1. Introduction
Glaciers are natural ice bodies formed by the compaction and solidification of snowfall in cold regions, which reach a certain thickness and slowly flow under the influence of gravity [
1,
2]. Glaciers are essential freshwater resources globally but also significant indicators of climate change [
3,
4]. As the “Roof of the World,” the Tibetan Plateau (TP) is the most developed region for modern glaciers worldwide, excluding Antarctica and the Arctic [
5]. Its glacier area accounts for approximately 14.5% of the total global glacier area. It is also China’s region with the highest concentration of glaciers, with 36,793 modern glaciers distributed across the area [
6]. The total glacier area is about 49,873.44 km
2, with a glacier storage volume exceeding 4500 km
3. They are mainly distributed in regions such as the Himalayas on the southern edge of the plateau, the Nyainqentanglha Mountains, the Kunlun Mountains in the west, and the western section of the Kunlun Mountains in the north.
However, with global warming increasing at an unprecedented rate [
7], glaciers worldwide are melting at an accelerated pace [
8]. Glacier retreat caused by melting glaciers not only affects water resource reserves but also lead to decreased stability of ice bodies, resulting in various glacier-related hazards such as avalanches, glacier surges, glacial lake outburst floods, and glacier debris flows. According to a comparison of data from the second Chinese Glacier Inventory (CGI-2) and the first Chinese Glacier Inventory (CGI-1), the glacier area within China has shrunk by approximately 17%, and the storage volume has decreased at the rate of −5.3%/decade [
9]. As the starting point and amplifier of global changes [
10], the TP is also warming several times faster than global warming [
11,
12]. Studies have shown that since the 1990s, the glaciers on the TP have exhibited a comprehensive and accelerated retreat trend, although regional differences exist [
13]. As one of the major glacier distribution areas globally and the source region of major rivers in Asia [
14], the TP is facing an imbalance problem under the accelerated warming [
15], which is characterized by rapid melting of solid water and an increasing trend in liquid water [
16]. This solid and liquid water imbalance directly exacerbates glacier hazard risks [
17]. Studies have indicated that approximately 15 million people globally are threatened by glacial lake outburst floods (GLOFs) [
18], with over 1 million people in China at risk of such floods, which are mainly concentrated in Tibet, Xinjiang, Qinghai, Sichuan, and Yunnan mountainous areas, including the TP and its adjacent regions. People and infrastructure in the TP and its surroundings face an increasing risk from GLOFs [
19].
The earliest research on glacial hazards on the TP can be traced back to investigating glacial debris flows in Guxiang gully in the southeastern Tibet Autonomous Region [
20]. The intense melting of glaciers in the upper reaches of Guxiang gully provides abundant meltwater and loose sediment, and the warm and humid climate accelerates the weathering and collapse of bedrock. The narrow gorge and steep terrain contribute to frequent glacial debris flow events in Guxiang gully, including several catastrophic disasters. Subsequently, Du et al. [
21] systematically discussed the characteristics of glacier debris flows in southeastern Tibet, pointing out that glacier retreats and climate fluctuations are the leading causes of glacier debris flow occurrences. As glacier research deepened, studies on glacial hazards on the TP became more abundant, including the categorization, causes, simulation, monitoring, and early warning of significant glacial hazards [
22,
23,
24,
25]. Scholars have also discussed the research progress on different types of glacial hazards [
26,
27,
28], Wu et al. [
29]. were the first to discuss glacial hazards on the TP and its surrounding areas. Tang et al. presented the first inventory of indentified the ice avalanches and GLOFs on the TP.
However, there has not been a systematic discussion on the distribution of glacial hazards on the TP and the compilation of historical hazard events. What’s more, how about the statuses of these glaciers or glacial lakes post the disaster events? With its vast area and wide glacier distribution, monitoring glacier disasters based on remote sensing often focuses on small regions. Therefore, extracting glacier and glacial lake distribution and historical glacier disaster events based on remote sensing can help us identify potential high-risk areas for glacier disasters on the TP, providing essential references for remote sensing monitoring [
30]. Retrospective analysis of historical hazard events and spatiotemporal analysis can help establish effective monitoring and early warning mechanisms [
31].
Based on this, this study combines existing literature and datasets to comprehensively analyze the major glacier hazard events and their spatiotemporal distribution characteristics in the TP. The aim is to identify the high-risk areas for glacial hazards and provide necessary references for monitoring glacial hazards on the TP.
2. Materials and Methods
2.1. Study Area
The Tibetan Plateau (TP) has an area of approximately 2.57 million km², accounting for 26.8% of China’s total land area. It stretches from the southern edge of the Himalayas to the northern side of the Kunlun and Qilian Mountains, spanning approximately 13 degrees of latitude. In China, the TP extends from the Pamir Plateau in the west to the Hengduan Mountains in the east, covering 31 degrees of longitude [
32] (
Figure 1). As the highest plateau in the world, the average elevation of the TP exceeds 4,000 meters. It is known as the “Roof of the World” and the “Third Pole of the Earth.” The plateau’s climate is cold and dry, and its unique climatic conditions make it the most extensive distribution area of modern glaciers in the middle and low latitudes worldwide. It accounts for 79.5% of the total number of glaciers in China, 84% of the total glacier area, and 81.6% of the glacier storage [
33]. The glacial meltwater from this region is the source of many major rivers in Asia, earning it the reputation of being the “Water Tower of Asia” [
34]. Since the 1990s, due to global warming, the TP has been warming several times faster than global warming. Glaciers on the plateau are generally undergoing rapid melting, and the glaciers on the TP are entering a phase of overall retreat [
13]. The risk of glacial hazards is increasing, and related hazard events are frequent. For example, on October 16, 2018, an ice avalanche occurred downstream of Gala Village in Milin County, Yarlung Tsangpo River (Yarlung Zangbo River), causing the river to block and the water level to rise due to the ice avalanche and the ice debris carried by it. This ice avalanche event resulted in an ice avalanche dam forming, severely threatening the lives, property, and infrastructure downstream. On July 17, 2016, an ice avalanche in Aru, Rutog County, Tibet, claimed the lives of nine herders and resulted in the loss of hundreds of livestock. Earlier that month, on July 5, the Zhamabu glacial lake in Nyalam County, Tibet, experienced an outburst flood, causing significant damage to the Bhotekoshi hydropower station and the China-Nepal highway in Nepal.
2.2. Determination of Glacial Hazards Types over the Tibetan Plateau
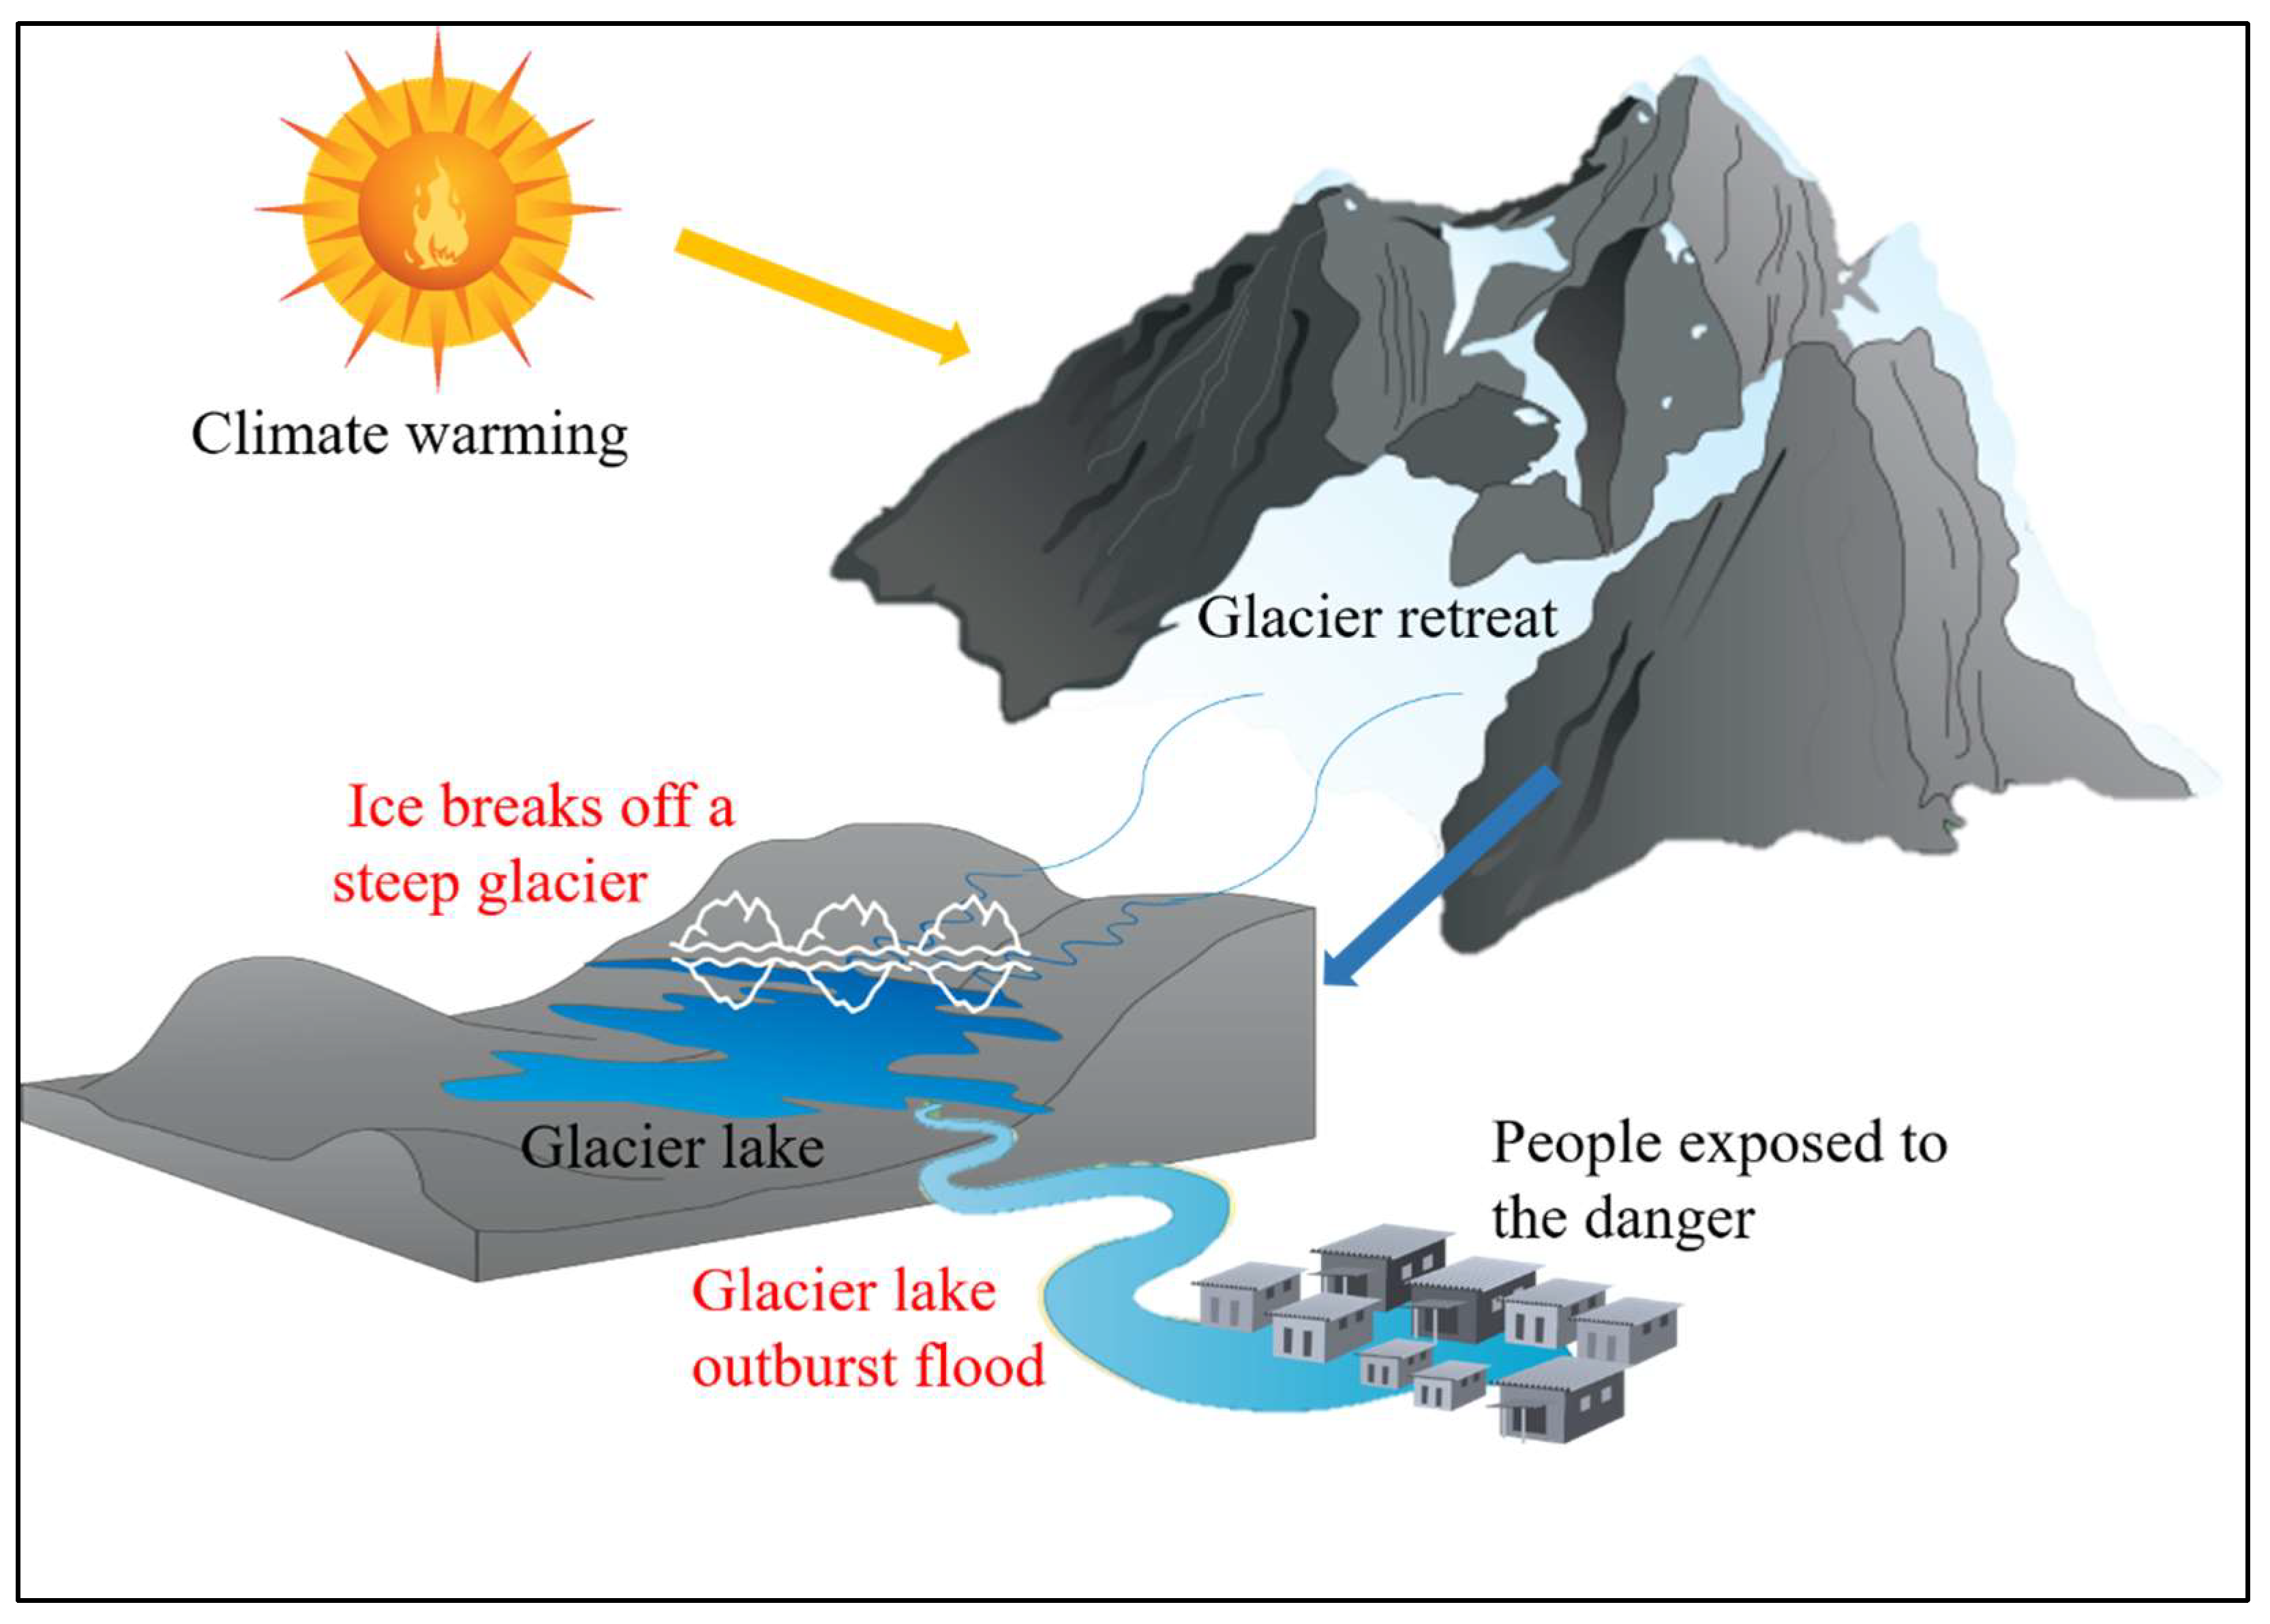
Glacial hazards exhibit typical chain-like characteristics [
36] (
Error! Reference source not found.): Glacier melting and retreat reduce the stability of the ice mass and provide an adequate water source supply to the basin formed by glacial erosion, creating numerous glacial lakes with moraine dams. During glacier movement, the ice mass slides or enters the glacial lake under the force of gravity, causing the lake water to breach the dam and discharge a large amount of sediment, mud, and rock debris, resulting in devastating impacts on the lives and property of downstream populations and the safety of road infrastructure. For example, the ice avalanche disaster that occurred in Dongru Township, Ngari Prefecture, Tibet, on July 17, 2016, was triggered by glacier surges [
37]. The shattered ice entered the Aru Co Lake, leading to a severe glacier hazard. Therefore, we selected three main glacial hazards, including glacier surges, glacier-related slope failures, and glacial lake outburst flood (GLOF). Glacier surges are periodic glacial movements between normal glacier flow and ice avalanches. Ice avalanche is defined as the phenomenon of glacier ice collapsing from steep areas of the glacier or the margins of an ice shelf under the influence of gravity. GLOF is characterized by their suddenness, large scale, strong destructive power, and wide-ranging hazards, often resulting in severe loss of life and property downstream.
2.3. Glacial Hazards Relate Dataset Comparsion and Selection
The glacier distribution data used in this study is obtained from the first Chinese Glacier Inventory (CGI-1) (1978-2002) [
38] and the second Chinese Glacier Inventory (CGI-1) (2006-2011) [
39]. CGI-1 and CGI-2 gathered glacier outlines and essential parameters—including geographic location, area, length, orientation, and elevation—across two distinct periods (the 1950s to the 1980s and the 2000s to the 2010s). This data is crucial for enhancing our understanding of the distribution and changes in China’s glaciers [
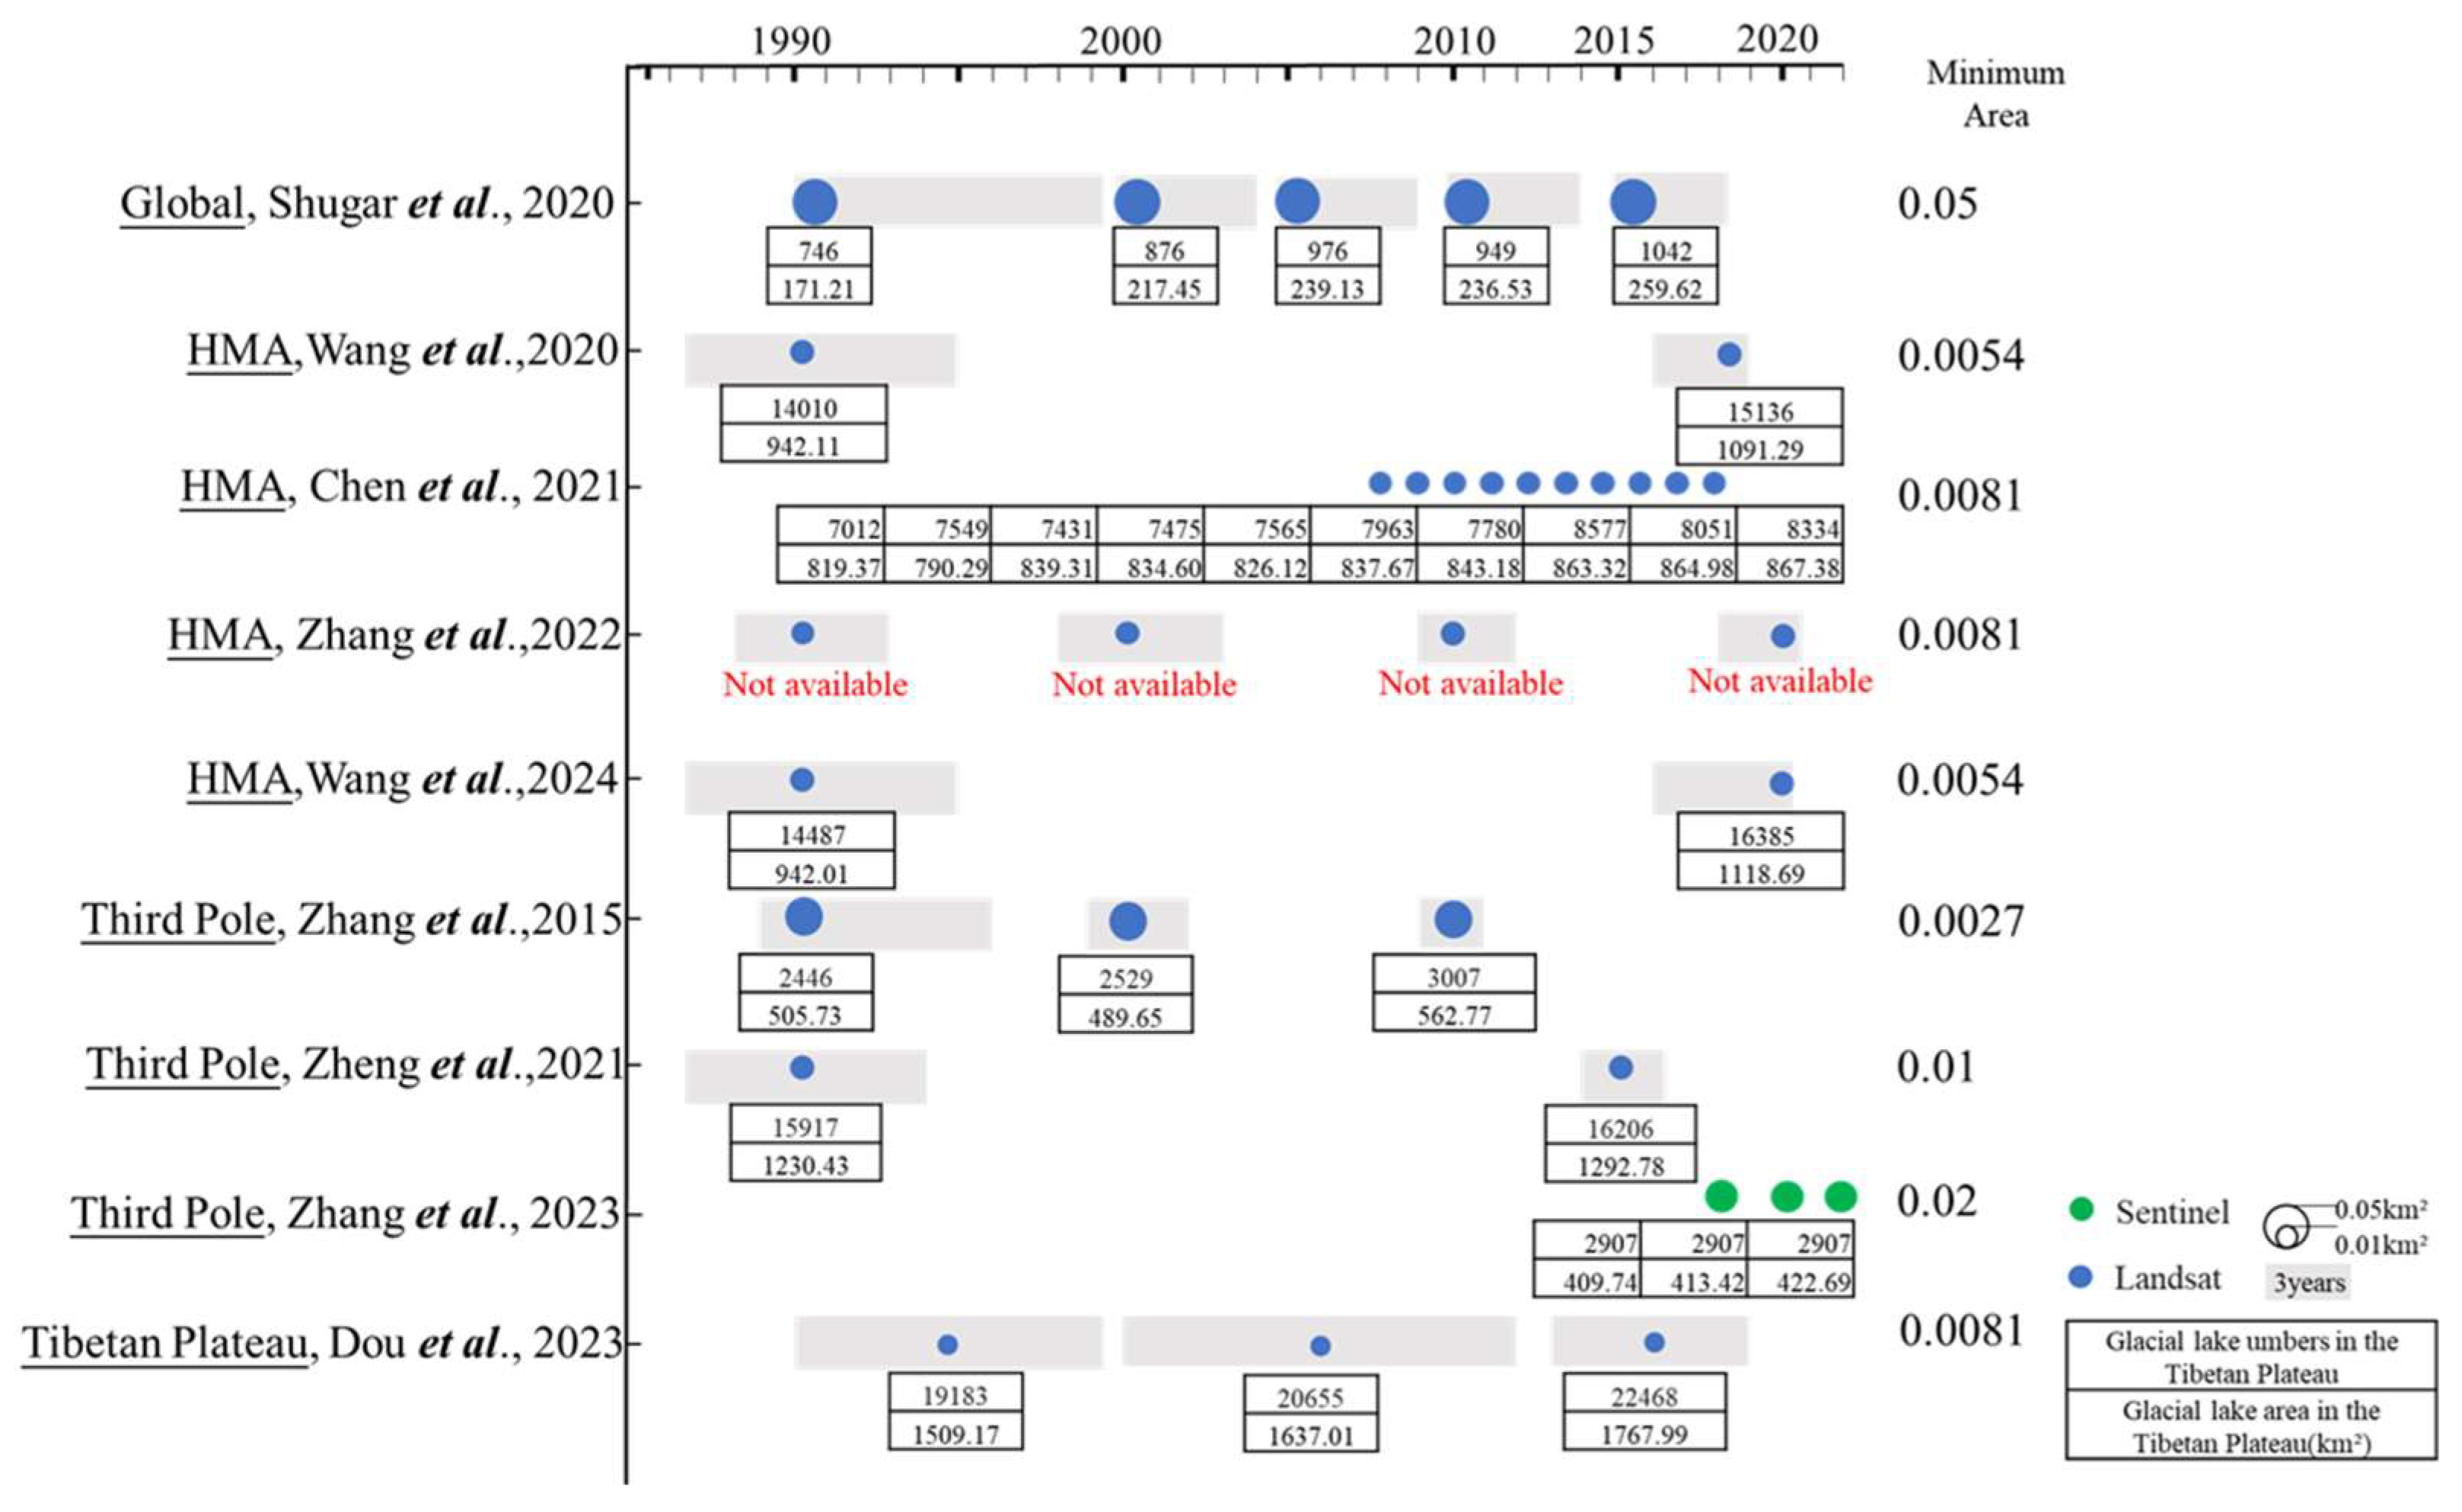
40]. Numerous studies have mapped the glacial lake distribution across the scales ranges from global to regional [
41,
42,
43,
44,
45], though significant variations exsit in glacial lakes numbers, size, types, etc (
Figure 2) [
46]. Which dataset best reflects the true distribution of glacial lakes on the Tibetan Plateau? Through comparision, we found that only one dataset can cover all the reported glacial lake outburst floods, published by Wang et al. [
47]. The dataset utilizes Landsat images and employs visual interpretation methods to extract the boundaries of glacial lakes in high mountain Asia for the years 1990 and 2020. The glacier avalanche distribution data (1902-2022) is sourced from the global glacier-related disaster database compiled by Zhang et al. [
48]. The database was established based on historical satellite images and includes information on various glacier-related hazards such as glacier avalanches, ice-rock avalanches, and rockfalls. This study selects only glacier avalanches and ice-rock avalanches for analysis. The glacier surge data is selected from the high Asia glacier surge dataset published by Lv et al. [
49] (1972-2019). Actually, there are another two glacier surge datasets covering the HMA [
50,
51], all above dataset are based on elevation changes and remote sensing images. Through the comparison of three datasets, we found that Guo et al. [
50] study identified the most numerous active glaciers (275 glaciers), but lacked specific active events. In contrast, the research by Yao et al. [
51] is consistent with that of Lv et al. [
49]. Records of glacial lake outburst flood (GLOF) mainly rely on the compilation of GLOF events in the Tibet Autonomous Region by Yao et al. [
52] and the review of high Asia GLOF events by Zhang et al. [
48]. Additionally, 176 previously unrecorded historical GLOF events identified by Zheng et al. [
53]. have been included based on historical satellite images, resulting in a comprehensive list of GLOF events that have occurred in the TP.
2.4. Potential Influencing Factors Detection of Glacial Hazards Frequency
Based on the mechanism and process of glacier hazard formation, this study primarily analyzes the main factors influencing the frequency of glacier hazard occurrences in the region, including the number and variation characteristics of glaciers, glacial lakes, terrain conditions, and climate characteristics. The terrain data is obtained from SRTM (Shuttle Radar Topography Mission) V4.1, with a spatial resolution of 30 meters, which can be accessed from the USGS Earth Explorer website:
https://earthexplorer.usgs.gov/. The climate data used in this study is derived from the 1km resolution monthly temperature and precipitation dataset for China from 1901 to 2020 [
54]. This dataset was generated by downscaling the global 0.5° climate dataset published by CRU (Climate Research Unit) [
https://crudata.uea.ac.uk/cru/data/hrg/] and the high-resolution climate dataset published by WorldClim [
http://www.worldclim.org/] using the Delta spatial downscaling method specifically for the China region. To further calculate the interannual trend of average temperature for different months (June to September) using simple linear regression, the following formula can be used:
where:
Slope represents the slope of the simple linear regression equation fitting the average temperature for different months against the time variable. The variable
i represents the time location variable, ranging from 1 to
n, where
n is the number of years in the study period, which is 21.
Ti represents the average temperature for the
i-th year. A
slope value < 0 indicates a decreasing trend in the monthly average temperature series over time, while a
slope value > 0 indicates an increasing trend. The absolute value of the slope indicates the rate of change in the monthly average temperature, with a larger absolute value indicating a faster rate of change.
The TP covers a vast area, but disaster events often occur within small localized regions such as points, lines, or locations. Therefore, in this study, a grid of 100 × 100 km cells was created based on the boundary of the TP. The occurrence frequency of different types of glacial hazards within each grid cell and the total frequency of all glacial hazards occurring within different grid cells were calculated and analyzed. Geodetector was applied to detect the contribution of the main influencing factors. Geodetector is a new statistical method to detect stratified spatial heterogeneity and reveal the driving factors behind it [
55]. Based on the assumption that the high-influence independent variable should share a similar spatial distribution pattern with the dependent variable [
55], Geodetector can measure each independent variable’s contribution by the q-statistic of the factor detector. The formula is as follows:
where
h(1…
m) denotes the number of factors;
Nh denotes the number of samples in subregion k;
N represents the total number of spatial units across the whole study area;
σ2 and
σh2 represent the global variance in the study area, and variance in the samples in subregion k, respectively. A greater
q-statistic value (range from 0 to 1) indicates higher explanatory power of the selected independent variable. Furthermore, Geodetector also provides another module to detect whether the explanatory powers of two independent variables are enhanced, weakened, or independent of each other [
55].
2.5. Long Time Series Glacial Lake Dataset Construction of Reported GLOF
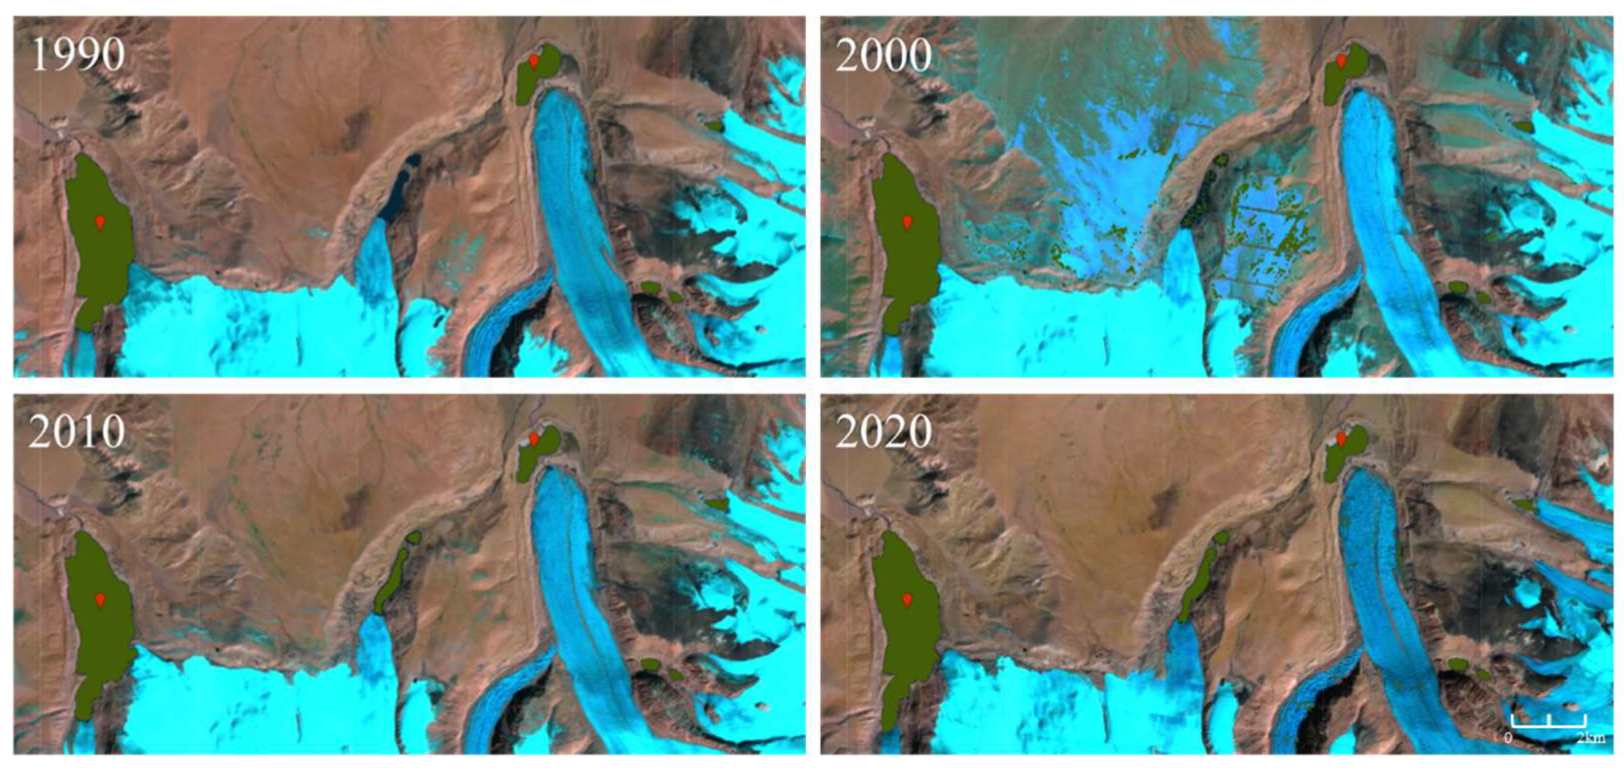
Considering the possibility of repeated outbursts, the recent statuses of glacial lakes posterior to their outbursts need to be continuously monitored for downstream risk management. Numerous studies have mapped the glacial lakes distiribution over the different scales, including global scale, HMA region, and Third Pole region from remotely sensed data. According to the previous studies, glacial lake extraction methods including Machine Learning, spectral index-based therehold methods, and manual methods. While the manual methods are not as efficienct as automated methods, at the present state of the art the manual methods could be more reliable. Therefore, a glaceir lake dataset produced by Wang et al.,2024 was selected for the further step analysis. However, this dataset only include glacial lake distribution in 1990 and 2020 which is not adequate for our needs. Here, we have used a modified normalized difference water index (NDWI) approach proposed by Shugar et al.,2020, combined with a variety of thresholds and filters, to identify and accurately map glacial lakes which have outbursted (See details in Shugar et al.,2020). First,we finished the initial mapping of water pixels from optical imagery in the Google Earth Engine (
Figure 3). Then, we mannually delineated the boundary of glacial lake in 2000 and 2010.
3. Results
3.1. Glaciers and Glacial Lakes Changes on the Tibetan Plateau
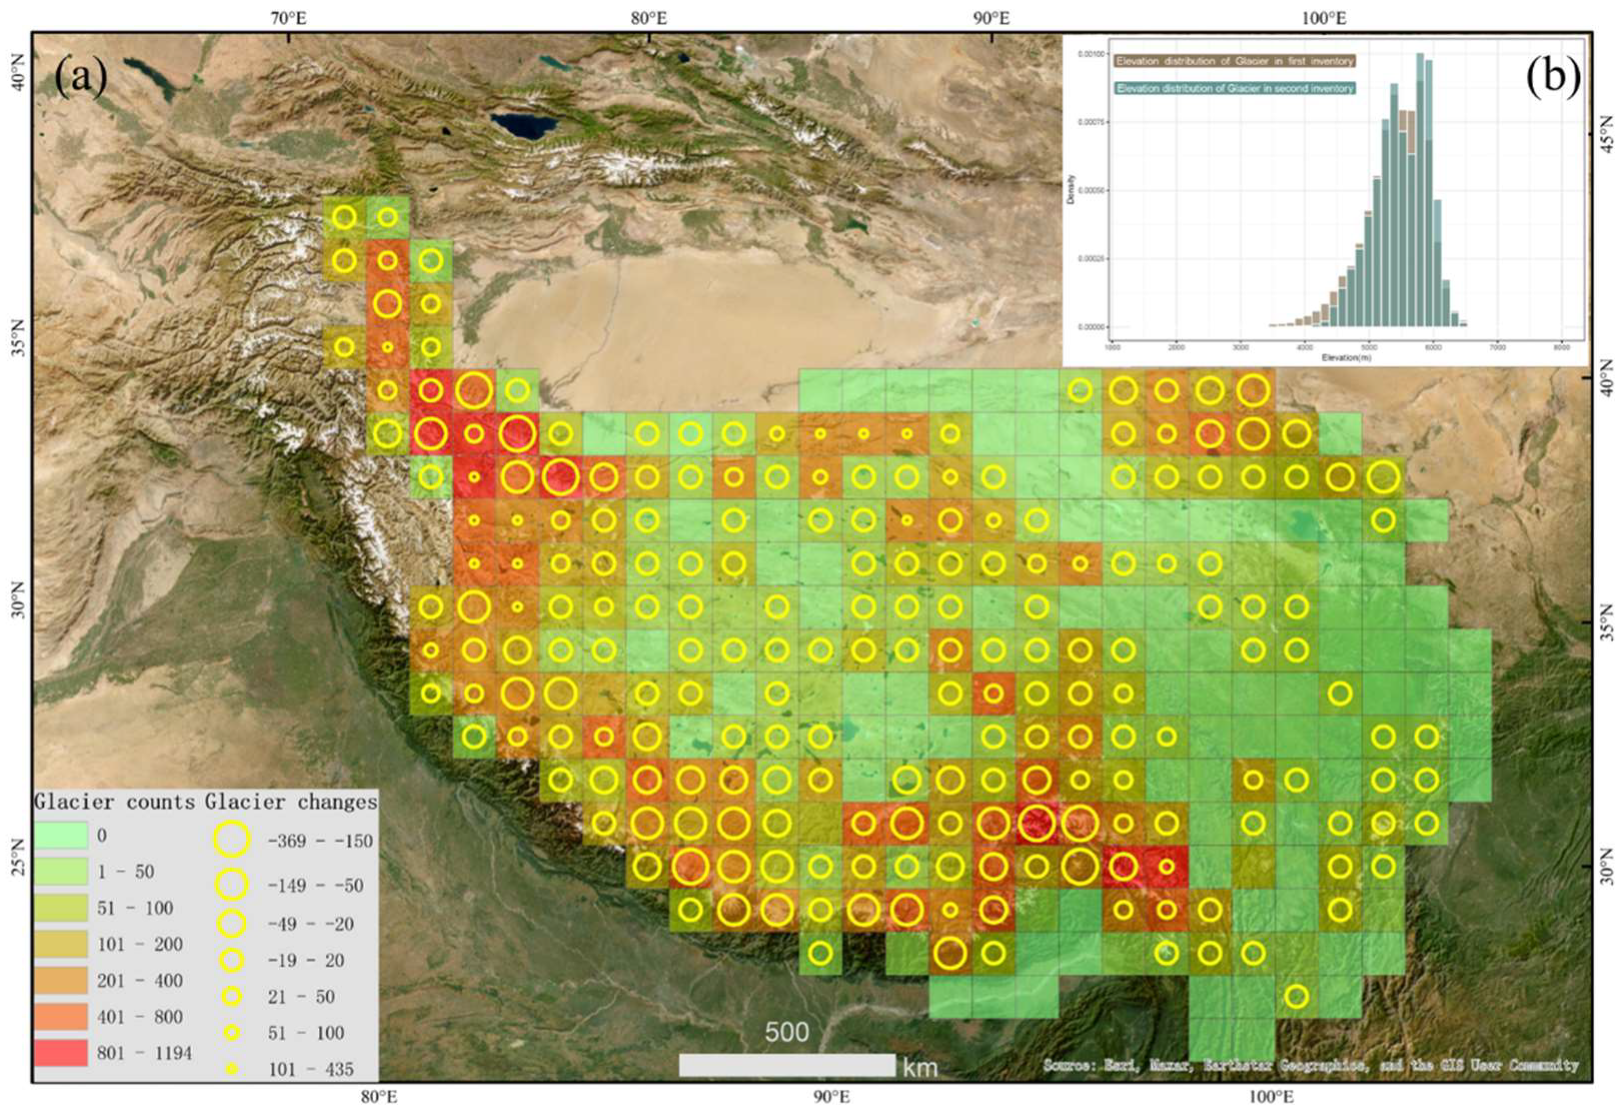
According to the second glacier inventory results, there are 40,230 glaciers in the Tibetan Plateau (TP). Compared to the first glacier inventory, the number of glaciers has increased by 145, while the total glacier area has decreased from 57,100 km² to 44,400 km² in the second inventory (
Figure 4a). The average elevation of glacier distribution in the TP was 5,340 meters in the first inventory, while in the second inventory, it increased significantly to 5,500 meters. The lowest average elevation of glaciers also increased from 2,162 meters to 3,346 meters. Regarding different elevation ranges, the first inventory shows that glaciers in the TP are mainly distributed between 5,000 and 6,000 meters, accounting for 74% of the total glaciers (
Figure 4b). This proportion increased to 77% in the second inventory. Additionally, the number of glaciers within this elevation range has significantly changed. Compared to the first inventory, the second inventory recorded an increase of 1,373 glaciers in the 5,000-6,000 meter elevation range, with a notable increase of 1,003 glaciers, specifically in the 5,500-6,000 meter range. The number of glaciers below 5,000 meters showed a decreasing trend, with a decrease of 2,098 glaciers compared to the first inventory. Particularly in the 4,000-4,500 meter range, there was a significant decrease, with 1,055 glaciers disappearing. In terms of spatial distribution, the regions where glacier numbers decreased were mainly in the middle and eastern sections of the Himalayas, as well as the West Kunlun Mountains and Qilian Mountains. On the other hand, the regions where glacier numbers increased were primarily located in the northern part of the Karakoram Mountains and the middle section of the Kunlun Mountains.
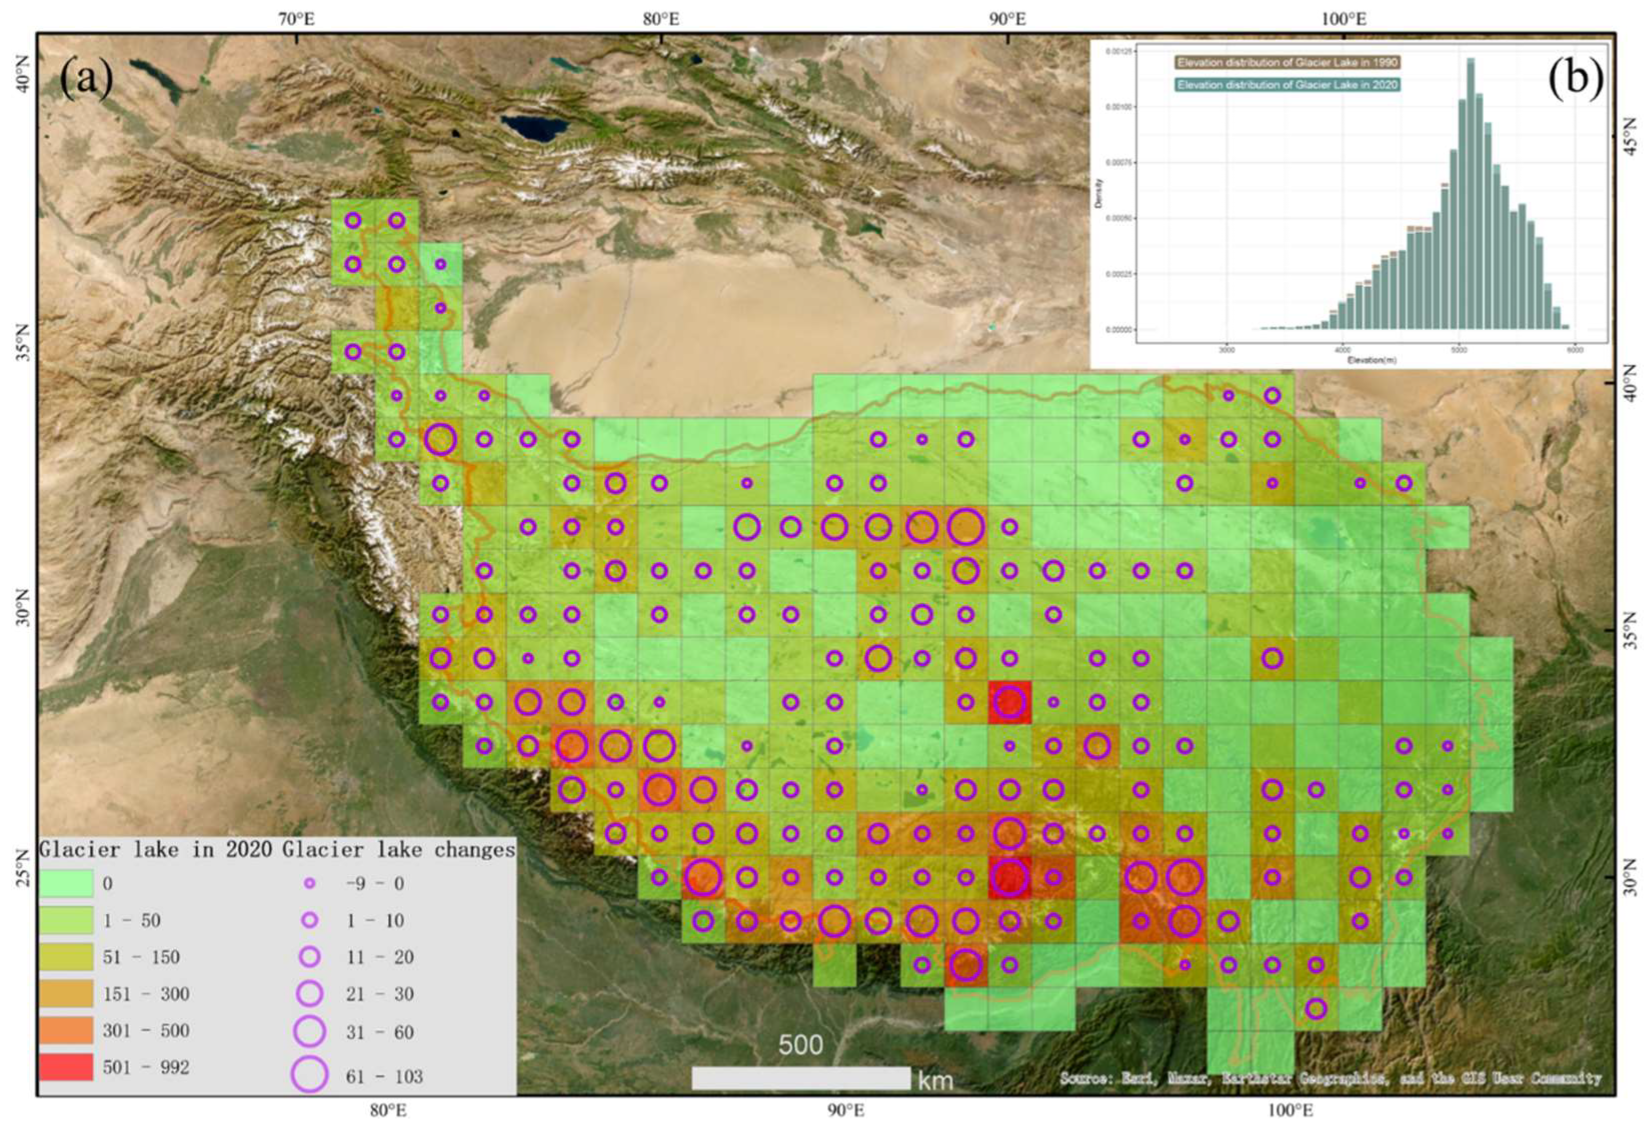
By comparing the changes in glacial lakes on the TP from 1990 to 2020 (
Figure 5), it was found that the number of glacial lakes increased from 14,487 to 16,385 in the past three decades, mainly concentrated in the eastern Himalayan region. The TP is primarily dominated by glacial lakes with an area of less than 1 km², accounting for over 99% of the total. In 1990, the average area of glacial lakes on the TP was 0.07 km
2, and increased by 5% in 2020. From a vertical perspective, the average elevation of glacial lakes on the TP increased from 4,988.21 meters to 5,009.12 meters. Glacial lakes on the TP are mainly distributed at altitudes between 5,000 and 5,500 meters, accounting for over 43% of the total glacial lakes. Meanwhile, the most significant increase in glacial lake numbers is also observed within this elevation range, with a total increase of 976 lakes compared to 1990. The average slope of glacial lakes in 1990 and 2020 are 9.7° and 9.47°, respectively, over 59% glacial lake distributed in a slope range from 5 ~10°. In terms of spatial distribution, from 1990 to 2020, there was an increasing trend in the number of glacial lakes in 158 grid cells, mainly in the middle and eastern sections of the Himalayas, with an average increase of 12.4 lakes. The largest increase was 103 lakes. The number of glacial lakes in 30 grid cells remained unchanged, while there was a decreasing trend in glacial lake numbers in 22 grid cells, with the largest decrease being 9 lakes.
3.2. Temporal-Spatial Distribution and Influencing Factors of the Main Glacier Hazard Events Since 1990
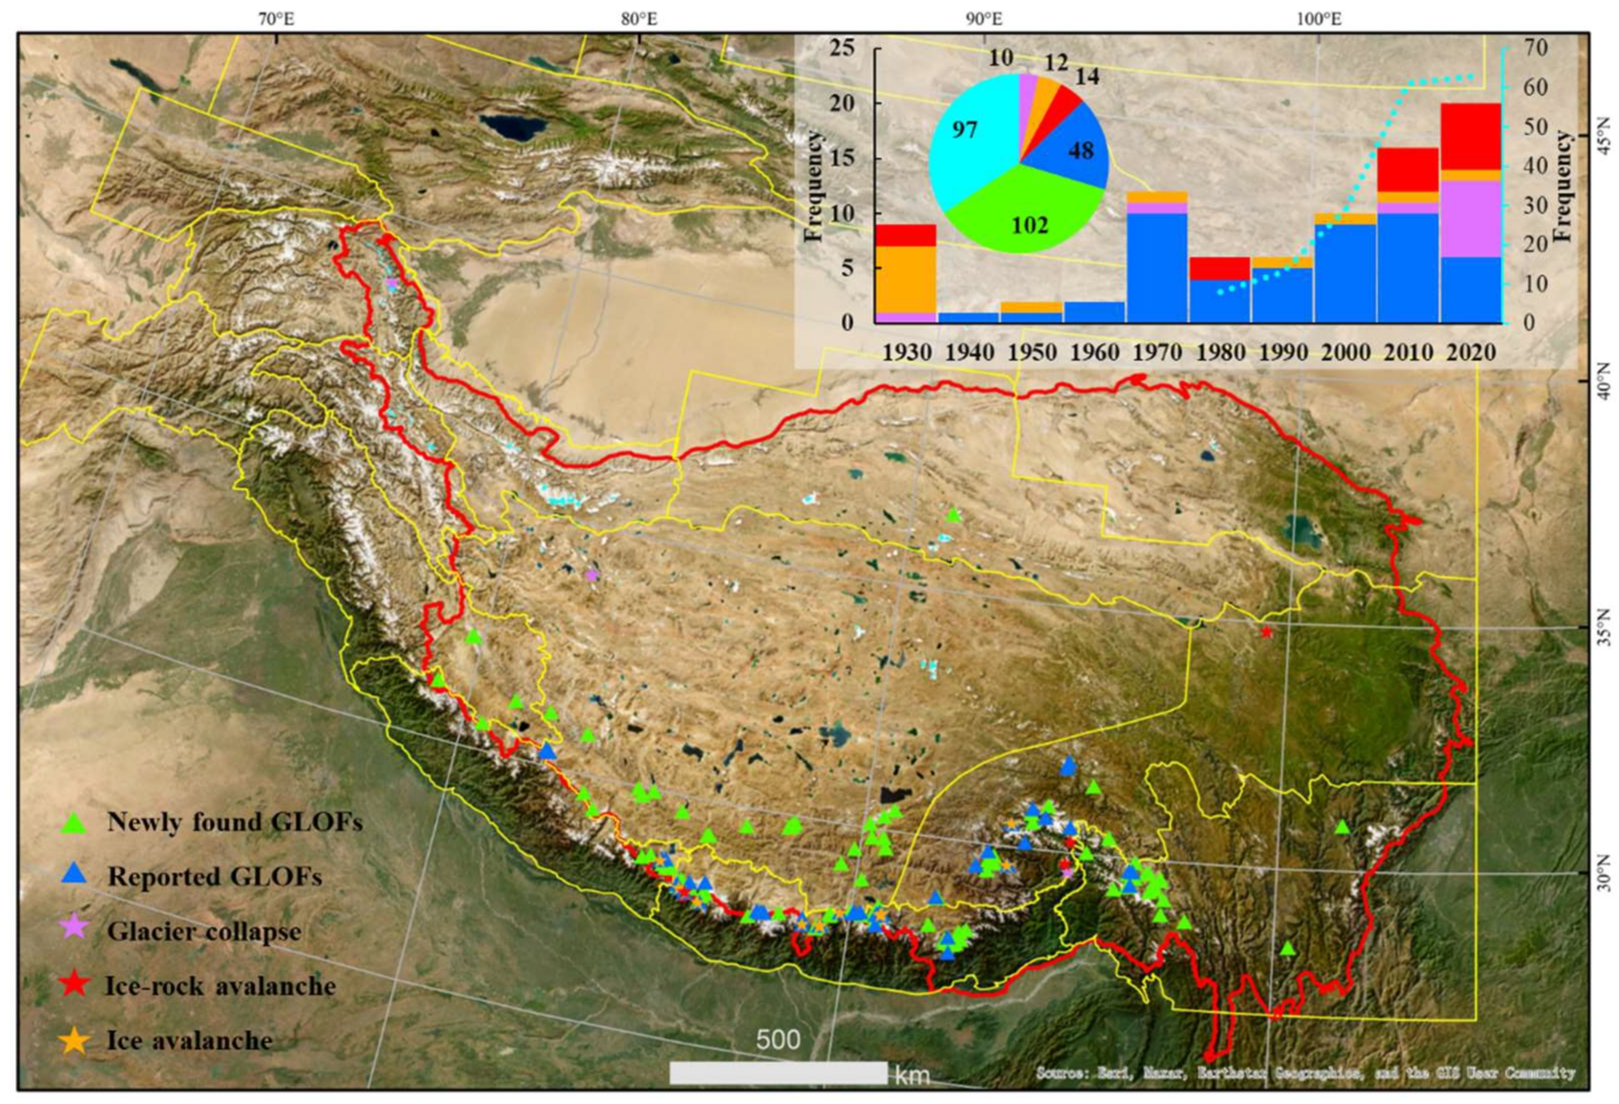
A total of 283 glacial hazards occurred in TP according to the published research, including 97 glacier surges, 36 glacier-related slope failures (GRSF), and 150 GLOFs (48 reported CLOFs) since 1900 (
Figure 6). Glacier surges are principally occurred in Pamir, Inner Tibet, West Kun Lun, and Karakoram, accounted for 23%, 22%, 21%, and 19% of the total glacier surges events, the remain distributed in East Kun Lun, South and East Tibet, and Qilian Shan. The average area of surging glaciers is 41.84 km², with the largest surging glacier being 355.58 km² and the smallest being only 2.15 km². The average elevation of surging glaciers is range from 4634 (lower boundary) to 6424 (upper boundary) meters, with an average slope of about 18 degrees. The highest surging glacier is located at an elevation of 6466 meters in West Kun Lun, while the lowest is at an elevation of 4374 meters in Pamir. Since 1970, the confirmed glacier surges have mainly occurred after the year 2000, accounting for 71% of all confirmed glacier surge events.
There has been a total of 36 GRSF events on the TP since 1905 (
Figure 6), including 10 glacier collapses, 12 ice avalanche, and 14 ice-rock avalanches. Over 58% GRSF distributed in South and East Tibet and the other 25% GRSF events occurred in East Himalaya. The average elevation and slope of GRSF was 4719 meters and 28 degrees, with the lowest elevation being 3577 meters and the highest elevation being 5711 meters. The earliest recorded event occurred on March 16, 1905, while the most recent event took place on September 11, 2019. GRSF events that occurred after 2000 accounted for 58% of all recorded events. Among the events with specific months recorded, with 8 events happening in July, accounting for 22% of the total recorded events, the remain events almost evenly distributed from March to November.
There have been records of 48 glacial lakes experiencing outburst floods since 1935 (
Figure 6), mainly distributed in East Himalaya and South and East Tibet, accounting for 50% and 23% of the total GLOF events, respectively. All reported GLOFs are moraine-dammed lakes, with a total of 59 outburst events, of which eight glacial lakes have experienced more than two GLOF events. 17 GLOFs occurred after 2000, accounting for 28.81% of all recorded events. GLOF events are mainly concentrated in June to September, with 31 events occurring during this period, accounting for 52.54% of all recorded events. The average elevation of reported GLOF events is 5143 meters. The highest elevation is 6082 meters, and the lowest is 3807 meters. 50.67% of glacial lake outburst events occurred at elevations between 4500 and 5000 meters. Furthermore, a total of 102 newly discovered GLOF events were identified, with 98 of them being moraine-dammed lakes and only 4 being bedrock-dammed lakes, which are mainly concentrated in the East Himalayas and the Inner Tibetan, accounting for 33% and 26% of all recorded events, respectively.
To further investigate the main influencing factors affecting the frequency of glacier hazard events, a geographic detector model was employed to analyze the individual contributions and interaction effects of topography (elevation and slope), climate (average temperature change rate from June to September), and glacier background conditions (glacier quantity and variations) on the occurrence frequency of glacial hazards in different grid cells (
Table 1). From the perspective of individual factor contributions, the variation in glacier quantity within the grid cell has the highest contribution to the frequency of glacier hazard events, accounting for 11.56% of the total contribution. The next significant factor is the average temperature change rate in July, contributing 10.24%, followed by elevation (8.32%), average temperature change rate in June (6.54%), slope (5.56%), and average temperature change rate in August (4.42%). Regarding the interaction effects of two factors, non-linear enhancement is observed between the major factors. The interaction between the slope and the average temperature change rate in June exhibits the highest contribution to the frequency of glacier hazard events, reaching 37.59%. The interaction between elevation and slope ranks second, contributing 37.45% to the frequency of glacier hazard events. The interaction between glacier quantity variations and the average temperature change rate in August follows closely behind the previous two factors, contributing 33.59% to the frequency of glacier hazard events.
3.3. Different Status of Glacial Lakes After the Main Glacial Hazards
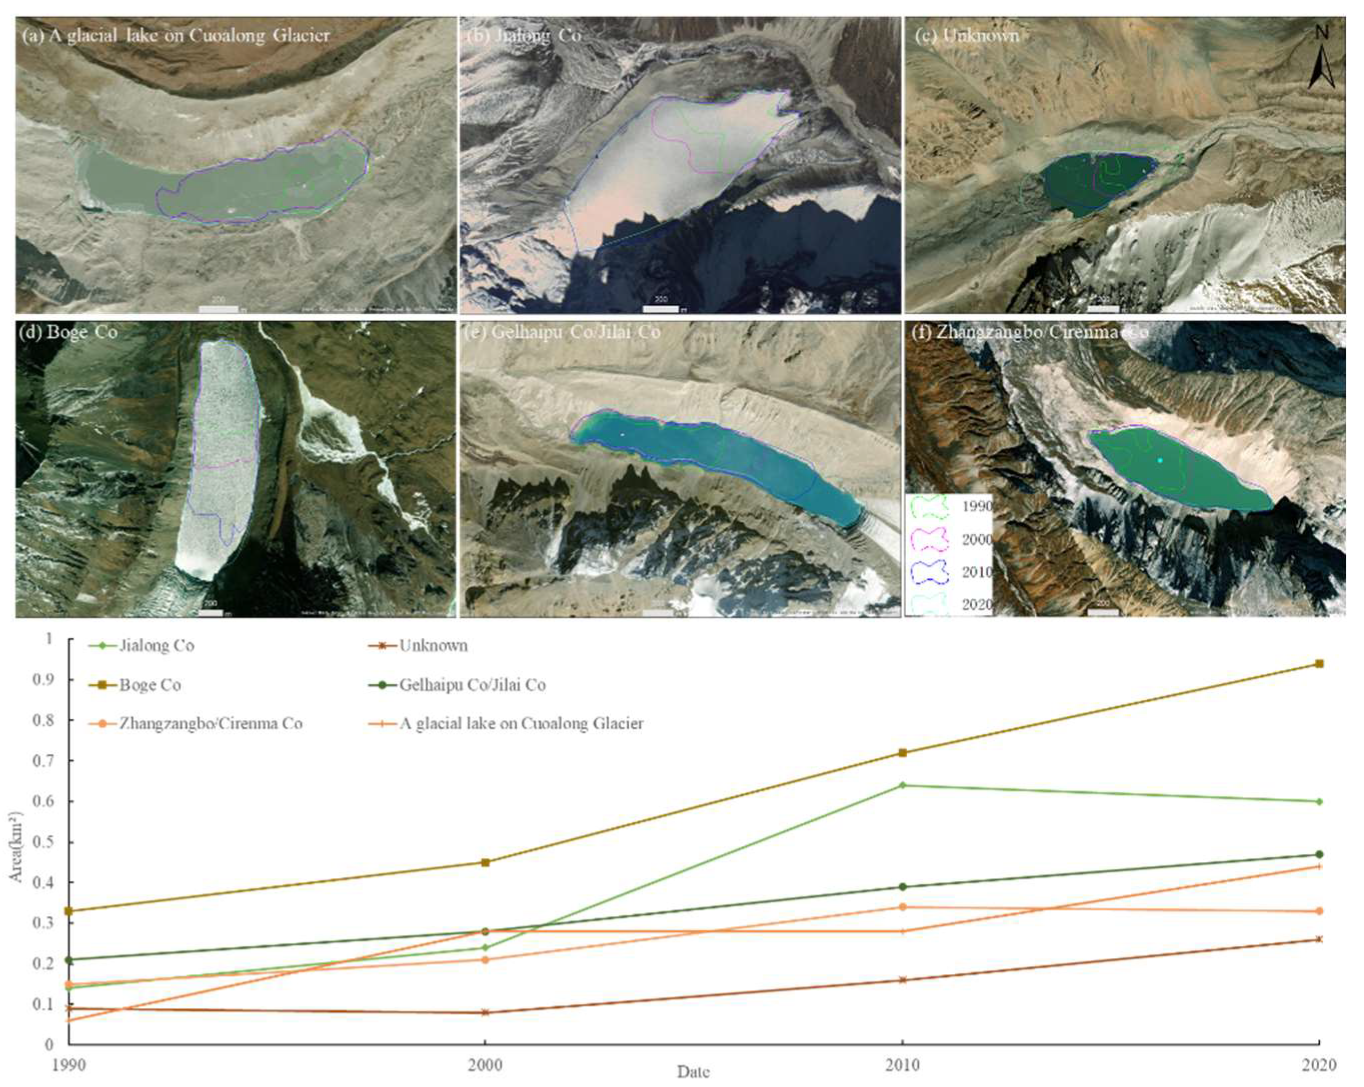
According to the historical records, eight glacial lakes have experienced more than two GLOF events. Thus, we divided all 48 recorded outburst lakes into three classes: disappeared, stable, and expanding lakes (increased by more than 100% compared to 1990). Satellite images show that four lakes perished after their GLOF events, while this number is five in zhang et al., 2022. We revised a record of a glacial lake on Cuoalong Glacier (90.6121°N, 28.0652°E), which shown an obvious increasing trend since 1990, especially in recent ten years, this glacial lake increased from 0.28 km² in 2010 to 0.44 km² in 2020. Four perished lakes are distributed in Central Himaya (Longda Co and Zana Co), Inner Tibet (Zangla Tsho), and South and East Tibet (unknown name). A total of 38 glacial lakes remain relatively stable after the outbursts. Among them, 17 lakes burst before 1990, seven lakes burst during 1990 to 2000, nine lakes burst during 2000 to 2010, five lakes burst during 2010 to 2020, and then experienced little changes. Sangwang Tsho burst on 16 July 1954 and resulted in catastrophic downstream damages. Its area slightly expanded from 2000 to 2020. Sangwang Tsho is currently the largest post-outburst glacial lake in the Himalayas (with an area of 5.83 km
2 in 2015). Post-outburst lake dynamics in was only inferred from the available monitoring period from ca. 1990 to 2015. For some of the lakes where outbursts occurred much earlier than 1990 (such as in the 1960s and 1950s), drastic area changes or fluctuations (expansions or shrinkage) might have occurred but are not observable from our acquired remote sensing images. As shown in their area dynamics during ~1990–2020 (
Figure 7), six glacial lakes were identified to have experienced evident expansion since the outburst, of which the most significant increase was observed in a glacial lake on Cuoalong Glacier, which increased by 633% from 1990 to 2020 (
Figure 7.a). During the past thirty years, this lake has experienced two obvious expansions, it increased by 367% from 1990 to 2000, then keep stable from 2000 to 2010, and further increased by 57% in the recent ten years. Jialong Co (Figure 12A) is about 15.8 km away from Nyalam County and flooded twice in 2002. After the GLOF, Jialong Co expanded by 150% between 2000 and 2010 and keep stable in recent ten years (
Figure 7.b). Zhangzangbo/Cirenma Co in the Central Himalaya produced three GLOFs in 1964, 1981, and 1983, respectively, the GLOF On 11 July. 1981. had the most serious disastrous effect. The main expansion of Zhangzangbo/Cirenma Co occurred in the first two ten years, and increased by 40% and 62%, respectively. Another three glacial lakes, Unknown (
Figure 7.c), Gelhaipuco (
Figure 7.d) and Lureco (
Figure 7.e), had significantly expanded (at least during ca. 1990 and 2010).
4. Discussion
This research demonstrates the spatiotemporal distribution characteristics of historical disaster events and analyzes the major environmental factors influencing the frequency of glacier hazard occurrences. It helps us understand the patterns of glacial hazards and establish effective monitoring and early warning mechanisms to minimize the risks associated with glacial hazards.
Glacial retreat as a global phenomenon has significantly intensified the occurrence of natural disasters [
56]. In theory, glacial hazards are more likely to occur in areas with rapid glacier melting or active glacier movement. The disaster claimed the lives of nine herders and hundreds of livestock. According to a comparison of two glacier inventories, the glacier area on the TP has decreased from 57,100 km² to 44,400 km². The areas of rapid glacier melting are mainly located in the middle and eastern sections of the Himalayas, the western Kunlun Mountains, and the Qilian Mountains [
57], while the number of glaciers in the northern Karakoram Mountains and the middle section of the Kunlun Mountains has shown an increasing trend [
58]. Similarly, glacial lakes have significantly increased in areas of rapid glacier melting, especially in higher-altitude (5000-5500) regions [
59]. Historical glacier hazard events show a good coupling with areas of rapid glacier melting and the rapid increase in glacial lakes in terms of occurrence frequency and spatial distribution.
Accelerated warming has led to faster glacier retreat and a rapid increase in the number of glacial lakes, further exacerbating the risk of glacial hazards [
56]. This indicates that glacial hazards are closely related to temperature changes. TP has experienced substantial warming during the past 50 years at a rate twice that of the global average [
60]. How has the frequency of the glacial hazards in TP changed under the accelerated warming rate? From the perspective of glacier hazard occurrence, the upward trend in reported incidents showed a marked decline after a shift in the 1970s. This pattern has been observed both globally and regionally [
61,
62]. Although this phenomenon aligns with independently observed shifts in annual air temperatures and the number of field-based glacier surveys, earlier studies suggest that the formation, growth, and failure of glacial lakes driven by temperature changes are only weakly correlated [
61]. From 1901 to 2017, only a few regions saw an increase in reported GLOFs, a trend likely attributed more to the rise in research activity than to atmospheric warming [
61]. For instance, a satellite-based approach recorded 60% more events in a 35-year period than had been documented over the previous 100 years in Alaska [
62]. This suggests that the rise in image availability is the main factor behind the growing number of detected events over time. Indeed, this is the case: existing studies have found nearly 200 previously unreported GLOF events in the Third Pole region, of which approximately 95% were moraine-dammed glacial lakes [
63]. Unfortunately, the exact dates of these newly discovered GLOF events cannot be confirmed, which limits our ability to accurately understand the changes in the frequency of these events. By constructing multi-temporal glacial lake distribution data and conducting research on the temporal changes of glacial lakes, it is of great significance to timely capture signals of GLOFs, so far limited by both availability of optical satellite images and mapping efficiency [
64,
65]. Gu et al.,(2023) [
66] demonstrated the potential of using dense Chinese high-resolution satellite images to monitor GLOF and release early warning.
Nevertheless, it is possible to glean evidence of GLOF characteristics, as now discussed for ice-dammed, moraine-dammed and bedrock-dammed GLOFs. Resulting hazards and changes are also assessed. In terms of the specific months when glacial hazards occur, the period from June to September is the peak season for glacial hazards. Through the analysis of the contributions and interaction effects of environmental factors that may affect the frequency of glacier hazard occurrences, this study found that the variation in glacier quantity within the grid cell is the factor with the highest contribution to the frequency of glacier hazard events, accounting for 11.56% of the total contribution. This is consistent with previous studies [
67] and theoretical expectations. The contribution rate of the average temperature change rate in July to the frequency of glacier hazard occurrences is second only to the variation in glacier quantity, reaching 10.24%. In terms of the interaction effects between factors, the interaction between slope and the average temperature change rate in June is the pair of environmental factors with the highest contribution to the frequency of glacier hazard events, accounting for 37.59%. Summer is a season of intense glacier melting, and the increase in temperature leads to rapid glacier melting. The melting of ice and snow also increases the water supply. Furthermore, warming affects the stress environment of the glacier’s lateral rocks. These combined factors contribute to the higher occurrence frequency of glacial hazards during this time period [
29]. In addition, we need to pay special attention to glacial lakes that have frequently experienced outburst events in the past. We have observed that the vast majority of glacial lakes that have experienced outburst floods have not disappeared, and some lakes have even shown a trend of rapid expansion after the outburst, which also have been noted in the previous research [
68]. This suggests that we need to be vigilant about the risk of these lakes experiencing outburst events again. Although the exact dates of historical glacial lake outburst events are lacking, based on the outburst dates of glacial lakes that have experienced multiple outbursts, the outburst dates of four glacial lakes all show a trend of occurring earlier.
The key to glacier hazard risk is not directly related to the size, quantity, or variations of glacial lakes; rather, it lies in the downstream population and their capacity to cope with disasters [
18]. For example, in 2013, the Chorabari glacial lake outburst in the Indian part of the western Himalayas caused over 6,000 deaths [
69], making it one of the largest glacial lake outburst flood disasters in human history, despite the lake’s maximum pre-outburst area being only 0.04 km². However, with the continuous development of socio-economic activities, human activities on the TP have rapidly intensified. Research has shown that the average increase in human activity intensity on the TP is more than three times that of the global average during the same period (1990-2010) [
70]. Grazing activities, infrastructure construction, road transportation, and major engineering projects are all expanding, bringing human activities closer to the impact zones of glaciers, and human activities near glacier areas are also increasing [
71]. This greatly increases the potential losses caused by glacial hazards. Therefore, a quantitative assessment of human exposure to glacial hazards is of paramount importance in effectively mitigating glacier hazard risks.
5. Conclusions
Glacial hazards on the Tibetan Plateau are increasing in frequency due to rapid climate warming, posing significant risks regionally. This study found that glaciers are shrinking, especially in the middle and eastern Himalayas, while the number of glacial lakes has significantly increased. Since 1900, 283 glacier-related hazard events have been recorded, with a notable rise after 2000, particularly in summer months. Key factors contributing to hazard frequency include glacier retreat and temperature changes, with slope and temperature interactions playing a significant role. Additionally, some glacial lakes that have experienced outburst events are expanding, underscoring the need for enhanced monitoring and early warning systems to inform disaster management.
Author Contributions
Conceptualization, C.G.; methodology, C.G and M.G.; software, C.G.; validation, M.L., X.G. and P.W.; formal analysis, C.G.; investigation, C.G.; resources, S.L.; data curation, C.G.; writing—original draft preparation, C.G.; writing—review and editing, S.L.; visualization, C.G.; supervision, M.L.; project administration, S.L.; funding acquisition, S.L. All authors have read and agreed to the published version of the manuscript.
Funding
This research was funded by the National Key Research and Development Program of China, grant number 2021YFB3901205.
Data Availability Statement
Data used in this study will be available upon request from the first author.
Acknowledgments
We would like to sincerely thank Dr. Wei Bo and Dr. Gong Dianqing from Institute of Geographic Sciences and Natural Resources Research, CAS for their timely help.
Conflicts of Interest
The authors declare no conflict of interest.
References
- Jansson, P.; Hock, R.; Schneider, T. The concept of glacier storage: a review. J. Hydrol. 2003, 282, 116–129. [Google Scholar] [CrossRef]
- Van der Veen, C.J. Fundamentals of glacier dynamics: CRC press, 2013.
- Nie, Y.; Pritchard, H.D.; Liu, Q.; Hennig, T.; Wang, W.; Wang, X.; Liu, S.; Nepal, S.; Samyn, D.; Hewitt, K. Glacial change and hydrological implications in the Himalaya and Karakoram. Nature reviews earth & environment. 2021, 2, 91–106. [Google Scholar]
- Hugonnet, R.; McNabb, R.; Berthier, E.; Menounos, B.; Nuth, C.; Girod, L.; Farinotti, D.; Huss, M.; Dussaillant, I.; Brun, F. Accelerated global glacier mass loss in the early twenty-first century. Nature. 2021, 592, 726–731. [Google Scholar] [CrossRef] [PubMed]
- Yao, T.; Thompson, L.; Yang, W.; Yu, W.; Gao, Y.; Guo, X.; Yang, X.; Duan, K.; Zhao, H.; Xu, B. Different glacier status with atmospheric circulations in Tibetan Plateau and surroundings. Nat. Clim. Change. 2012, 2, 663–667. [Google Scholar] [CrossRef]
- Pu, J.; Yao, T.; Wang, N.; Su, Z.; Shen, Y. Fluctuations of the glaciers on the Qinghai-Tibetan Plateau during the past century. Journal of glaciology and Geocryology. 2004, 26, 517–522. [Google Scholar]
- Osman, M.B.; Tierney, J.E.; Zhu, J.; Tardif, R.; Poulsen, C.J. Globally resolved surface temperatures since the Last Glacial Maximum. Nature. 2021, 599, 239–244. [Google Scholar] [CrossRef]
- Hugonnet, R.; Mcnabb, R.; Berthier, E.; Menounos, B.; Kb, A. Accelerated global glacier mass loss in the early twenty-first century. Nature. 2021, 592, 726–731. [Google Scholar] [CrossRef]
- Su, B.; Xiao, C.; Chen, D.; Huang, Y.; Che, Y.; Zhao, H.; Zou, M.; Guo, R.; Wang, X.; Li, X. Glacier change in China over past decades: Spatiotemporal patterns and influencing factors. Earth-Sci. Rev. 2022, 226, 103926. [Google Scholar] [CrossRef]
- Liu, X.; Kutzbach, J.E.; Liu, Z.; An, Z.; Li, L. The Tibetan Plateau as amplifier of orbital-scale variability of the East Asian monsoon. Geophys. Res. Lett. 2003, 30. [Google Scholar] [CrossRef]
- Zhou, T.; Zhang, W. Anthropogenic warming of Tibetan Plateau and constrained future projection. Environ. Res. Lett. 2021, 16, 44010–44039. [Google Scholar] [CrossRef]
- You, Q.; Wu, F.; Shen, L.; Pepin, N.; Jiang, Z.; Kang, S. Tibetan Plateau amplification of climate extremes under global warming of 1.5 C, 2 C and 3 C. Global Planet. Change. 2020, 192, 103261. [Google Scholar] [CrossRef]
- Yao, T.; Pu, J.; Lu, A.; Wang, Y.; Yu, W. Recent glacial retreat and its impact on hydrological processes on the Tibetan Plateau, China, and surrounding regions. Arctic, Antarctic, and Alpine Research. 2007, 39, 642–650. [Google Scholar] [CrossRef]
- Yao, T.; Thompson, L.; Yang, W.; Yu, W.; Gao, Y.; Guo, X.; Yang, X.; Duan, K.; Zhao, H.; Xu, B. Different glacier status with atmospheric circulations in Tibetan Plateau and surroundings. Nat. Clim. Change. 2012, 2, 663–667. [Google Scholar] [CrossRef]
- Cheng, T.F.; Chen, D.; Wang, B.; Ou, T.; Lu, M. Human-induced warming accelerates local evapotranspiration and precipitation recycling over the Tibetan Plateau. Communications Earth & Environment. 2024, 5, 388. [Google Scholar]
- Yao, T.; Bolch, T.; Chen, D.; Gao, J.; Immerzeel, W.; Piao, S.; Su, F.; Thompson, L.; Wada, Y.; Wang, L. The imbalance of the Asian water tower. Nature Reviews Earth & Environment. 2022, 3, 618–632. [Google Scholar]
- Hugonnet, R.; McNabb, R.; Berthier, E.; Menounos, B.; Nuth, C.; Girod, L.; Farinotti, D.; Huss, M.; Dussaillant, I.; Brun, F. Accelerated global glacier mass loss in the early twenty-first century. Nature. 2021, 592, 726–731. [Google Scholar] [CrossRef]
- Taylor, C.; Robinson, T.R.; Dunning, S.; Rachel Carr, J.; Westoby, M. Glacial lake outburst floods threaten millions globally. Nat. Commun. 2023, 14, 487. [Google Scholar] [CrossRef]
- Nie, Y.; Deng, Q.; Pritchard, H.D.; Carrivick, J.L.; Ahmed, F.; Huggel, C.; Liu, L.; Wang, W.; Lesi, M.; Wang, J. Glacial lake outburst floods threaten Asia’s infrastructure. Science Bulletin. 2023, 68, 1361–1365. [Google Scholar] [CrossRef]
- Meng, Z.; Lyu, L.; Xu, M.; Yu, G.; Ma, C.; Wang, Z.; Stoffel, M. Effects of frequent debris flows on barrier lake formation, sedimentation and vegetation disturbance, Palongzangbo River, Tibetan Plateau. Catena. 2023, 220, 106697. [Google Scholar] [CrossRef]
- Du, R.; Zhang, S. Characteristics of glacial mud-flows in south-eastern Qingha-Xizang plateau. Journal of Glaciology and Geocryology. 1981, 10–16. [Google Scholar]
- Cui, P.; Jia, Y. Mountain hazards in the Tibetan Plateau: research status and prospects. National Science Review. 2015, 2, 397–399. [Google Scholar] [CrossRef]
- Wang, S.; Che, Y.; Xinggang, M. Integrated risk assessment of glacier lake outburst flood (GLOF) disaster over the Qinghai–Tibetan Plateau (QTP). Landslides. 2020, 17, 2849–2863. [Google Scholar] [CrossRef]
- Allen, S.K.; Zhang, G.; Wang, W.; Yao, T.; Bolch, T. Potentially dangerous glacial lakes across the Tibetan Plateau revealed using a large-scale automated assessment approach. Science Bulletin. 2019, 64, 435–445. [Google Scholar] [CrossRef] [PubMed]
- Gao, Y.; Liu, S.; Qi, M.; Zhu, Y.; Xie, F.; Wu, K.; Jiang, Z. Characterizing the behaviour of surge-type glaciers in the Geladandong Mountain Region, Inner Tibetan Plateau, from 1986 to 2020. Geomorphology. 2021, 389, 107806. [Google Scholar] [CrossRef]
- Wang, S.; Che, Y.; Xinggang, M. Integrated risk assessment of glacier lake outburst flood (GLOF) disaster over the Qinghai–Tibetan Plateau (QTP). Landslides. 2020, 17, 2849–2863. [Google Scholar] [CrossRef]
- Cui, P.; Jia, Y. Mountain hazards in the Tibetan Plateau: research status and prospects. National Science Review. 2015, 2, 397–399. [Google Scholar] [CrossRef]
- Zhao, C.; Yang, W.; Westoby, M.; An, B.; Wu, G.; Wang, W.; Wang, Z.; Wang, Y.; Dunning, S. Brief communication: An approximately 50 Mm 3 ice-rock avalanche on 22 March 2021 in the Sedongpu valley, southeastern Tibetan Plateau. The Cryosphere. 2022, 16, 1333–1340. [Google Scholar] [CrossRef]
- Guangjian, W.; Tandong, Y.; Weicai, W.; Huabiao, Z.; Wei, Y.; Guoqing, Z.; Shenghai, L.I.; Wusheng, Y.U.; Yanbin, L.; Wentao, H.U. Glacial hazards on Tibetan Plateau and surrounding alpines. Bulletin of Chinese Academy of Sciences (Chinese Version). 2019, 34, 1285–1292. [Google Scholar]
- Nie, Y.; Liu, Q.; Wang, J.; Zhang, Y.; Sheng, Y.; Liu, S. An inventory of historical glacial lake outburst floods in the Himalayas based on remote sensing observations and geomorphological analysis. Geomorphology. 2018, 308, 91–106. [Google Scholar] [CrossRef]
- Emmer, A.; Wood, J.L.; Cook, S.J.; Harrison, S.; Wilson, R.; Diaz-Moreno, A.; Reynolds, J.M.; Torres, J.C.; Yarleque, C.; Mergili, M.; et al. ; et al.. 160 glacial lake outburst floods (GLOFs) across the Tropical Andes since the Little Ice Age. Global Planet. Change. 2022, 208, 103722. [Google Scholar] [CrossRef]
- Zhang, Y.; Li, B.; Zheng, D. Datasets of the boundary and area of the Tibetan Plateau. Acta Geographica Sinica. 2014, 69, 65–68. [Google Scholar]
- Yao, T.D.; Yao, Z.J. Impacts of glacial retreat on runoff on Tibetan Plateau. Chinese J. Nat. 2010, 32, 4–8. [Google Scholar]
- Yao, T.; Bolch, T.; Chen, D.; Gao, J.; Immerzeel, W.; Piao, S.; Su, F.; Thompson, L.; Wada, Y.; Wang, L. The imbalance of the Asian water tower. Nature Reviews Earth & Environment. 2022, 3, 618–632. [Google Scholar]
- Zhang, Y.; Li, B.; Zheng, D. Datasets of the boundary and area of the Tibetan Plateau. Acta Geographica Sinica. 2014, 69, 65–68. [Google Scholar]
- Lixin, W.U.; Jia, L.I.; Zelang, M.; Wei, W.; Biyan, C.; Zhiwei, L.I.; Wujiao, D.; Wenbin, X.U. Pattern and directions of spaceborne-airborne-ground collaborated intelligent monitoring on the geo-hazards developing environment and disasters in glacial basin. Acta Geodaetica et Cartographica Sinica. 2021, 50, 1109. [Google Scholar]
- Kääb, A.; Leinss, S.; Gilbert, A.; Bühler, Y.; Gascoin, S.; Evans, S.G.; Bartelt, P.; Berthier, E.; Brun, F.; Chao, W. Massive collapse of two glaciers in western Tibet in 2016 after surge-like instability. Nat. Geosci. 2018, 11, 114–120. [Google Scholar] [CrossRef]
- Shi, Y.; Liu, C.; Kang, E. The glacier inventory of China. Ann. Glaciol. 2009, 50, 1–4. [Google Scholar] [CrossRef]
- Guo, W.; Liu, S.; Xu, J.; Wu, L.; Shangguan, D.; Yao, X.; Wei, J.; Bao, W.; Yu, P.; Liu, Q. The second Chinese glacier inventory: data, methods and results. J. Glaciol. 2015, 61, 357–372. [Google Scholar] [CrossRef]
- Su, B.; Xiao, C.; Chen, D.; Huang, Y.; Che, Y.; Zhao, H.; Zou, M.; Guo, R.; Wang, X.; Li, X. Glacier change in China over past decades: Spatiotemporal patterns and influencing factors. Earth-Sci. Rev. 2022, 226, 103926. [Google Scholar] [CrossRef]
- Shugar, D.H.; Burr, A.; Haritashya, U.K.; Kargel, J.S.; Watson, C.S.; Kennedy, M.C.; Bevington, A.R.; Betts, R.A.; Harrison, S.; Strattman, K. Rapid worldwide growth of glacial lakes since 1990. Nat. Clim. Change. 2020, 10, 939–945. [Google Scholar] [CrossRef]
- Wang, X.; Guo, X.; Yang, C.; Liu, Q.; Wei, J.; Zhang, Y.; Liu, S.; Zhang, Y.; Jiang, Z.; Tang, Z. Glacial lake inventory of high-mountain Asia in 1990 and 2018 derived from Landsat images. Earth System Science Data. 2020, 12, 2169–2182. [Google Scholar] [CrossRef]
- Chen, F.; Zhang, M.; Guo, H.; Allen, S.; Kargel, J.S.; Haritashya, U.K.; Watson, C.S. Annual 30 m dataset for glacial lakes in High Mountain Asia from 2008 to 2017. Earth System Science Data. 2021, 13, 741–766. [Google Scholar] [CrossRef]
- Zhang, G.; Yao, T.; Xie, H.; Wang, W.; Yang, W. An inventory of glacial lakes in the Third Pole region and their changes in response to global warming. Global Planet. Change. 2015, 131, 148–157. [Google Scholar] [CrossRef]
- 殷永胜; 王欣; 刘时银; 郭小宇; 张勇; 冉伟杰; 王琼. 1990—2020年中国冰湖变化特征及影响因素. 湖泊科学. 2023, 35, 10.
- Zhang, T.; Wang, W.; An, B.; Wei, L. Enhanced glacial lake activity threatens numerous communities and infrastructure in the Third Pole. Nat. Commun. 2023, 14, 8250. [Google Scholar] [CrossRef] [PubMed]
- Wang, X.; Ran, W.; Wei, J.; Yin, Y.; Liu, S.; Bolch, T.; Zhang, Y.; Xue, X.; Ding, Y.; Liu, Q. Spatially resolved glacial meltwater retainment in glacial lakes exerts increasing impacts in High Mountain Asia. J. Hydrol. 2024, 633, 130967. [Google Scholar] [CrossRef]
- Zhang, T. Global inventory of glacier-related slope failures and moraine dammed lake outburst floods. Geophys. Res. Lett. 2022.
- Mingyang, L.; Huadong, G.; Shiyong, Y.; Guanyu, L.; Di, J.; Haolei, Z.; Ziyan, Z. A dataset of surge-type glaciers in the High Mountain Asia based on elevation change and satellite imagery. China Scientific Data. 2022.
- Guo, L.; Li, J.; Dehecq, A.; Li, Z.; Li, X.; Zhu, J. A new inventory of High Mountain Asia surging glaciers derived from multiple elevation datasets since the 1970s. Earth System Science Data. 2023, 15, 2841–2861. [Google Scholar] [CrossRef]
- Yao, X.; Zhou, S.; Sun, M.; Duan, H.; Zhang, Y. Surging glaciers in High Mountain Asia between 1986 and 2021. Remote Sens.-Basel. 2023, 15, 4595. [Google Scholar] [CrossRef]
- YAO, X.; LIU, S.; SUN, M.; ZHANG, X. Study on the glacial lake outburst flood events in Tibet since the 20th century. Journal of Natural Resources. 2014, 29, 1377–1390. [Google Scholar]
- Zheng, G.; Bao, A.; Allen, S.; Antonio Ballesteros-Cánovas, J.; Yuan, Y.; Jiapaer, G.; Stoffel, M. Numerous unreported glacial lake outburst floods in the Third Pole revealed by high-resolution satellite data and geomorphological evidence. Science Bulletin. 2021, 66, 1270–1273. [Google Scholar] [CrossRef]
- Peng, S.; Ding, Y.; Liu, W.; Li, Z. 1 km monthly temperature and precipitation dataset for China from 1901 to 2017. Earth System Science Data. 2019, 11, 1931–1946. [Google Scholar] [CrossRef]
- Wang, J.; Xu, C. Geodetector: Principle and prospective. Acta Geographica Sinica. 2017.
- Rounce, D.R.; Hock, R.; Maussion, F.; Hugonnet, R.; Kochtitzky, W.; Huss, M.; Berthier, E.; Brinkerhoff, D.; Compagno, L.; Copland, L. Global glacier change in the 21st century: Every increase in temperature matters. Science. 2023, 379, 78–83. [Google Scholar] [CrossRef] [PubMed]
- Ninglian, W.; Tandong, Y.; Baiqing, X.; An’An, C.; Weicai, W. Spatiotemporal pattern, trend, and influence of glacier change in Tibetan Plateau and surroundings under global warming. Bulletin of Chinese Academy of Sciences (Chinese Version). 2019, 34, 1220–1232. [Google Scholar]
- Hewitt, K. The Karakoram anomaly? Glacier expansion and the’elevation effect,‘Karakoram Himalaya. Mt. Res. Dev. 2005, 332–340. [Google Scholar] [CrossRef]
- Yin, Y.; Wang, X.; Liu, S.; Guo, X.; Zhang, Y.; Ran, W.; Wang, Q. Characteristics and influence factors of the glacial lake changes in China from 1990 to 2020. Lake Science. 2023, 35, 358–367. [Google Scholar]
- Chen, W.; Yao, T.; Zhang, G.; Woolway, R.I.; Yang, W.; Xu, F.; Zhou, T. Glacier surface heatwaves over the Tibetan Plateau. Geophys. Res. Lett. 2023, 50, e2022G–e101115G. [Google Scholar] [CrossRef]
- Veh, G.; Lützow, N.; Kharlamova, V.; Petrakov, D.; Hugonnet, R.; Korup, O. Trends, breaks, and biases in the frequency of reported glacier lake outburst floods. Earth’s Future 2022, 10, e2021E–e2426E. [Google Scholar] [CrossRef]
- Rick, B.; McGrath, D.; McCoy, S.W.; Armstrong, W.H. Unchanged frequency and decreasing magnitude of outbursts from ice-dammed lakes in Alaska. Nat. Commun. 2023, 14, 6138. [Google Scholar] [CrossRef]
- Zheng, G.; Bao, A.; Allen, S.; Ballesteros-Cánovas, J.A.; Yuan, Y.; Jiapaer, G.; Stoffel, M. Numerous unreported glacial lake outburst floods in the Third Pole revealed by high-resolution satellite data and geomorphological evidence. Sci. Bull. 2021, 66, 1270–1273. [Google Scholar] [CrossRef]
- Frey, H.; Paul, F.; Strozzi, T. Compilation of a glacier inventory for the western Himalayas from satellite data: methods, challenges, and results. Remote Sens. Environ. 2012, 124, 832–843. [Google Scholar] [CrossRef]
- Zhang, G.; Carrivick, J.L.; Emmer, A.; Shugar, D.H.; Veh, G.; Wang, X.; Labedz, C.; Mergili, M.; Mölg, N.; Huss, M. Characteristics and changes of glacial lakes and outburst floods. Nature Reviews Earth & Environment. 2024, 1-16.
- Gu, C.; Li, S.; Liu, M.; Hu, K.; Wang, P. Monitoring glacier lake outburst flood (GLOF) of Lake Merzbacher using dense chinese high-resolution satellite images. Remote Sens.-Basel. 2023, 15, 1941. [Google Scholar] [CrossRef]
- Zhang, T.; Wang, W.; An, B. Heterogeneous changes in global glacial lakes under coupled climate warming and glacier thinning. Communications Earth & Environment. 2024, 5, 374. [Google Scholar]
- Nie, Y.; Liu, Q.; Wang, J.; Zhang, Y.; Sheng, Y.; Liu, S. An inventory of historical glacial lake outburst floods in the Himalayas based on remote sensing observations and geomorphological analysis. Geomorphology. 2018, 308, 91–106. [Google Scholar] [CrossRef]
- Rafiq, M.; Romshoo, S.A.; Mishra, A.K.; Jalal, F. Modelling Chorabari lake outburst flood, kedarnath, India. J. Mt. Sci.-Engl. 2019, 16, 64–76. [Google Scholar] [CrossRef]
- Li, S.; Zhang, Y.; Wang, Z.; Li, L. Mapping human influence intensity in the Tibetan Plateau for conservation of ecological service functions. Ecosystem Services. 2018, 30, 276–286. [Google Scholar] [CrossRef]
- Qi, W.; Liu, S.; Zhou, L. Regional differentiation of population in Tibetan Plateau: Insight from the “Hu Line”. Acta Geogr. Sin. 2020, 75, 255–267. [Google Scholar]
Figure 1.
Geographical location of Tibetan Plateau and distribution of glaciers in surrounding areas. The Tibetan Plateau boundary is obtained from Zhang et al. [
35].
Figure 1.
Geographical location of Tibetan Plateau and distribution of glaciers in surrounding areas. The Tibetan Plateau boundary is obtained from Zhang et al. [
35].
Figure 2.
Illustration of glacial hazards chain. Glacial disasters often exhibit a typical chain of events: glacier surges lead to ice collapses (sometimes triggered by rapid warming) → the collapse of ice causes ice masses to enter rivers or lakes → this results in damming or glacial lake outbursts, which in turn trigger floods → floodwaters then rush downstream along valleys, leading to flash floods and mudslides.
Figure 3.
Summary of published glacial lakes datasets across different scales, including Global, High Mountain Asia(HMA), and Third Pole. Grey bars show the composite years of cloud-free scenes. Blue and green circles denote the satellite source, the circles were scaled according to the minimum size of mapped glacial lakes. Glacial lake numbers and area in Tibetan Plateau of each datasets were counted and filled in the table.
Figure 4.
Glacial lake extraction results from 1990 to 2020 based on Google Earth Engine.
Figure 4.
Glacial lake extraction results from 1990 to 2020 based on Google Earth Engine.
Figure 5.
Spatial distribution of the glacier changes over the Tibetan Plateau. a, The distribution of glaciers in the second glacier inventory were counted in the 100*100 km grids. The yellow circle size depicted the glacier changes between the first and the second glacier inventory. b, The histogram demonstrated the elevation range changes between the first and the second glacier inventory.
Figure 6.
Spatial distribution of the glacial lake changes from 1990 to 2020 over the Tibetan Plateau. a, The distribution of glacial lakes in the 2020 were counted in the 100*100 km grids. The purple circle size depicted the glacial lake changes between 1990 and 2020. b, The histogram demonstrated the elevation range changes between 1990 and 2020.
Figure 7.
Distribution of historical glacial hazards events in the Tibetan Plateau.
Figure 7.
Distribution of historical glacial hazards events in the Tibetan Plateau.
Figure 8.
Analyses for six rapidly expanding glacial lakes after GLOF. a~f denotes a glaical lake (90.61°E, 28.07°N) on Cuolong Glacier, Jialong Co (85.85°E, 28.21°N), unkonw glacial lake (85.48°E, 28.66°N), Boge Co (94.76°E, 31.86°N), Gelhaipu Co/Jilai Co (87.81°E, 27.96°N), and Zhangzangbo/Cirenma Co (86.07°E, 28.07°N), respectively.
Table 1.
Interactive detection of factors affecting the frequency of glacier disasters.
Table 1.
Interactive detection of factors affecting the frequency of glacier disasters.
| Influencing factors |
June temperature change rate |
July temperature change rate |
October temperature change rate |
September temperature change rate |
Elevation |
Slope |
Glacier changes |
| June temperature change rate |
|
|
|
|
|
|
|
| July temperature change rate |
0.2394 |
|
|
|
|
|
|
| October temperature change rate |
0.1642 |
0.2655 |
|
|
|
|
|
| September temperature change rate |
0.2336 |
0.2087 |
0.1724 |
|
|
|
|
| Elevation |
0.2418 |
0.2327 |
0.2094 |
0.2382 |
|
|
|
| Slope |
0.3759 |
0.1725 |
0.3217 |
0.3022 |
0.3745 |
|
|
| Glacier changes |
0.2198 |
0.2368 |
0.3359 |
0.2349 |
0.2280 |
0.2575 |
|
|
Disclaimer/Publisher’s Note: The statements, opinions and data contained in all publications are solely those of the individual author(s) and contributor(s) and not of MDPI and/or the editor(s). MDPI and/or the editor(s) disclaim responsibility for any injury to people or property resulting from any ideas, methods, instructions or products referred to in the content. |
© 2024 by the authors. Licensee MDPI, Basel, Switzerland. This article is an open access article distributed under the terms and conditions of the Creative Commons Attribution (CC BY) license (http://creativecommons.org/licenses/by/4.0/).