
Submitted:
08 November 2024
Posted:
12 November 2024
You are already at the latest version
Abstract
The accumulation of anesthetic gas residues in surgery units can pose health risks to healthcare professionals, highlighting the need for the establishment of effective protection measures. This study evaluated waste anesthetic gas levels in a Local Health Unit in Northern Portugal to identify high-exposure areas during surgeries with general anesthesia. Measurements of desflurane, sevoflurane, carbon dioxide, air temperature, and relative humidity were taken during 20 surgeries carried out approximately throughout six months. Results show that the existing HVAC system was able to efficiently control temperature but failed to maintain recommended humidity levels. The detected WAG concentrations fluctuated across different locations, with concerning peaks being detected in specific settings. Desflurane levels reached 8.79 ppm in the general surgery room (GSR) and averaged 3.13 ppm in the recovery room (RR), while sevoflurane averaged 2.06 ppm in the RR. High concentrations were notably observed after endotracheal tube removal, exceeding recommendations of U.S. National Institute for Occupational Safety and Health (NIOSH). In short surgeries, anesthetic gas levels exceeded safety limits, while long surgeries caused sevoflurane peaks, highlighting the need for improved extraction/ventilation systems. Longer surgeries and higher occupancy were significantly linked to increased WAG and carbon dioxide levels, emphasizing the need for improving ventilation and environmental controls to safeguard healthcare professionals.
Keywords:
Indoor air
; Sevoflurane
; Desflurane
; Occupational safety
; General anesthesia
; Circular anesthesia system
1. Introduction
Healthcare services face increasing demand due to various health conditions within the population [1]. In this context, anesthesia plays a crucial role in performing surgical interventions by suppressing pain and inducing a state of unconsciousness and temporary loss of sensation in patients during a variety of medical procedures [2]. Currently, halogenated gases such as sevoflurane, isoflurane, and desflurane are the most frequently used as volatile anesthetic agents [3]. Initially in a liquid state, these compounds are converted into volatile anesthetics when vaporized and administered through inhalation, mixed with a carrier gas like oxygen. This can be done using devices such as mechanical ventilation, endotracheal tubes, laryngeal masks and facial masks [4,5]. Consequently, surgical professionals may be exposed daily to waste anesthetic gases (WAGs) released from the system due to leaks in piping, seals, and joints, improper practices, lack of training, inadequate ventilation, ineffective gas scavenging systems, and improper maintenance of equipment [6]. Additionally, during clinical use, volatile anesthetics are not fully metabolized by the body and are exhaled unchanged [7]. Whenever the flow of WAGs reaches the breathing zone of anyone in the area, it is considered a setting of “high risk” of exposure. The overall risk level depends on the frequency and duration of this exposure [8].
Exposure to WAGs in operating rooms presents both short-term and long-term impacts. Immediate effects include fatigue, headaches, irritability, and lethargy, while prolonged exposure is associated with various disorders in workers and fetuses. Healthcare professionals face occupational risks due to this exposure, linked to reproductive problems, fatigue, headaches, and nausea. In patients, the toxicity of these gases is reflected in elevated serum bilirubin and liver enzymes. Additionally, prolonged exposure can cause oxidative stress, DNA damage, increasing the risk of cancer and other chronic issues, as well as congenital defects and pregnancy complications. Despite this, volatile anesthetics are classified as Group 3 by the International Agency for Research on Cancer (IARC), as long as they are within permitted limits [9,10,11].
In 1977, the U.S. National Institute for Occupational Safety and Health (NIOSH) recommended that occupational exposure to halogenated anesthetic agents should not exceed concentrations of >2 ppm when used alone, or >0.5 ppm when used in combination with nitrous oxide, during a sampling period not exceeding 1 hour (time-weighted average exposure) [12]. Additionally, it is recommended that anesthesia machines, non-rebreathing systems, and T-piece devices should have effective scavenging systems to capture all WAGs. Current guidelines from the U.S. Department of Labor, Occupational Safety and Health Administration (OSHA), advise minimizing exposure to all residual and trace gases to protect worker health and safety. In general, since absolutely safe levels have not been scientifically determined, most guidelines and policies on inhaled anesthetics tend to be advisory rather than mandatory [13]. To encourage member states to expand occupational health surveillance (OHS) coverage, the European Union (EU) implemented Council Directive 89/391 on June 12, 1989, which addresses the introduction of measures to promote improvements in workplace safety and health [14]. The directive establishes guidelines for safety and health in the healthcare sector, adopting a hierarchy of prevention and protection measures: a) eliminate the hazard; b) substitute with less hazardous processes, operations, materials, or equipment; c) use engineering controls and job reorganization; d) use administrative controls, including training; and e) use appropriate personal protective equipment.
Hospitals encompass diverse work environments, such as day hospitals, perioperative care units, and operating rooms, where many people may be potentially exposed. Therefore, it is important—and often required—to measure WAG concentrations. This allows for the identification, implementation, and maintenance of appropriate safety measures [3]. Recent studies have investigated the potential adverse effects of occupational exposure to WAGs on the health of healthcare professionals. Silva et al. (2022) assessed biomarkers of genetic instability, oxidative stress, and susceptibility genes in professionals exposed to high levels of anesthetic gases in operating rooms, comparing them with a non-exposed control group. The results showed that exposed professionals had higher rates of buccal micronuclei and nuclear buds, especially those over 30 years old. Exposed men had greater antioxidant capacity (FRAP) than exposed women, who showed higher frequencies of buccal micronucleus (MN) and nuclear bud (NBUD) compared to unexposed women. Genetic instability was greater in professionals with higher weekly exposure, and those exposed for longer periods showed oxidative stress [6]. This finding was also reported by Braz et al. (2020), who conducted a cross-sectional study on young doctors exposed to WAGs at the end of their medical residency. They found increased DNA damage and inflammation in exposed doctors, highlighting the genetic and inflammatory risks associated with exposure. However, they did not find significant differences in oxidative stress markers [15]. In another study conducted by Amiri et al. (2018), it was investigated whether exposure of operating room professionals to inhaled anesthetics (nitrous oxide, isoflurane, and sevoflurane) caused hematological changes. The results indicated that although exposure levels were often within recommended limits, there was evidence of subtle changes in the hematological health of exposed healthcare professionals, who had significantly lower average hemoglobin, hematocrit, and red blood cell counts compared to the control group [16].
There is also interest in evaluating the effectiveness of exposure control measures for WAGs, such as ventilation systems, protective masks, and safety protocols, in reducing professionals' exposure to WAGs. In the study by Sárkány et al. (2016), a laminar flow air conditioning system in operating rooms was assessed to determine whether the position of the anesthetist (sitting versus standing) affected exposure to anesthetic gases. The results indicated that exposure did not differ significantly between the two positions, suggesting that laminar ventilation may be effective in reducing exposure [17]. In the study conducted by Kisielinski et al. (2024), N95, surgical, and fabric/disposable masks were examined for exposure to Volatile Organic Compounds (VOCs). The results revealed VOCs released by the masks, which can accumulate inside them, especially during prolonged use. These concentrations exceeded reference limits from various institutions, including the World Health Organization (WHO) Air Quality Guidelines and Oeko-Tex Standard 100. For example, for the N95 mask, the total VOC release was 403 mg/m³ in 17 minutes, while for the surgical mask, it exceeded 1000 μg/m3 in the first hour [18]. Additionally, studies have investigated how factors such as the frequency and duration of exposure, as well as the type of anesthetic gas may influence levels of WAGs. For instance, the study by Jafari et al. (2017) compared isoflurane and sevoflurane concentrations in the breathing zone and ambient air of operating rooms, correlating respiratory levels with urinary concentrations and assessed pollution at different times and weeks. The results indicated that urinary isoflurane is a more effective biomarker for monitoring occupational exposure and suggested the implementation of real-time air monitoring [19].
Although some studies have assessed exposure to anesthetic gases, significant gaps remain and need to be addressed. Current research often focuses on overall exposure levels without analyzing variations across different locations and over time within the operating room. Additionally, it frequently neglects to investigate the specific factors contributing to high exposure levels. Thus, the main objectives of this study, conducted in the Operating Suite of a Local Health Unit located in the Northern Region of Portugal, were 1) to assess the levels of anesthetic gases – desflurane and sevoflurane - in different areas of an operating sector during various surgeries, and 2) to identify the locations/periods of highest exposure, along with the specific causes/factors contributing to these situations. The study included the precise quantification of these anesthetic gases, and the characterization of occupational exposure compared to NIOSH recommended limits.
2. Materials and Methods
2.1. Surgery Unit and Anesthetic Process
The study was conducted in the surgical suite of a Local Health Unit located in northeast of Portugal. The unit was inaugurated in 1973 and has undergone several renovations over the years, especially since 2004. Figure 1 presents an illustration of the surveyed surgical suite. Briefly, the surgical block consists of two operating rooms—one for scheduled general surgeries and the other for emergency surgeries—as well as disinfection, recovery and medical files rooms and also a patient transfer area. The ventilation in the operating room is manually controlled by the HVAC system, which includes both bag filters, used for coarse particle filtration (replaced weekly), and high-efficiency filters (replaced annually). The operating rooms are ventilated and used for both scheduled and emergency surgeries, with approximately 30 m² each. The disinfection and recovery rooms are designed to ensure the cleanliness and safety of patients.
The medical, nursing, and auxiliary staff, along with medical and nursing interns, move through the operating unit during clinical activities. The anesthesia system used in the hospital is the Leon Plus model from Löwenstein Medical SE & Co. KG, Bad Ems, Germany, with a precise electronic gas mixture in a wide flow range of 200 ml/min up to 18 l/min, thus usable from the semi-open to quasi-closed range. In a semi-closed circular system, the Adjustable Pressure Limiting (APL) valve is opened to allow excess gas to be removed from the system, reducing the risk of barotrauma. However, the relatively high flow of fresh gas enables the use of an external vaporizer which can provide a higher and more accurate percentage of anesthetic gas for the mixture. In a closed circular system, the APL valve, which allows variable pressure within the anesthesia system using a spring-loaded unidirectional valve, is completely closed. Although this is the most efficient anesthetic ventilation system, it leaves little margin for error. The fresh gas flow must meet the patient's exact needs, and the soda lime must absorb all the exhaled carbon dioxide. The minimal flow in this system allows for the use of only one vaporizer within the circuit.
The anesthetic gases used by the anesthetists were desflurane (C₃H₂F₆O; CAS: 57041-67-5; 1 ppm = 6.87 mg/m³ at 1 atm and 25 ºC) and sevoflurane (C₄H₃F₇O; CAS: 28523-86-6; 1 ppm = 8.17 mg/m³ at 1 atm and 25 ºC), with the specific choice of gas varying according to the anesthesiologist's preference. During surgeries, these gases were administered after intravenous anesthetic induction with propofol, followed by endotracheal intubation.
2.2. Measurements of Physical-Chemical Parameters
The study involves the monitoring of 20 surgeries from January to June 2019, of which 8 were performed with desflurane and 12 with sevoflurane, all of them conducted in general surgery room. Additionally, three similar trials were conducted on days when no surgeries were performed, to establish a baseline situation and simultaneously allow for a more rigorous comparison and validation of the results.
Measurements of desflurane, sevoflurane, carbon dioxide (CO₂), temperature, and relative humidity were taken in three areas of the operating unit: the general surgery room (GSR), the recovery room (RR), and the transfer zone (TZ), during surgeries and non-surgery periods, as well as measurements in the external corridor (EC) for comparison. Measurements in the GSR were taken at five points: the entrance of the room (A), anesthesia tubing at the patient (B), the medical team area (C), near the anesthesia equipment (D), and where the anesthesiologist stands (E). In the RR, measurements were taken near the anesthesia equipment (F), at the room exit (G), and near patients 1 (H) and 2 (I). In the TZ, measurements were taken near door 1 (J), near the window (K), the central area of the transfer zone (L), and near door 2 (M). In the EC, two random points were chosen for measurement: near the entrance to the men's room (N) and near the window of the external corridor (O).
The Gasera One Pulse, analyser, from Gasera, Turku, Finland device was used to measure WAGs and CO₂. This device uses infrared photoacoustic spectroscopy and operates continuously, allowing for real-time, in situ air sample collection and analysis. The Gasera One Pulse was configured to measure the anesthetic gases of interest, CO₂, ethanol, and water vapor, enabling sample collection and analysis every 3 minutes. Only a few milliliters of sample were needed to be injected into the photoacoustic gas cell of the device to achieve detection sensitivity. Ethanol and water vapor measurements were conducted to correct for cross-interference in the readings of volatile anesthetics and CO₂, respectively. CO₂ measurements were performed to assess ventilation conditions in the spaces, and its concentrations were compared to the protection threshold established by Portaria n.º 138-G/2021, of July 1 [20].
Additionally, an IQ-610 probe from Graywolf Sense Solutions and a low-cost temperature and humidity sensor integrated with an Arduino platform were used to measure temperature and relative humidity, comparing them with the Technical Specifications for HVAC Installations – ET 06/2008 [21] and Decree-Law No. 246/1989 related to occupational safety [23], and to assess thermal comfort using the psychometric diagram adapted by Givoni (1992) [22]. The IQ-610 probe was used for the first ten surgeries, while the low-cost sensor, connected to an Arduino platform, was used for the next ten surgeries. Both the IQ-610 probe and the Arduino-based system ensured accurate real-time measurements. The Graywolf probe was mounted on a mini tripod, positioned centrally in the measurement spaces, on a movable table approximately 1.50 m high. The Arduino-based sensor allowed for portability and quick setup. Measurements were approximately 1 hour in the RR, TZ, and EC, and between 2 to 4 hours in the GSR, depending on the duration of the surgeries.
2.4. Data Analysis
The data were processed using Microsoft Excel and JMP 11 to calculate weighted averages of the anesthetic gases administered to patients (based on surgery time) and to perform statistical analyses. In addition to descriptive statistics, comparisons were made between data collected at different locations and between sampling points within each location. After checking for normality and homogeneity of the data, ANOVA and Tukey’s post-hoc test was applied, with a significance level set at p < 0.05. Whenever ANOVA assumptions were not met, the non-parametric Kruskal-Wallis test was applied, followed by multiple comparisons of mean ranks.
Data visualization through boxplots was also performed to represent the distribution of the analyzed parameters. In these plots, the central line inside the box indicates the median, the box itself spans the interquartile range (IQR) between the first (Q1) and third quartiles (Q3), and the "whiskers" extend to 1.5 times the IQR. Any data points outside this range are considered outliers and are plotted as individual points. Additionally, the mean is shown as a small square within the box.
R Studio software was used to obtain a multiple correlation matrix between the results of temperature (T), relative humidity (RH), carbon dioxide (CO₂), anesthetic gas residues (WAGs), surgery time (t), the number of people present in the room (N), and the weighted average of the concentration of gas delivered (WA). This allowed for the verification of correlations between these variables. The concentration of gas delivered (WA) was calculated as a weighted average based on the percentage of anesthetic gas administered over the duration of the surgery. The anesthesiologist adjusts the percentage of gas delivery multiple times throughout the surgery. For each adjustment, the percentage of gas and the corresponding time at that level were recorded. The weighted average was then calculated by multiplying each percentage of gas by the time it remained in use, summing these products, and dividing by the total surgery time. This approach reflects the varying levels of anesthetic gas administered at different stages of the surgery.
3. Results
3.1. Environmental Conditions
3.1.1. Thermal Comfort assessment
During the study period, air temperature values ranged from 19.4 ºC to 30.2 ºC, with the minimum temperature being recorded in the GSR and the maximum in the EC. Notably, the GSR and RR exhibited lower and similar temperature values, which can be attributed to the air conditioning provided by the HVAC system. Statistical analysis using the Kruskal-Wallis test revealed that temperatures assessed in the GSR and RR were similar, while statistically significant differences were observed when compared to the TZ and EC. The boxplots in Figure 2 illustrate the interquartile range and the extreme values of temperature and relative humidity in the four examined spaces.
Comparing the obtained data with the technical standards for HVAC installations in hospital environments, it was found that the average temperature in the GSR, RR, and TZ fell within the recommended ranges of 17 ºC to 27 ºC in operating rooms and 24 ºC in the recovery room and other areas of the operating suite. However, the increased temperature values recorded in the EC (median of 27.4 ºC) are likely to be attributed to factors including the lack of thermal control by the HVAC system, its location in the southern wing of the hospital— which is exposed to higher solar incidence — and the timing of the measurements, which were often conducted in the afternoon. This value exceeds the recommended temperature range for indoor environments established by Decree-Law No. 243/1986, which specifies a range of 18 ºC to 24 ºC for workplace safety [23]. Additionally, it surpasses the acceptable temperature range outlined by WHO, which recommends maintaining temperatures between 18 ºC and 24 ºC in healthcare settings [24]. Furthermore, the American Society of Heating, Refrigerating and Air-Conditioning Engineers (ASHRAE) Standard 170 suggests a temperature range of 21 ºC to 24 ºC in operating rooms [25].
Regarding the relative humidity of the air in the different evaluated spaces, the minimum values ranged from 11.4% to 22.3% (RR and EC, respectively), and the maximum values ranged from 53.1% to 57.9% (EC and GSR, respectively). The locations with the lowest average air humidity values were the TZ and RR (34.1% and 35.6%, respectively), while the highest was in the GSR (42.7%). Although the average relative humidity values are within the limits established in the technical specifications – between 30% and 60% –, the low air humidity levels recorded can cause respiratory discomfort and may be associated with the development of respiratory diseases. This situation occurred occasionally since humidity control is managed manually, making it difficult to adjust effectively. In the EC, the relative humidity did not reach the recommended values as set by Decree-Law No. 246/1989, which indicates a range between 50% and 70%. The average relative humidity obtained was 38.9%, with a minimum of 22.3%, a maximum of 53.1%, and a median of 40.6%. Using the psychometric diagram adapted by Givoni (1992), it was found that the operating suite falls within the thermal comfort zone with low humidity (classification D) [22].
3.1.2. Comprehensive Evaluation of Air Exchange Rates
Table 1 provides a summary of CO₂ concentration measurements (ppm) for the different operating room compartments, including minimum, maximum, median, and mean values with standard deviation, also comparing conditions for periods without surgeries and with surgeries. The lowercase letters next to the median values indicate statistically significant differences according to the Kruskal-Wallis test (p < 0.05). Different letters within the same column denote significant differences between levels of CO2 registered in the different spaces.
Figure 3 shows the boxplots of CO₂ concentrations (ppm) in the different studied spaces, for both periods without and with surgeries.
The average CO₂ levels measured in the different areas of the operating suite, in the absence of surgeries, ranged between 426 and 878 ppm, significantly below the 1250 ppm national limit established by Portaria 138-G of 2021 for an 8-hour exposure period. These results indicate efficient ventilation throughout the operating suite, given that indoor CO2 levels are a good proxy for ventilation conditions mainly in rooms where occupants are a major source of contaminants. In occupational environments involving the use of chemical products, this discussion should be approached more cautiously, because even at low CO₂ concentrations, improved ventilation/extraction may be necessary to ensure adequate removal of pollutants resultant from indoor activities.
The lowest CO₂ averages were observed in the GSR and RR, with 486 ppm and 505 ppm, respectively, according to the Kruskal-Wallis test, suggesting that these areas have better ventilation compared to the TZ and EC, which had averages of 591 ppm and 727 ppm, respectively.
During surgeries, the average CO₂ concentrations were slightly higher but still well below the recommended limits. This increase can be easily explained by the higher activity and the presence of a higher number of people in the rooms, but it does not compromise air quality, indicating that ventilation appear to be adequate to the existing occupant density. In the TZ, CO₂ levels ranged between 562 ppm and 798 ppm, benefiting from the operating suite's air pressure and the frequent door openings, which facilitate air exchange and prevent contaminant buildup. In the EC, CO₂ levels remained above 600 ppm but did not reach critical values. Ventilation is ensured by the constant door openings, allowing for adequate air circulation. Analysis using the Kruskal-Wallis test showed that CO₂ results in the GSR are similar to those in the TZ, both showing good ventilation. The GSR is equipped with AVAC system supply grilles, while the TA benefits from pressure gradients and lower occupancy. The RR also demonstrated good ventilation, with an average CO₂ level of 625.3 ppm. However, one outlier exceeded the recommended 1250 ppm in the GSR, along with several other values that approached this threshold. These elevated concentrations may be associated with high occupancy levels in the environment.
3.2. Concentrations of Anesthetic Gas Residues (WAGs)
3.2.1. Without Surgery
Figure 4 presents the concentrations of desflurane and sevoflurane measured during periods when no surgeries were taking place in the operating suite. It is observed that the variability of values between different spaces was relatively low, with the highest recorded values not exceeding 0.34 ppm for desflurane and 0.41 ppm for sevoflurane. The Tukey test confirmed the absence of significant differences between the mean values of the different locations evaluated for both gases. These results indicate that, even in the absence of the use of anesthetic gases, the measurements are not null but have values below 0.45 ppm.
3.2.2. With Surgery
Table 2 presents the average residual concentrations of desflurane and sevoflurane in the different spaces evaluated during 20 surgeries, along with the respective minimums, means, standard deviations, medians, and maximums for each space. In general, measurements in the TZ and EC were consistently below 2 ppm for both gases, with a reduced range over the trials. These locations fully comply with NIOSH recommendations, with the lowest levels observed in the EC due to its distance from the sources of anesthetic gas emissions, making this location a reference. The maximum values were 0.35 ppm for sevoflurane, while the minimums were 0.07 ppm and 0.03 ppm for desflurane and sevoflurane, respectively.
In the GSR, the average values of sevoflurane were relatively low, although those of desflurane occasionally exceeded 2 ppm, indicating adverse situations. In the RR, the average concentrations of sevoflurane and desflurane were 2.06 ppm and 3.13 ppm, respectively, suggesting that this is the most critical space in the operating block. Despite the existing ventilation in the RR, it appears insufficient to mitigate emissions from the expiration of anesthetic gases during anesthesia.
It was observed that the measurement results in the EC and TZ, with and without the occurrence of surgeries, were quite similar. In the GSR, the average results of sevoflurane were close, with and without surgeries, being 0.41 ppm and 0.23 ppm, respectively. For desflurane, a discrepancy was identified due to one surgery performed with the halogenated gas exhaust system turned off, resulting in an average of 1.58 ppm with surgeries and 0.12 ppm without surgeries. In the RR, the difference was greater, with averages of 0.24 ppm without surgeries and 2.06 ppm with surgeries for sevoflurane, and 0.13 ppm and 3.13 ppm, respectively, for desflurane. The Kruskal-Wallis test demonstrated that all locations showed distinct patterns, with all being significantly different from each other for both gases. Figure 5 presents the boxplots of the spatial variations of residual concentrations of desflurane and sevoflurane in the indoor air of each assessed location, aiming to better understand the distribution of these gas levels and the exposure depending on the occupants' positions in these locations.
In the measurements conducted in the GSR, a significant variation was observed in the concentrations of desflurane and sevoflurane at different points in the room. The values of sevoflurane were consistently lower than those of desflurane, except for the measurement point near the patient's breathing circuit, where the concentrations of desflurane and sevoflurane reached 10 ppm after the removal of the breathing tube. The highest concentrations of desflurane were recorded near the anesthesia equipment, reaching up to 37.81 ppm, especially when the gas exhaust system was turned off. The average concentrations of sevoflurane ranged from 0.28 ppm near the room entrance to 0.65 ppm near the anesthesia equipment.
In the RR, both desflurane and sevoflurane exhibited similar variation patterns to those observed in the surgery room, with less variability at points F, G, and I. Point H, near the patient's breathing area, showed high variability for desflurane, with concentrations ranging from 0.58 to 31.30 ppm. This point was identified as the most critical, reflecting higher exposure to desflurane after general anesthesia.
In the TZ, the levels of desflurane and sevoflurane were low at all monitored locations, with some variability within the recorded intervals. Desflurane reached higher levels on the day the exhaust system was turned off, allowing gas accumulation in distant locations. Analyses using the Kruskal-Wallis test indicated that differences between sampling points were not statistically significant, grouping all in the same classification. In the EC, the spatial variability of desflurane and sevoflurane concentrations was minimal, with values below 0.29 ppm and 0.27 ppm, respectively. These results are consistent with the corridor's distant location relative to the surgery room, suggesting limited dispersion of anesthetic gases. Measurements in the corridor also served as a control, confirming that values detected close to zero are within the detection limits of the equipment used.
3.3. Anesthetic Gas Exposure over Time
3.3.1. Short Surgeries
This section evaluates the potential exposure of healthcare professionals in operating rooms during procedures lasting approximately one hour. Two distinct surgeries were analyzed, each supervised by different anesthetists and involving the use of desflurane as the anesthetic gas. Anesthetist 1 performed a laparoscopic cholecystectomy, while Anesthetist 2 conducted a quadrantectomy. Figure 6 compares the environmental levels of anesthetic gases during these surgeries.
Desflurane concentrations were sequentially measured at two specific points within the room: point C, in the medical team area, and point E, near the anesthetist. The black line in both graphs indicates the variations in the percentages of anesthetic gas administered by the anesthesia machine, which were manually adjusted by the anesthetists during the procedures. The weighted average concentration of the gas administered was 4.29% for Anesthetist 1 and 4.32% for Anesthetist 2. The analysis of desflurane concentrations during the surgeries reveals important differences in exposure depending on the measurement location and the percentages administered by the anesthetists. In Figure 6(a), related to the laparoscopic cholecystectomy conducted by Anesthetist 1, a rapid increase in the concentration of desflurane administered by the machine is observed, reaching 6% at the beginning of the procedure and remaining at this level for approximately 60 minutes, before being abruptly reduced to zero. Measurements at point C show high initial desflurane concentrations, exceeding 2.5 ppm in the first 12 minutes of the surgery, but gradually decreasing and stabilizing below 2 ppm for the remainder of the procedure. In contrast, at point E, desflurane concentrations consistently remained below 1 ppm throughout the intervention.
In Figure 6(b), related to the quadrantectomy supervised by Anesthetist 2, a gradual increase in the administered desflurane concentration is observed, reaching 8% after 30 minutes. At 50 minutes, the concentration decreased to 6%, remaining at that level until approximately 65 minutes, when the administration was discontinued. Measurements at point C indicate maximum concentrations of up to 1.5 ppm, consistently staying below the 2 ppm during the entire procedure. At point E, desflurane concentrations also remained below 1 ppm.
3.3.2. Long Surgeries
Long-duration surgeries monitored exceeded 3 hours. Anesthetist 1 conducted a conventional cholecystectomy lasting 3.25 hours, while Anesthetist 2 performed a partial gastrectomy lasting 3.65 hours, both utilizing sevoflurane for anaesthesia. Sevoflurane concentrations measured at point D, near the anaesthesia equipment, point E, near the anaesthetist for the cholecystectomy and points C and E for the gastrectomy are depicted in Figure 7 together with the weighted average concentration of sevoflurane administered in both surgeries.
The concentrations of sevoflurane administered by both anaesthetists varied over time between minimums of 0% and maximums of 3%. The weighted average concentration of sevoflurane administered was 1.98% for the procedure by Anaesthetist 1 and 2.16% for Anaesthetist 2.
The evaluation of sevoflurane concentrations during the two long surgeries highlights differences in exposure levels based on the location of the measurements and the amount of anesthetic administered. In Figure 7(a), which corresponds to the conventional cholecystectomy performed by Anesthetist 1, sevoflurane administration starts at around 2.5% and decreases in stages throughout the 3.25-hour procedure, eventually reaching 1%. At point D, near the anesthesia equipment, there were two peaks above 2 ppm, one at the beginning and another at the end of the surgery, while for the rest of the time, the concentrations fluctuated but always remained below the 2 ppm. At point E, near the anesthetist, sevoflurane levels remained lower, consistently below 0.5 ppm throughout the operation.
For the partial gastrectomy supervised by Anesthetist 2, shown in Figure 7(b), the concentration of sevoflurane started at about 0.6% and increased to around 2.5% after the first hour. Around 96 minutes, it rose to 3%, remaining at that level until approximately 192 minutes into the 3.65-hour surgery. In the medical team area, the measurements at point C showed relatively stable concentrations, generally below 0.75 ppm. At point E, near the anesthetist, sevoflurane levels were generally lower than 0.5 ppm throughout the surgery, but there was a peak above 2 ppm around 96 minutes.
3.4. Correlations between Anesthetic Gas Levels and Environmental Factors
The correlation matrices presented in Figure 8 illustrate the relationships between the concentrations of the anesthetic gases desflurane and sevoflurane and environmental factors in the indoor air of the General Surgery Room (GSR) and Recovery Room (RR). The correlation matrix in Figure 8(a) and Figure 8(b) evaluates the relationship between desflurane and sevoflurane concentrations, respectively, and environmental factors in the GSR. These factors include temperature (T), relative humidity (RH), carbon dioxide levels (CO₂), waste anesthetic gases (WAGs), surgery time (t), the number of people present in the room (N), and the weighted average concentration of gas delivered to the patient (WA).
It can be observed that, for both matrices, the longer the surgery time (t), the higher the average concentration of gas provided in the patient's anesthesia circuit (WA). This correlation had a coefficient of 0.65 for desflurane and 0.77 for sevoflurane in the SCG. There was also a strong positive correlation between the average concentration of sevoflurane residues in the GSR and the average concentration provided to the patient, with a correlation coefficient of 0.73. Regarding desflurane in the SCG, the correlation coefficient between the concentration of the gas provided to the patient and the average levels of desflurane was relatively low (0.37). In fact, it was found that regardless of the concentration provided to the patient, levels of desflurane in the indoor air of the SCG were above 2 ppm, whereas with sevoflurane, higher concentrations are associated with more concentrated gas flows inhaled by the patient.
Another evident aspect is the strong correlation between the concentration of anesthetic gas provided in the anesthesia circuit and the averages of the anesthetic gas residues on RR for both gases (Figure 8(c) and Figure 8(d)). The coefficient of this correlation was 0.81 for desflurane and 0.49 for sevoflurane. In other words, higher concentration of gas provided to the patient were significantly linked to increased average airborne concentrations of desflurane and sevoflurane in the RR.
CO2 levels were directly related to the number of people in the SCG for measurements with desflurane and in the RR for measurements with sevoflurane. This correlation was 0.52 and 0.60, respectively. In fact, as expected, in these two analyses, it was found that the greater the number of people present in the room was associated to higher average concentrations of CO2. In the case of CO2 measurements in the RR with sevoflurane residues, it was also observed that the higher the concentration of gas provided in the anesthesia circuit, the higher the average sevoflurane concentrations found in the recovery room, consequently leading to higher amounts of CO2 being exhaled in this environment.
4. Discussion
Findings from the temperature assessments in the operating unit indicate that areas served by the HVAC system, exhibit more effective control of thermal comfort conditions compared to other spaces. These findings are consistent with those obtained in the study conducted by Khankari (2018) [26], which demonstrated that the HVAC system has a significant impact on airflow patterns, temperature distribution, and the path of airborne contaminants in operating rooms. For the period of study, indoor temperatures exceeding official recommendations were also obtained, particularly in the EC area. Although this situation is relative to a corridor, results underscore the importance of monitoring and managing temperature in surgical environment to ensure both patient safety and the well-being of the professionals. For instance, the effects of elevated temperatures on professional performance were discussed by Palejwala et al. (2023) [27], who observed a correlation between temperatures outside the recommended range and reduced operational efficiency.
Relative humidity values below the recommended range limits were found in all operating room facilities. This is concerning, especially in the GSR, as according to findings reported by Guarnieri et al. (2023), relative humidity conditions below 40% can have significant impacts on health, including facilitating the transmission of infections and exacerbating respiratory diseases [28]. Additionally, the analysis of thermal comfort in the operating room, classified as D, indicates that these conditions may interfere with worker performance, leading to the contraction or worsening of respiratory diseases in exposed individuals [30]. Also, in line with other authors including Thongkhome et al. (2019) [29], findings from this work reinforce the importance of automated and efficient relative humidity control to maintain a safe, comfortable and productive environment.
Regarding CO2 levels, the results obtained in this study are consistent with the observations of Ha et al. (2021), who also reported concentrations of CO2 below regulatory limits in well-ventilated hospital environments [31]. Similarly, Wilson et al. (2024) found variations in CO2 levels depending on activity and occupancy [32]. The low CO2 levels combined to the observed reduced variability in anesthetic gas concentrations during non-surgical periods suggest the effectiveness of the ventilation system in diluting indoor generated pollutants. Studies including the one conducted by Fogagnolo et al. (2021) indicate that during surgeries, adequate ventilation is crucial for keeping anesthetic gas levels within acceptable limits, and thereby for preventing excessive exposure of healthcare professionals to WAGs [33].
The results of the WAGs measurements showed that the concentrations of desflurane and sevoflurane in different areas of the operating room varied significantly during surgeries. In the CE and TZ, the concentrations were consistently below 2 ppm for both gases, with average values within NIOSH recommendations. However, in the SCG, the average values of desflurane occasionally exceeded 2 ppm, indicating a putative risk for adverse situations. In the RR, the average concentrations of desflurane and sevoflurane were 3.13 ppm and 2.06 ppm, respectively, suggesting that the ventilation in this room may be insufficient to mitigate emissions from the exhalation of anesthetic gases during anesthesia.
Additionally, it was observed that the most critical situations tend to occur more frequently in areas close to the anesthesiologist and near the patient’s exhalation area, likely due to possible leaks in the anesthesia system and even after removing the patient’s tubing. In fact, Norton et al. (2020) corroborates that improper procedures or leaks can result in spikes in anesthetic gas concentrations, increasing the risk of exposure for healthcare professionals [34].The analysis of measurements in the SCG revealed significant variation in desflurane concentrations, especially when the exhaust system was turned off. This can happen, especially if there are failures in the anesthetic gas absorption or recirculation system. In closed or quasi-closed anesthetic systems, gas recirculation relies on a careful balance between oxygen administration and carbon dioxide absorption, with little or no ventilation to the outside. If the system is not perfectly adjusted or if there are leaks, anesthetic gases exhaled by the patient can accumulate in the environment. Additionally, as the patient continues to exhale a small amount of residual anesthetic gases, even in a closed system, there is always some risk of these gases being released into the environment, particularly during interventions such as adjusting the mask or tubes. If room ventilation or waste control systems are inadequate or deficient, this can result in exposure to higher concentrations of anesthetic gases in the indoor atmosphere. These results underscore the critical importance of keeping exhaust systems operational during surgeries.
In short-duration surgical procedures, during laparoscopic surgery (Figure 7a), point C, located in the medical team area, showed initial concentrations exceeding 2.5 ppm, surpassing the NIOSH safety limit of 2 ppm. This increase may be attributed to the proximity to the patient, where exhaled gas or gas not captured by the ventilation system can temporarily accumulate. At point E, near the anesthetist, levels remained below 1 ppm, possibly due to the efficient use of exhaust systems that better control gas dispersion in that area. In the quadrantectomy (Figure 7b), both point C and point E consistently remained below the limit, suggesting that the control of desflurane administration was more efficient, possibly due to improvements in air circulation or adjustments to the ventilation system.
In long procedures (conventional cholecystectomy and partial gastrectomy), peaks of sevoflurane at point D (near the anesthesia equipment) may be caused by momentary gas emissions, particularly during the initiation and termination of administration, when the exhaust system may be less efficient. Although these peaks above 2 ppm were short-lived, they indicate a potential need to improve ventilation around the equipment. At point E, near the anesthetist, concentrations remained well below 0.5 ppm, except for a peak of 2 ppm during the gastrectomy (Figure 8b), which may have occurred during anesthesia machine adjustments or room ventilation changes. This suggests that exposure is generally controlled, but momentary variations related to anesthesia handling or airflow dynamics can occur.
Finally, the multiple correlation matrix corroborated the following findings: i) surgery duration: longer durations are consistently associated with higher concentrations of both anesthetic gases, possibly due to the increased period during which the “pollution source” remains actively emitting, as well as to a time-dependent accumulation effect; ii) Number of people: a higher number of occupants in the surgical environment naturally increase the concentrations of anesthetic gases and CO2; iii) CO2 levels: may serve as an indirect indicator of ventilation effectiveness and accumulation of anesthetic gases.
5. Conclusions
The study allowed to conclude that there is significant exposure to WAGs in the breathing areas of patients and healthcare professionals, particularly after the removal of the endotracheal tube. Higher concentrations were observed at specific points, suggesting the need for improvements in ventilation systems and operational practices. The implementation of effective control measures is essential to minimize occupational risks and protect worker health. The findings also highlight the need for particular attention to long-term surgeries, during which adequate comfort and ventilation/extraction conditions are pivotal for promoting health, well-being, and optimal performance in surgical settings. Overall, this study provides valuable data for developing more stringent safety policies in the hospital environment.
Author Contributions
Conceptualisation, M.F. and E.P.; methodology, M.F., E.P. and V.Y.; validation, M.F., E.P., J.T. and M.G. and M.F.D; formal analysis, V.Y., L.L.; investigation, M.F., E.P. and V.Y.; resources, M.F.; data curation, M.F., E.P., M.G.; writing—original draft preparation, L.L. V.Y.; writing—review and editing, M.F., E.P., M.G. and J.T.; supervision M.F., E.P. and J.T.; funding acquisition, M.F.; project administration: M.F. and E.P.. All authors have read and agreed to the published version of the manuscript.
Funding
This work was supported by Portuguese national funds through FCT/MCTES (PIDDAC): CIMO, UIDB/00690/2020 (DOI: 10.54499/UIDB/00690/2020) and UIDP/00690/2020 (DOI: 10.54499/UIDP/00690/2020); and SusTEC, LA/P/0007/2020 (DOI: 10.54499/LA/P/0007/2020). .
Data Availability Statement
The raw data supporting the conclusions of this article will be made available by the authors on request.
Acknowledgments
The authors express their gratitude to the Local Health Unit of Northeast, particularly its Director, and to all the staff of the Hospital Unit (technicians, nurses, doctors) who contributed to this study.
Conflicts of Interest
The authors declare no conflicts of interest.
References
- D.F. Johnston, L.R. Turbitt, Defining success in regional anaesthesia, Anaesthesia 76 (2021) 40–52. [CrossRef]
- Muir, A., & Hart, R. (2023) 412-415. Non-operating room anaesthesia: general considerations. In Anaesthesia and intensive care medicine.
- M. Keller, A. Cattaneo, A. Spinazzè, L. Carrozzo, D. Campagnolo, S. Rovelli, F. Borghi, G. Fanti, S. Fustinoni, M. Carrieri, A. Moretto, D.M. Cavallo. Occupational Exposure to Halogenated Anaesthetic Gases in Hospitals: A Systematic Review of Methods and Techniques to Assess Air Concentration Levels. Int. J. Environ. Res. Public Health 2023, 20, 514. [CrossRef]
- E.D. Wieruszewski, M. ElSaban, P.M. Wieruszewski, N.J. Smischney, Inhaled volatile anesthetics in the intensive care unit, World J Crit Care Med 13 (2023). [CrossRef]
- M.C. Kapoor, M. Vakamudi, Desflurane-Revisited, J Anaesthesiol Clin Pharmacol 28 (2012) 92–100. [CrossRef]
- M.A.P. Silva, D.B.S. Figueiredo, J.R. Lara, E.E. Paschoalinotte, L.G. Braz, M.G. Braz, Evaluation of genetic instability, oxidative stress, and metabolism-related gene polymorphisms in workers exposed to waste anesthetic gases, Environmental Science and Pollution Research 30 (2023) 9609–9623. [CrossRef]
- S. Varughese, R. Ahmed, Environmental and Occupational Considerations of Anesthesia: A Narrative Review and Update, Anesth Analg 133 (2021) 826–835. [CrossRef]
- Office of Research Services NIH, Waste Anesthetic Gas, 2024.
- A.M. Emara, K.A. Alrasheedi, M.A. Aldubayan, A.H. Alhowail, R.M. Elgarabawy, Effect of inhaled waste anaesthetic gas on blood and liver parameters among hospital staff, Hum Exp Toxicol 39 (2020) 1585–1595. [CrossRef]
- M.I. Lestari, K. Murti, I.A. Liberty, Z. Hafy, V. Linardi, M. Khoirudin, T.P. Umar, Waste anesthetic gases have a significant association with deoxyribonucleic acid (DNA) damage: A systematic review and meta-analysis of 2,732 participants, Heliyon 9 (2023). [CrossRef]
- K.A. AL-Rasheedi, A.A. Alqasoumi, A.M. Emara, Effect of inhaled anaesthetics gases on cytokines and oxidative stress alterations for the staff health status in hospitals, Int Arch Occup Environ Health 94 (2021) 1953–1962. [CrossRef]
- J. McGlothlin, S. Caler, P. Lilley, M. Rosales, E. Card, D. Krenzischek, L. Wilson, Recognition, Evaluation and Control of Waste Anesthetic Gases in the Post-Anesthesia Care Unit White Paper, 2021.
- M. Gaya da Costa, A.F. Kalmar, M.M.R.F. Struys, Inhaled anesthetics: Environmental role, occupational risk, and clinical use, J Clin Med 10 (2021) 1–23. [CrossRef]
- C. Colosio, S. Mandic-Rajcevic, L. Godderis, G. van der Laan, C. Hulshof, F. van Dijk, Workers’ health surveillance: Implementation of the Directive 89/391/EEC in Europe, Occup Med (Chic Ill) 67 (2017) 574–578. [CrossRef]
- M.G. Braz, L.I.M. Carvalho, C.Y.O. Chen, J.B. Blumberg, K.M. Souza, N.M. Arruda, D.A.A. Filho, L.O. Resende, R.T.B.G. Faria, C. d. A. Canário, L.R. de Carvalho, C.R. Corrêa, J.R.C. Braz, L.G. Braz, High concentrations of waste anesthetic gases induce genetic damage and inflammation in physicians exposed for three years: A cross-sectional study, Indoor Air 30 (2020) 512–520. [CrossRef]
- F. Amiri, M. Neghab, F.K. Shouroki, S. Yousefinejad, J. Hassanzadeh, Early, subclinical hematological changes associated with occupational exposure to high levels of nitrous oxide, Toxics 6 (2018). [CrossRef]
- P. Sárkány, B. Tankó, É. Simon, J. Gál, B. Fülesdi, C. Molnár, Does standing or sitting position of the anesthesiologist in the operating theatre influence sevoflurane exposure during craniotomies?, BMC Anesthesiol 16 (2016). [CrossRef]
- K. Kisielinski, S. Hockertz, O. Hirsch, S. Korupp, B. Klosterhalfen, A. Schnepf, G. Dyker, Wearing face masks as a potential source for inhalation and oral uptake of inanimate toxins – A scoping review, Ecotoxicol Environ Saf 275 (2024). [CrossRef]
- A. Jafari, R. Bargeshadi, F. Jafari, I. Mohebbi, M. Hajaghazadeh, Environmental and biological measurements of isoflurane and sevoflurane in operating room personnel, Int Arch Occup Environ Health 91 (2018) 349–359. [CrossRef]
- O. do T. e E. da S. e da S.E. e S.S. de P. Ministérios do Ambiente, Portaria n.o 353-A/2013 de 4 de dezembro, 2013.
- Ministério da Saúde do Governo de Portugal, Especificações Técnicas para Instalações de AVAC – ET 06/2008, 2022.
- B. Givoni, Comfort, climate analysis and building design guidelines, E Nergy Artd Buildings 18 (1992) 11–23.
- K. Khankari, Analysis of Air Change Rates This article was published in ASHRAE Journal, 2018. www.ashrae.org.
- World Health Organization, WHO housing and health guidelines. World Health Organization, 2018.
- American Society for Healthcare Engineering, “Ventilation of Health Care Facilities,” 2020. [Online]. Available: www.ashrae.org.
- K. Khankari, “Analysis of Air Change Rates This article was published in ASHRAE Journal,” 2018. [Online]. Available: www.ashrae.org.
- Z. Palejwala, K.E. Wallman, S. Maloney, G.J. Landers, U.K.H. Ecker, M.W. Fear, F.M. Wood, Higher operating theatre temperature during burn surgery increases physiological heat strain, subjective workload, and fatigue of surgical staff, PLoS One 18 (2023). [CrossRef]
- G. Guarnieri, B. Olivieri, G. Senna, A. Vianello, Relative Humidity and Its Impact on the Immune System and Infections, Int J Mol Sci 24 (2023). [CrossRef]
- P. Thongkhome, S. Veangkum, T. Pattanakarn, Experimental Studies of Automate Temperature and Relative Humidity Control System to Minimize Adverse Health Effects, IJPHS International Journal of Public Health and Health Sciences; IJPHS IJPHS 1 (2019) 1–10. www.tci-thaijo.org/index.php/ijphs.
- R.E. Davis, G.R. McGregor, K.B. Enfield, Humidity: A review and primer on atmospheric moisture and human health, Environ Res 144 (2016) 106–116. [CrossRef]
- W. Ha, T.F. Zabarsky, E.C. Eckstein, H. Alhmidi, A.L. Jencson, J.L. Cadnum, C.J. Donskey, Use of carbon dioxide measurements to assess ventilation in an acute care hospital, Am J Infect Control 50 (2022) 229–232. [CrossRef]
- N.M. Wilson, C. Calabria, A. Warren, A. Finlay, A. O’Donovan, G.L. Passerello, N.L. Ribaric, P. Ward, R. Gillespie, R. Farrel, A.F. McNarry, D. Pan, Quantifying hospital environmental ventilation using carbon dioxide monitoring – a multicentre study, Anaesthesia 79 (2024) 147–155. [CrossRef]
- A. Fogagnolo, F. Montanaro, L. Al-husinat, C. Turrini, M. Rauseo, L. Mirabella, R. Ragazzi, I. Ottaviani, G. Cinnella, C.A. Volta, S. Spadaro, Management of intraoperative mechanical ventilation to prevent postoperative complications after general anesthesia: A narrative review, J Clin Med 10 (2021). [CrossRef]
- P. Norton, P. Pinho, D. Xará, F. Pina, M. Norton, Assessment of anesthetic gases in a central hospital, Porto Biomed J 5 (2020) e076. [CrossRef]
Figure 1.
Illustration of the layout and key areas of the operating room, including the scheduled and emergency surgery rooms, disinfection and recovery rooms, and patient transfer area. The letters A to O in the figure represent the locations where measurements were taken.
Figure 1.
Illustration of the layout and key areas of the operating room, including the scheduled and emergency surgery rooms, disinfection and recovery rooms, and patient transfer area. The letters A to O in the figure represent the locations where measurements were taken.
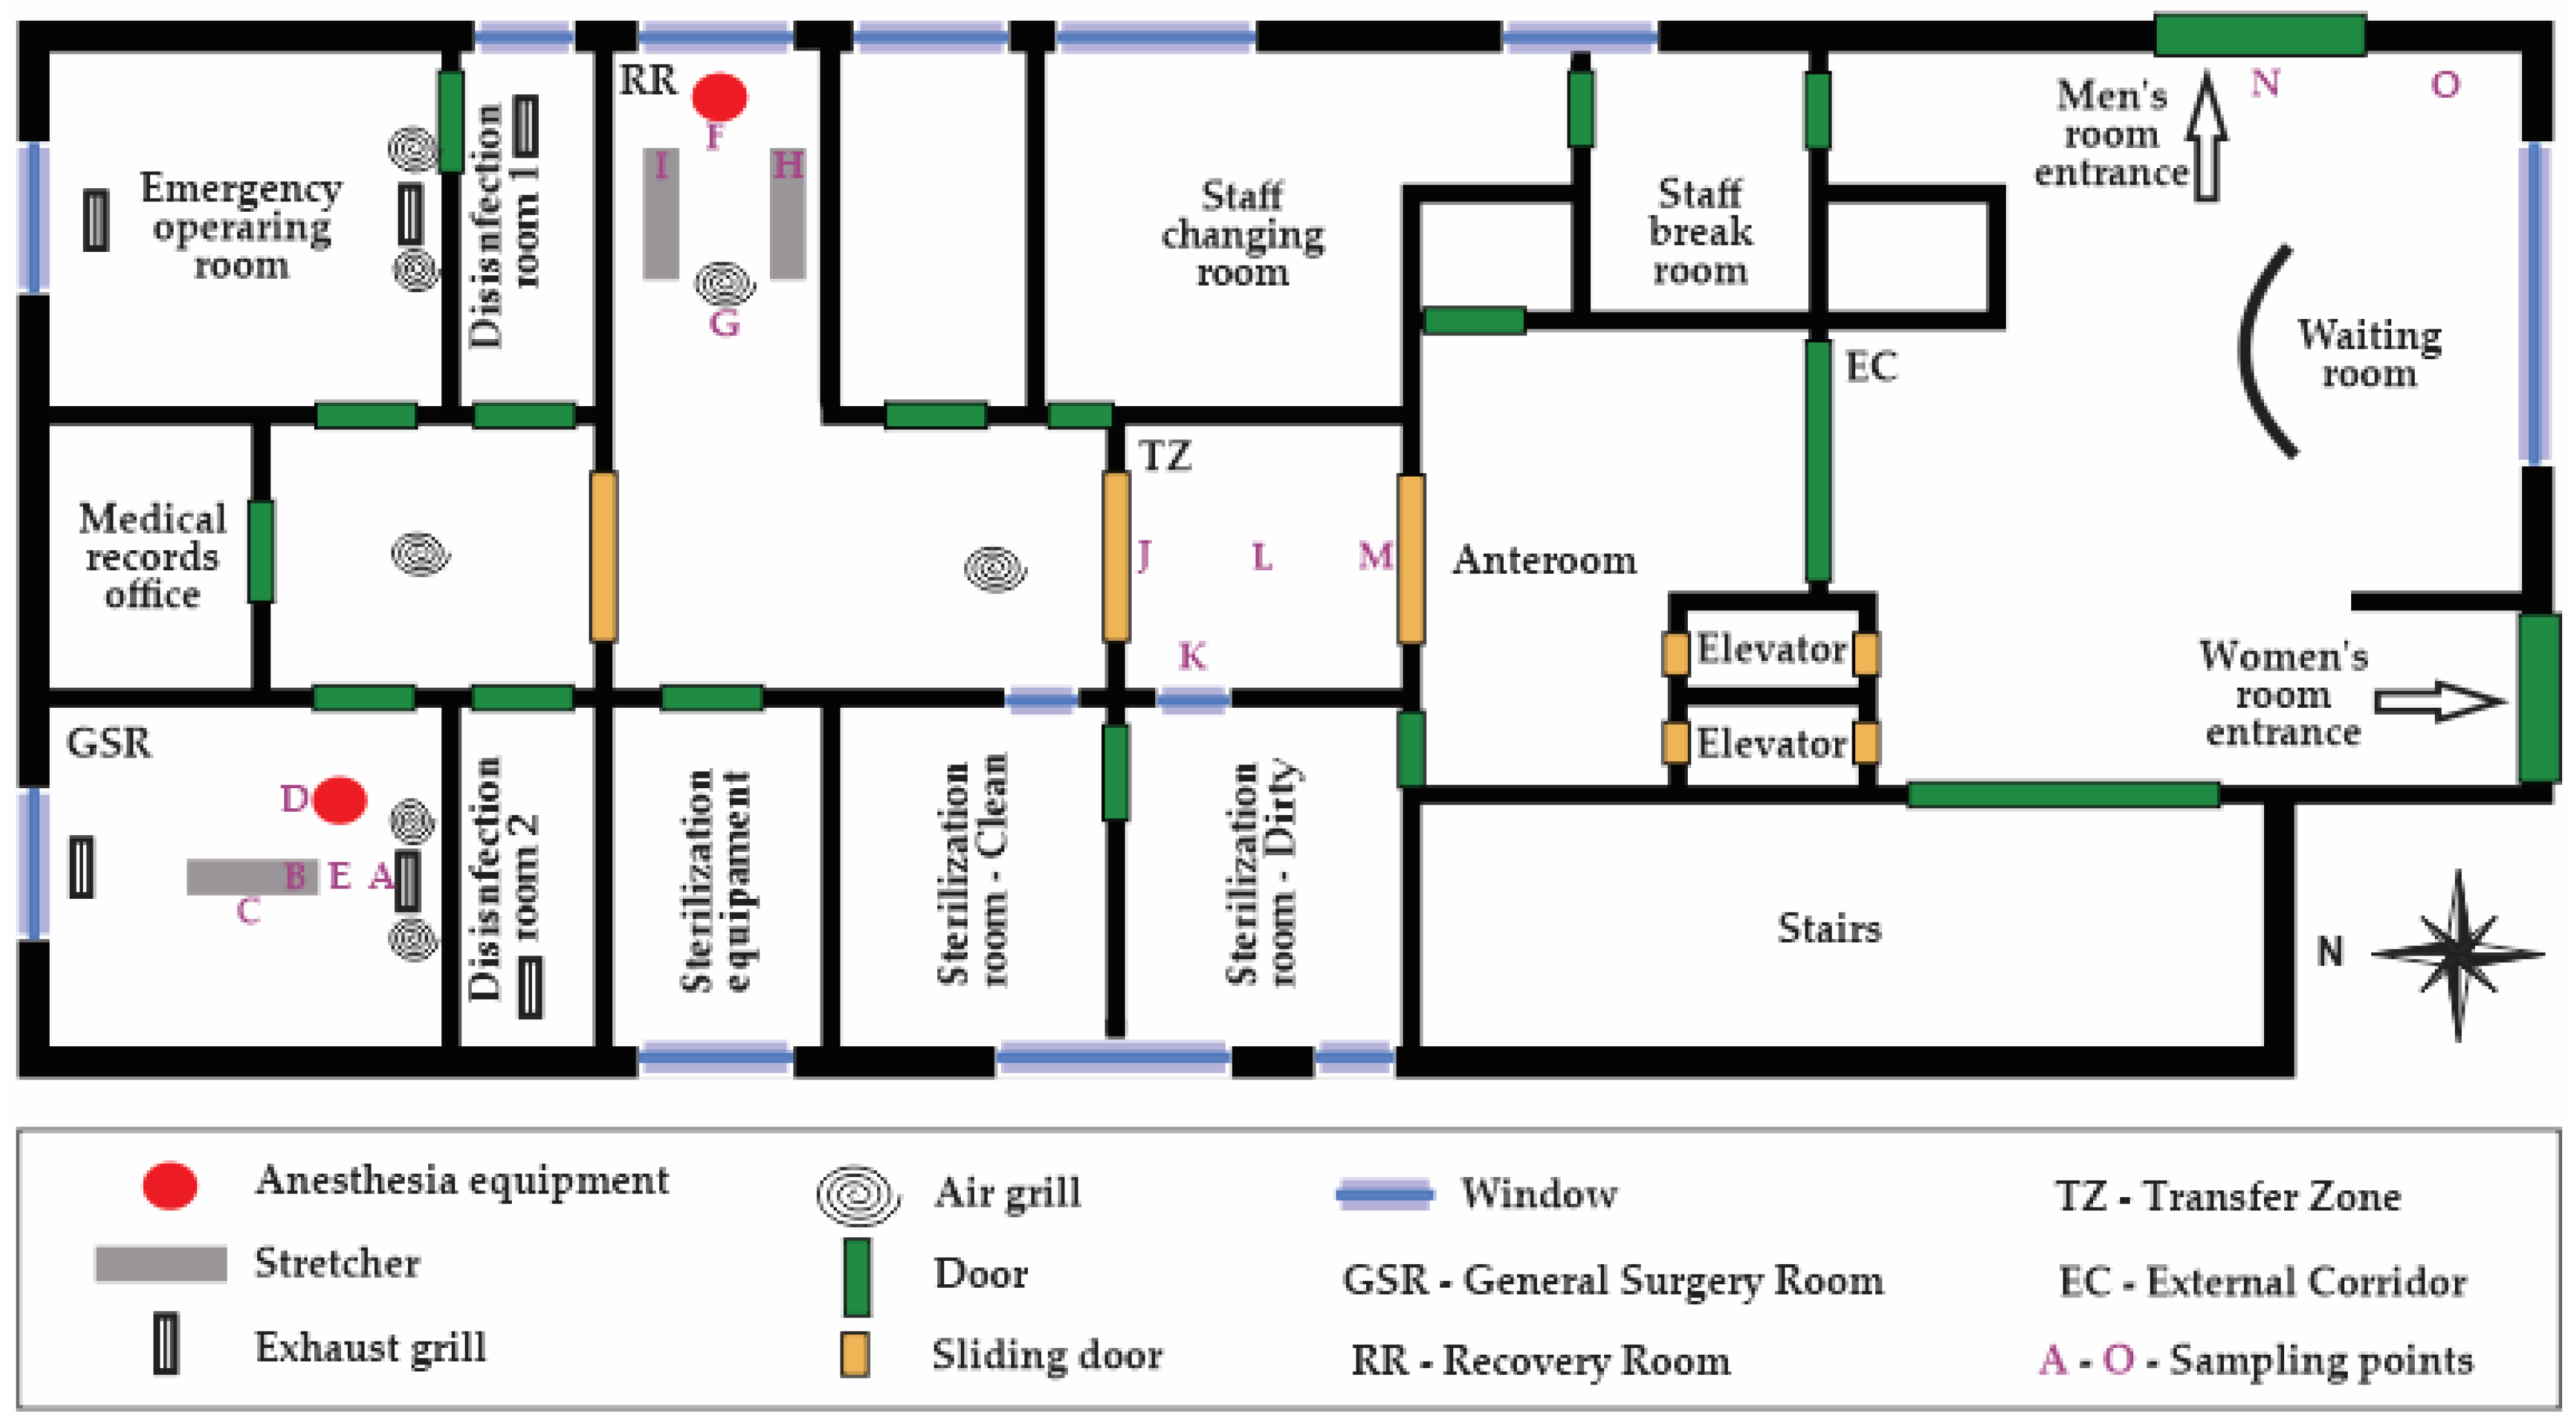
Figure 2.
Boxplots representing the levels measured in the different hospital areas for: (a) Temperature; and (b) Relative Humidity.
Figure 2.
Boxplots representing the levels measured in the different hospital areas for: (a) Temperature; and (b) Relative Humidity.

Figure 3.
Boxplots representing CO2 concentrations assessed in the different hospital areas for periods: (a) Without surgeries; (b) With surgeries.
Figure 3.
Boxplots representing CO2 concentrations assessed in the different hospital areas for periods: (a) Without surgeries; (b) With surgeries.
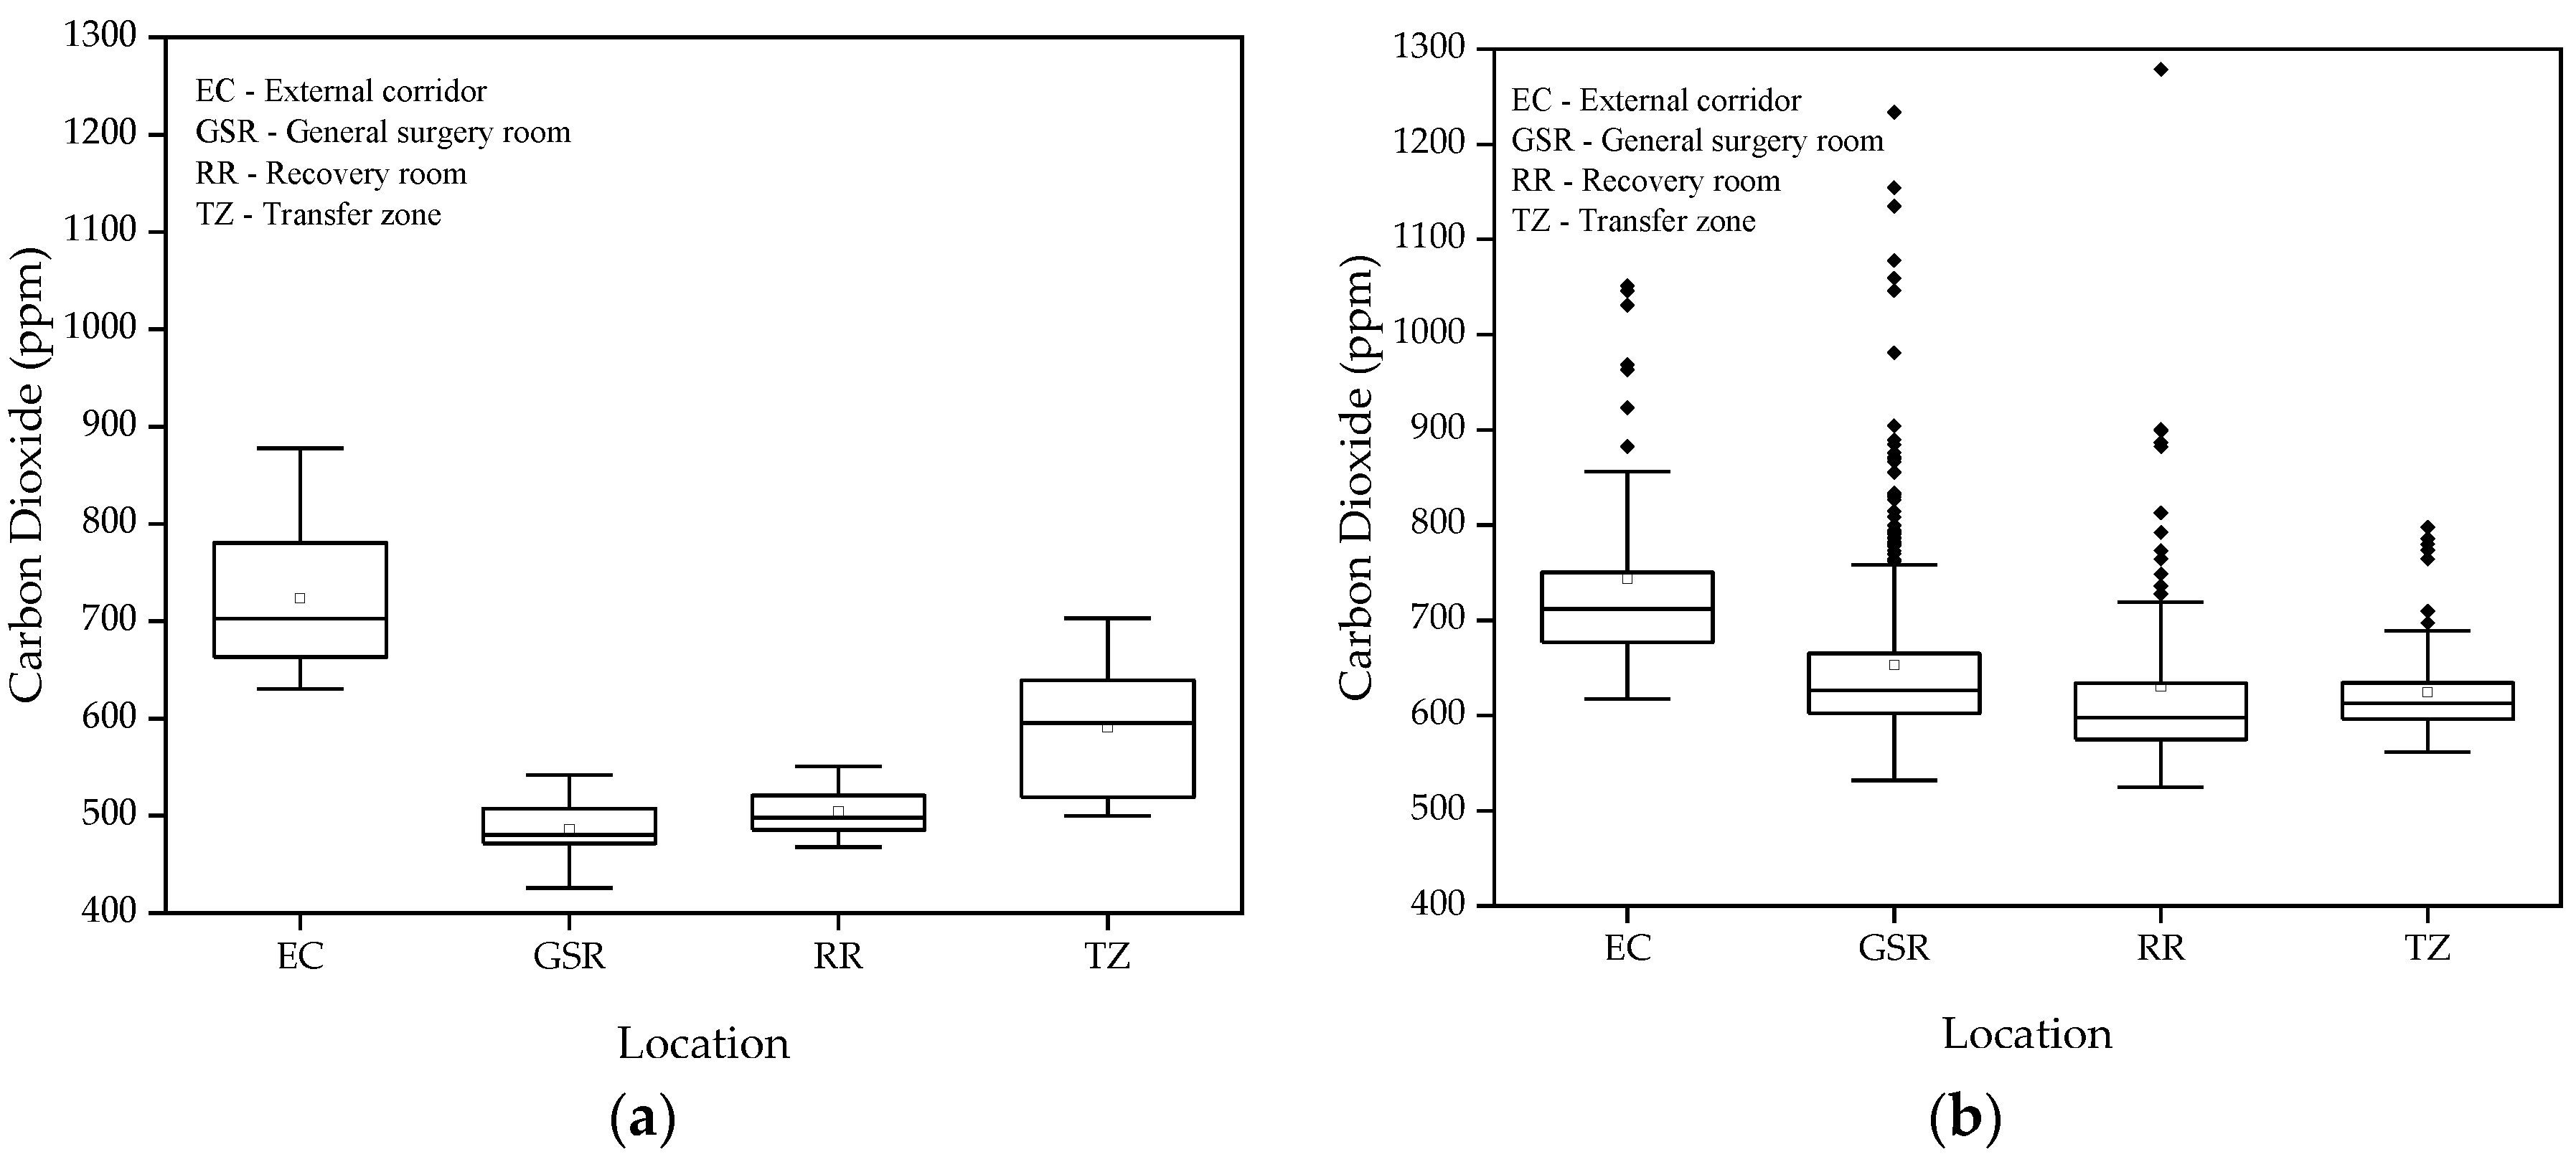
Figure 4.
Boxplot of WAGs concentrations for the different hospital areas without surgery for: (a) Desflurane; (b) Sevoflurane.
Figure 4.
Boxplot of WAGs concentrations for the different hospital areas without surgery for: (a) Desflurane; (b) Sevoflurane.
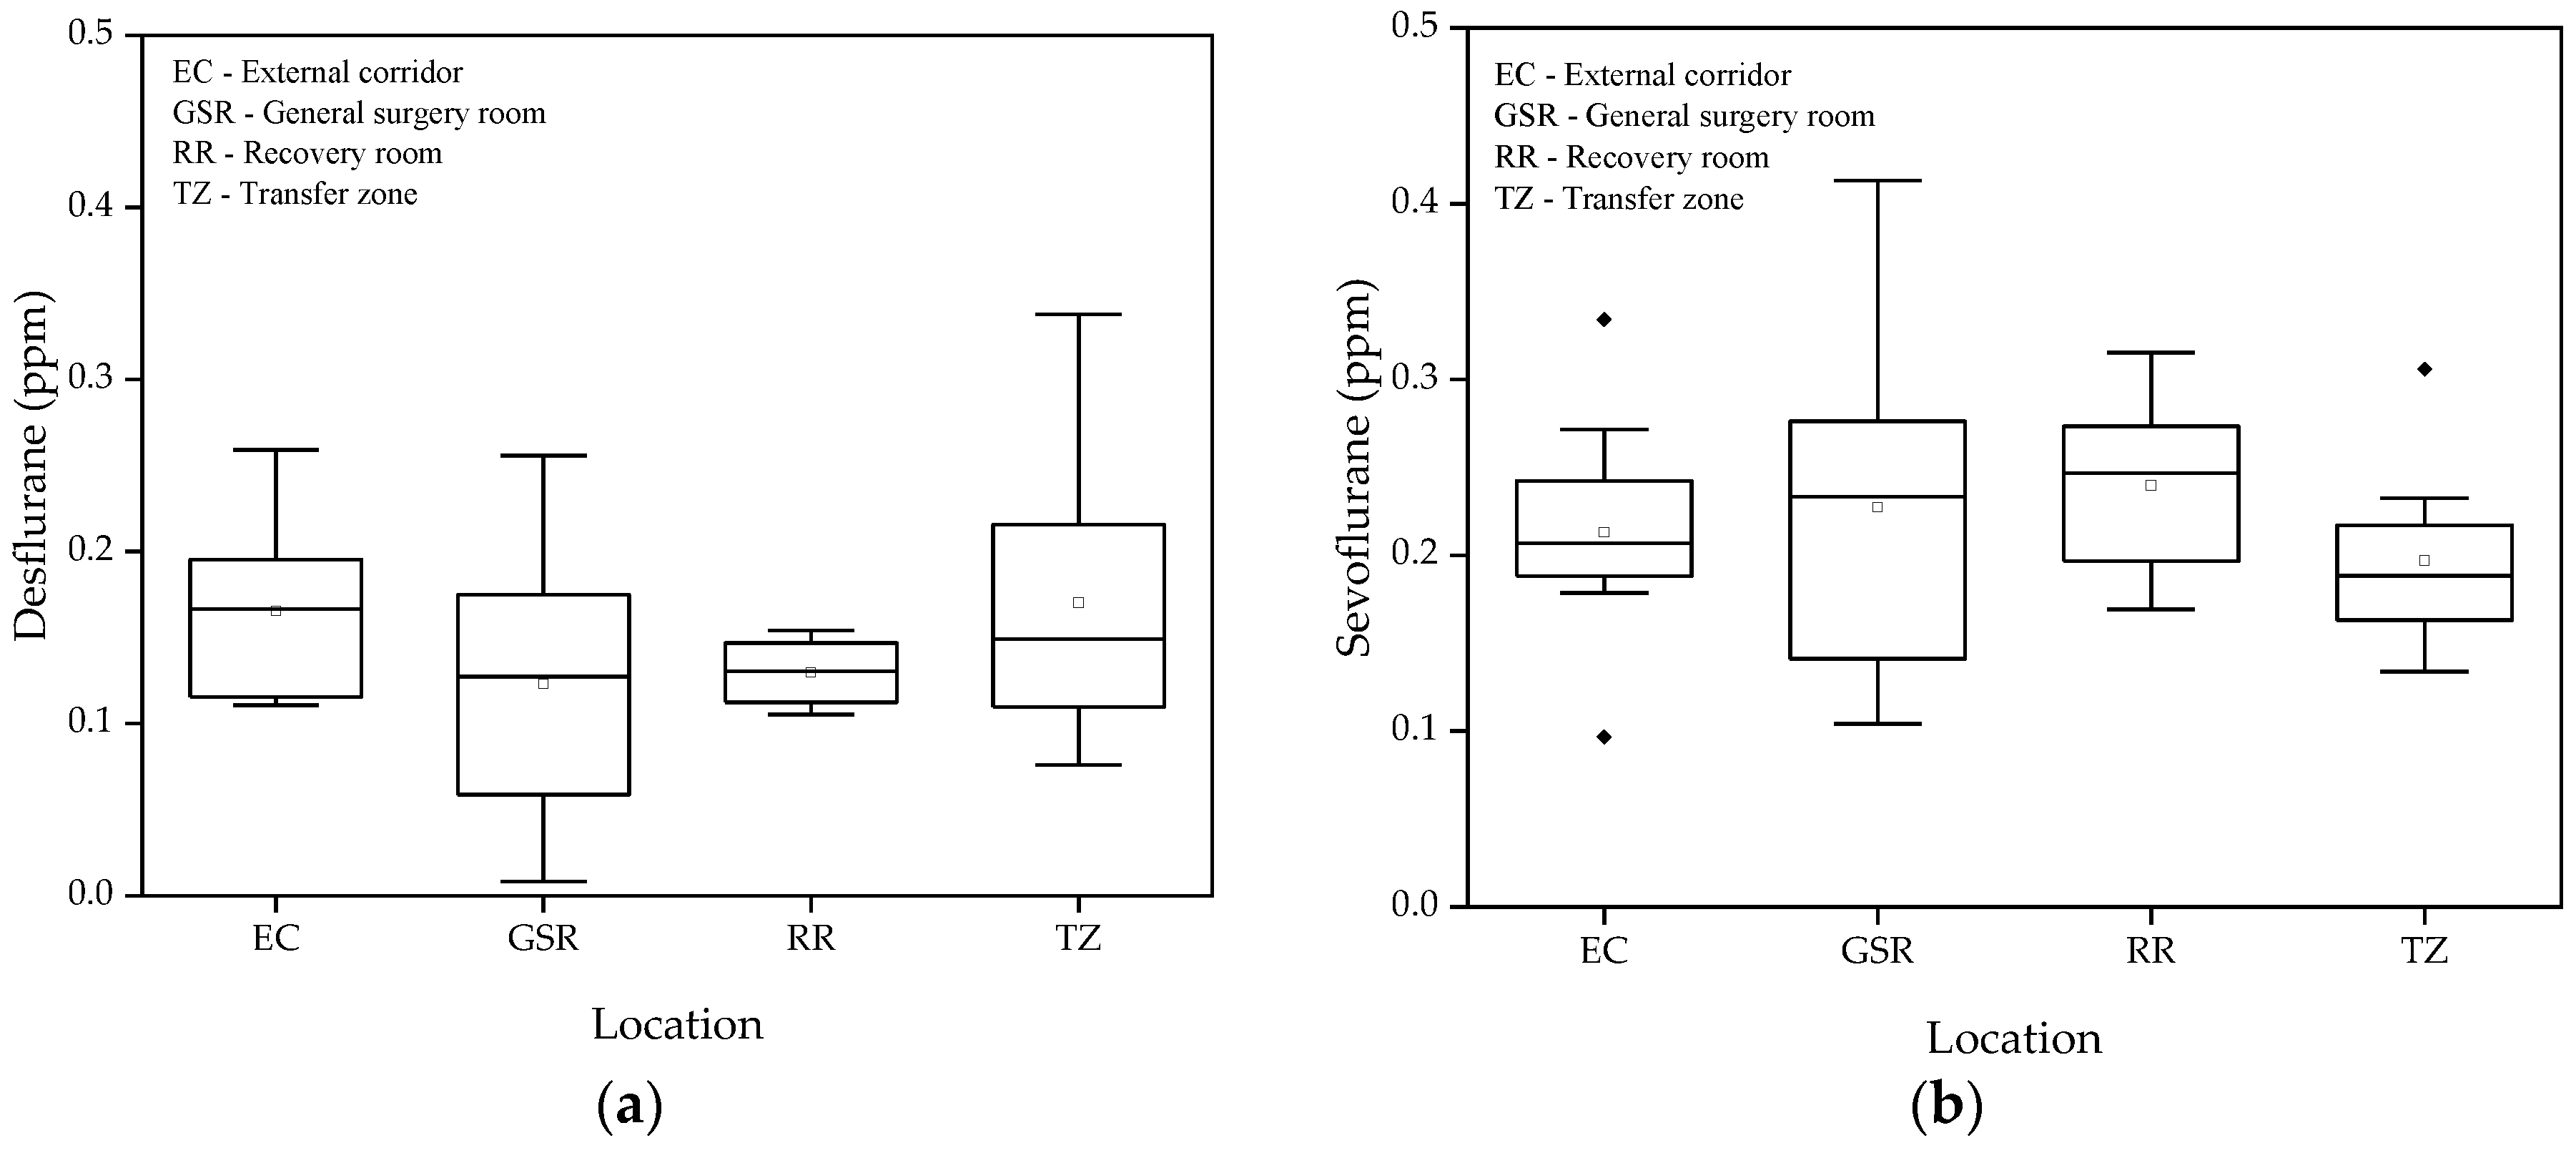
Figure 5.
Spatial variations of WAGs for: (a) Desflurane in the GSR; (b) Sevoflurane in the GSR; (c) Desflurane in the RR; (d) Sevoflurane in the RR; (e) Desflurane in the TZ; (f) Sevoflurane in the TZ; (g) Desflurane in the EC; and (h) Sevoflurane in the EC.
Figure 5.
Spatial variations of WAGs for: (a) Desflurane in the GSR; (b) Sevoflurane in the GSR; (c) Desflurane in the RR; (d) Sevoflurane in the RR; (e) Desflurane in the TZ; (f) Sevoflurane in the TZ; (g) Desflurane in the EC; and (h) Sevoflurane in the EC.
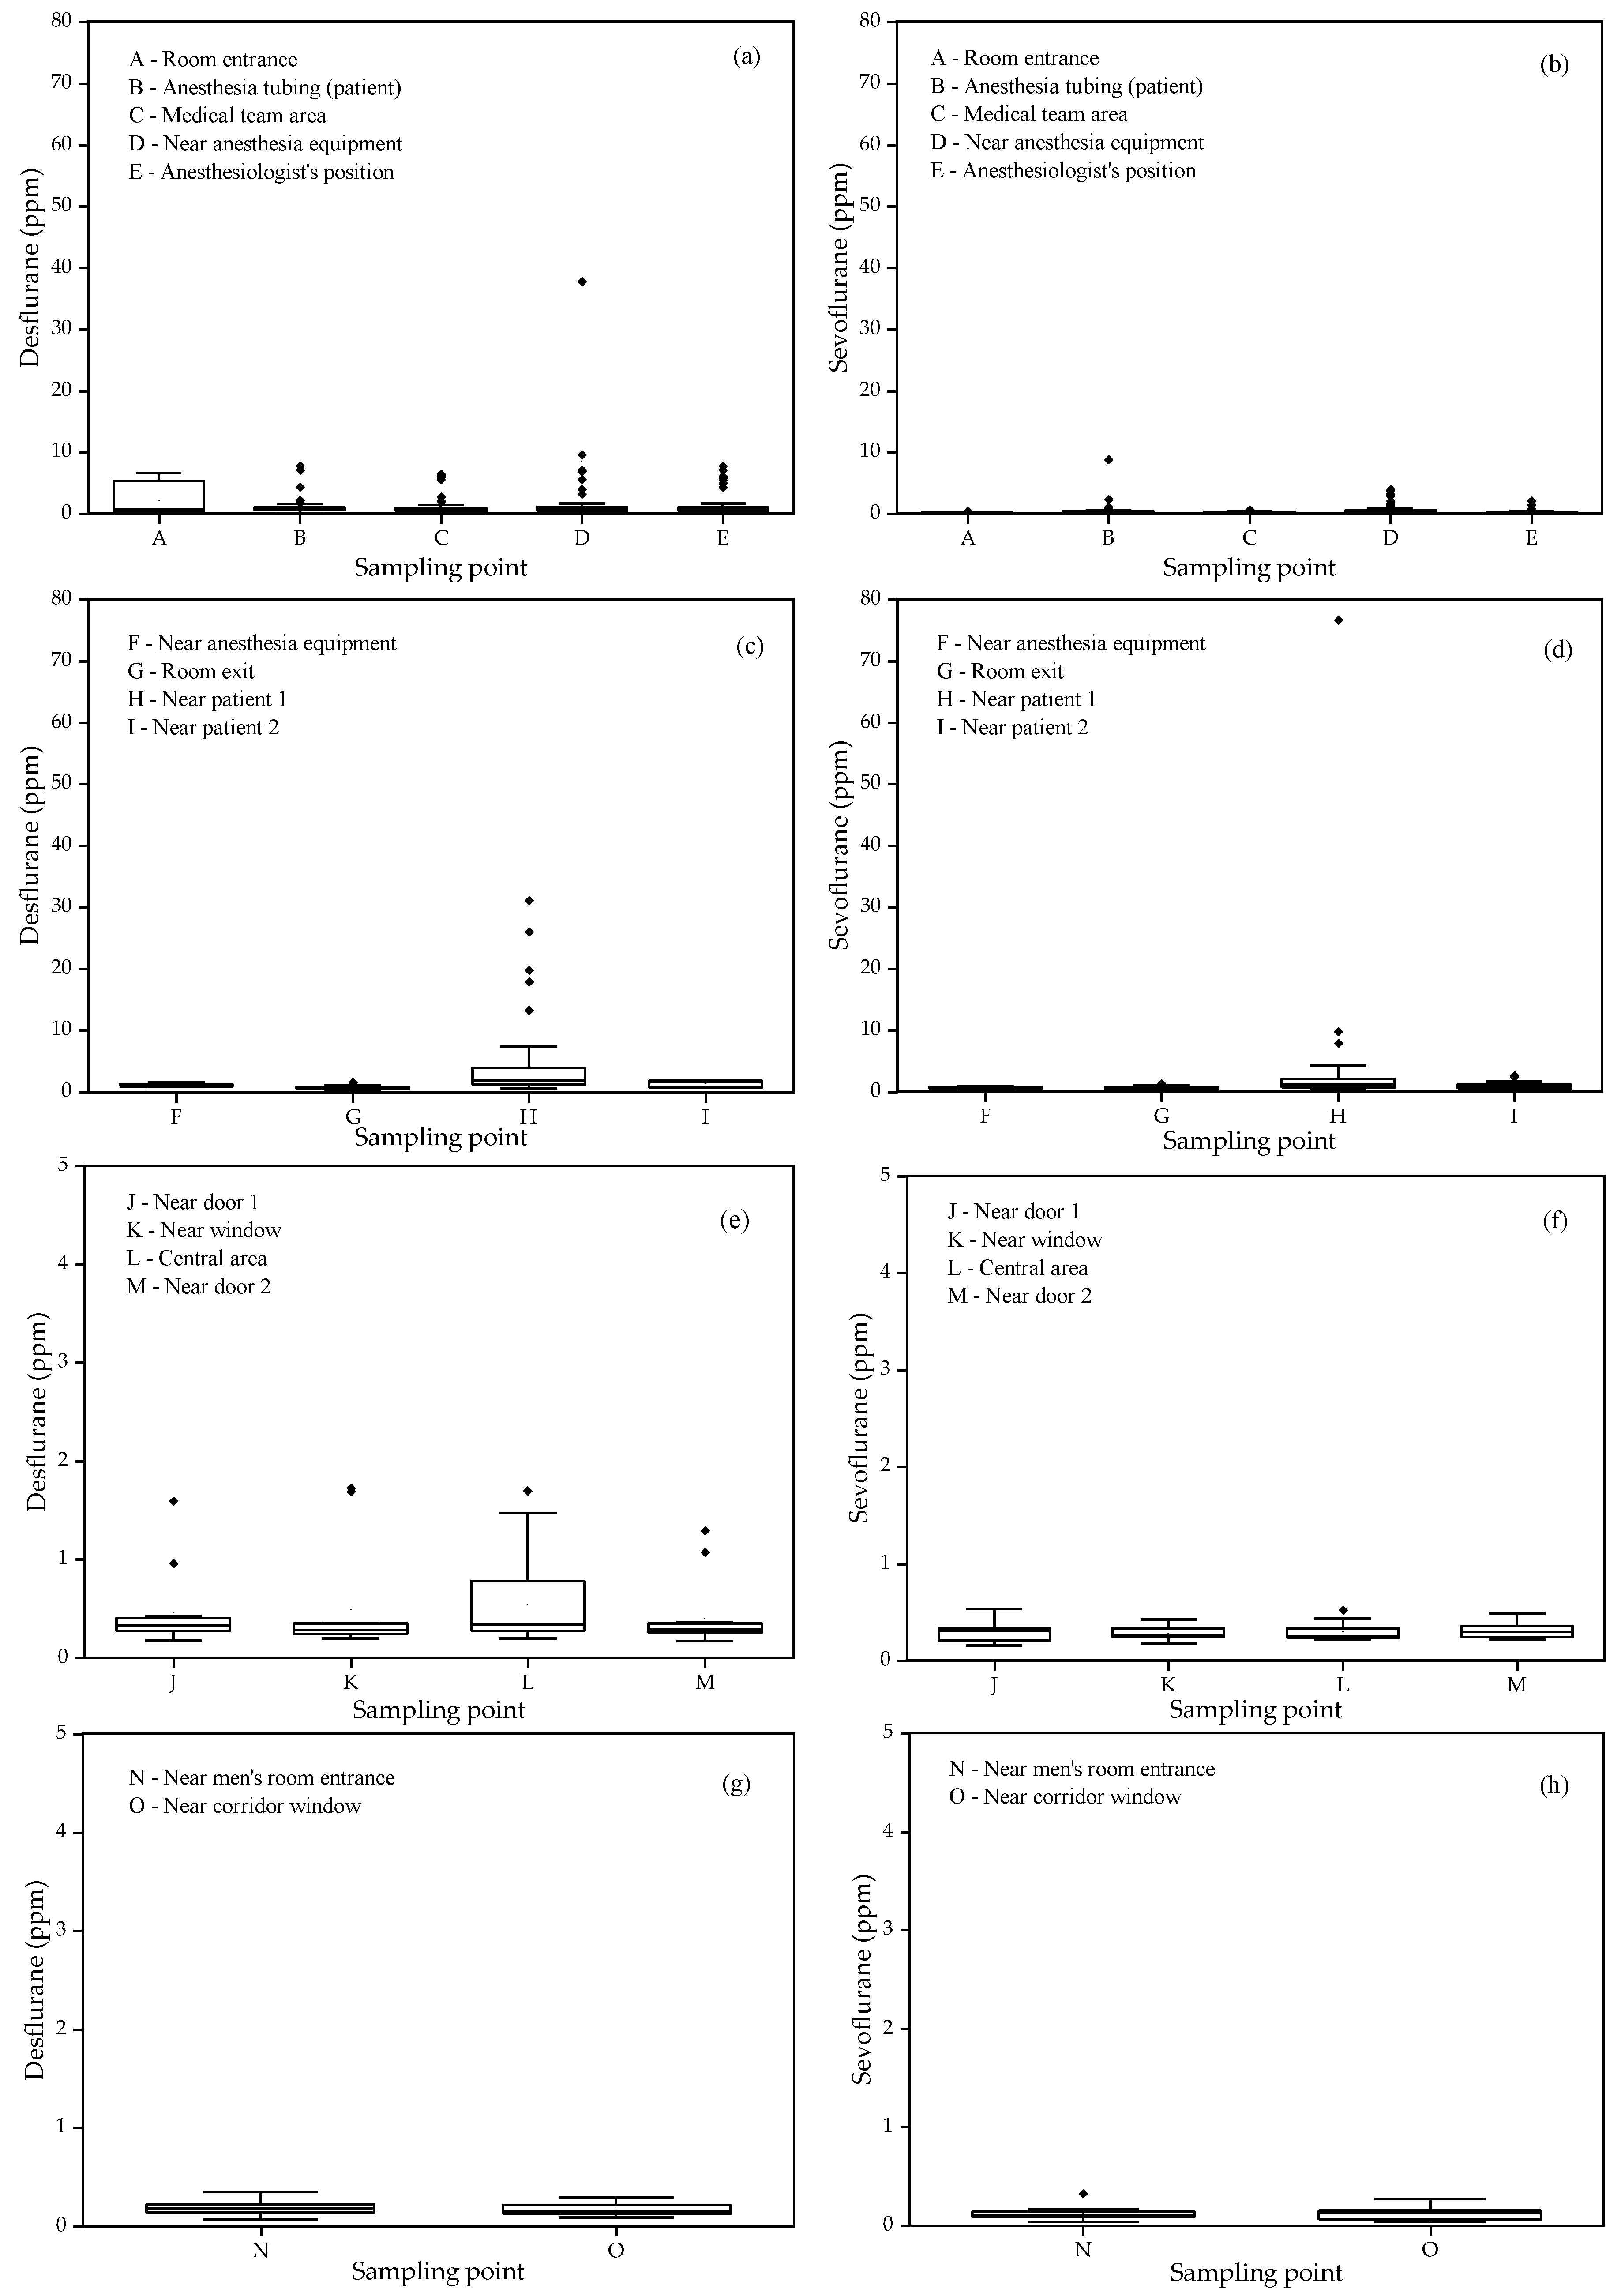
Figure 6.
Desflurane concentrations measured during: (a) laparoscopic cholecystectomy (Anesthetist 1); (b) quadrantectomy (Anesthetist 2), at points C (medical team area) and E (near the anesthetist).
Figure 6.
Desflurane concentrations measured during: (a) laparoscopic cholecystectomy (Anesthetist 1); (b) quadrantectomy (Anesthetist 2), at points C (medical team area) and E (near the anesthetist).
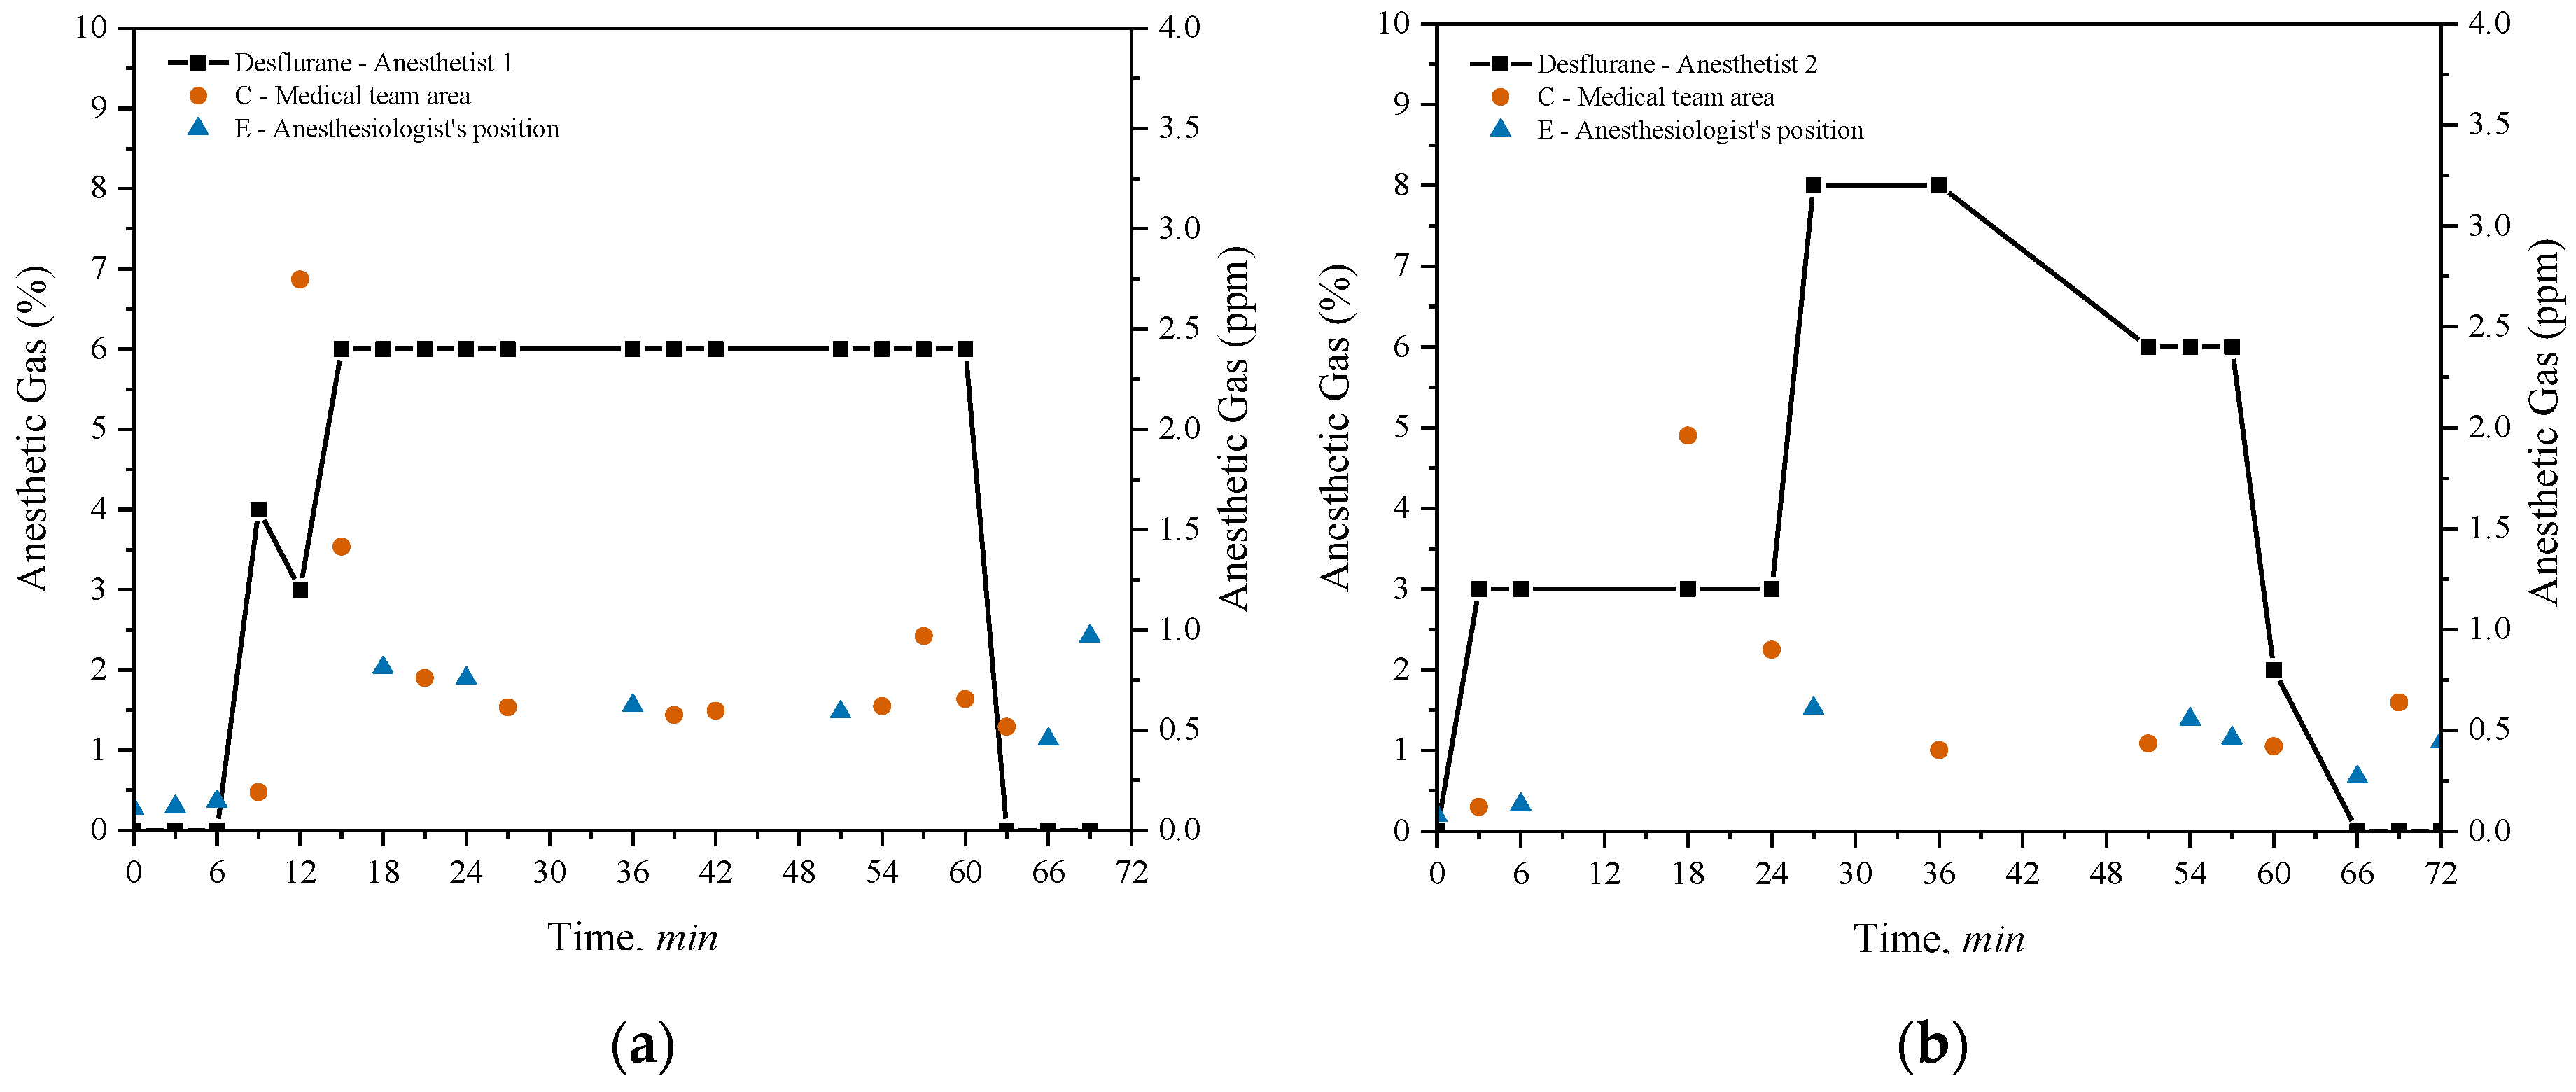
Figure 7.
Sevoflurane concentrations measured during (a) conventional cholecystectomy (Anesthetist 1); (b) partial gastrectomy (Anesthetist 2), at points C (medical team area), D (near the anesthesia equipment), and E (near the anesthetist).
Figure 7.
Sevoflurane concentrations measured during (a) conventional cholecystectomy (Anesthetist 1); (b) partial gastrectomy (Anesthetist 2), at points C (medical team area), D (near the anesthesia equipment), and E (near the anesthetist).
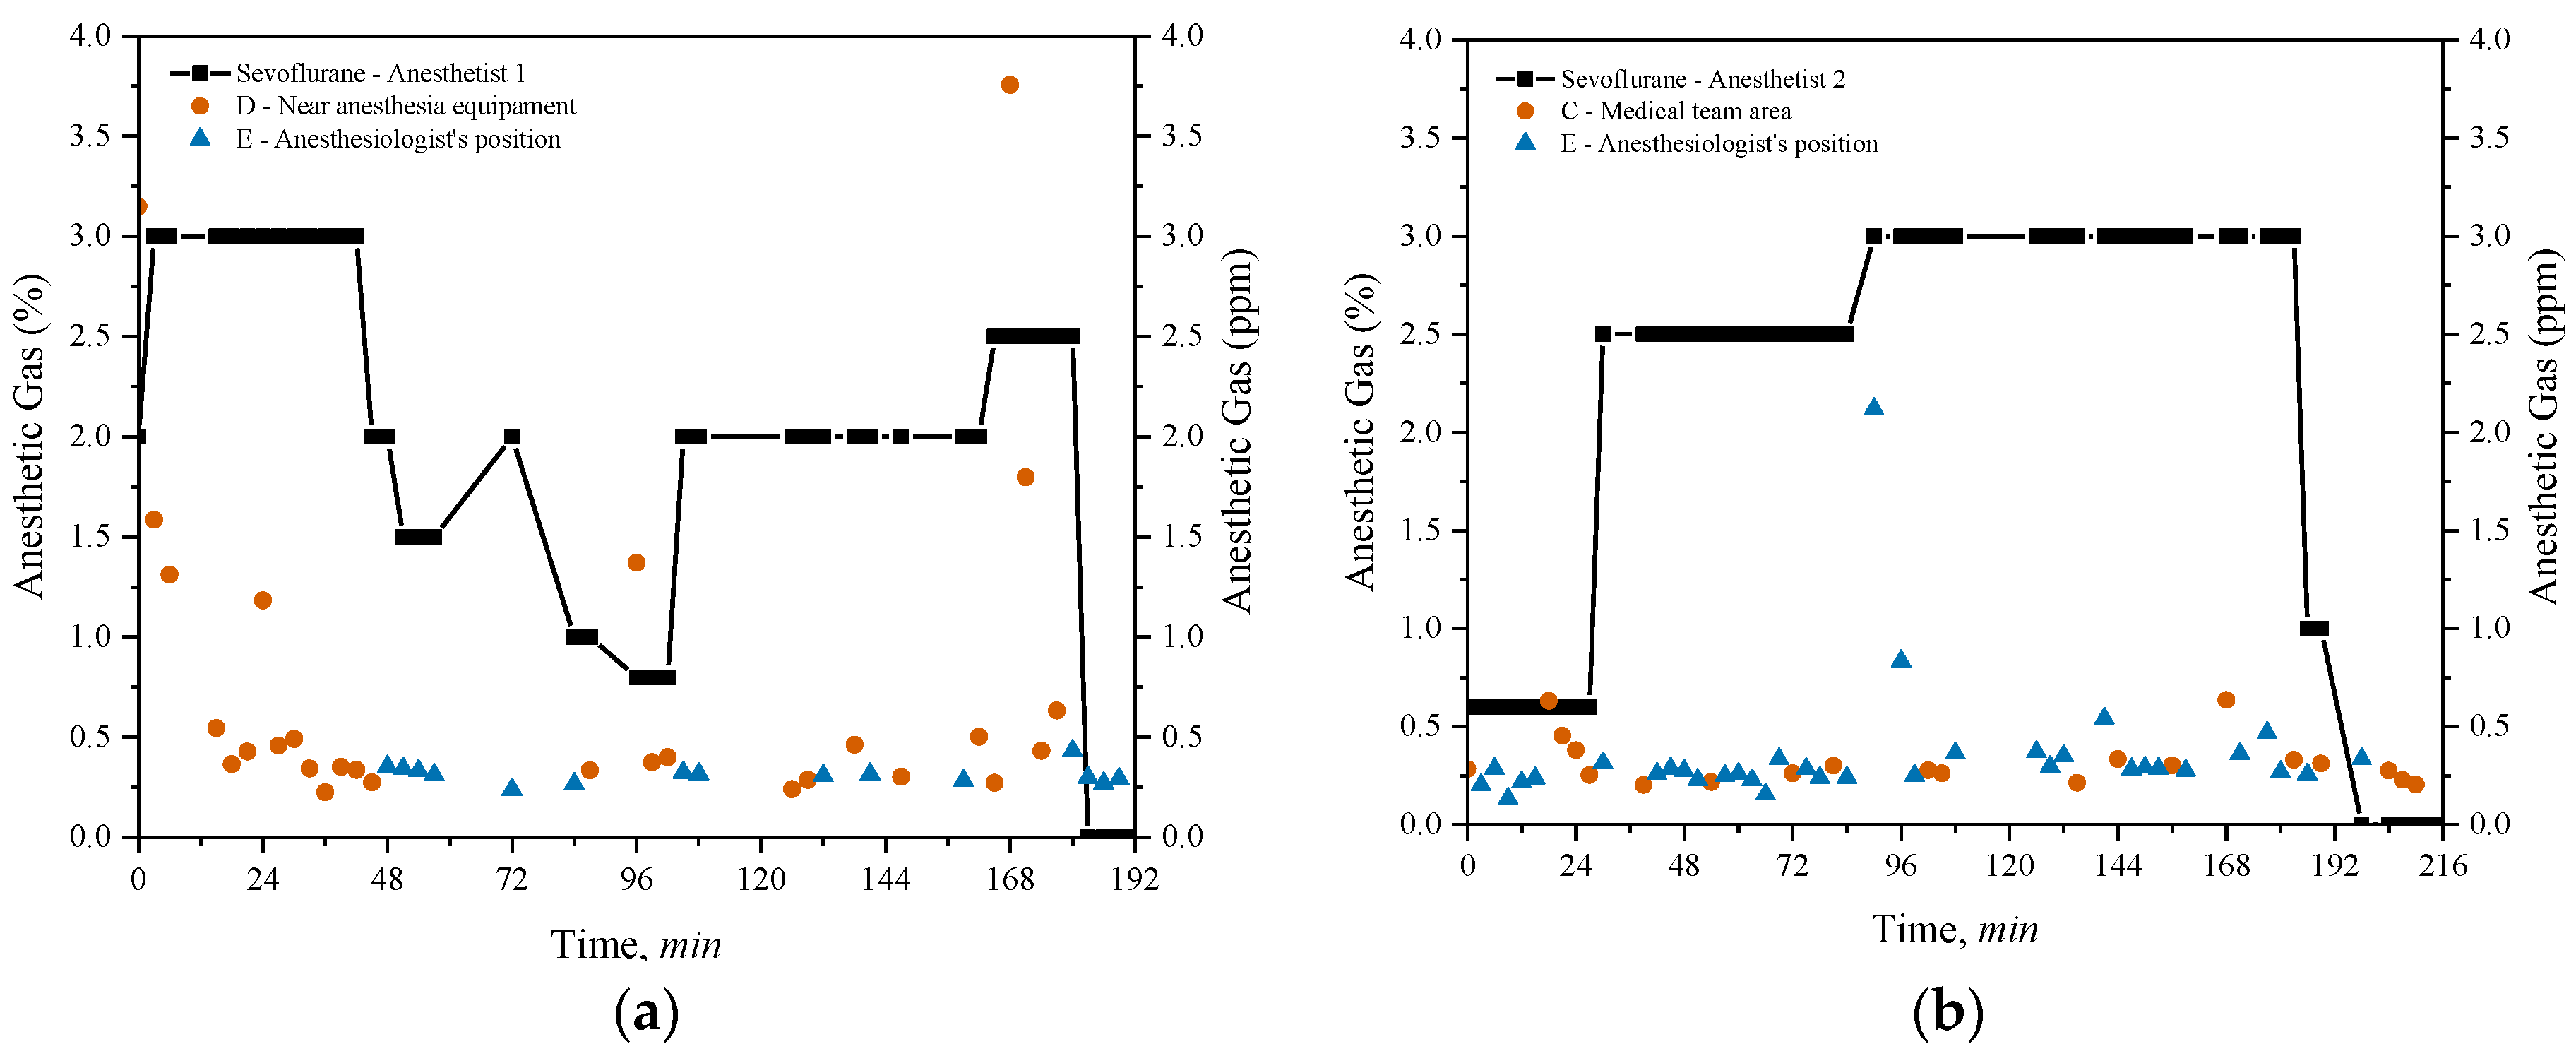
Figure 8.
Correlation matrices for anesthetic gases across different scenarios: (a) Desflurane in the GSR; (b) Sevoflurane in the GSR; (c) Desflurane in the RR; and (d) Sevoflurane in the RR. The matrices illustrate the correlation between various factors related to gas levels and concentrations in each environment.
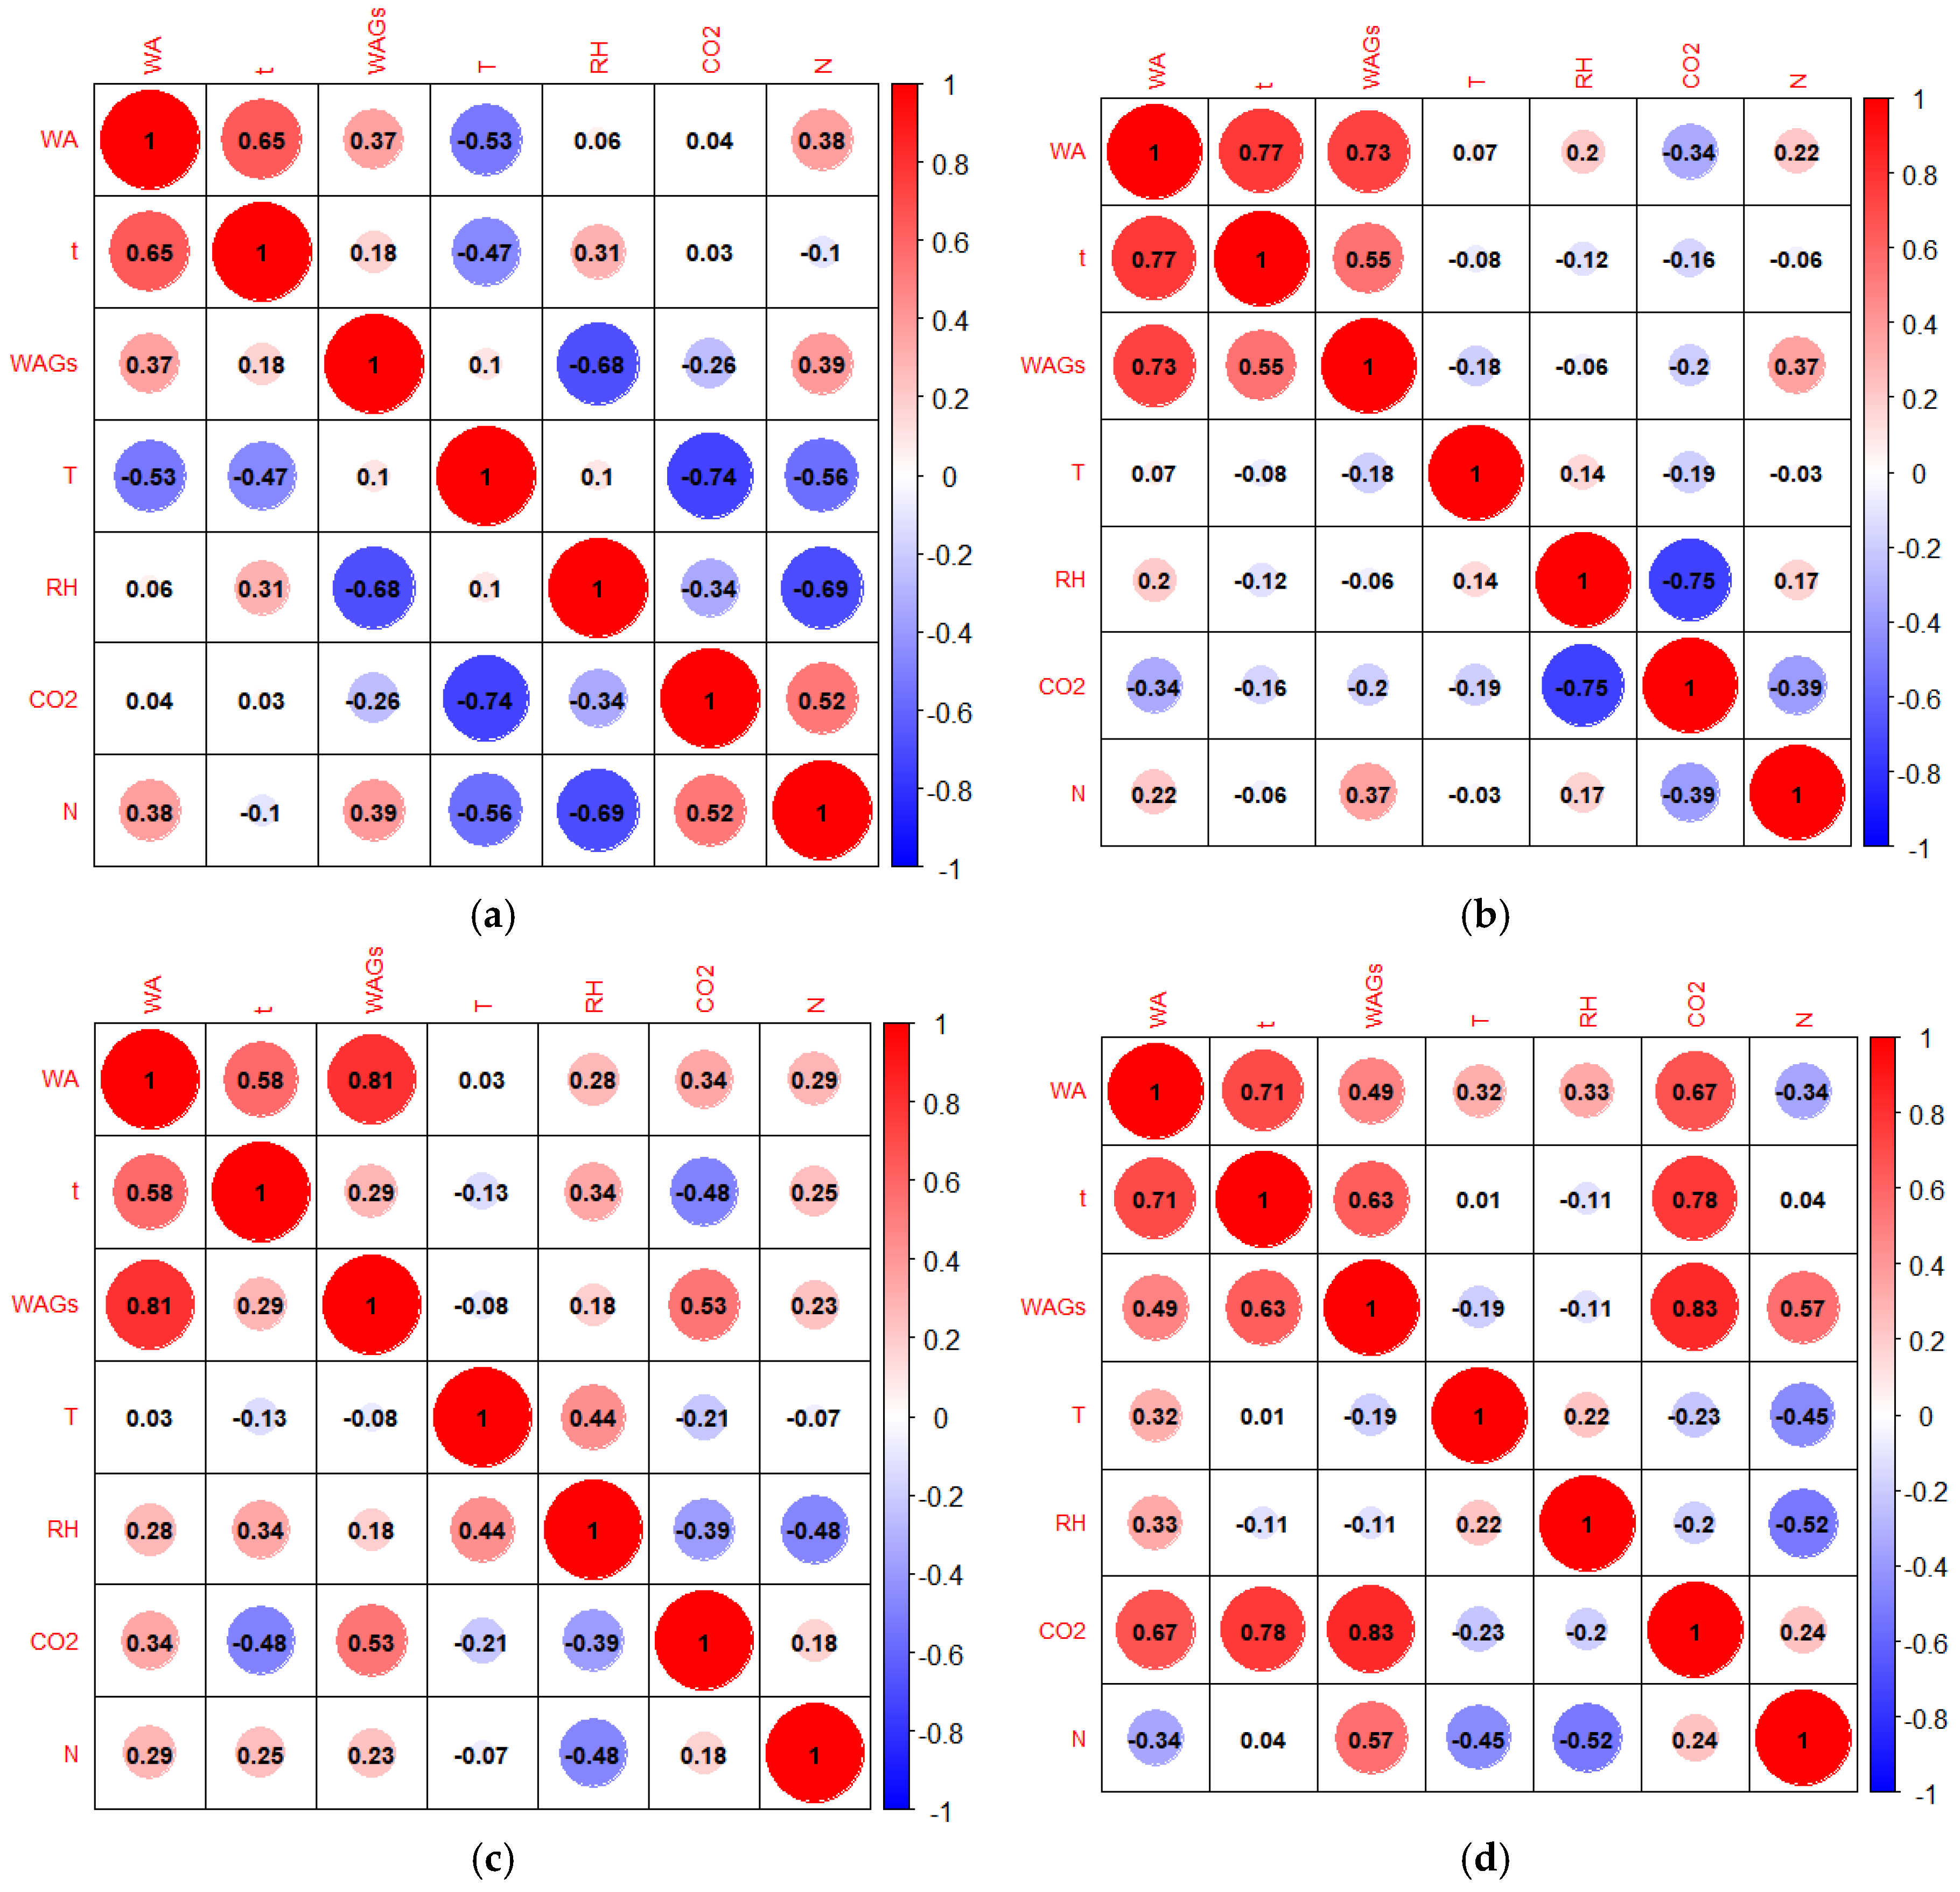

Table 1.
Summary descriptive statistics for CO₂ concentrations obtained in different hospital areas in periods without and with surgery.
Table 1.
Summary descriptive statistics for CO₂ concentrations obtained in different hospital areas in periods without and with surgery.
| CO2 (ppm) | |||||
| Location | Parameter | Without surgery | With surgery | ||
| External Corridor (EC) | Minimum | 630.3 | 544.6 | ||
| Mean ± standard deviation | 727.4 ± 74.0 | 682.2 ± 112.9 | |||
| Median | 702.7 | a | 657.2 | c | |
| Maximum | 877.8 | 1051.23 | |||
| Geral Surgery Room (GSR) | Minimum | 425.7 | 531.9 | ||
| Mean ± standard deviation | 485.9 ± 29.9 | 632.2 ± 76.9 | |||
| Median | 480.4 | b | 614.1 | a | |
| Maximum | 541.8 | 1233.5 | |||
| Recovery Room (RR) | Minimum | 467.7 | 524.9 | ||
| Mean ± standard deviation | 504.5 ± 26.0 | 625.3 ± 133.7 | |||
| Median | 498.1 | c | 595.2 | b | |
| Maximum | 550.7 | 1890.6 | |||
| Transfer Zone (TZ) | Minimum | 499.8 | 529.0 | ||
| Mean ± standard deviation | 591.0 ± 71.8 | 618.3 ± 46.3 | |||
| Median | 595.4 | c | 609.7 | a | |
| Maximum | 703.0 | 797.9 | |||
*Different lowercase letters per column indicate significant differences (p<0.05) for the different operating room compartments regarding CO2 levels.
Table 2.
Residual concentrations of desflurane and sevoflurane in different hospital areas during surgery.
Table 2.
Residual concentrations of desflurane and sevoflurane in different hospital areas during surgery.
| Location | Parameter | Desflurane (ppm) | Sevoflurane (ppm) | ||
| External Corridor (EC) | Minimum | 0.07 | 0.03 | ||
| Mean ± standard deviation | 0.18 ± 0.07 | 0.17 ± 0.06 | |||
| Median | 0.17 | a | 0.11 | a | |
| Maximum | 0.35 | 0.33 | |||
| Geral Surgery Room (GSR) | Minimum | 0.08 | 0.04 | ||
| Mean ± standard deviation | 1.58 ± 18.33 | 0.41 ± 0.53 | |||
| Median | 0.62 | b | 0.31 | b | |
| Maximum | 37.8 | 8.78 | |||
| Recovery Room (RR) | Minimum | 0.35 | 0.25 | ||
| Mean ± standard deviation | 3.13 ± 5.58 | 2.06 ± 9.08 | |||
| Median | 1.32 | c | 0.78 | c | |
| Maximum | 31.1 | 76.68 | |||
| Transfer Zone (TZ) | Minimum | 0.16 | 0.16 | ||
| Mean ± standard deviation | 0.48 ± 0.43 | 0.30 ± 0.09 | |||
| Median | 0.31 | d | 0.27 | d | |
| Maximum | 1.73 | 0.53 |
*Different lowercase letters per column indicate significant differences (p<0.05) for the different operating room compartments regarding the anesthetic’s gases.
Disclaimer/Publisher’s Note: The statements, opinions and data contained in all publications are solely those of the individual author(s) and contributor(s) and not of MDPI and/or the editor(s). MDPI and/or the editor(s) disclaim responsibility for any injury to people or property resulting from any ideas, methods, instructions or products referred to in the content. |
© 2024 by the authors. Licensee MDPI, Basel, Switzerland. This article is an open access article distributed under the terms and conditions of the Creative Commons Attribution (CC BY) license (http://creativecommons.org/licenses/by/4.0/).
Copyright: This open access article is published under a Creative Commons CC BY 4.0 license, which permit the free download, distribution, and reuse, provided that the author and preprint are cited in any reuse.


