
Submitted:
10 November 2024
Posted:
11 November 2024
Read the latest preprint version here
Abstract
Background/Objectives: This study aimed to evaluate the diagnostic performance and clinical utility of elastography and AI-based S-detect in distinguishing benign from malignant thyroid nodules. Methods: This retrospective study included 159 patients who underwent thyroid ultrasonography and were found to have thyroid nodules at an outpatient clinic from January 2023 to June 2024. All patients underwent elastography, S-detect, and fine needle aspiration cytology. Malignancy status was determined based on the fine needle aspiration cytology findings, and the diagnostic performance of elastography (elasticity contrast index), S-detect, and evaluations by a radiologist were assessed. Results: Radiologist interpretation showed the highest diagnostic accuracy (area under the curve 89%), with a sensitivity of 98.28%, specificity of 79.21%, positive predictive value (PPV) of 73.1%, and negative predictive value (NPV) of 98.8%. The of elasticity contrast index was rated with a diagnostic accuracy of 85%, sensitivity of 87.93%, specificity of 81.19%, PPV of 72.9%, and NPV of 92.1%. S-detect had the lowest diagnostic accuracy at 78%, with a sensitivity of 87.93%, specificity of 68.32%, PPV of 61.4%, and NPV of 90.8%. Conclusions: Elastography and S-detect are promising adjunctive diagnostic tools for thyroid nodules that may reduce repeat tests and invasive procedures.
Keywords:
thyroid nodule
; benign
; malignant
; elastography
; thyroid ultrasonography
1. Introduction
Thyroid nodules are common clinical findings characterized by the overgrowth of thyroid cells and are detected in approximately 19–67% of the population through thyroid ultrasound. Approximately 5–15% of these cases are diagnosed as thyroid cancer [1,2,3]. Although the occurrence of thyroid nodules cannot be completely prevented, regular health check-ups enable early detection and management.
The diagnostic approach for thyroid nodules includes palpation, history taking, thyroid function tests, thyroid scans, ultrasonography, and fine needle aspiration cytology (FNAC). Additional imaging techniques, such as computed tomography and magnetic resonance imaging, may be used if necessary [3,4,5,6]. Ultrasonography, in particular, is a highly useful, non-invasive, and convenient method for diagnosing thyroid lesions, as it not only detects nodules but also evaluates the involvement of surrounding lymph nodes and adjacent tissues [7]. Despite its high sensitivity in assessing malignancy risk, ultrasonography has limited specificity, and further evaluation using FNAC is required to confirm malignancy [1,8].
Performing FNAC on all nodules detected by ultrasonography is impractical, as it may increase healthcare costs due to unnecessary biopsies and cause patient discomfort from invasive procedures. Although FNAC is useful for distinguishing between benign and malignant thyroid nodules, performing it on all nodules is considered an unnecessary utilization of healthcare resources [9,10]. To complement the limitations of ultrasonography and improve the accuracy of malignancy assessment, elastography and high-resolution ultrasound have recently been implemented [11].
Elastography is a non-invasive imaging technique used to assess tissue stiffness and elasticity. This advanced computer-aided diagnosis (CAD) technology operates on the principle that softer areas deform more easily than firmer areas when pressure is applied. This technology enables real-time measurement and visualization of tissue stiffness and elasticity, and tissue characteristics are analyzed because malignant nodules are typically stiffer than benign ones [12]. The elasticity contrast index (ECI) quantitatively assesses the stiffness contrast between the nodule and surrounding normal tissue and is a useful index for the evaluation of malignancy risk [13].
S-detect is a deep learning-based computer-aided diagnosis (DL-CAD) software that analyzes grayscale 2D ultrasound images to evaluate the morphological characteristics of thyroid nodules, providing a visual guide to the likelihood of malignancy [14,15]. Both ECI and S-detect contribute to a more precise characterization of thyroid nodules and facilitate appropriate treatment planning by providing data on the elasticity and morphological characteristics of nodules, respectively.
This study aimed to compare the diagnostic performance of ECI and S-detect, specifically their clinical applicability and utility in differentiating malignant from benign thyroid nodules, and to establish a more accurate diagnostic approach that minimizes the need for unnecessary FNAC procedures.
2. Materials and Methods
2.1. Study Design and Population
This study enrolled 159 patients (61 men and 98 women) aged 30–83 years who visited J Internal Medicine Clinic in Busan from January 2023 to June 2024. Participants underwent FNAC after a new diagnosis of one or more thyroid nodules. Patients who had previously undergone thyroid surgery, were currently undergoing treatment for thyroid-related conditions, or had nondiagnostic or unsatisfactory FNAC results due to inadequate sampling were excluded from the study. FNAC results were interpreted according to the Bethesda System, which classifies malignancy risk into six categories. Ethical approval for this study was obtained from the Institutional Bioethics Committee of University B (approval NO. CUPIRB-2024-033).
2.2. US Examination
Thyroid nodule detection was performed using a high-resolution ultrasound system (RS85, Samsung Medison, Seoul, South Korea) with a 14 MHz high-frequency linear transducer (LA 2-14A, Samsung Medison). An ultrasound technologist with over 20 years of clinical experience conducted the ultrasound examinations, and a radiologist interpreted the images based on the guidelines of the Korean Thyroid Imaging Reporting and Data System (K-TIRADS). The final diagnosis was confirmed through FNAC results [16,17].
2.3. Elastography
For the elastography procedure, patients were positioned supine with their heads slightly turned away from the thyroid being examined and their chin extended. B-mode ultrasound images of the thyroid nodule were acquired, and static elastography was performed [18]. Images were obtained by using light pressure to ensure patient comfort, and ECI was automatically measured within the region of interest. This case is depicted in Figure 1.
2.4. S-Detect
S-detect is an AI-based CAD software for analyzing ultrasound images. When the region of interest for the targeted nodule is established, the software automatically identifies the boundaries and begins the analysis [16,19]. The nodules were classified as possibly benign or possibly malignant based on characteristics such as internal composition, echogenicity, orientation, margin, and shape. This case is depicted in Figure 2.
2.5. Statistical Analysis
The general characteristics of the study population are presented as mean and standard deviation (SD) or number of persons (n) and percentage (%). To assess the diagnostic utility of elastography, receiver operating characteristic (ROC) curve analysis was conducted, and the area under the curve (AUC), positive predictive value (PPV), negative predictive value (NPV), sensitivity, and specificity were calculated. Diagnostic agreement with FNAC results was evaluated using Cohen’s Kappa analysis. Statistical significance was set at p<0.05, and all analyses were performed using SPSS Version 29.0 (IBM Corp., Armonk, NY, USA).
3. Results
3.1. General Characteristics of Patients
Based on FNAC results, 101 patients (63.5%) had benign nodules, and 58 patients (36.5%) had malignant nodules. The cohort included 61 (38.4%) males and 98 (61.6%) females, with no significant difference in sex distribution between the benign and malignant groups (p=0.352). The mean age of the study population was 56.14±11.35 years. Nodule sizes ranged from 0.23 cm to 6.13 cm, with a mean of 1.07±0.85 cm. The mean nodule size was significantly larger in the benign group (1.23±0.94 cm) compared to the malignant group (0.79±0.58 cm; p=0.002). In terms of nodule composition, 146 (91.8%) were solid, 11 (6.9%) were predominantly solid, and 2 (1.3%) were predominantly cystic, with no significant difference between the benign and malignant groups (p=0.077). Regarding nodule orientation, 105 (66.0%) were parallel, and 54 (34.0%) were nonparallel, with nonparallel orientation being more frequently observed in malignant cases (p<0.001). In terms of nodule margins, 75 nodules (47.2%) were circumscribed, and 84 (52.8%) were not circumscribed (p<0.001). Regarding shape, 67 nodules (42.1%) were oval, 34 (21.4%) were round, and 58 (36.5%) were irregular, with irregular shapes being more frequently associated with malignancy (p<0.001). The results are detailed in Table 1.
3.2. Performance of Diagnostic Models
In the ROC curve analysis, S-detect had an AUC of 0.78 (95% CI 0.72–0.84, p<0.001), sensitivity of 87.93%, specificity of 68.32%, PPV of 61.4%, and NPV of 90.8%. For ECI, the optimal cutoff value was 2.41 and had an AUC of 0.85 (95% CI 0.79–0.90, p<0.001), sensitivity of 87.93%, specificity of 81.19%, PPV of 72.9%, and NPV of 92.1%. Radiologist evaluation had an AUC of 0.89 (95% CI 0.84–0.93, p<0.001), sensitivity of 98.28%, specificity of 79.21%, PPV of 73.1%, and NPV of 98.8%. The results are presented in Table 2 and Figure 3.
3.3. Agreement of Diagnostic Models
Kappa coefficients were calculated to assess the agreements of S-detect, ECI, and radiologist evaluation with FNAC results. According to Landis and Koch’s interpretation, S-detect showed moderate agreement with a Kappa value of 0.52 (95% CI 0.38–0.64, p < 0.001). ECI demonstrated substantial agreement with a Kappa value of 0.66 (95% CI 0.54–0.78, p < 0.001), while K-TIRADS also exhibited substantial agreement with a Kappa value of 0.72 (95% CI 0.62–0.83, p < 0.001) [20]. The results are presented in Table 3.
4. Discussion
Thyroid nodules are generally slow-growing and often do not require surgical intervention. According to the National Cancer Registry Statistics in South Korea, the 5-year relative survival rate (2016–2020) for thyroid cancer is 100% [21]. With early detection and appropriate treatment, malignant thyroid nodules have a favorable prognosis compared to other cancers [22]. Additionally, avoiding unnecessary tests and surgeries for benign nodules helps reduce healthcare costs and improves patients’ quality of life [23]. Therefore, distinguishing between benign and malignant nodules at an early stage is crucial.
There has been ongoing research to incorporate AI-based computer-aided diagnostic systems into ultrasound examinations to minimize diagnostic variability among clinicians caused by differences in proficiency and provide consistent treatment recommendations [24]. In this study, we compared the diagnostic performance of radiologist evaluation (K-TIRADS) with AI-assisted S-detect and ECI (elastography) to examine their potential as adjunctive diagnostic tools.
In this study, the diagnostic accuracy was the highest for K-TIRADS-based radiologist evaluation, with an accuracy of 89%, sensitivity of 98.28%, specificity of 79.21%, PPV of 73.1%, and NPV of 98.8%. Next, the accuracy of ECI was relatively high at 85%, with a sensitivity of 87.93%, specificity of 81.19%, PPV of 72.9%, and NPV of 92.1%, indicating that ECI can be helpful in differentiating thyroid nodules. The accuracy of S-detect was the lowest among the diagnostic models, at 78%, with a sensitivity of 87.93%, specificity of 68.32%, PPV of 61.4%, and NPV of 90.8%. According to Cho et al. [25], the diagnostic accuracy of combined grayscale ultrasound and ECI was 78.6% when using an ECI cutoff value of 3.5, which was higher than that of grayscale ultrasound (76.9%) and ECI alone (67.1%). Sheng et al. [26] reported that ECI significantly increases in patients with Hashimoto’s thyroiditis and can be used to assess the degree of immune dysfunction. Di et al. [27] found that the optimal ECI cutoff value was 2.16, lower than the 2.41 found in this study, with a sensitivity of 90.3%, specificity of 82.9%, PPV of 83.7%, and NPV of 91.2%. The said study suggested that these variations could be attributed to differences in study populations or diagnostic criteria, confirming that ECI can be a useful tool for assessing the malignant potential of thyroid nodules in specific contexts. In addition, the authors of the said study suggest that elastography, which measures tissue stiffness upon external pressure in real-time through noninvasive methods, is a useful tool for differentiating thyroid nodules [27].
A limitation of this study is the lack of an objective criterion for accurately measuring the degree of fine pressure applied during elastography, which might have led to variability in the elasticity grades assigned by each examiner [28]. In addition, the sample size was limited to 126 subjects, and the study was conducted in a single geographic area, which may limit the generalizability of the results. To address these limitations, larger-scale studies involving diverse population groups are necessary. Moreover, educational programs to enhance examiner proficiency, research aimed at improving diagnostic accuracy through the development of objective measurement criteria for elastography, and advancements in artificial intelligence-based diagnostic tools should continue. Despite these limitations, elastography has proven to be a valuable noninvasive diagnostic tool for thyroid nodules. The Kappa coefficient of 0.66 observed in this study indicates substantial agreement with FNAC results, suggesting that elastography could play an important role in the development and refinement of diagnostic techniques for thyroid nodules [29]. The results of this study show that ECI, as calculated through elastography, demonstrated relatively high sensitivity and specificity. Although S-detect’s accuracy was lower compared to the other two methods, it still shows promise as an artificial intelligence-based diagnostic tool for thyroid nodule evaluation.
5. Conclusions
This study evaluated the potential of elastography and S-detect as adjunctive diagnostic tools for thyroid nodules. Although ECI and S-detect cannot fully replace FNAC, they can significantly enhance the accuracy and reliability of thyroid nodule diagnosis, thereby aiding in the effective diagnosis of thyroid cancer. Incorporating elastography to obtain ECI values and using S-detect patients undergoing thyroid ultrasonography could maximize diagnostic precision for thyroid nodules and potentially reduce the need for unnecessary FNAC and biopsies.
Author Contributions
Conceptualization, J.Y.P. and S.H.Y.; methodology, S.H.Y.; formal analysis, S.H.Y.; investigation, J.Y.P.; data curation, J.Y.P.; writing—original draft preparation, J.Y.P. and S.H.Y.; writing—review and editing, J.Y.P. and S.H.Y.; visulalization, J.Y.P; funding acquisition, S.H.Y. All authors have read and agreed to the published version of the manuscript.
Funding
This research received no external funding.
Institutional Review Board Statement
Ethical approval for this study was obtained from the Institutional Bioethics Committee of University B (approval NO. CUPIRB-2024-033).
Informed Consent Statement
The requirement for patient consent was waived due to the study’s retrospective nature.
Data Availability Statement
The data supporting the findings of this study are available on request from the corresponding author (S.H.Y.).
Conflicts of Interest
The authors declare no conflicts of interest.
References
- Park, Y.J.; Lee, E.K.; Song, Y.S.; Koo, B.S.; Kwon, H.; Kim, K.; Kim, M.; Kim, B.H.; Kim, W.G.; Kim, W.B.; et al. Korean Thyroid Association Guidelines on the Management of Differentiated Thyroid Cancer; Overview and Summary 2024. Int J Thyroidol 2024, 17, 1–20. [Google Scholar] [CrossRef]
- Hegedüs, L. Clinical practice: The thyroid nodule. N Engl J Med 2004, 351, 1764–1771. [Google Scholar] [CrossRef] [PubMed]
- Kim, K.H.; Kim, E.K.; Kwak, J.Y.; Kim, M.J. Detection and Management of Thyroid Incidentaloma; Vol. 27; Korean Society of Ultrasound in Medicine, 2008; pp. 111–117.
- Shaheen, R.; Levine, D. Diagnostic Ultrasound ed. 5; Elsevier: Philadelphia, 2018; pp. 725–765. [Google Scholar]
- AlSaedi, A.H.; Almalki, D.S.; ElKady, R.M. Approach to thyroid nodules: diagnosis and treatment. Cureus 2024, 16, e52232. [Google Scholar] [CrossRef] [PubMed]
- Dighe, M.; Barr, R.; Bojunga, J.; Cantisani, V.; Chammas, M.C.; Cosgrove, D.; Cui, X.W.; Dong, Y.; Fenner, F.; Radzina, M.; et al. Thyroid ultrasound: State of the art Part 2. Med Ultrason 2017, 19, 195–210. [Google Scholar] [CrossRef]
- Hahn, S.Y.; Shin, J.H.; Oh, Y.L.; Son, Y.I. Discrepancies between the ultrasonographic and gross pathological size of papillary thyroid carcinomas. Ultrasonography 2016, 35, 220–225. [Google Scholar] [CrossRef]
- Tian, W.; Hao, S.; Gao, B.; Jiang, Y.; Zhang, S.; Guo, L.; Luo, D. Comparison of diagnostic accuracy of real-time elastography and shear wave elastography in differentiation malignant from benign thyroid nodules. Med (Baltim) 2015, 94, e2312. [Google Scholar] [CrossRef]
- Lee, Y.J.; Kim, D.W.; Park, Y.M.; Park, H.K.; Jung, S.J.; Kim, D.H.; Lee, S.M.; Oh, M. Comparison of sonographic and cytological diagnoses of solid thyroid nodules:Empahsis on the discordant cases. Diagn Cytopathol 2015, 43, 953–959. [Google Scholar] [CrossRef]
- Dondi, F.; Gatta, R.; Treglia, G.; Piccardo, A.; Albano, D.; Camoni, L.; Gatta, E.; Cavadini, M.; Cappelli, C.; Bertagna, F. Application of radiomics and machine learning to thyroid diseases in nuclear medicine: a systematic review. Rev Endocr Metab Disord 2024, 25, 175–186. [Google Scholar] [CrossRef]
- Ha, E.J.; Baek, J.H. Applications of machine learning and deep learning to thyroid imaging: Where do we stand? Ultrasonography 2021, 40, 23–29. [Google Scholar] [CrossRef]
- Zhao, C.K.; Xu, H.X. Ultrasound elastography of the thyroid: Principles and current status. Ultrasonography 2019, 38, 106–124. [Google Scholar] [CrossRef]
- Cong, P.; Wang, X.M.; Zhang, Y.F. Comparison of artificial intelligence, elastic imaging, and the thyroid imaging reporting and data system in the differential diagnosis of suspicious nodules. Quant Imaging Med Surg 2024, 14, 711–721. [Google Scholar] [CrossRef] [PubMed]
- Ko, E.Y. S-detect in breast ultrasound: Initial experience. Samsung Medical Center, Medison, (Seoul, Korea), /: online: http.
- Sorrenti, S.; Dolcetti, V.; Radzina, M.; Bellini, M.I.; Frezza, F.; Munir, K.; Grani, G.; Durante, C.; D’Andrea, V.; David, E.; et al. Artificial intelligence for thyroid nodule characterization: Where are we standing? Cancers (Basel) 2022, 14, 3357. [Google Scholar] [CrossRef] [PubMed]
- Park, J.Y.; Cho, Y.I.; Yang, S.H. Diagnostic usefulness of deep learning based S-detect using thyroid ultrasonography. J Next-Gener Converg Technol Assoc 2024, 8, 343–350. [Google Scholar] [CrossRef]
- Ha, E.J.; Chung, S.R.; Na, D.G.; Ahn, H.S.; Chung, J.; Lee, J.Y.; Park, J.S.; Yoo, R.E.; Baek, J.H.; Baek, S.M.; et al. 2021 Korean thyroid imaging reporting and data system and imaging-based management of thyroid nodules: Korean society of thyroid radiology consensus statement and recommendations. Korean J Radiol 2021, 22, 2094–2123. [Google Scholar] [CrossRef] [PubMed]
- Ophir, J.; Garra, B.; Kallel, F.; Konofagou, E.; Krouskop, T.; Righetti, R.; Varghese, T. Elastographic imaging. Ultrasound Med Biol 2000, 26, S23–S29. [Google Scholar] [CrossRef] [PubMed]
- Russ, G.; Bonnema, S.J.; Erdogan, M.F.; Durante, C.; Ngu, R.; Leenhardt, L. European Thyroid association guidelines for ultrasound malignancy risk stratification of thyroid nodules in adults: The EU-TIRADS. Eur Thyroid J 2017, 6, 225–237. [Google Scholar] [CrossRef]
- Landis, J.R.; Koch, G.G. The measurement of observer agreement for categorical data. Biometrics 1977, 33, 159–174. [Google Scholar] [CrossRef]
- Korea Central Cancer Registry, National Cancer Center. Annual Report of Cancer Statistics in Korea in 2020; Ministry of Health and Welfare. Available online: https://www.ncc.re.kr/cancerStatsList.ncc.
- Hong, Y.; Liu, X.; Li, Z.; Zhang, X.; Chen, M.; Luo, Z. Real-time ultrasound elastography in the differential diagnosis of benign and malignant thyroid nodules. J Ultrasound Med 2009, 28, 861–867. [Google Scholar] [CrossRef]
- Yang, S.H.; Lee, J.S. Evaluation of breast ultrasound lesion recognition rate using machine learning application. Next-Generation Convergence Technology Association 2023, 7, 1261–1267. [Google Scholar] [CrossRef]
- Park, S.H.; Kim, S.J.; Kim, E.K.; Kim, M.J.; Son, E.J.; Kwak, J.Y. Interobserver agreement in assessing the sonographic and elastographic features of malignant thyroid nodules. AJR Am J Roentgenol 2009, 193, 416–423. [Google Scholar] [CrossRef]
- Cho, Y.J.; Ha, E.J.; Han, M.R.; Choi, J.W. US elastography using carotid artery pulsation may increase the diagnostic accuracy for thyroid nodules with US-pathology discordance. Ultrasound Med Biol 2017, 43, 1587–1595. [Google Scholar] [CrossRef] [PubMed]
- Sheng, J.G.; Wang, B.; Cao, K.K.; Zhang, S. Relationship of thyroid ultrasound elasticity contrast index with serum autoantibody and Th1/Th2 cytokine levels in patients with Hashimoto’s thyroiditis. J Hainan Med Univ 2016, 22, 147–150. [Google Scholar]
- Di, Z.; Li, Z.; Tian, J.; Wang, D.; Liu, L.; Liu, C. The value of elasticity contrast index in the differential diagnosis of thyroid solid nodules. Ultrasound Q 2019, 35, 259–263. [Google Scholar] [CrossRef] [PubMed]
- Han, R.J.; Du, J.; Li, F.H.; Zong, H.R.; Wang, J.D.; Shen, Y.L.; Zhou, Q.Y. Comparisons and combined application of two-dimensional and three-dimensional real-time shear wave elastography in diagnosis of thyroid nodules. J Cancer 2019, 10, 1975–1984. [Google Scholar] [CrossRef]
- Reverter, J.L.; Vázquez, F.; Puig-Domingo, M. Diagnostic performance evaluation of computer-assisted imaging analysis system for ultrasound risk stratification of thyroid nodules. AJR Am J Roentgenol 2019, 213, 169–174. [Google Scholar] [CrossRef]
Figure 1.
a) Isoechoic, well-defined margin and spongiform nodule localized in the left lobe of the thyroid gland. The axial peri-intranodular ECI was 1.22. Histology confirmed the diagnosis of benign nodular hyperplasia. b) Hypoechoic nodule with taller than wider and some internal calcifications localized in the left lobe of the thyroid gland. The axial peri-intranodular ECI was 2.15. Histology confirmed the diagnosis of papillary carcinoma. c) Hypoechoic nodule with irregular margins and some internal calcifications localized in middle portion of the thyroid gland. Peri-intranodular ECI measures 3.33. Histology confirmed the diagnosis of papillary carcinoma.
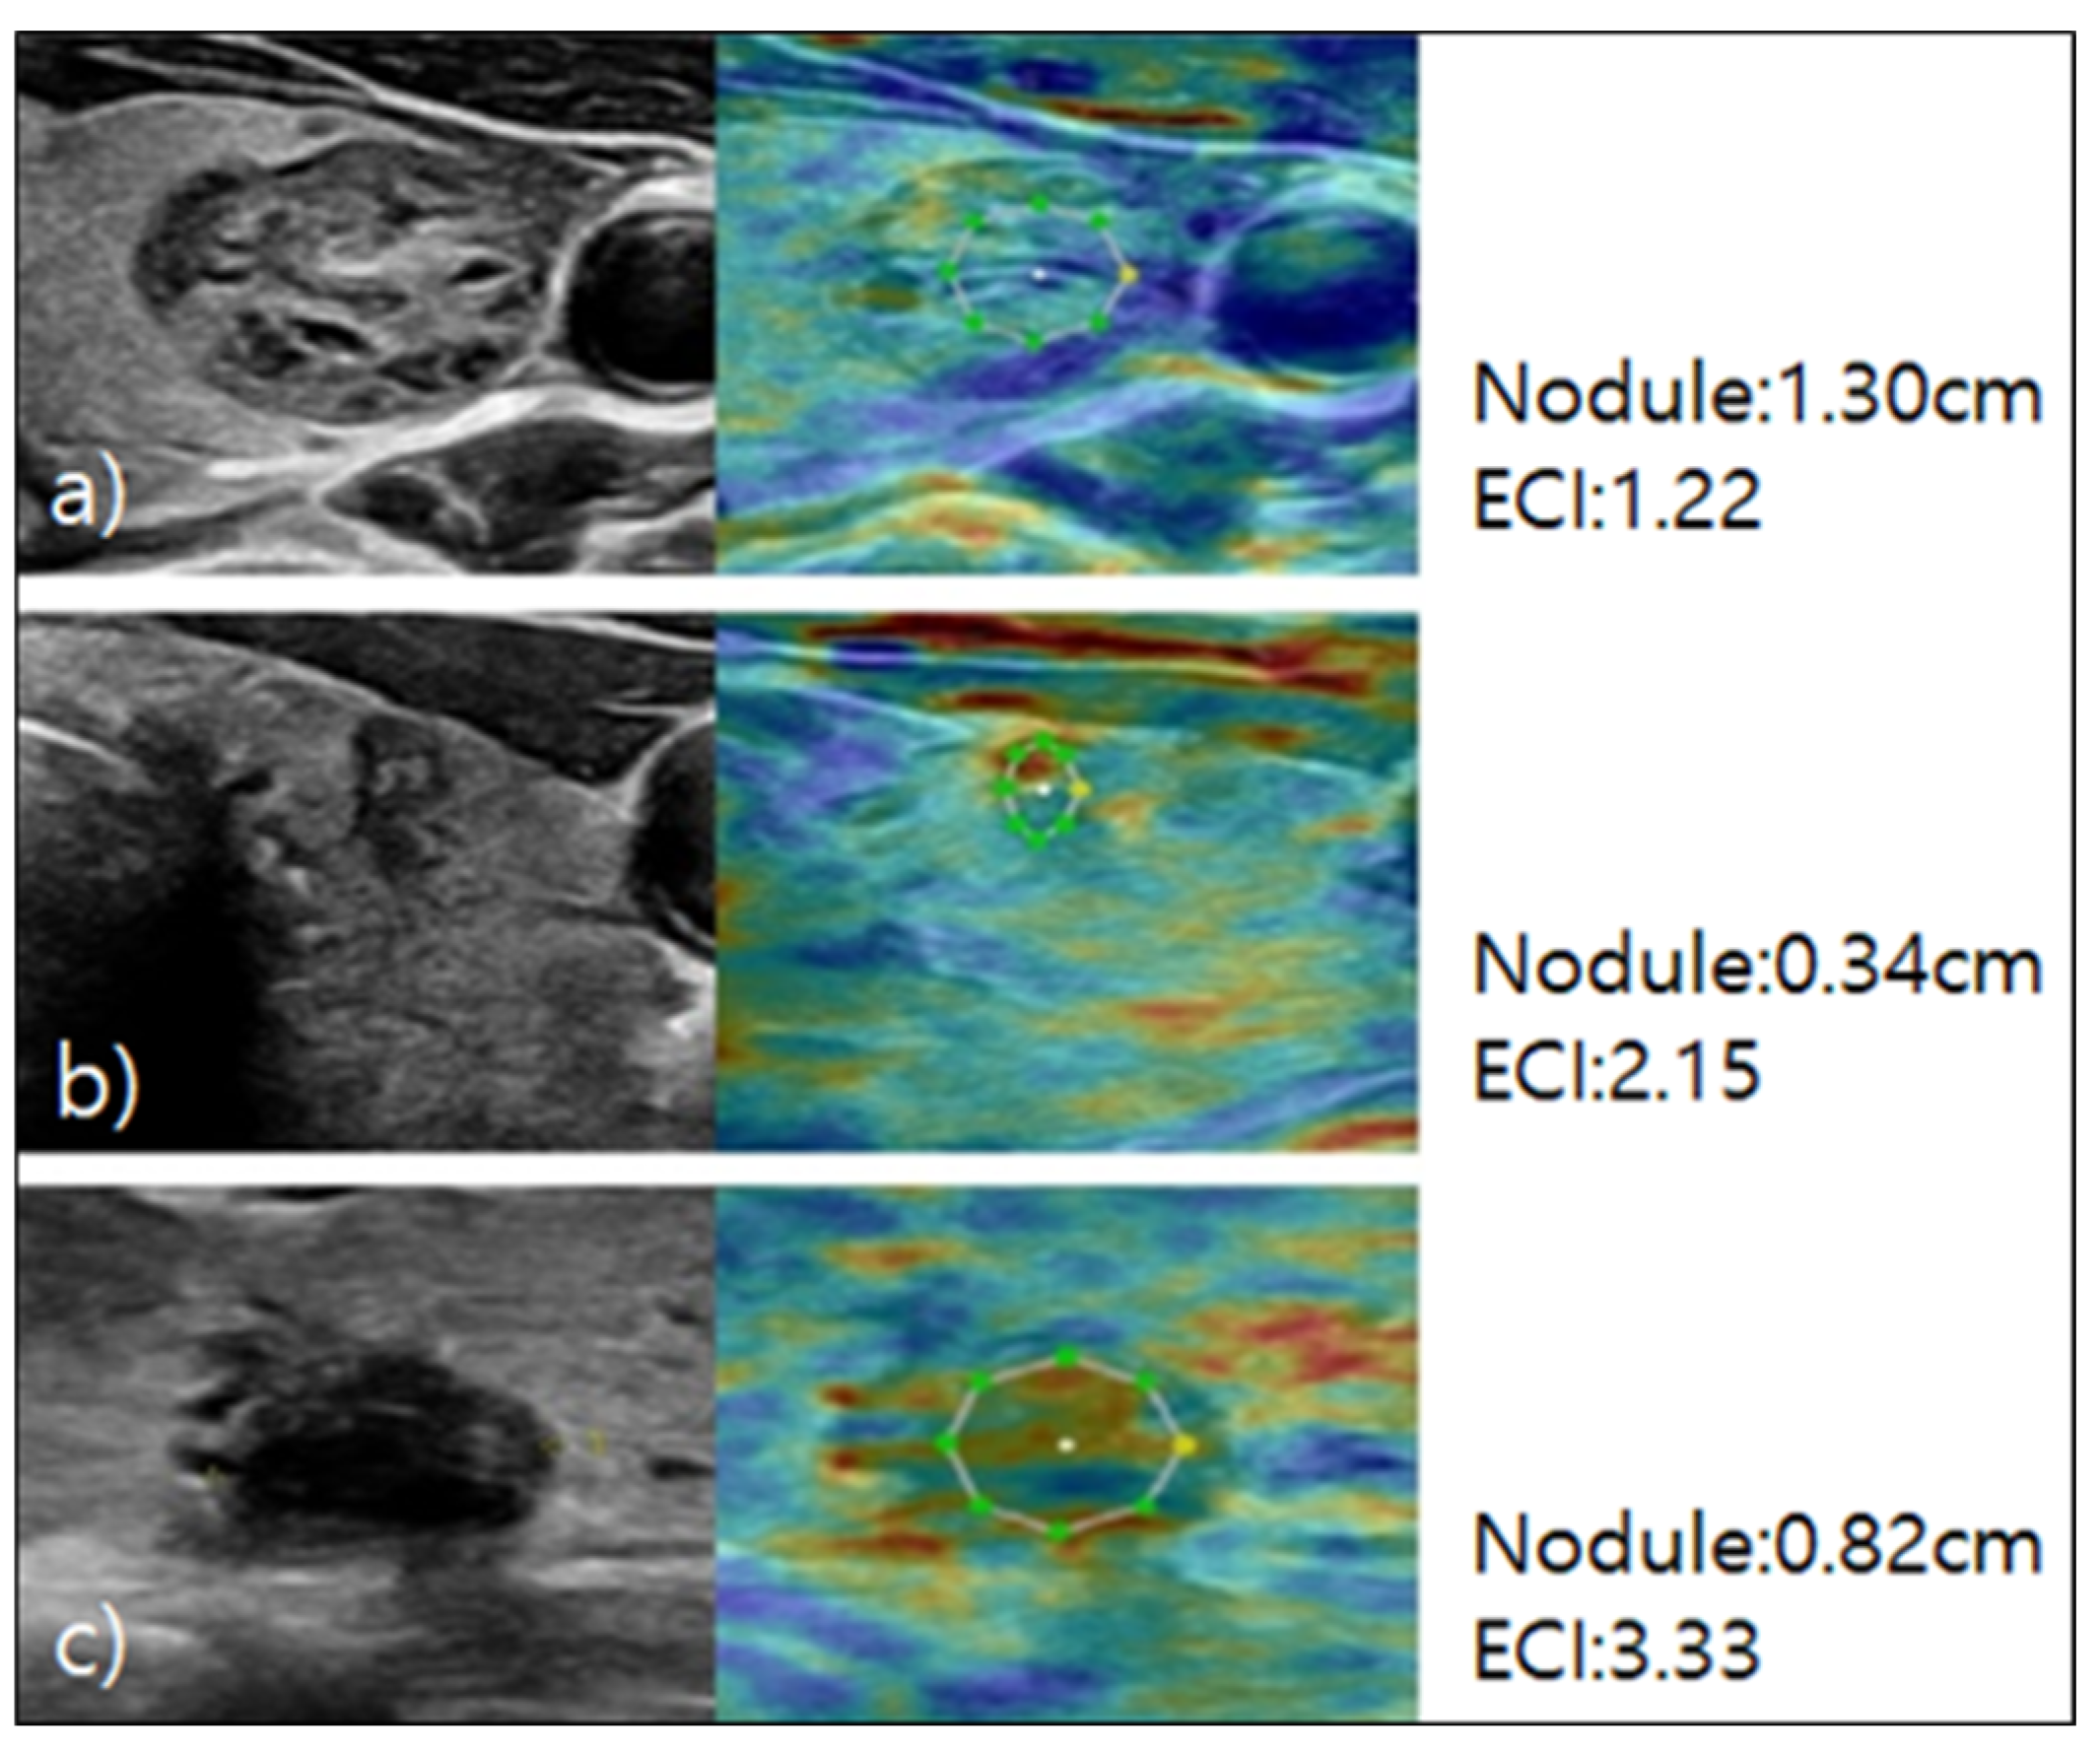
Figure 2.
a) Ultrasound grayscale transverse image of the left thyroid lobe in a 57-year-old woman. b) Thyroid nodules automatically classified as benign and malignant using S-detect according to characteristics such as internal composition, echogenicity, orientation, margin, and shape.
Figure 2.
a) Ultrasound grayscale transverse image of the left thyroid lobe in a 57-year-old woman. b) Thyroid nodules automatically classified as benign and malignant using S-detect according to characteristics such as internal composition, echogenicity, orientation, margin, and shape.
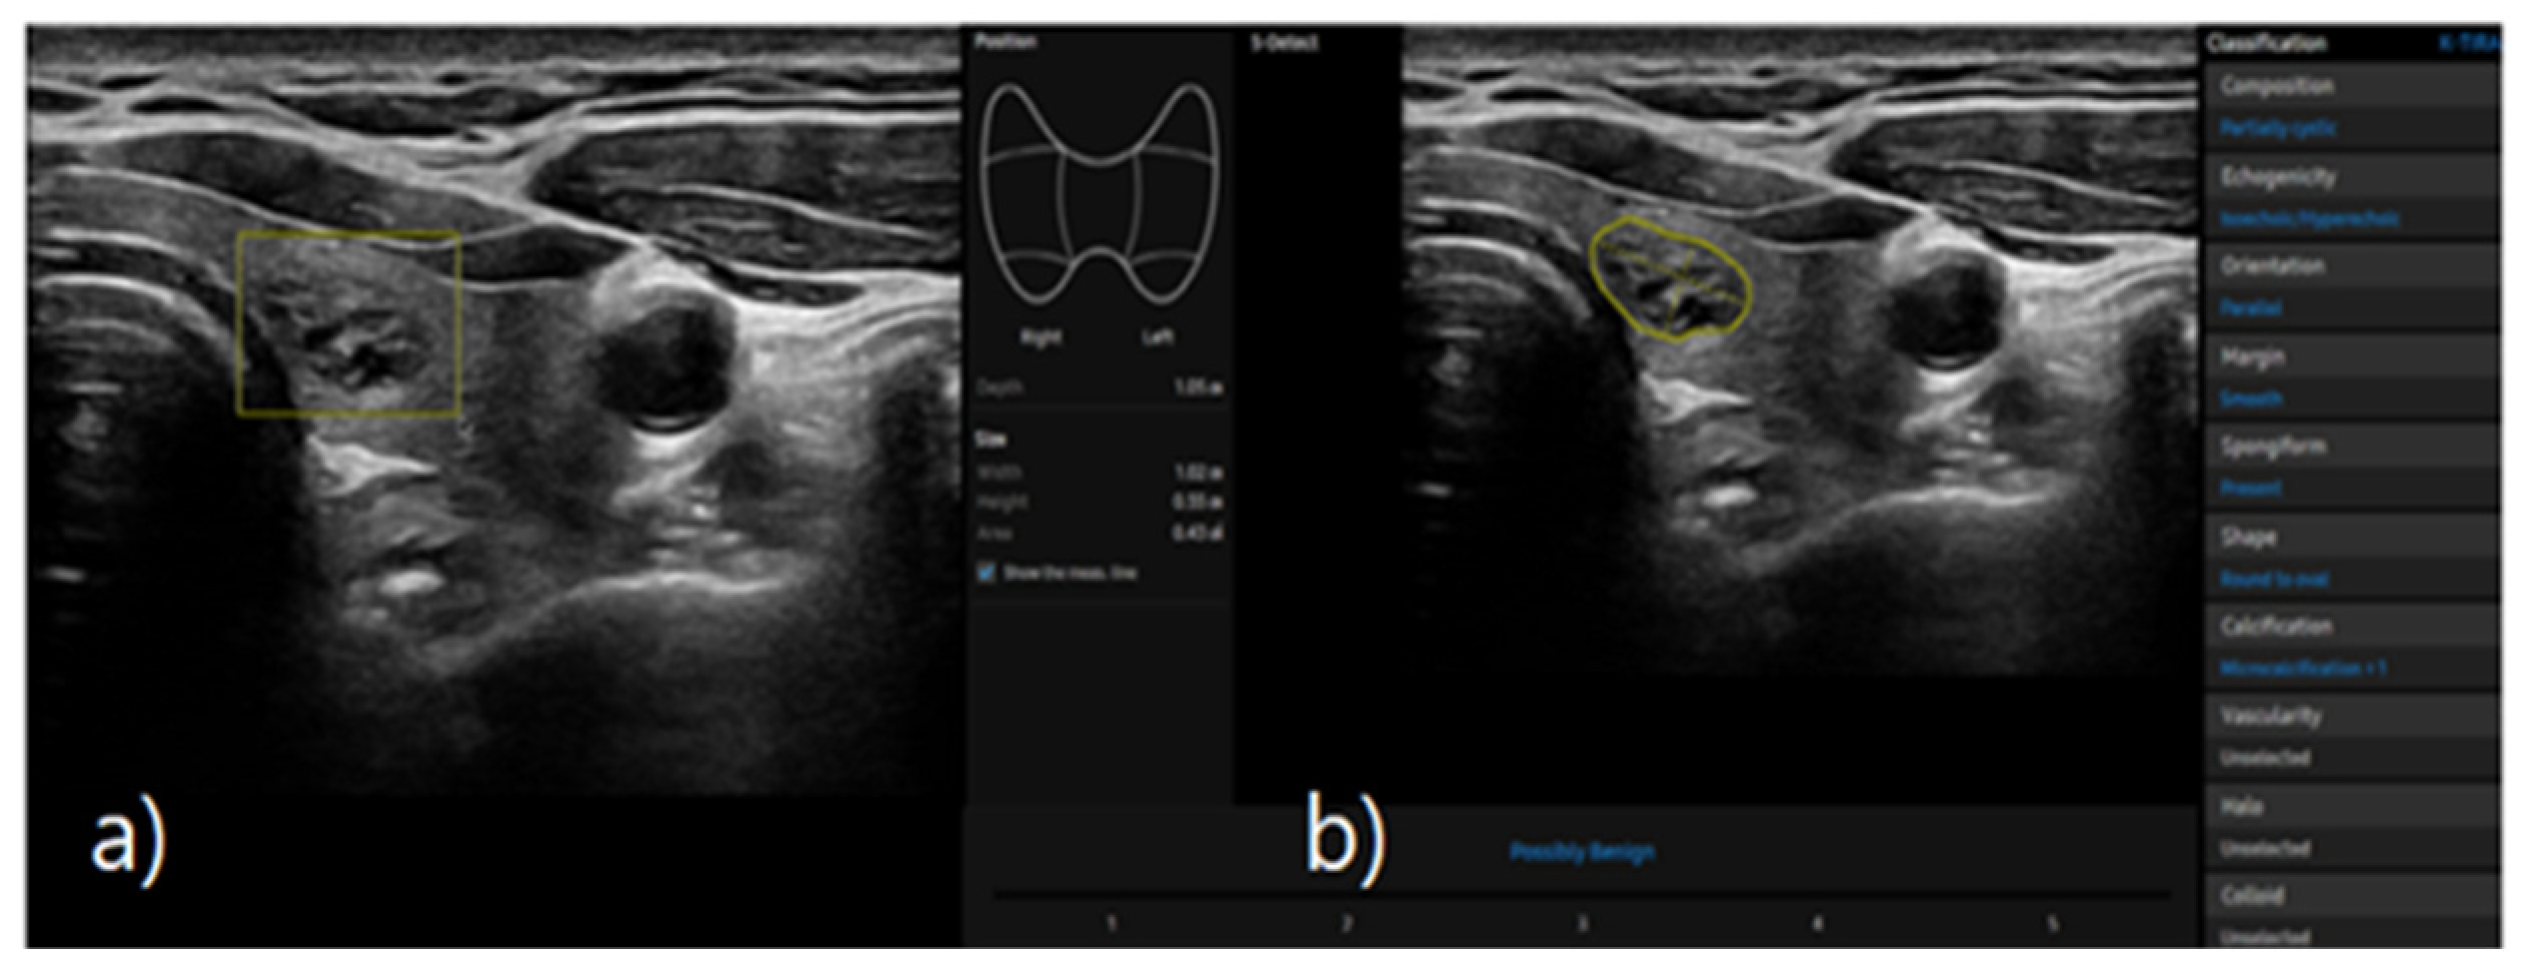
Figure 3.
Receiver operating characteristic curve analysis comparing the diagnostic performance of the radiologist, S-detect, and elastography based on fine needle aspiration cytology results.
Figure 3.
Receiver operating characteristic curve analysis comparing the diagnostic performance of the radiologist, S-detect, and elastography based on fine needle aspiration cytology results.
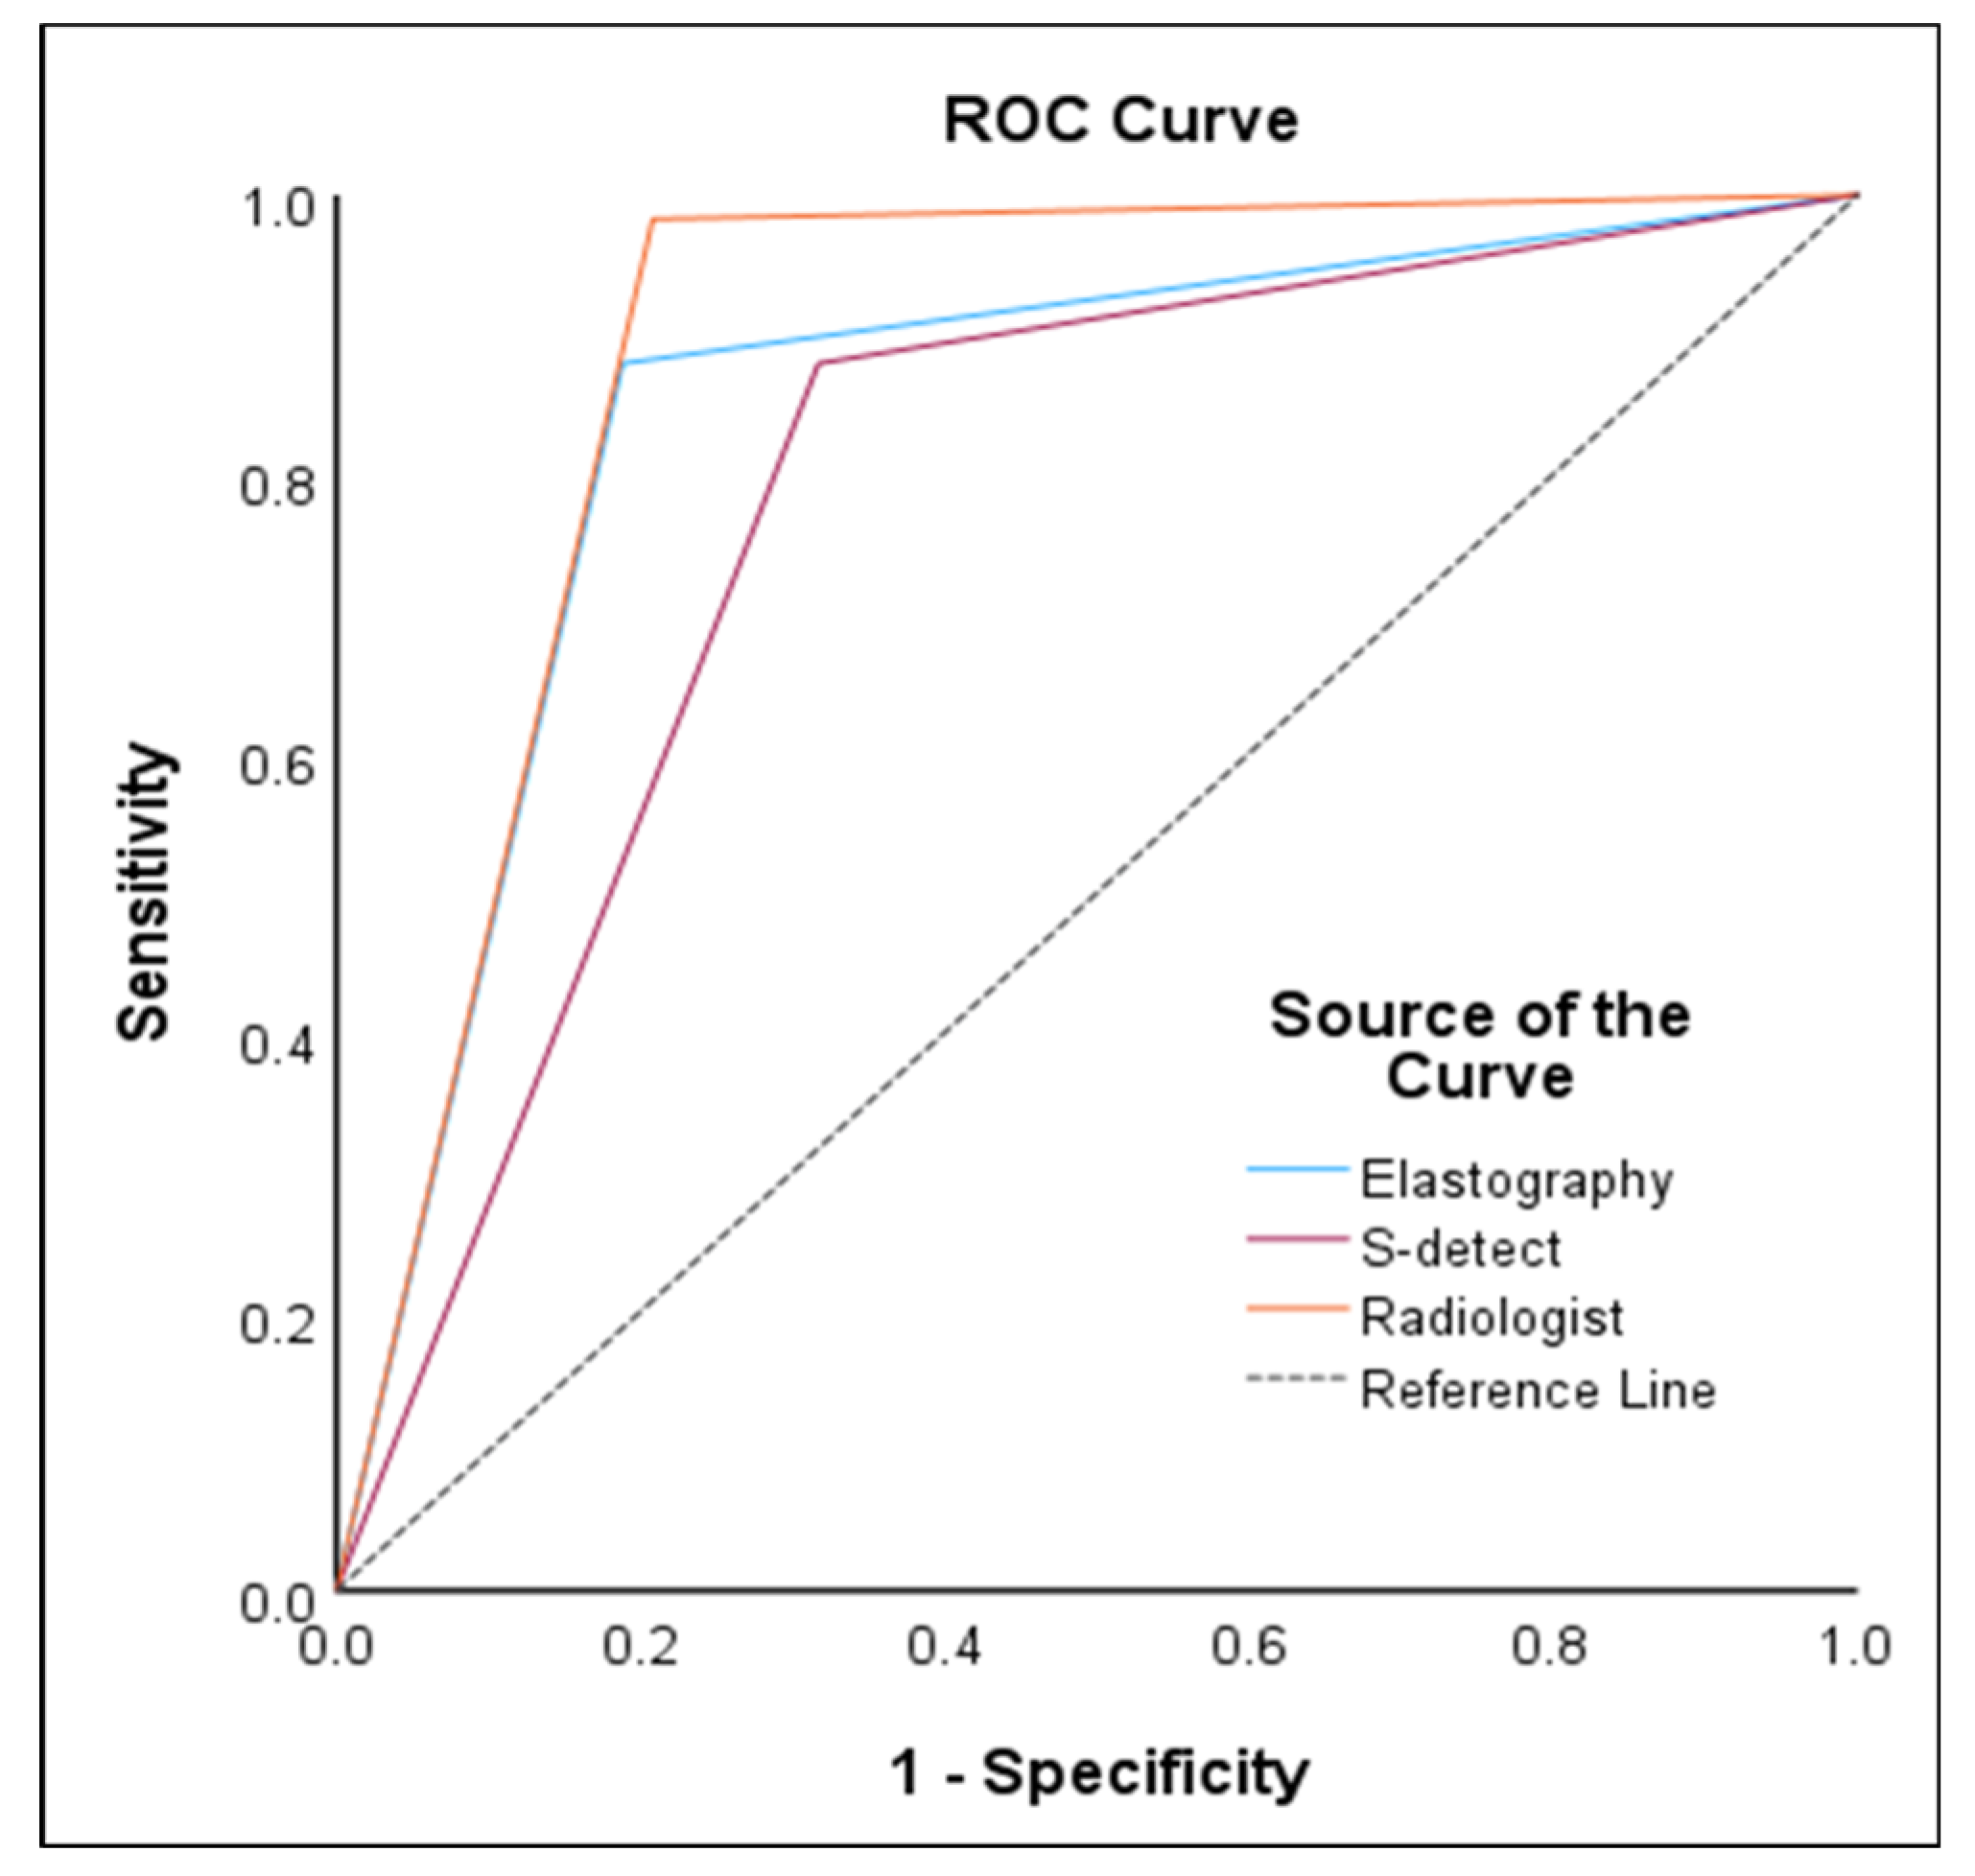

Table 1.
Comparison of characteristics between benign and malignant nodules (n=159).
| Variable | n(%) | Benign | Malignant | χ2/t | p Value | |
|---|---|---|---|---|---|---|
| Sex | Male | 61(38.4) | 36(22.7) | 25(15.7) | 0.87 | 0.352 |
| Female | 98(61.0) | 65(40.5) | 33(20.5) | |||
| Age(year) | 56.14±11.35 | 56.53±10.29 | 55.45±13.06 | 0.54 | 0.021 | |
| Size(cm) | 1.07±0.85 | 1.23±0.94 | 0.79±0.58 | 3.58 | 0.002 | |
| Composition | Solid | 146(91.8) | 89(56.0) | 57(35.8) | 5.12 | 0.077 |
| Predominantly solid | 11(6.9) | 10(6.3) | 1(0.6) | |||
| Predominantly cystic | 2(1.3) | 2(1.3) | 0(0.0) | |||
| Echogenicity | Hypoechogenicity | 119(74.8) | 62(39.0) | 57(35.8) | 26.63 | <0.001 |
| Isoechogenicity | 40(25.2) | 39(24.6) | 1(0.6) | |||
| Orientation | Parallel | 105(66.0) | 82(51.5) | 23(14.5) | 28.34 | <0.001 |
| Nonparallel | 54(34.0) | 19(12.0) | 35(22.0) | |||
| Margin | Circumscribed | 75(47.2) | 64(40.3) | 11(6.9) | 29.99 | <0.001 |
| Not circumscribed | 84(52.8) | 37(23.3) | 47(29.5) | |||
| Shape | Oval | 67(42.1) | 60(37.7) | 7(4.4) | 36.84 | <0.001 |
| Round | 34(21.4) | 19(12.0) | 15(9.4) | |||
| Irregular | 58(36.5) | 22(13.8) | 36(22.7) | |||
| Calcification | Presence | 111(69.8) | 82(51.6) | 29(18.2) | 17.00 | <0.001 |
| Absence | 48(30.2) | 19(12.0) | 29(18.2) | |||
| Posterior shadow | Presence | 131(82.4) | 89(56.0) | 42(26.4) | 6.26 | 0.012 |
| Absence | 28(17.6) | 12(7.5) | 16(10.1) | |||
| Total | 159(100) | 101(63.5) | 58(36.5) | |||
Unit: Person (%), Mean ± SD.
Table 2.
Evaluation of the diagnostics performed by S-detect, ECI, and a radiologist.
| Variable | AUC (95% CI) |
Sensitivity | Specificity | Youden Index |
PPV | NPV | p Value |
|---|---|---|---|---|---|---|---|
| S-detect | 0.78 (0.72–0.84) |
87.93 | 68.32 | 0.562 | 61.4 | 90.8 | <0.001 |
| ECI | 0.85 (0.79–0.90) |
87.93 | 81.19 | 0.773 | 72.9 | 92.1 | <0.001 |
| Radiologist | 0.89 (0.84–0.93) |
98.28 | 79.21 | 0.775 | 73.1 | 98.8 | <0.001 |
ECI, elasticity contrast index; AUC, area under curve; CI, confidence interval; PPV, positive predictive value; NPV, negative predictive value.
Table 3.
Diagnostic agreement of S-detect, ECI, and radiologist based on FNAC (n=159).
| Variable | Kappa | SE | 95% CI | p value |
|---|---|---|---|---|
| S-detect | 0.52 | 0.06 | 0.38~0.64 | <0.001 |
| ECI | 0.66 | 0.06 | 0.54~0.78 | <0.001 |
| Radiologist | 0.72 | 0.05 | 0.62~0.83 | <0.001 |
SE, standard error; CI, confidence interval; ECI, elasticity contrast index.
Disclaimer/Publisher’s Note: The statements, opinions and data contained in all publications are solely those of the individual author(s) and contributor(s) and not of MDPI and/or the editor(s). MDPI and/or the editor(s) disclaim responsibility for any injury to people or property resulting from any ideas, methods, instructions or products referred to in the content. |
© 2024 by the authors. Licensee MDPI, Basel, Switzerland. This article is an open access article distributed under the terms and conditions of the Creative Commons Attribution (CC BY) license (http://creativecommons.org/licenses/by/4.0/).
Copyright: This open access article is published under a Creative Commons CC BY 4.0 license, which permit the free download, distribution, and reuse, provided that the author and preprint are cited in any reuse.


