
Submitted:
08 November 2024
Posted:
12 November 2024
You are already at the latest version
Abstract
Food shortages in Perú, often caused by roadblocks on land communication routes due to demonstrations and seasonal variations, limit food production and contribute to scarcity, particularly in regions with limited agricultural land. To address this challenge, an automated control system and IoT architecture for wireless monitoring were developed to recreate specific climatic conditions within greenhouses, enabling the cultivation of crops typically restricted to certain regions. The control system regulates critical environmental parameters, including temperature, irrigation, and luminosity. Wireless monitoring of temperature, water level, luminosity, and pH within the greenhouse is achieved via radio frequency (RF) communication, with data transmitted to a database via WiFi. Real-time data visualization is enabled through a cross-platform application. A pilot-scale greenhouse was constructed to validate the proposed system. The implementation of the control system and IoT architecture effectively regulates environmental parameters and facilitates wireless monitoring, demonstrating its potential to enhance agricultural productivity and address food security concerns in Perú.
Keywords:
Greenhouse
; automatic control
; IoT
; radio frequency
; monitoring
1. Introduction
Food security is a critical issue facing many countries, particularly in regions where agricultural production is affected by climatic limitations or political instability. In Peru, road blockades due to political demonstrations often disrupt the supply of essential food products, leading to shortages and malnutrition. To address this challenge, it is crucial to develop innovative agricultural technologies that promote self-sufficiency and improve productivity. The shortage of greenhouses in Peru hinders agricultural production and contributes to food insecurity. Traditional agricultural methods are vulnerable to disruptions in transportation networks caused by political unrest, resulting in shortages of essential foods. The inability to grow food in climate-controlled conditions limits the availability of diverse products, especially in regions with limited agricultural land. This research project aims to develop and implement an automated control system and IoT architecture for wireless monitoring in greenhouses. The main objectives are:
- Establish an IoT architecture for wireless monitoring greenhouse parameters, including temperature, humidity, brightness, and pH.
- Implement an automated control system for regulating temperature and water level in hydroponic irrigation systems.
- Design and develop a user-friendly web application for real-time data visualization and parameter control.
- Validate the proposed system by constructing a pilot-scale greenhouse and evaluating its performance under controlled conditions.
The scope of this research encompasses the design, implementation, and validation of an IoT-enabled greenhouse monitoring and control system. The focus is on establishing a communication network among sensors, actuators, and a central controller, enabling real-time monitoring and automated parameter adjustment. The system will be designed to accommodate various greenhouse configurations and crop requirements.
Implementing an IoT-based greenhouse monitoring and control system has significant potential to address food security concerns in Peru. Enabling the self-sufficient cultivation of diverse crops under controlled conditions can help mitigate the impact of transportation disruptions and enhance agricultural productivity. This technology has the potential to improve food availability, reduce malnutrition rates, and contribute to economic growth in rural communities.
The article presented six sections. In the Section 1 presents the introduction. The Section 2 presents the related works. Section 3 describes the proposed methodology. Section 4 details the results. Section 5 is presented the discussions and Section 6 concludes and summarizes the achievement of the objectives of the article.
2. Related Works
Below are other articles that are related to this article. In [1] is presented research takes the IoT as the core and combines sensor, actuator and cloud platform technologies to build a smart greenhouse control system. Environmental parameters such as temperature, humidity, and light are obtained through sensors. In [2] is presented the Internet of Things (IoT) is a global network of interconnected computing, sensing, and networking devices that can exchange data and information via various network protocols. It can connect numerous smart devices thanks to recent advances in wired, wireless, and hybrid technologies. In [3] is presented the Internet of Things is currently one of the fastest-growing branches of computer science. The development of 5G wireless networks and modern data transmission protocols offers excellent opportunities for rapid development in this field. The article presents an overview of monitoring and control systems based on the Internet of Things. In [4] is presented in agriculture, IoT solutions according to the challenges for Industry 4.0 can be applied to greenhouses. Greenhouses are protected environments in which best plant growth can be achieved. IoT for smart greenhouses relates to sensors, devices, and information and communication infrastructure for real-time monitoring and data collection and processing, in order to efficiently control indoor parameters such as exposure to light, ventilation, humidity, temperature, and carbon dioxide level. In [5] is presented this paper, an IoT-based smart irrigation system is used for building a smart Management device that efficiently uses the available water. The purpose of this Management device is to automatically manage time, avoid under-irrigation and over-irrigation issues, streamline water consumption, and distribution and manage the water reserves. In this paper [6], we designed a smart IoT-enabled drip irrigation system using ESP32 to automate the irrigation process, and we tested it. The ESP32 communicates with the Blynk app, which is used to collect irrigation data, manually water the plants, switch off the automatic watering function, and plot graphs based on the readings of the sensors.
In the article of [7] is aimed at monitoring and storing data on soil moisture, temperature, pH, and luminosity through a cross-platform application. The article highlights the use of the XBee S2c module for wireless communication with the coordinating node through the Zigbee communication protocol and the Raspberry Pi Model B for uploading information to the database [7]. The system employs DHT sensors, Arduino boards, and Raspberry Pi 3 B+ boards. The software used enables database management, reporting, and alert delivery. The system meets the requirements of low cost and power consumption and is capable of displaying, analyzing, and alerting museum staff about the conditions in which collections are exhibited. A study of the environmental conditions in different rooms was conducted using a monitoring system with temperature and humidity sensors. The system was designed with three layers: a physical layer for measurement and transmission, a data acquisition layer, and a data management and processing layer in [10]. In the article [8] is presented an IoT system based on LoRaWAN was developed and evaluated as a precision irrigation tool in fresh-market tomato production within a plasticulture system. Four irrigation scheduling treatments were designed and tested, including irrigation based on crop evapotranspiration (ET), soil matrix potential sensors (Watermark 200SS-5) set to -60 kPa (MP60) or -40 kPa (MP40), and the GesCoN fertigation decision support system (DSS). The results suggest that the IoT system can be implemented for automatic and precision irrigation operations for vegetables and other horticultural crops, improving crop water use efficiency and sustainability in [8]. Additionally, the article [9] implements an automated irrigation system alongside an Android application that allows for manual motor control, enabling it to be switched on and off as an alternative. The implementation of this system utilizes an Arduino UNO, GSM modules, an Android application, and temperature and soil moisture sensors in [9].
The article aims to develop an automated control system and IoT architecture for wireless monitoring were developed to recreate specific climate conditions inside greenhouses, enabling the cultivation of crops normally restricted to certain regions. The control system regulates essential environmental parameters, including temperature, irrigation, and brightness. Wireless monitoring of temperature, water level, light, and pH inside the greenhouse is done using radio frequency (RF) communication, with data transmitted to a database via WiFi. Real-time data visualization was made possible through a cross-platform application. A pilot-scale greenhouse was built to validate the proposed system. The implementation of the control system and IoT architecture effectively regulates environmental parameters and facilitates wireless monitoring, demonstrating its potential to increase agricultural productivity and address food security concerns in Peru. This article aims to advance the development of IoT-enabled greenhouse monitoring and control systems, addressing the critical issue of food security in Peru. By enabling the cultivation of diverse crops under controlled conditions, the system has the potential to mitigate the impact of transportation disruptions, improve agricultural productivity, and enhance food availability in regions facing food shortages.
3. Methodology
This article presents the methodology to be used. Therefore, the General block diagram and the block diagram of the IoT architecture for monitoring are presented.
In Figure 1 is described the general block diagram of the project.
In Figure 2 is described the block diagram of the IoT architecture for monitoring
In Figure 3 is described the block diagram for the level control of a hydroponics tank.
In Figure 4 is described a block diagram for temperature control.
In Figure 5 is described a block diagram for hourly brightness control.
3.1. Materials Required for the Implementation of the Article
3.2. Mathematical Modeling and Simulation of Control Systems
3.2.1. Mathematical Model of the Level Control System
Figure 6 below shows the filling and draining scheme of a tank.
Therefore, the resulting expression of the Equation of Obtained Motion (EOM), considering the mass balance applied to the water level in the tank, is:
Where:
- water height in the tank
- tank base area
- Tank inlet flow rate
- tank outlet flow rate
It is assumed that the inlet volumetric flow rate to the tank is directly proportional to the current applied to the pump, so we have:
In addition, according to Bernoulli’s equation for small orifices, it is possible to obtain the tank outlet velocity.
Thus, the volumetric flow rate out of the tank is expressed as:
Where:
- tank outlet orifice area
- tank outlet flow velocity
From the figure of the tank, the following equations are defined:
Since the area of the base of the tank is constant, the equation develops as follows:
From Equations (2) and (4), the above expression is rewritten as:
Finally, replacing Equation (3) in the previous expression:
LINEARIZATION: From Equation (5), which defines the tank, the term is calculated by deriving Equation (5) and evaluating at an average height of 15 cm. The linearized system has the form:
System parameters:
- cm
- = 0.2827
In addition, by Laplace transform the equation is obtained:
3.2.2. Simulation and Auto-Tuning of the PI Controller for the Level Control System
To perform the auto-tuning of the PID controller it is possible to use the Tune function of the Simulink software, this function provides estimated values of the PID according to the established transfer function, and it is also possible to observe a change depending on the desired response time. The block diagram is presented below in Figure 7:
In this program there is a block designated as PID(s), in Figure 8 is presented this block is where the configuration of the tune is performed, in addition to making changes to the PID values to observe the result in simulation.
The values obtained, as well as the response time of the controller with these values, are presented below in Figure 9.
The proportional value of the controller allows the controller output to adjust proportionally to the current error. For instance, if the difference between the setpoint and the actual value is 1 unit, the proportional action will generate a controller output of 70 units. Meanwhile, the integral value of the controller is responsible for accumulating the error over time. The value obtained from the PID tuning indicates that the integral of the error will be multiplied by to adjust the controller output.
Based on observations from the simulation, the system response shows an overshoot of approximately 1% and a settling time of around 4 minutes.
3.2.3. Temperature Control System Control Logics
Fuzzy control allows for expressing logical values between true and false. For decision making and system control, it utilizes fuzzy logic, meaning decisions are made based on various variables using approximate or fuzzy rules. These rules are used to make decisions in different scenarios, which are evaluated through a degree of truthfulness by comparing the rules and the established input. The fuzzy controller has two main characteristics that support its selection as a control system. First, it does not require a detailed mathematical model of the system for design. Additionally, a fuzzy controller involves minimal computational load in [12]. The fuzzy controller design is applied in a temperature control system using a Peltier cell. This Peltier cell operates over a current range of 0 to 3.2 amps, where 0 amps represent the minimum temperature, and 3.2 amps represents the maximum temperature. In this control system, the control action is represented by a PWM signal (0 to 255 pulses) generated by the Arduino UNO, allowing adjustment of the current range required for Peltier cell operation. The temperature sensor used is the DHT21 model. Inputs to the fuzzy controller are determined from the difference between the temperature setpoint established in the greenhouse and the temperature measured at a specific moment, as well as the rate of change of that difference. This enables the controller to effectively adjust the output to maintain the greenhouse temperature at the desired level. Based on this theory, the following rules were applied for temperature control using fuzzy logic in Table 4:
These rules presented control the PWM response given to the driver based on the value recorded in the temperature sensor, below is the graphical representation of the rules presented in Figure 10.
The figure below shows the configuration of the controller outputs represented with a PWM signal (). Three possible controller outputs are configured, which will be selected according to the decision of the fuzzy controller, considering the rules established above in Figure 11.
Likewise, the rules are assigned a weight, and the resolution of these rules is established:
- If the measured temperature is in the "LowTemp" range, then the controller output will be "highPeltier" ().
- If the measured temperature is in the "MedTemp" range, then the controller output will be "medPeltier" ().
- If the measured temperature is in the "HighTemp" range, then the controller output will be "lowPeltier" ().
The Figure 12 presents fuzzy controller rules.
Figure 13 below shows the response of the controller to different temperature values, considering the rules described above. The setpoint considered in the control system is . According to the simulation before this temperature, the controller output will be 220 pulses.
3.3. Electronic Design
3.3.1. Emitter Module
The transmitter module represents the initial stage in the process of real-time parameter monitoring. The purpose of this module is to measure water pH, temperature, humidity, luminosity, and water level, and then transmit these readings via a radiofrequency module to a remote receiver. Monitoring the water level is essential, as a hydroponic irrigation system is being considered, where the water is maintained at a preset level (setpoint) and flows continuously to prevent stagnation.
The transmitter module includes an Arduino Uno programming board, an NRF24L01 RF module, an AM2302 temperature sensor, an HC-SR04 ultrasonic sensor, a PH-4502C pH sensor, and a BH-1750 luminosity sensor. The actual wiring of the transmitter module is shown below in Figure 14.
In addition, the schematic diagram of the emitter module is shown below, according to the actual connection with its respective pins. Figure 15 presents Schematic diagram of the emitter module.
From the datasheet of the RF module NRF24L01 from NORDIC SEMICONDUCTOR, Table 5 describes the function of the pins used for data transmission.
Data transmission via the MOSI (Master Out Slave In) pin is a unidirectional operation used in devices that follow the SPI communication protocol. In this protocol, the master device (Arduino) sends data to the slave device (NRF24L01). After correctly configuring the pins, the Arduino sends a clock pulse on the SCK pin. With each clock pulse, the least significant bit of the data in the output register is placed on the MOSI pin. If the bit is 1, the MOSI pin goes high; if the bit is 0, the MOSI pin goes low. This process repeats for each bit of data. Besides collecting data from sensors, the Arduino receives a reset command from the web application, which does not interfere with the normal operation of the system. Once the data transmission is complete, the CSN pin is set high, signaling to the NRF24L01 module that the transfer has finished and the module can process the received information.
3.3.2. Receiver Module
The purpose of this module is to receive data from the sender module and transmit this data to a database and a web application. An Arduino UNO was used as the programming board for this module, an NRF24L01 was used as RF module, and additionally, a Raspberry Pi 4B was used to send the data received from the transmitter to a database so that these data can be viewed in a web application.
Figure 16 presents the actual connection diagram of the receiver module.
Figure 17 presents a schematic diagram of the receiver module.
3.3.3. Control Module
This module manages the water supply control for the main tank based on data from the ultrasonic sensor, which measures the water level and, using PID control adjusts the intensity supplied to the water pump via an L298N driver. The pump operates at a voltage level of 12V, requiring a power source that can provide this voltage. Lighting control utilizes a ZS-042 RTC1 clock module, which regulates the light intensity in the prototype at specific times of the day through automatic monitoring. Operation times are present in the code, and when the module registers a specified time, the light intensity is adjusted by the L298N driver. The system uses an Arduino UNO board for control and code implementation. Additionally, temperature control is managed using a separate Arduino UNO and a Peltier cell. This cell adjusts the temperature via a VHN2SP30 motor shield, which modulates a PWM signal through fuzzy control embedded in the Arduino code. This shield is chosen due to the amperage limitations of the L298N drivers. Fans circulate air, helping to distribute the temperature generated by the Peltier cell.
Figure 18 presents an actual wiring diagram of the control module.
3.4. Mechanical Design
3.4.1. Pilot Prototype
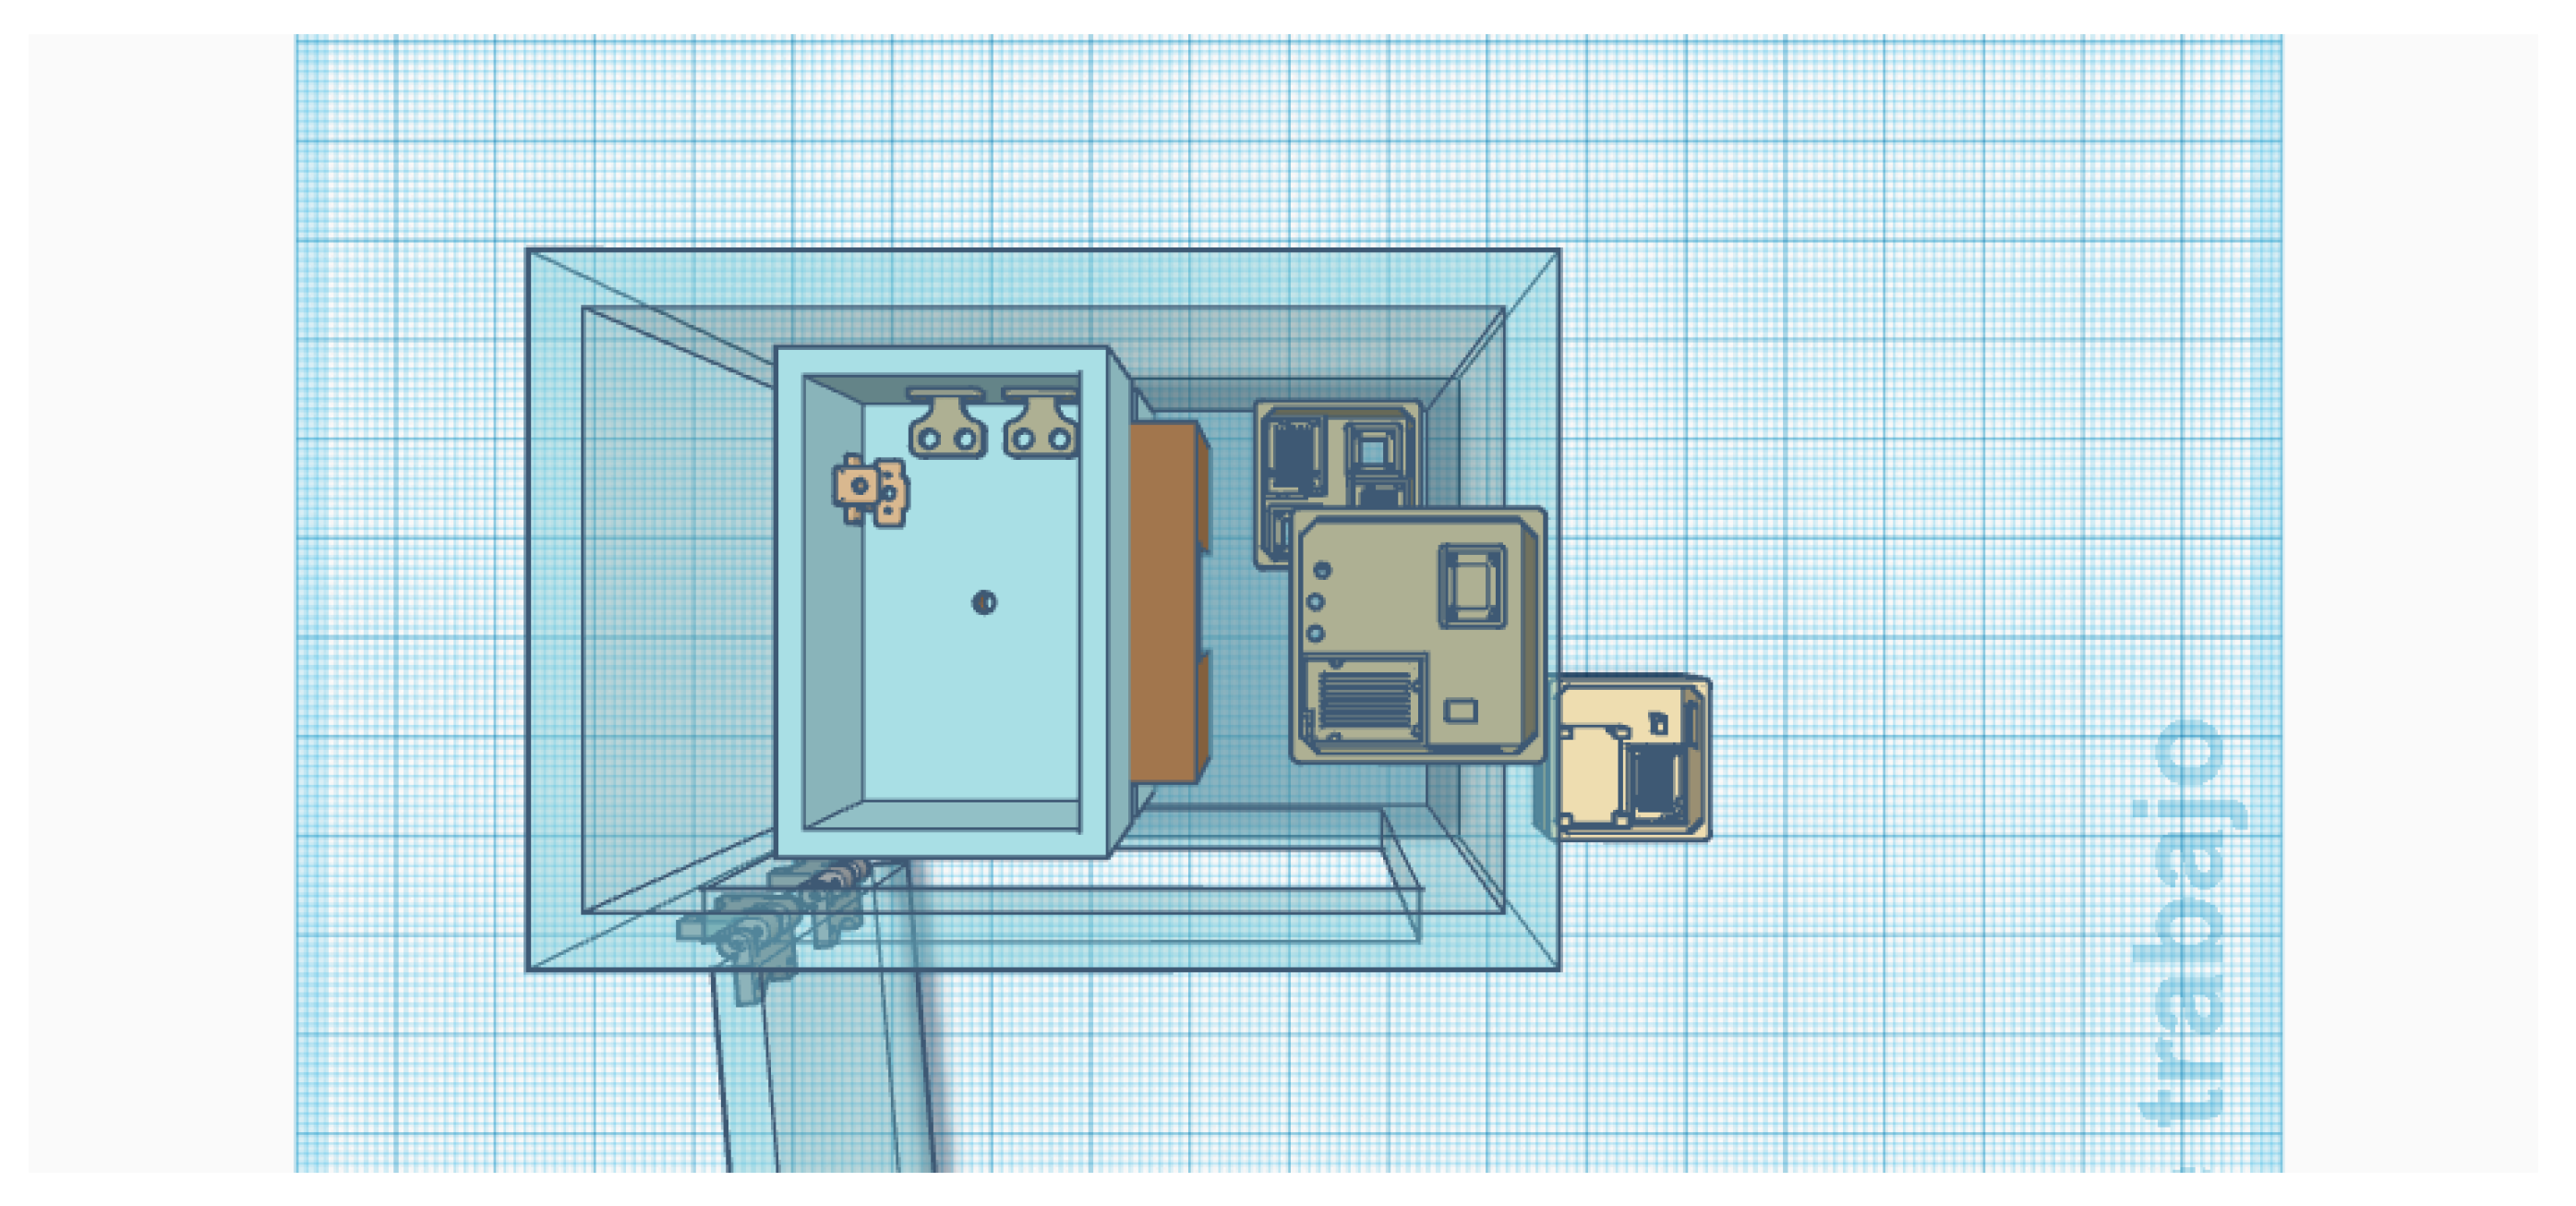
The figures below show, from different perspectives, the plan of the pilot prototype implemented to validate the research project. This design was made in the free software Tinkercad.
Figure 22.
Top view of the pilot prototype.
3.4.2. Module Structures
Emitter module holder
Similar to the supports designed for the sensors, a support was designed for the emitter module on which all the components related to this module will be placed. The figures below show this design from different perspectives. The support was designed in Tinkercad software and 3D printed with an Artillery Genius Pro 3D printer.
Figure 24 presents the top view of the emitter module.
Figure 23.
Top view of the emitter module.

Receiver module holder
Likewise, support was designed for the receiver module on which all the components related to this module will be placed. The figures below show this design from different perspectives. The bracket was designed in Tinkercad software and 3D printed with an Artillery Genius Pro 3D printer.
Figure 24 presents the top view of the receiver module
Support for control module
Similarly, a support was designed for the control module on which all the components of this module will be placed. Holes were drilled in the lower part of this support for better ventilation of the components of this module. The figures below show this design from different perspectives. The support was designed in Tinkercad software and 3D printed with an Artillery Genius Pro 3D printer.
Figure 25 presents the top view of the control module.
3.5. Software Design
3.5.1. Programming for the Transmitter Module
Figure 26 presents the receiver module flow diagram.
Figure 27 presents the programming for the receiver module
3.5.2. Programming for Sending Data to the Database and Web Application
To start the Python code, it is necessary to start the code by connecting it directly to the power source, for this, it is necessary to tell the Raspberry that you need to start the code once it starts, it is necessary to add a line of code to the source code of the Raspberry system. This code forces the Raspberry to start the program with that name once the device is turned on. The Raspberry receives the sensor readings of the pilot prototype from the receiving Arduino via serial communication. The Raspberry then sends the acquired data to a Web Server hosted on PythonAnywhere. From there, the data is written to the database, and the data is sent to the web application. The server is hosted on PythonAnywhere, which provides a free infrastructure for deploying Python applications. The Raspberry Pi connects to the server to send greenhouse monitoring data from the sensors. The server processes this data, forwarding it to both the database and the web application for real-time display and analysis. The database logs events and stores historical data in an SQL table with columns for a unique identifier (ID), date and time of entry, pH level, temperature, luminosity, and water level. For the web application’s interface, Pusher was used with HTML and JavaScript. Pusher is installed on both the server and web application, allowing data in the web interface to update automatically whenever there are changes on the server. Additionally, the Raspberry Pi calls the function on the server, which triggers Pusher to execute the "update" function through the "parameters" channel, enabling real-time data updates in the web application.
Figure 28 presents a flowchart for sending data to the database and Web application
3.5.3. Programming for the Control Module
Figure 29 presents a flow diagram of the control module
4. Results
4.1. Explanation of the Construction of the Pilot Prototype
For the construction of the pilot prototype, a 3 mm acrylic sheet was used for the construction of the walls, base, and roof. Likewise, an MDF sheet was used to support the base. Aluminum angles were used to give better support to the corners of the structure. Two plastic containers were used, one of them will be located at the bottom and will function as a water reservoir, the second one will be located above it, and on it will be the lettuce, as well as the PH and ultrasonic sensor. An MDF base was built to support the second tank on top of the first one. In addition, a door was made in the front part of the prototype for better handling of the sensors inside.
Figure 30 presents the construction of the pilot prototype.
Figure 31 presents the pilot prototype in operation.
Figure 32 presents a temperature and ventilation control system.
Figure 33 presents a level control system.
Figure 34 presents a level and pH monitoring system.
4.1.1. Testing of the Level Control with Setpoint 5 cm
The actual response of the level control system is shown below. The comparison between the simulated response in Simulink and the real response of the level control system shows that the settling time and overshoot maintain good agreement. Water level measurements were acquired from the Arduino serial port over a period of seven minutes; thus, a graph was drawn as a function of water level in centimeters and time. In the simulation, a settling time of approximately 5 minutes and an overshoot of % were obtained, while in the real system, values of 3:46 minutes and an overshoot of 14% were obtained. The slight variation in the overshoot may be due to disturbances not considered in the system modeling, such as the noise introduced by the ultrasonic sensor used for the measurement. The observed differences are minimal and do not significantly affect the overall behavior of the system. Thus, the validity of the model proposed for the simulation is confirmed.
Figure 35 presents a temporal response of the level control system (SP: 5 cm).
Figure 36 presents the simulation of the time response of the level control system (SP: 5 cm).
4.1.2. Testing of Level Control with Setpoint 8 cm
The figure below shows the time response of the level control system to a setpoint of 8 cm, which was implemented with a PI controller. According to the time response, the system has no overshoot and has a settling time of approximately 9 minutes. On the other hand, the simulation shows an establishment time of 5 minutes and 48 seconds and an overshoot of 7.5%.
Figure 37 presents Temporal response of the level control system (SP: 8 cm).
Figure 38 presents a simulation of the time response of the level control system (SP: 8 cm).
4.1.3. Testing of Fuzzy Temperature Control with Setpoint
The figure below shows the time response of the temperature control system to a set point of , which was implemented with a fuzzy controller. According to the time response, the system has no overshoot and has a settling time of approximately 30 minutes. This long settling time may be due to several factors, such as ambient temperature, Peltier cell dimensions, and heatsink dimensions.
Figure 39 presents temporal response of the temperature control system (SP: ).
The graph Figure 40 below shows the operating ranges, pulses, and current, of the Peltier cell at different temperature measurements.
4.2. Tests Performed on the Web Application
The web application is used for real-time monitoring of environmental parameters obtained from sensors that are connected to the Arduino. The lines of code are executed and sent to the Raspberry, which in turn sends it to the database for logging, allowing to observe the measured results. Additionally, there is a remote restart function in case of failure or data saturation, thus ensuring a reliable and continuous flow of data. The web application can be used on any mobile device. A temperature setpoint of and a water level of 8 cm were established, obtaining actual measured values of and 7.95 cm at the water level. Likewise, the application allows monitoring pH, luminosity, and humidity values, obtaining measurements of 7.8, 170 Lx, and 41.4%, respectively. The application has a button in the central part that indicates "Reset Device". This button allows the receiver module to be reset from the web application.
5. Discussions
Having completed the research project and carried out the respective tests and validation with the prototype in a pilot scale, the following observations have been made that could be useful to improve the research project. The first observation is oriented to the use of ultrasound sensors. These sensors produce many peaks in their measurement, resulting in inaccurate measurements. For future work, it is suggested to use more accurate level measurement sensors, such as hydrostatic pressure type level sensors, which provide a more precise measurement. Hydroponic pots designed in 3D are suitable for the cultivation of lettuce, since its root is not of great extension, as well as its leaves. In this sense, if you want to grow a different species, it will be necessary to consider these dimensions. On the other hand, the display and updating of data in the web application stand out, with an update rate of 500 ms. In this type of application, a short update time is not required, since the measured parameters show a slow evolution. Thus, in the work of Gar-cía Cortés an update rate of 5 minutes is presented in [11]. With respect to the RF modules used, NRF24L01, it was observed that they present difficulties in transmission at low temperatures and at distances with obstacles in the transmission path in the line of sight. To solve this problem, it is recommended to use another RF module with LoRaWAN technology, as is the case of the work of Guillermo [7]. This technology covers a distance of several kilometers, even up to 10 km, and is designed to operate with low power consumption [7]. Regarding the results obtained in the tests performed, temperature, level, pulses, and amperage responses were obtained, which present certain differences with respect to the simulations. This is due to the fact that there are environmental conditions or external factors that compromise the obtaining of data in an appropriate manner. In addition, the simulations are ideal situations that are not compromised by any external factor. However, despite these variations, the actual results behave similarly to the simulations, except for minor perturbations.
The article was validated with the construction of a pilot-scale prototype, which is adapted, as well as the parameters configured in sensors and actuators, for the hydroponic cultivation of lettuce. On the other hand, during the implementation and construction of the pilot prototype, it was determined that the radio frequency communication modules suitable for the application are the NRF24L01, considering the practicality of connection with the development board, which is Arduino UNO, accessibility, its range in meters, and its price in the market. However, for other applications, the use of another antenna is recommended. In addition, the actuators used for temperature control were selected: a Peltier cell for water level, a 12 VDC water pump; and for luminosity, LED strips. Similarly, sensors were selected for temperature monitoring: DHT21 sensor; for water level, ultrasonic sensor; for luminosity, BH1750 luxmeter; and for pH, PH4502C sensor. All these parameters were adapted and configured in the appropriate range for hydroponic lettuce cultivation. For later work, if it is desired to grow another plant, it will be necessary to modify the parameters in the appropriate range. Likewise, the correct operation of the RF communication between the transmitter and receiver modules was implemented and tested, with the NRF24L01 RF modules, so that the transmitted data is visualized in the designed web application via WiFi connection through the use of the Raspberry Pi 4B development board. Thermal insulation is recommended to ensure the proper operation of the RF module at low temperatures. Also, with respect to the NRF24L01 RF module, it is recommended that the connection of the RF module to the Arduino should be made with twisted wire. In addition, it is recommended to use a 100 nF ceramic capacitor in order to guarantee a constant 3.3 V power supply to the module. On the other hand, in future work, it is recommended to use level sensors different from the ultrasonic sensor, since these generate peaks and, consequently, noise is introduced into the circuit. The presence of external factors is evidenced at the time of testing compared to the simulations; however, these results behave similarly and show that the responses are adequate, presenting a future possibility of implementing improvements to the project by considering these external factors in the simulation.
Finally, regarding temperature control, it is recommended to perform additional tests to identify the temperature range present in the area where it is implemented. From this analysis, it will be possible to obtain new rules or more precise values adapted to the environment, with which to modify the previous rules or add more rules in the future. Additionally, the use of heat sinks of the same size is recommended for adequate temperature transmission. Future work will include the additional function of configuring the setpoint of the control systems from the web application.
6. Conclusions
After the completion of the research project, the implementation of an automatic control system for a greenhouse was achieved. Likewise, through the implementation of an IoT architecture, wireless monitoring was achieved by means of RF and WiFi communication of the parameters necessary for the operation of the greenhouse. This ensures the formation of specific microclimates and adds value to the problem of the lack of greenhouses that causes food shortages in the region. The data collected through monitoring are recorded in the cloud and displayed in a web application.
The database was implemented using the SQLite engine for storing and sending data. It should be noted that the database requires a specific restart or reboot every 3 months; otherwise, the database will not work. The receiver restart was implemented by means of lines of code and a button on the web page, thus demonstrating the bidirectional communication of the program. Finally, in the control stage, the mathematical model of the tank system and tuning of a PI controller for the water level in the hydroponic tank was performed using the PID Tune tool of Simulink. Also, the control system presents feedback through the reading of an ultrasonic level sensor. Likewise, an open-loop control system was implemented for the brightness parameter and a fuzzy control for the temperature. LED strips were used for brightness control, which will be on for 11 hours a day. Meanwhile, the monitoring of this parameter was carried out by means of a BH1750 lux meter sensor, with which an approximate measurement of 288 Lx was obtained. Similarly, for temperature control, a Peltier cell was configured to work continuously, maintaining the temperature in a range of 20°C at low power and at maximum power, considering that the optimum temperature range for the lettuces is to .
Author Contributions
For research articles with several authors, a short paragraph specifying their individual contributions must be provided. The following statements should be used I.M.P.C., E.J.R.C., F.P.S.C. and G.A.E.E., conceived and designed the study; I.M.P.C., E.J.R.C., F.P.S.C. G.A.E.E. were responsible for the methodology; I.M.P.C., E.J.R.C. and F.P.S.C. performed the simulations and experiments; I.M.P.C., E.J.R.C., F.P.S.C., E.R.L.V. reviewed the manuscript and provided valuable suggestions; I.M.P.C., E.J.R.C., A.O.S. and E.R.L.V. wrote the paper; G.A.E.E. and A.O.S. were responsible for supervision. All authors have read and agreed to the published version of the manuscript.
Acknowledgments
We thank the National University of San Agustín, our alma mater, for please provide us with the necessary knowledge to carry out this project.
Conflicts of Interest
The authors declare no conflicts of interest.
Abbreviations
The following abbreviations are used in this manuscript:
| EOM | Equation of Obtained Motion |
| PI | Proportional Integral |
| PID | Proportional Integral Derivative |
| MOSI | Master Out Slave In |
References
- Song, Y. C.; Bi, J.; Wang, X. Design and implementation of intelligent monitoring system for agricultural environment in IoT. Internet of Things, 2024, 25, 101029. [Google Scholar] [CrossRef]
- Mansour, M.; Gamal, A.; Ahmed, A.I.; Said, L.A.; Elbaz, A.; Herencsar, N.; Soltan, A. Internet of Things: A Comprehensive Overview on Protocols, Architectures, Technologies, Simulation Tools, and Future Directions. Energies, 2023, 16, 3465. [Google Scholar] [CrossRef]
- Witczak, D.; Szymoniak, S. Review of Monitoring and Control Systems Based on Internet of Things. Appl. Sci., 2024, 14, 8943. [Google Scholar] [CrossRef]
- Bersani, C.; Ruggiero, C.; Sacile, R.; Soussi, A.; Zero, E. Internet of Things Approaches for Monitoring and Control of Smart Greenhouses in Industry 4.0. Energies, 2022, 15, 3834. [Google Scholar] [CrossRef]
- Tephila, M. B. ; Sri, R. A. ; Abinaya, R. ; Lakshmi, J. A. ; Divya, V. Automated Smart Irrigation System using IoT with Sensor Parameter, 2022 International Conference on Electronics and Renewable Systems (ICEARS), Tuticorin, India, 2022, 543–549. [CrossRef]
- Pereira, G.P.; Chaari, M.Z.; Daroge, F. IoT-Enabled Smart Drip Irrigation System Using ESP32. IoT , 2023, 4, 221–243. [Google Scholar] [CrossRef]
- Guillermo, J.C. ; García-Cedeño, A. ; Rivas-Lalaleo, D. ; Huerta, M. ; Clotet, R. (2019). IoT Architecture Based on Wireless Sensor Network Applied to Agricultural Monitoring: A Case of Study of Cacao Crops in Ecuador. In: Corrales, J., Angelov, P., Iglesias, J. (eds) Advances in Information and Communication Technologies for Adapting Agriculture to Climate Change II. AACC 2018. Advances in Intelligent Systems and Computing, vol 893. Springer.
- Zhang, H.; He, L.; Gioia, F. D.; Choi, D.; Elia, A.; Heinemann, P. LoRaWAN based internet of things (IoT) system for precision irrigation in plasticulture fresh-market tomato. Smart Agricultural Technology , 2022, 2, 100053. [Google Scholar] [CrossRef]
- Guntur, J.; Srinivasulu Raju, S.; Jayadeepthi, K.; Sravani, C.H. An automatic irrigation system using IOT devices. Materials Today: Proceedings , 2022, 68, 2233–2238. [Google Scholar] [CrossRef]
- Garcia, D. C. ; Martinez, SG. A. ; Garcia, M.E. Raspberry Pi y Arduino: semilleros en innovación tecnológica para la agricultura de precisión.Informatica y Sistemas, 2018, 2(1), 72–84. https://citt.itsm.edu.mx/ingeniantes/ articulos/ingeniantes6no2vol2/9.
- García Cortés, J.J. ; Chávez Orendain, G. ; Erick Yovanny Fajardo Gómez, E. Y. ; Sahagún Benítez, J.R. Sistema inalámbrico portátil de bajo costo para monitoreo de las variables temperatura y humedad relativa en un invernadero. Revista Ingeniantes, 2019, 2(2),61–67.
- Jimenez Moreno, R.; Aviles Sanchez, O.; Ramos Sandoval, O.L. Implementation analysis of a controller over different hardware tools. Ciencia e Ingenieria Neogranadina, 2013, 23(1),77–87.https://revistas.unimilitar.edu.co/ index.php/rcin/article/download/233/1870?inline=1.
Figure 1.
General block diagram.
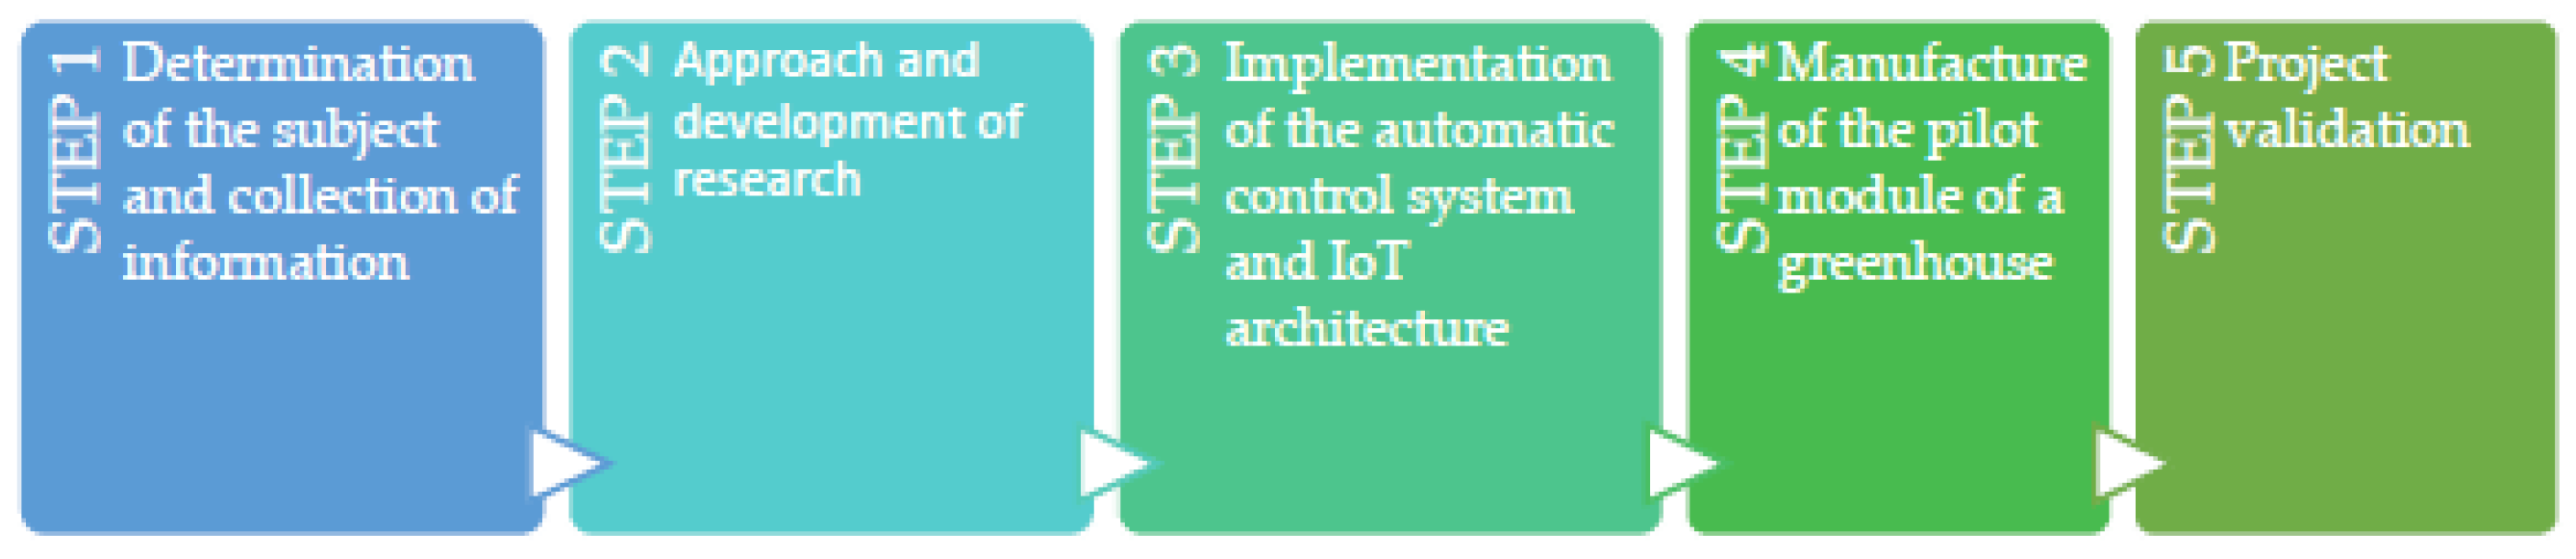
Figure 2.
Block diagram of the IoT architecture for monitoring.
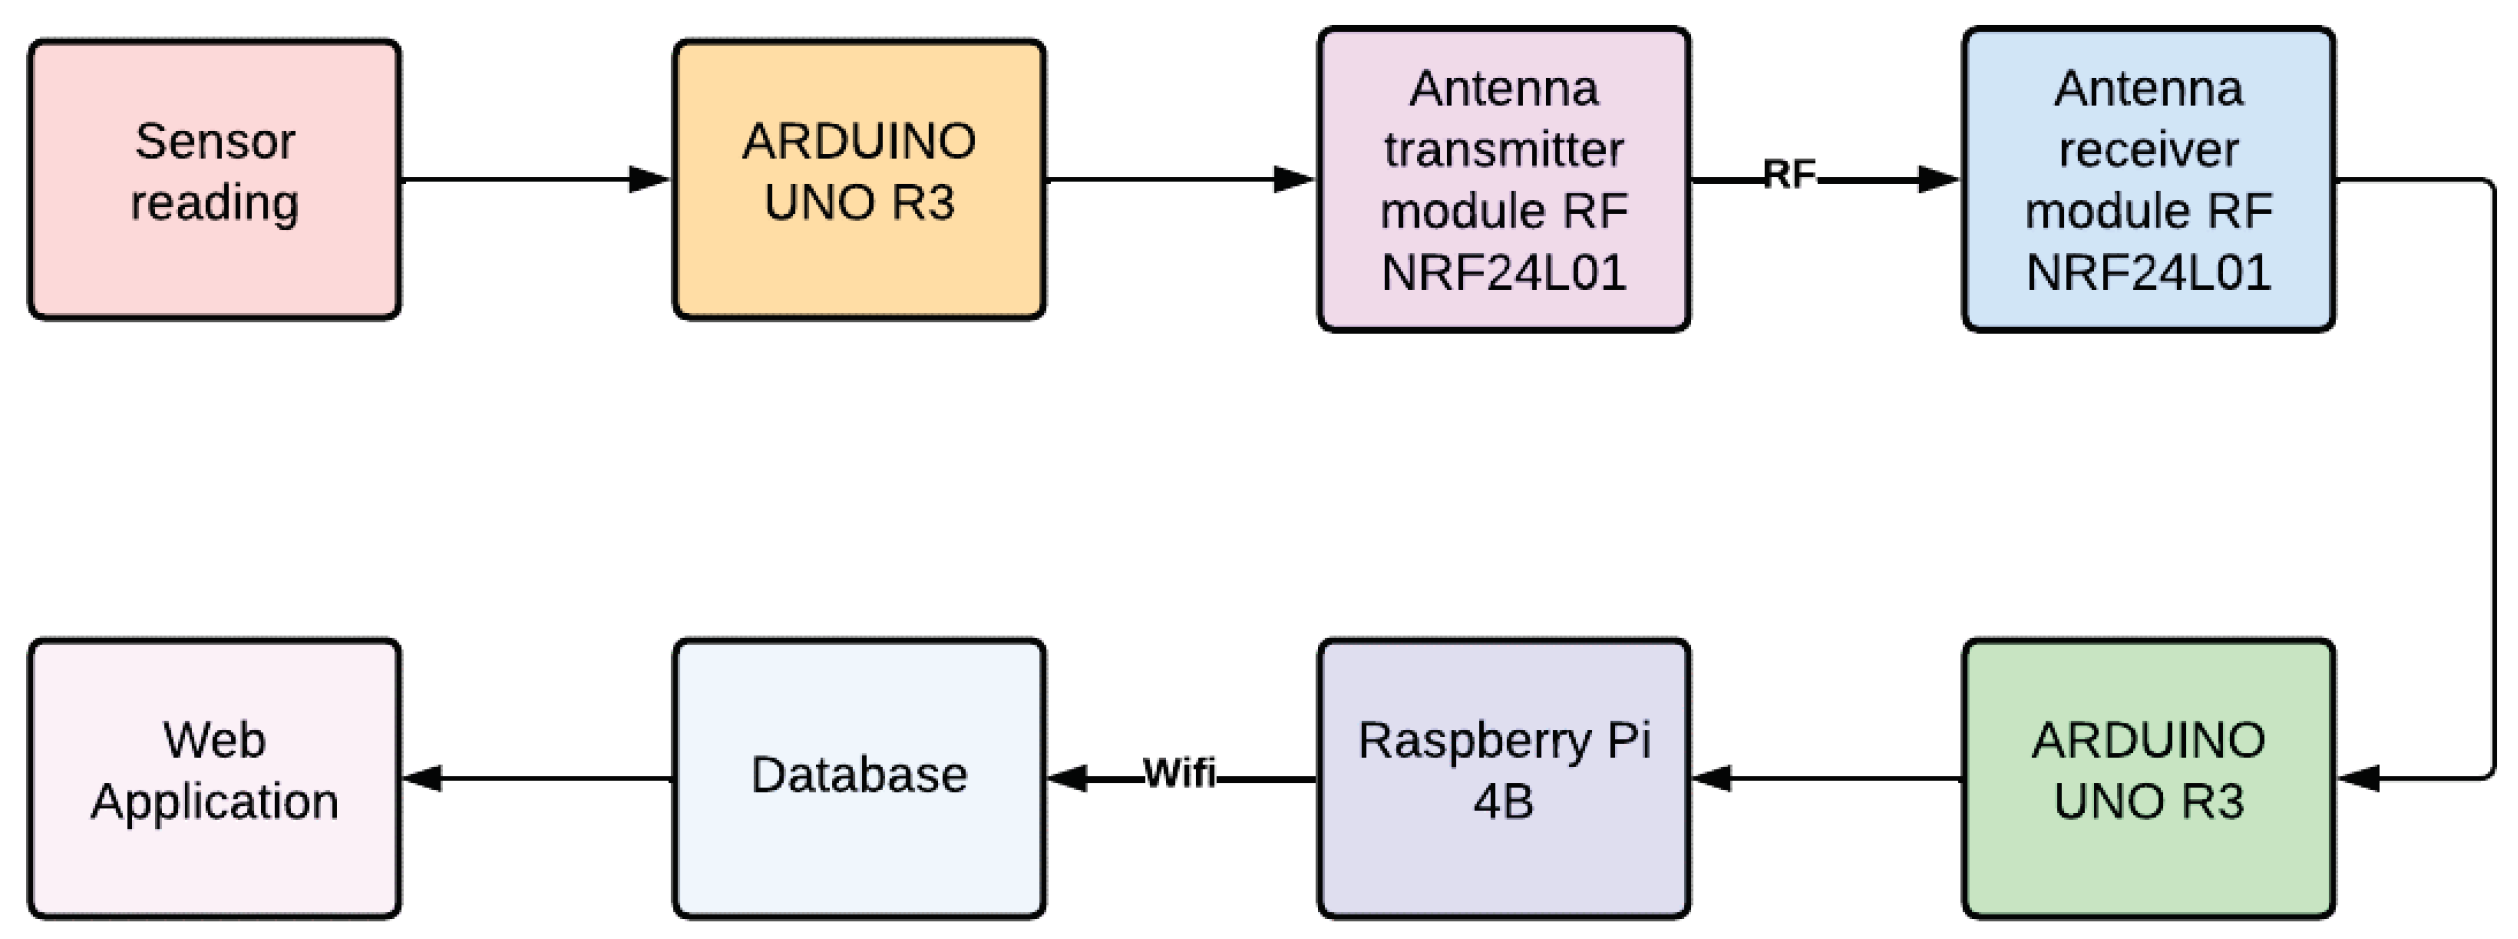
Figure 3.
Block diagram for level control of a hydroponics tank.
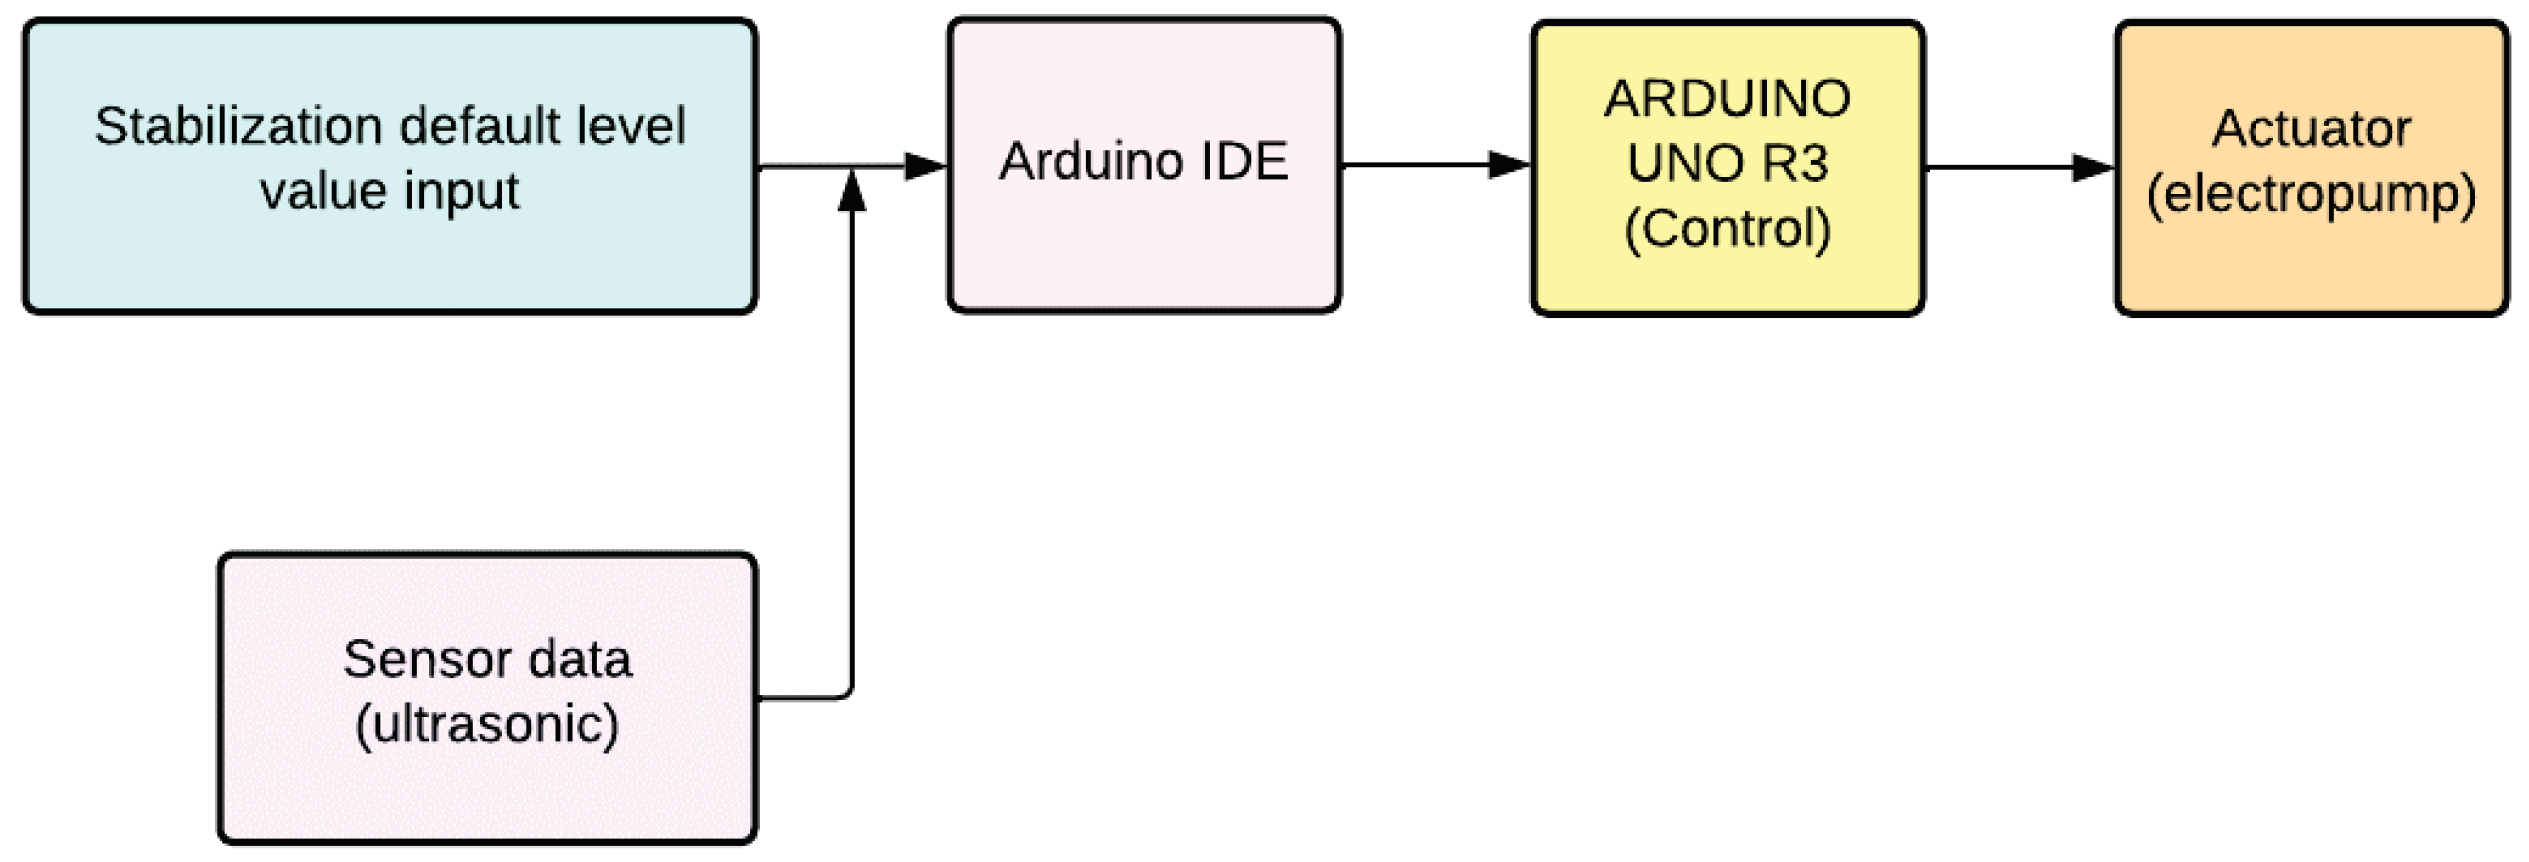
Figure 4.
Block diagram for temperature control.
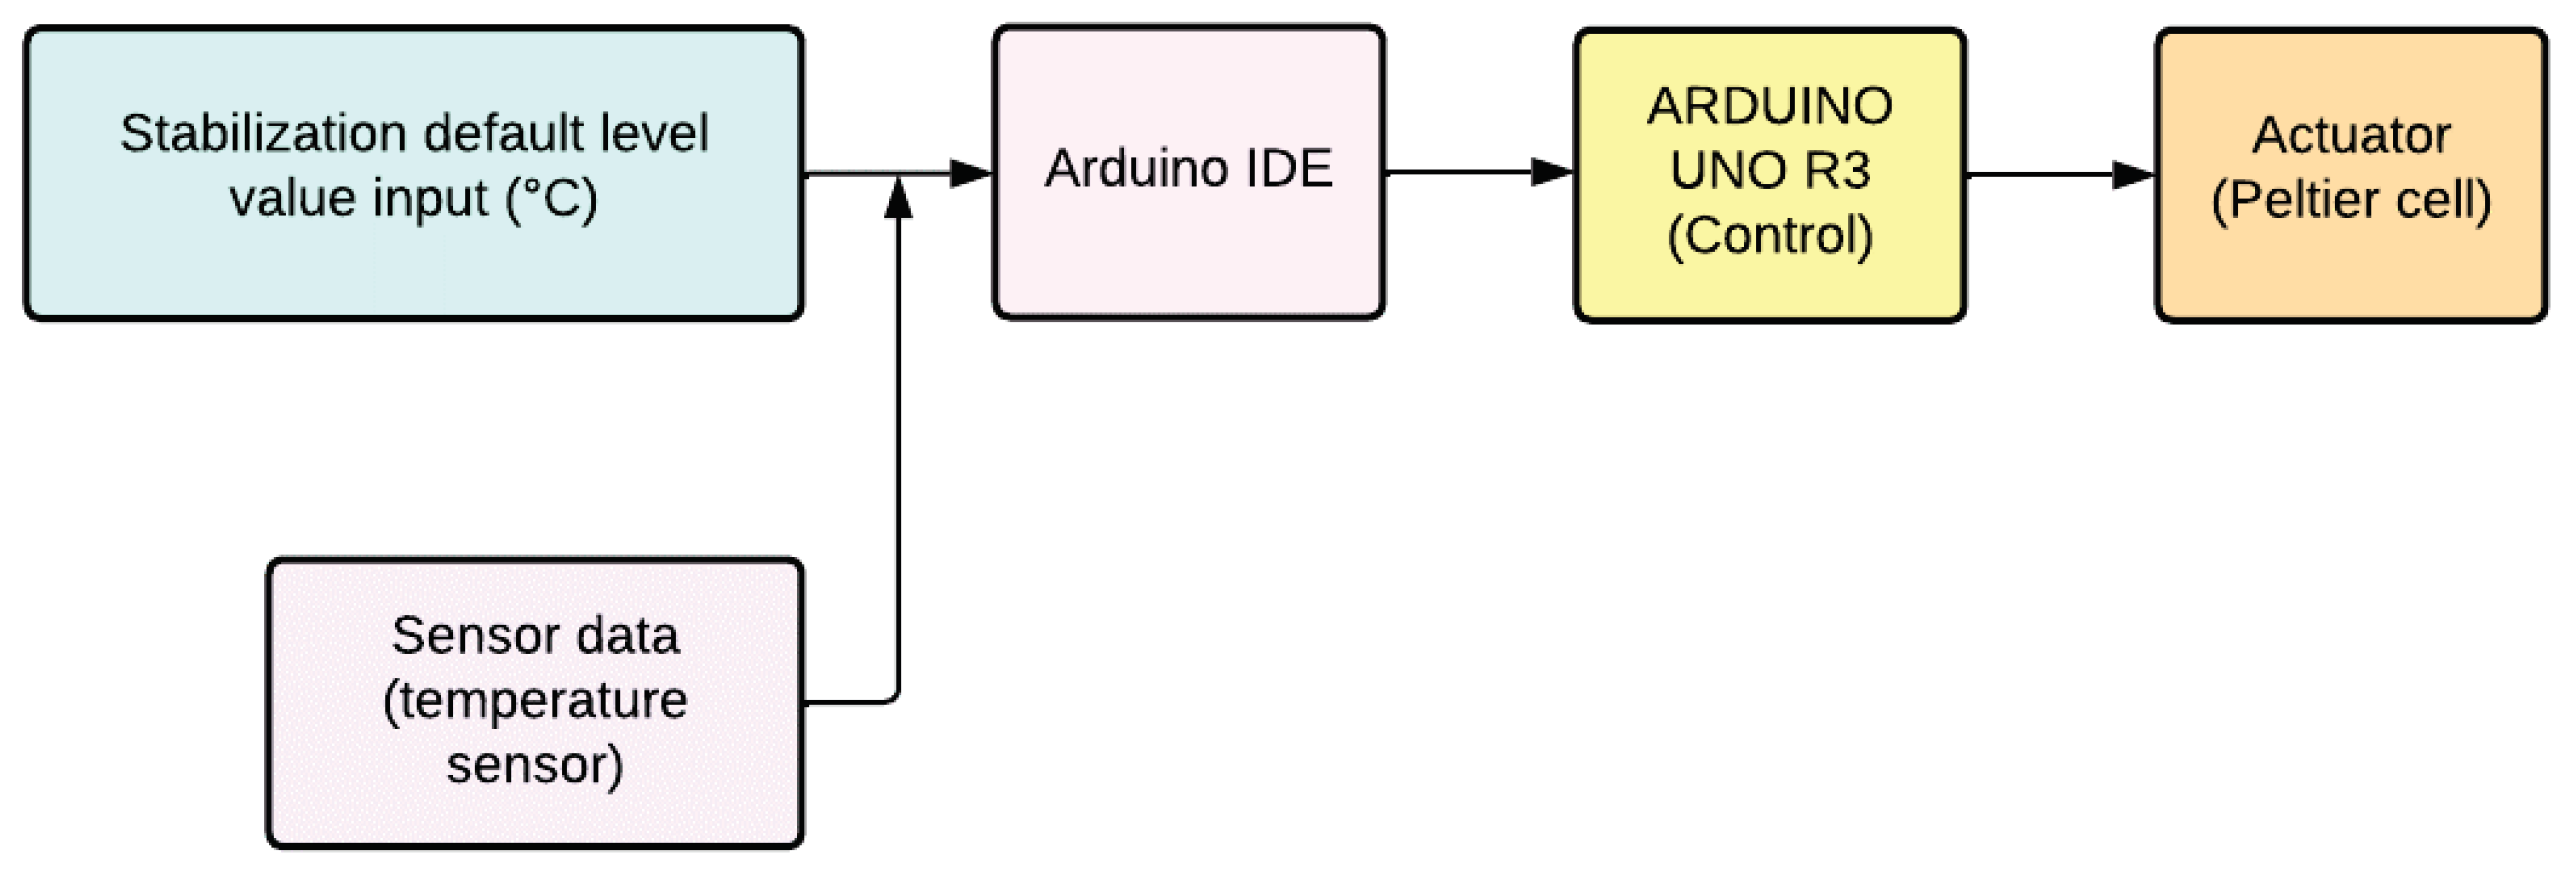
Figure 5.
Block diagram for hourly brightness control.
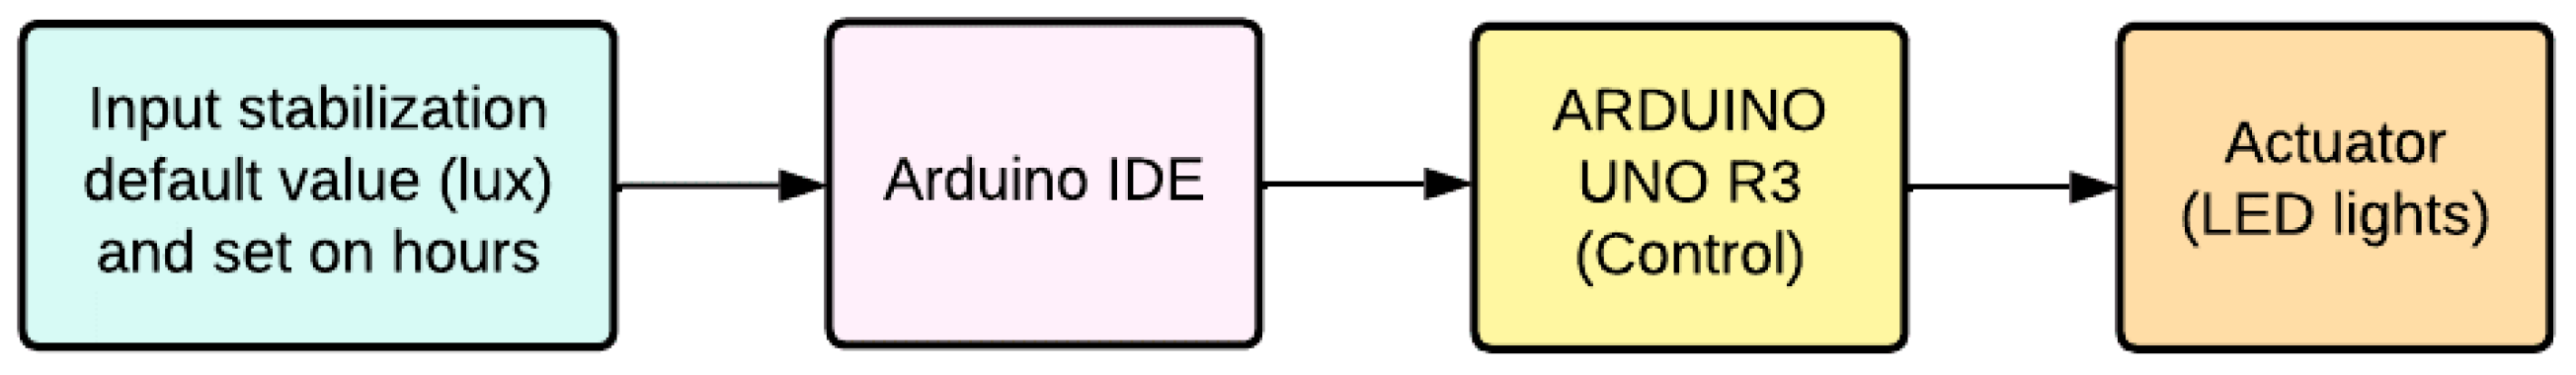
Figure 6.
Schematic diagram of filling and draining a tank.
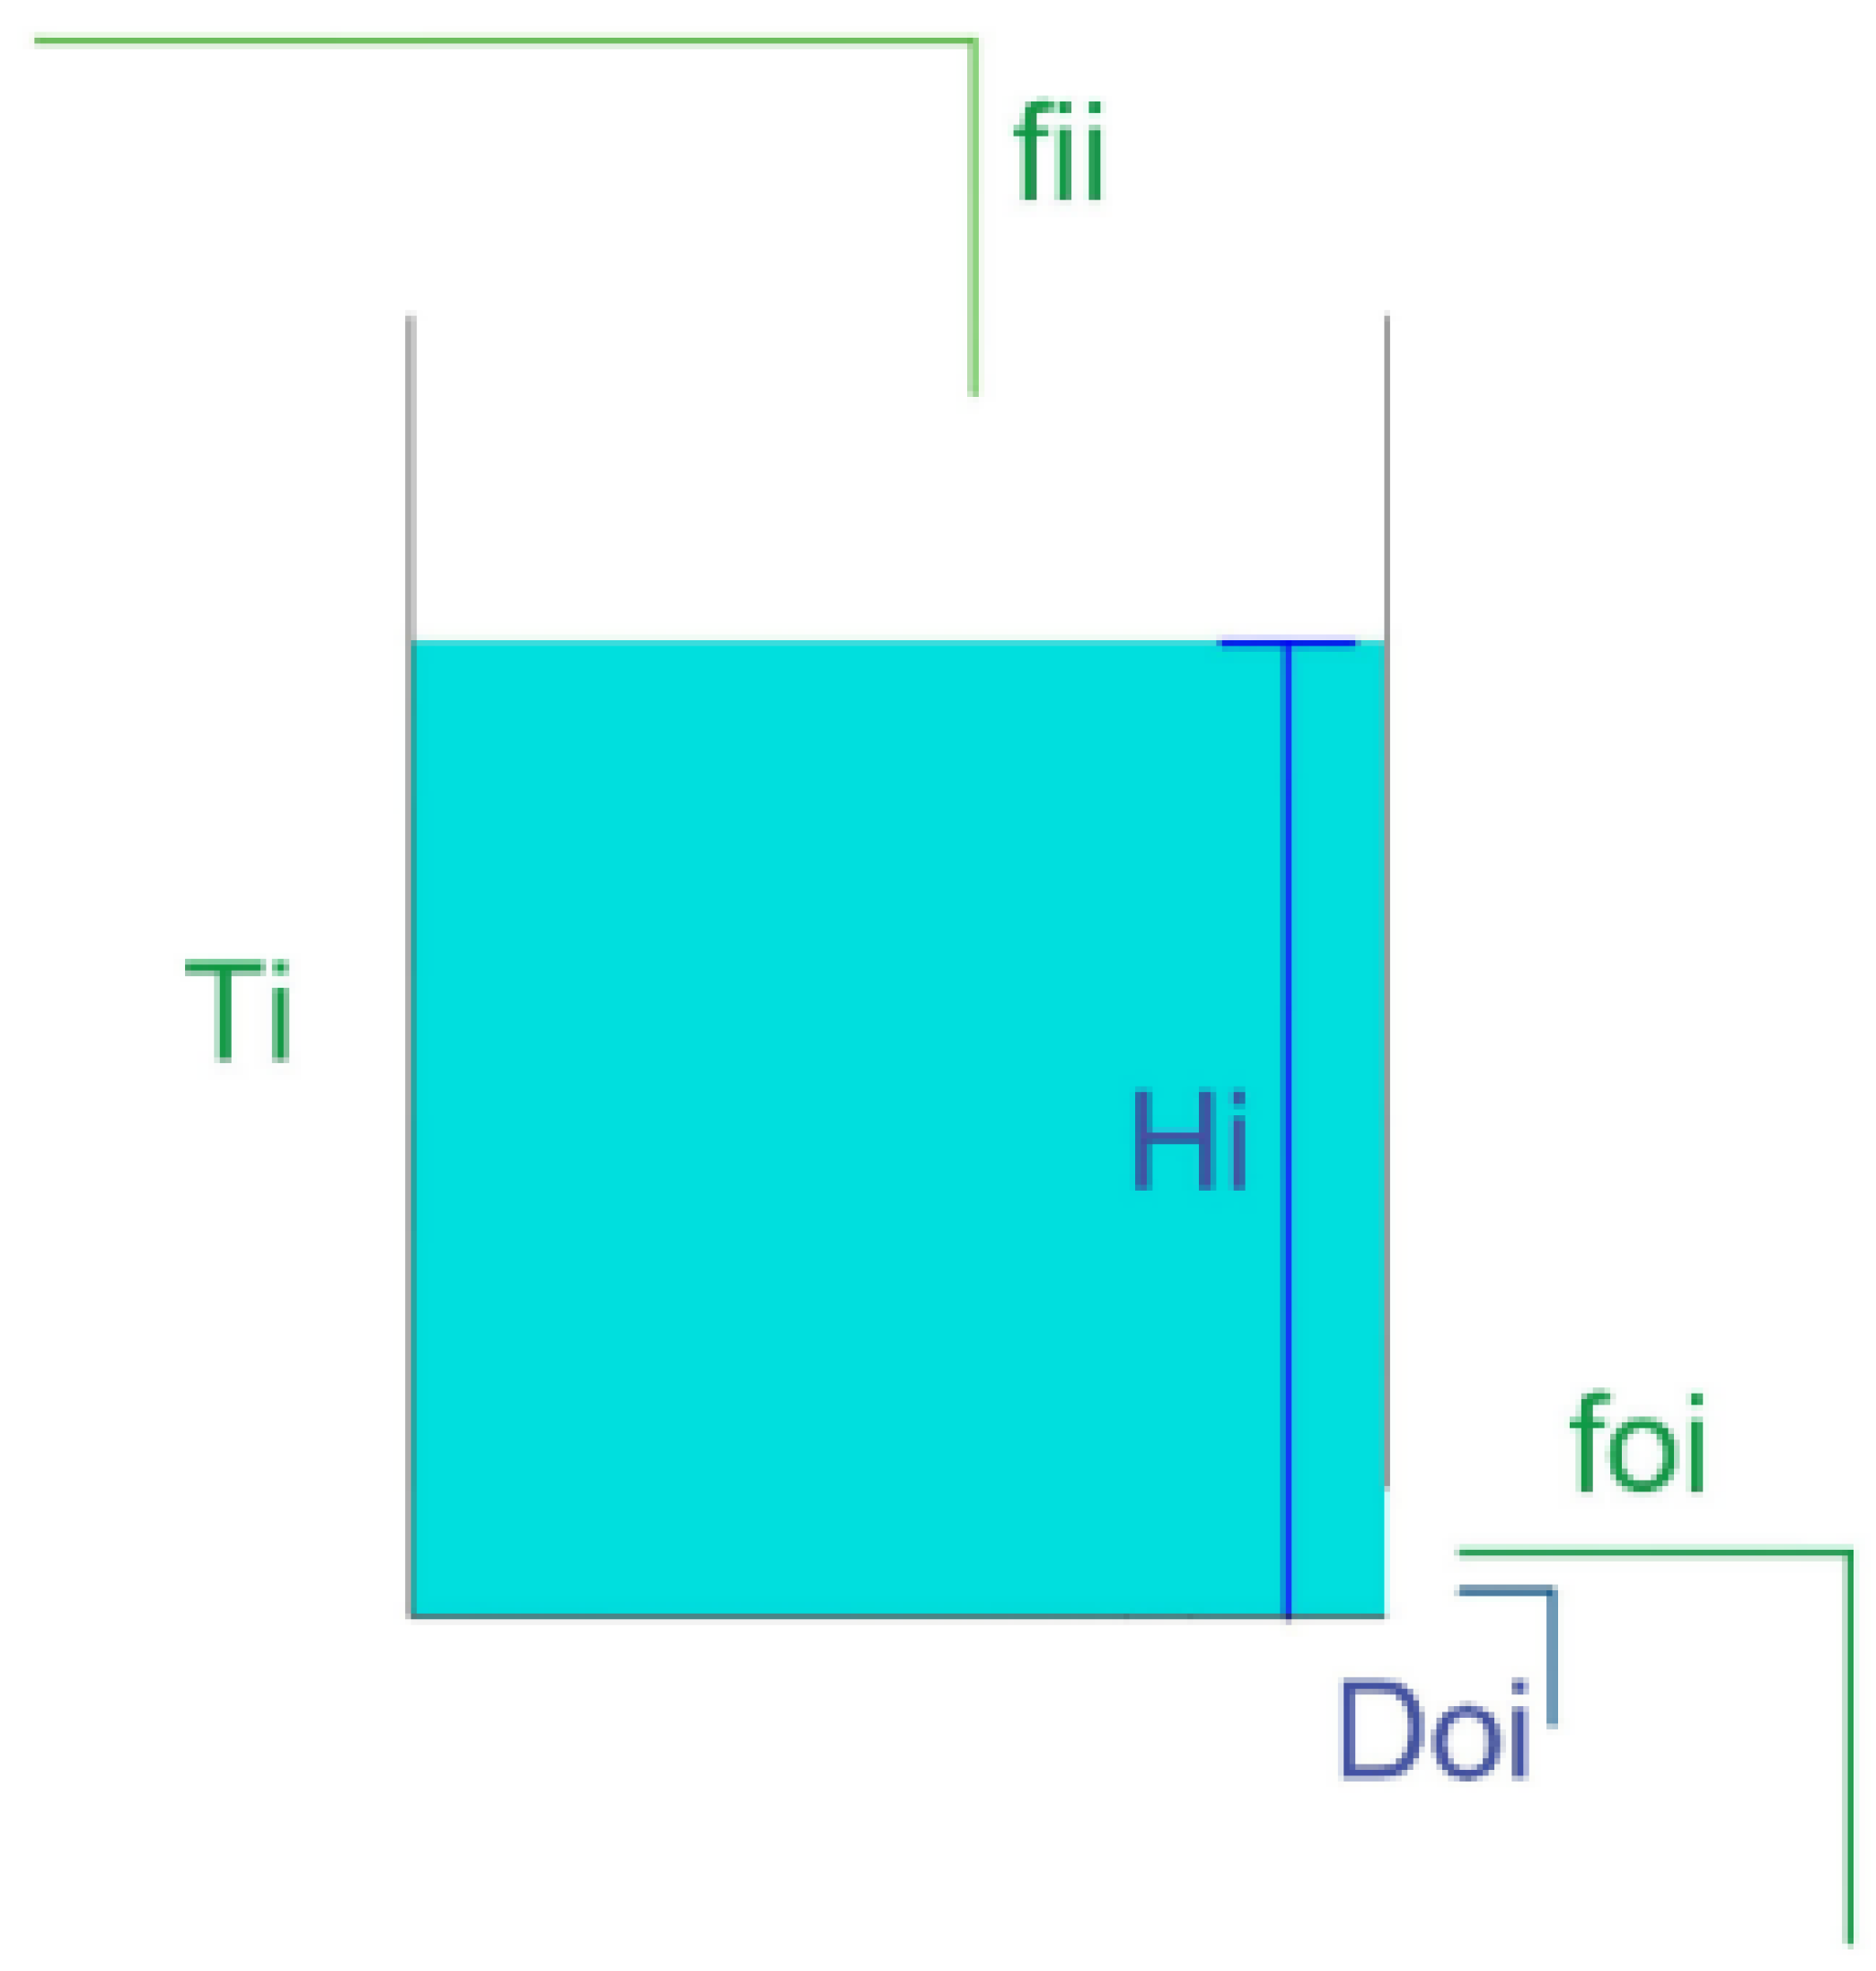
Figure 7.
Block diagram of the system implemented in Simulink.
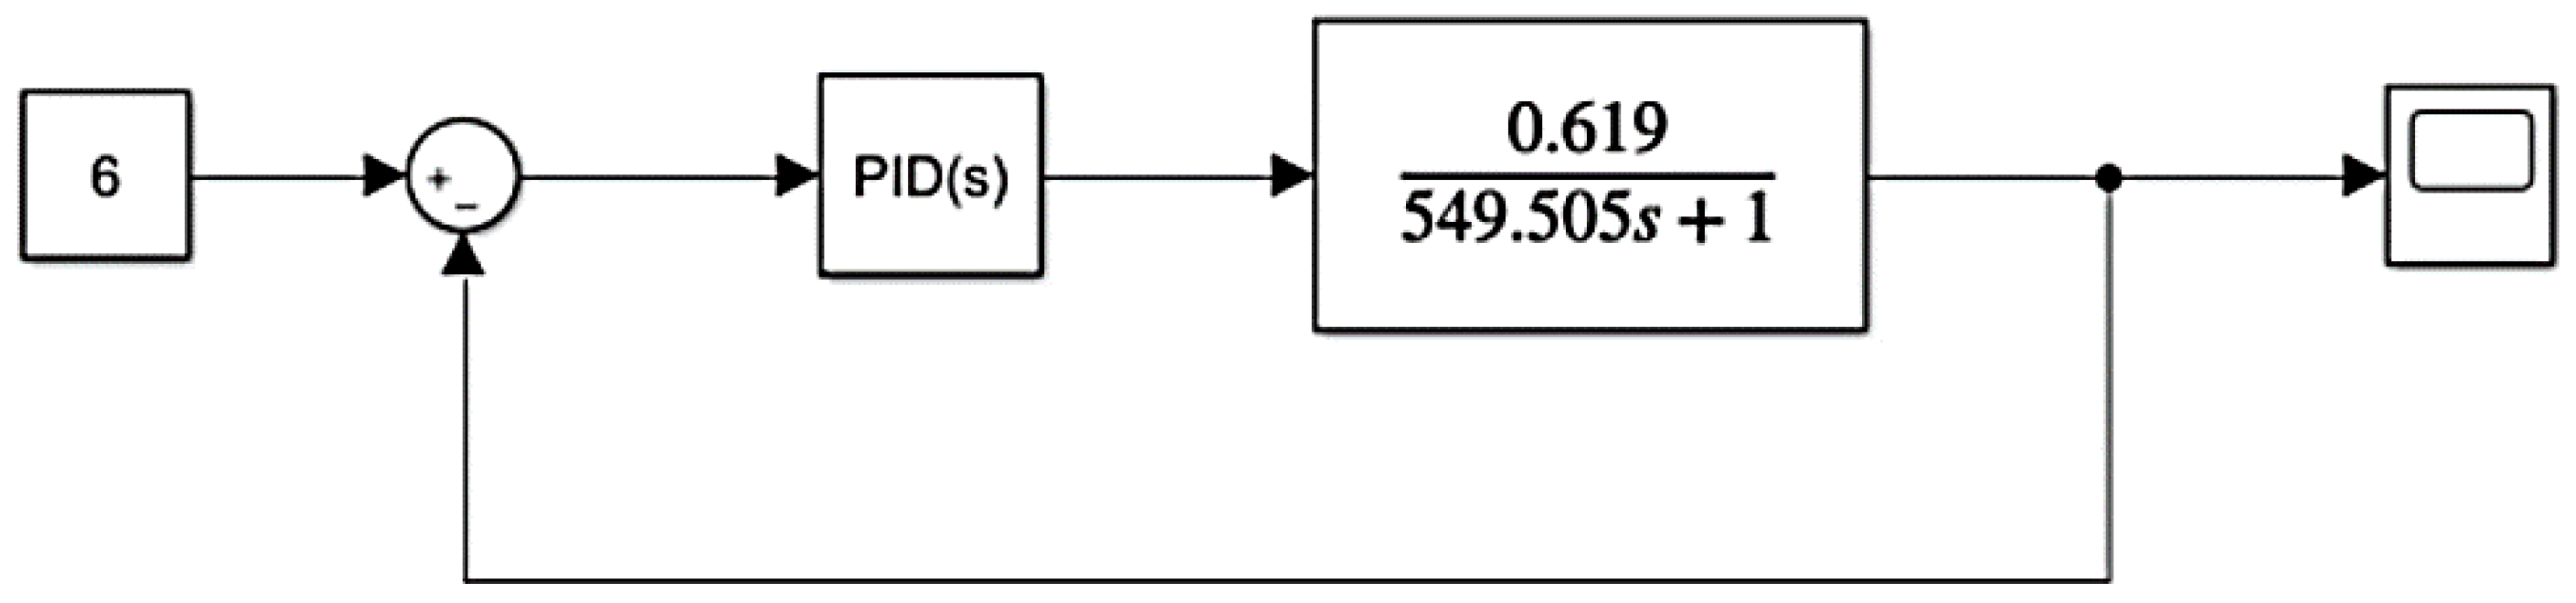
Figure 8.
PID block parameters in Simulink.
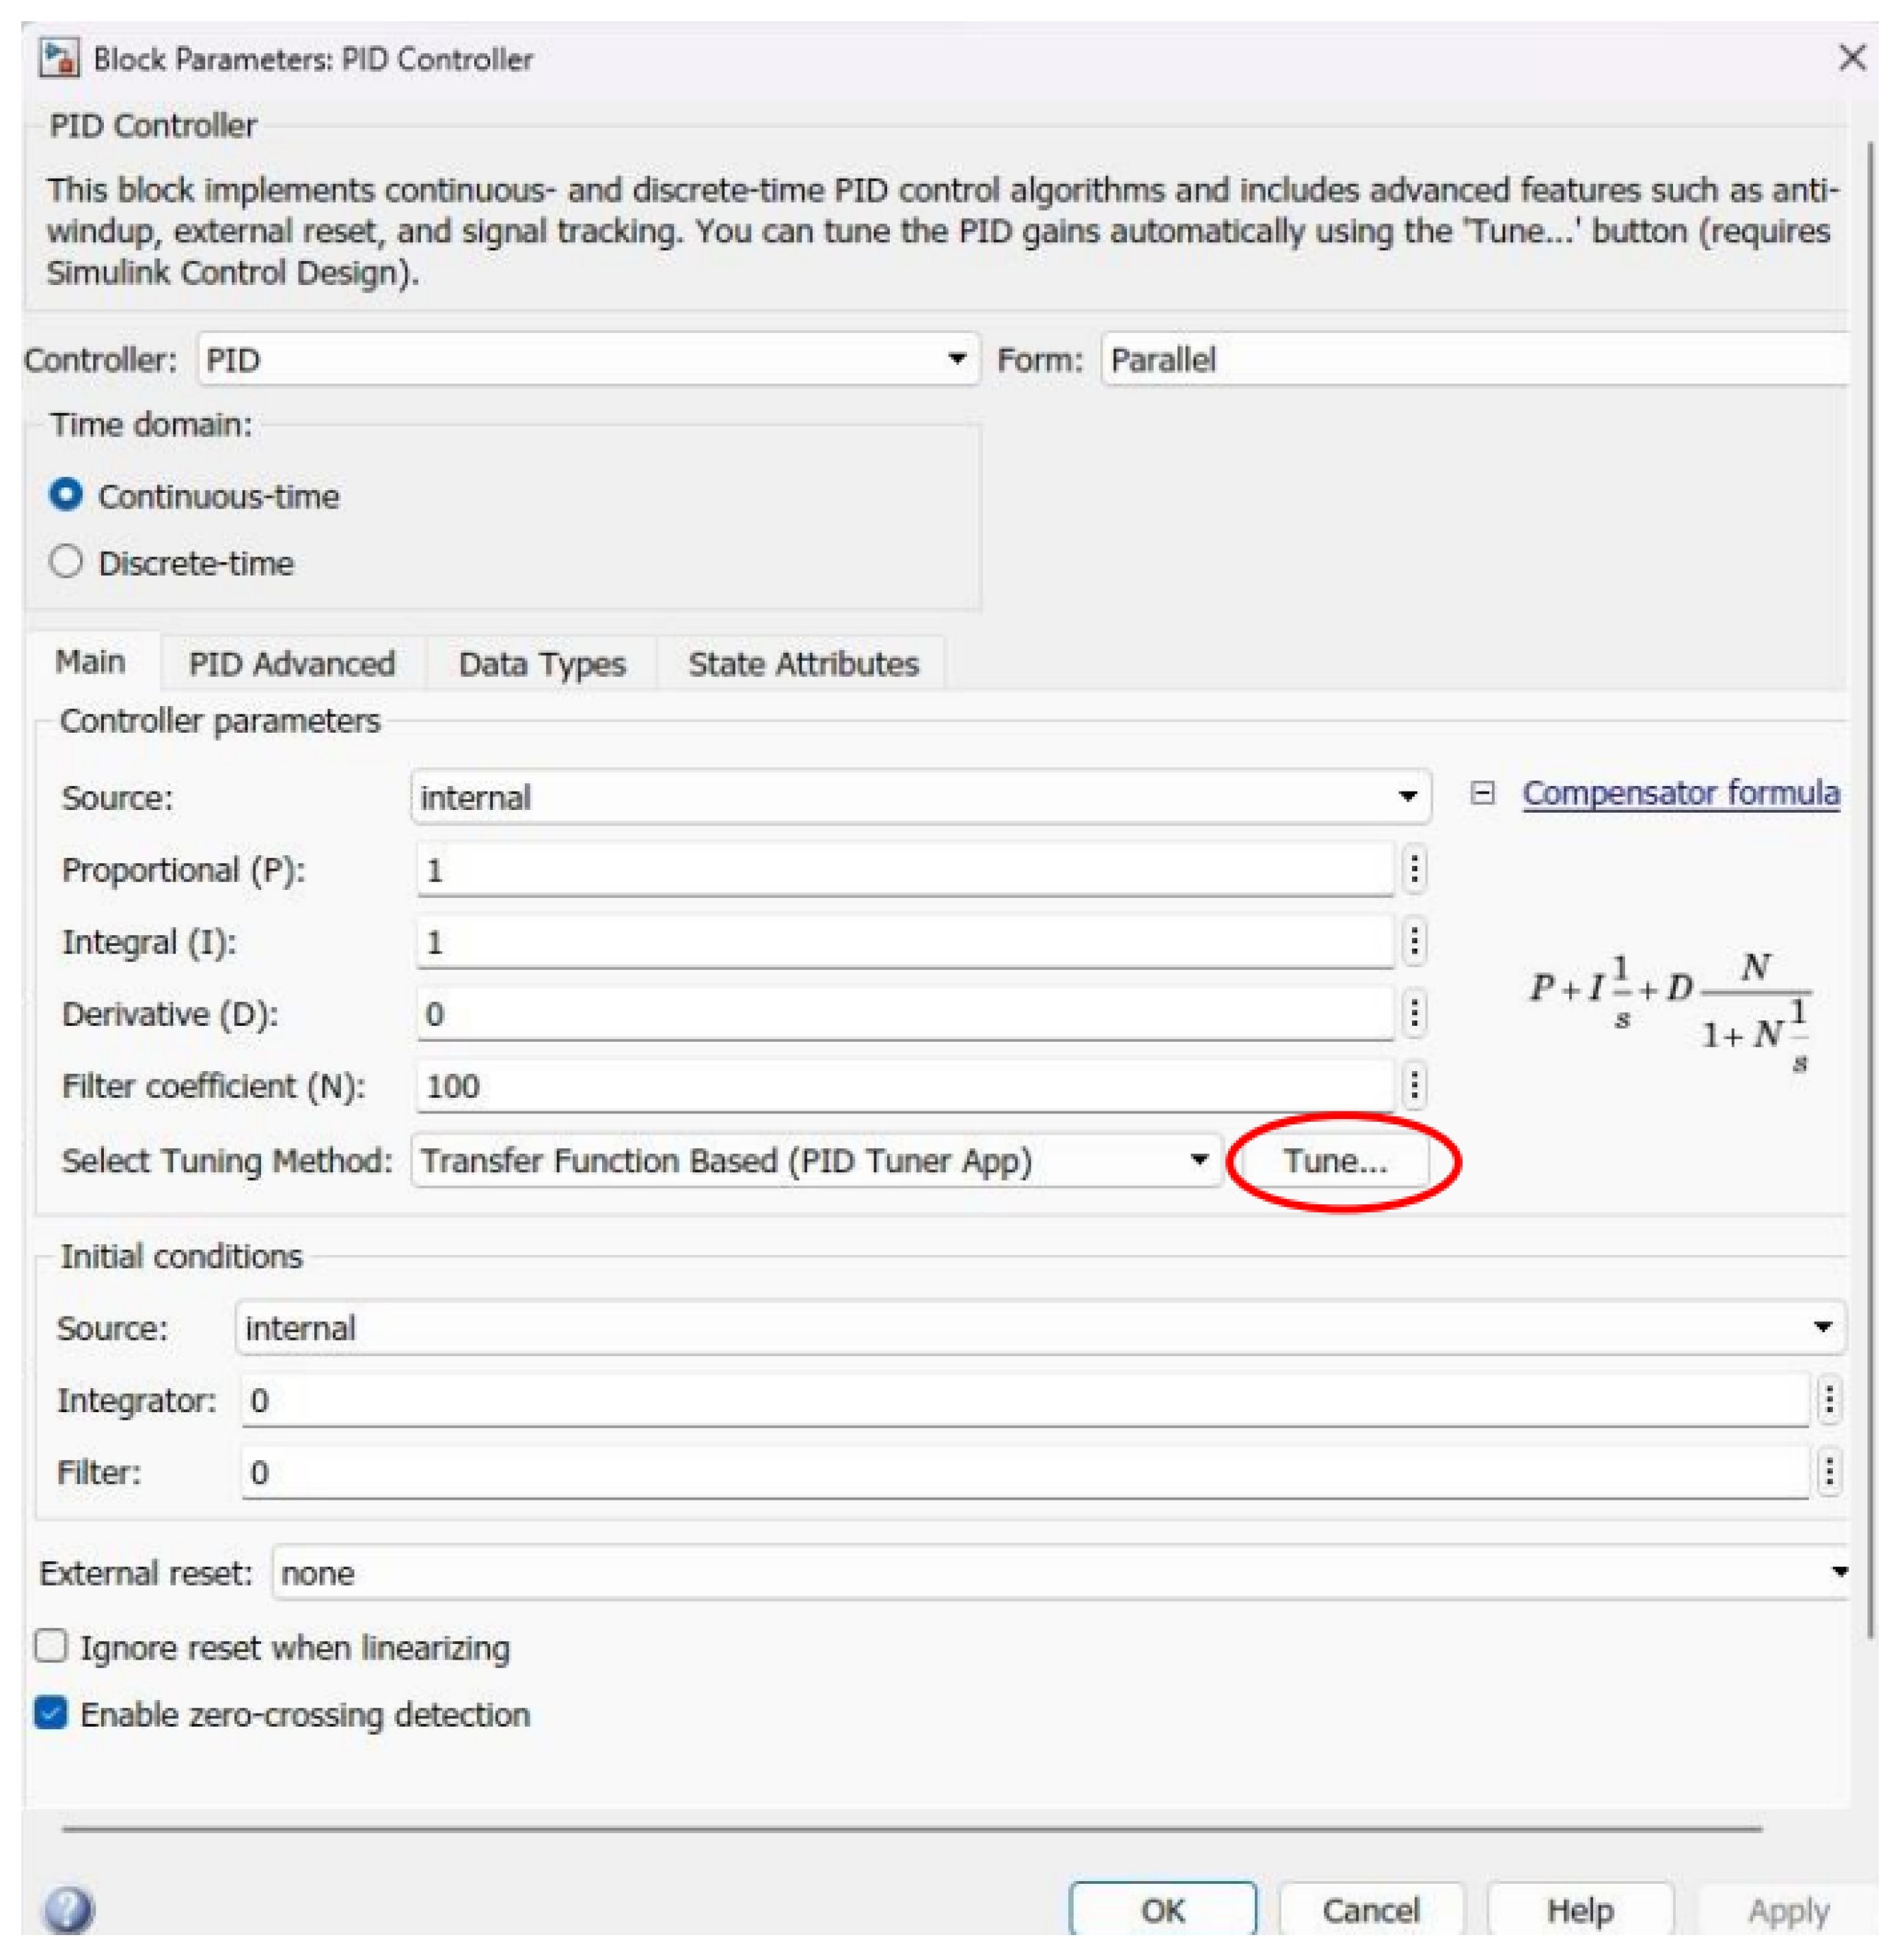
Figure 9.
Auto tuning of PID parameters.
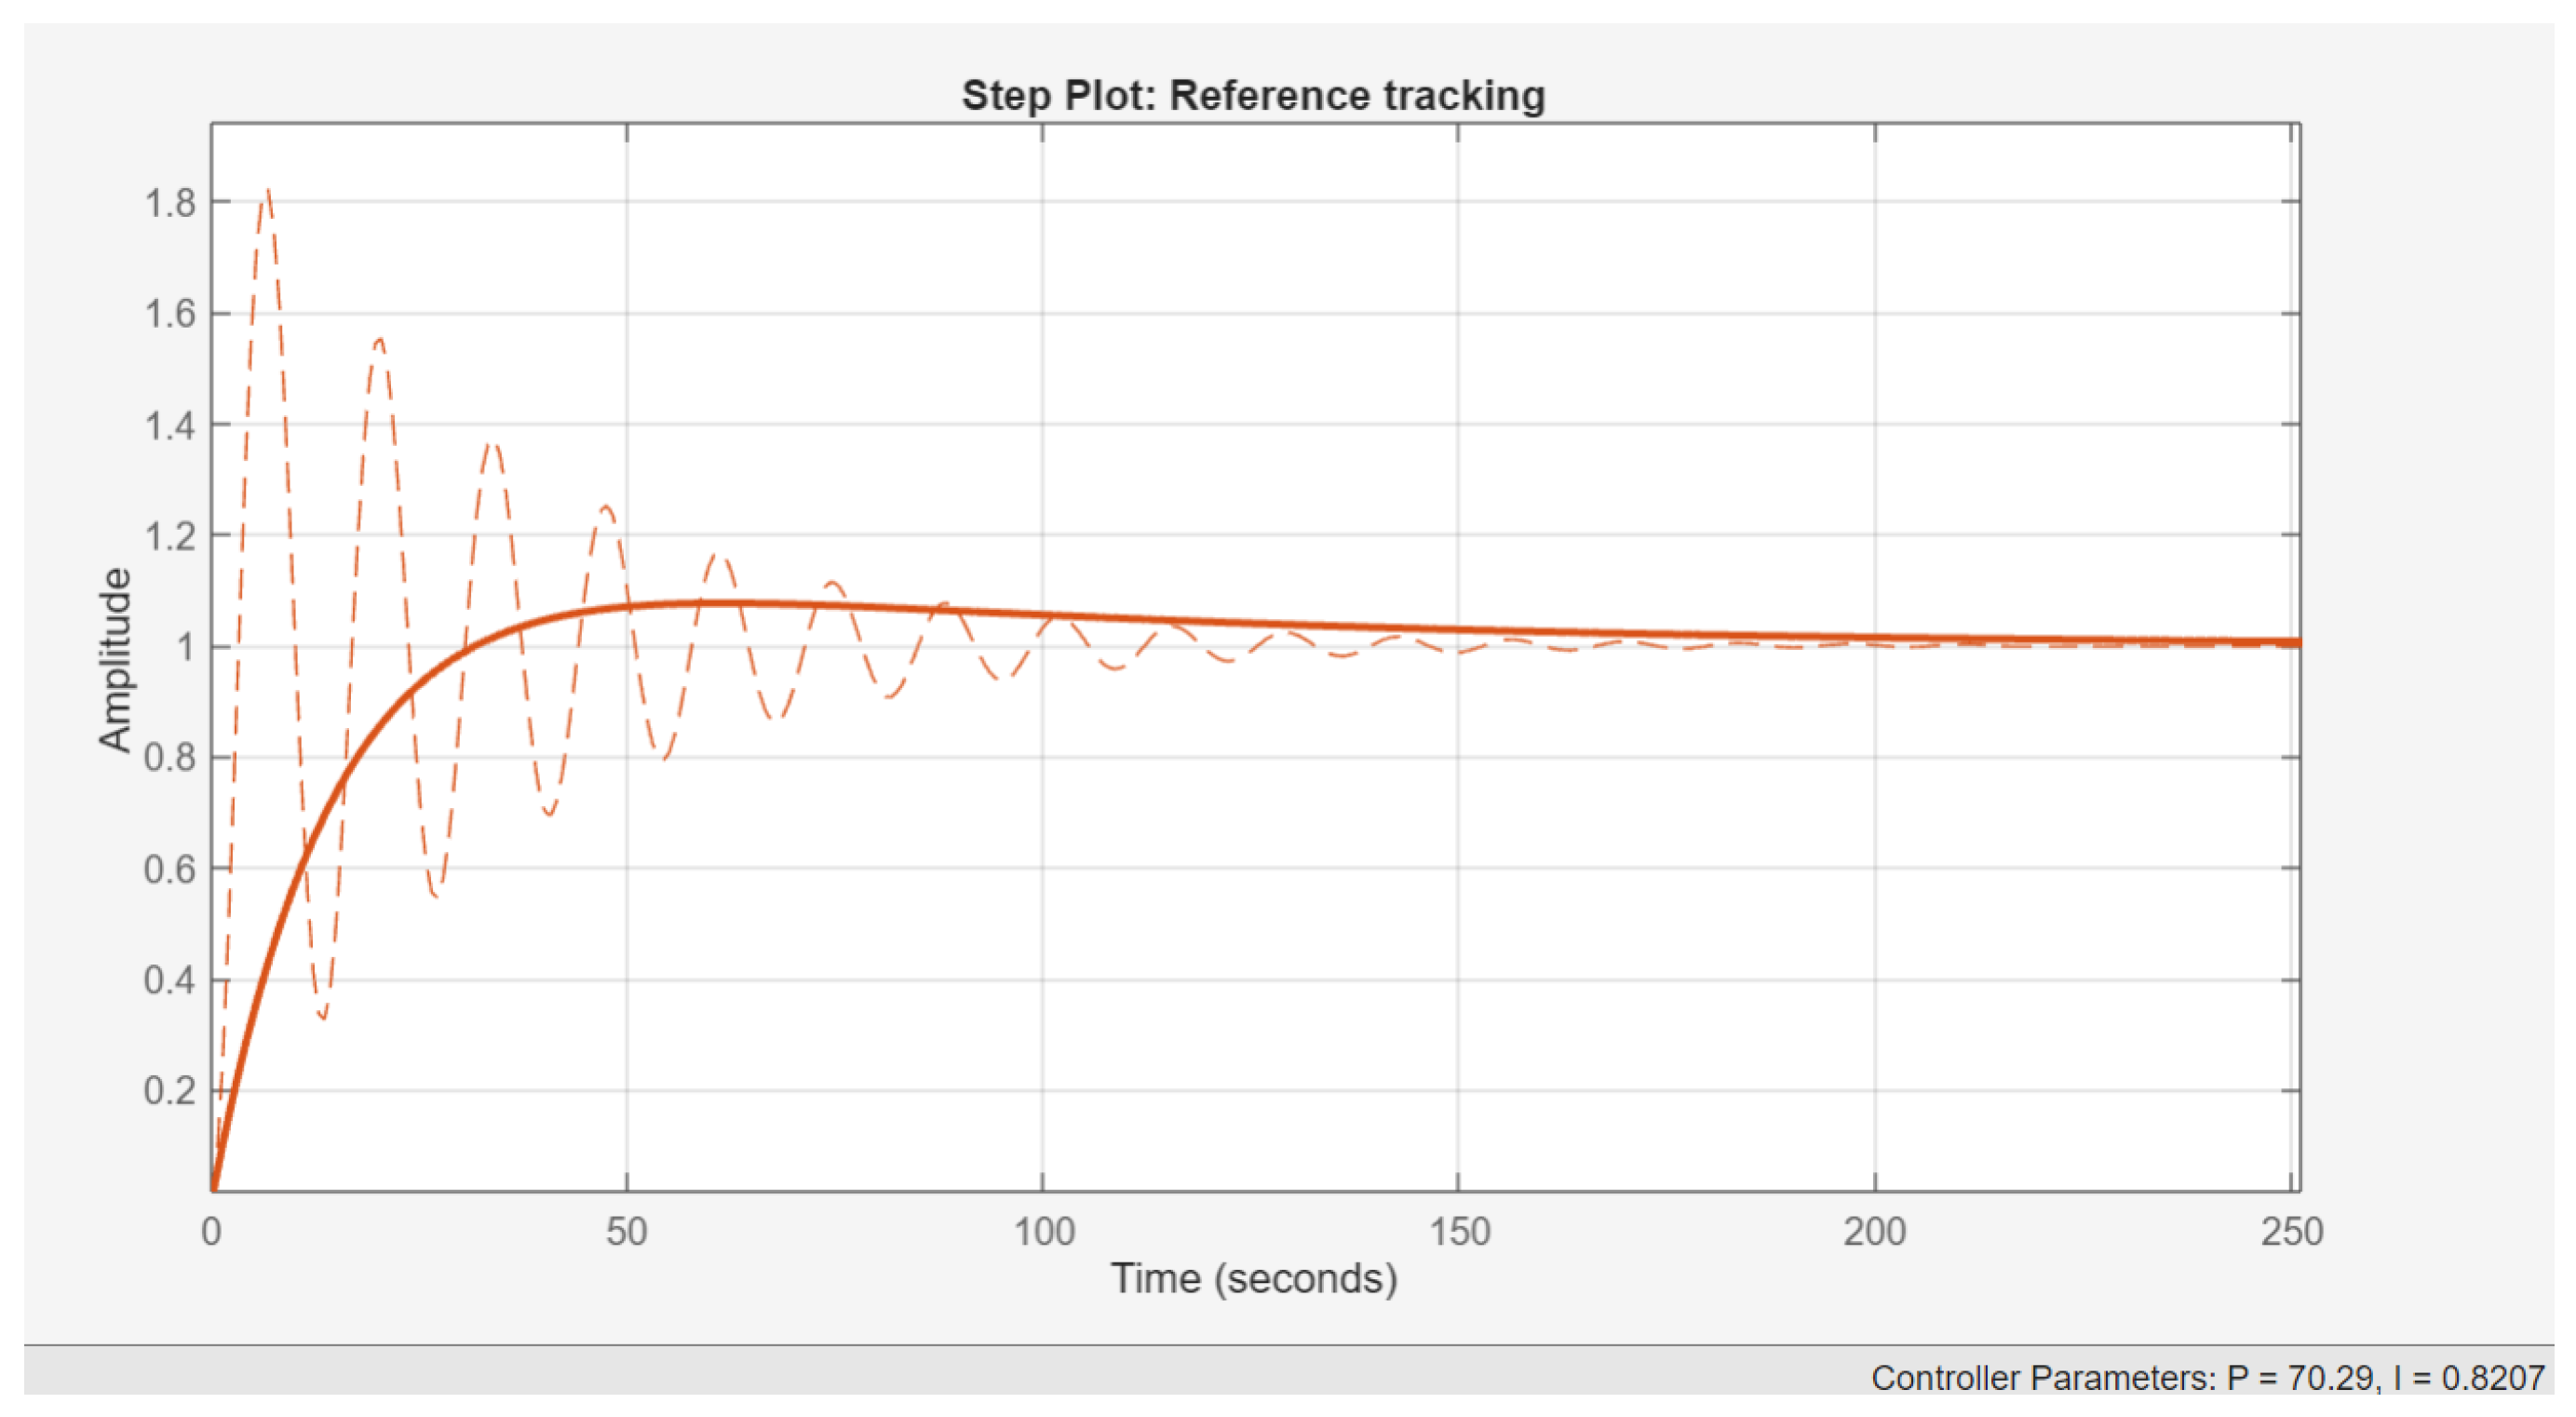
Figure 10.
Input configuration of the fuzzy controller.
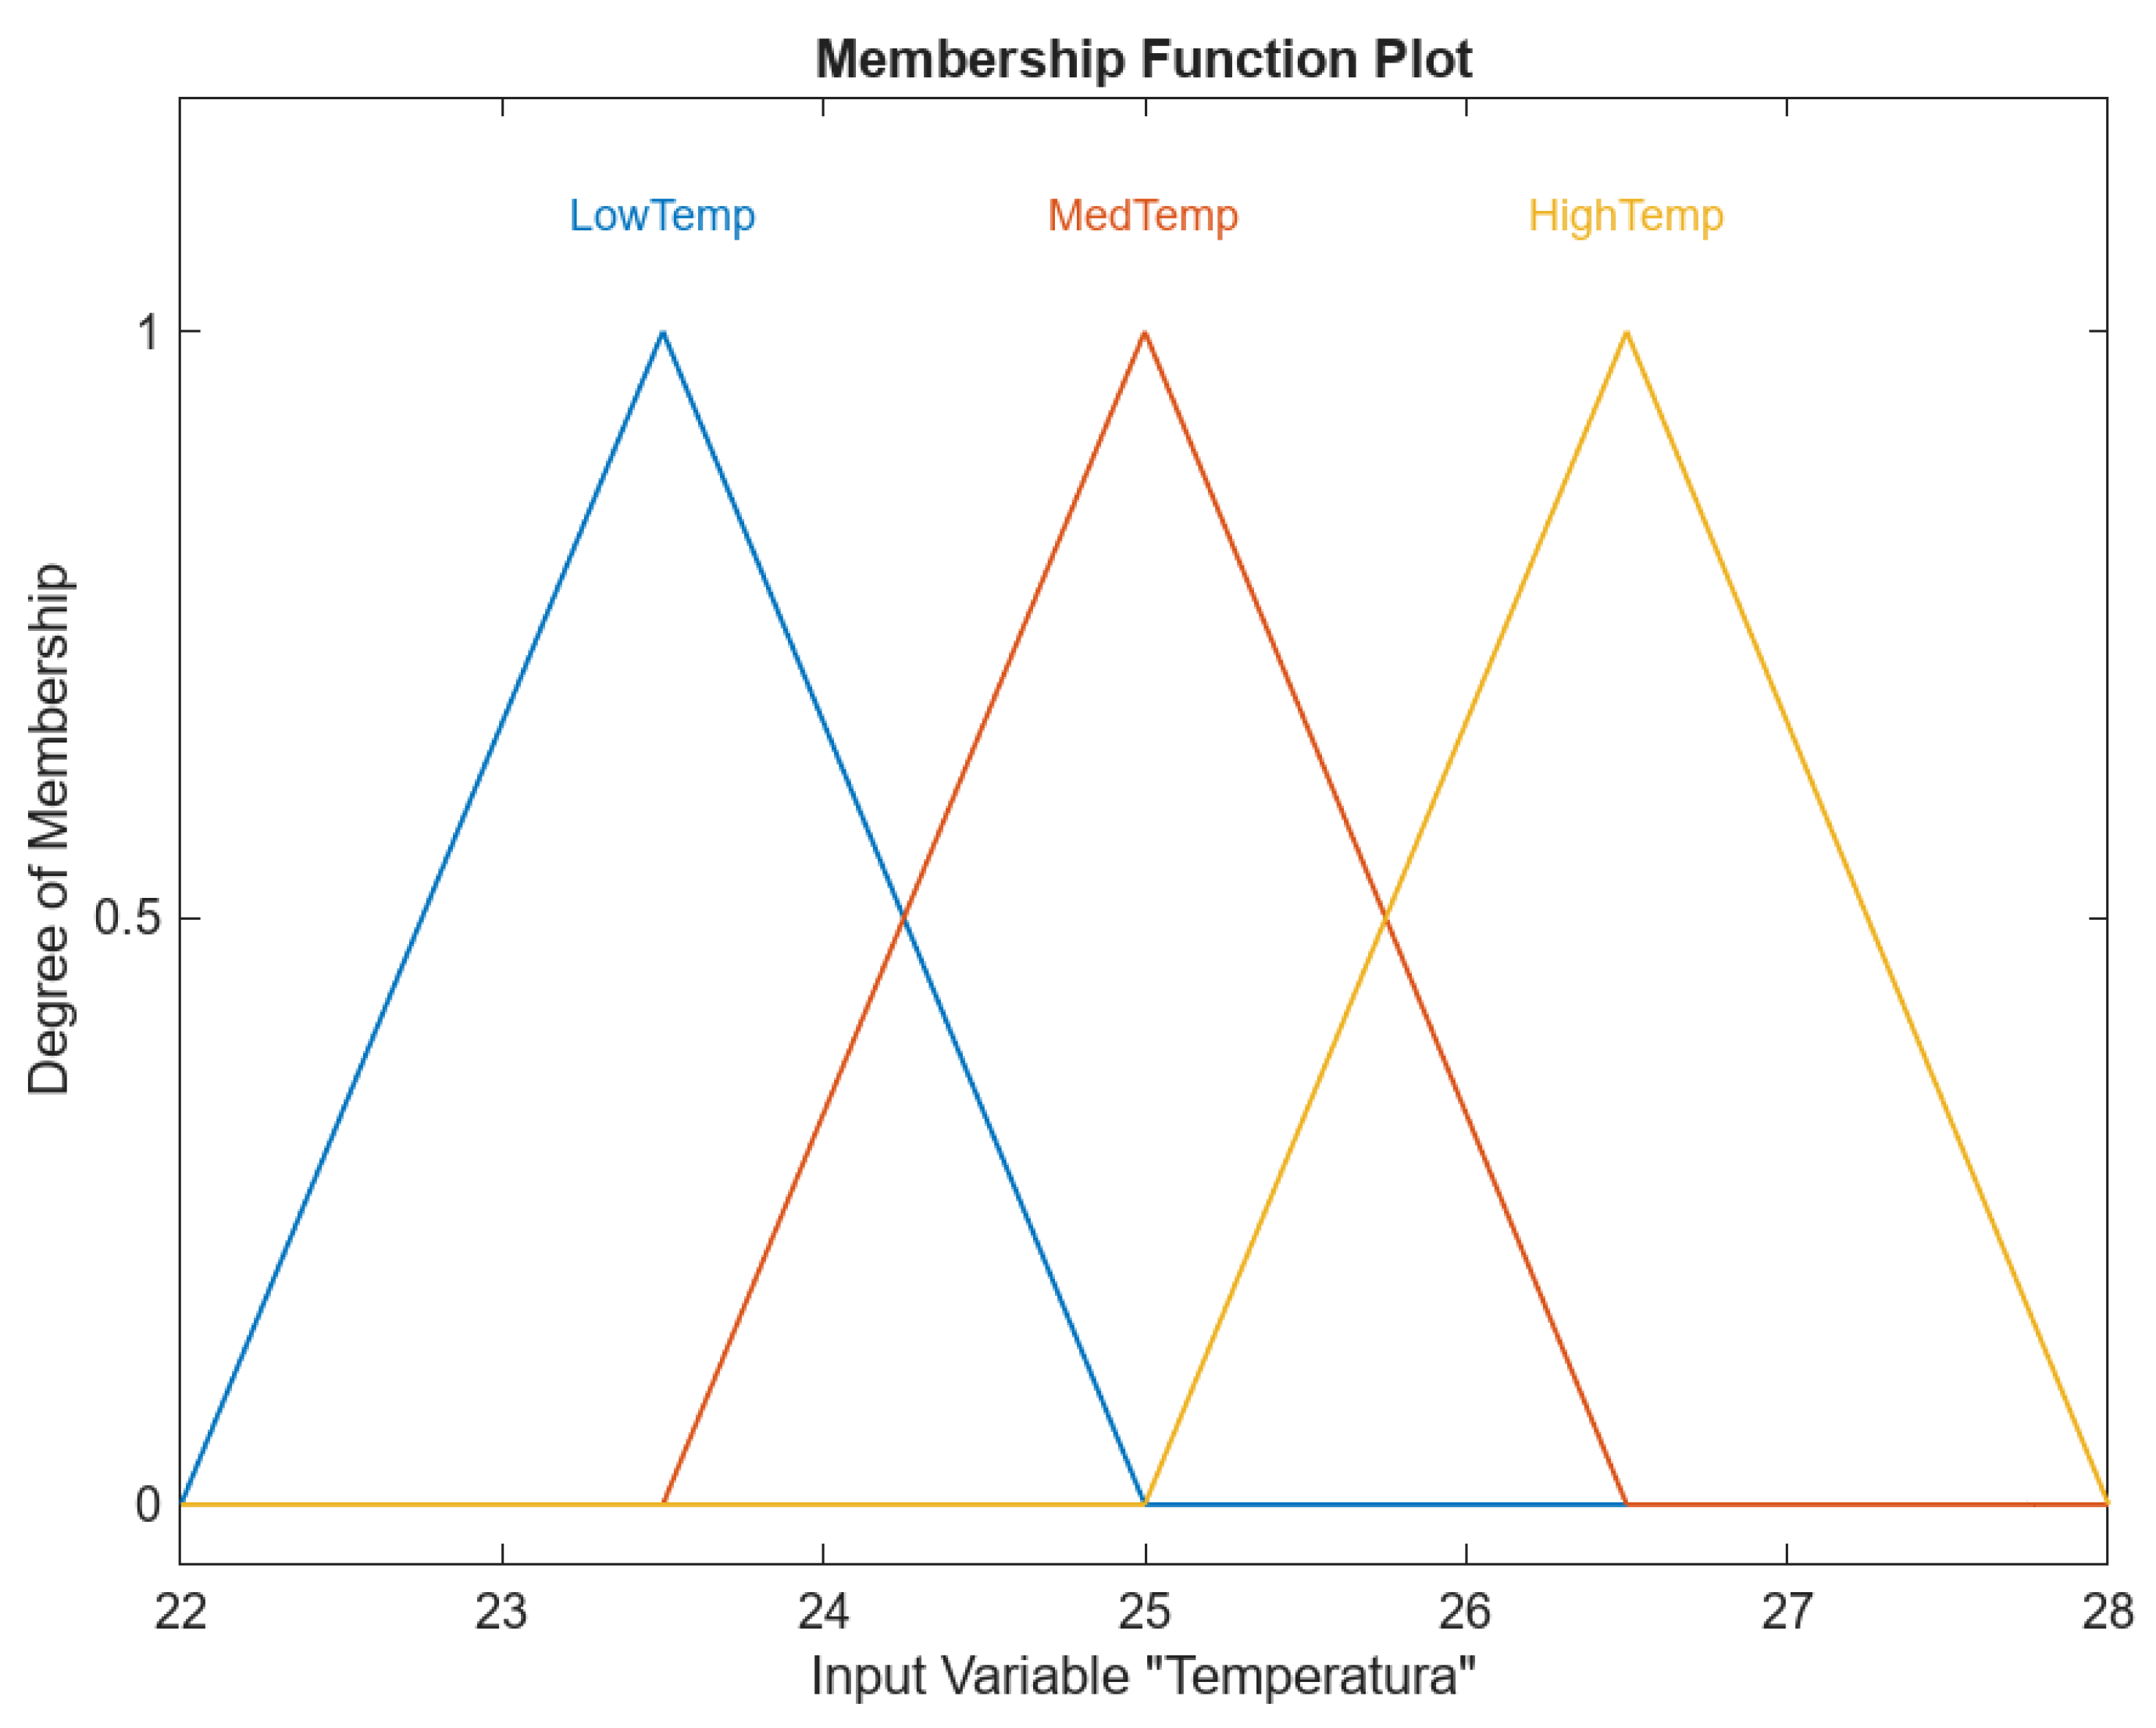
Figure 11.
Output configuration of the fuzzy controller.
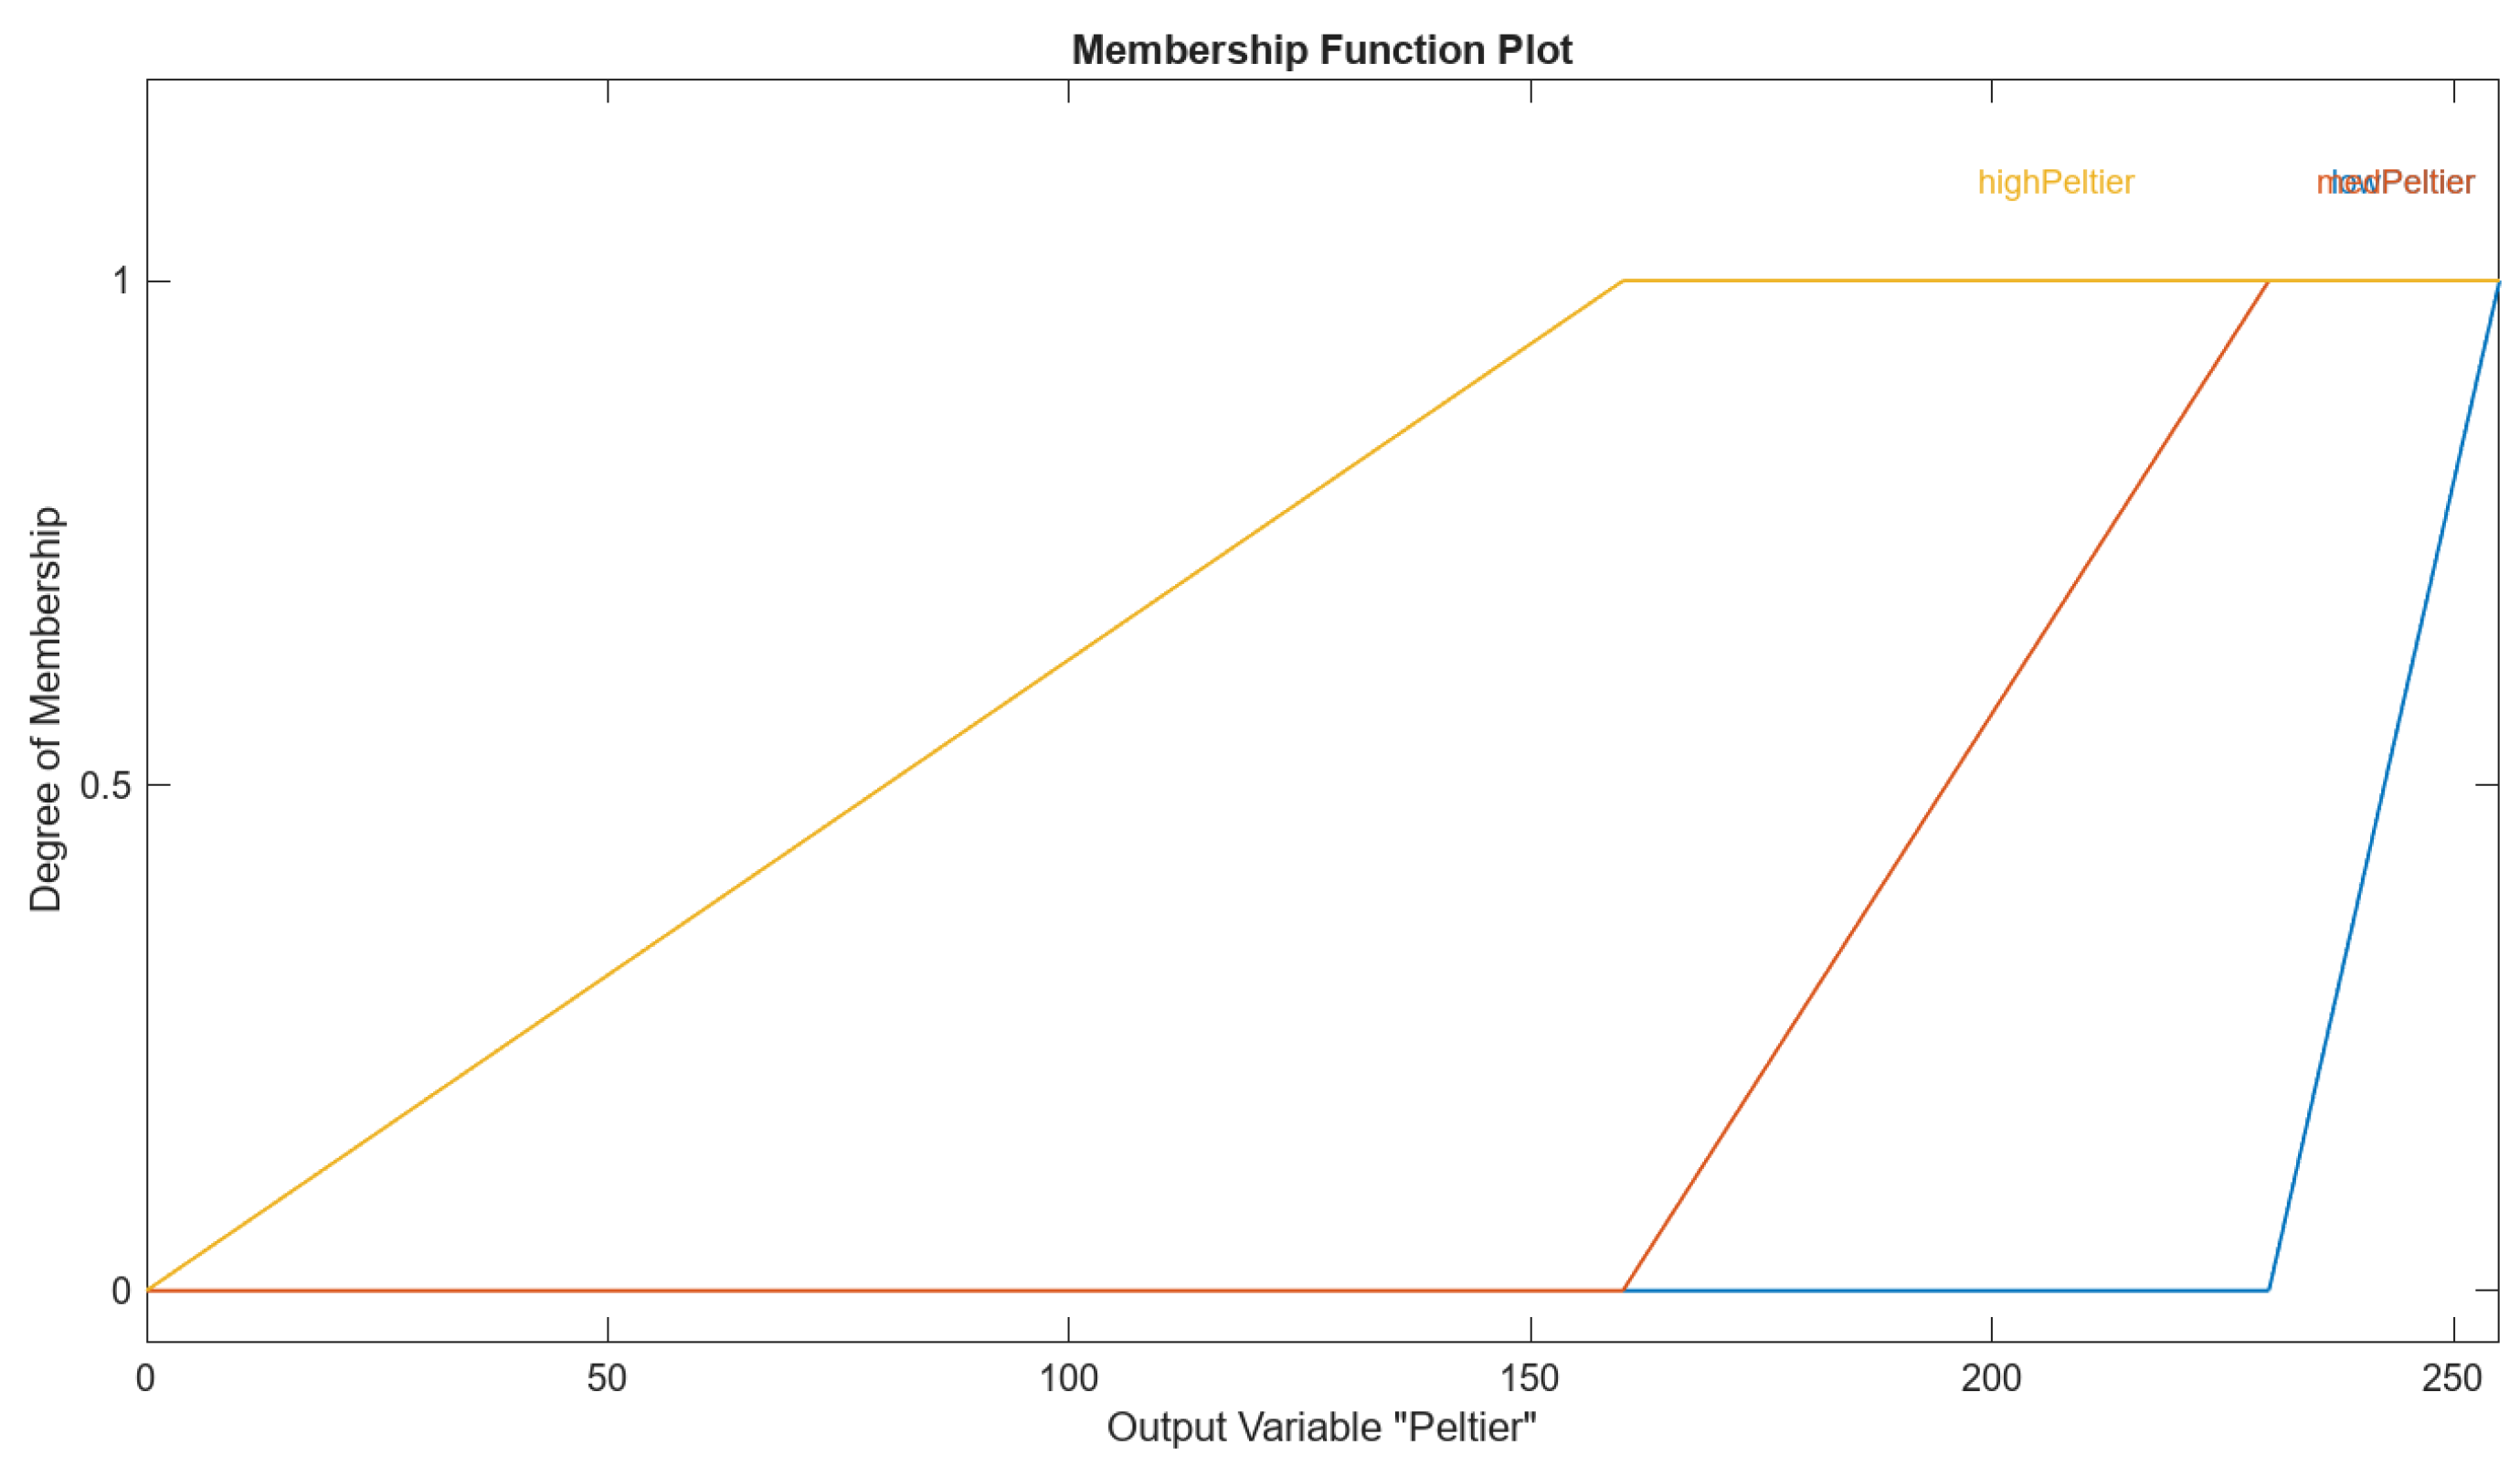
Figure 12.
Fuzzy controller rules.
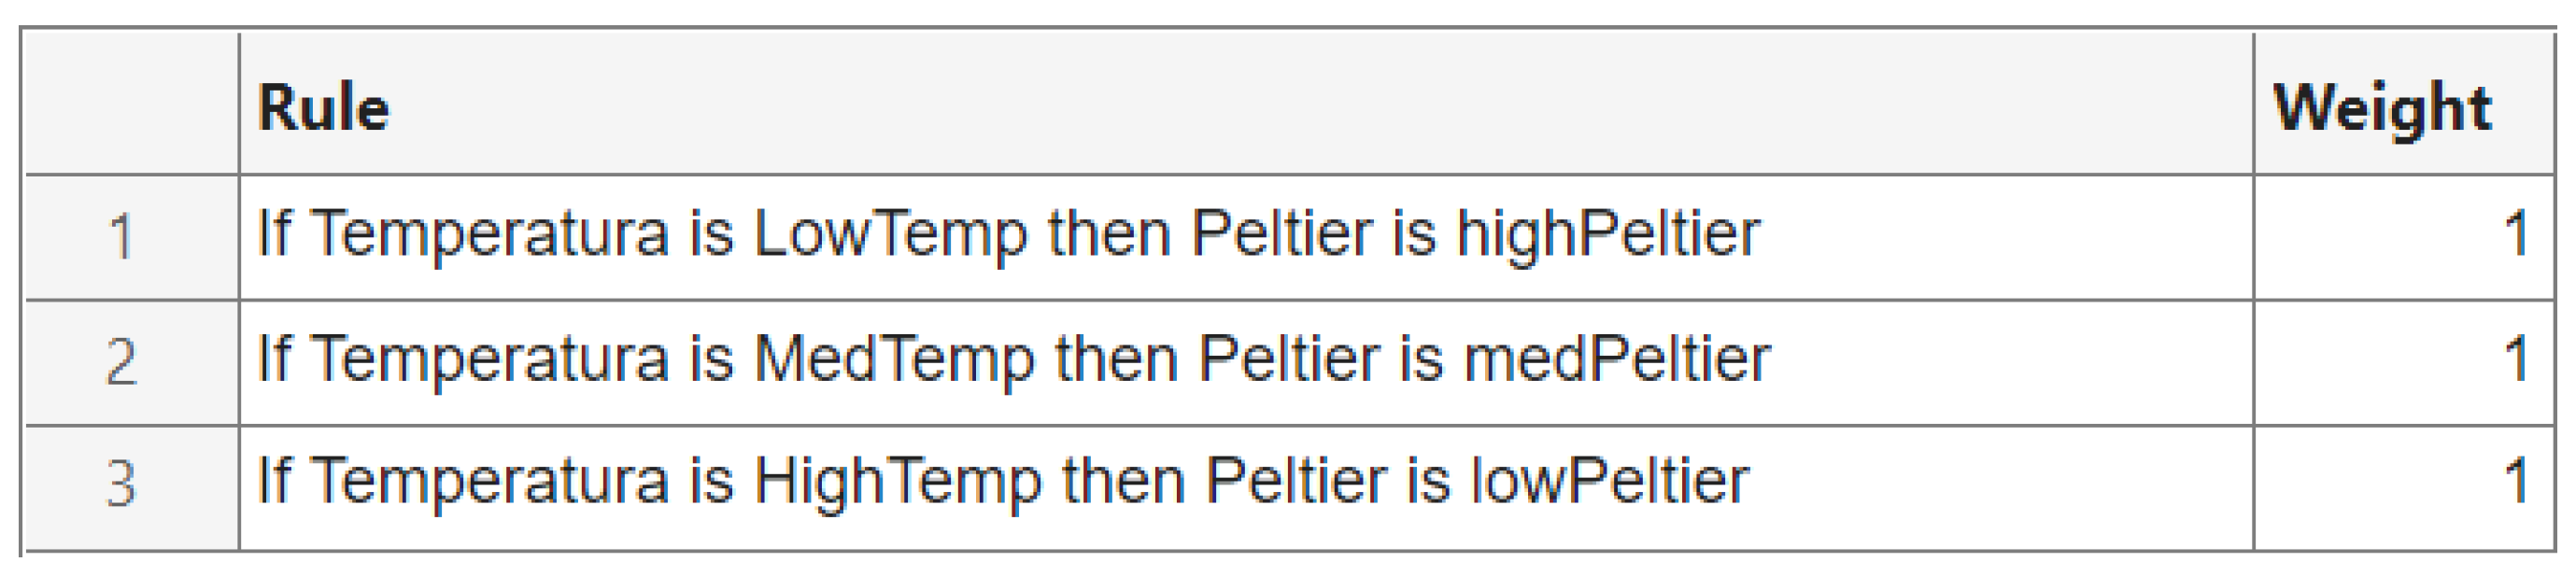
Figure 13.
Response of the fuzzy controller to temperature changes.
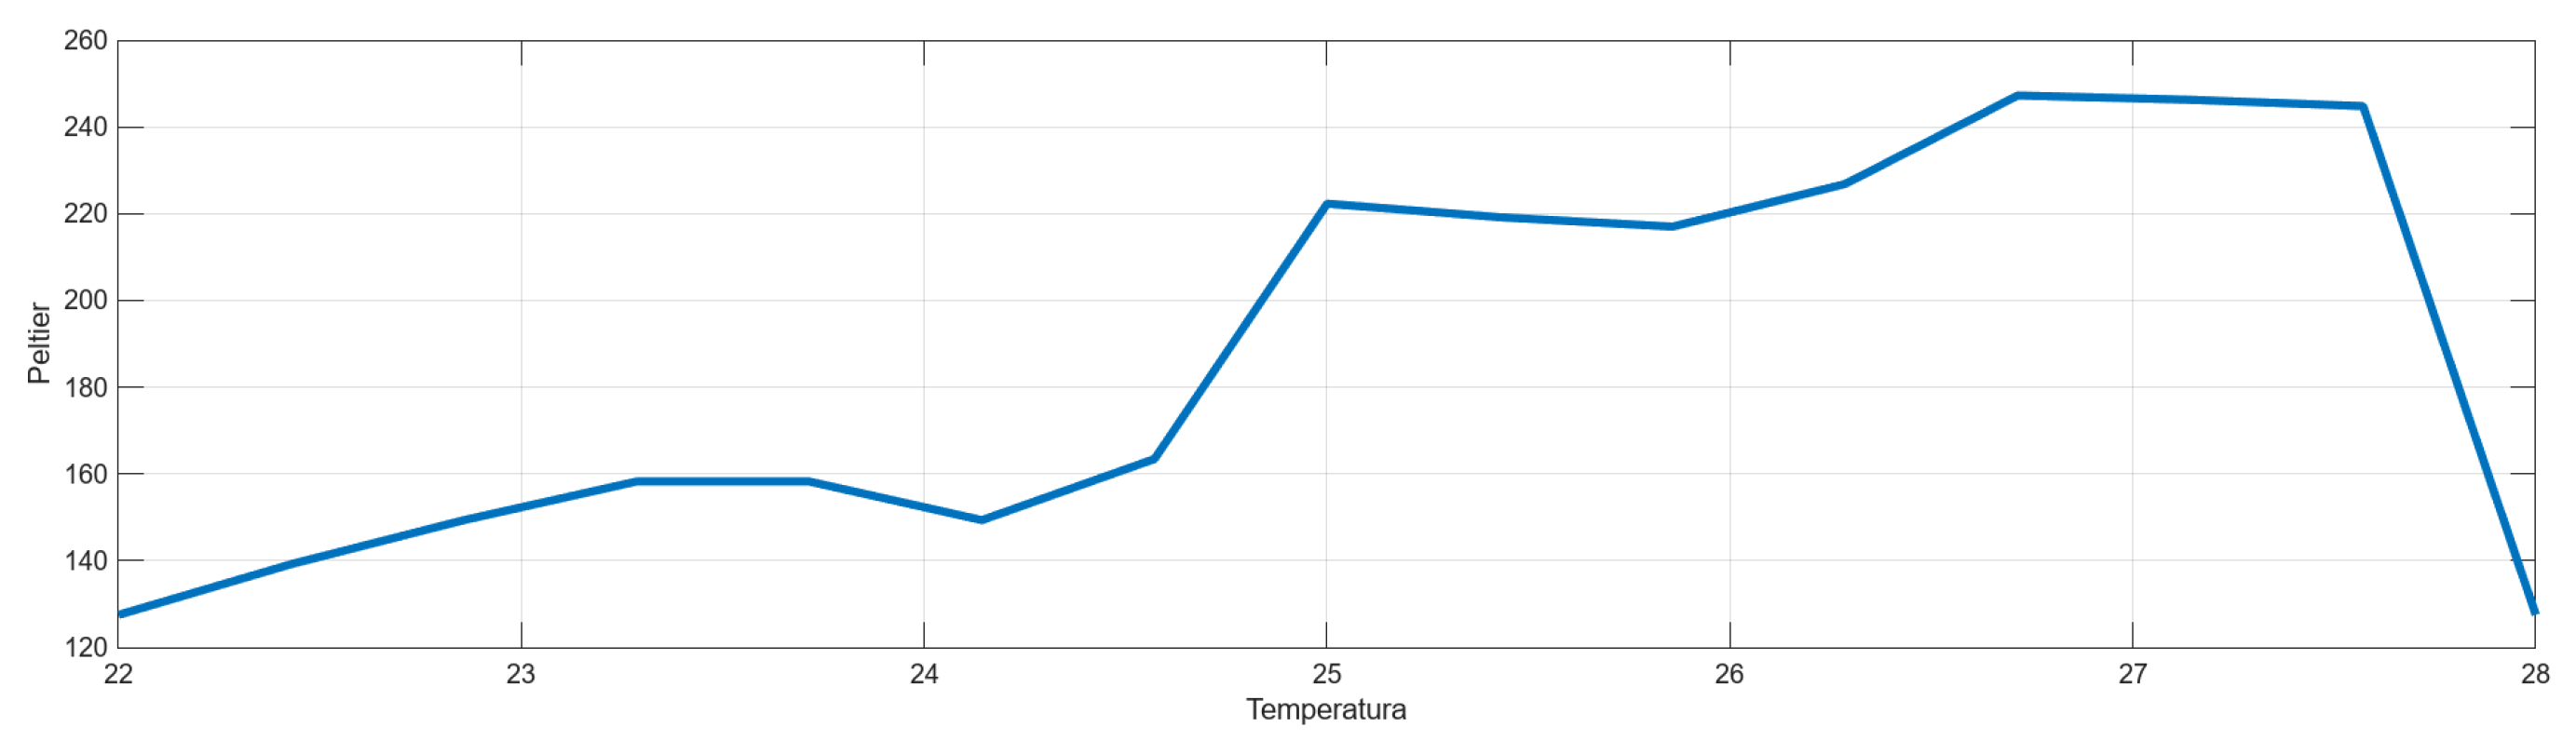
Figure 14.
Actual wiring diagram of the emitter module.
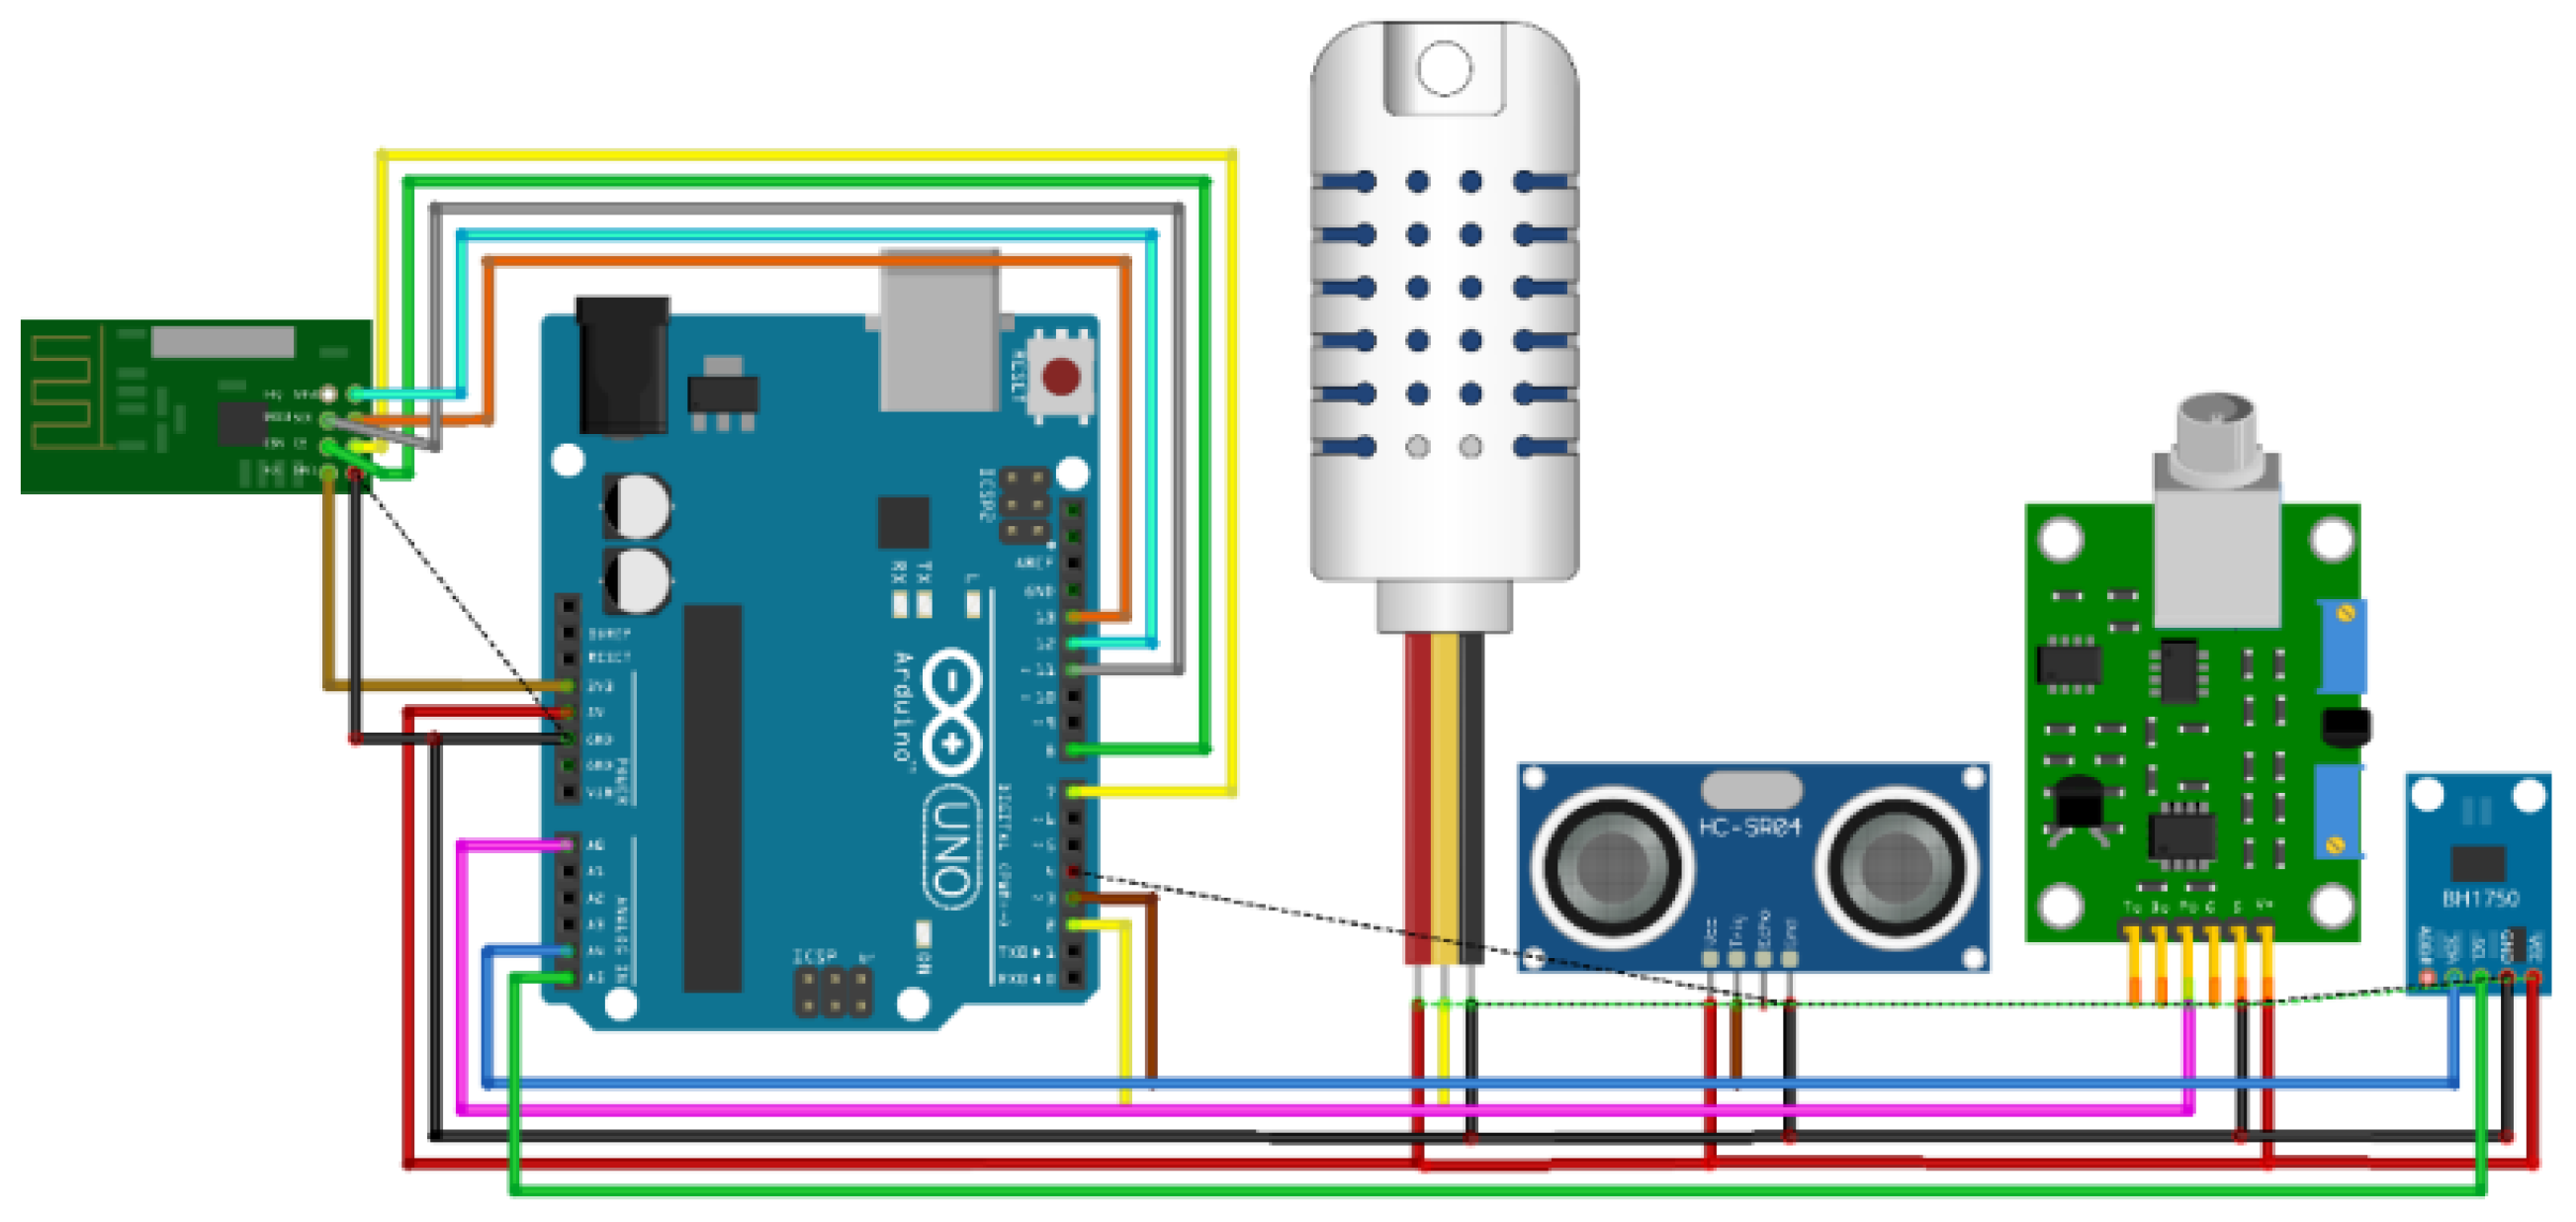
Figure 15.
Schematic diagram of the emitter module.
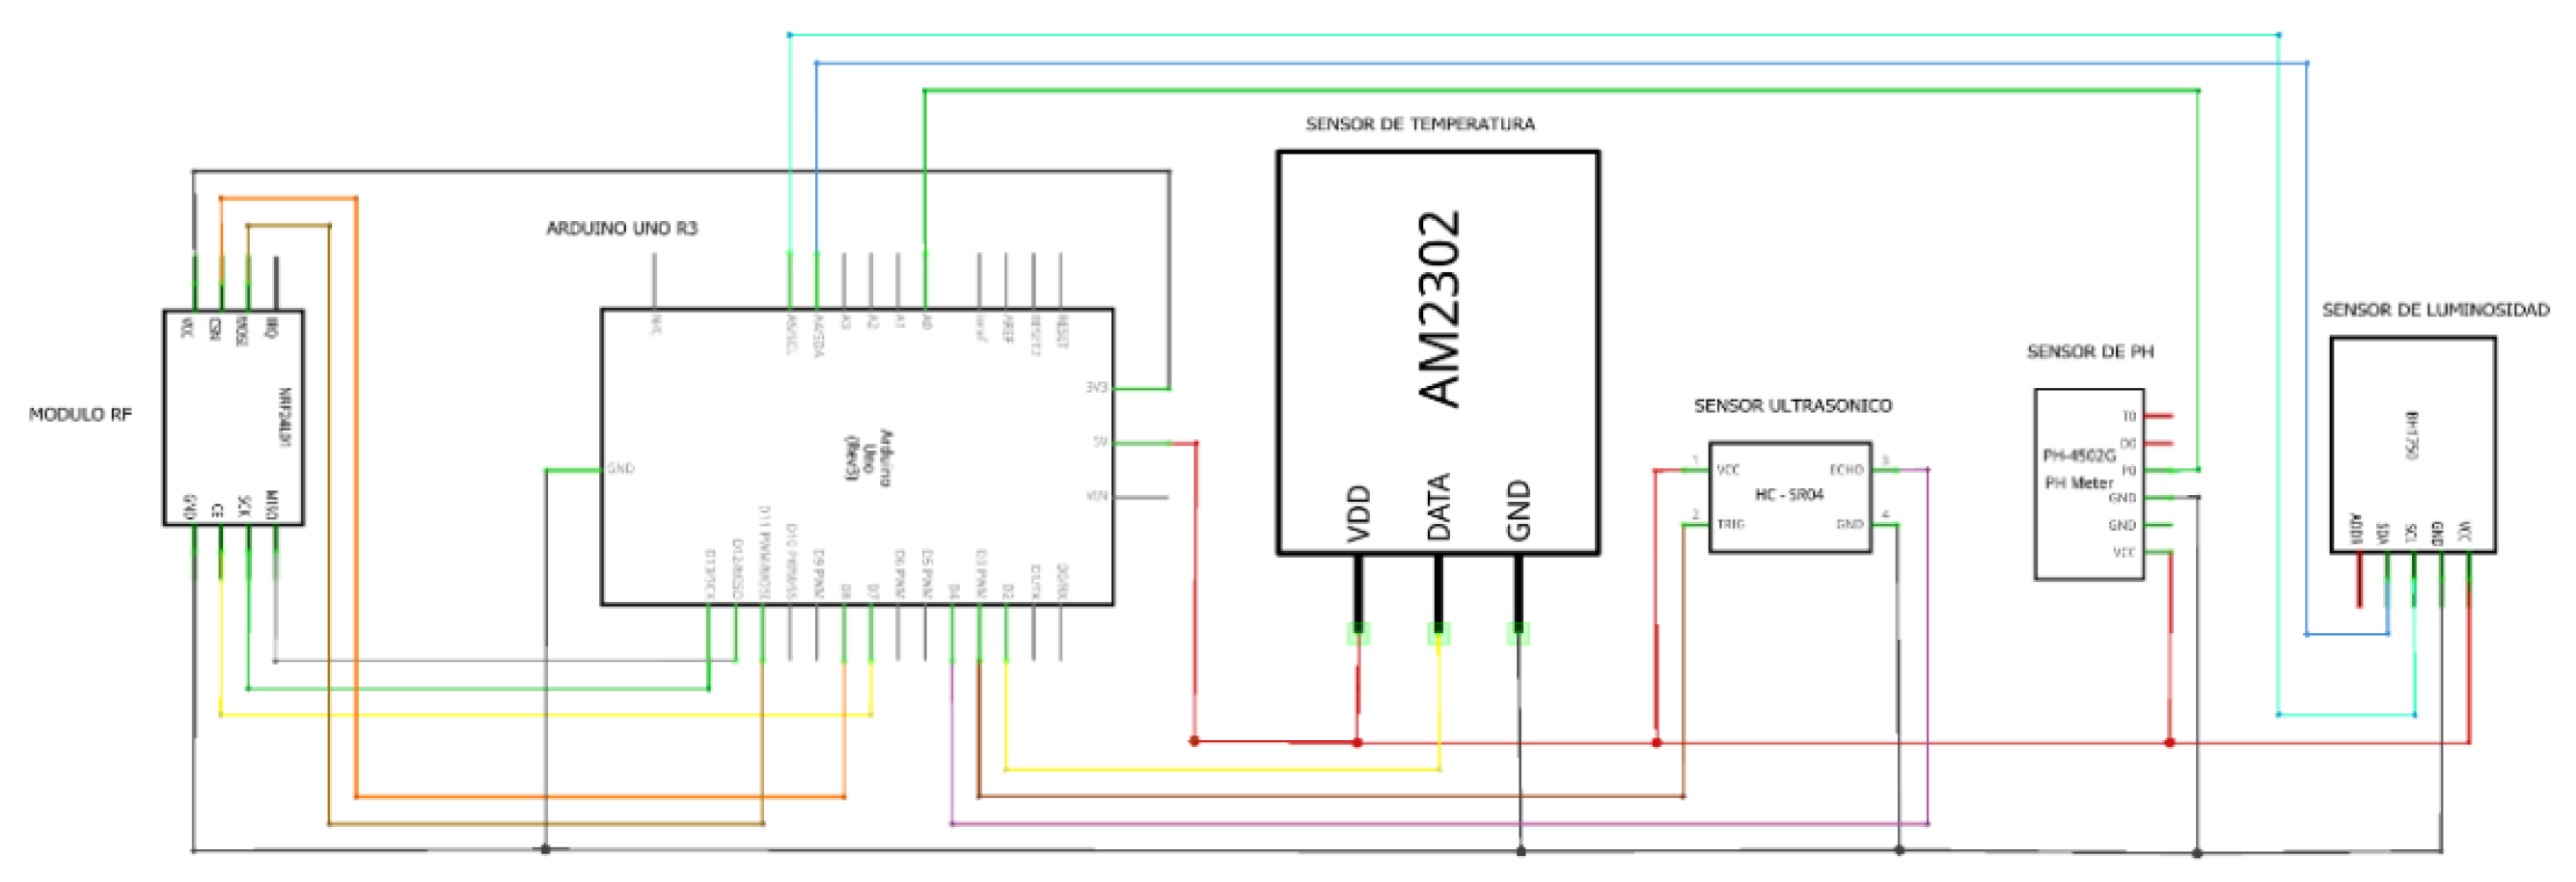
Figure 16.
Actual connection diagram of the receiver module.
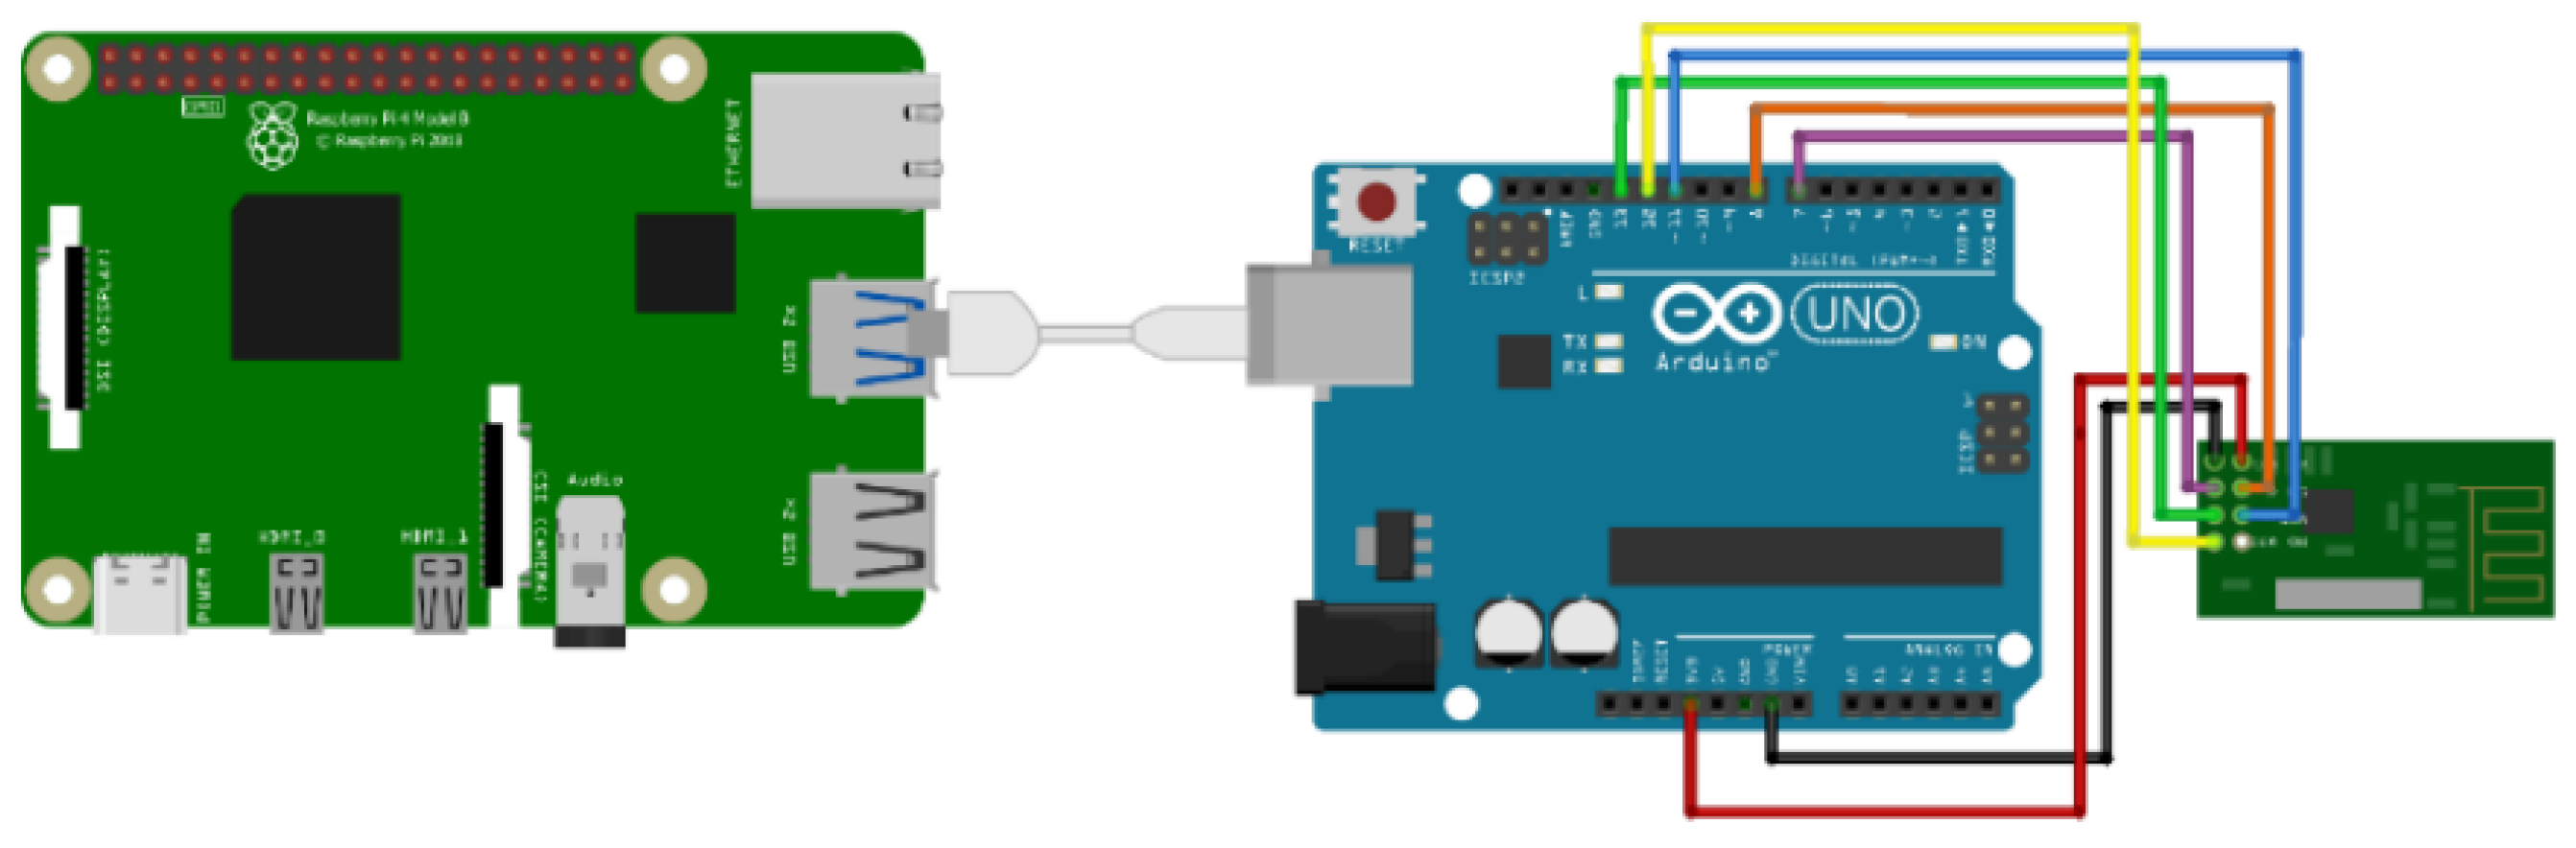
Figure 17.
Schematic diagram of the receiver module.
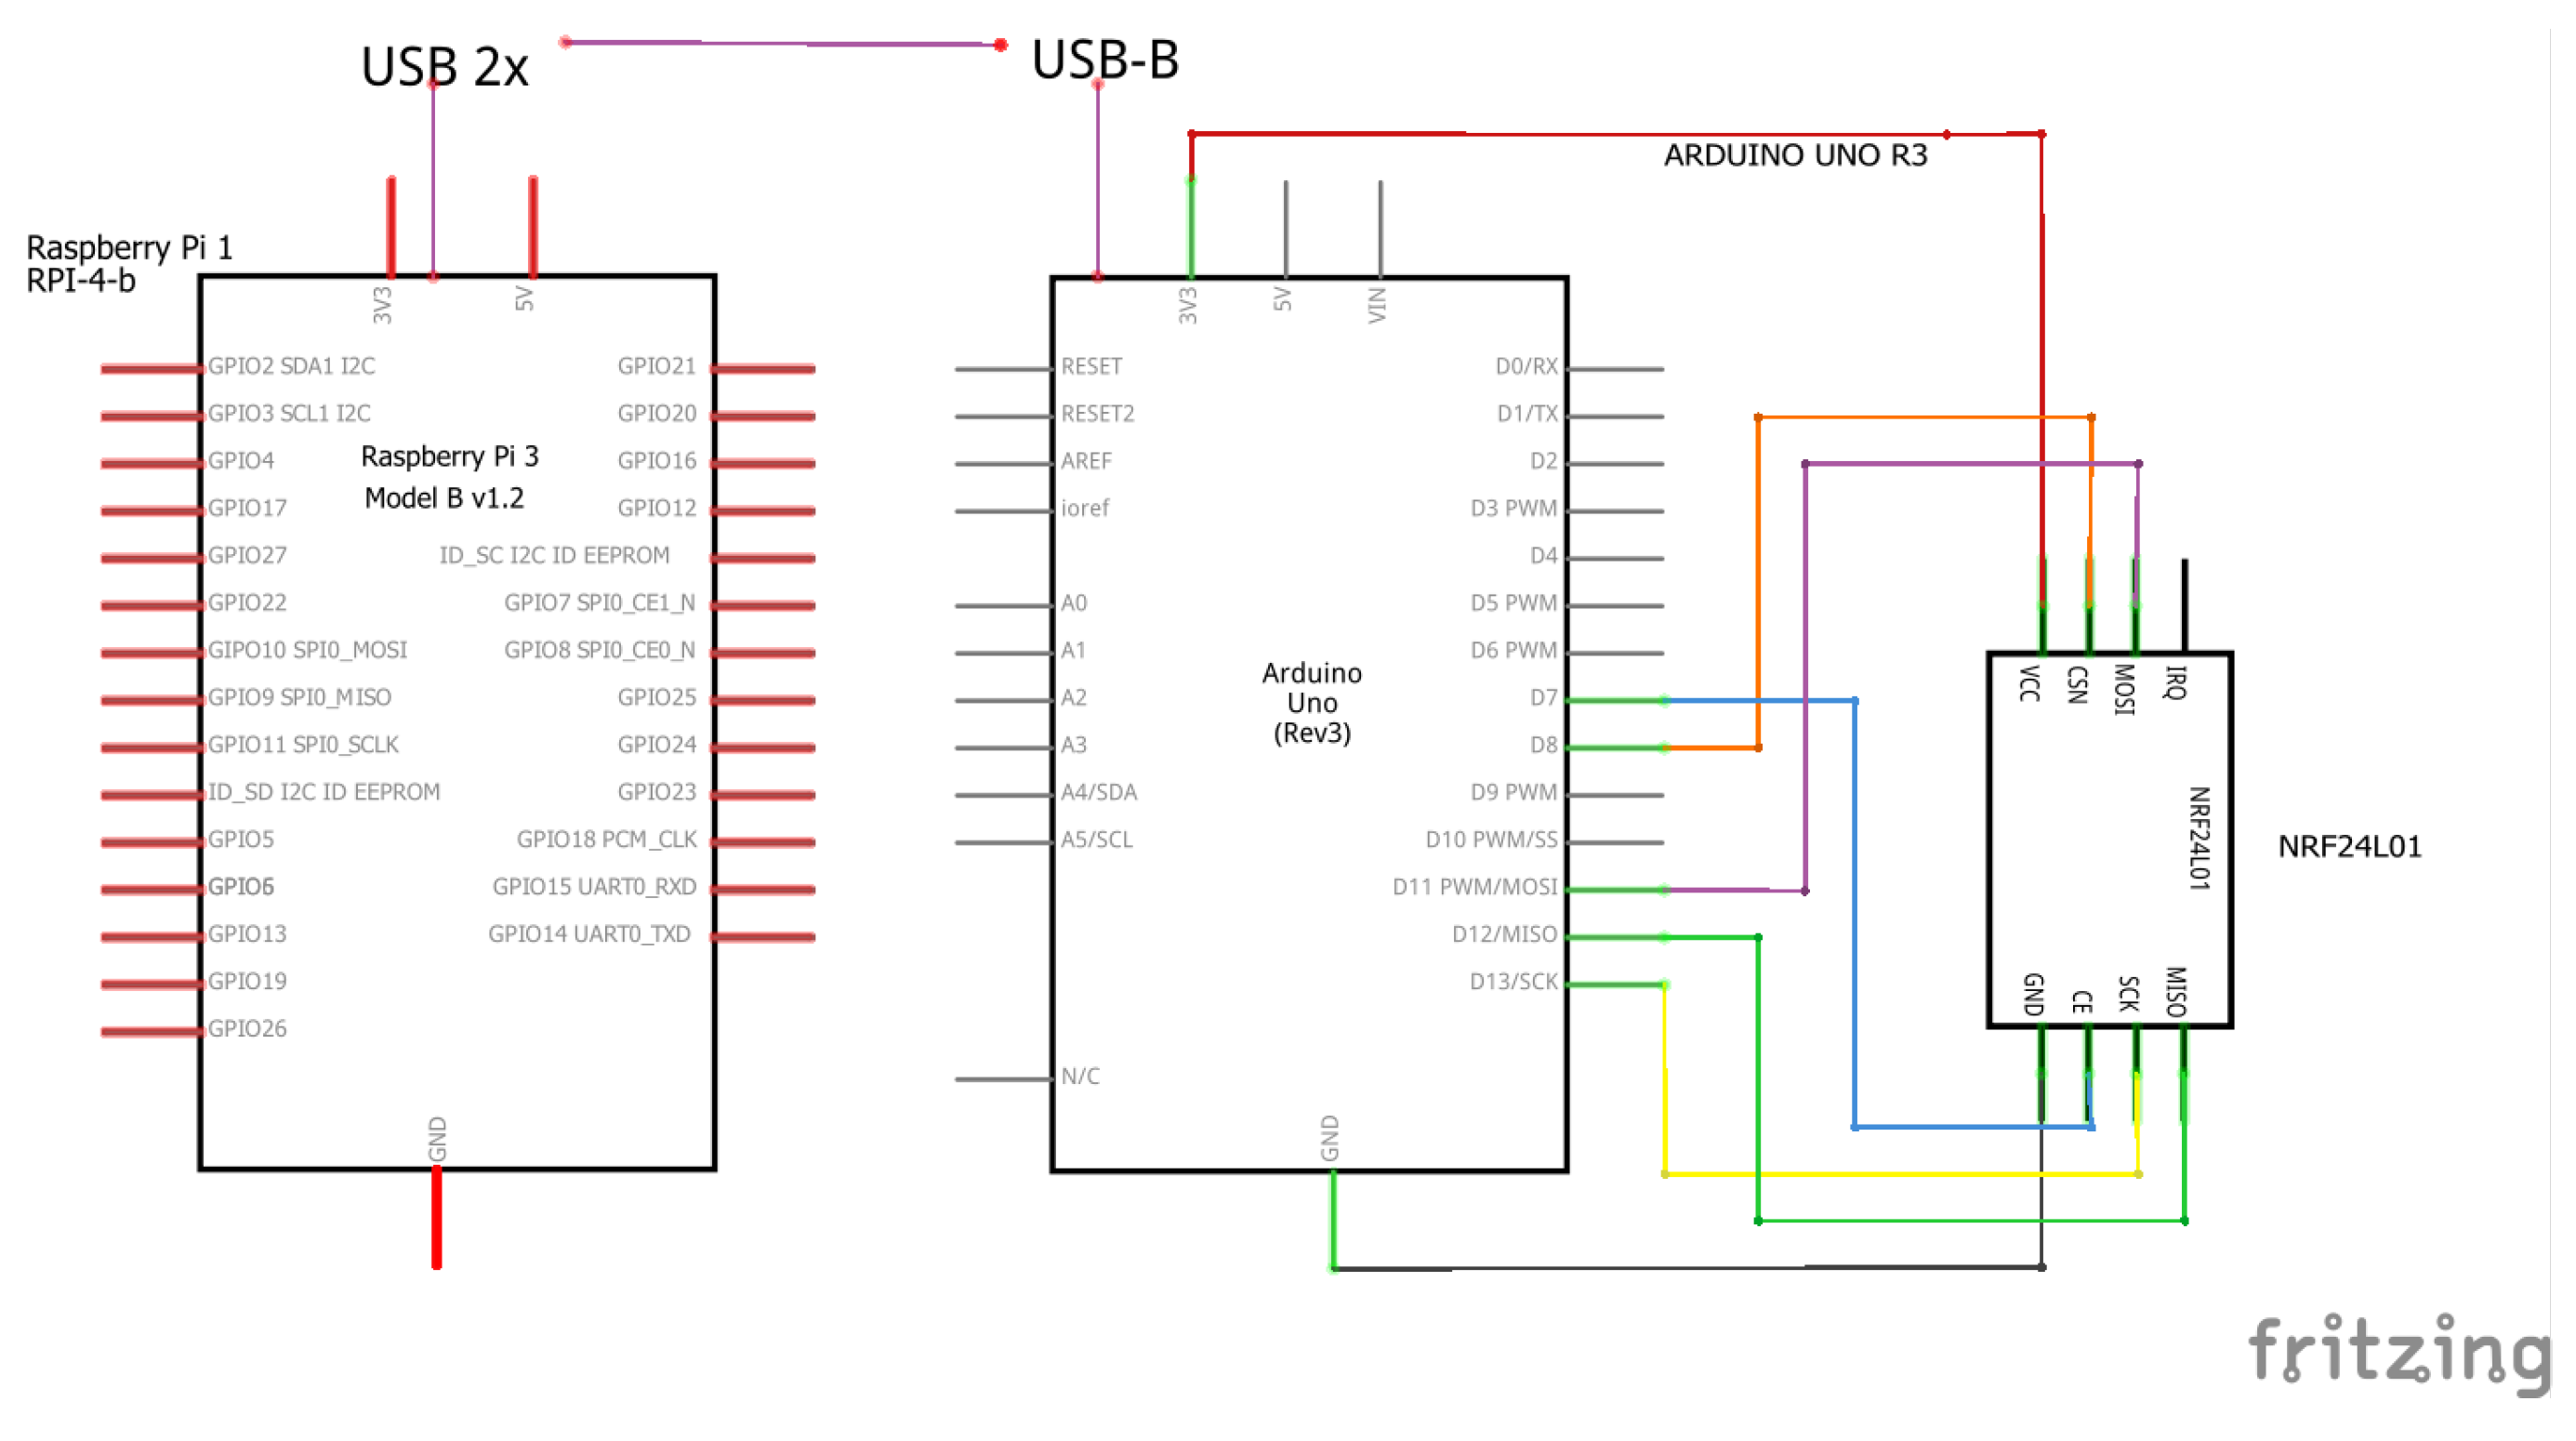
Figure 18.
Actual wiring diagram of the control module.
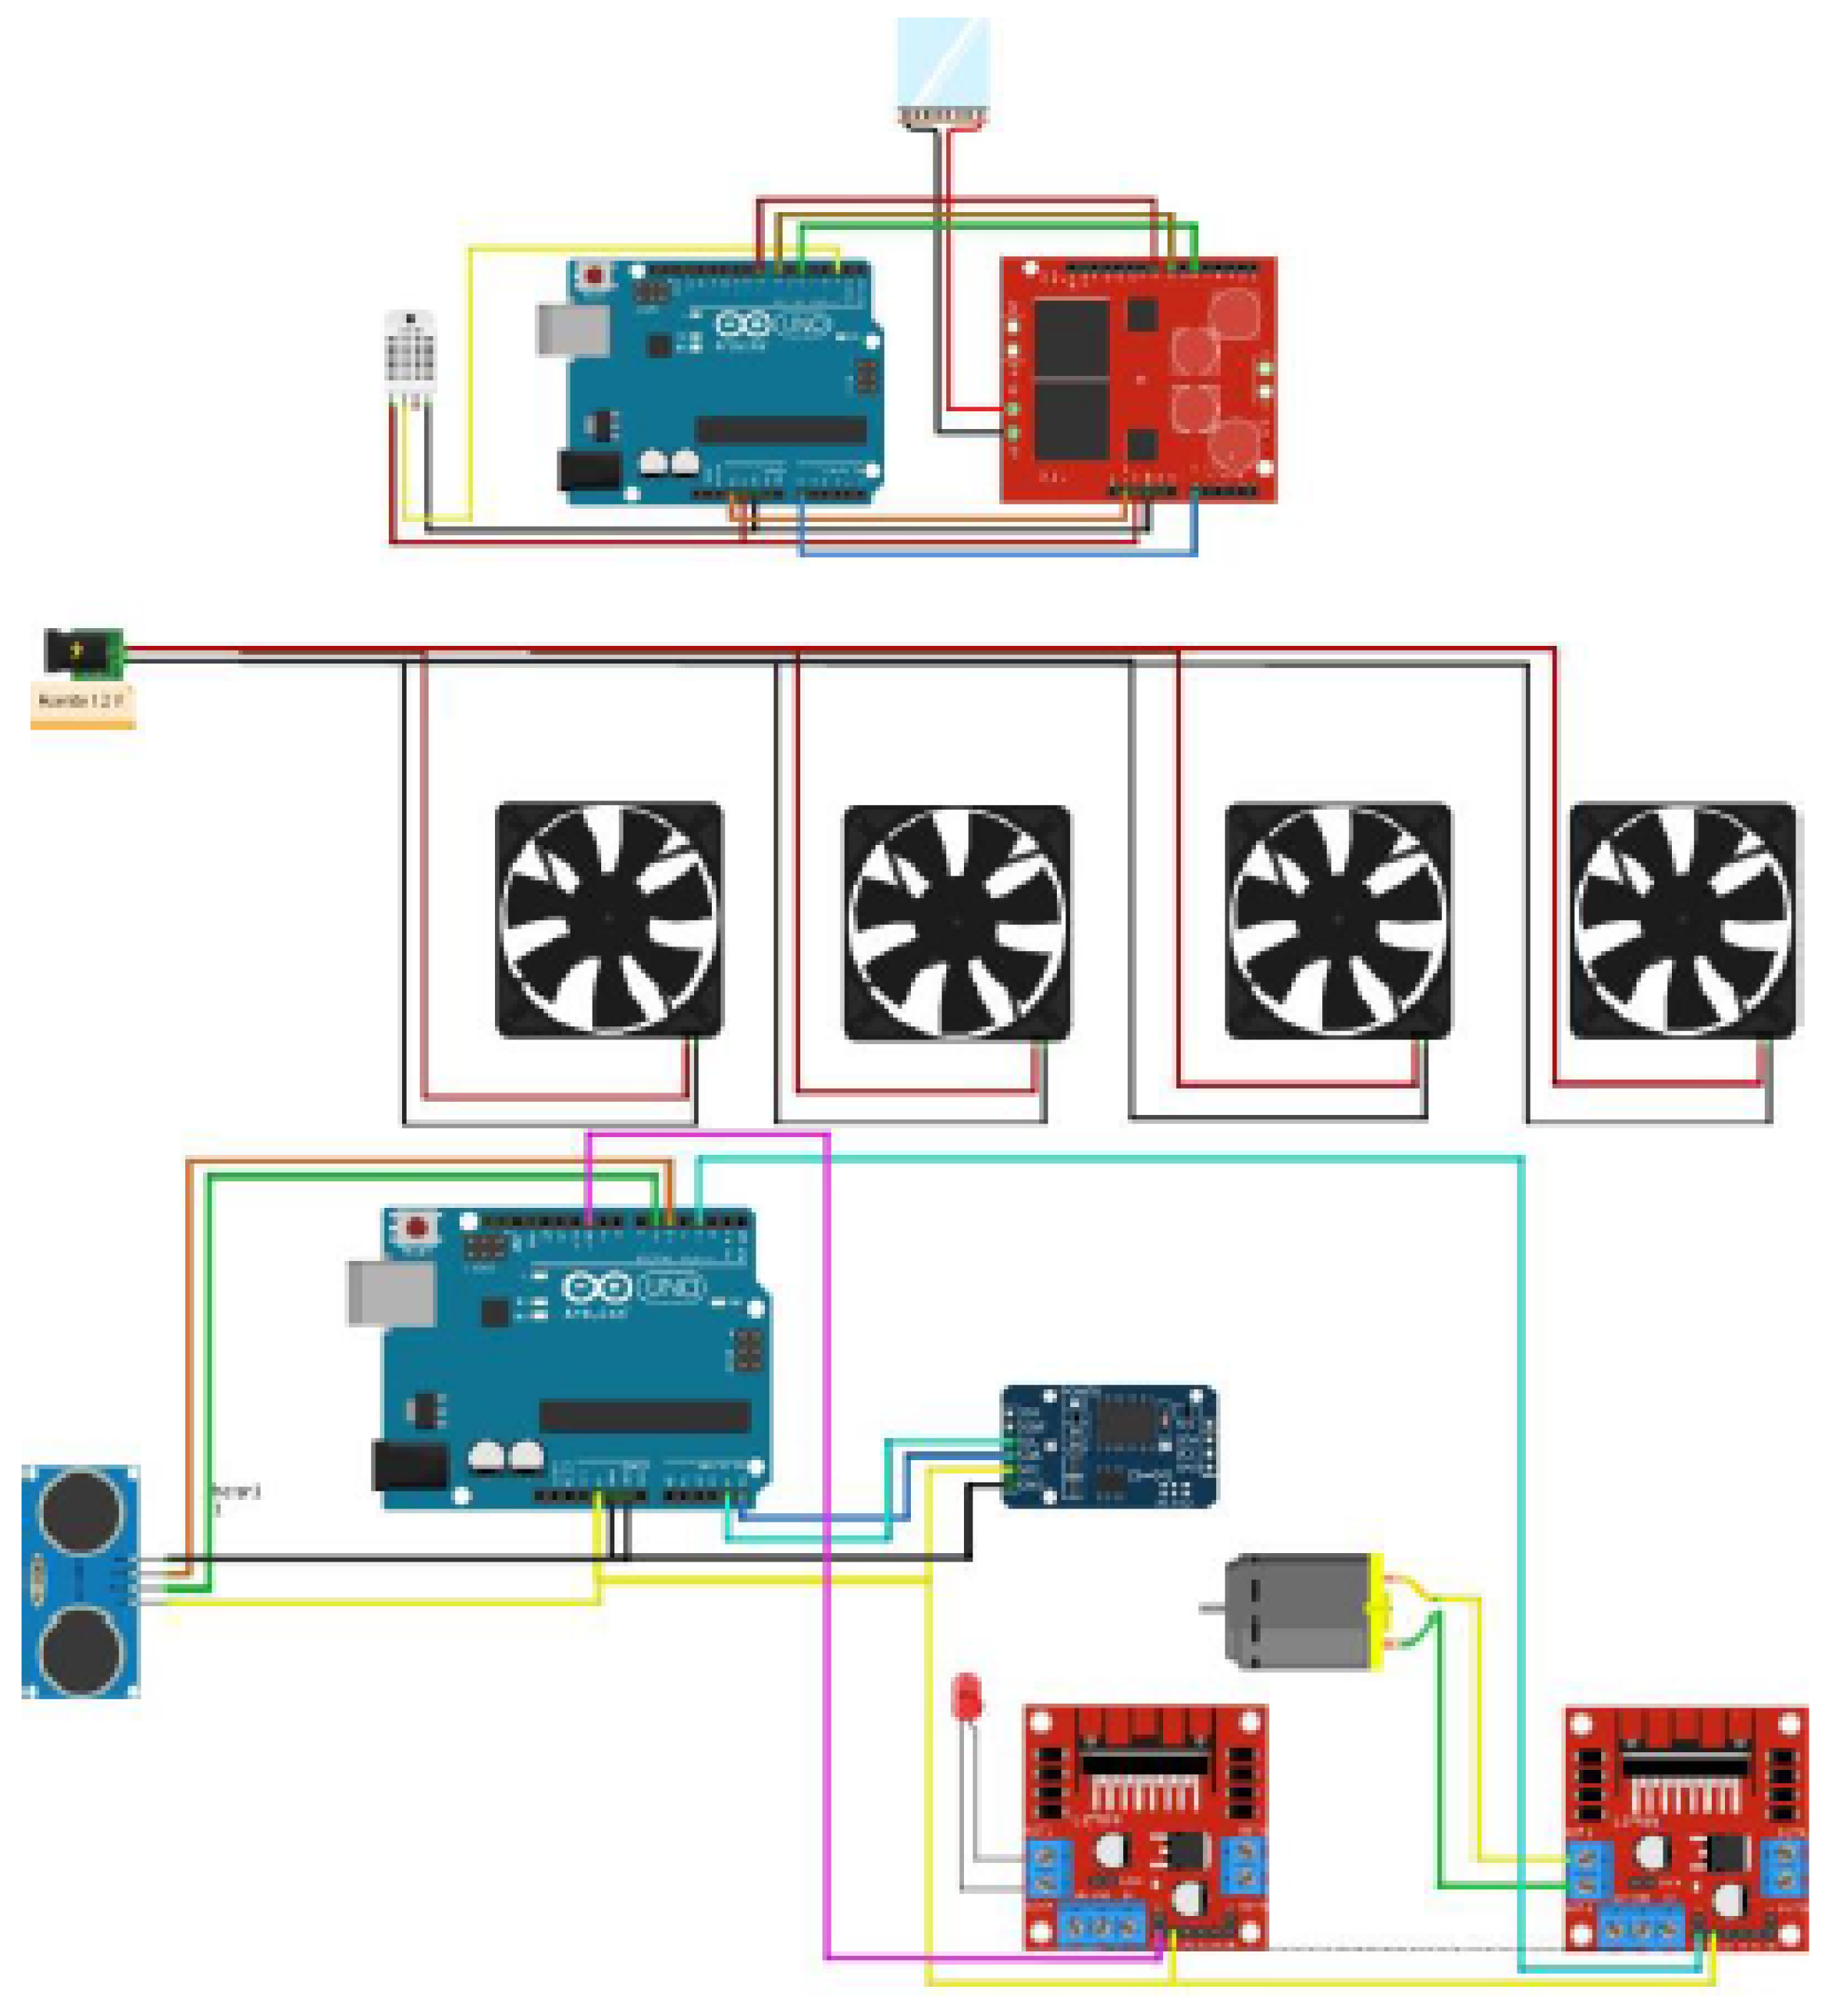
Figure 19.
Actual wiring diagram of the control module. (Part1)
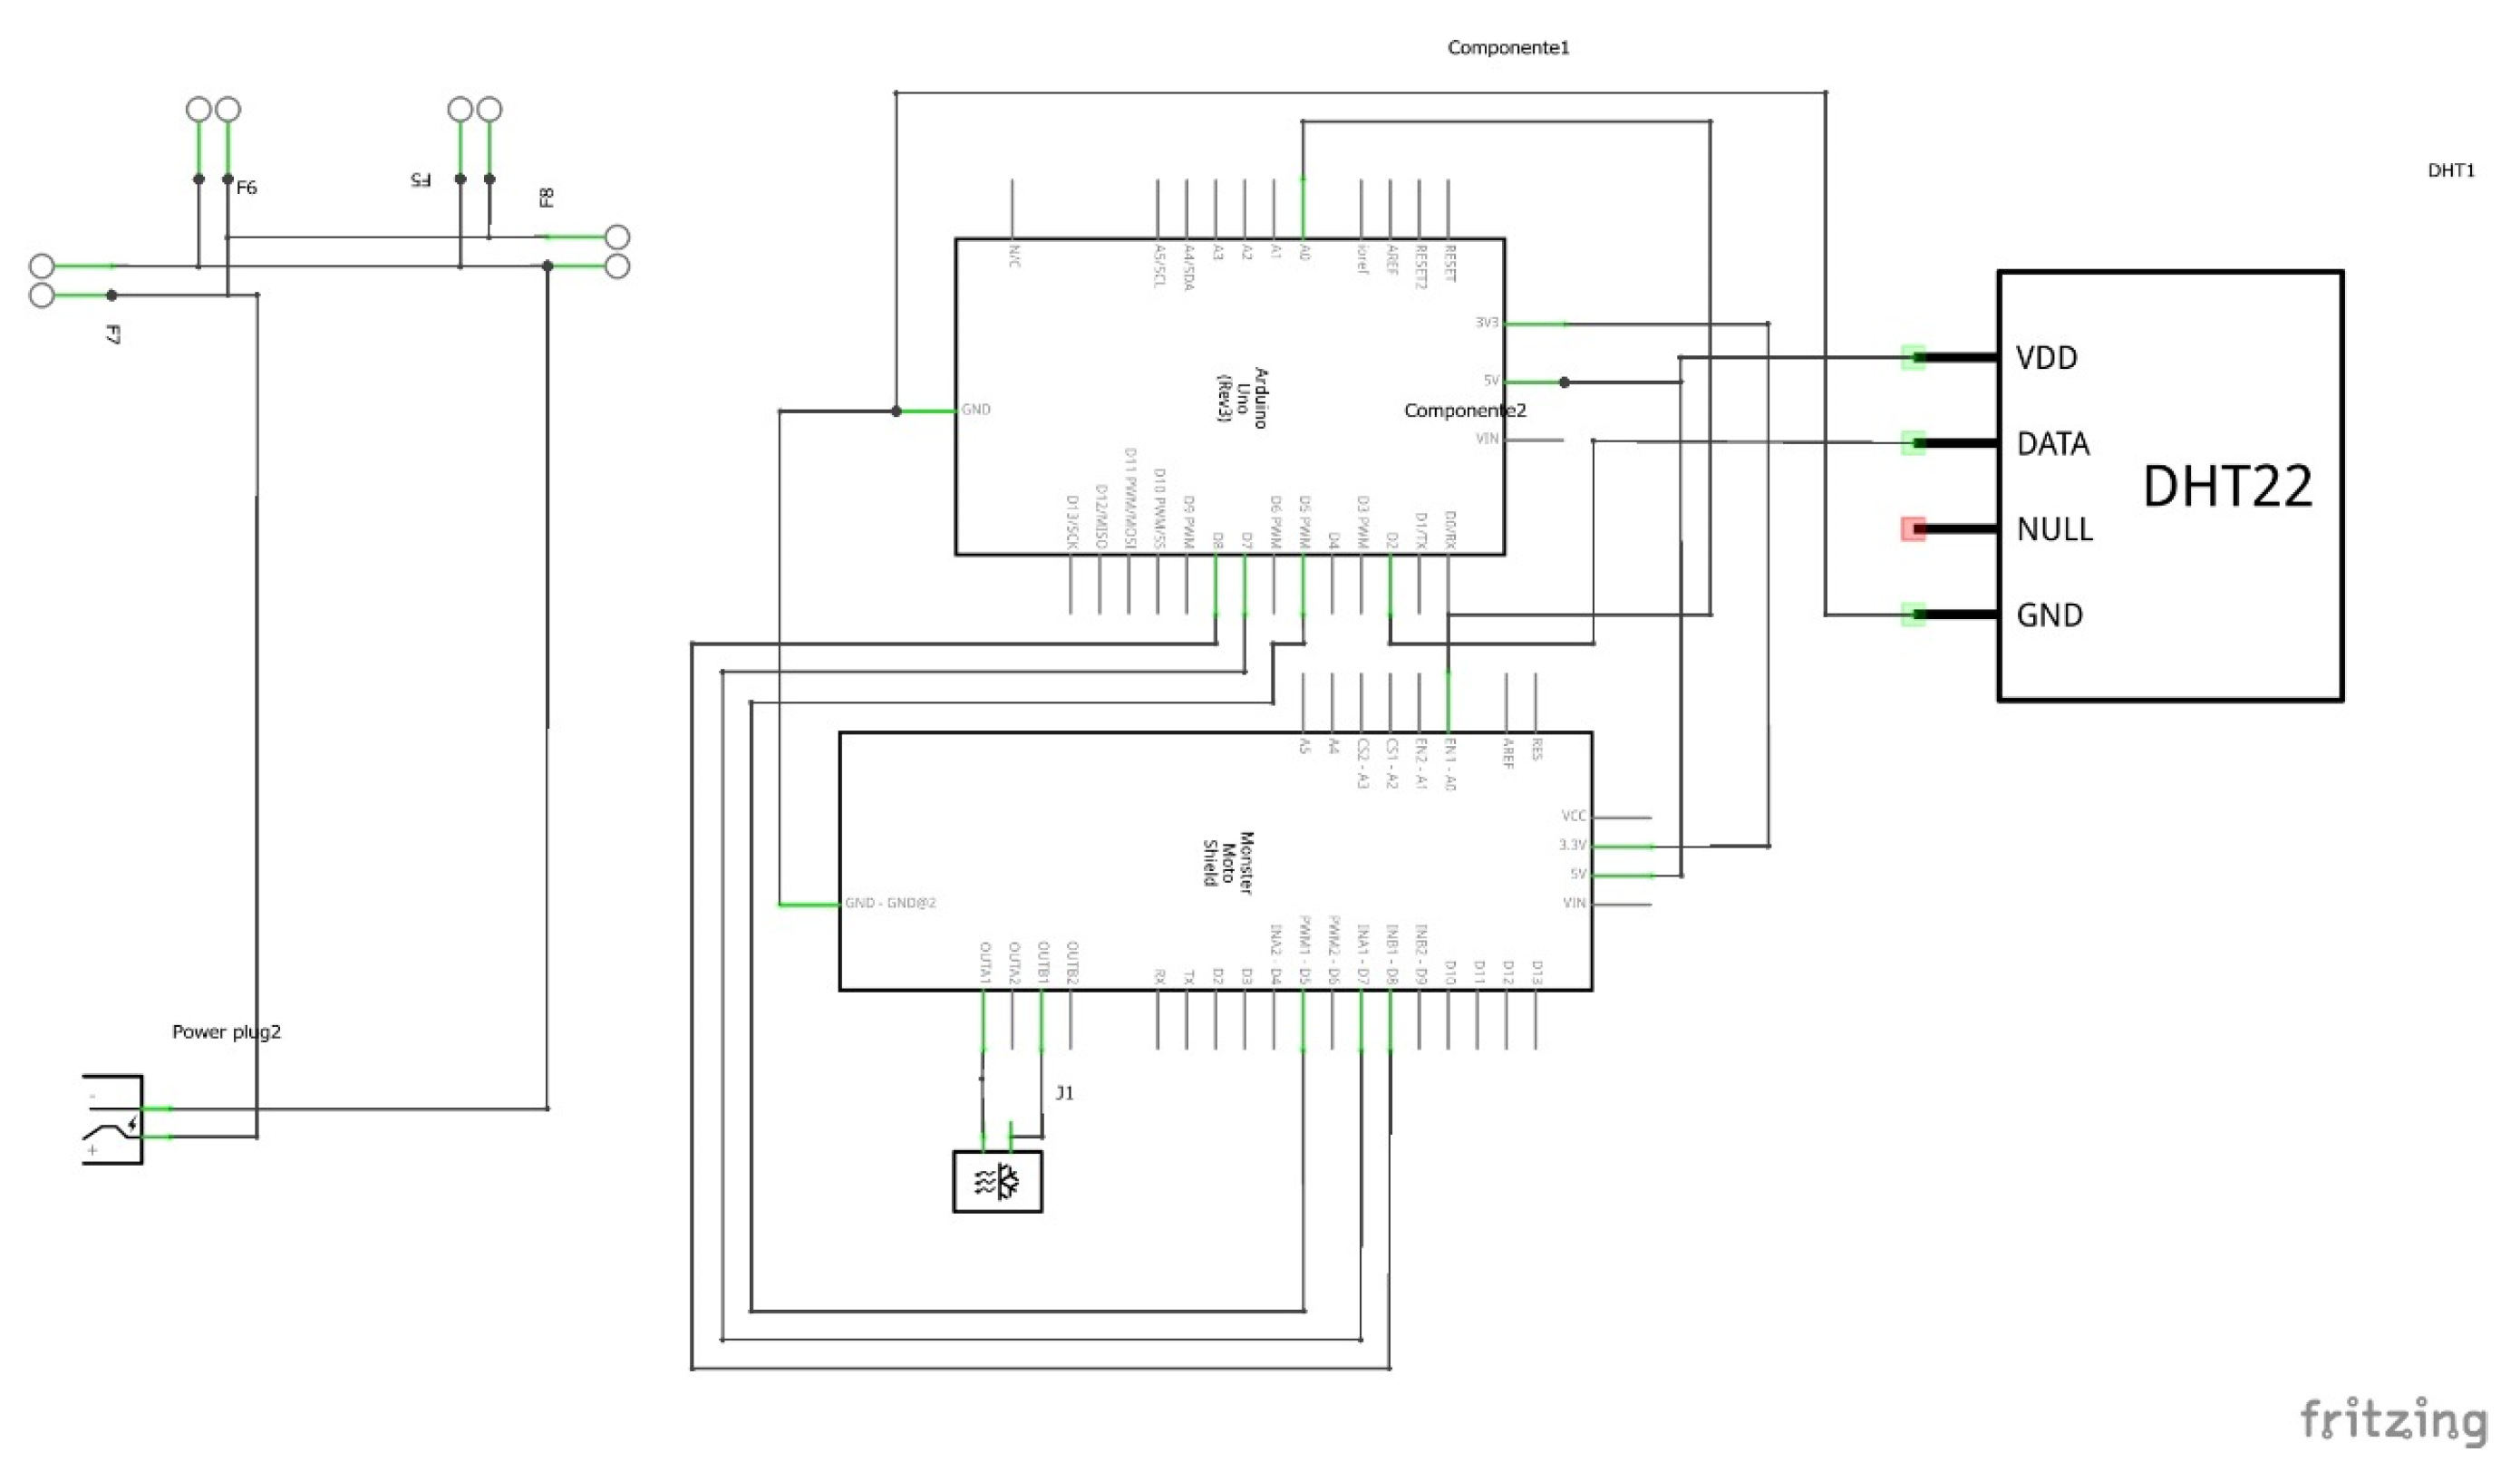
Figure 20.
Actual wiring diagram of the control module. (Part2)
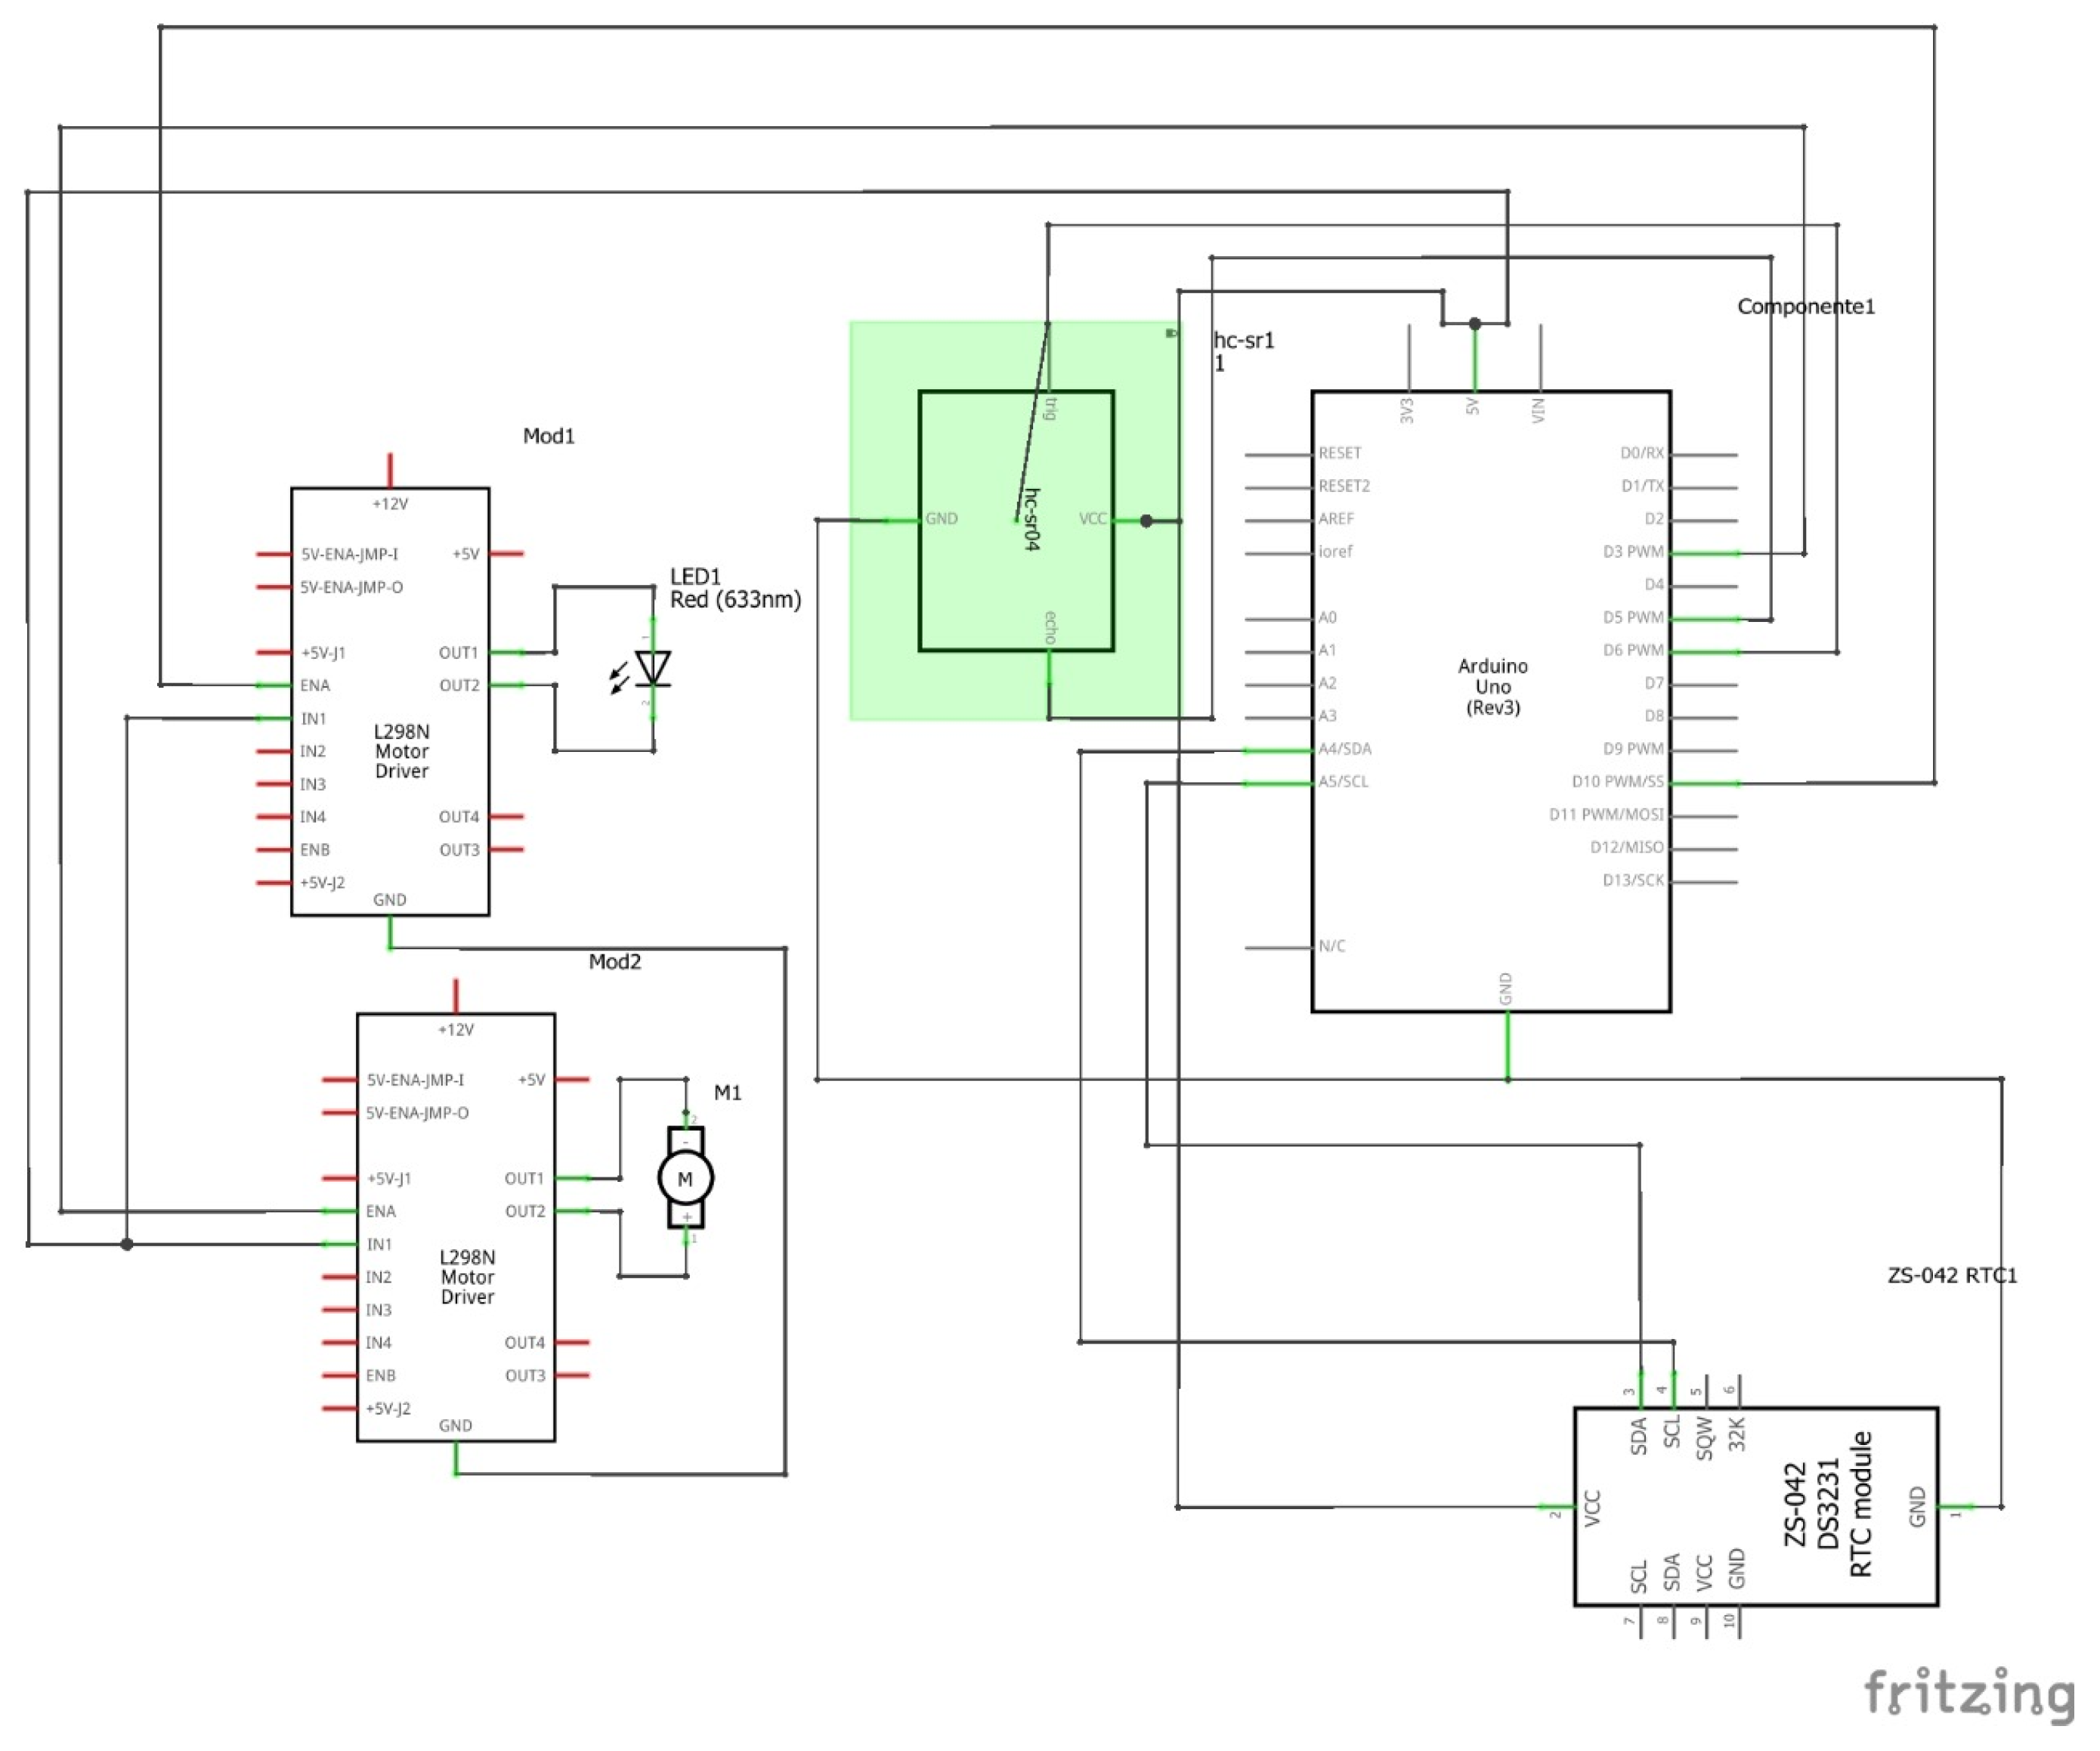
Figure 21.
Front view of the pilot prototype.
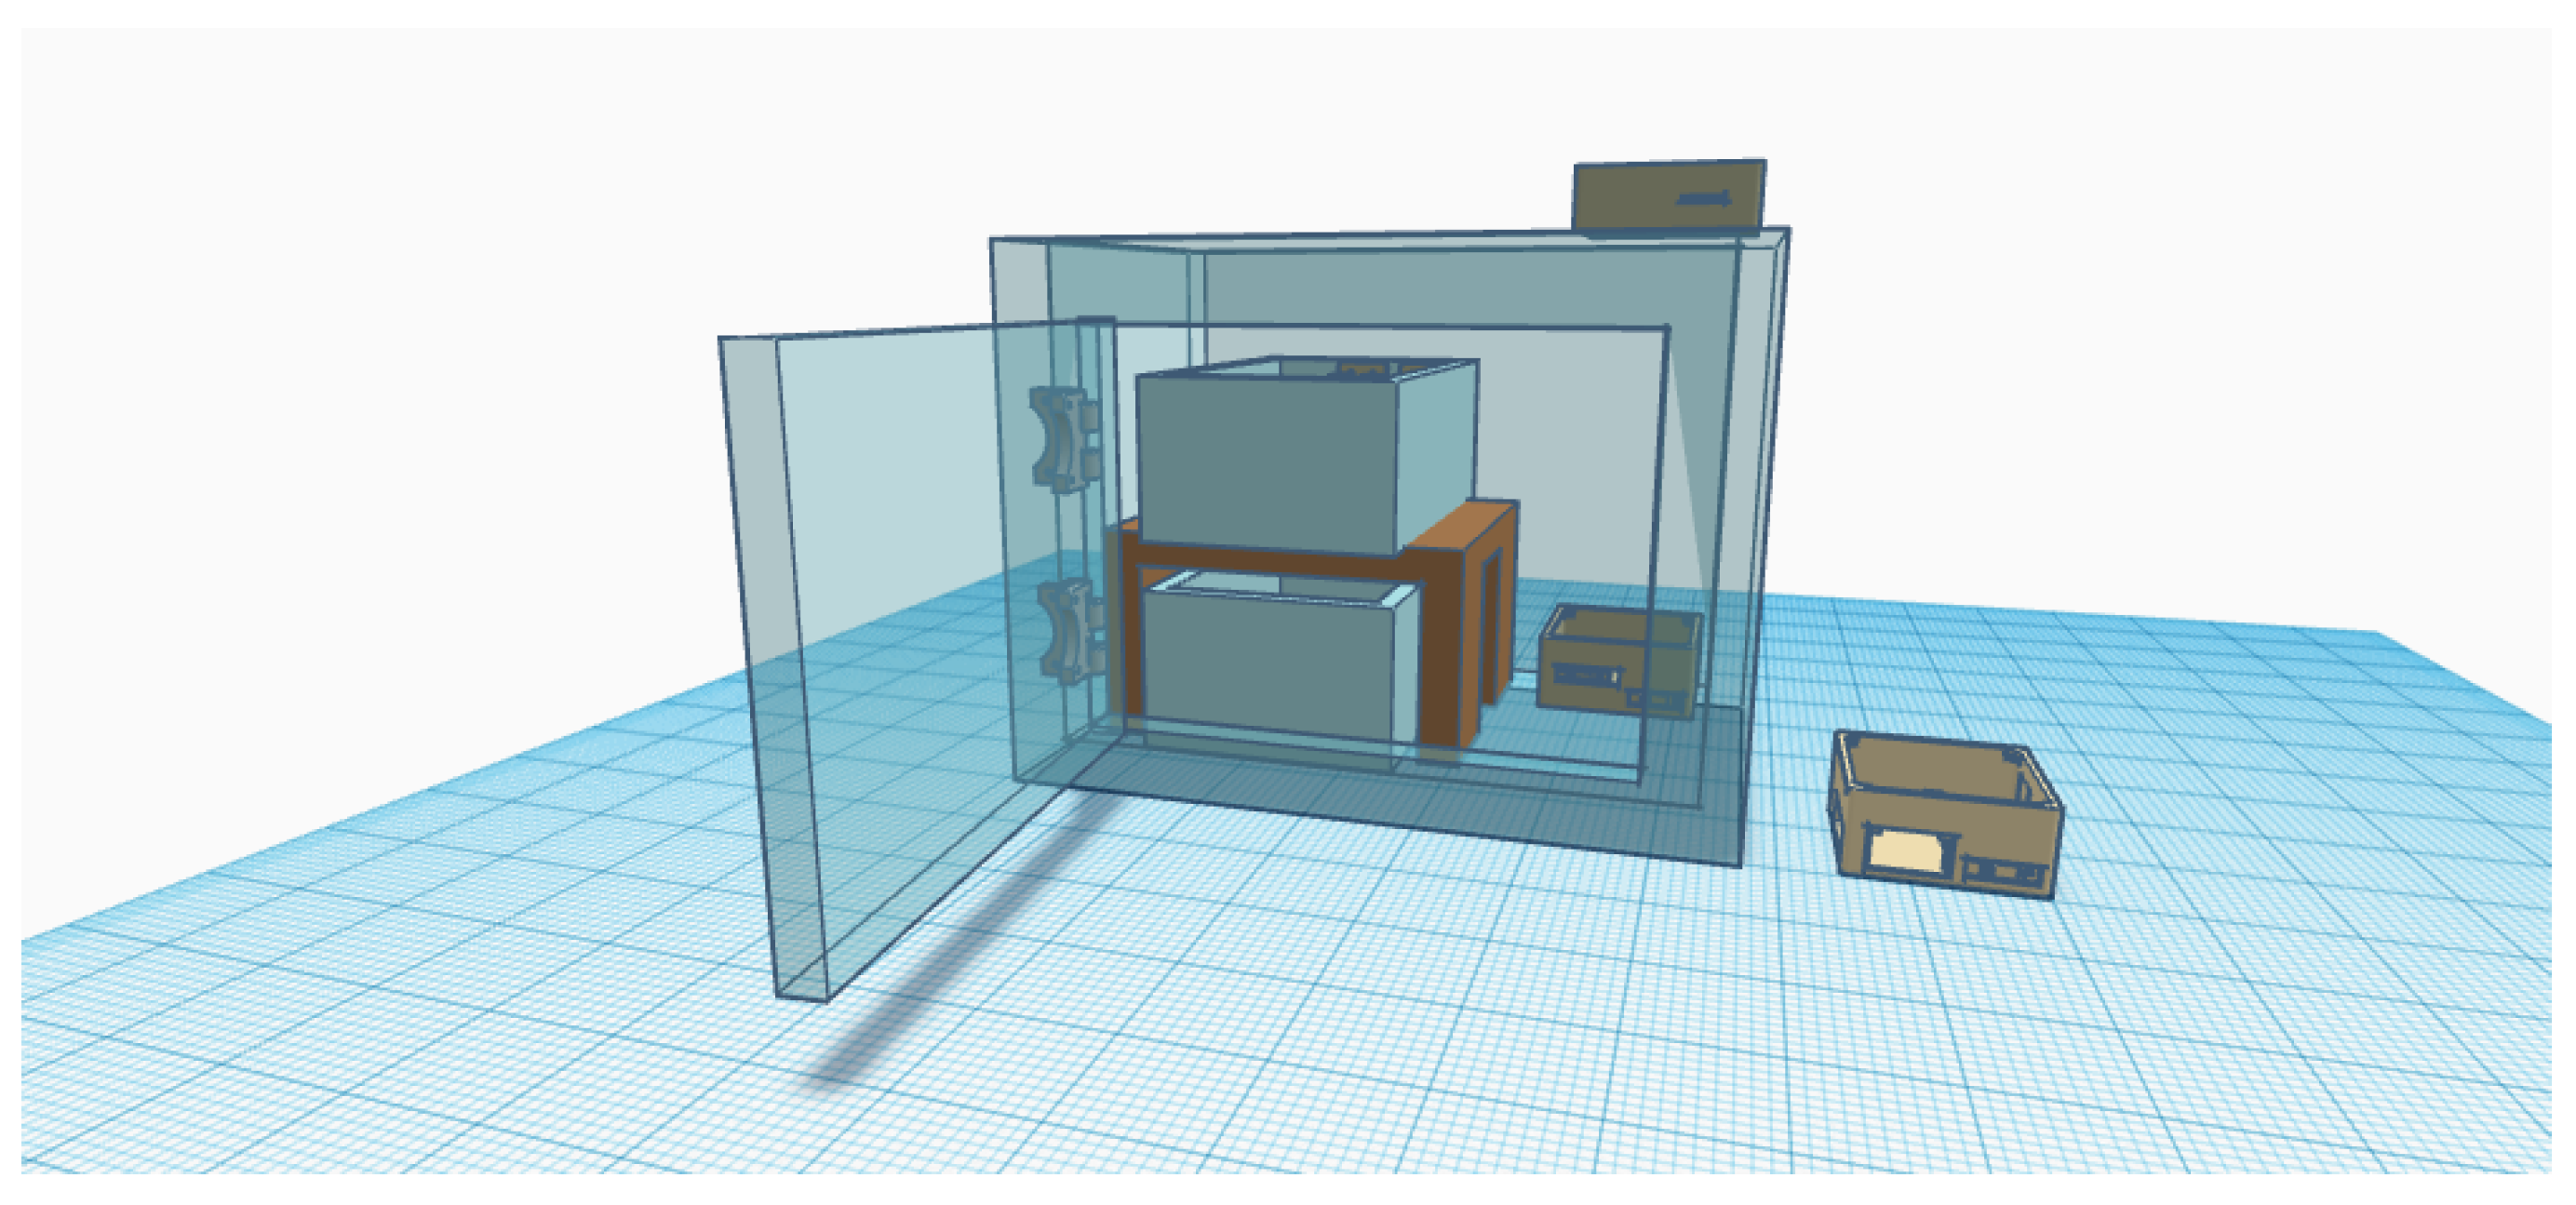
Figure 24.
Top view of the receiver module.
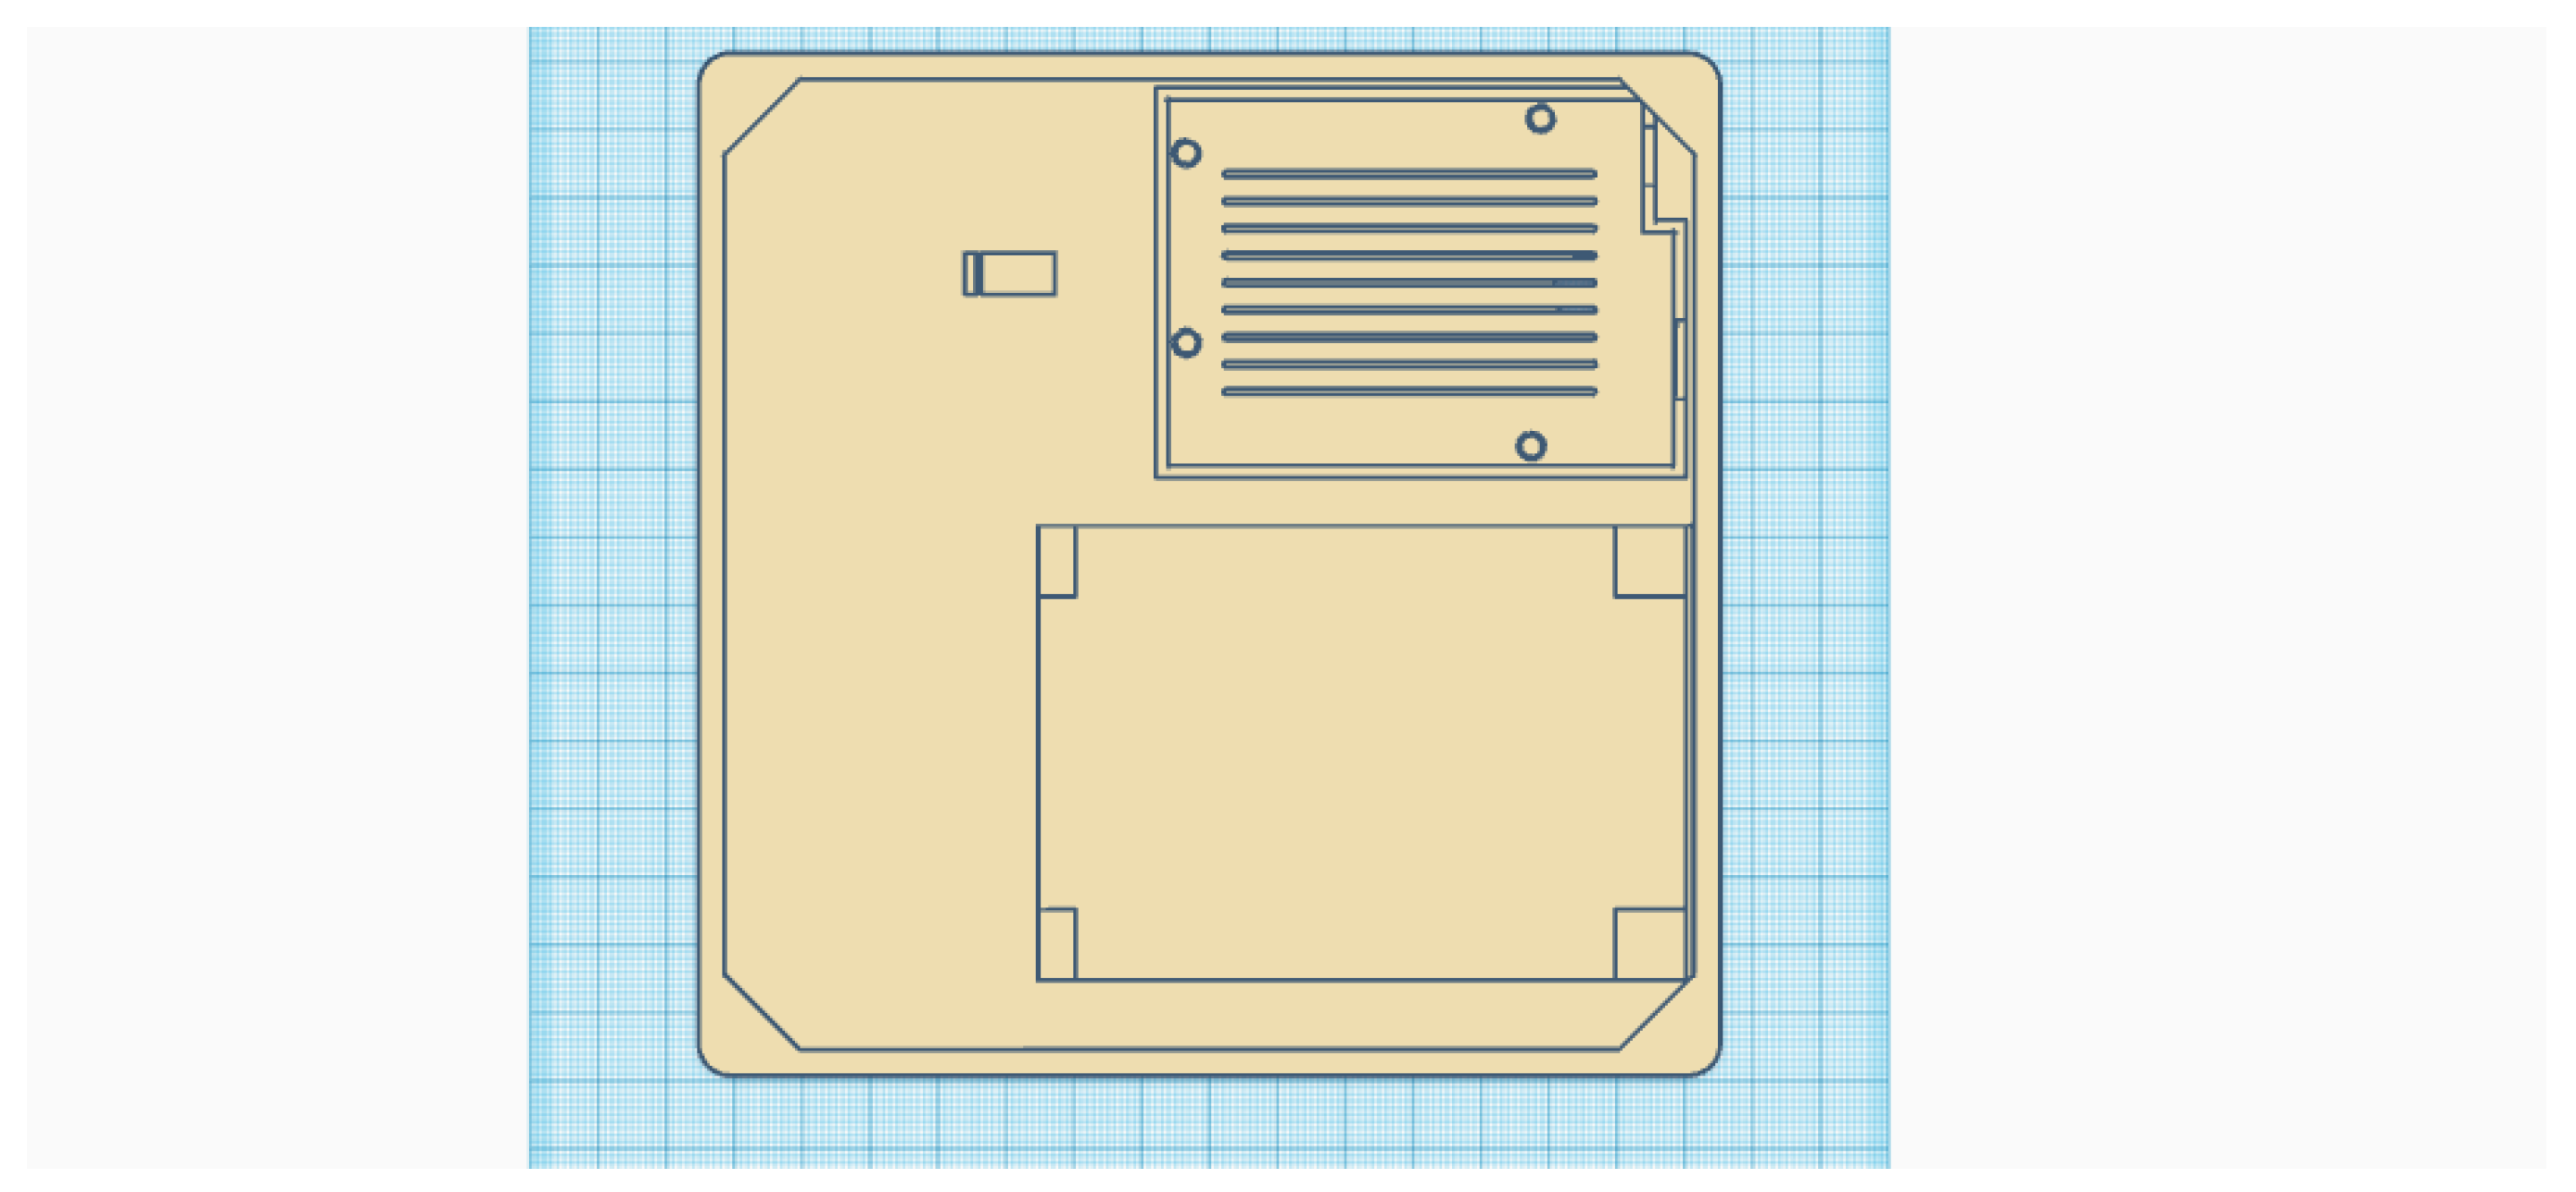
Figure 25.
Top view of the control module.
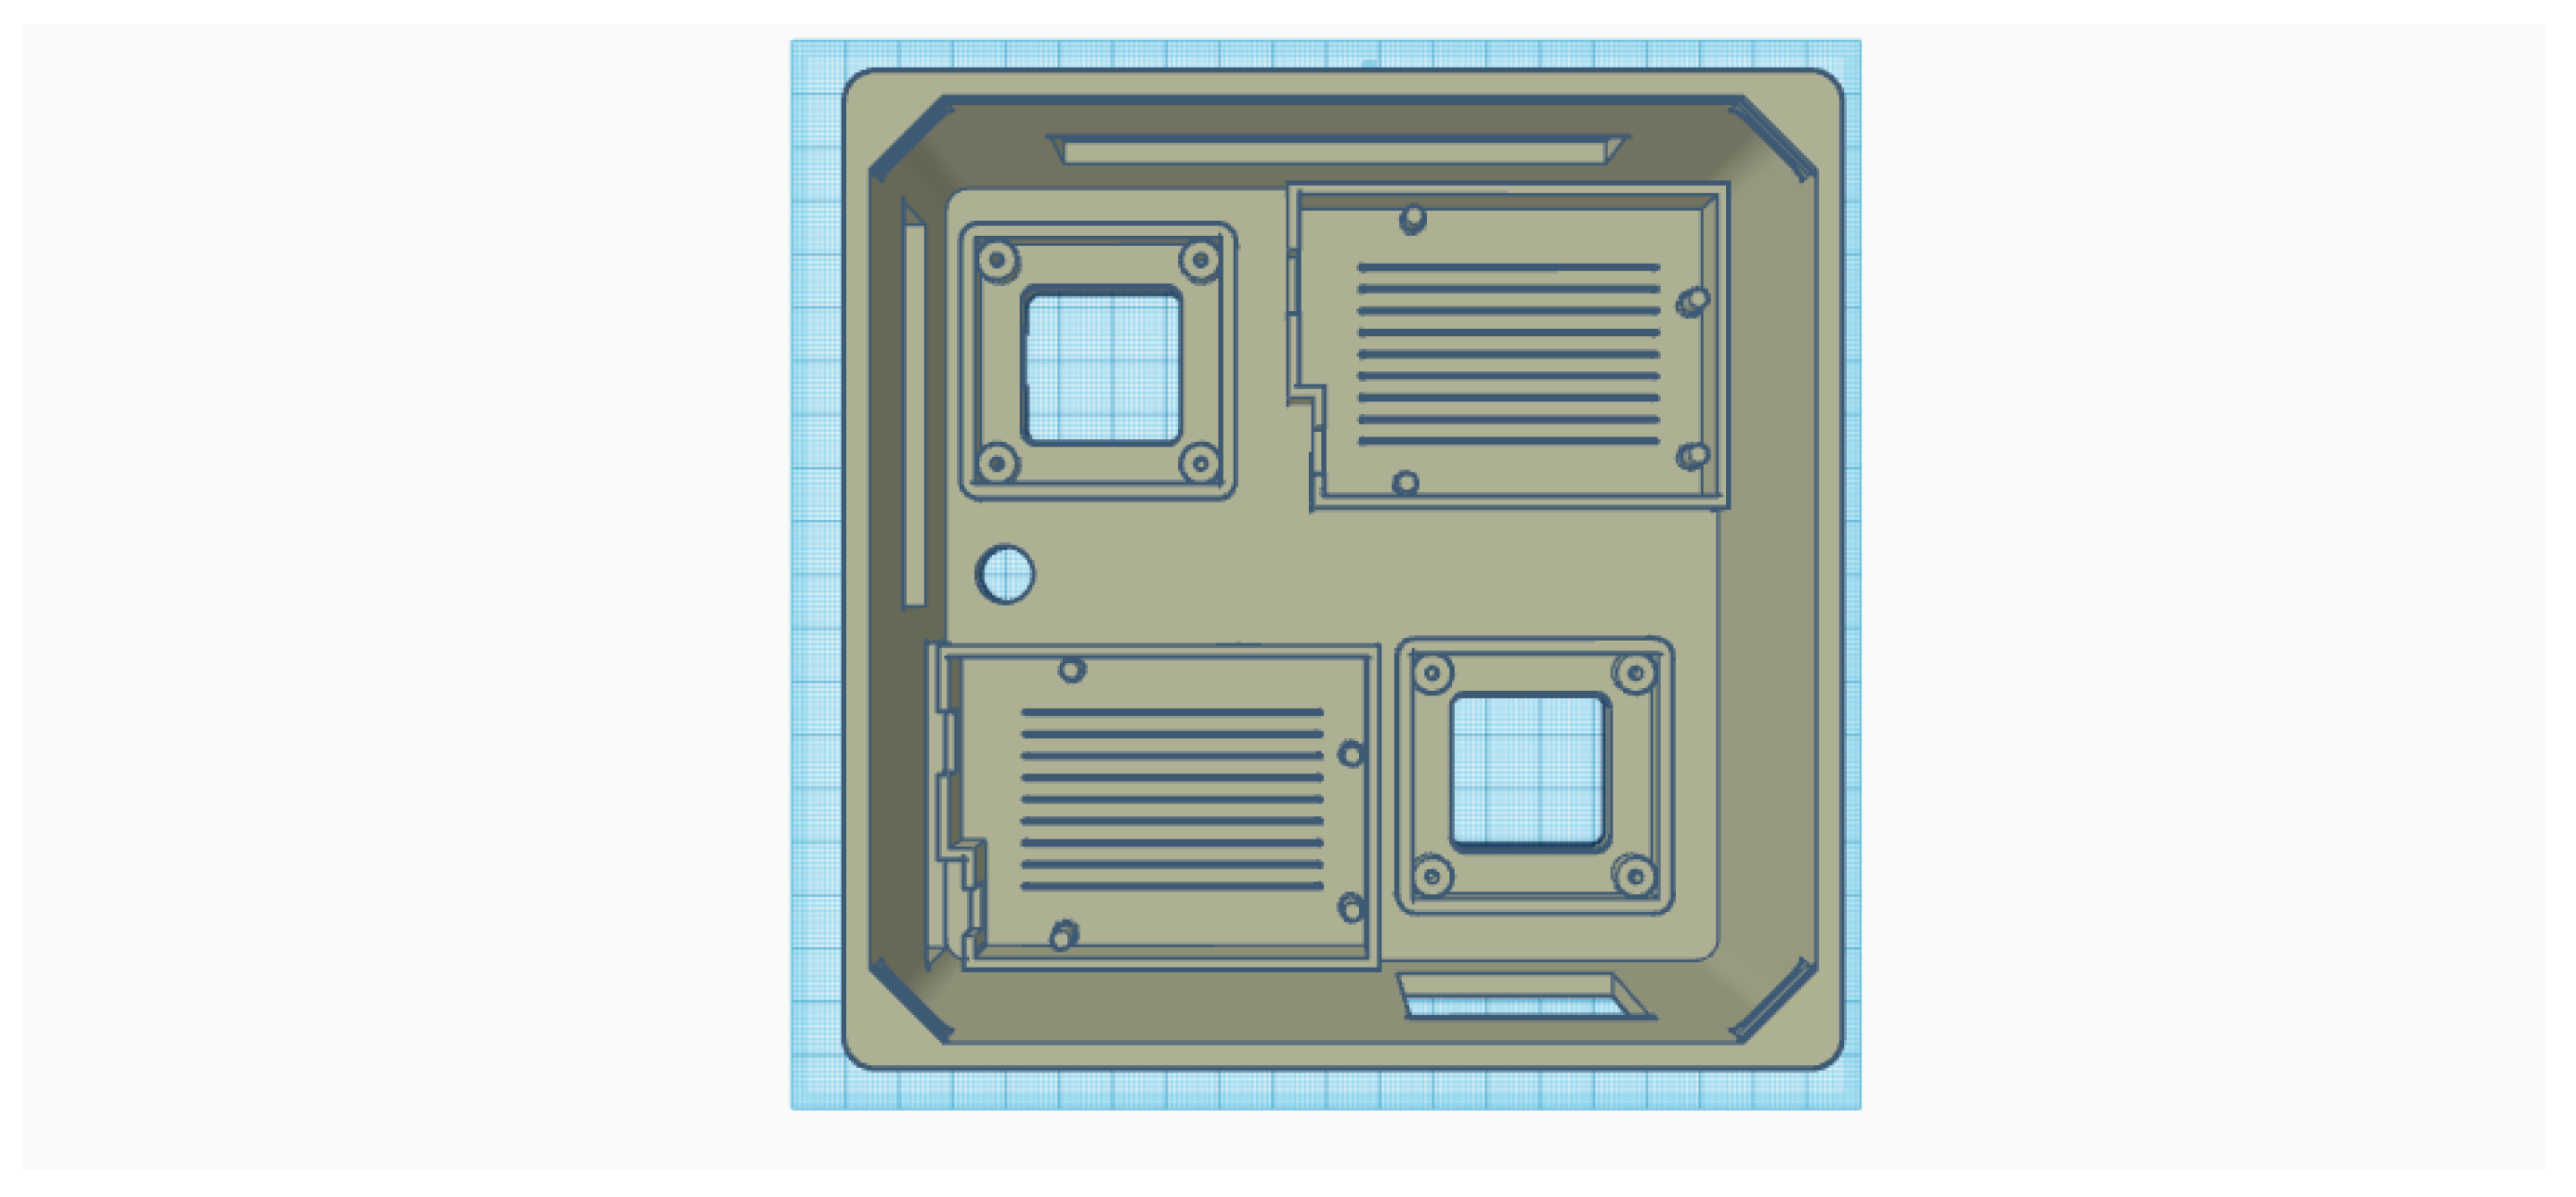
Figure 26.
Receiver module flow diagram.
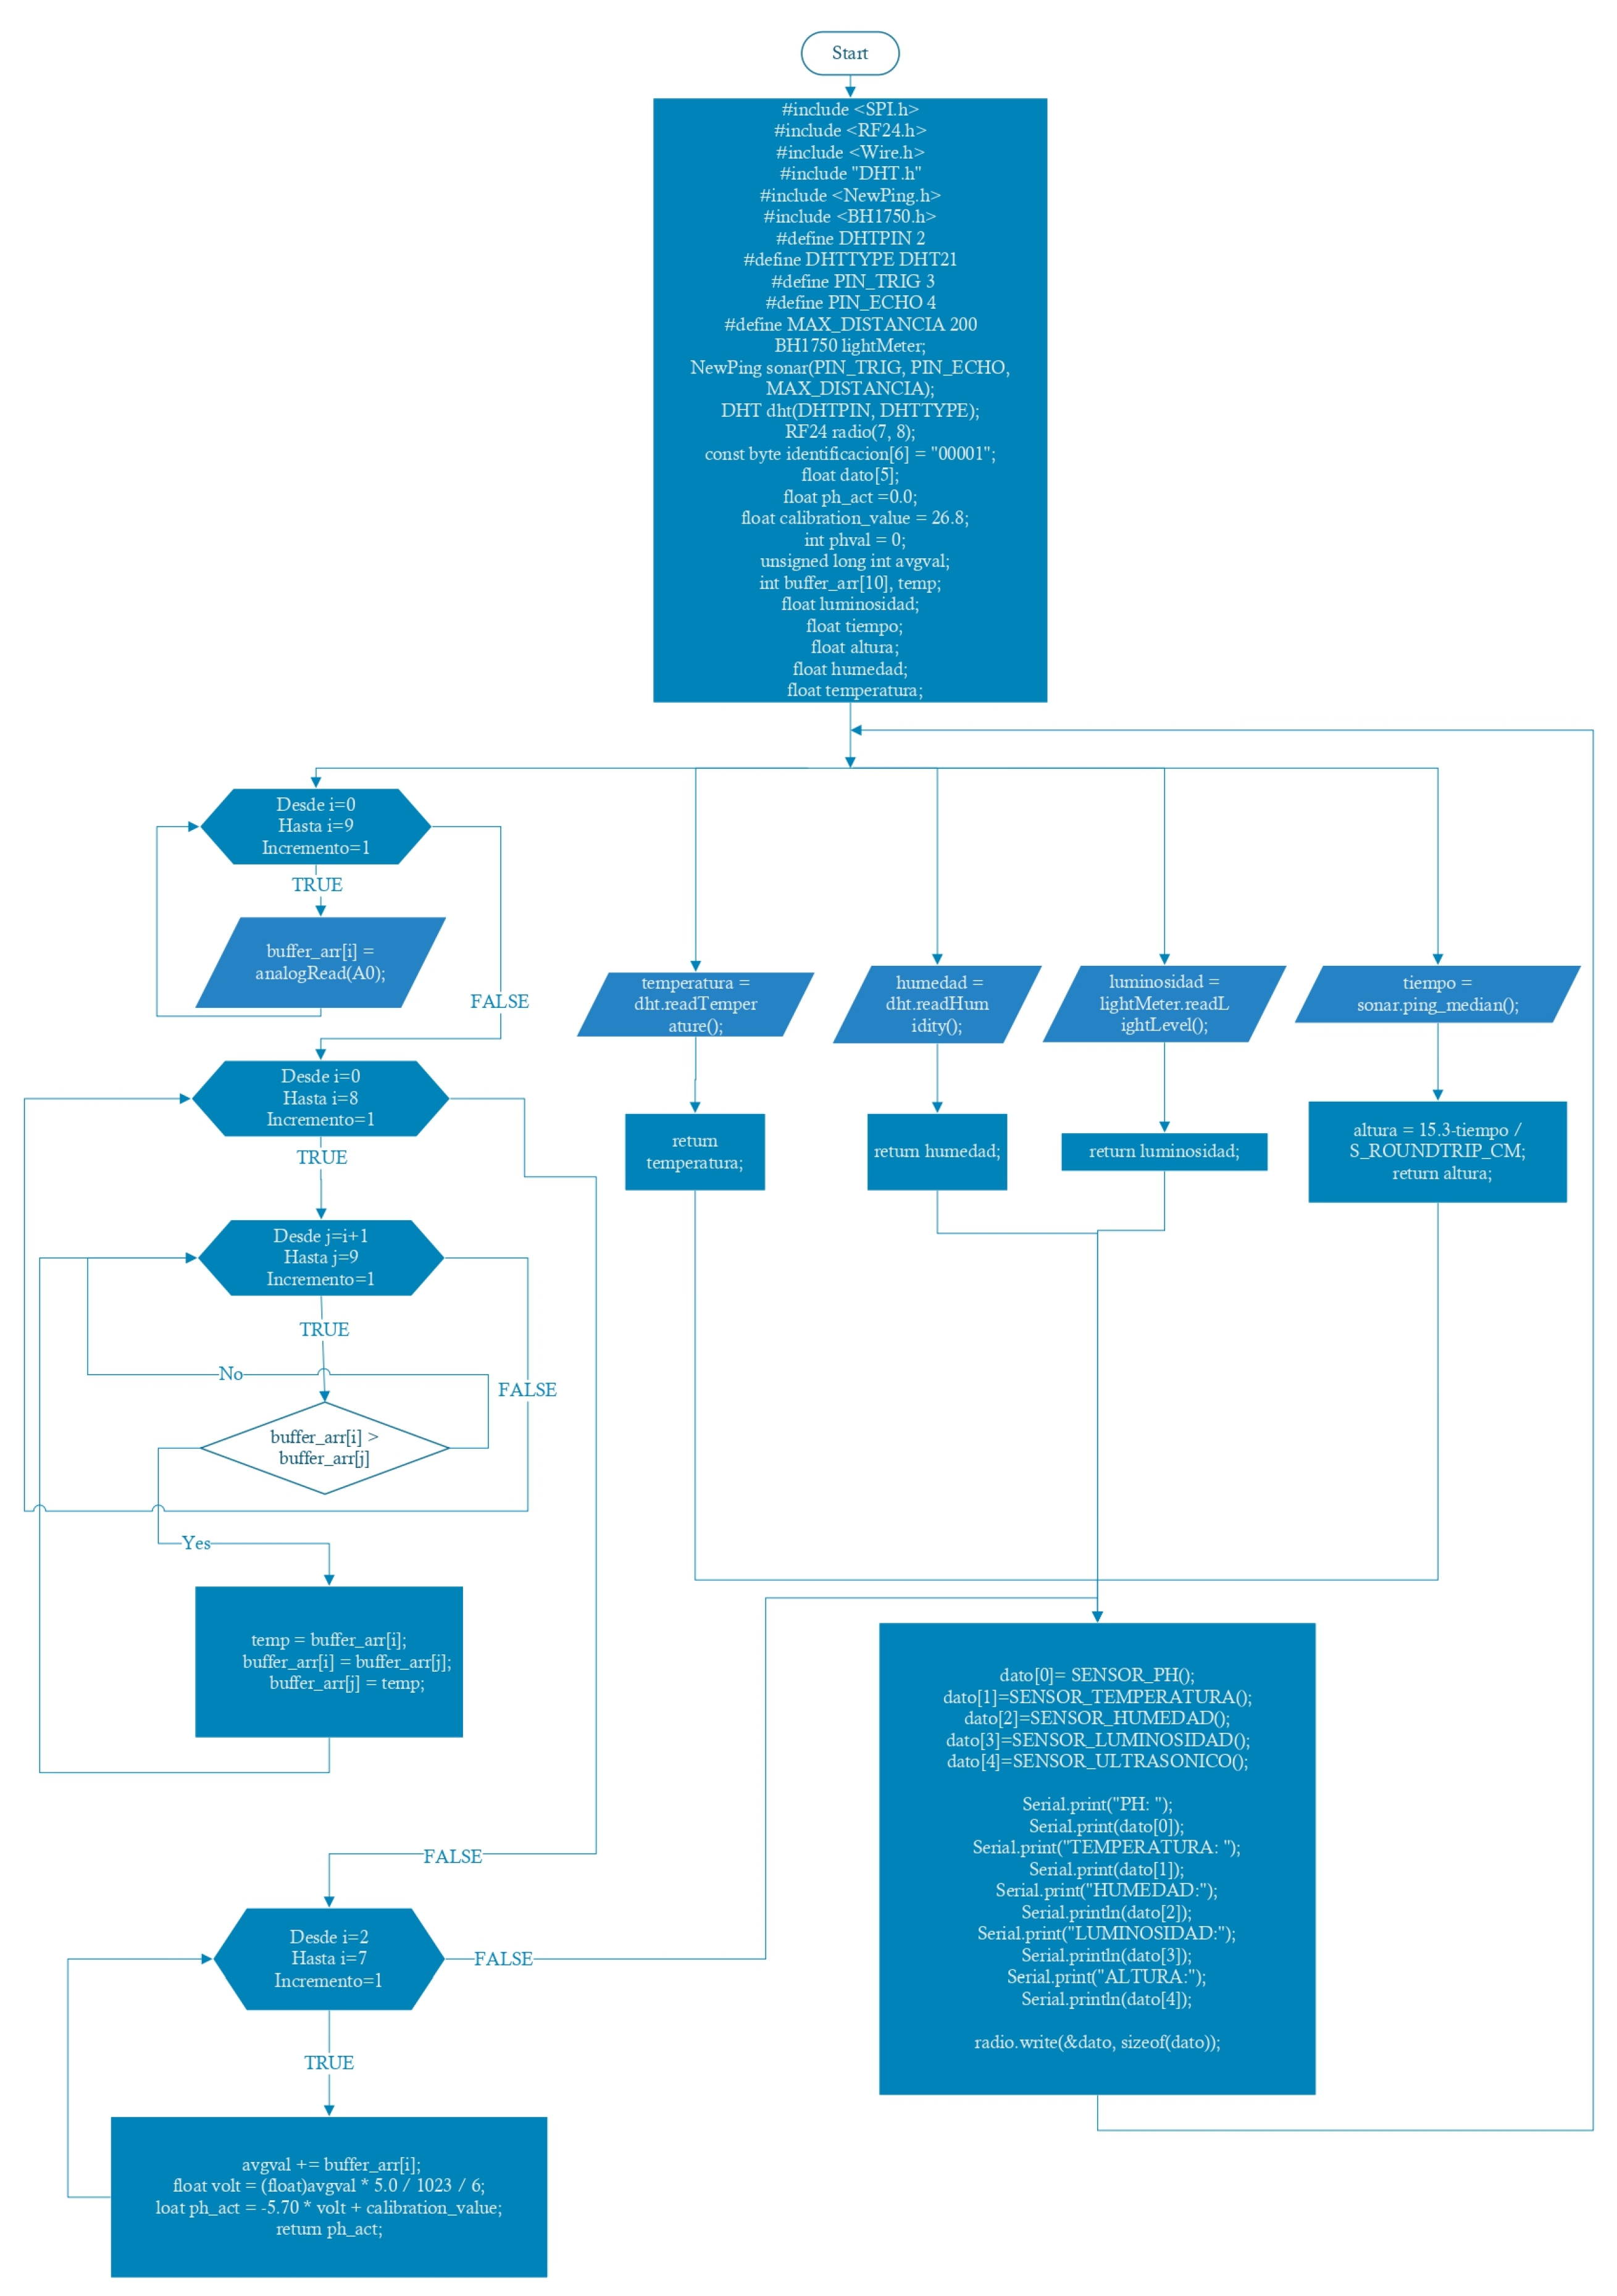
Figure 27.
Programming for the receiver module.
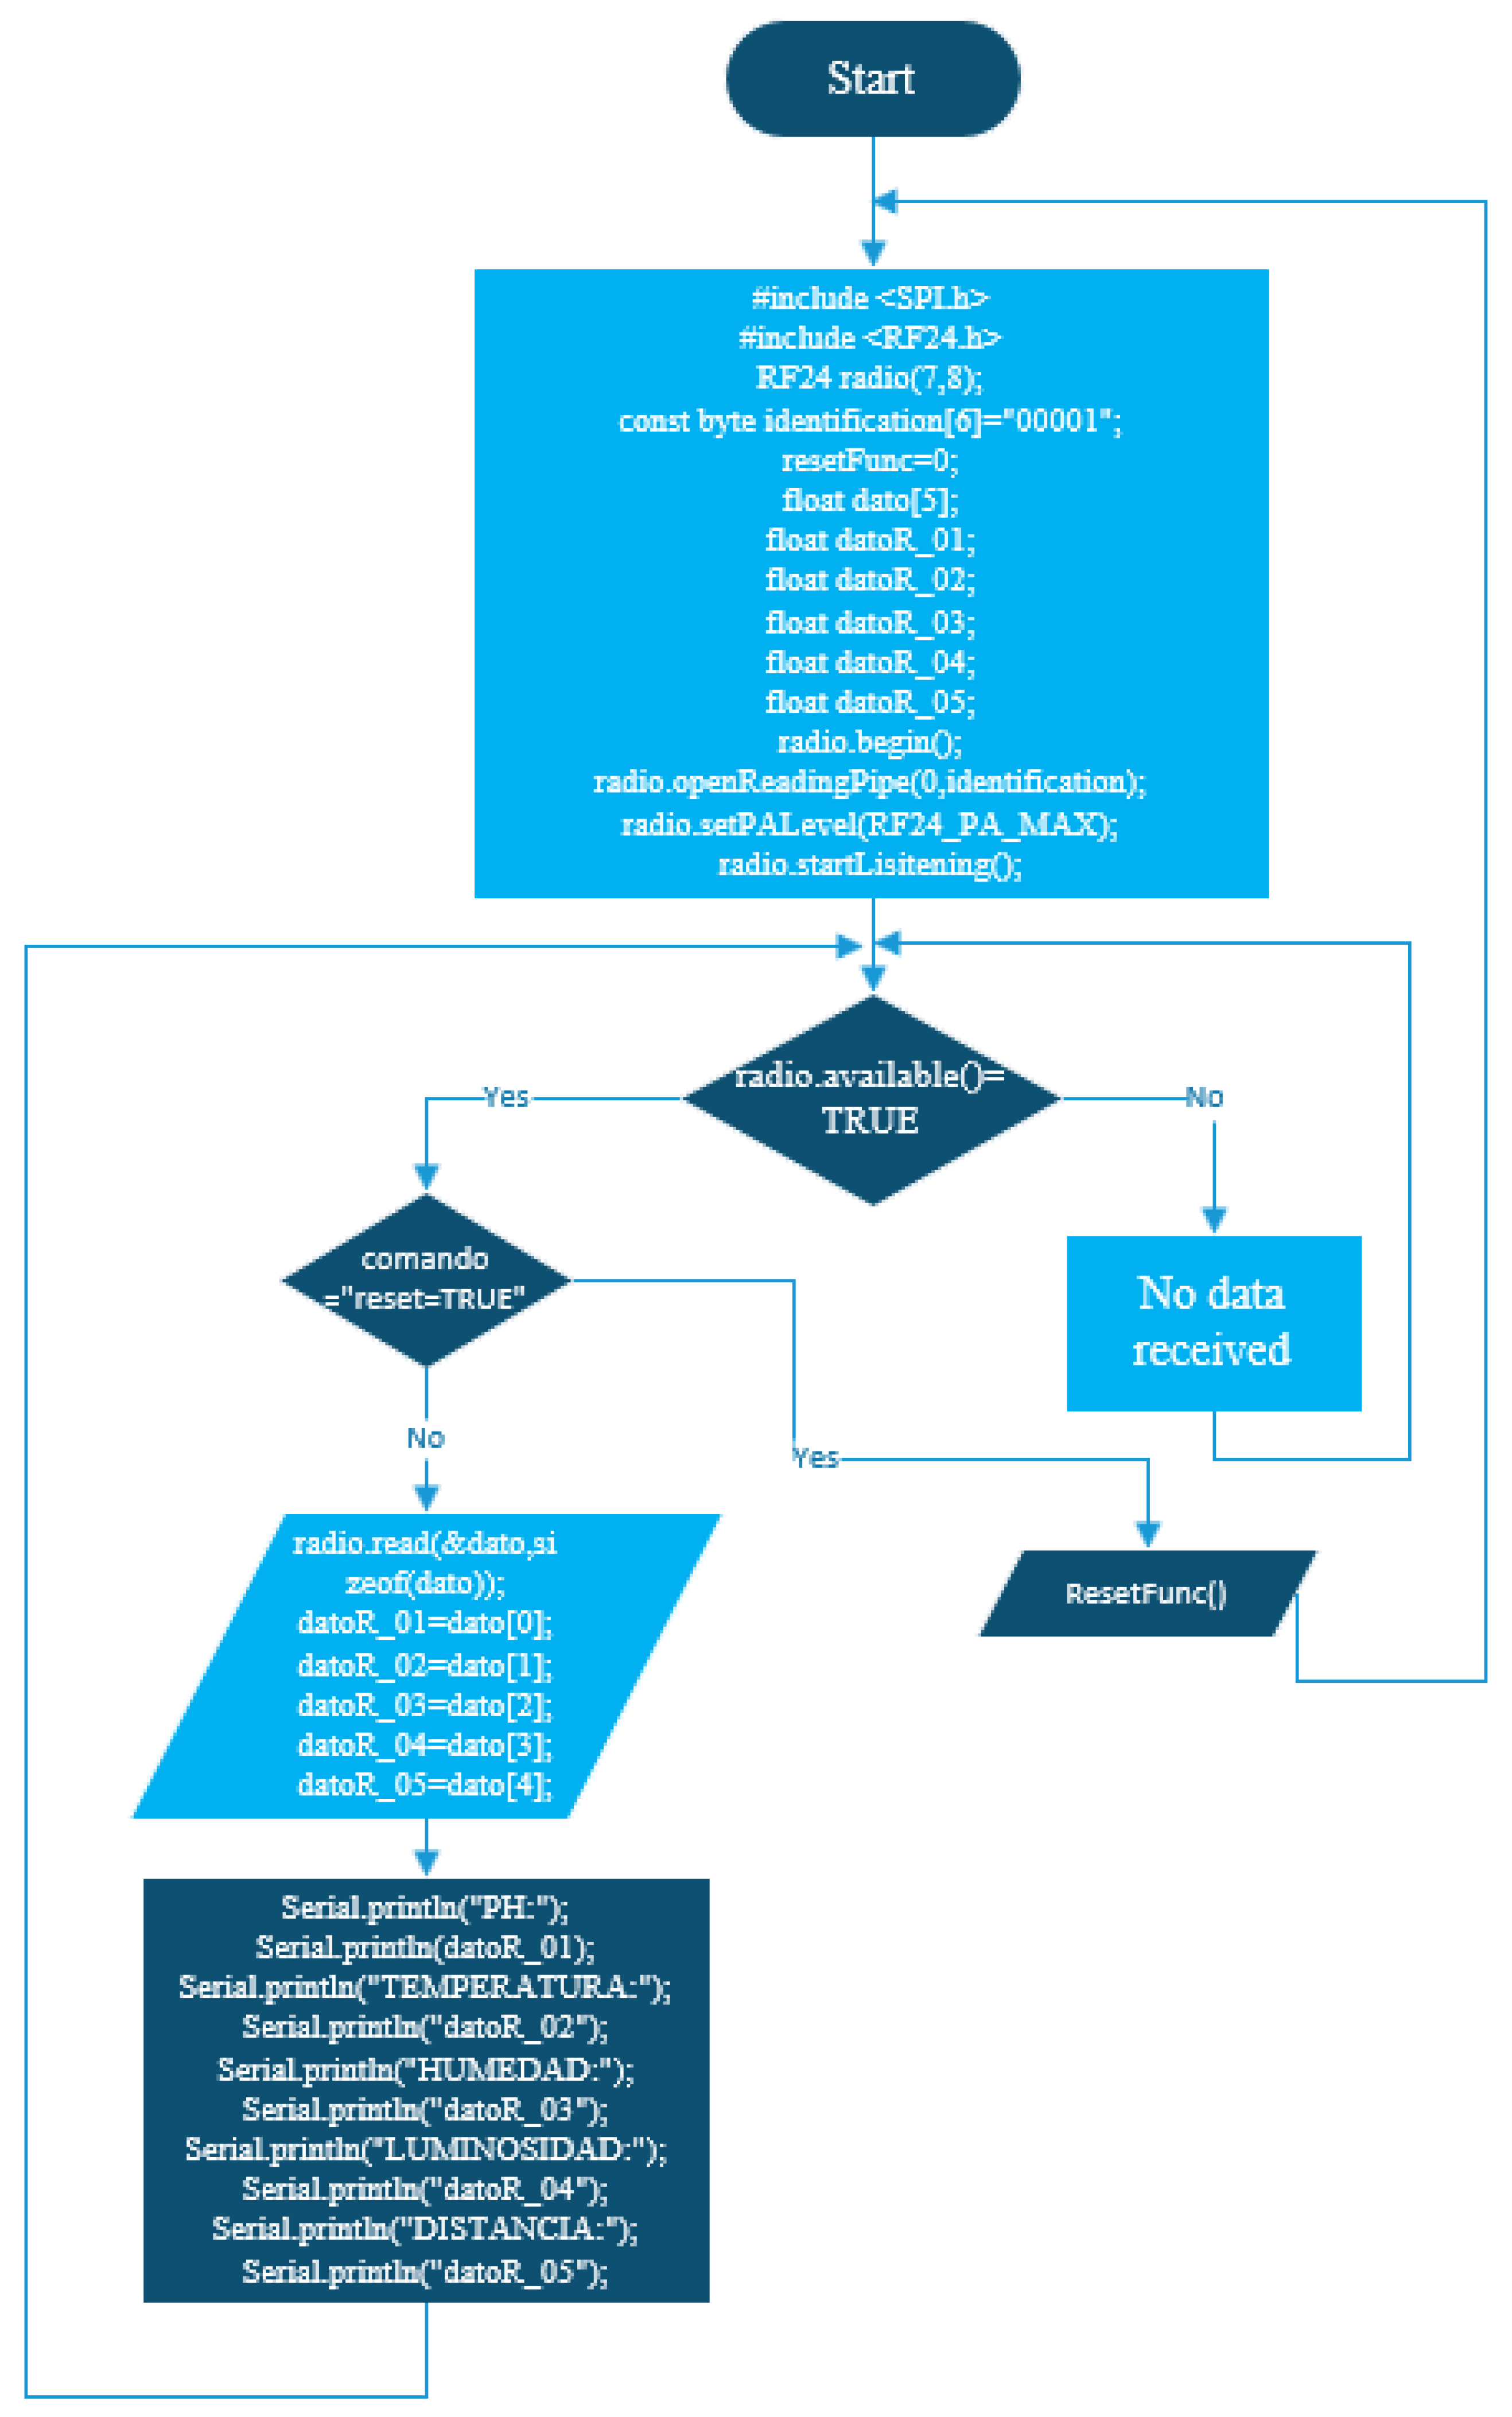
Figure 28.
Flowchart for sending data to the database and Web application.
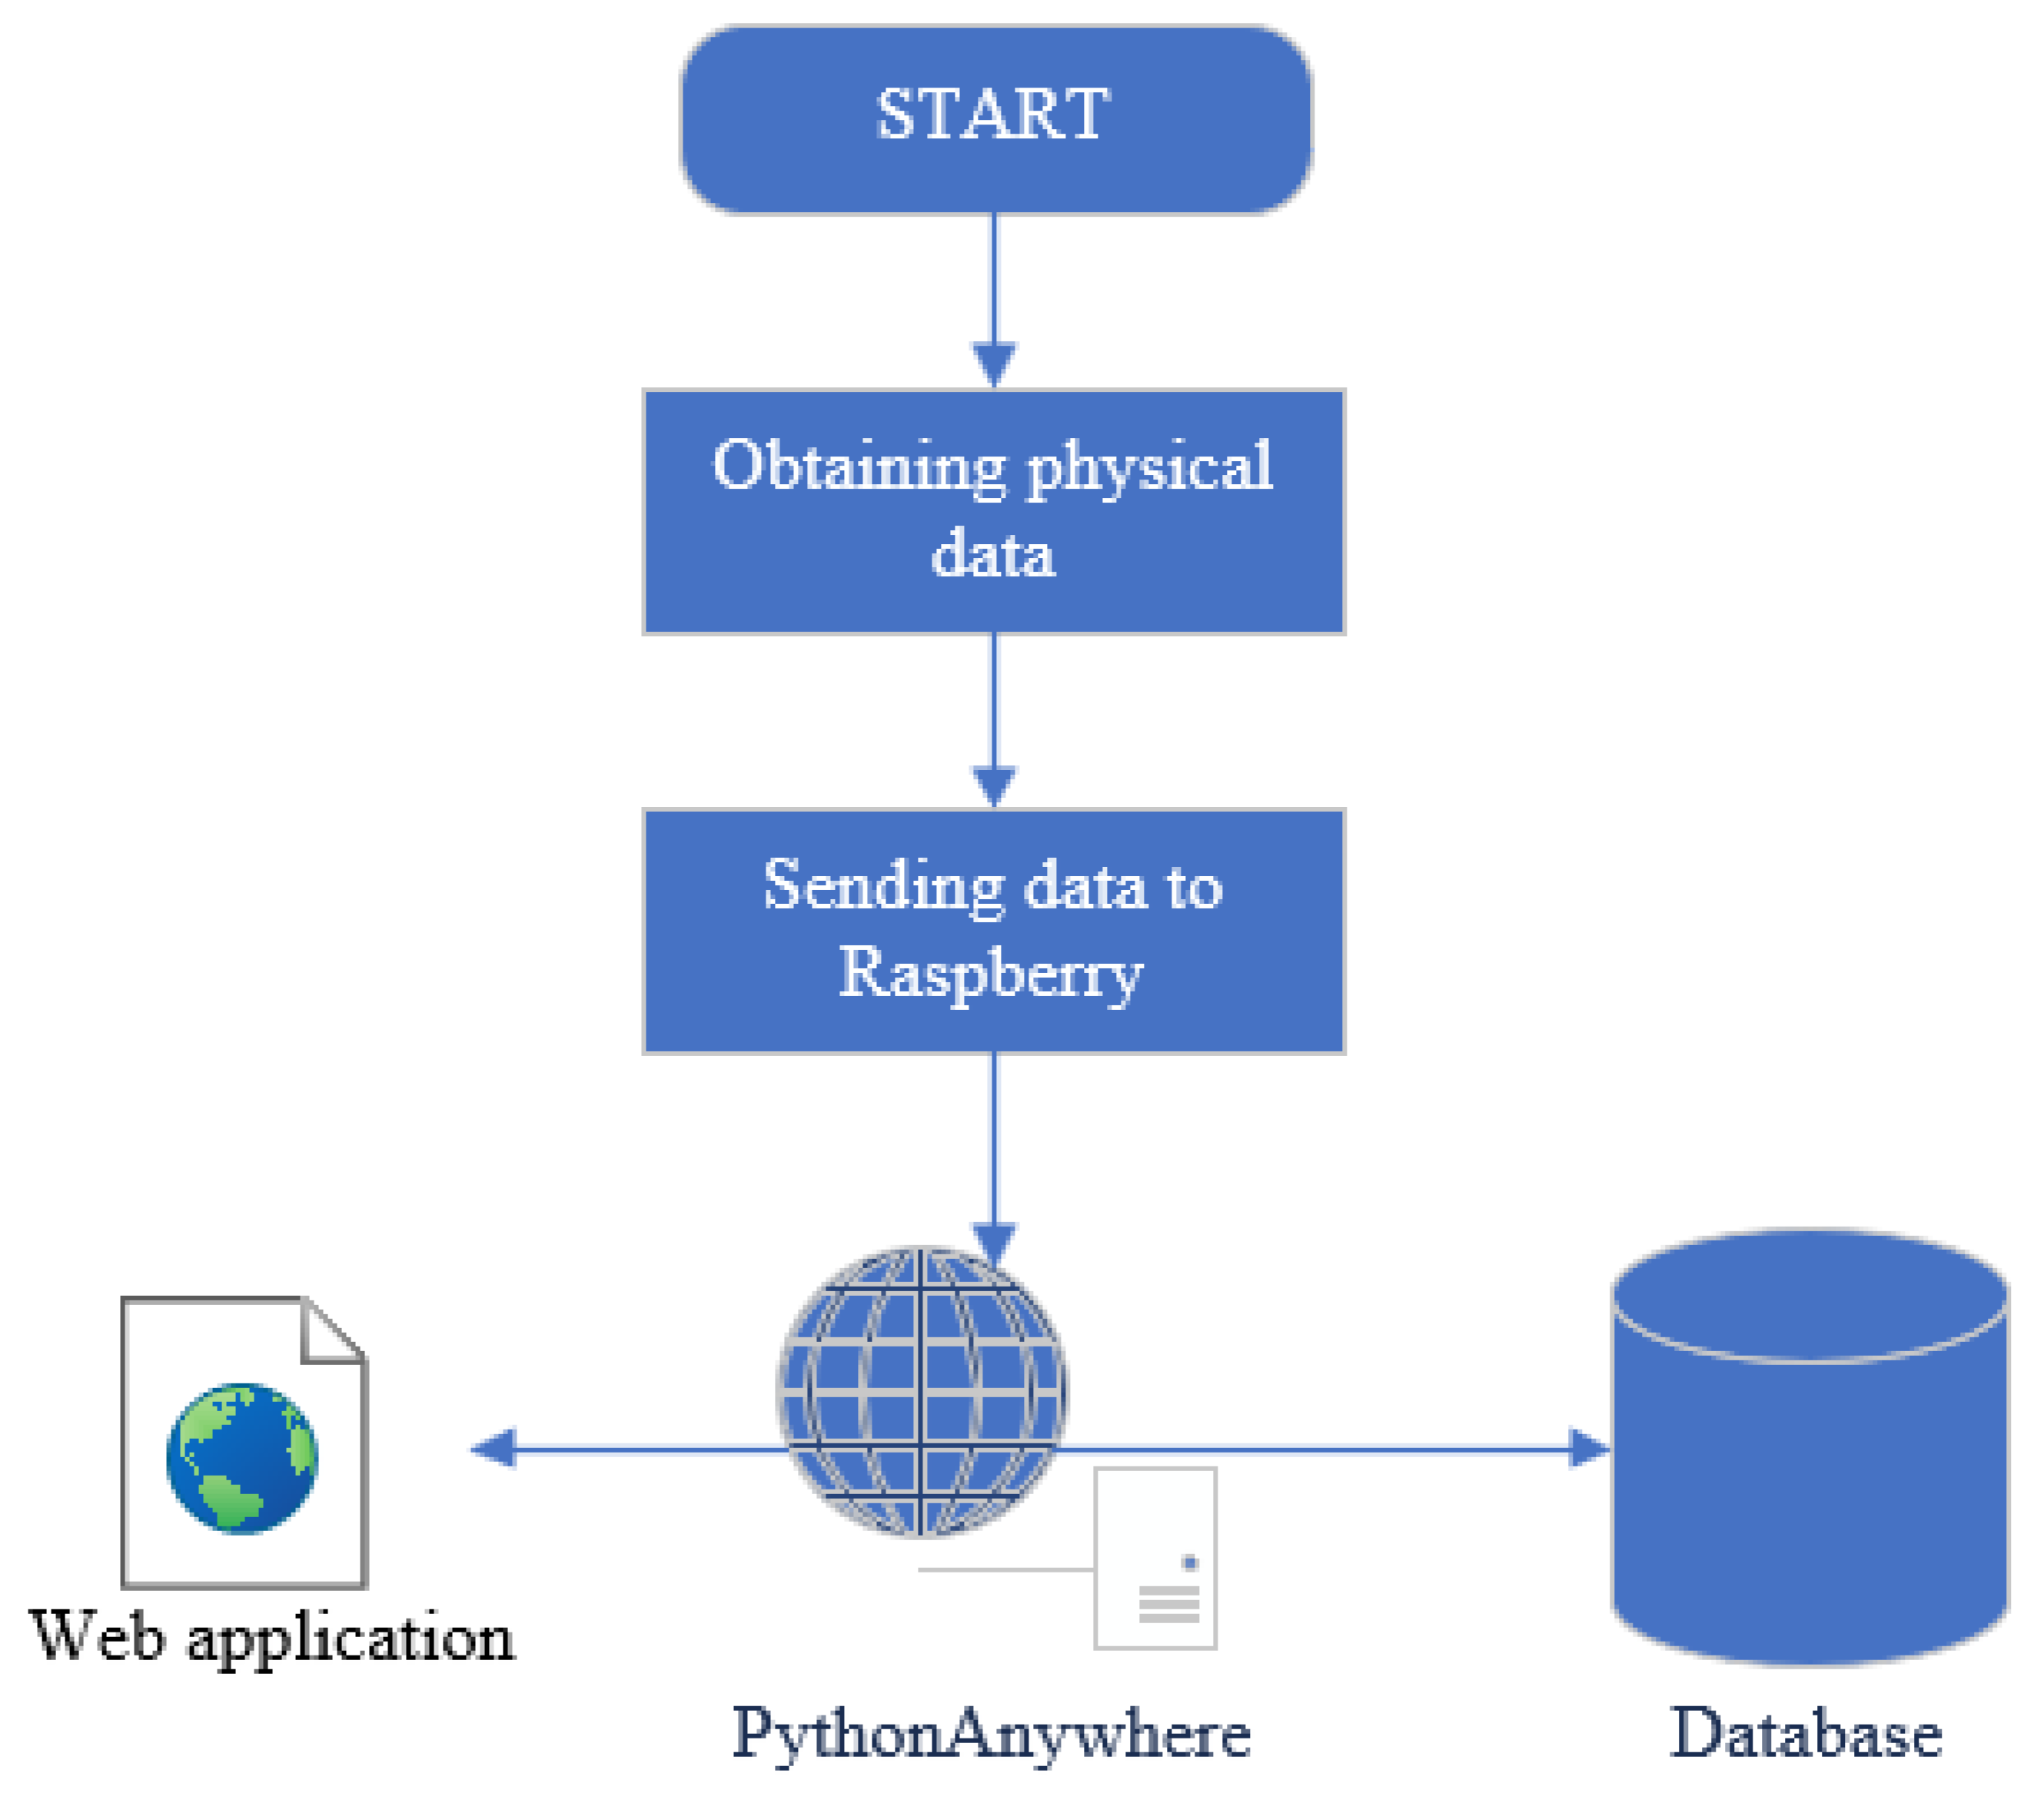
Figure 29.
Flow diagram of the control module.
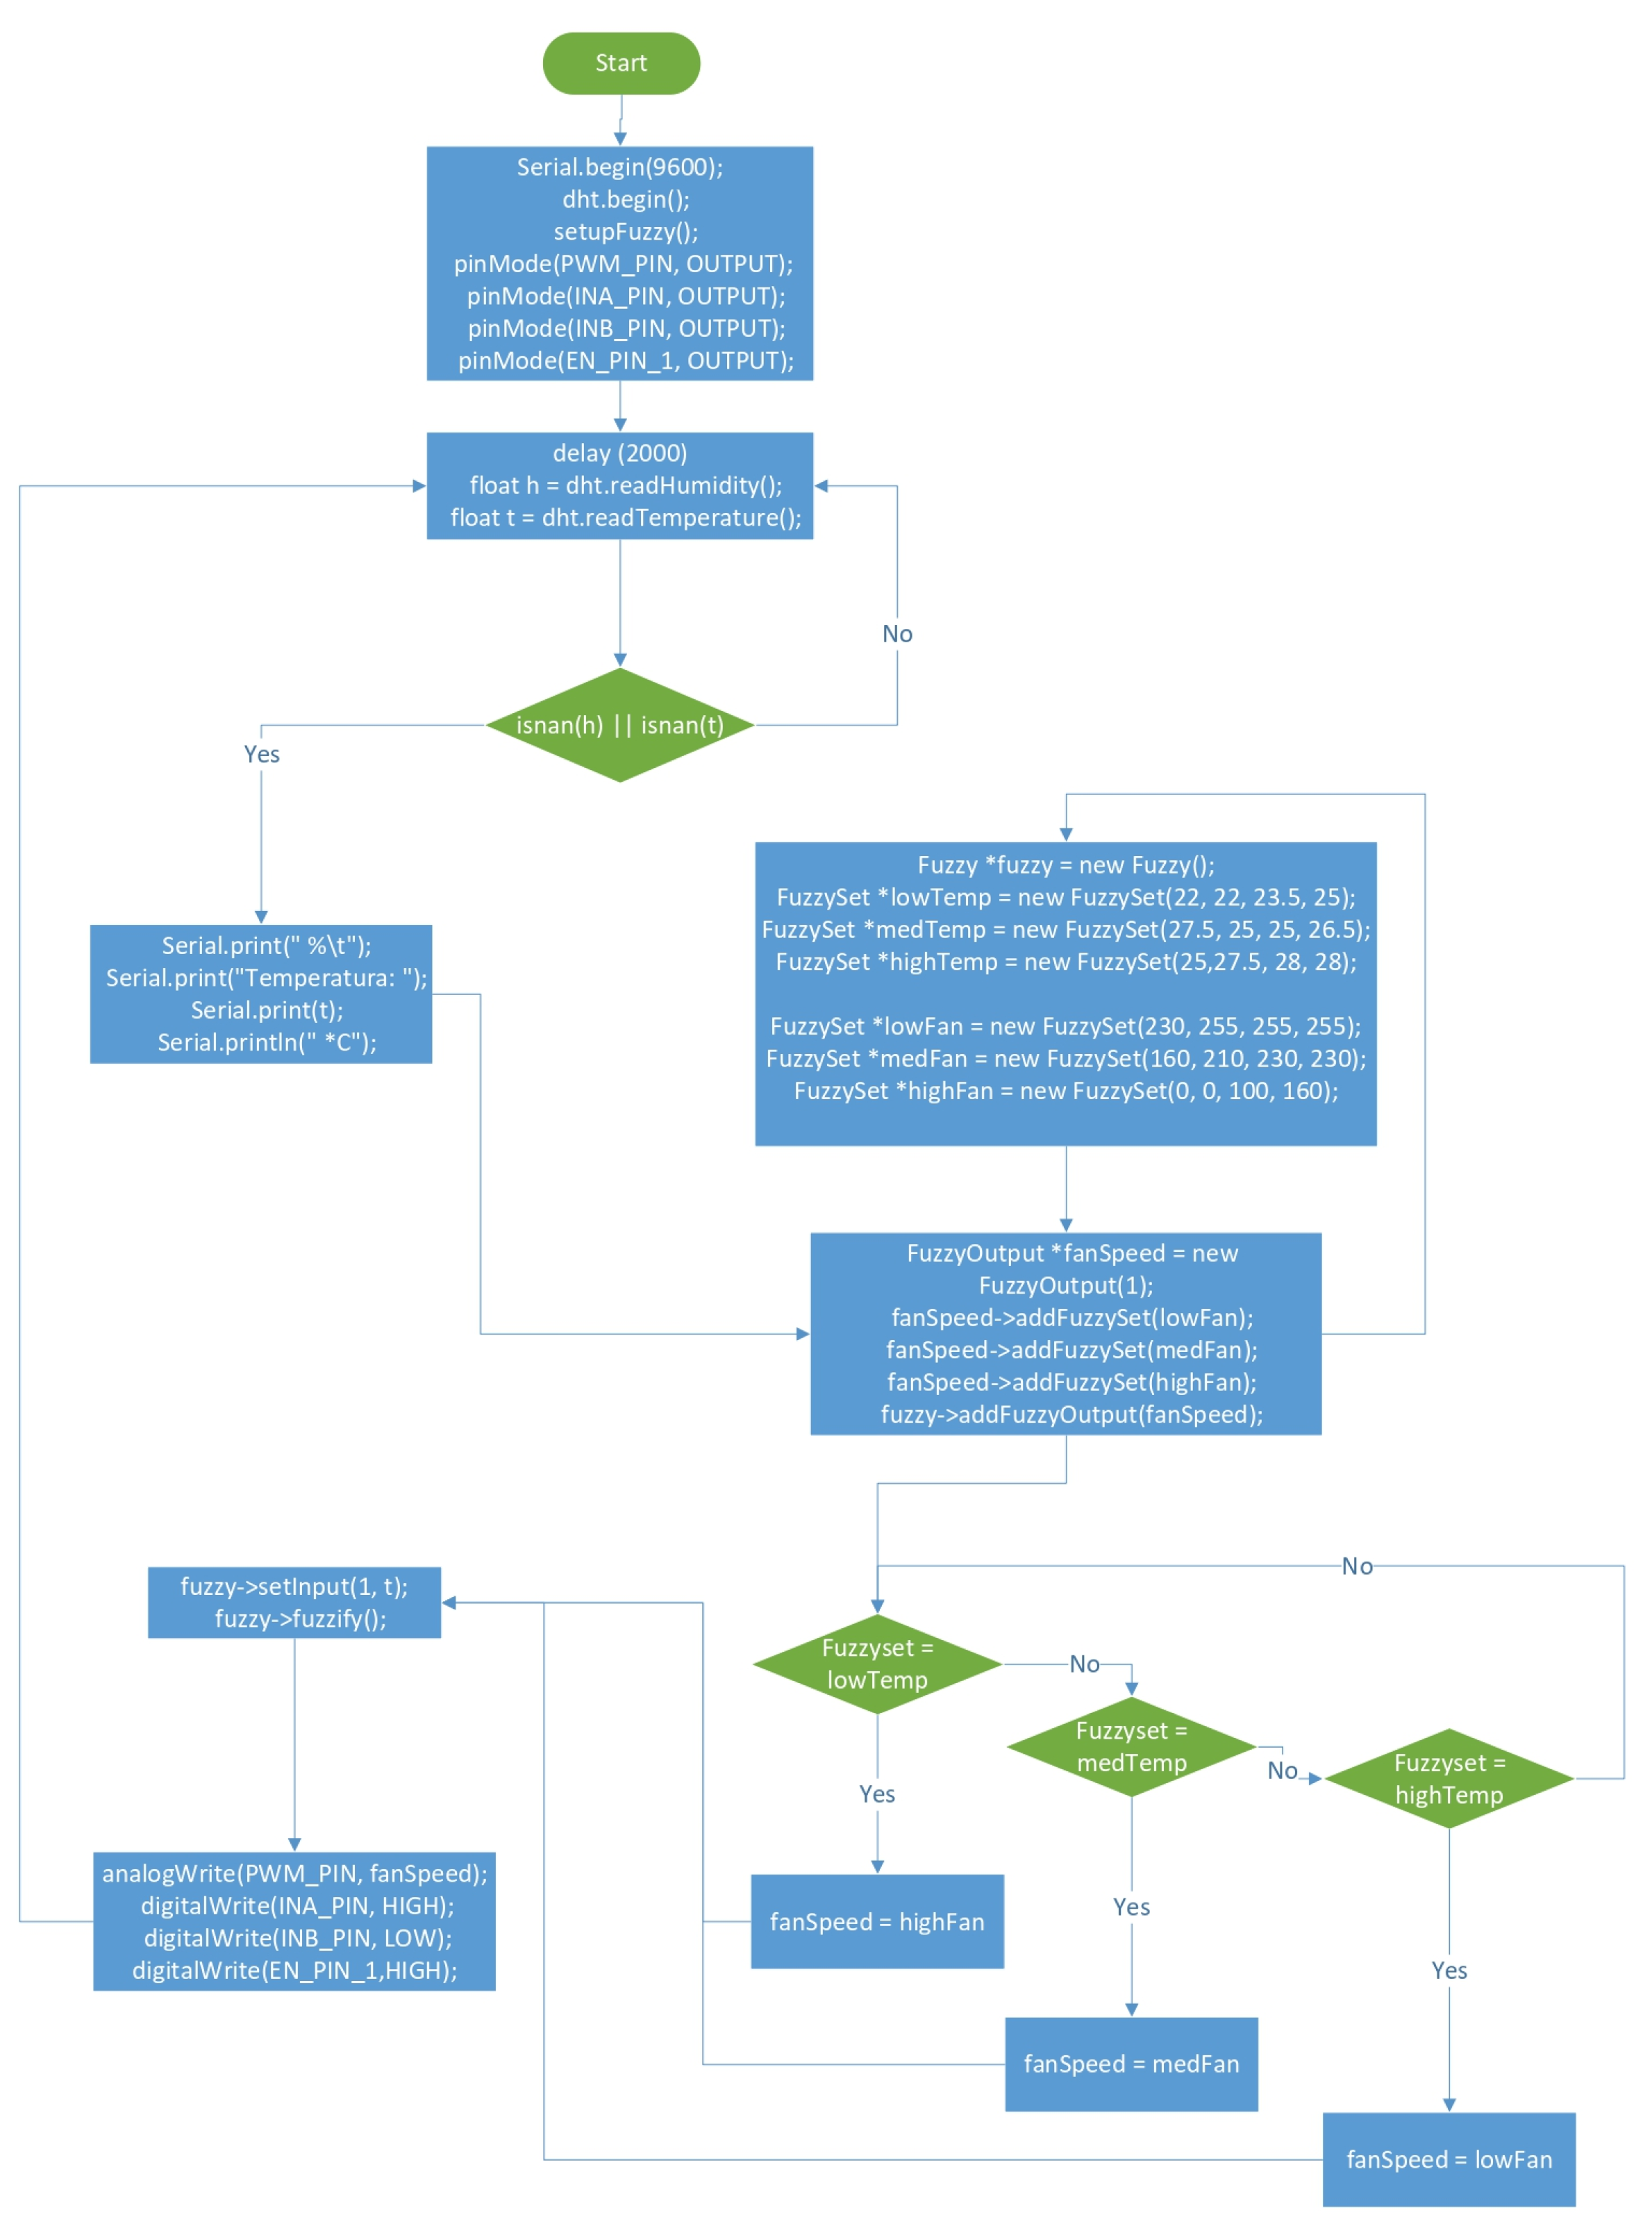
Figure 30.
Construction of the pilot prototype.
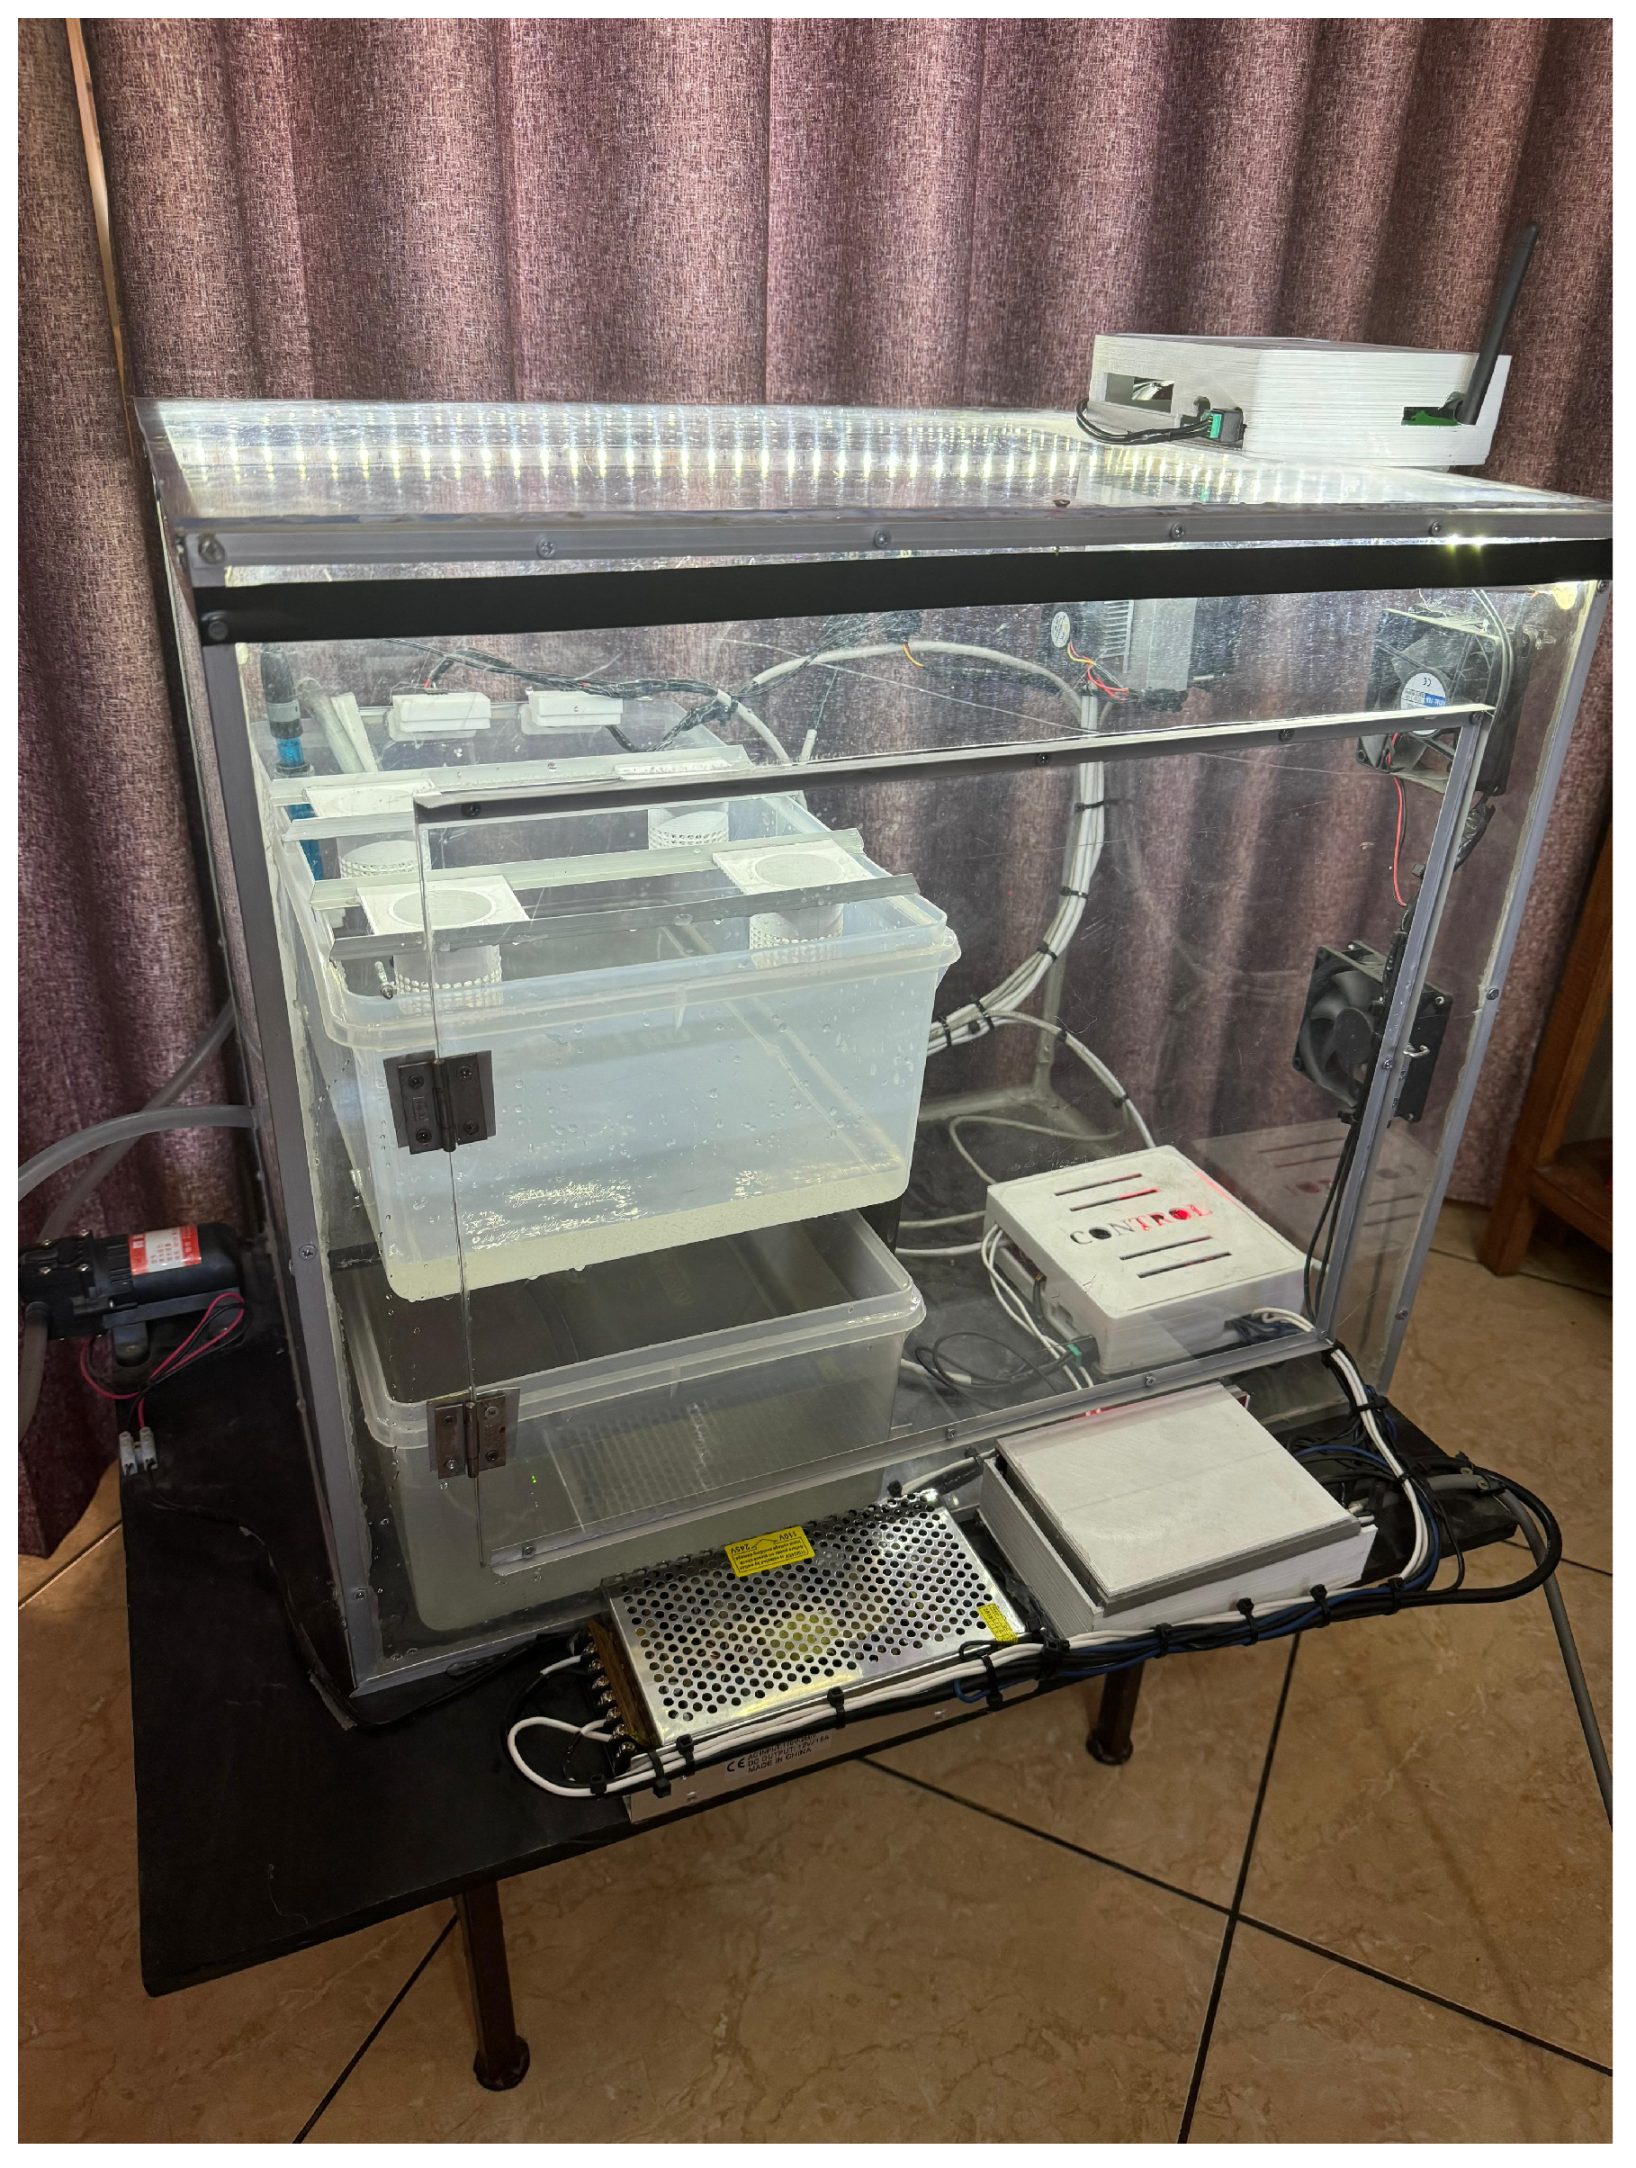
Figure 31.
Pilot prototype in operation.
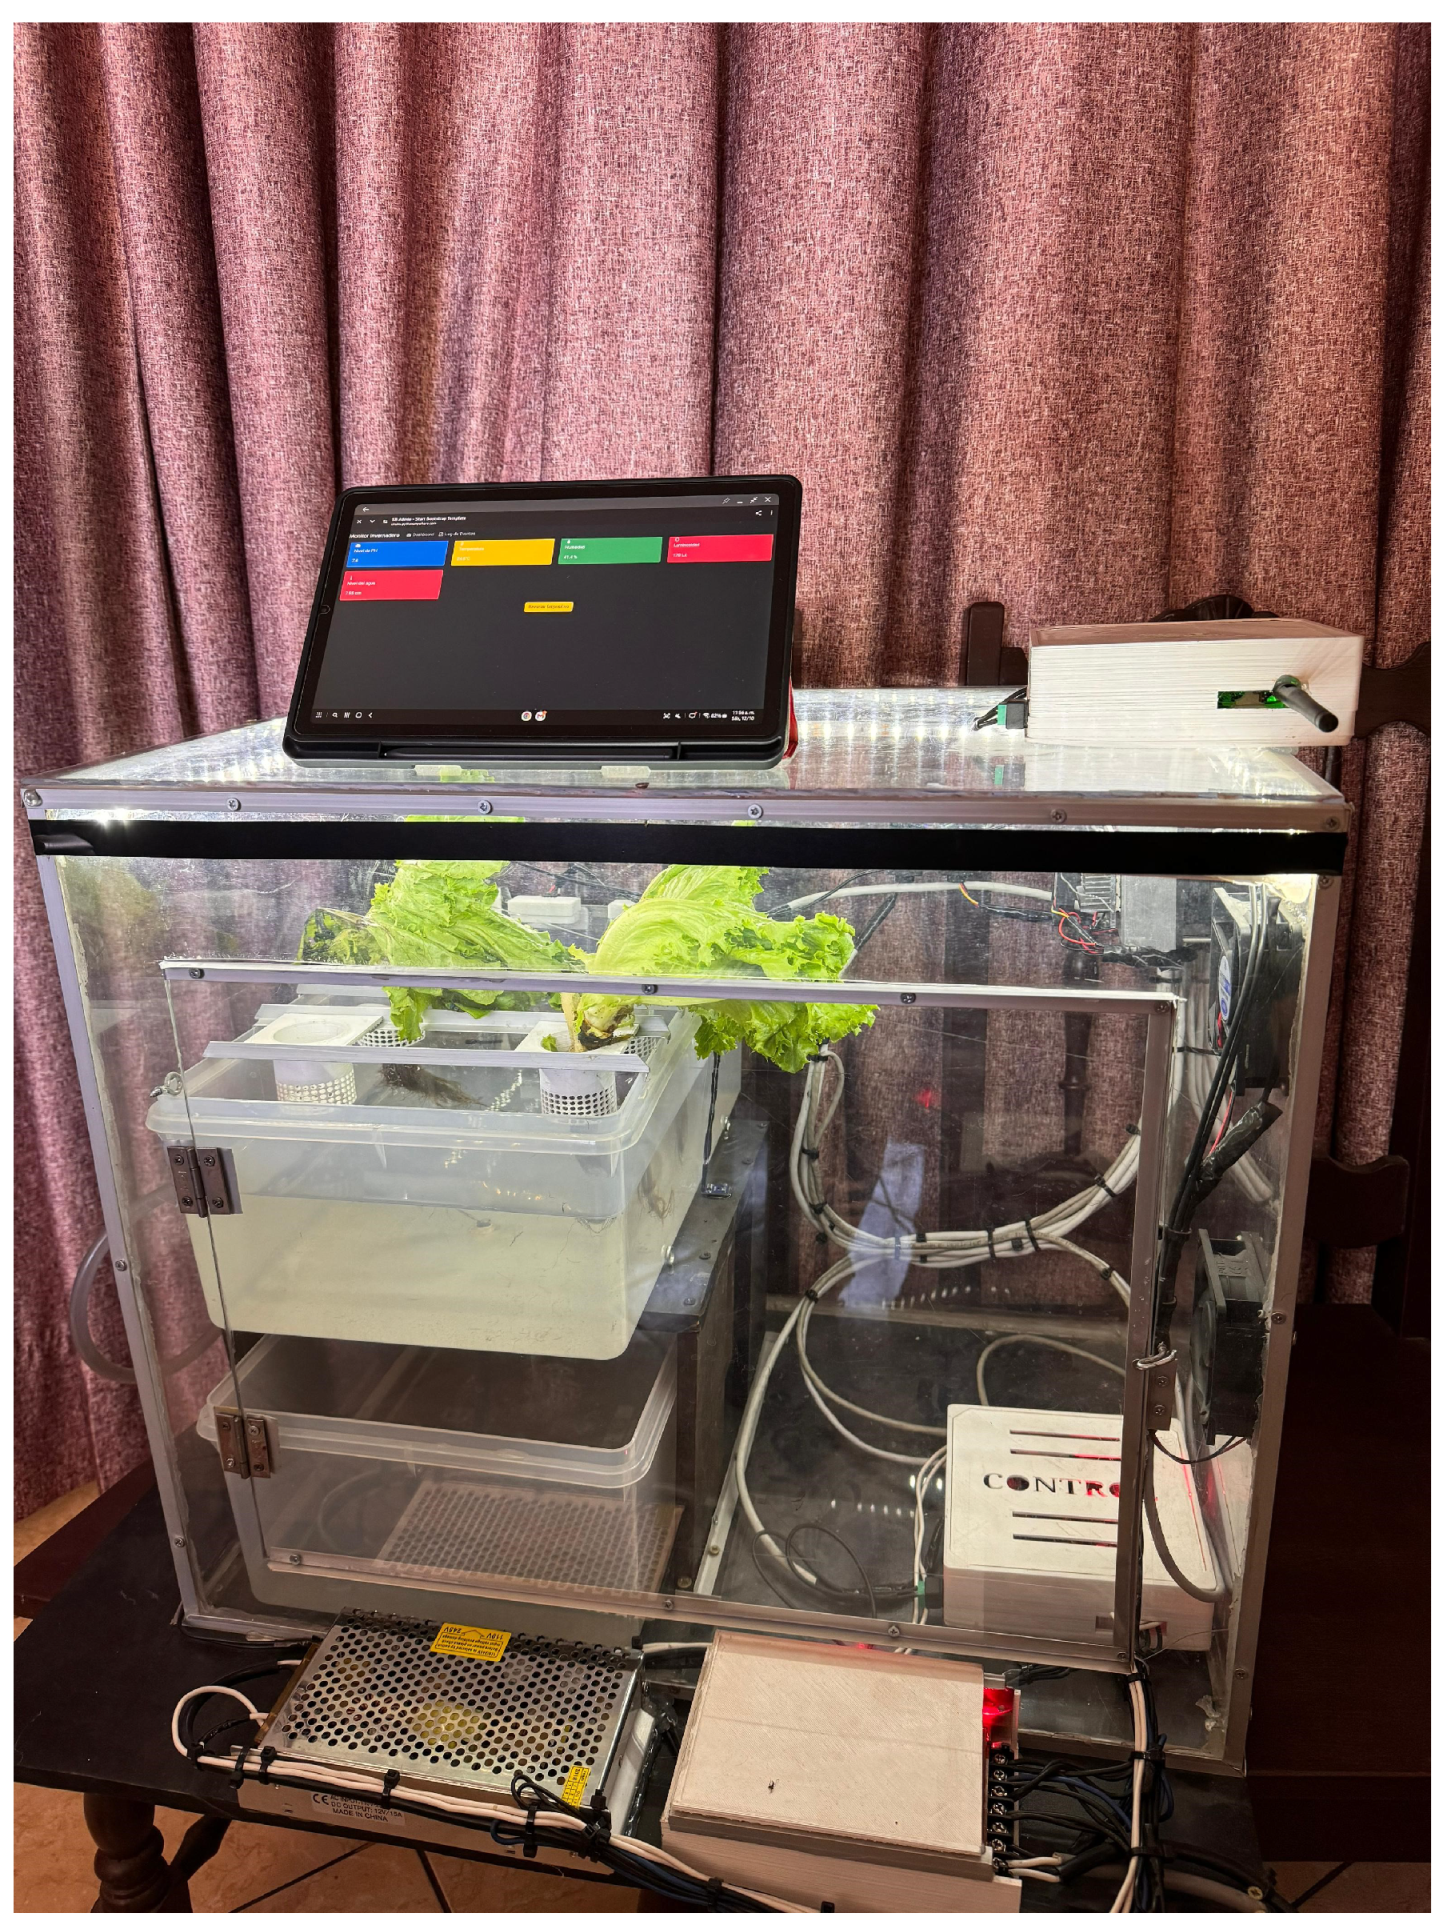
Figure 32.
Temperature and ventilation control system.
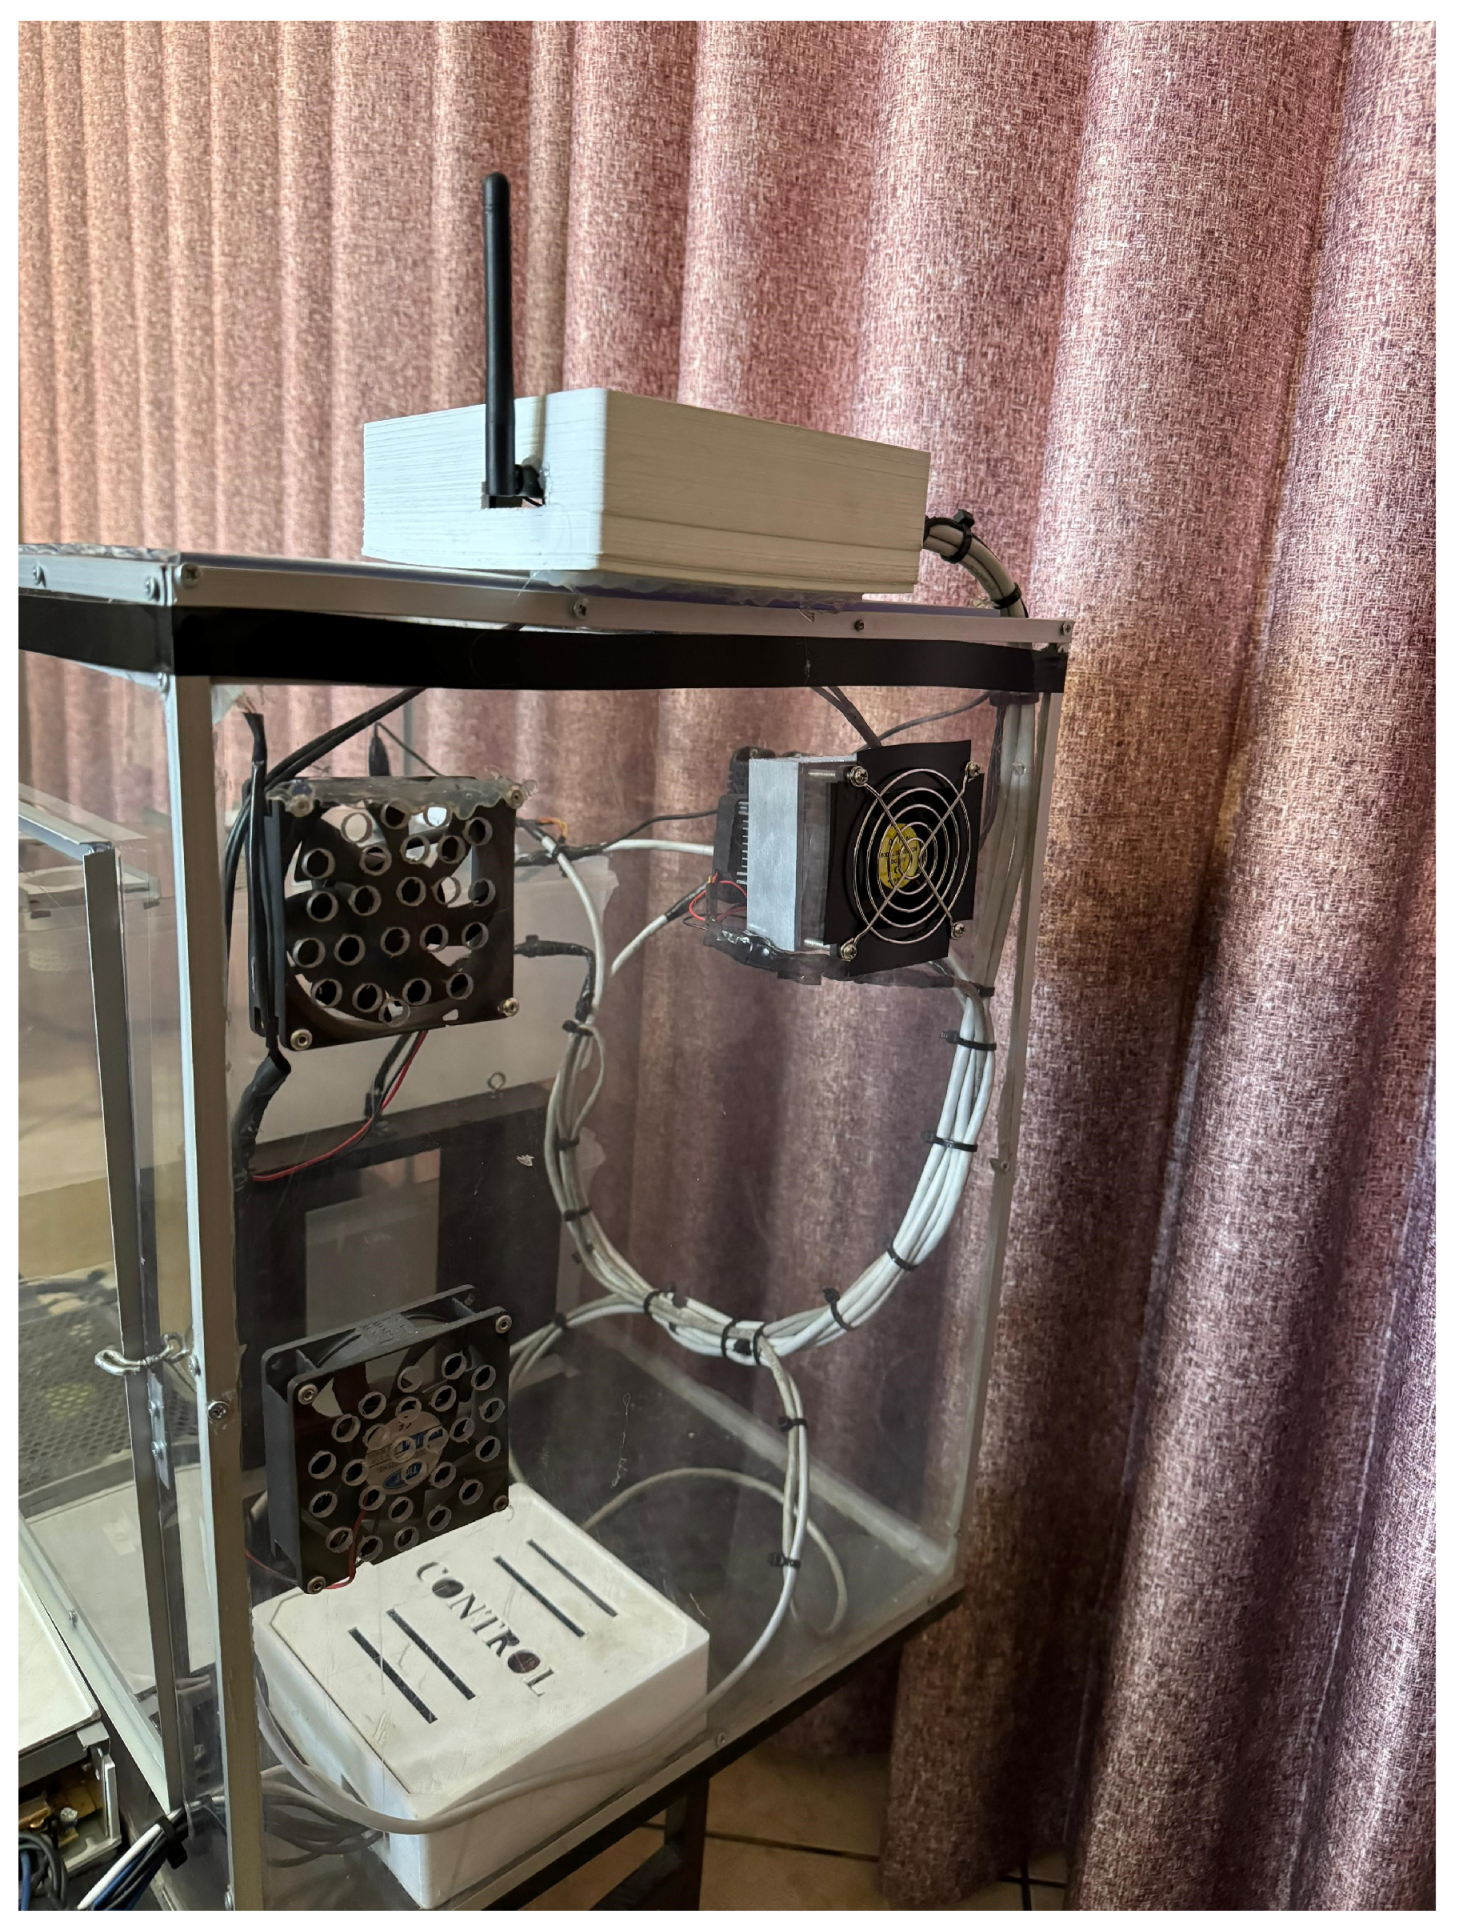
Figure 33.
Level control system.
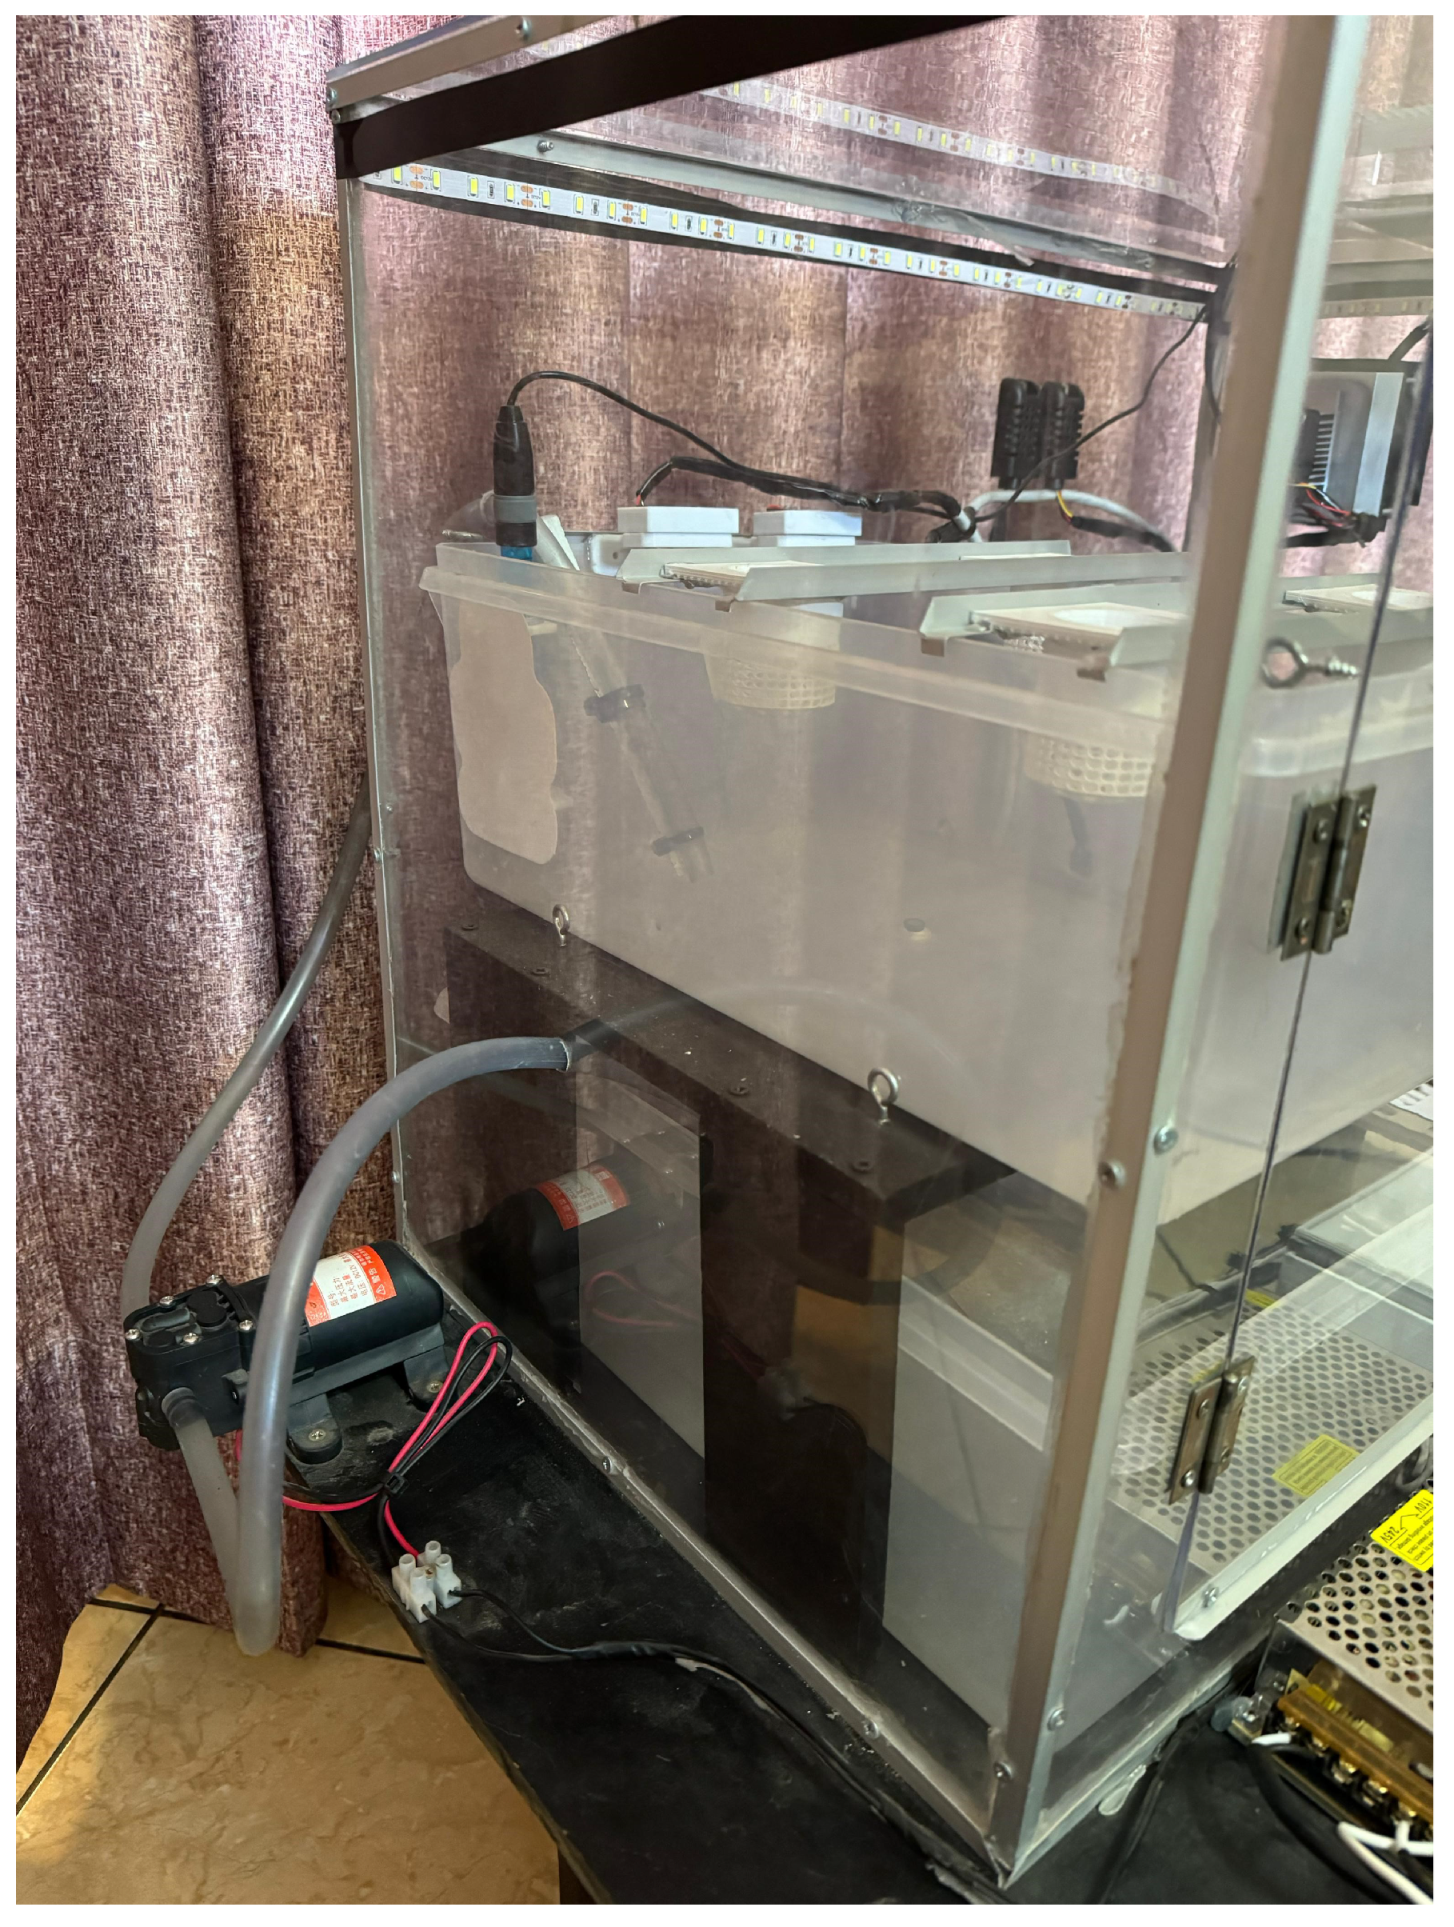
Figure 34.
Level and pH monitoring system.
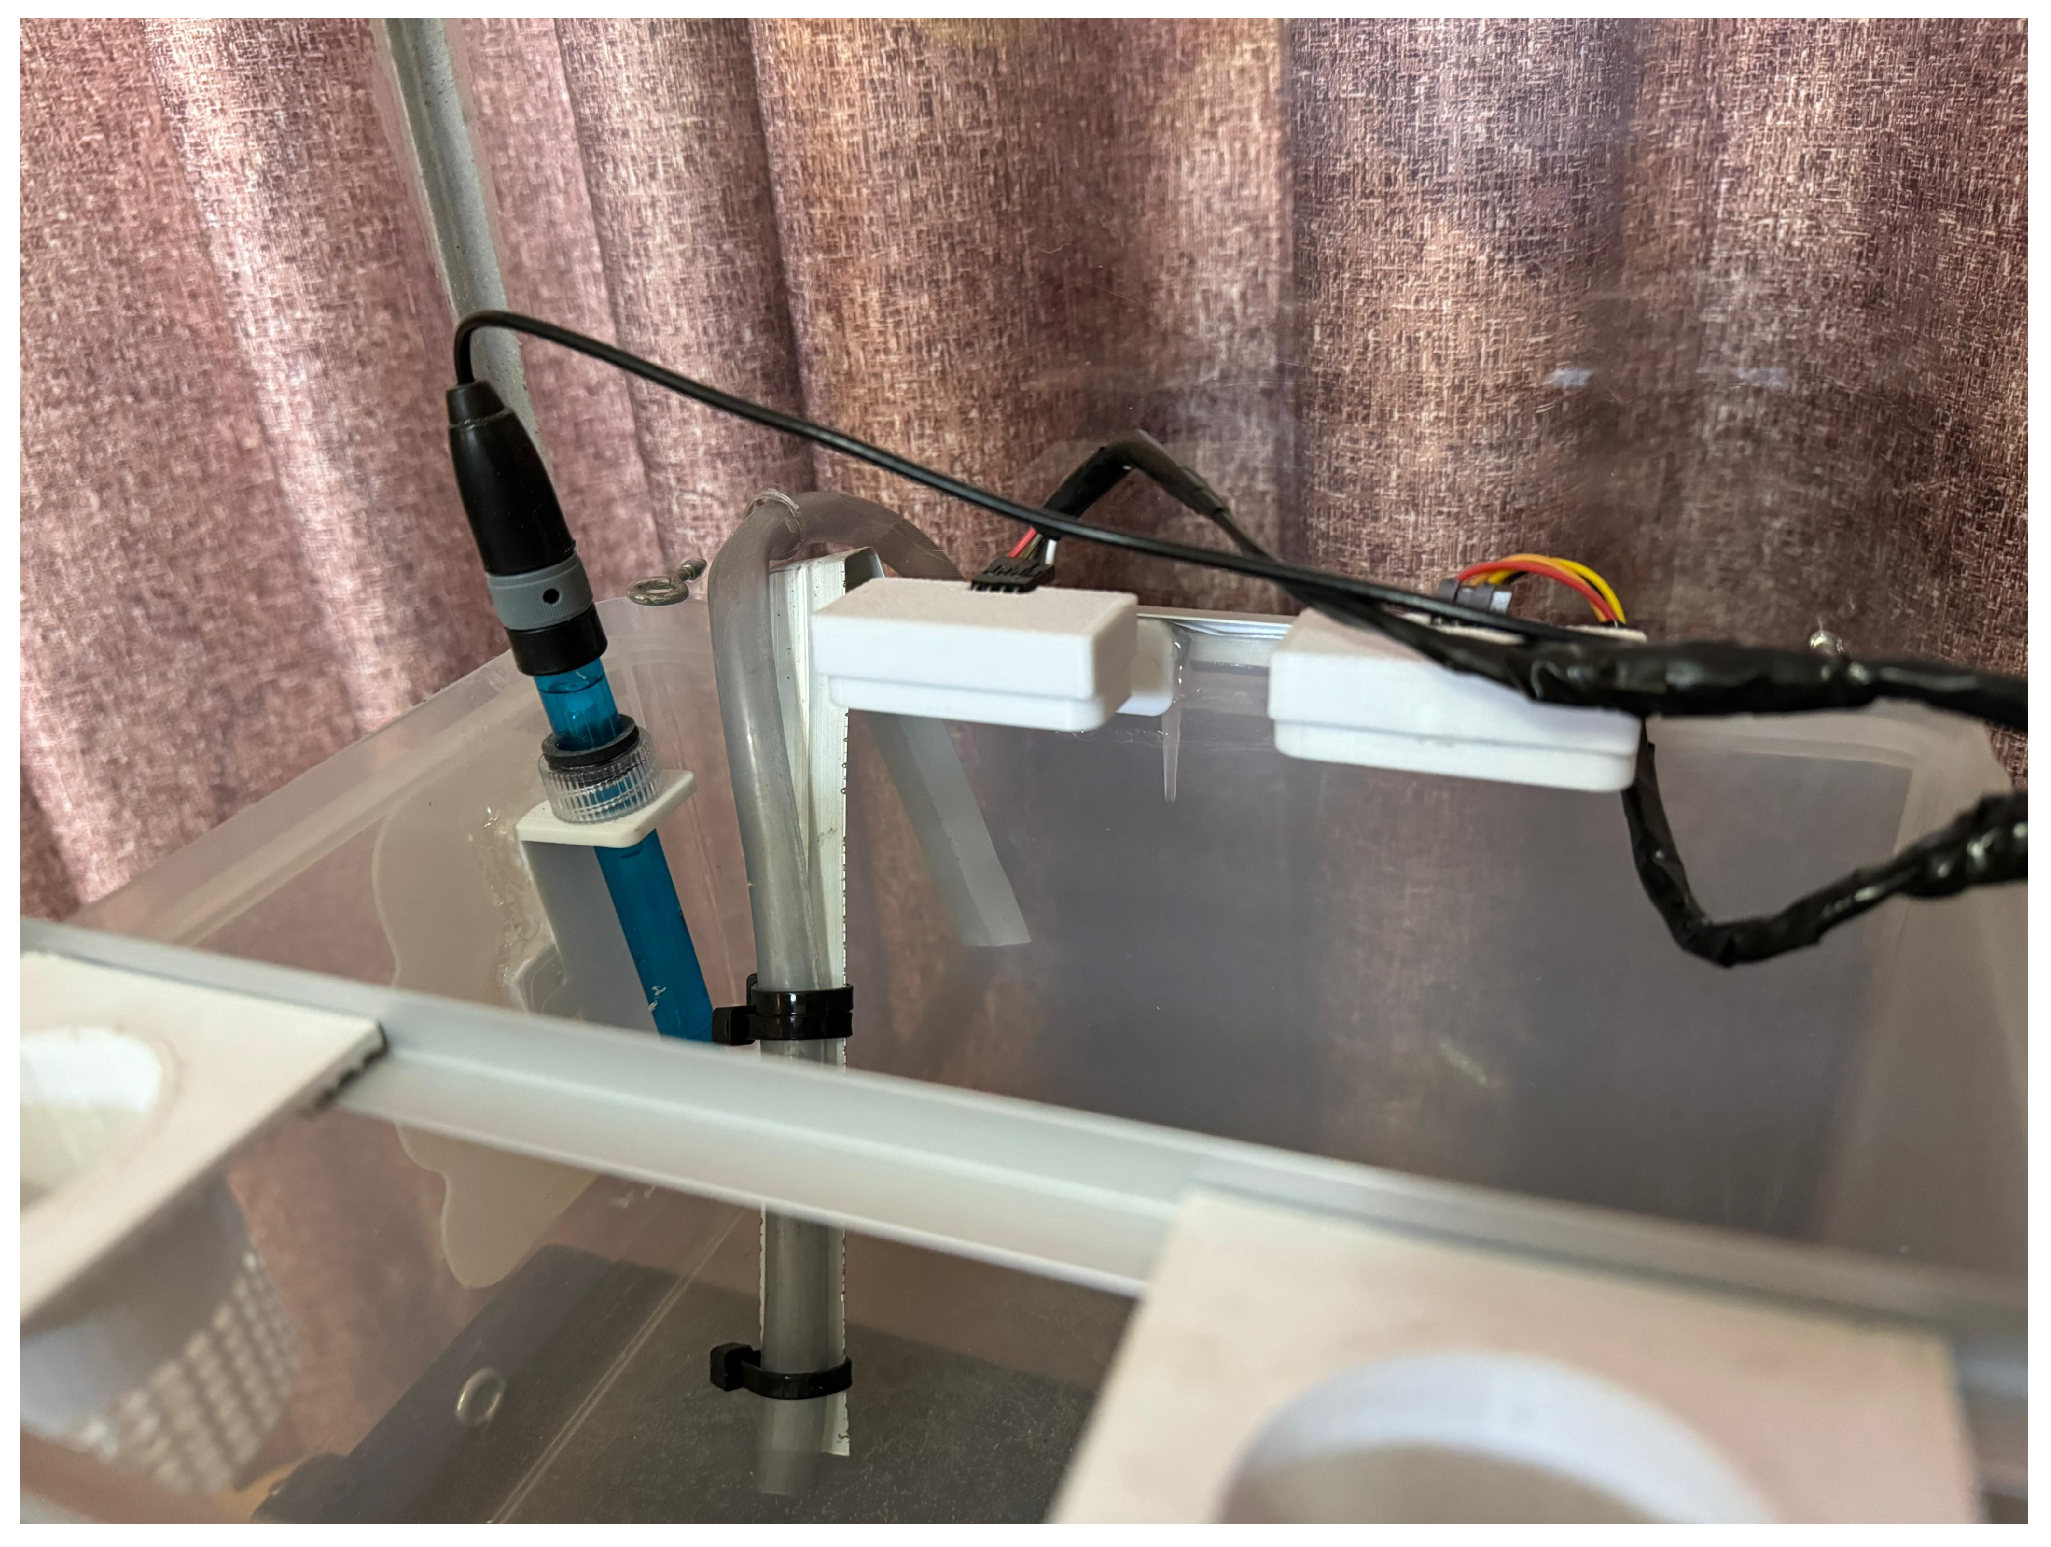
Figure 35.
Temporal response of the level control system (SP: 5 cm).
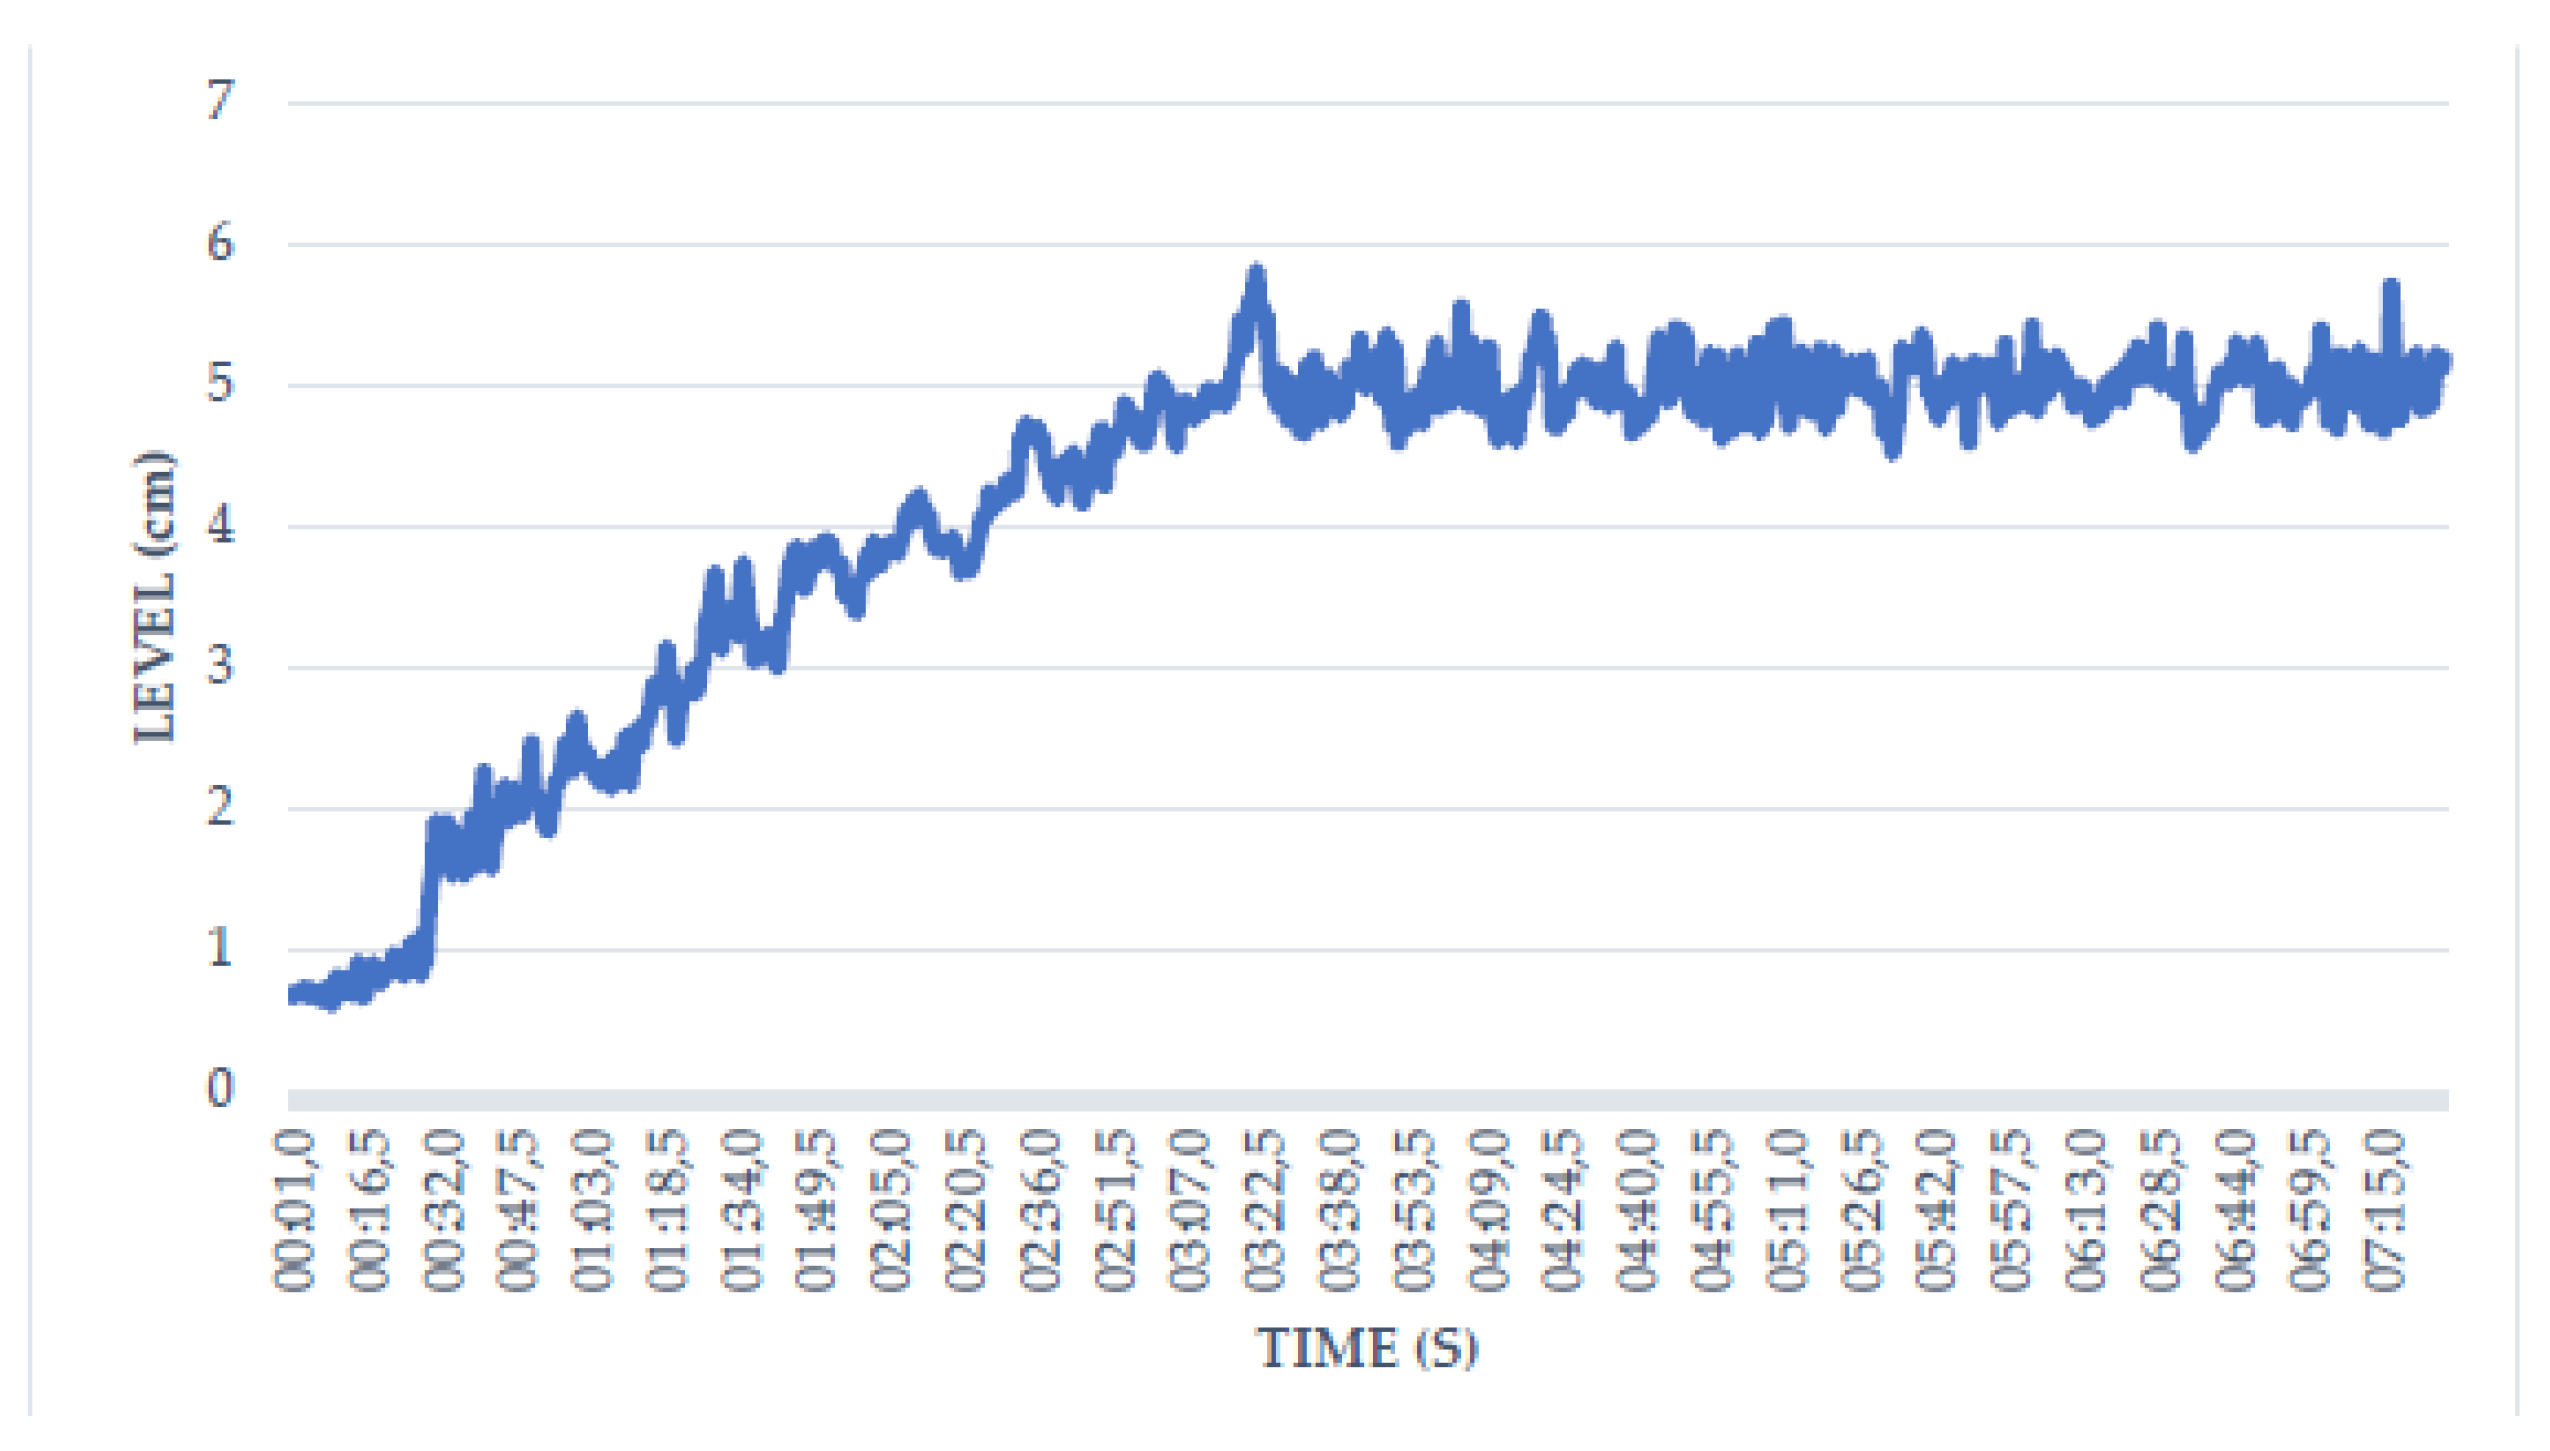
Figure 36.
Simulation of the time response of the level control system (SP: 5 cm).
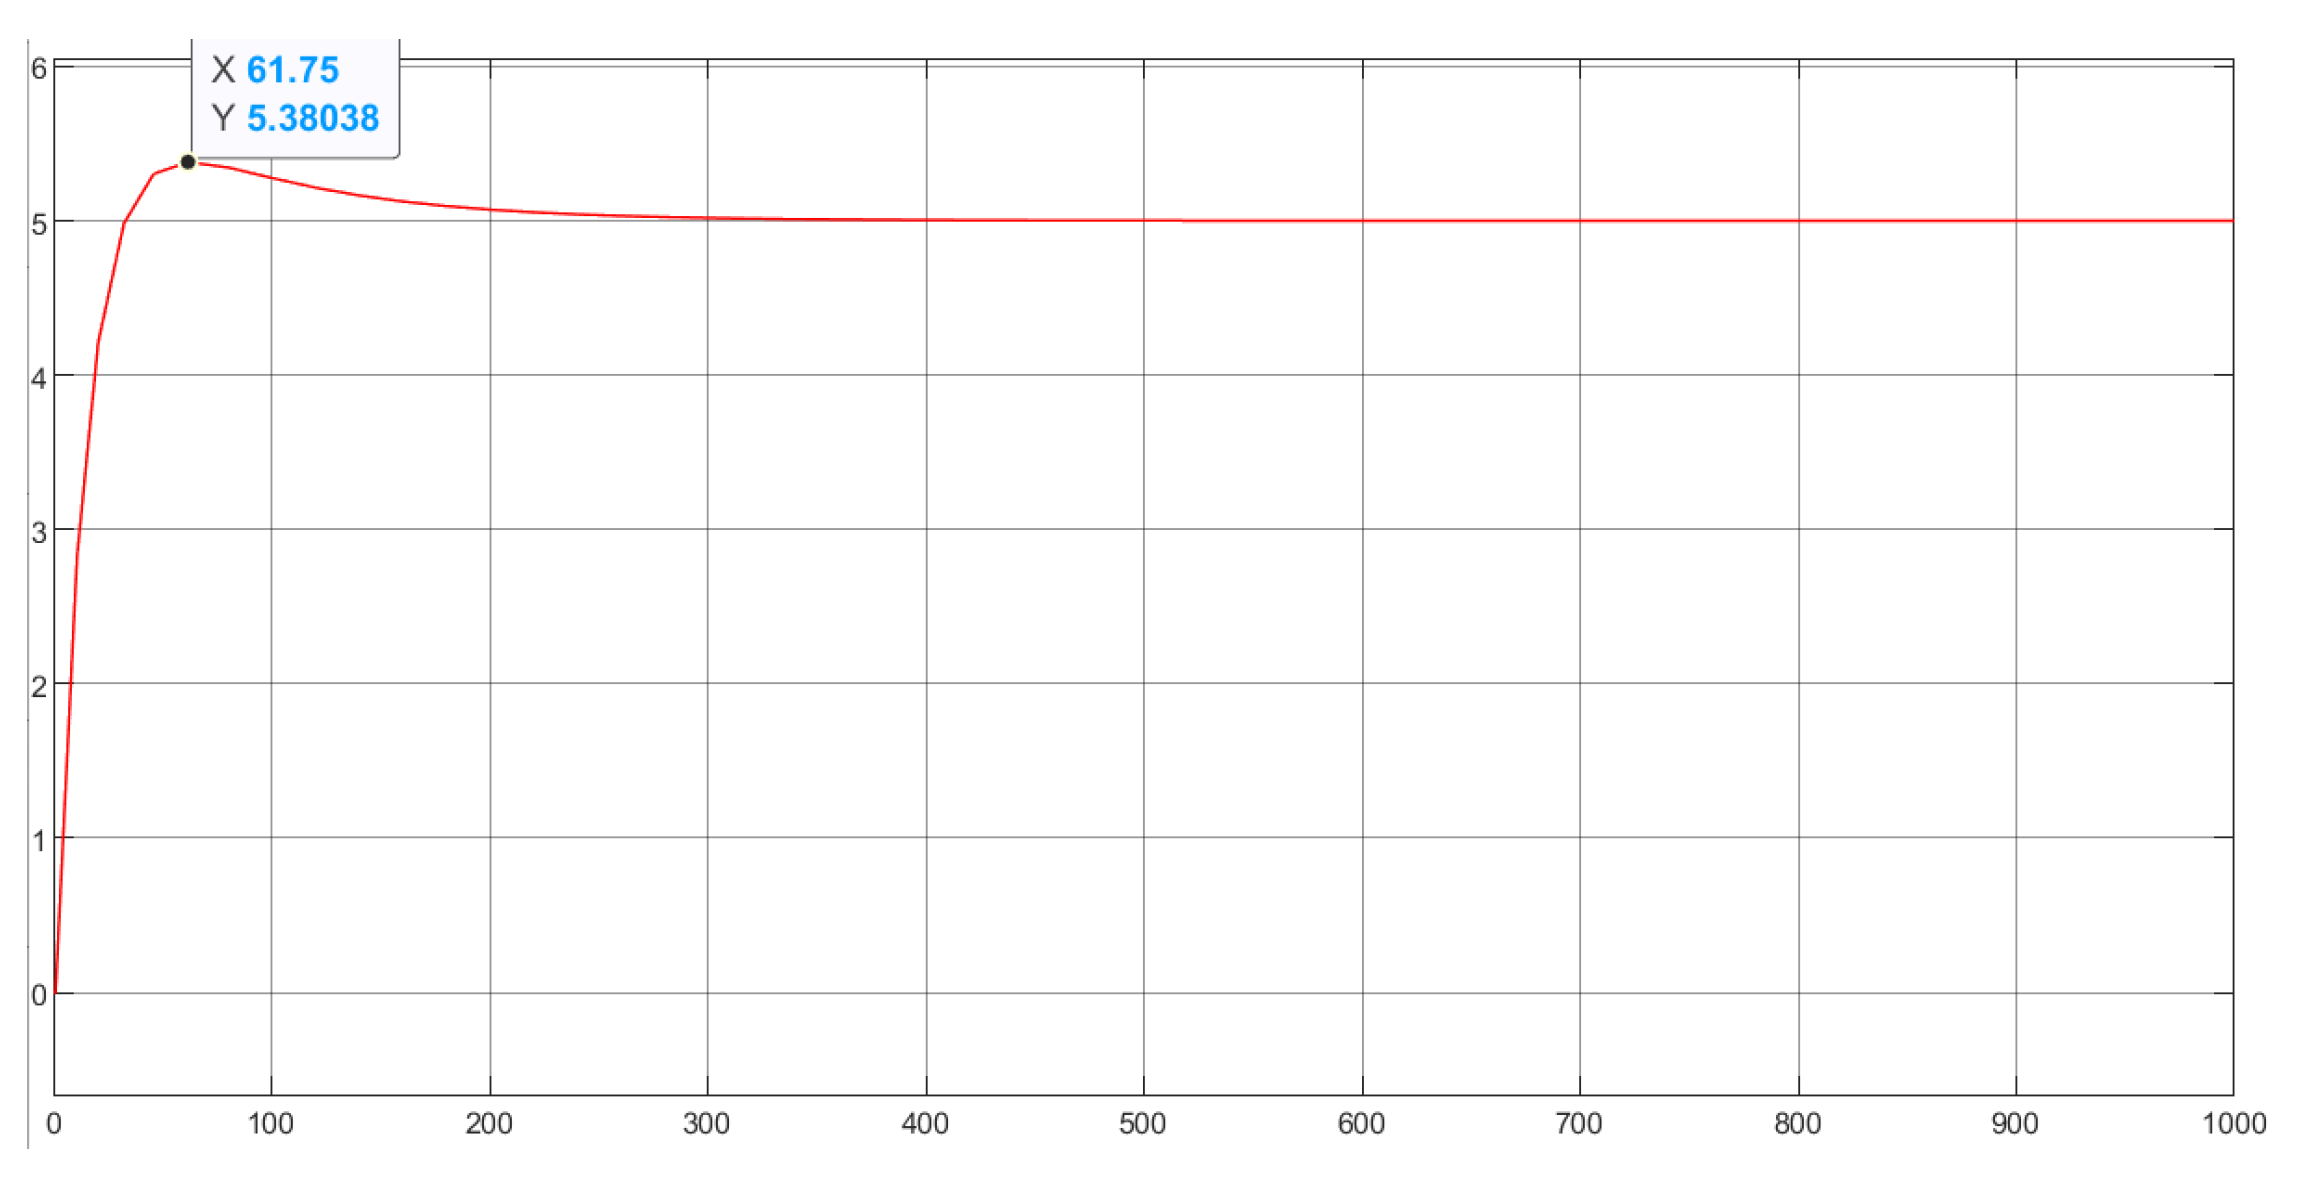
Figure 37.
Temporal response of the level control system (SP: 8 cm).
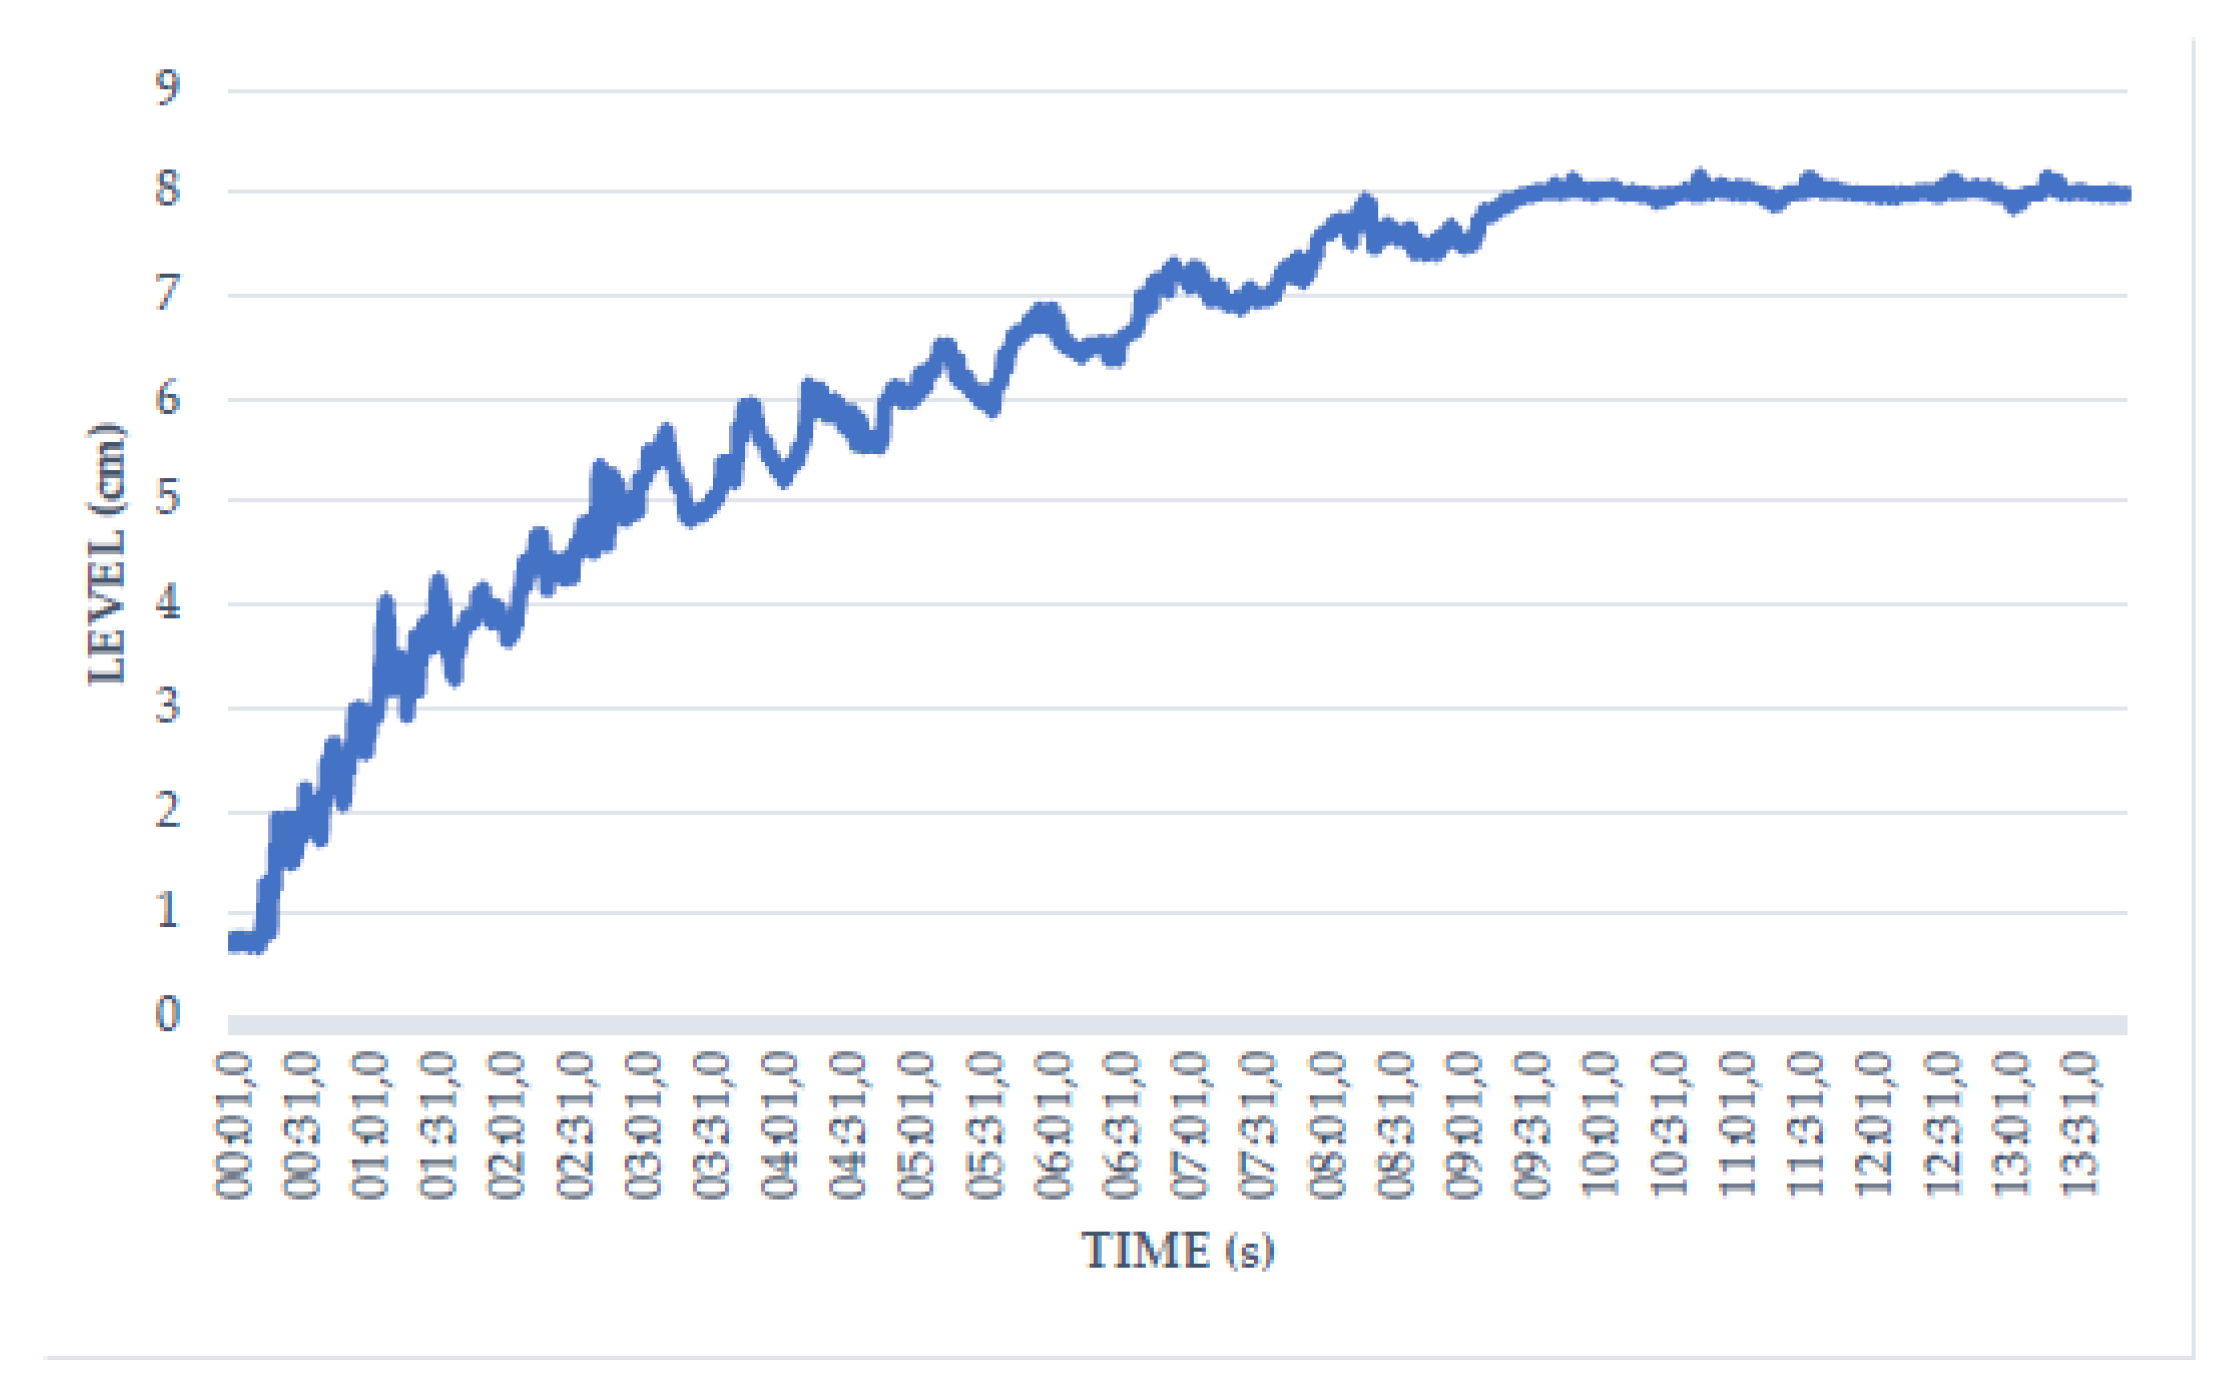
Figure 38.
Simulation of the time response of the level control system (SP: 8 cm).
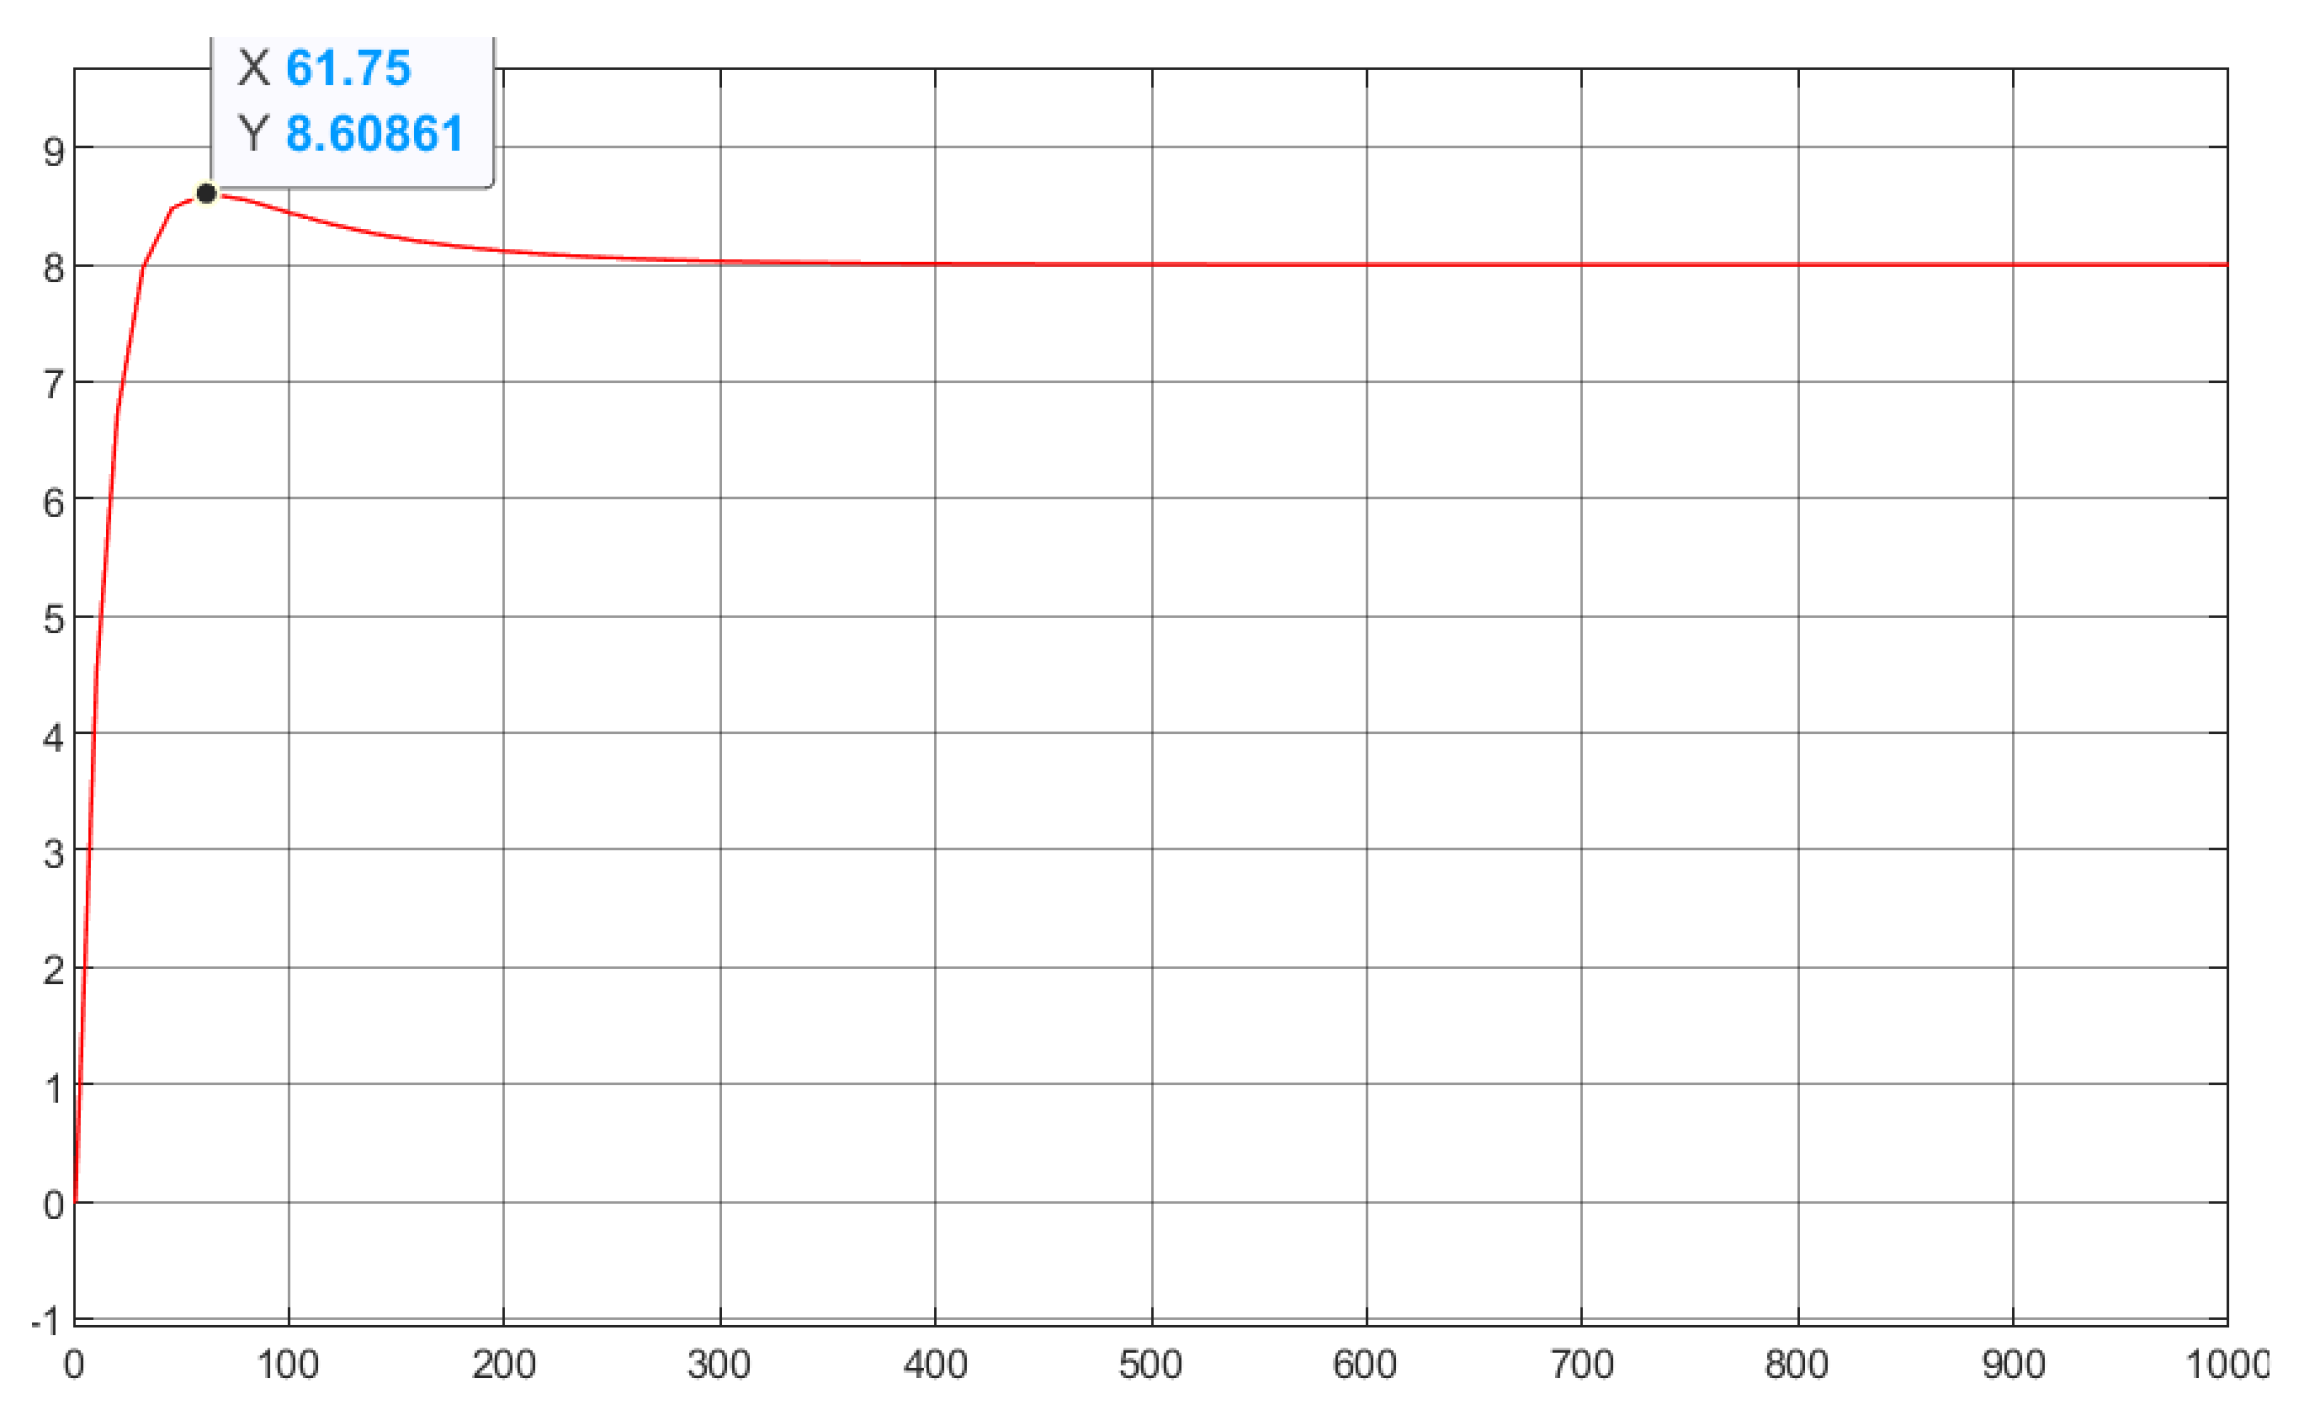
Figure 39.
Temporal response of the temperature control system (SP: ).
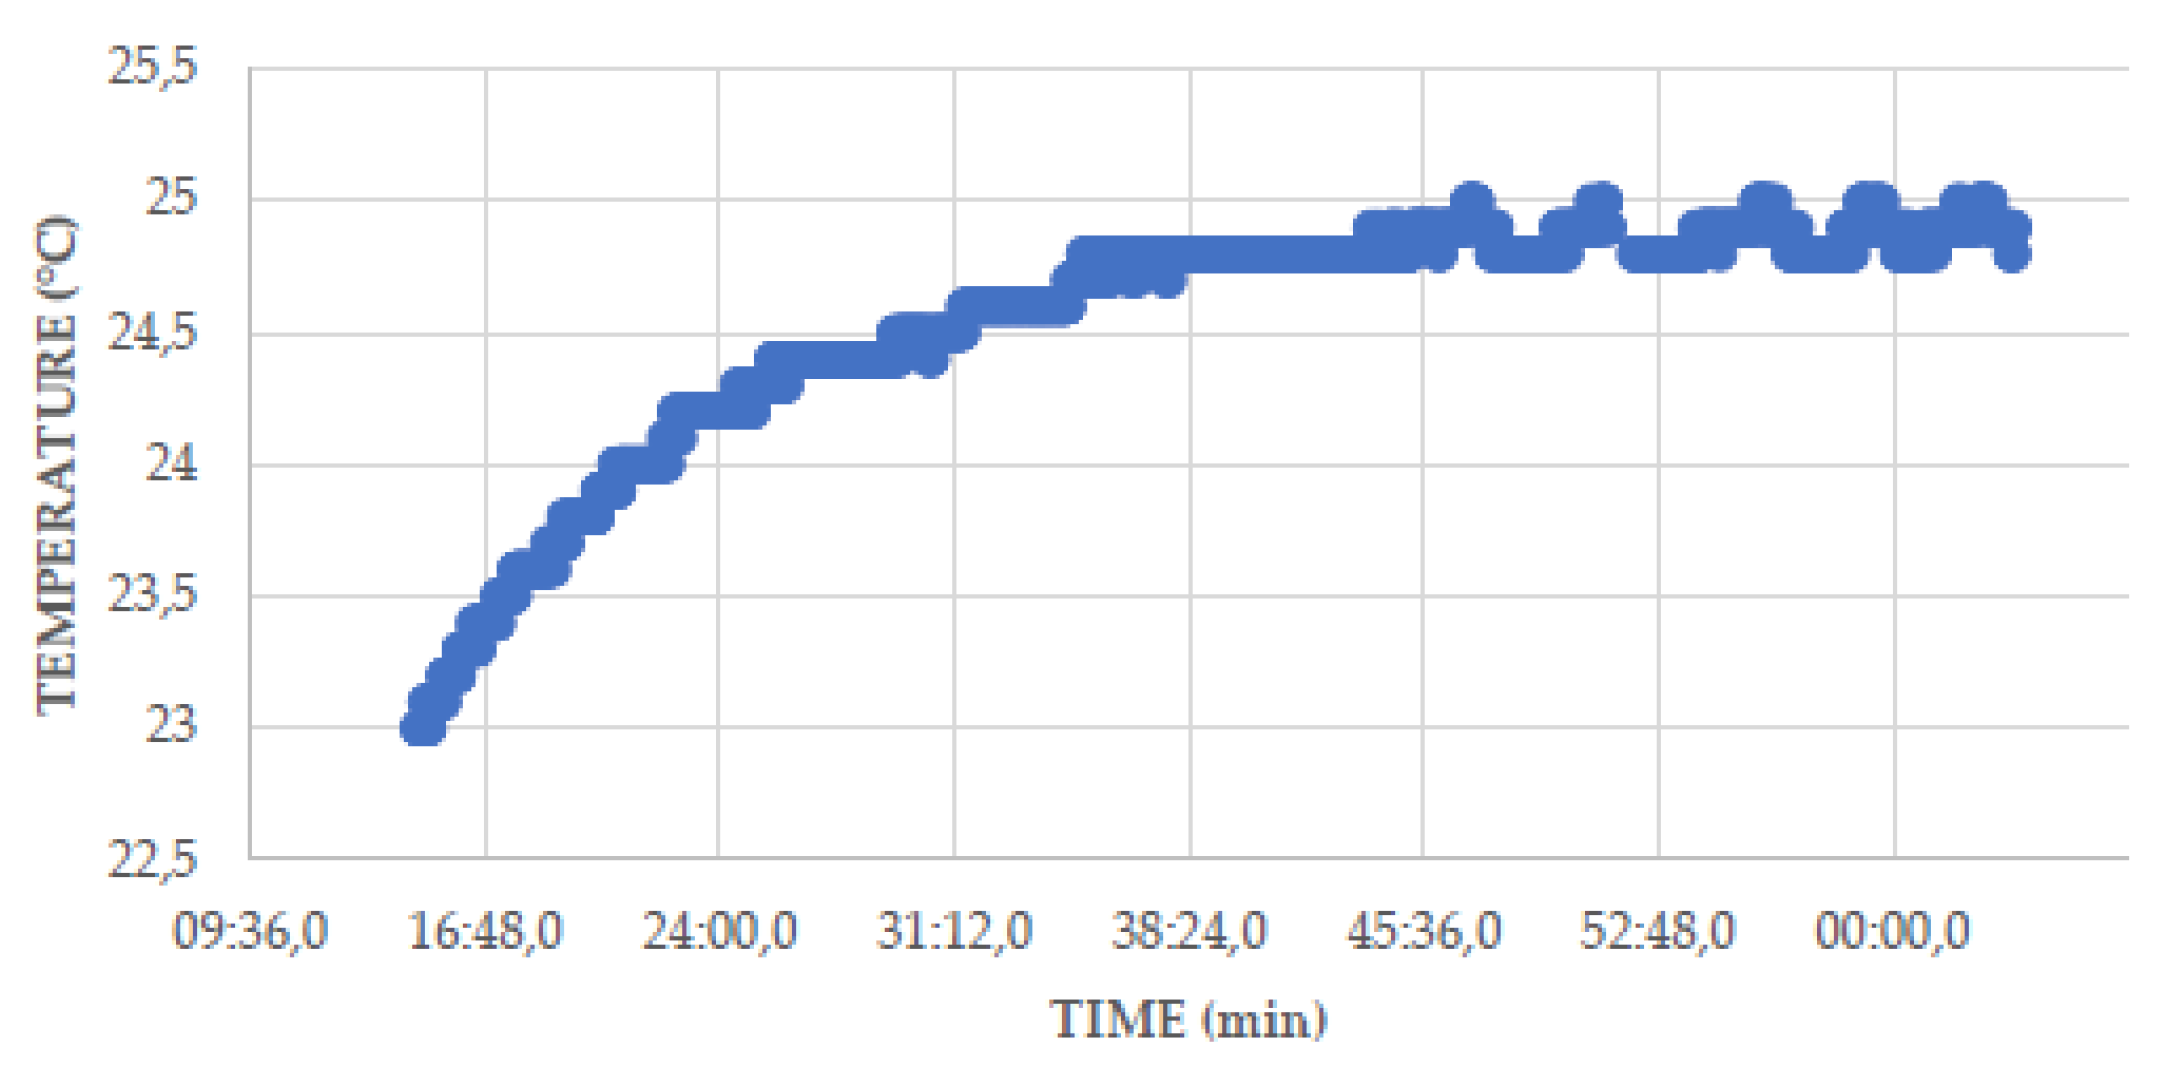
Figure 40.
Variation of pulses and amperage against temperature changes.
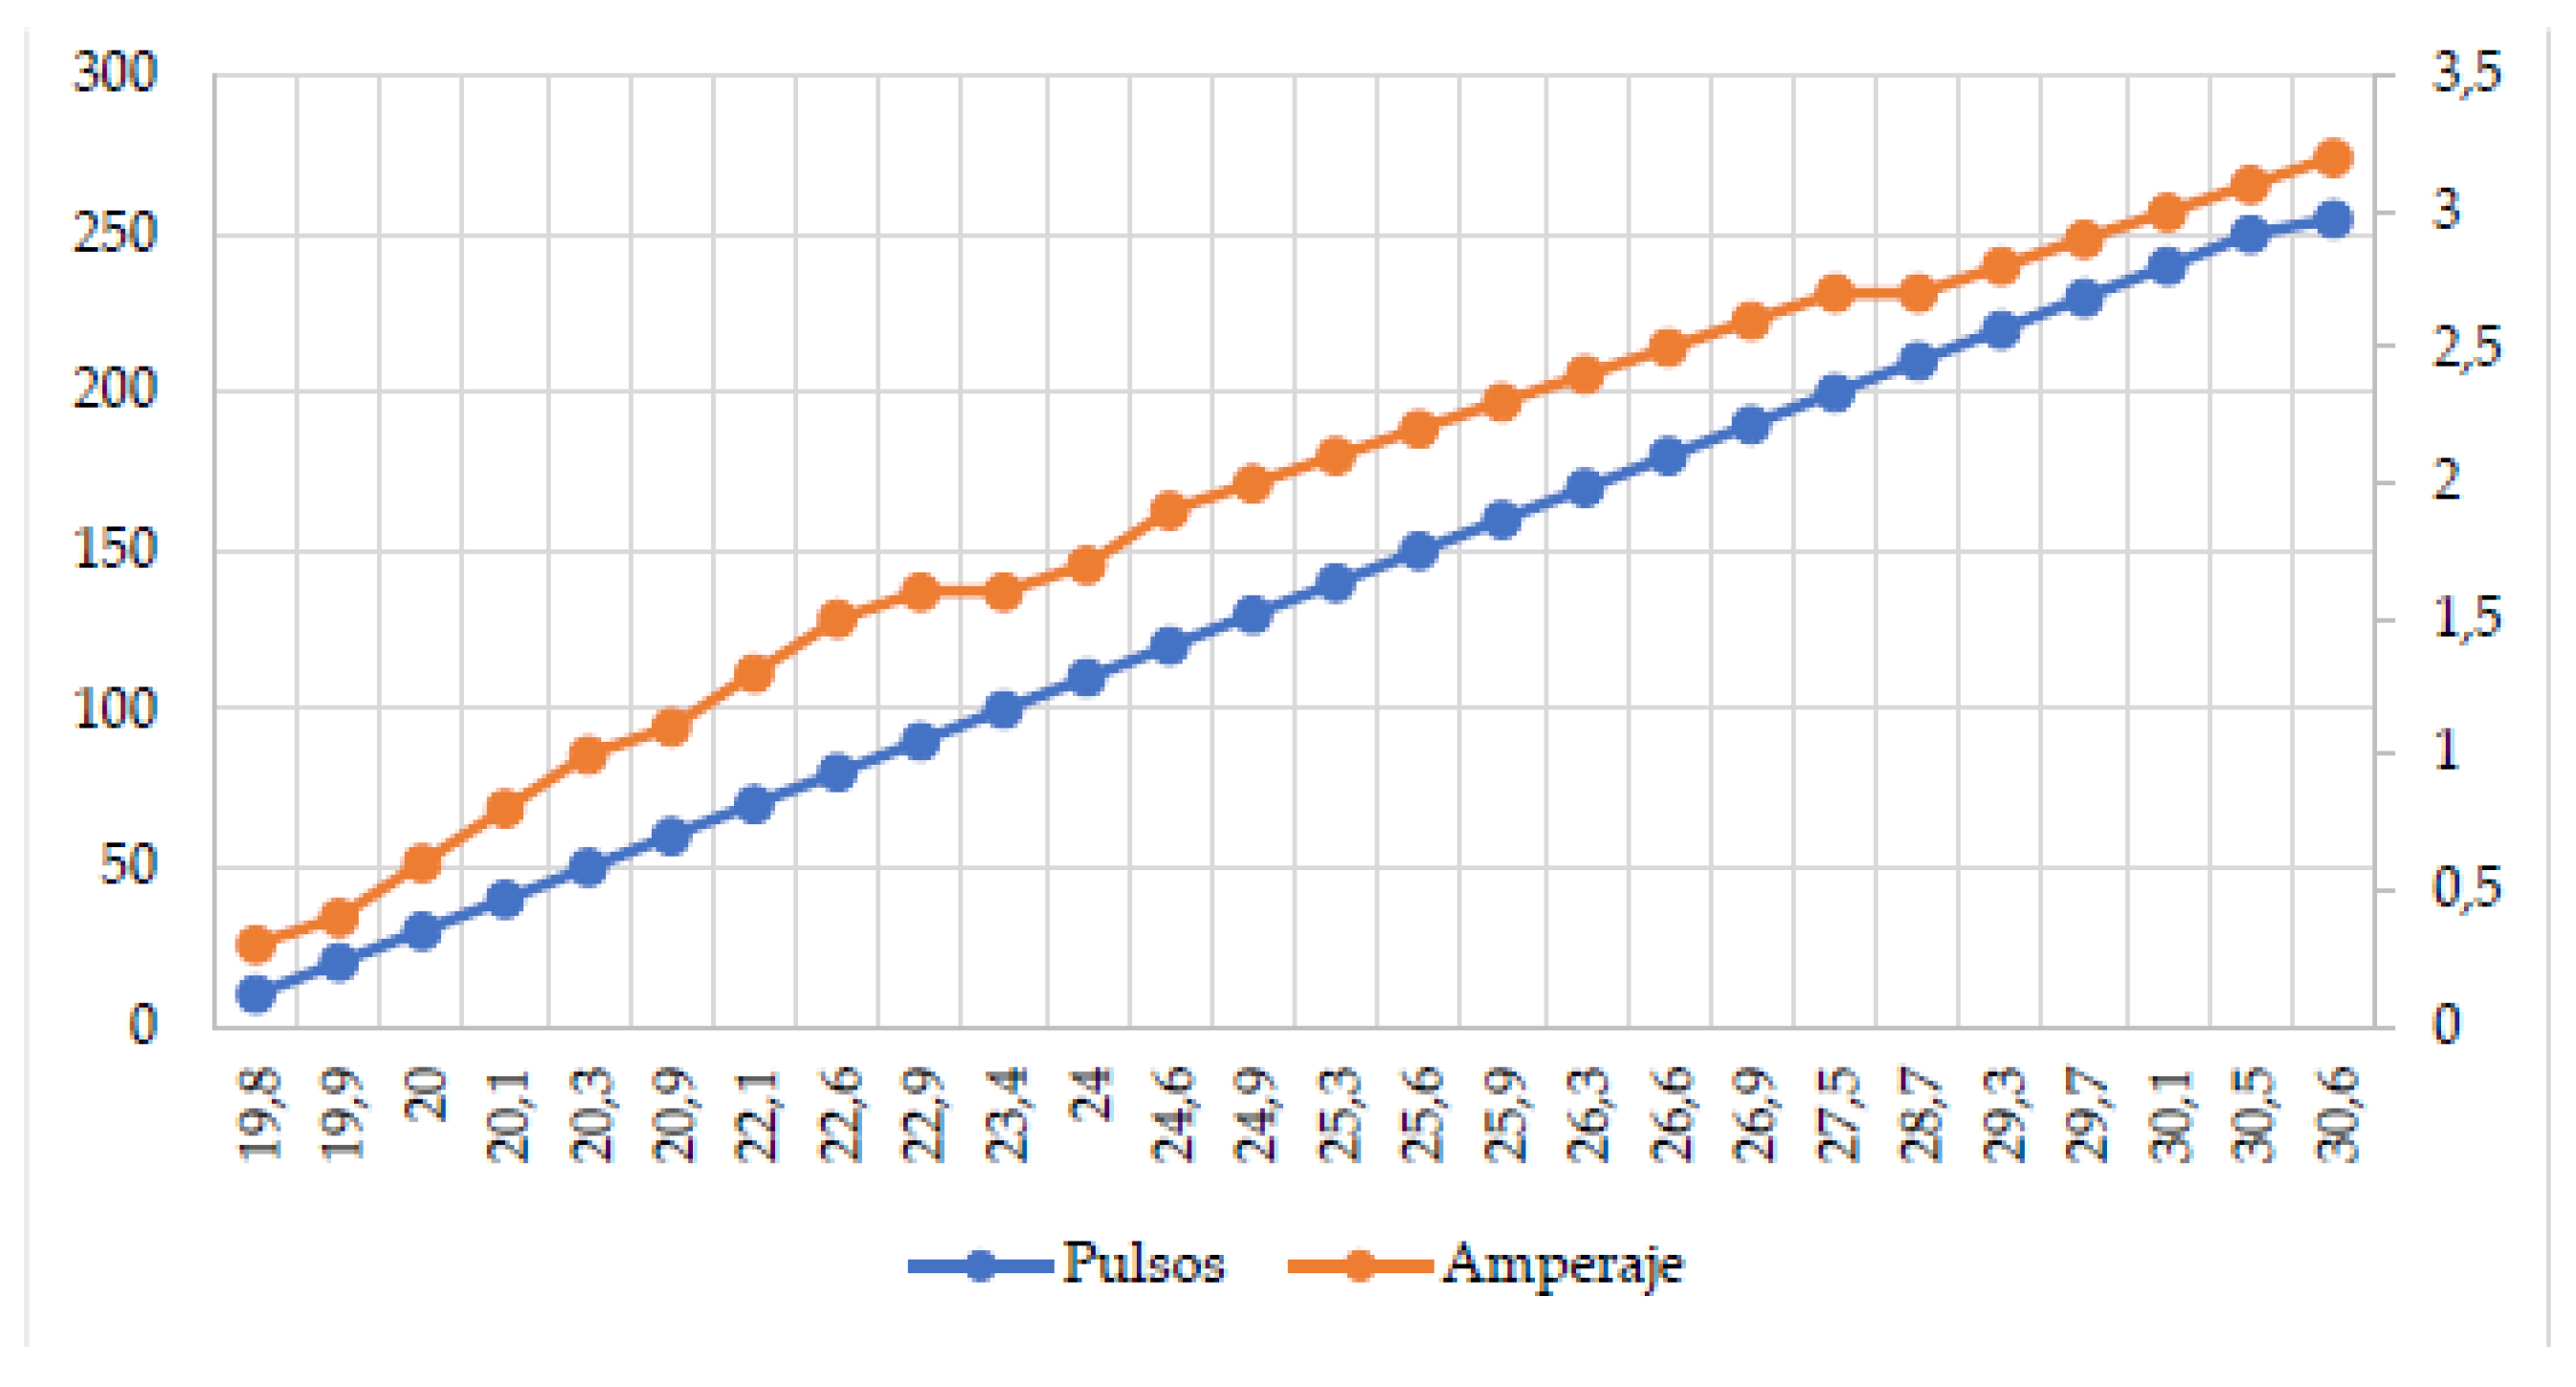
Figure 41.
Operation of the web application.
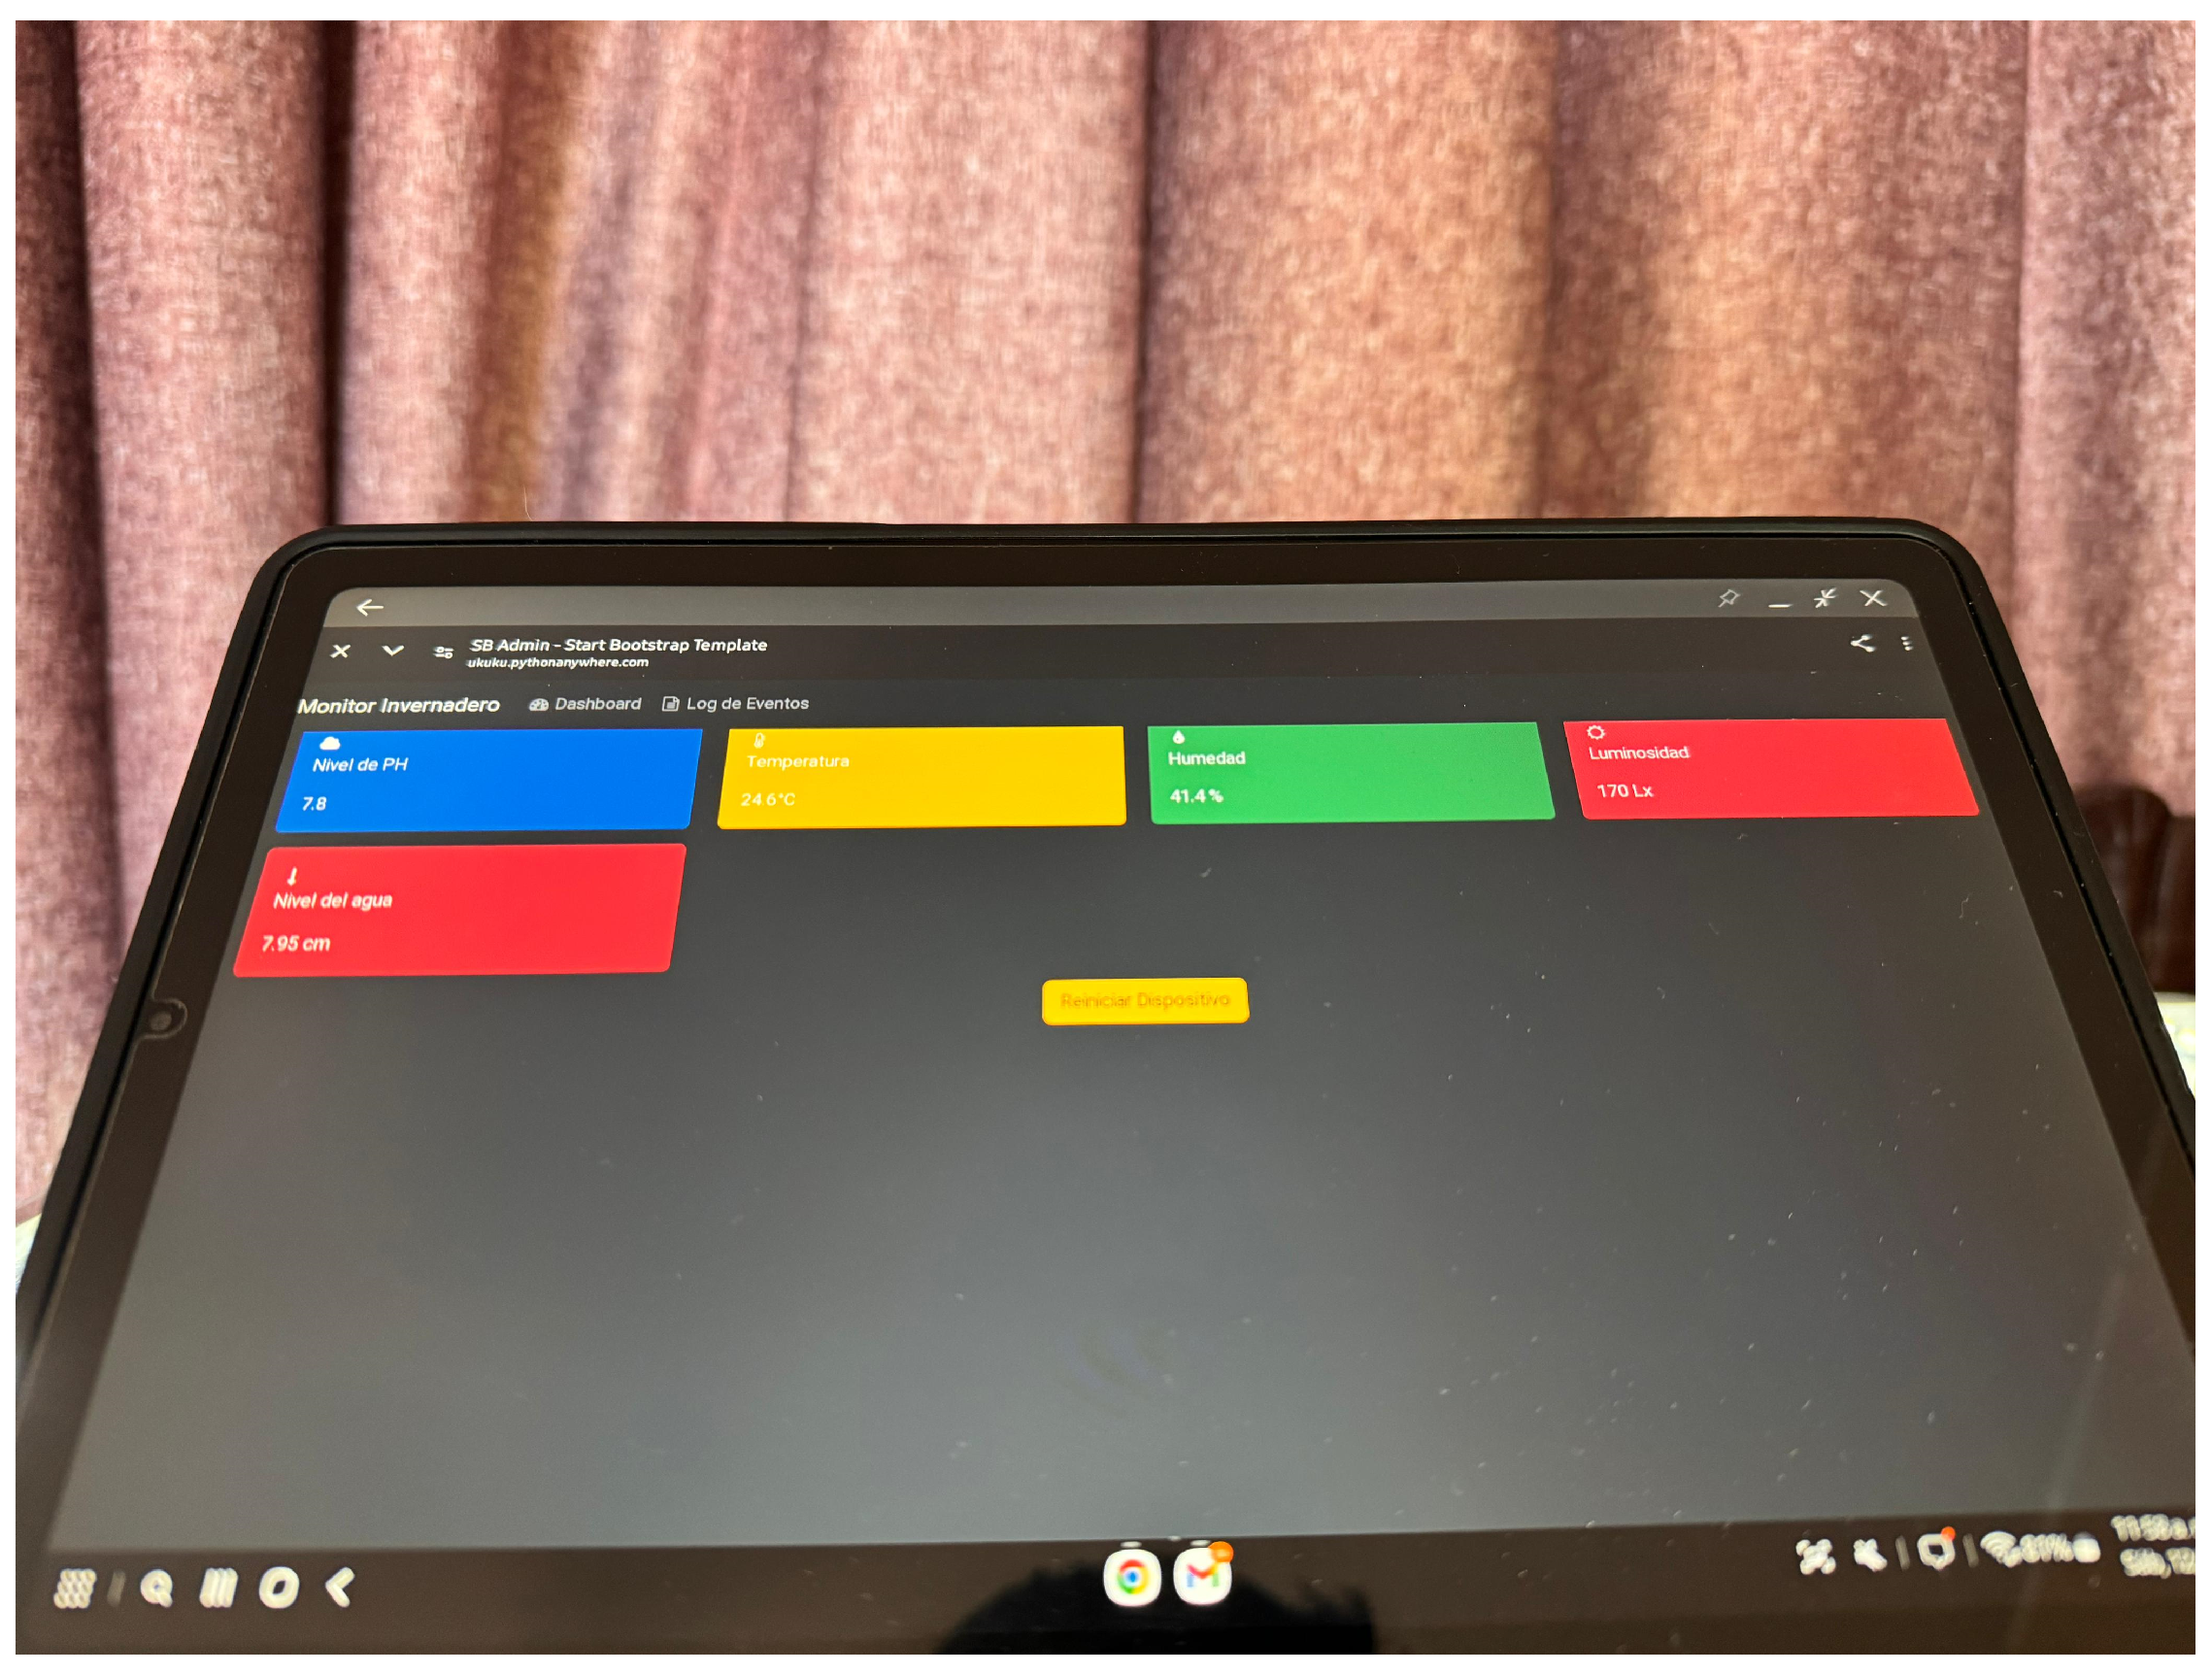

Table 1.
List of materials required of resources for implementation.
| Description | Unit of measure | Quantity |
|---|---|---|
| Raspberry Pi 4B 8Gb + Vilros Case | Unit | 1 |
| Cooler Fan 12V 8cm | Unit | 2 |
| Cooler Fan 12V 4cm | Unit | 1 |
| RF module NRF24L01 | Unit | 2 |
| Driver Bridge ’H’ L298N | Unit | 2 |
| Motor Shield VHN2SP30 | Unit | 1 |
| Luxmeter BH1750 | Unit | 1 |
| DS3231 clock module | Unit | 1 |
| LM2596 DC-DC voltage regulator module | Unit | 2 |
| Ultrasonic sensor HC-SR04 | Unit | 2 |
| Digital humidity and temperature sensor DHT21 | Unit | 2 |
| LED Tape 5m without silicone | Unit | 2 |
| Liquid pH Sensor + Hydroponic Electrode Bnc | Unit | 1 |
| Peltier Kit 12706 with cell, heatsinks and thermal paste | Unit | 1 |
| Water Pump 12 V. 3.5 L/min 2 A | Unit | 1 |
| Switching power supply AC/DC 12 VDC 10 A | Unit | 1 |
| Switching power supply AC/DC 12 VDC 15 A | Unit | 1 |
| White PETG roll | Unit | 1 |
| ARDUINO UNO R3 | Unit | 4 |
Table 2.
List of materials required of software .
| Description | Unit of measure |
|---|---|
| ARDUINO IDE | Unit |
| Matlab/Simulink (UNSA Student License) | Unit |
| Pusher | Unit |
| PythonAnywhere | Unit |
| Visual Studio Code | Unit |
| Tinkercad | Unit |
| Thonny, Python IDE | Unit |
Table 3.
List of materials required of prototype structure.
| Description | Unit of measure | Quantity |
|---|---|---|
| Premium Acrylic Plate 4mm 1.25 x 1.85 | Unit | 1 |
| MDF board | Unit | 1 |
| Aluminum angles | Unit | 4 |
| Screws | Unit | 100 |
| UTP cable | Meters | 8 |
| Sika acetic silicone | Unit | 1 |
| PVC pipe | Unit | 1 |
Table 4.
Structure of the fuzzy controller.
| Fuzzy rules | Output (PWM value on current control driver 0 - 255) |
|---|---|
| Temperature between 22oC - | PWM response between 230 - 255 |
| Temperature between - | PWM response between 160 - 230 |
| Temperature between - | PWM response between 0 - 160 |
Table 5.
Structure of the fuzzy controller .
| N° | Pin Name | Pin function | Description |
|---|---|---|---|
| 1 | CE | Digital Input (7) | Chip Enable. Enables RX or TX mode. |
| 2 | CSN | Digital Input (8) | SPI (Serial Peripheral Interface) chip selection. |
| 3 | SCK | Digital Input (13) | SPI watch. |
| 4 | MOSI | Digital Input (11) | SPI slave data input |
| 5 | MISO | Digital Output (12) | SPI slave data output, with a choice of three states. |
| 6 | IRQ | Digital Output (Not connected) | Maskable interrupt pin. Active low. |
| 7 | VCC | Power (3.3 V) | Power supply (+1.9V -+3.6V DC) |
| 8 | GND | Power (GND) | Ground (0V) |
Disclaimer/Publisher’s Note: The statements, opinions and data contained in all publications are solely those of the individual author(s) and contributor(s) and not of MDPI and/or the editor(s). MDPI and/or the editor(s) disclaim responsibility for any injury to people or property resulting from any ideas, methods, instructions or products referred to in the content. |
© 2024 by the authors. Licensee MDPI, Basel, Switzerland. This article is an open access article distributed under the terms and conditions of the Creative Commons Attribution (CC BY) license (http://creativecommons.org/licenses/by/4.0/).
Copyright: This open access article is published under a Creative Commons CC BY 4.0 license, which permit the free download, distribution, and reuse, provided that the author and preprint are cited in any reuse.


