Submitted:
26 November 2024
Posted:
26 November 2024
You are already at the latest version
Abstract
This paper proposes a green business aggregation strategy tailored to low Earth orbit (LEO) satellite networks (LSNs), dynamically adjusting satellite states to address energy limitations inherent to LEO satellites. A three-layer network architecture is introduced, with control satellites, service satellites, and user devices working collaboratively. Utilizing a Markov Decision Process (MDP) and a Double Deep Q-Network (Double DQN), this strategy optimizes business scheduling and satellite state management. Simulation results validate that the proposed aggregation strategy saves up to 47.87\% energy under low traffic and 4.36\% under high traffic, underscoring its effectiveness.
Keywords:
LSNs
; business aggregation
; Double DQN
; energy efficiency
; green computing
1. Introduction
The 6th generation mobile networks (6G) are expected to offer higher data transmission rates, broader coverage, and reduced latency to meet the extensive future demands in information transmission and processing [1]. Low Earth Orbit (LEO) satellite networks (LSNs) provide full coverage for remote regions and, compared to other satellite systems, offer lower latency, making them a critical component of 6G [2].
Despite these advantages, LSNs face significant challenges due to energy limitations, as LEO satellites rely on solar cells for power, leading to unstable energy supplies as satellites alternate between shadow and sunlight periods. This energy limitation affects the continuous operation and service reliability of LSNs [3].
To address these energy constraints, efficient solar energy acquisition is crucial. Perovskite-based solar cells have shown potential for improving energy conversion in space applications by increasing solar radiation absorption through optimized heat stimulation [4]. Additionally, effective onboard energy management can further optimize performance. For instance, managing energy usage across sunlit and shadow periods enhances transmission efficiency and coverage in high-mobility, large-scale connection scenarios [5].
Existing studies highlight that business aggregation in LSNs can yield significant green energy-saving effects. Studies [6,7] demonstrate that roughly 45% of LEO satellite nodes can be deactivated in low-demand regions without substantial latency increases. Furthermore, on-demand inter-satellite link management can reduce network energy consumption. However, these strategies lack quantification of latency costs associated with business aggregation.
This paper addresses the business aggregation challenge in LSNs. Our contributions are as follows: first, under a three-layer architecture comprising control, service, and user layers, we introduce an Energy-Delay Ratio (EDR) metric to assess the effectiveness of business aggregation; second, we propose an Optimal Consolidation Strategy for Business Efficiency (OCSBE) based on MDP-Double DQN optimization; finally, we validate the strategy’s effectiveness through simulation.
2. System Model
2.1. Network Model
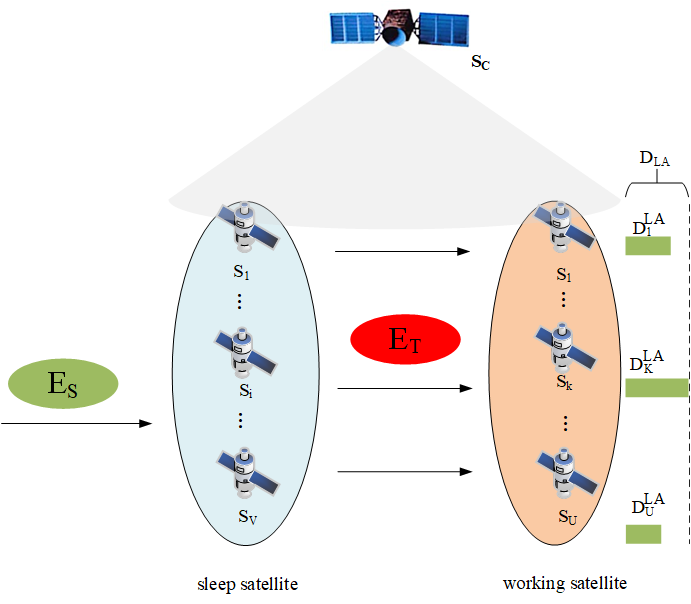
The layered LSNs network architecture is shown in Figure 1. The control satellite layer is composed of high-orbit satellites denoted as , responsible for making aggregation decisions for the service satellites. The business satellite layer consists of M LEO satellites in low Earth orbit, responsible for handling specific businesses. Define the set of business satellites as , where and represent any arbitrary business satellites. The user layer consists of various types of terminals located on the ground, which generate businesses and transmit them to the business satellites covering their region.
The set of businesses received by the business satellite layer is defined as , , where and are the businesses received by satellites and , respectively. The set of business counts received by the business satellites is , where and represent the number of businesses received by satellites and , respectively. Define the sequence of businesses received by as , where is the j-th business received by . The attribute list for business is defined as , where is the data size of business , in bits, and is its maximum tolerable delay, in seconds.
The LEO satellite orbit model is given by:
where R is the Earth’s radius, h is the altitude of the satellite, e is the orbital eccentricity, and is the true anomaly angle.
The distance between two satellites and is calculated as:
where is the spherical distance between and , and , are their respective orbital heights.
2.2. Communication Model
The uplink channel capacity between a ground user and is:
where is the channel bandwidth, and are the transmit power and antenna gain of the user equipment, is the channel gain, and is the noise power [8].
The transmission delay for business from the user to is given by:
The channel capacity between and is:
where is the bandwidth, is the transmission power, is the antenna gain of , is the channel gain between and , and is the noise power.
The delay required for transmitting from to is:
Since the computational results to be sent back to the ground are relatively small, the energy consumption and delay for the return transmission are negligible.
2.3. Computation Model
For a business being processed at , the computation delay, assuming the existence of a ta business queue, is:
where f is the CPU processor frequency of (in cycles/s), and represents the computation capability (in cycles/bit).
The total delay for to process all businesses is:
The energy consumed for computation at is:
where is the computation power of .
3. Problem Modeling
Based on the operational modes of satellites, the working state of can be divided into three states: active, idle, and sleep. In the active state, the satellite performs business transmission and computation businesses, consuming the highest power, with average power consumption for transmission, reception, and computation modules denoted as , , and , respectively. In the idle state, the satellite maintains a low-power mode for communication and computation modules, with power levels , , and . In the sleep state, the computation module is turned off to save power, with , though communication functions remain active for rapid response [9,10].
In specific scenarios, such as low business volume at night or in sparsely populated regions, certain satellites are underutilized. To enhance energy efficiency, a business aggregation strategy can be employed to consolidate businesses on a subset of satellites, allowing others to enter a sleep state.
As illustrated in Figure 2, the LSNs concentrate business processing on a subset of service satellites, allowing other satellites to enter a sleep state. Define the set of sleeping satellites as and working satellites as , where U and V represent the number of sleeping and working satellites, respectively, such that .
The energy consumption for transferring a business from a sleeping satellite to a working satellite is:
The total communication energy for aggregating businesses from to is:
The energy savings for a sleeping satellite is:
where is the duration of the sleep period.
The total energy savings for all sleeping satellites is:
The net energy saved by business aggregation is:
After receiving businesses from sleeping satellites, the working satellite updates its business queue. Suppose business is assigned a sequence number upon insertion; then the updated queue for is , where represents the total number of businesses in after aggregation.
The computation delay for processing after aggregation is:
The total computation delay for after aggregation is:
The maximum delay for all working satellites after aggregation is:
The maximum delay without aggregation is:
The delay increment due to aggregation is:
To comprehensively evaluate the impact of energy savings and delay increase, we define the Energy-Delay Ratio (EDR) as:
where EDR represents the energy savings per unit delay increase (in J/s).
The optimization objective of the business aggregation strategy is defined as:
where constraint (a) ensures that the business processing time is less than the maximum tolerable delay for the business; constraint (b) ensures that each business is assigned only once, with taking a value of 0 or 1 to indicate whether the business is assigned to business satellite ; constraint (c) defines the range of the number of working satellites; and constraint (d) ensures that the sum of working and sleeping satellites equals the total number of business satellites.
4. Problem Solution
The optimization problem includes both continuous and discrete variables, making it a Mixed-Integer Programming (MIP) problem. Due to the non-linear constraints, this problem can be classified as a Mixed-Integer Nonlinear Programming (MINLP) problem. To address this complex optimization, we decompose it into two sub-problems:
- Sub-problem 1: Determining the Set of Sleeping Satellites
- Sub-problem 2: Aggregating Businesses from Sleeping Satellites to Working Satellites
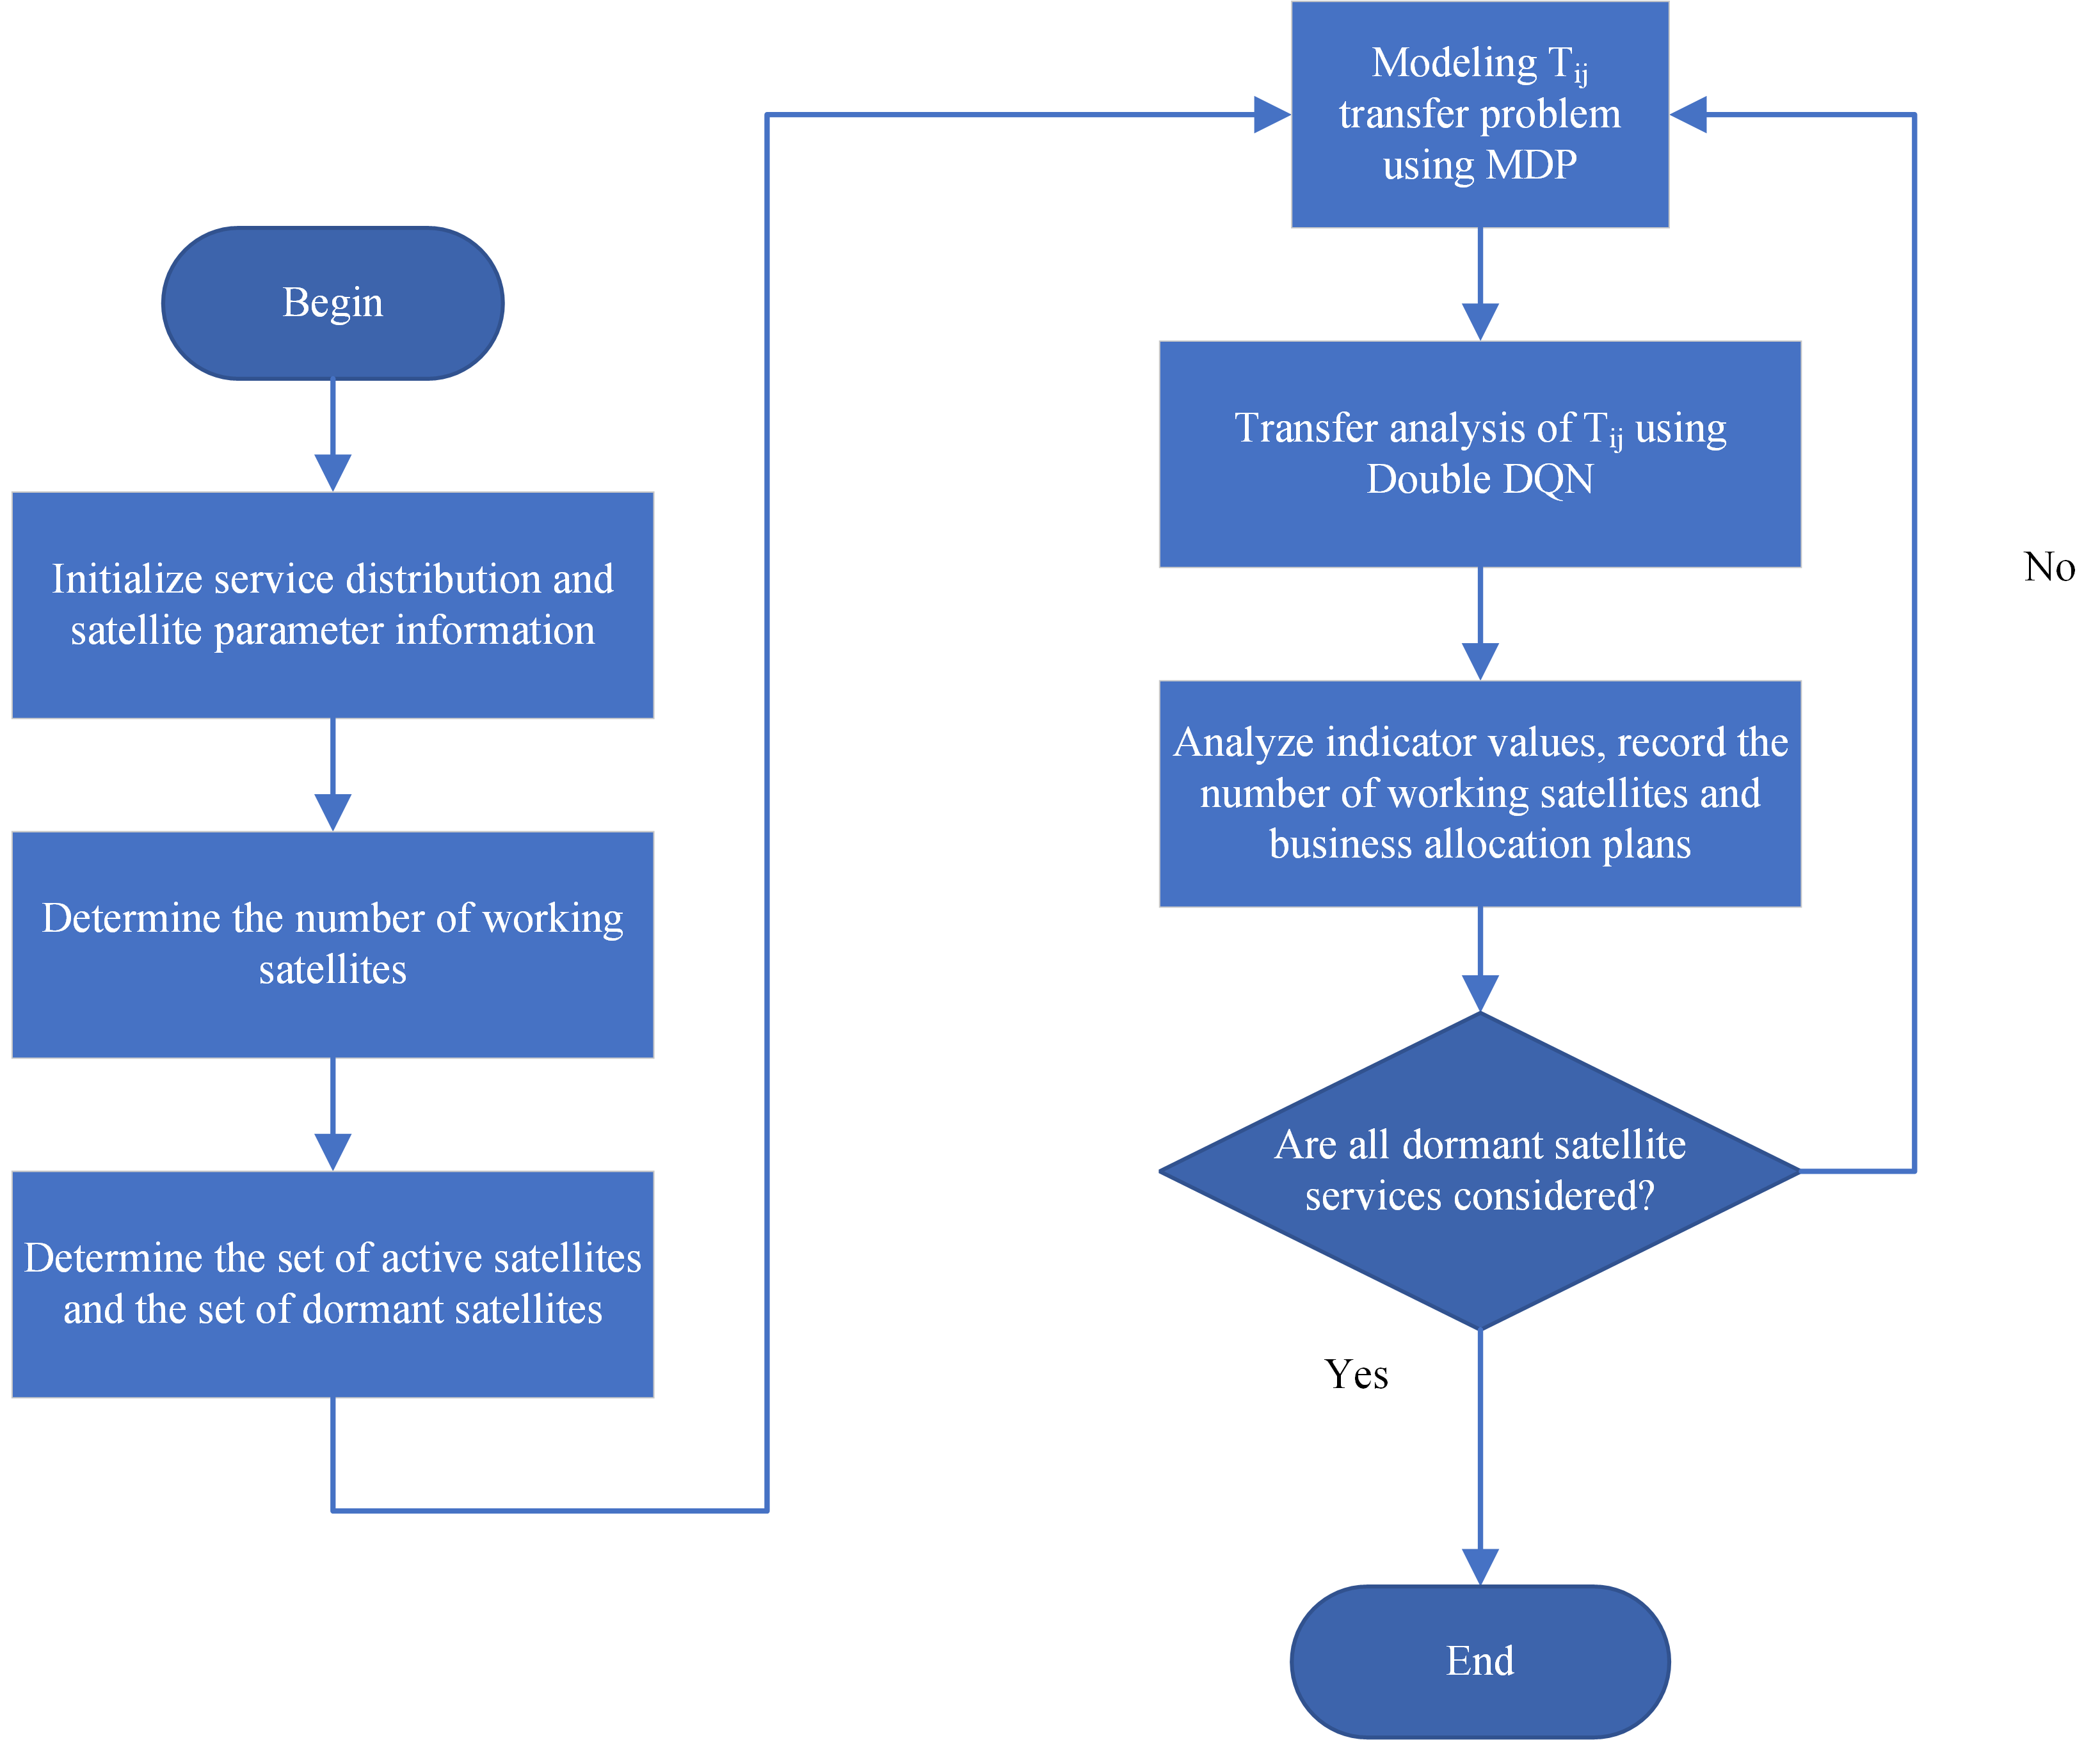
We propose the Optimal Consolidation Strategy for Business Efficiency (OCSBE) to aggregate businesses on service satellites. The procedure is illustrated in Figure 3.
- Step 1: Initialization. The control satellite initializes the process by collecting information on service distribution and satellite parameters.
- Step 2: Determine the Number of Working Satellites. Based on the current service volume, determine the number of satellites that will remain active.
- Step 3: Determine the Set of Active Satellites and the Set of Dormant Satellites. Classify satellites into active and dormant sets based on service demand.
- Step 4: Model the Transfer Problem Using MDP. Use a Markov Decision Process (MDP) to model the transfer problem for .
- Step 5: Perform Transfer Analysis of Using Double DQN. Conduct transfer analysis for using a Double Deep Q-Network (Double DQN).
- Step 6: Analyze Indicator Values, Record the Number of Working Satellites and Business Aggregation Plans. Analyze indicator values, and record the number of active satellites and the business aggregation scheme.
- Step 7: Check if All Dormant Satellite Services Are Considered. Verify if all services for dormant satellites have been considered. If not, return to continue the process; if yes, end the process.
4.1. Determining the Set of Sleeping Satellites
For Sub-problem 1, this paper adopts the Capacity-Driven Sleep Satellite Quantity (CDSSQ) mechanism to determine the number of sleeping satellites. The design is as follows:
- Sorting Satellites: First, sort the business satellites in ascending order based on their business volume to obtain the list .
- Calculating the Number of Working Satellites: Determine the number of working satellites V using the relationship between the current business volume and the system’s maximum capacity as per Equation 22:where represents the current total business volume of ; is the maximum computable business volume per satellite (measured in bits); and denotes the ceiling function.
- Determining Satellite Sets: Based on the calculated number V and the sorted list , identify the set of working satellites and the set of sleeping satellites .
4.2. Aggregating Businesses
We address this sub-problem by modeling it as a Markov Decision Process (MDP) and employing a Double Deep Q-Network (Double DQN) for business reassignment.
4.2.1. MDP Element Group
-
Define the elements of the MDP as follows:
- State Space ():where represents the current business volume of satellite .
-
Action Space ():Each action denotes assigning business to satellite .
-
Transition Probability (): The probability of assigning business to satellite is represented as:This denotes the probability of satellite transitioning from state to state after action .
- Reward Function (): The reward for assigning business to satellite is defined as:where is the energy difference associated with the business transfer; is the idle power consumption; and are the transmission and reception power consumptions, respectively; and and represent delay components.
- Discount Factor (): is a discount factor between 0 and 1 that balances the importance of current and future rewards.
4.2.2. Double DQN
The Double DQN approach is designed to reduce the overestimation of Q-values by decoupling the action selection from the action evaluation. The implementation details are as follows:
Utilize Double DQN to learn the optimal business aggregation policy that maximizes cumulative rewards. Double DQN employs two Q-networks to mitigate the overestimation of Q-values:
- Online Network (): The primary network used for selecting actions.
- Target Network (): A secondary network with parameters that are periodically updated to stabilize training.
- Action Selection Using -Greedy Strategy: Based on the -greedy policy, an action is selected in a given state as per:where is a probability between 0 and 1 representing the likelihood of choosing a random action for exploration, and is the action-value function of the online network.
- Calculating Transition Probabilities: The probability of transferring business to satellite is computed as:where is the maximum business volume that satellite can handle, and represents the current business volume of satellite .
- Reward Calculation: The reward for taking action in state is calculated as:
- Updating the Q-Values Using the Bellman Equation: Update the Q-value of the online network using the Bellman equation as shown:where: where is the previous Q-value before the update, is the learning rate, is the discount factor, and are the parameters of the target network.
- Convergence Check: Perform a convergence check to determine if the Q-values have stabilized:where is a small threshold value. If remains below for multiple consecutive updates, the Q-values are considered to have converged, indicating that the optimal business aggregation strategy for has been found.
Repeat the above steps to make aggregation decisions for all businesses that need to be transferred, and form the final business-working satellite mapping.
5. Simulation Analysis
5.1. Simulation Parameter Design
By using STK to build a three-layer network architecture scenario, the control satellite is set at an altitude of 2000 km, while the business satellites are distributed at altitudes ranging from 500 to 1500 km. The power range for the entire functional module transmitting inter-satellite signals is 10 W to 50 W [10], the power range for the entire functional module receiving signals is 5 W to 25 W [10], and the power range for the entire functional module performing computations is 60 W to 415 W [11]. The clock frequency of the satellite CPU is cycles/s [12]. The parameters for LSNs are shown in Table 1.
The Double DQN strategy parameters are listed in Table 2. The learning rate was set to 0.001, ensuring a stable parameter update step size, with an epsilon decay rate of 0.995 to balance exploration and exploitation phases. The discount factor was set to 0.99 to emphasize the importance of long-term rewards, and the training involved 500 episodes.
5.2. Strategy Simulation and Analysis
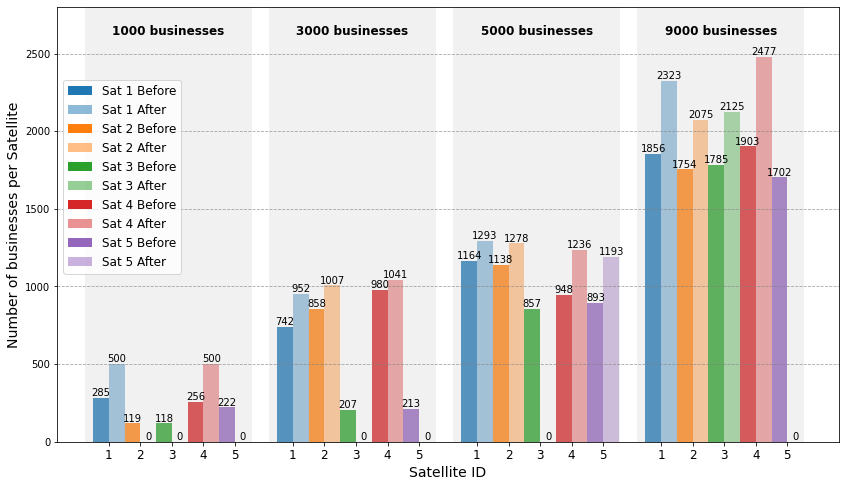
Figure 4 shows the performance of the proposed aggregation strategy. As business volume increases, the number of satellites involved in processing also grows. The strategy favors satellites with initially higher business volumes for aggregation, reducing transmission energy. Furthermore, the load distribution among working satellites becomes more balanced due to the reward-punishment mechanism, which optimizes the overall performance of the system.
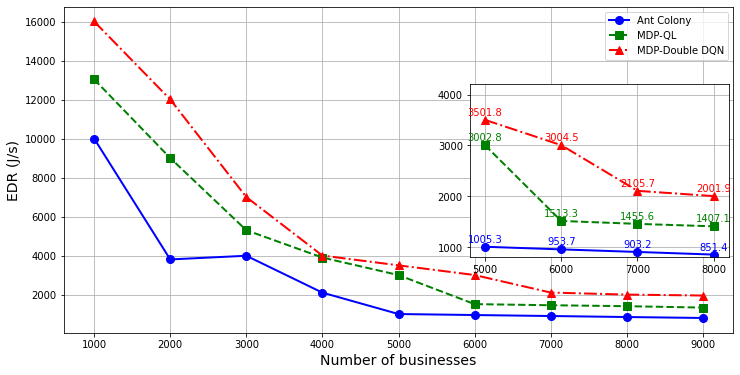
To validate the performance advantage of the proposed strategy, this paper compares it with the following baseline strategies:
- Ant Colony Strategy (AC): This strategy generates aggregation decisions and resource aggregations by simulating ant colony behavior for global optimization.
- MDP-QL Strategy (MDP-QL): This strategy constructs a Q-table to generate aggregation decisions and resource aggregations, aiming to achieve global optimization.
Figure 5 shows the performance comparison in terms of EDR across different strategies. With increasing business volume, the overall optimization goal declines and eventually converges. This is due to the increased transmission energy consumption and processing delays. The proposed strategy outperforms others across different business volumes because it utilizes reinforcement learning to effectively balance exploration and exploitation in continuous state spaces, achieving optimal performance.
Table 3 presents the delay increment and energy reduction ratio for different business volumes. When the business volume is low, the proposed aggregation strategy achieves significant energy savings with minimal delay increase. However, as the business volume grows, the energy savings decrease, making this strategy particularly advantageous in low-traffic scenarios.
6. Conclusion
In this paper, we propose a business aggregation strategy for Low Earth Orbit (LEO) Satellite Networks (LSNs) to address the energy limitations of LEO satellites. This strategy dynamically adjusts the working states of satellites based on the business volume, enabling certain satellites to enter a sleep state for energy conservation. By constructing a three-layer network architecture involving control satellites, service satellites, and user devices, and employing a Markov Decision Process (MDP) and Double Deep Q-Network (Double DQN), we optimize business scheduling and satellite state management.
The simulation results validate the effectiveness of the business aggregation strategy, demonstrating a 47.87% reduction in energy consumption under low business volume and a 4.36% reduction under high business volume. This shows that the proposed strategy is particularly effective in low-traffic scenarios where energy savings are critical.
The findings in this study provide practical guidance for energy-efficient management in LSNs, with potential applications in other energy-sensitive fields, such as data centers and smart grids, that require high energy-efficiency management.
Acknowledgments
This work was supported in part by the Director Fund of Key Laboratories of Cognitive Radio and Information Processing, Ministry of Education (Grant No. CRKL210109). We also thank the ImageNet team for providing the dataset used in this research.
References
- ITU. Framework and Overall Objectives of the Future Development of IMT for 2030 and Beyond. Available online: https://www.itu.int/en/publications/Pages/default.aspx (accessed on Day Month Year).
- Zhu, X.; Jiang, C. Creating Efficient Integrated Satellite-Terrestrial Networks in the 6G Era. IEEE Wireless Communications 2022, 29, 154–160. [Google Scholar] [CrossRef]
- Yue, P.; An, J.; Zhang, J.; Ye, J.; Pan, G. Low Earth Orbit Satellite Security and Reliability: Issues, Solutions, and the Road Ahead. IEEE Communications Surveys & Tutorials 2023, 25, 1604–1652. [Google Scholar]
- Angmo, D.; Yan, S.; et al. Toward Rollable Printed Perovskite Solar Cells for Deployment in Low-Earth Orbit Space Applications. ACS Applied Energy Materials 2024, 7, 1777–1791. [Google Scholar] [CrossRef]
- Song, Y.; Li, X.; et al. Energy-Aware Task Offloading and Resource Allocation in the Intelligent LEO Satellite Network. In Proceedings of the IEEE Annual International Symposium on Personal, Indoor and Mobile Radio Communications (PIMRC); 2022; pp. 481–486. [Google Scholar]
- Al-Hraishawi, H.; Chatzinotas, S. Quantum Optimization Algorithm for LEO Satellite Communications Based on Cell-Free Massive MIMO. In Proceedings of the IEEE International Conference on Communications Workshops (ICC Workshops), 2023.
- Bhattacharjee, D.; Madoery, P.G.; et al. On-Demand Routing in LEO Mega-Constellations with Dynamic Laser Inter-Satellite Links. IEEE Transactions on Aerospace and Electronic Systems 2024. [Google Scholar] [CrossRef]
- Wang, Y.; Gui, K.A. An Energy Consumption Minimization Resource Allocation Strategy in Satellite-Terrestrial Communication Networks. Electronics Letters 2023, 59, e13025. [Google Scholar] [CrossRef]
- Raj, R.; Dharmaraja, S. Stochastic Modelling of Multi-Layer HAP-LEO Systems in 6G for Energy Saving: An Analytical Approach. Computer Communications 2023, 210, 22–34. [Google Scholar] [CrossRef]
- Gao, X.; Kaushik, A.; et al. Virtual Network Function Placement in Satellite Edge Computing with a Potential Game Approach. IEEE Transactions on Network and Service Management 2022, 19, 1243–1259. [Google Scholar] [CrossRef]
- Zhang, Y.; Wu, Q.; et al. Energy Drain Attack in Satellite Internet Constellations. In Proceedings of the IEEE/ACM International Symposium on Quality of Service (IWQoS); 2023; pp. 1–10. [Google Scholar]
- Lin, X.; Liu, A.; Han, C.; et al. LEO Satellite and UAVs Assisted Mobile Edge Computing for Tactical Ad-Hoc Network: A Game Theory Approach. IEEE Internet of Things Journal 2023. [Google Scholar] [CrossRef]
Figure 1.
Layered architecture of LSNs showing control, business, and user layers.
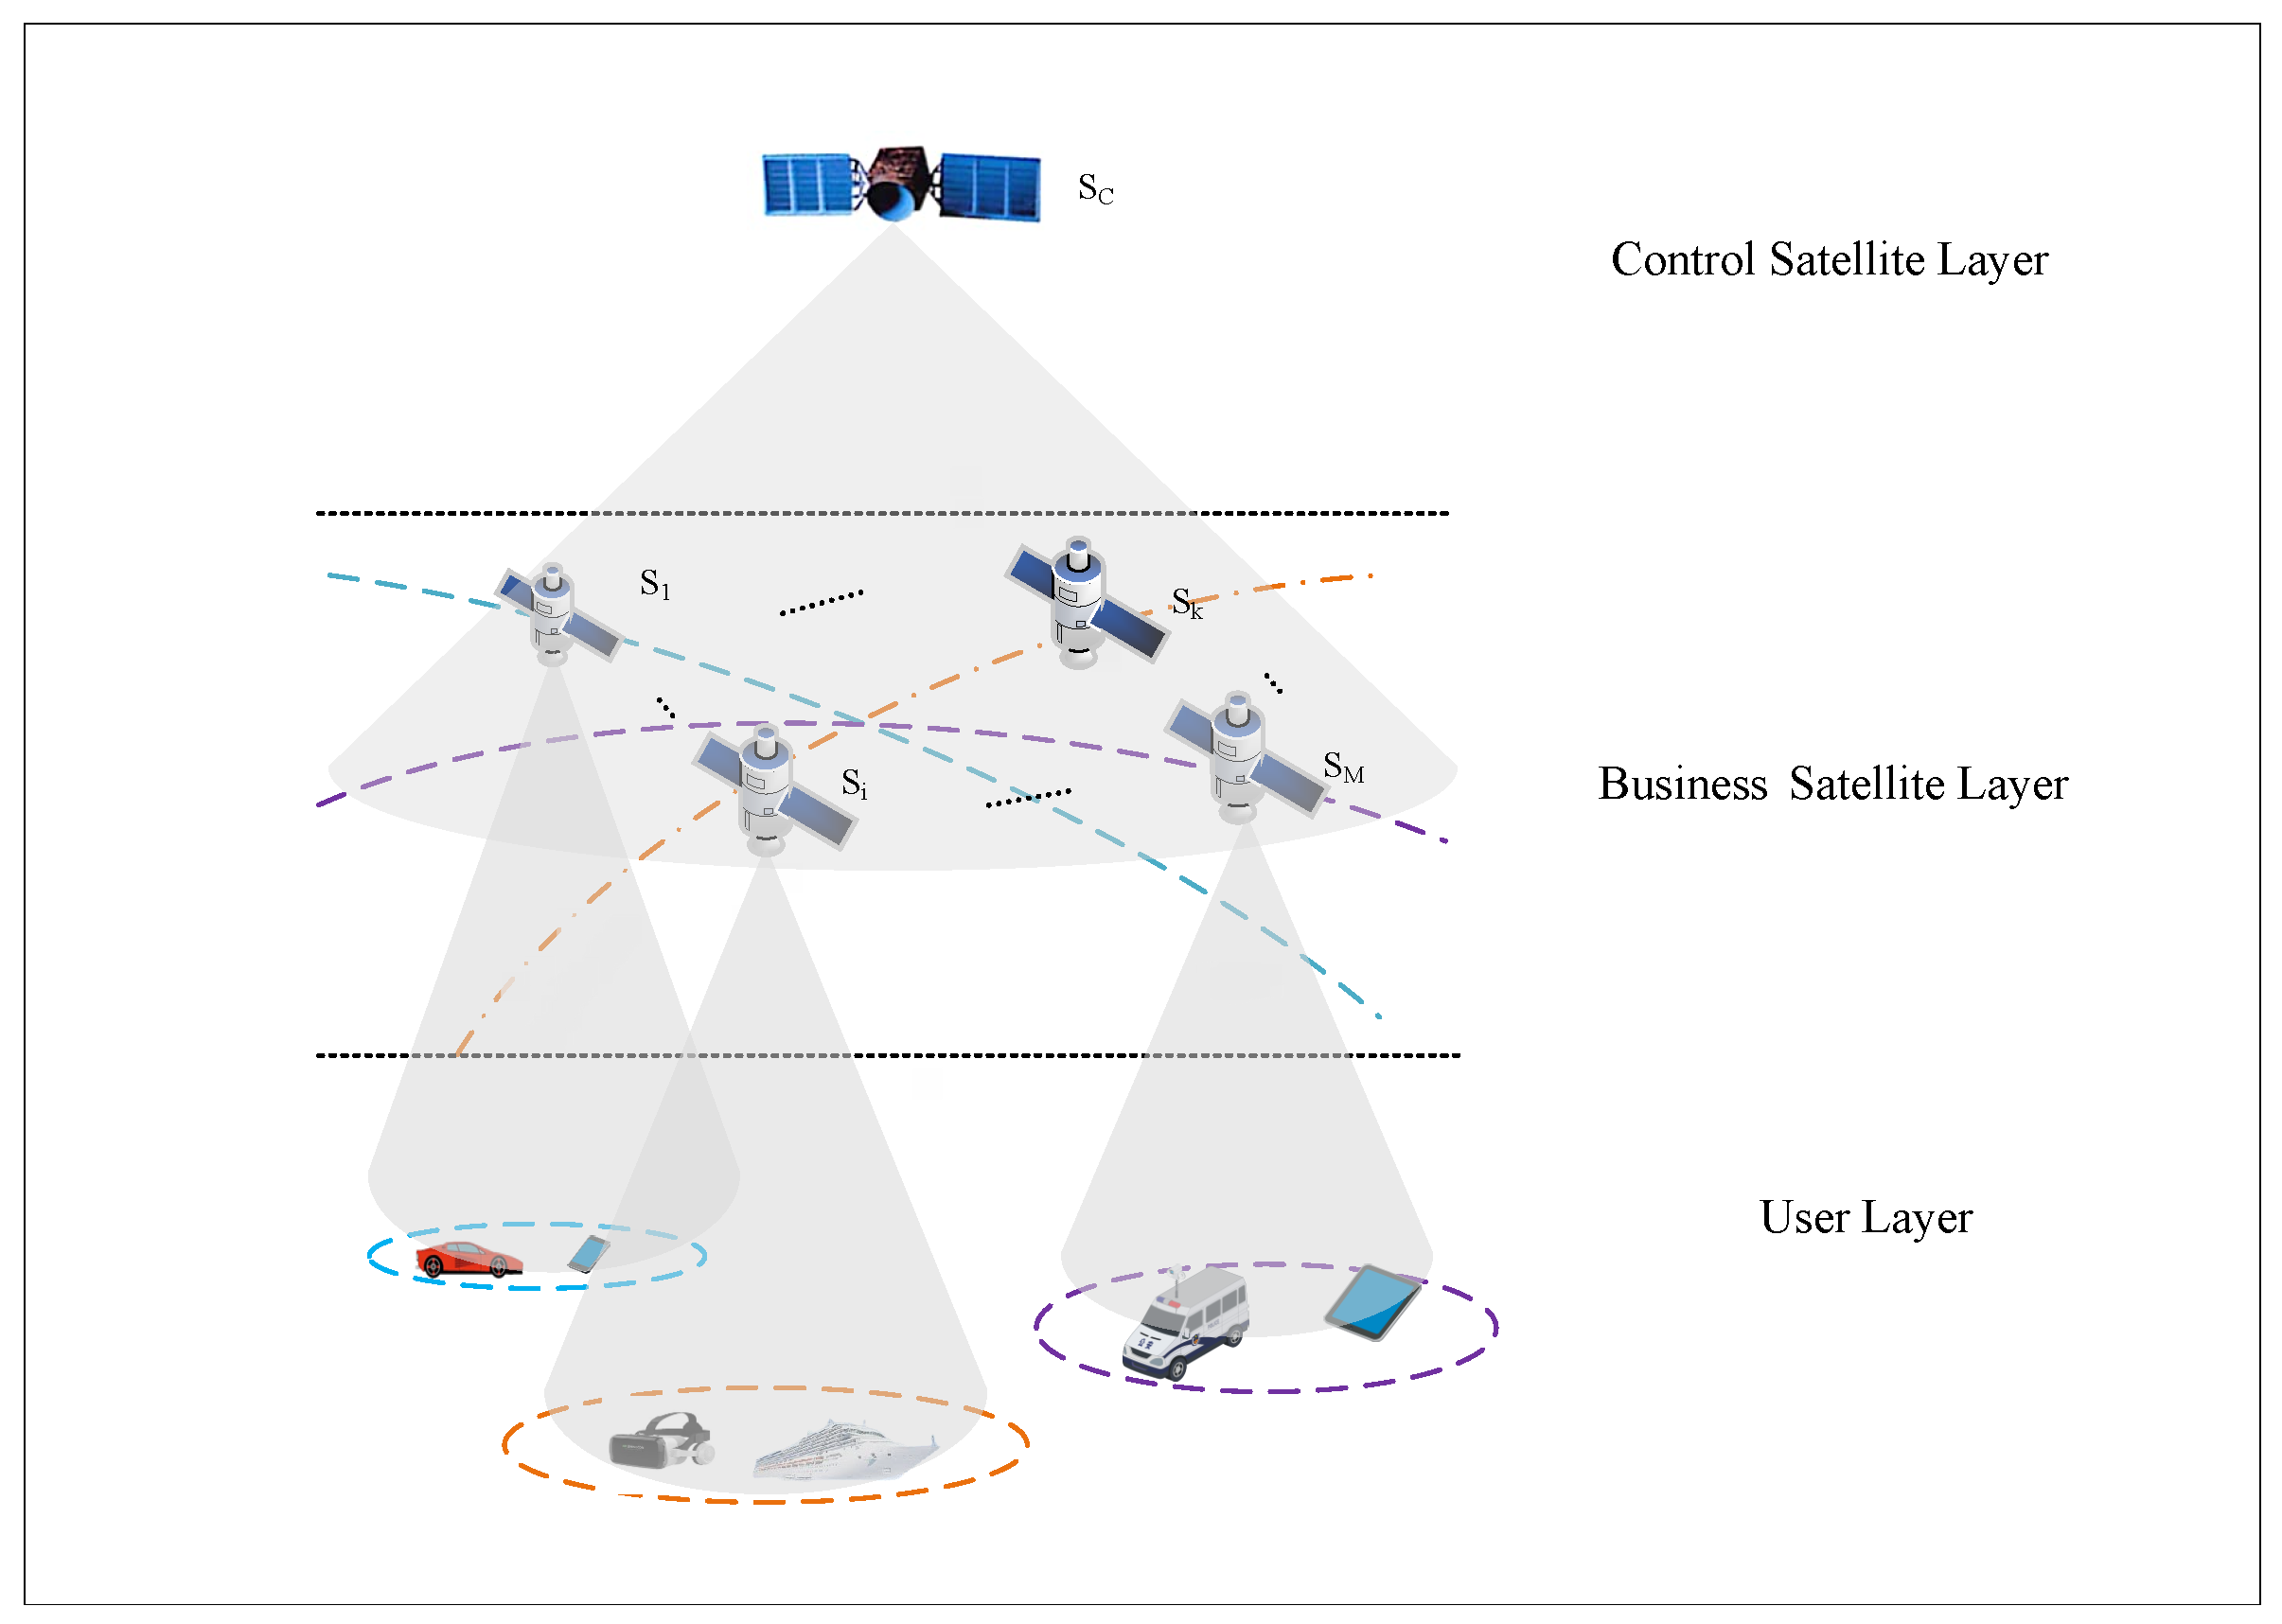
Figure 2.
Business satellite load aggregation diagram.
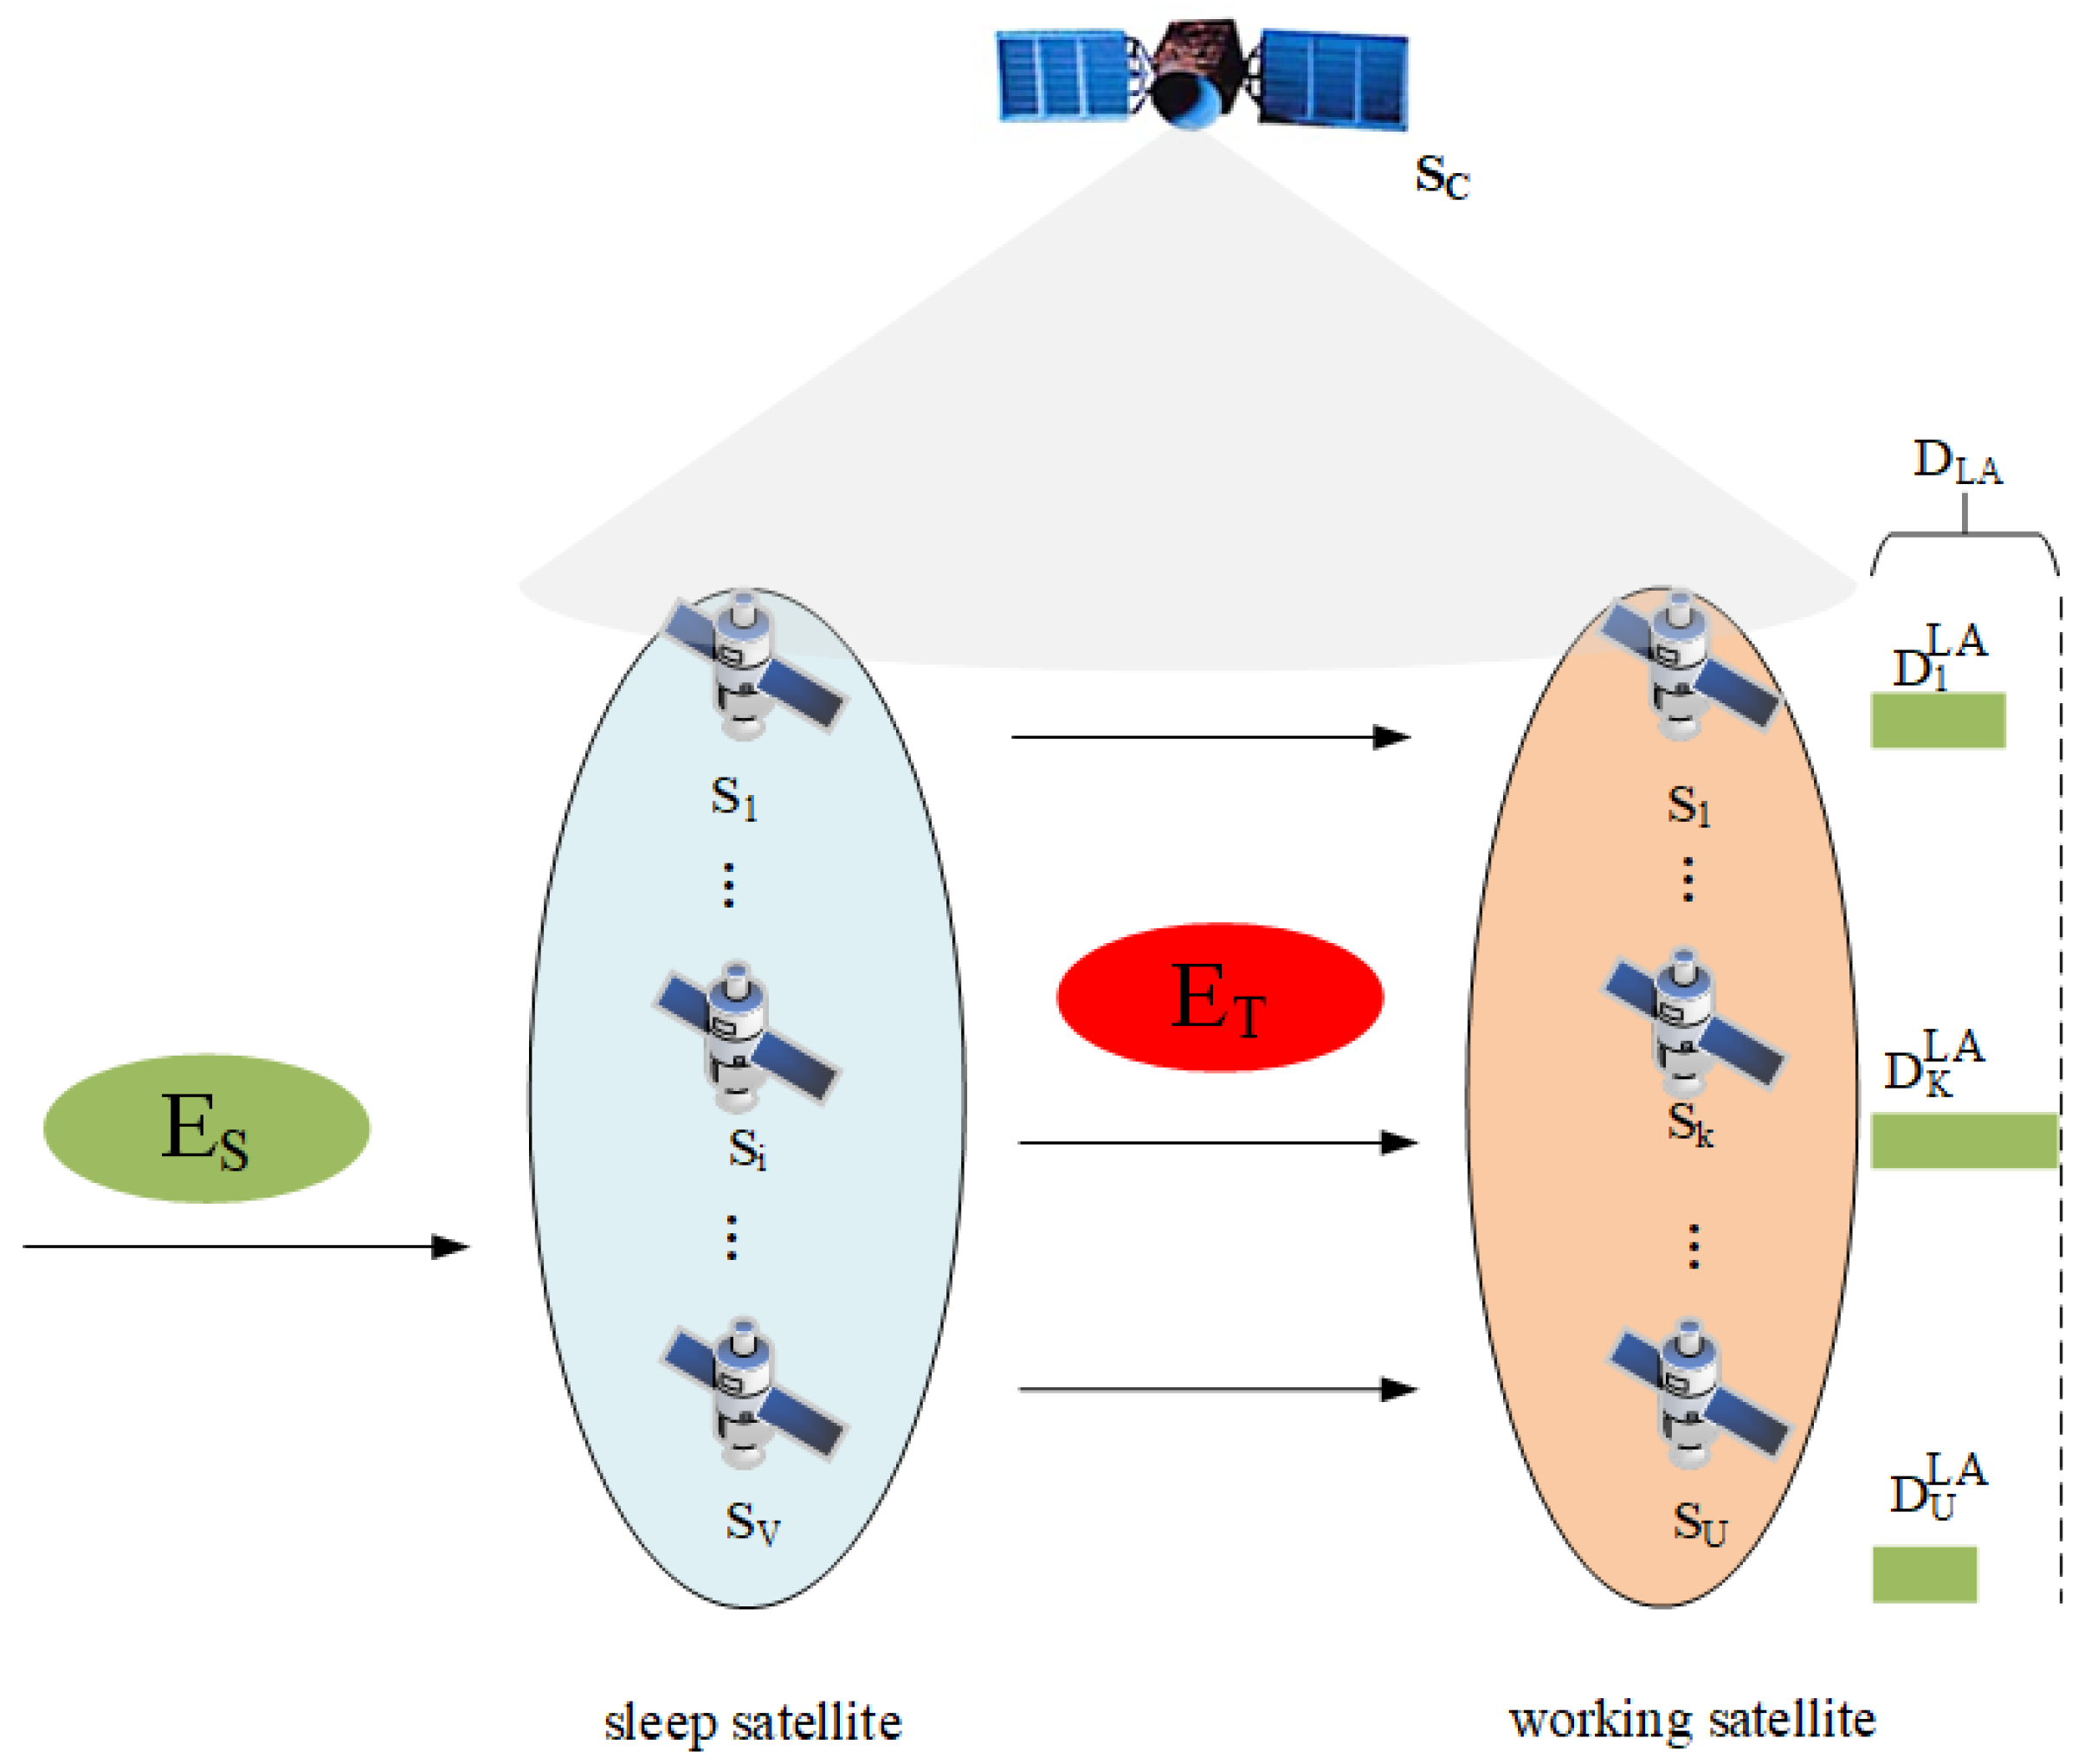
Figure 3.
Business Aggregation Flow Chart
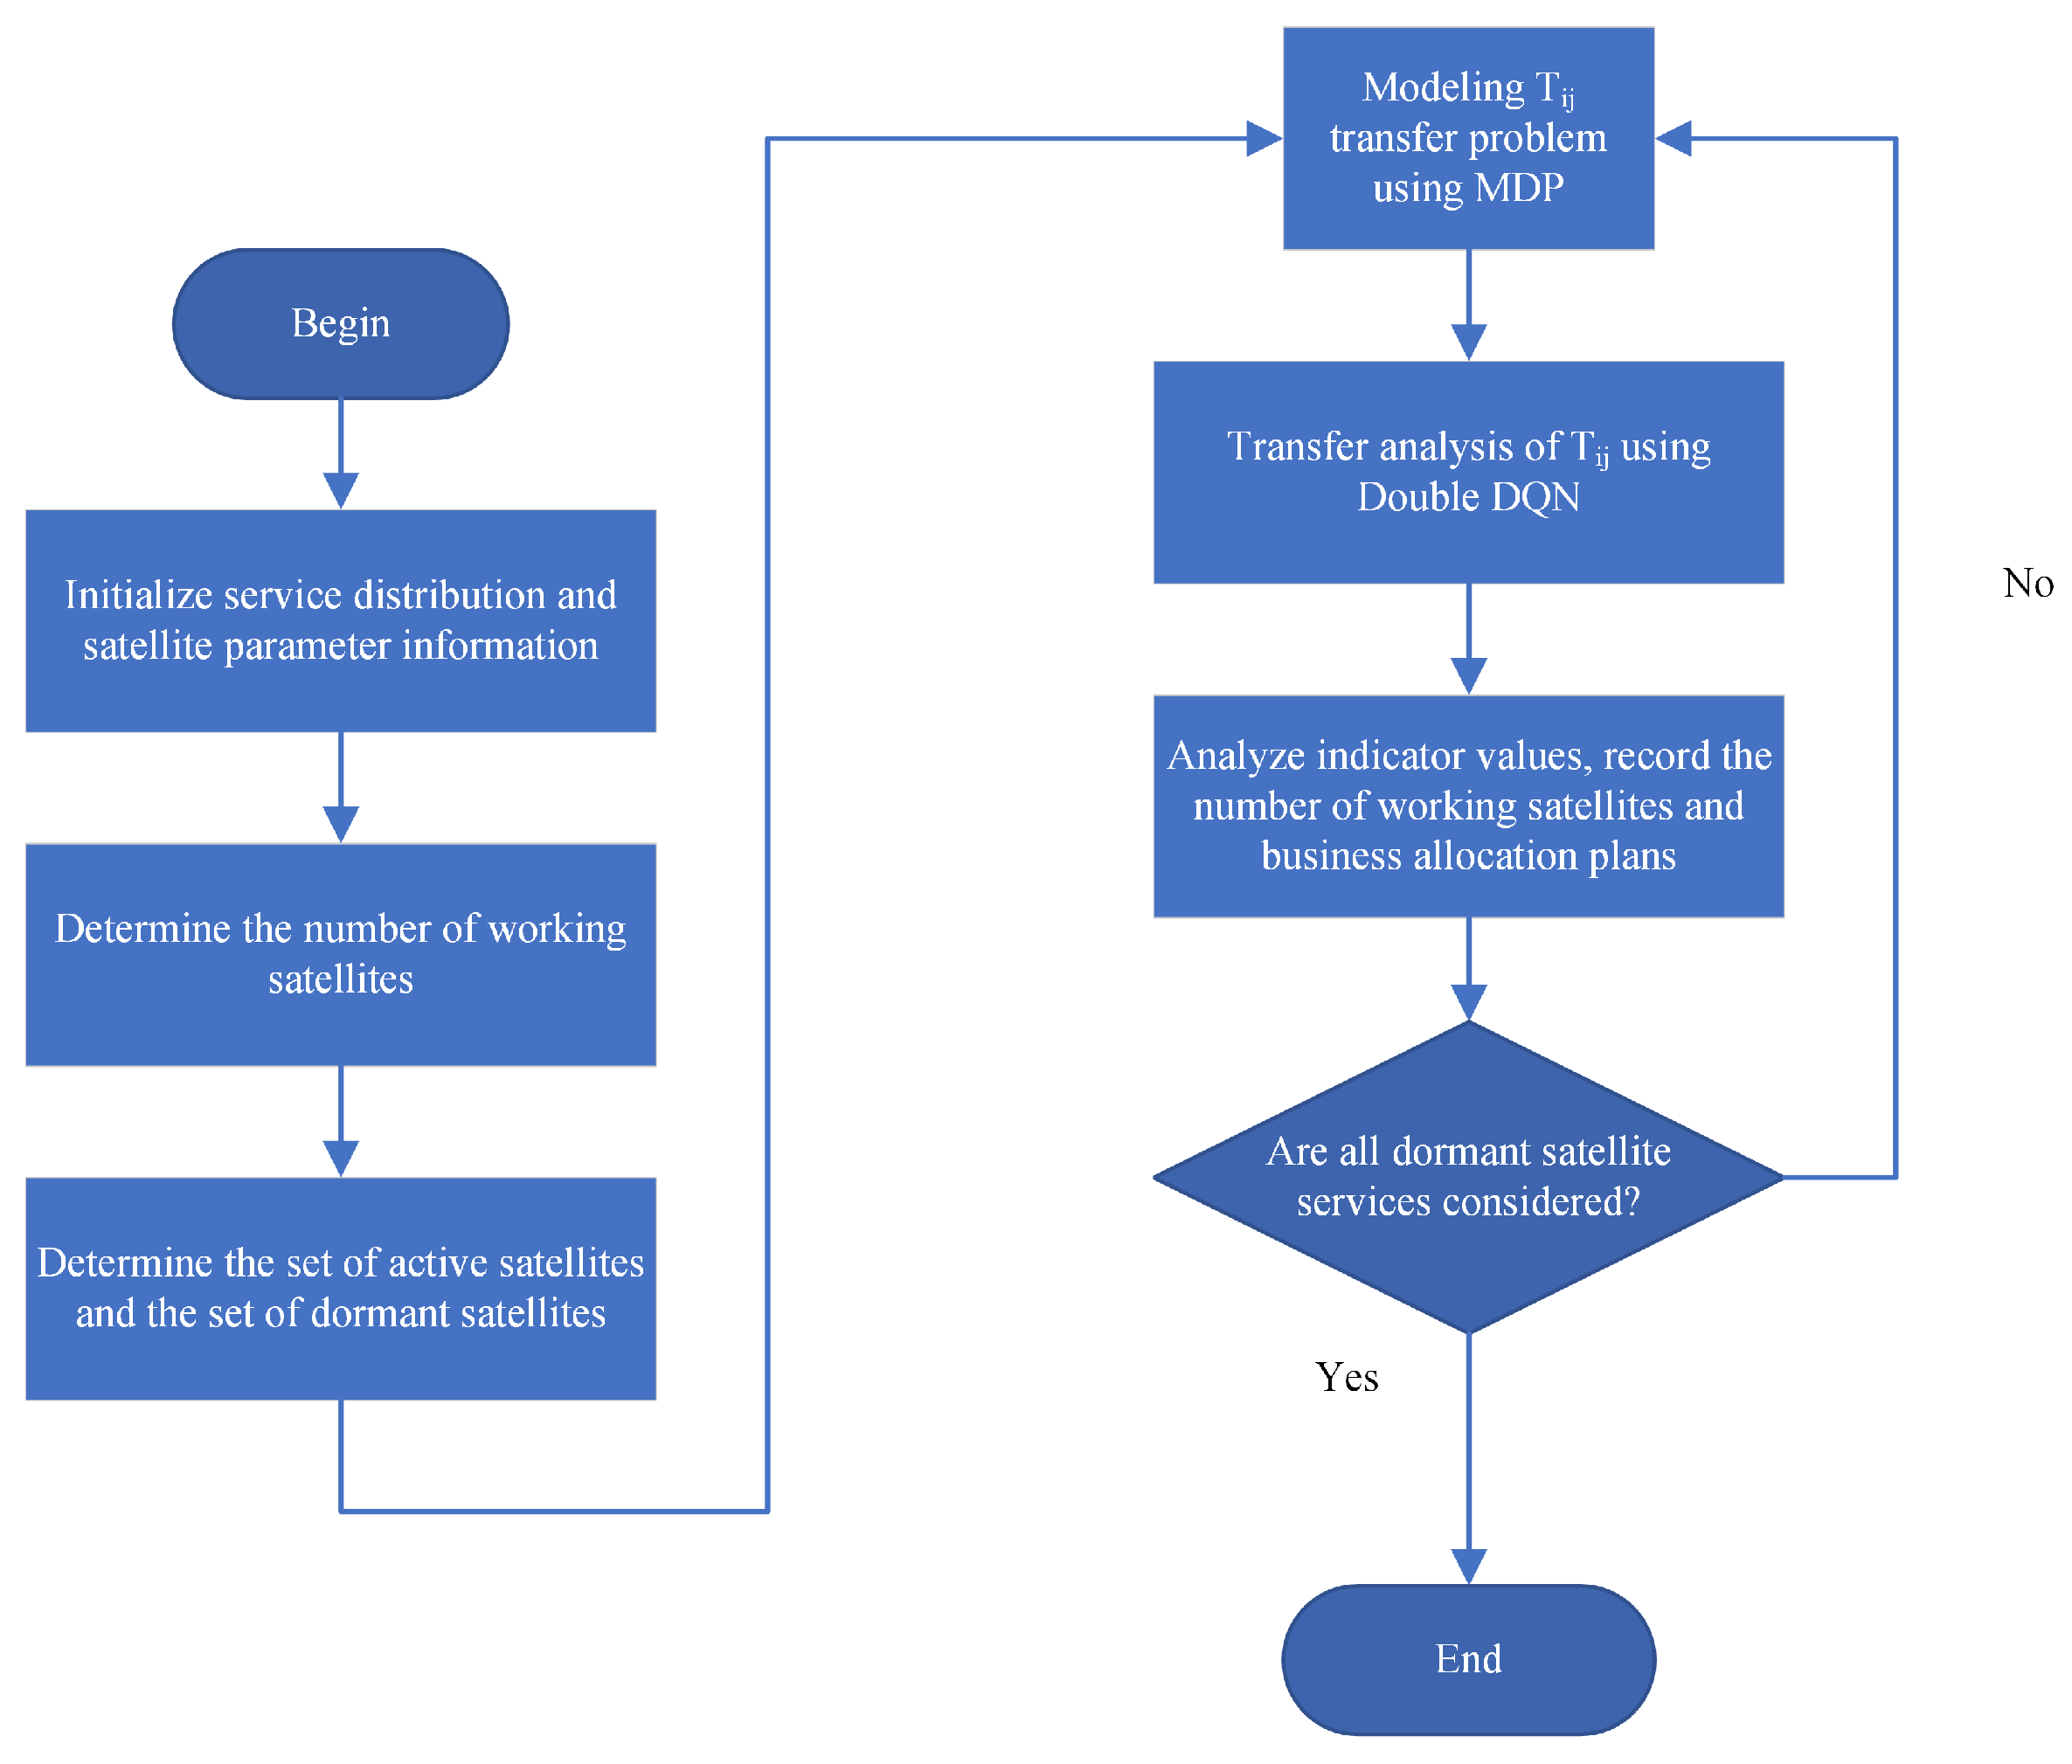
Figure 4.
Performance of the recommended aggregation strategy.
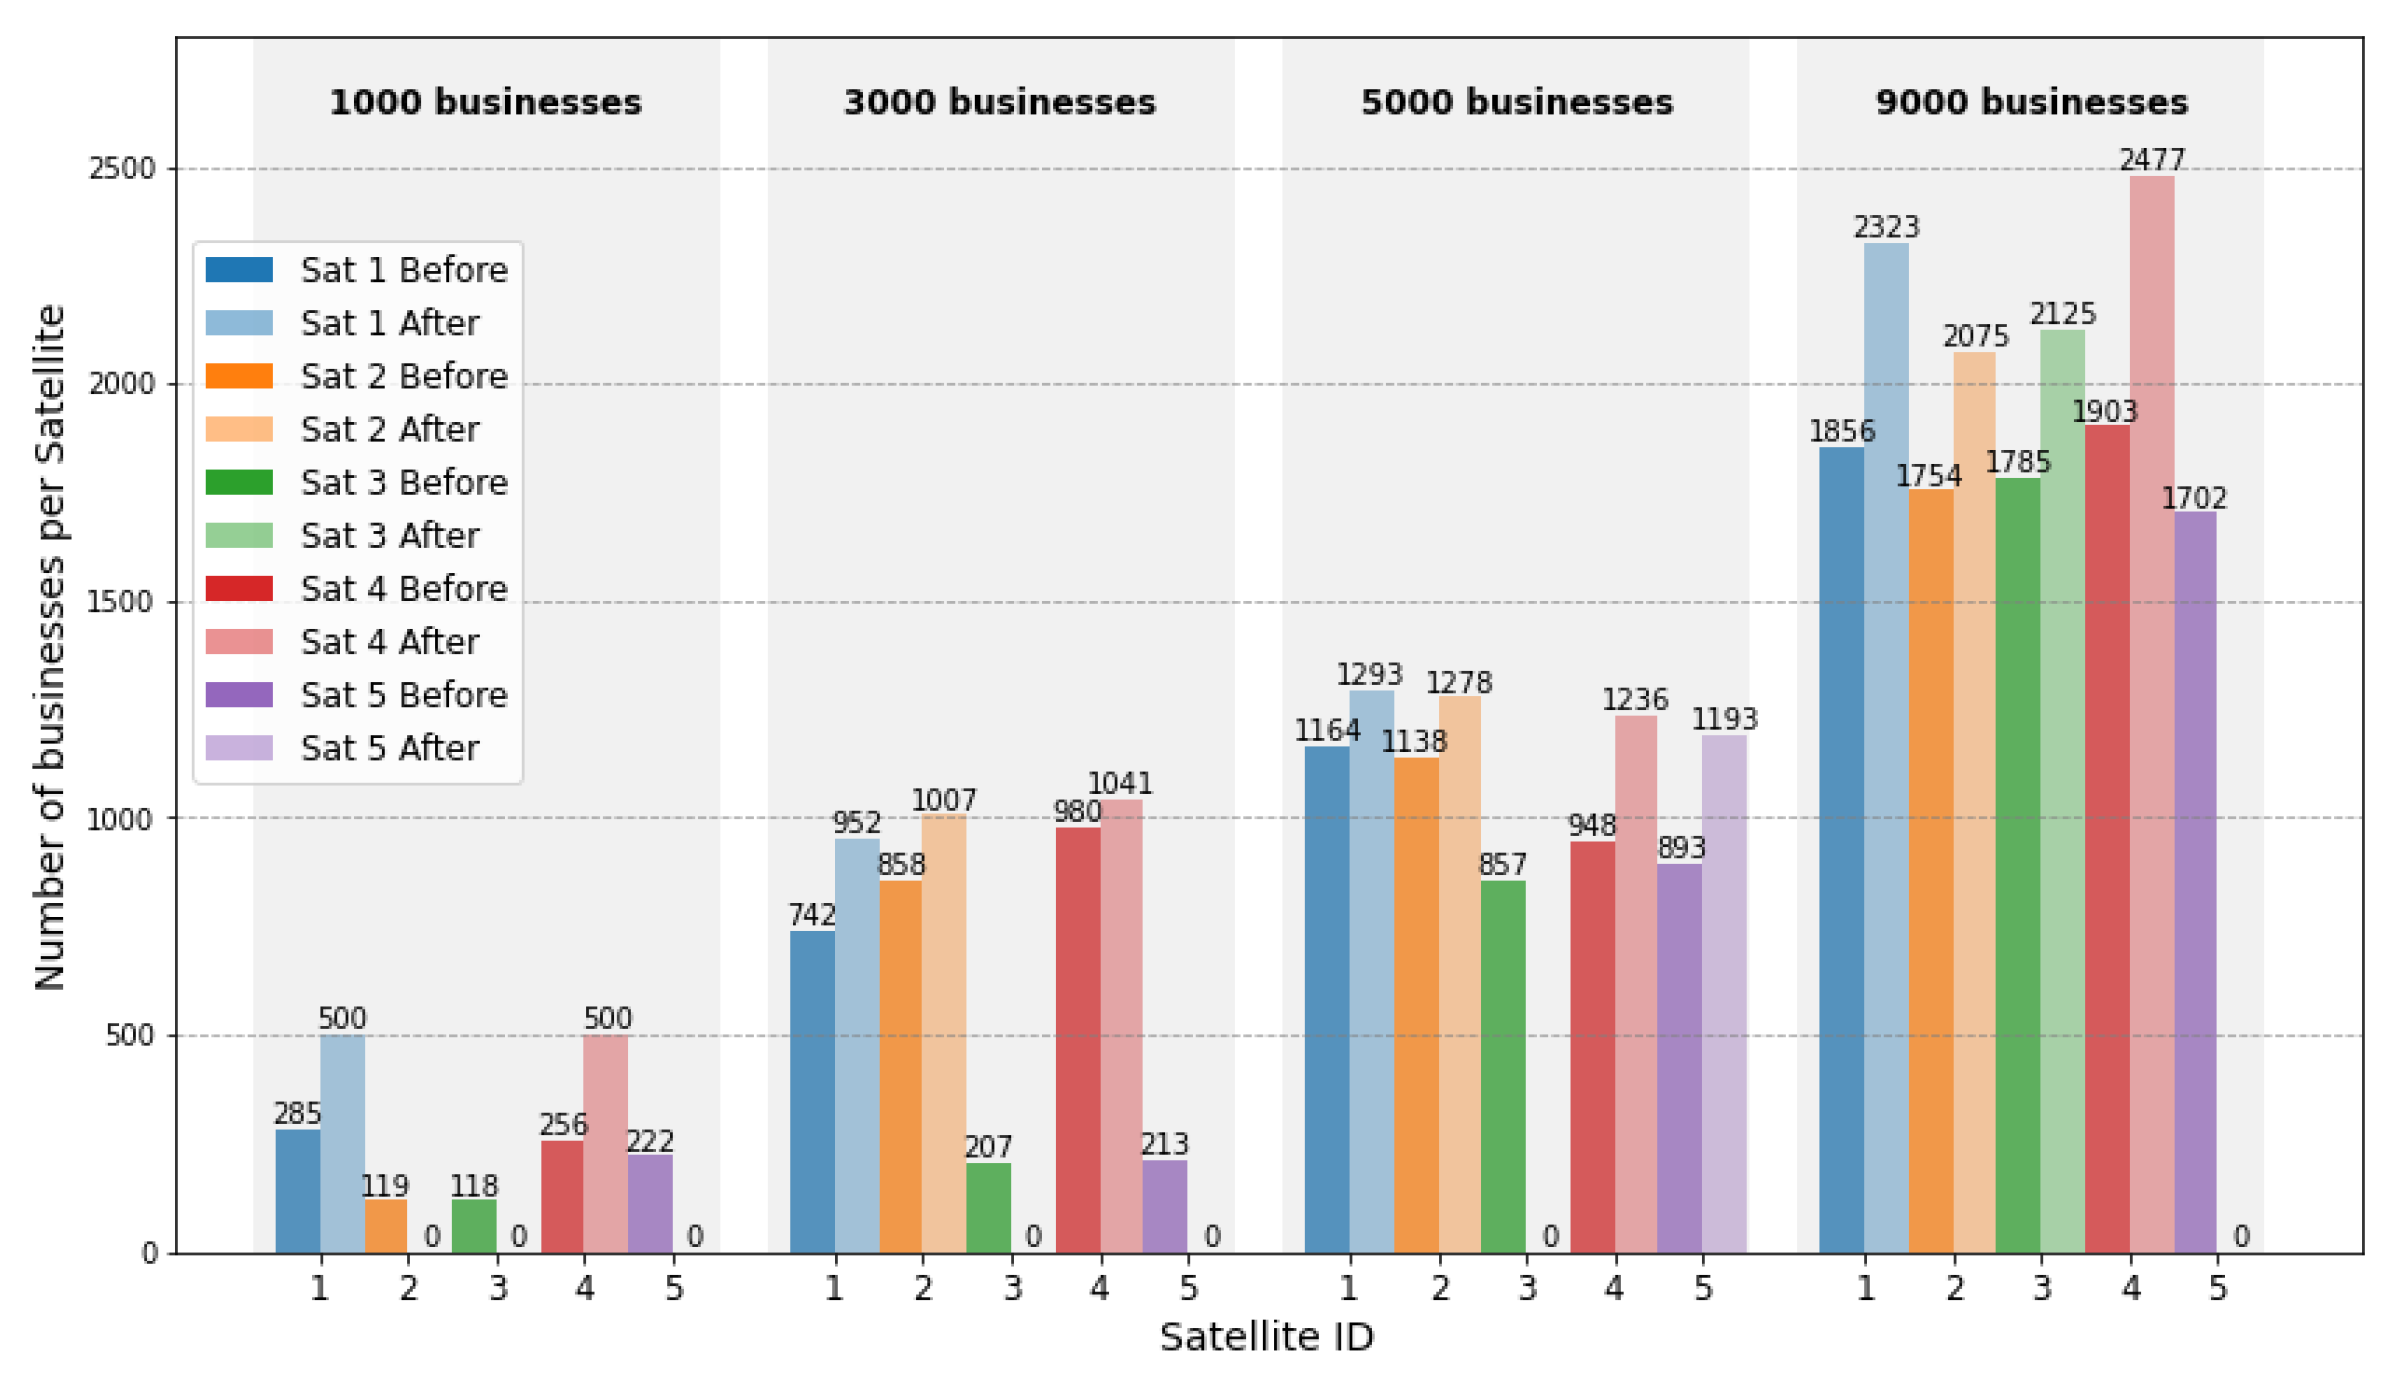
Figure 5.
Energy-Delay Ratio (EDR) versus number of businesses for different optimization strategies.
Figure 5.
Energy-Delay Ratio (EDR) versus number of businesses for different optimization strategies.
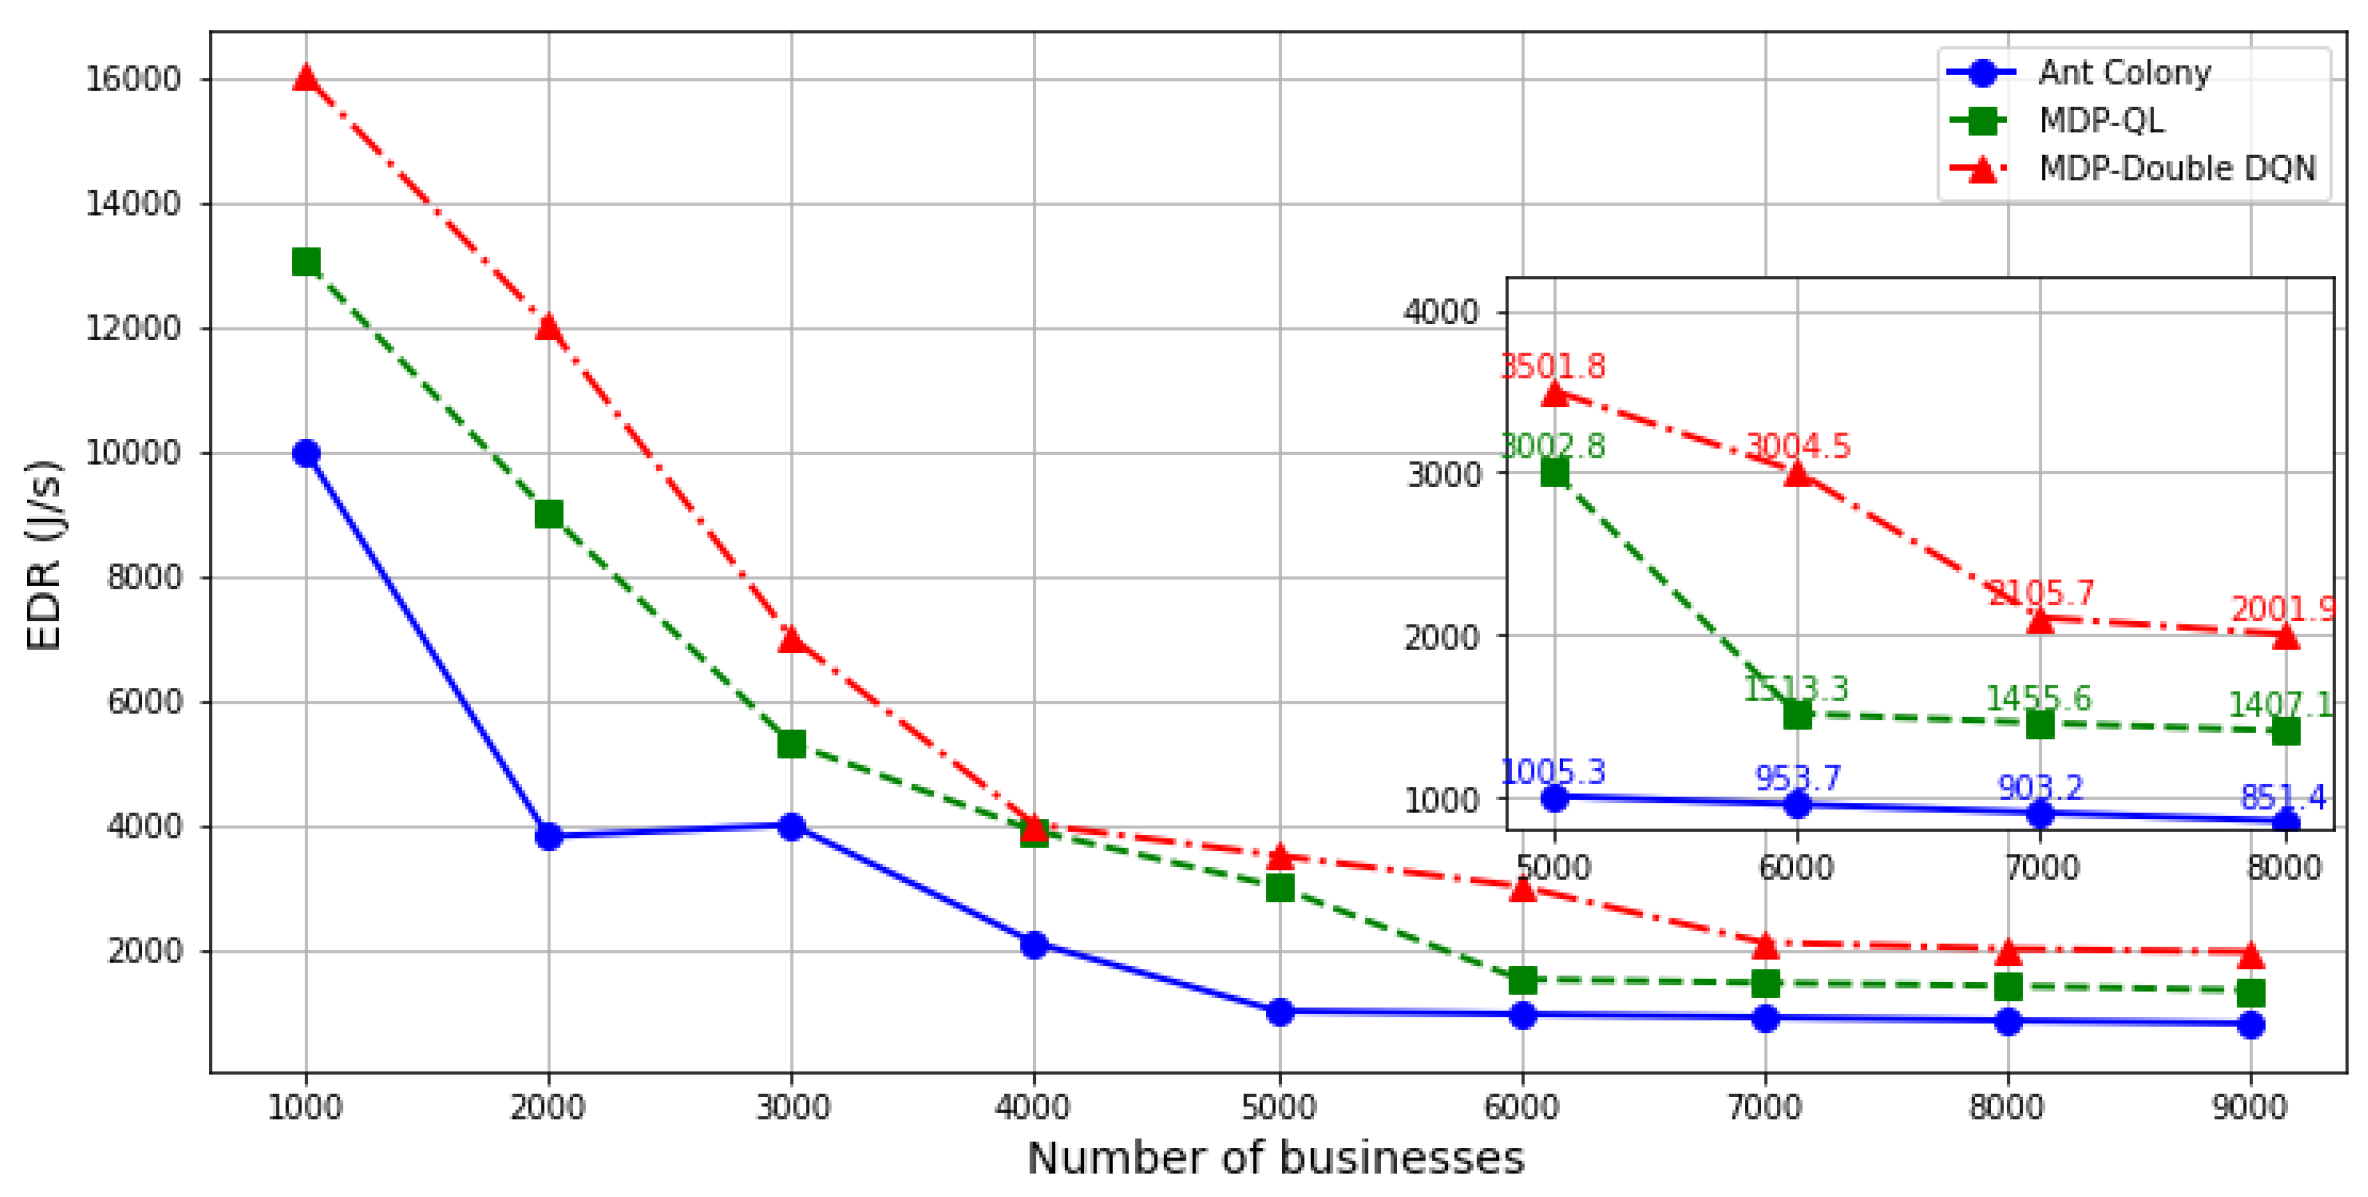

Table 1.
LSNs Parameters
| Parameter | Value | Parameter | Value |
|---|---|---|---|
| Control satellite altitude | 2000 km | 1–3 W | |
| Business satellite altitude | 500–1500 km | 20–40 MHz | |
| Number of Control satellite | 1 | 20–40 MHz | |
| Number of business satellites | 5 | bit/s | |
| Number of businesses | 1000–9000 | f | cycle/s |
| 10–50 W | -140.4 dBm | ||
| 5–25 W | -110 dBm | ||
| 60–415 W | 300 cycle/bit | ||
| 5–8 W | 1 s | ||
| 3–6 W | 0.6 s | ||
| 45–55 W | bit– bit |
Table 2.
Double DQN Strategy Parameters
| Parameter | Value |
|---|---|
| Learning Rate (lr) | 0.001 |
| Epsilon Decay | 0.995 |
| Discount Factor () | 0.99 |
| Episodes | 500 |
Table 3.
Delay Increment and Energy Reduction Ratio for Different Business Volumes
| Number of Businesses | Delay Increment (s) | Energy Reduction Ratio |
|---|---|---|
| 1000 | 0.0161 | 47.87% |
| 3000 | 0.0227 | 22.01% |
| 5000 | 0.0203 | 11.34% |
| 7000 | 0.0304 | 7.83% |
| 9000 | 0.0299 | 4.36% |
Disclaimer/Publisher’s Note: The statements, opinions and data contained in all publications are solely those of the individual author(s) and contributor(s) and not of MDPI and/or the editor(s). MDPI and/or the editor(s) disclaim responsibility for any injury to people or property resulting from any ideas, methods, instructions or products referred to in the content. |
© 2024 by the authors. Licensee MDPI, Basel, Switzerland. This article is an open access article distributed under the terms and conditions of the Creative Commons Attribution (CC BY) license (http://creativecommons.org/licenses/by/4.0/).
Copyright: This open access article is published under a Creative Commons CC BY 4.0 license, which permit the free download, distribution, and reuse, provided that the author and preprint are cited in any reuse.


