Submitted:
31 October 2024
Posted:
01 November 2024
You are already at the latest version
Abstract
This study aimed at systematically exploring seasonalities of a 16 years series of bacterial identifications in hospitalized patients, considering the infectious site and the community-acquired or hospital-associated origin. Deduplicated bacterial identifications from February 2004 to February 2020 were extracted from the data warehouse of the Institut Hospitalo-Universitaire Mediterranée Infection surveillance system, along with their epidemiological characteristics. Each species’ series was processed using a scientific workflow based on TBATS time series model. Possible co-seasonalities were researched using seasonal peak clustering and series cross-correlations. From 575 bacterial species, only 86 had a sufficient number of cases for the study purpose and only the 15 most frequent species were described in detail. About 60% of species exhibited a seasonality for at least one series, and winter is the season with the most of seasonal peaks. Co-occurrence studies confirm the presence of seasonal complexes associating several species in a same infection location. Possible weather drivers were found for about a third of seasonal series. Seasonality is a frequent characteristic of bacterial infections. Our results showed significant associations of periodicity between pathogens, origin of infection and type of sampling, as well as significant associations of some species with one or more weather drivers.
Keywords:
Seasonality
; Surveillance system
; Meteorological drivers
; Community-acquired infections
; Hospital-associated infections
1. Introduction
Seasonality is a constantly encountered notion in medicine, along history and space, stated in European medicine since the Hippocratic time or in traditional Taoist medicine since the Huang ti nei ching (Yellow Lord’s Inner Canon), both more than 2,200 years ago. Since then, many infectious diseases are known to be periodical or seasonal, essentially viral infections but also common bacterial infections [1] (e.g., ‘influenza’ disease takes its name origin from the fact that it is influenced by the cold). However, the introduction of statistical methods adapted to periodicity analyses is more recent, with the systematic use in 1918 of periodograms for investigating measles outbreaks reported in the Bills of Mortality [2]. As Fisman, we consider seasonal a processes having “an incidence associated with a particular calendar period, and which have periodicity, although this is not limited to annual periodicity”[3]. Regarding viral infections, seasonality may be driven by vector seasonality, climatic conditions, abiotic or biotic environment, co-infections, viral antigenic drifts, seasonal human immune variation, human behaviours and seasonality in domestic or wildlife animal hosts [4,5]. Seasonality studies of infectious diseases have long been based on meteorological and climatic factors that were the most evident associated determinants. For example, Greer et al. reported that norovirus winter outbreaks in Toronto are associated with the seasonal fluctuation of the Lake Ontario temperature favouring the virus survival in winter [6]. Seasonal viral outbreaks due to seasonal climatic-dependent proliferation of vectors belong to the most well-known mechanisms, as for the Rift Valley fever [7] or for arboviruses in general [8]. Seasonality can be influenced by humans’ mobility behavior [9,10] or by periodical socio-cultural or religious gathering, as during the annual pilgrimage organized in Mecca for the Hajj [11]. However, the possibility of confounding factors and then of fallacious associations cannot be eliminated as the subjacent mechanism is rarely understood [3].
It is only recently that seasonal periodicities of bacterial infections have been systematically studied [12]. Moreover, these systematic studies rarely take into consideration the sites of infection, differentiating, among others, bloodstream, urinary tract, skin and soft tissues, respiratory tract infections, and rarely differentiate infections from colonization. The reason is that large scale systematic studies are mainly done on surveillance data which do not integrate these kinds of information.
The association of various climatic factors such as temperature, precipitation, sunshine, atmospheric pressure, frost and snow with a number of bacterial infectious diseases, has been reported in numerous studies [13]. As examples, a raised incidence of salmonellosis has been associated with increased temperature and precipitation [14,15]. Campylobacter spp. Infections show a peak in spring [16]. Studies in the UK and Wales [17,18] reported that Campylobacter spp. and Cryptosporidium spp. cases were significantly associated with temperature and rainfall. Gram-negative bloodstream infections, including Escherichia coli, Acinetobacter spp., and Klebsiella spp., also exhibit seasonal variations, being frequently associated with temperature and rainfall [19,20,21]. It has also been suggested that seasonal viral infections may drive seasonal bacterial infection variations, as observed for influenza and invasive pneumococcal [22] and meningococcal diseases [23]. However, these interactions are especially difficult to decipher as they may result from a spurious correlation or an unmeasured seasonal factor [24].
To date, although systematic studies to the search of periodicities were performed for a broad number of pathogens e.g [25], none took into account both the community-acquired or hospital-associated origin and the type of sampling. In contrast, the present study aimed at exploring systematically the bacterial identifications in hospitalized patients in search of, or in confirmation of, seasonal variations of bacterial infections, taking into account the infectious site and community-acquired or hospital-associated origin, and trying to identify climatic drivers.
2. Materials and Methods
2.1. Material
2.1.1. Bacterial Identifications and Related Data
The Institut Hospitalo-Universitaire Méditerranée Infection (IHUMI) is the infectious disease-dedicated hospital of Marseille Public hospitals (Assistance Publique – Hôpitaux de Marseille, APHM). It performs all microbiological analyses for all APHM hospitals, representing about 190,000 bacterial cultures per year. Since February 1st, 2014, our microbiological surveillance system (Méditerranée Infection Datawarehouse and Surveillance - MIDaS) allows the weekly monitoring of the routine clinical microbiology activity and further in-silico statistical investigations [26]. We included in this study all routine bacterial identifications at species level present in the MIDaS Datawarehouse, from February 1st, 2014 until January 31st, 2020 (6 years, ending just before the COVID-19 oubreak in France), deduplicated on the basis of the hospital stay and the sample type. Taking in account studies about the effect of data aggregation granularity on time series seasonal analysis [27] and the influence of this granularity on case numbering, we aggregated the data to a weekly level.
All routine bacterial identifications were obtained using a Microflex MALDI-TOF mass spectrometer and the Biotyper software (Bruker Daltonics, Bremen, Germany). As recommended by the manufacturer, bacterial identifications at species level were validated when the Biotyper matching log score was ≥ 2. Fastidious bacteria were excluded from this study due to the choice of culture-based routine identifications.
We associated to each identification the epidemiological characteristics available in the data warehouse and required for our study, including the sampling date and origin, a community-acquired (comm)/ hospital-associated (hosp) flag (community-acquired if the identification was done within the first 48 hours following the hospital admission), and the patient’s age.
2.1.2. Weather Data
Weather data for the study period were downloaded from the Météo France SYNOP (surface synoptic observations) opendata service (https://donneespubliques.meteofrance.fr/?fond=produit&id_produit=90&id_rubrique=32). These data gather 57 weather description variables (Supplementary Table S1) collected from 62 stations in France with a timestep of 3 hours. For this study, we selected the following variables: temperature, rain, humidity, wind, and pressure differentials.
In order to detect possible associations between seasonal variations and weather conditions, we selected from the database the dataset collected by the Marignane station (latitude: 43.44° North, longitude: 5.22° East), which is 20 km away from Marseille. We aggregated the data using the same weekly time step than the epidemiological time series, calculating for each week the minimal and maximal values, the mean and the sum.
2.1.3. Legal Statement
The surveillance system is in accordance with the Regulation (EU) 2016/679 of the European Parliament and of the Council of 27 April 2016 on the protection of natural persons with regard to the processing of personal data and on the free movement of such data, and the repealing Directive 95/46/EC (General Data Protection Regulation). It is registered by the Data Protection Officer under id 2019-73.
2.2. Methods
For each bacterial species, we made the distinction between hospital-infected infections, with further analyses on urines and blood samples, and community-acquired infections, with further analyses on urines, blood, respiratory and skin samples. For both infections, specific analyses were made on ages (0-20, 21-40, 41-60, 61-80, over 80 years-old). A total of 19 times series were then selected for each species (Supplementary Figure S1). Only time series with at least 100 deduplicated observations were considered for statistical analysis, and only the 15 most frequent species will be described in this paper.
For a systematic big-data analysis of our database, we created an analysis workflow of each time series seasonality, as follows:
- A Kwiatkowski–Phillips–Schmidt–Shin (KPSS) test for testing a trend-stationarity, with stationarity rejection if p>0.05 [28].
- A ‘Seasonal and Trend decomposition using Loess’ (STL), which is a versatile and robust method for decomposing time series. The loess method used for this decomposition is a method for estimating nonlinear relationships [29]. The advantage of this method is that the seasonal component is allowed to change over time, and it is robust to outliers. For the purpose of this study, we have forced the seasonal component to be identical across years.
- A ‘Trigonometric seasonality, Box-Cox transformation, ARMA errors, Trend and Seasonal components’ (TBATS) analysis for allowing a search for multiple seasonality [30].
- An extraction of the detrended time series using the STL results.
This workflow was applied to each of the 19 species time series with at least 100 observations.
A co-seasonality analysis was performed using an ascending hierarchical classification based on the Euclidean distance between seasonality peaks, with the UPGMA aggregation method. For further in-depth co-seasonality analyses of selected time series, we performed cross-correlation analyses in order to confirm the statistical significance and the time lag [31].
Analyses of species periodicities in relation with possible meteorological drivers were done using Poisson mixed-effect time-series regressions on detrended series. Meteorological characteristics with a participation in the regression model significative with p≤0.05 were considered as possible drivers.
3. Results
The surveillance dataset used for this study included 314,884 bacterial identifications, deduplicated in 228,365 new sample related identifications, which were counted on a weekly basis.
A total of 575 different bacterial species were retrieved in this dataset. Of these, only 86 species (15%) met our inclusion criteria (at least 100 new cases over the study period), and only the first 15 most frequent species are described in this paper. The full results are reported in the supplementary materials.
3.1. Seasonality Study
The three most frequent species were Escherichia coli, Staphylococcus aureus, and Staphylococcus epidermidis with median weekly incidences of 145, 74, and 39 cases respectively. The full set of statistics for the weekly incidence series is summarized in Table 1.
The systematic periodicity analysis taking in account the sample origin showed that 60% of species (9/15) exhibited at least one seasonality. The full result set for the 15 most frequent species is summarized by the heat map of Figure 2, which reports in green the series with a statistically significant seasonality, and the full set for all 86 bacterial species is reported in the Supplementary Figure S2. Samples coming from hospital-associated infection and from community-acquired infections presented the sample frequency of seasonality (10/15, 66.7%). Seasonality of hospital-acquired infections were specific of 3 species: K. oxytoca, S. haemolyticus and G. vaginalis, while seasonality of community-acquired infections was specific of 4 species: S. epidermidis, S. agalactiae, S. hominis and P. acnes. Pseudomonas aeruginosa and Staphylococcus aureus exhibited a seasonality for most of the samples, with the exception of urine samples coming from hospital-associated infections of patients younger than 20-years old, and urine samples of the 61–80-year-old population with community-acquired infections.
Some bacterial species, apparently without seasonality at the whole series, the global hospital-associated or the global community-acquired levels, may exhibit a seasonality at a narrower level. It is the case for K. oxytoca, which presents a seasonality for its blood and respiratory tract levels for its community-acquired infections, or for P. mirabilis, which presents a seasonality only at the respiratory tract level for its community-acquired infections.
A further analysis of seasonal peaks was specifically performed for samples from community-acquired infections (Figure 3). More seasonal peaks were observed during the winter season, particularly during week 2, with 15 peaks (Figure 4) for 86 species, and during weeks 4 and 6, both with 9 peaks. Among the 15 peaks of this seasonal maximum, (1/15, 6.7%) were coming from blood (K. oxytoca), and (2/15, 13.3%) from respiratory specimens (E. coli, S. aureus). Most of seasonal peaks belonging to respiratory samples are observed during Winter (10/20, 50%) and Spring (7/20, 35%). Blood samples exhibit a bi-modal seasonality with maxima during Winter (6/15, 40%) and Summer (5/15, 33%). Skin samples show only a seasonal minimum during Summer (2/16, 13%), with S. aureus belonging of this group. The apparent seasonality of urinary tract infections is Spring, with peaks (8/17, 47%).
3.2. Co-Seasonality and Cross-Correlation Analysis
The result of the hierarchical clustering of the seasonal peak distances for community-acquired infections is presented in Figure 5. Kind of sampling with seasonality are grouped according to the proximity of their seasonal peak. The dendrogram shows that samplings of S. aureus and E. coli follow the same seasonal dynamics, and that seasonality of community-acquired infections of S. aureus is the same than its respiratory samples, but opposite to its skin samples. Infections of the respiratory tract of S. aureus and E. coli and synchronous, with a lag between them and H. influenzae. Several seasonal complexes may be found: a complex associating S. hominis and epidermidis with most of their locations, concerning S. aureus, E. coli and P. aeruginosa a first complex associating their respiratory locations and a second associating their blood infections.
The analysis showed that, for S. aureus, sample coming for all community-acquired infections and respiratory samples of these infections were synchronous with a strong cross-correlation (r = 0.56), both with their peaks during week 2 (Figure 6). This shows that the apparent overall seasonality of S. aureus community-acquired infections is mostly driven by respiratory infections. In contrast, cutaneous and respiratory S. aureus community-acquired infections exhibited a shifted cross-correlation (r=0.24) (Figure 7) with peaks respectively during weeks 38 and 2. These results show that the apparent winter seasonality of S. aureus community-acquired infections masks the cutaneous infection seasonality of this species.
3.3. Species Periodicities and Meteorological Drivers
Temperature (°C), rain (mm), humidity (%), wind (m/s) and pressure change (Pa) were tested for significant positive or negative associations with seasonal infection incidences. Significant associations of incidences with possible meteorological drivers for respiratory, urines, blood and cutaneous samples coming from community-acquired and hospital-associated infections, are presented in Table 2 for the 15 most frequent bacterial species. Concerning S. aureus, hospital-associated infections exhibited a significant association with temperature, humidity, and pressure change, whereas community-acquired infections were only associated with precipitations. Community-acquired H. influenzae infections were globally associated with humidity and pressure changes (precipitations and pressure change for blood samples, and wind for urine samples).
E. cloacae exhibited significant associations with pressure changes and wind for hospital-associated infections, and with humidity for community-acquired infections.
K. pneumoniae infections were associated to humidity for urine samples in community-acquired infections.
Among a total of 156 combinations of bacterial species, origin, and sample types with a seasonality (Supplementary Table S2), (59/156, 37.8%) were significantly associated with precipitations, (43/156, 27.6%) with pressure change, (38/156, 24.4%) with humidity, (36/156, 23.1%) with wind, and (23/156, 14.4%) with temperature. In contrast, (19/156, 12.2%) combinations had no significant association with any meteorological parameter.
4. Discussion
This seasonality study was based on the university hospital microbiological laboratory activities from an area of the East Mediterranean coast of France, characterized by abundant sunshine, warm and dry summers, windy episodes, associated with rainfalls from October to April. This big-data systematic cross analysis taking in account the infection origin, types of samples and age category, and not only bacterial species identifications [13,17,33,34], was processed using a statistical workflow in search for seasonal periodicities of the incidence time series. These analyses were supplemented by the search for co-seasonalities and association with meteorological drivers. From a methodological point of view, the originality of this study resides in the distinction made on the sample origin in the systematic analysis, which allows the decomposition of the bacterial species overall time series into infection-related time series that may have different seasonalities. A workflow was built for controlling series stationarity and for handling varying periodicities. A hierarchical clustering of the time series seasonal peaks allowed a global exploration of co-seasonalities, with possible deeper analyses using cross-correlations. The weekly granularity of the time series brought us more precision in the location of the seasonal peak, and allowed also a more precise search for meteorological drivers. However, this last study must be taken with caution as the linear model used does not take into specific consideration the possible lag between the periodicities of the meteorological drivers and the infections. In the same way, it must be considered that an apparent driver may be in fact the result of a confusion with other determinants, as seasonalities of patients’ metabolic conditions (e.g., the seasonality in the skin production of vitamin D), or even more complex factors in the case of the seasonality of hospital-acquired infections. We believe that this study is the first that has systematically examined the association between climatic drivers and bacterial species while taking in account sample kinds.
From 228,365 unique bacterial identifications during a 6-years data collection, 86 bacterial species had at least one time series with at least 100 observations, and able to be analysed by the workflow. Among them, this paper focused specifically on the 15 most frequent bacterial species. A same identification method (MALDI-TOF) with a same protocol has been used along the collection, enforcing the homogeneity of the identification capability.
A first result of this work is that seasonality is more frequent than non-seasonality. An incidence seasonality was retrieved for 55.9% of the time series belonging to the 15 most frequent species. Hospital-associated infection without sample distinction showed a seasonality for 2/3 of these species, and the same frequency of seasonalities in community-acquired infections without sample distinction. It is important to underline here that the seasonality of a specific infection may be hidden in the non-seasonality of the global species incidence, as for K. oxytoca, and that an overall apparent seasonality of a species may be the result of the seasonalities of its various forms of infections with different phases. For example, S. aureus exhibited a community-acquired respiratory infection peak during winter, a community-acquired skin infection peak during summer, and an overall seasonal peak of community-acquired infections during winter, corresponding to the peak of its most abundant sub-population. Epidemiologically speaking, the microbiological point of view at species level may be different than the clinical infection point of view. In our study, winter is the season with the most seasonal peaks, and especially the second week.
The association analysis of species with weather variables identified several possible drivers. H. influenzae incidence was associated with humidity and pressure change, and S. capitis incidence with temperature and precipitations. Our study showed that hospital-associated S. aureus blood infections were significantly associated with temperature as shown by Eber et al [20], who estimated that an increase in temperature of 5.6°C was associated with a 2.2% increase (95% CI 1.3-3.2) in S. aureus frequency. In addition, other studies have shown the presence of a S. aureus seasonal peak during summer [35], or during autumn [36] or both [37], depending the kind of clinical picture. In fact, with only a statistical co-occurrence analysis, it is difficult to determine if a species seasonality is driven by a weather condition or if the weather condition is only a characteristic of the season corresponding to the species seasonal peak.
Similar studies of Campylobacter and Salmonella seasonality in the UK [16,25] demonstrated that the prevalence of Campylobacter spp. was associated with temperature, while our study showed an association of Campylobacter with precipitation and humidity (supplementary material), and other studies found limited association with temperature [14]. Hospital-associated H. influenzae infections were associated with pressure change for all age groups, and humidity for the 0-20 year-old age group (Table 2). It was reported by Shaman and Kohn [38] that atmospheric pressure changes could have strong associations with several infectious agents such as the influenza virus, which creates optimal conditions for the manifestation of H. influenzae. In our study week 2 gathered the most important number of seasonal peaks, which is may be due to the low temperature and high humidity during this winter period. Most Gram-negative bacteria such as E. cloacae, E. coli, K. pneumoniae and P. aeruginosa did not exhibit any significant association with temperature except A. baumannii, in contrast with other studies [1,21,39] reporting a higher incidence of positive blood cultures for these species during summer months.
This systematic big-data study on bacterial identifications of hospitalized patient shows that seasonality is a frequent, but not systematic, characteristic, and that seasonalities of bacterial species is different from the seasonalities of the different infections of the species. Our study of meteorological drivers of seasonality must be expanded with further works taking in account the possible variable lags between disease and meteorological time series.
Supplementary Materials
The following supporting information can be downloaded at the website of this paper posted on Preprints.org.
Author Contributions
Conceptualization, H.C. and P.C.; methodology, H.C. and L.K.; collected data H.C., L.K., A.G-G.; writing—original draft preparation, L.K.; writing—review and editing, H.C., L.K., A.G-G., P-E.F., P.C.; analyzed and interpreted data, L.K., A.G-G, P.C., P-E.F and H.C. All authors have read and agreed to the published version of the manuscript.
Funding
This work was supported by the French Government under the “Investments for the Future” program managed by the National Agency for Research (ANR), Méditerranée-Infection 10-IAHU-03, and was also supported by the Région Provence Alpes Côte d’Azur and European funding FEDER PRIMMI (Fonds Européen de Développement Régional—Plateformes de Recherche etd’Innovation Mutualisées Méditerranée Infection), FEDER PA 0000320 PRIMMI.
Institutional Review Board Statement
The information system involved in this study and the associated data analysis was declared and approved by the Commission Nationale Informatique etLiberté (declaration number 2139516 v 0).
Informed Consent Statement
The information system involved in this study and the associateddata analysis was declared and approved by the Commission Nationale Informatique et Liberté(declaration number 2139516 v 0).
Data Availability Statement
The data from our surveillance system are not available on the publicdomain, but anyone interested in using the data for scientific purpose is free to request permissionfrom the corresponding author: Hervé Chaudet (herve.chaudet@gmail.com).
Conflicts of Interest
The authors declare no conflicts of interest.
References
- Paul, M. Seasonality in Infectious Diseases: Does It Exist for All Pathogens? Clin. Microbiol. Infect. 2012, 18, 925–926. [Google Scholar] [CrossRef] [PubMed]
- Brownlee, J.; Fletcher, W.M. VI. An Investigation into the Periodicity of Measles Epidemics in London from 1703 to the Present Day by the Method of the Periodogram. Philos. Trans. R. Soc. Lond. Ser. B Contain. Pap. Biol. Character 1918, 208, 225–250. [Google Scholar] [CrossRef]
- Fisman, D. Seasonality of Viral Infections: Mechanisms and Unknowns. Clin. Microbiol. Infect. 2012, 18, 946–954. [Google Scholar] [CrossRef] [PubMed]
- Dowell, S.F. Seasonal Variation in Host Susceptibility and Cycles of Certain Infectious Diseases - Volume 7, Number 3—June 2001 - Emerging Infectious Diseases Journal - CDC. [CrossRef]
- Martinez, M.E. The Calendar of Epidemics: Seasonal Cycles of Infectious Diseases. PLOS Pathog. 2018, 14, e1007327. [Google Scholar] [CrossRef]
- Greer, A.L.; Drews, S.J.; Fisman, D.N. Why “Winter” Vomiting Disease? Seasonality, Hydrology, and Norovirus Epidemiology in Toronto, Canada. EcoHealth 2009, 6, 192–199. [Google Scholar] [CrossRef] [PubMed]
- Linthicum, K.J.; Britch, S.C.; Anyamba, A. Rift Valley Fever: An Emerging Mosquito-Borne Disease. Annu. Rev. Entomol. 2016, 61, 395–415. [Google Scholar] [CrossRef]
- Schuster, G.; Ebert, E.E.; Stevenson, M.A.; Corner, R.J.; Johansen, C.A. Application of Satellite Precipitation Data to Analyse and Model Arbovirus Activity in the Tropics. Int. J. Health Geogr. 2011, 10, 8. [Google Scholar] [CrossRef]
- Coletti, P.; Poletto, C.; Turbelin, C.; Blanchon, T.; Colizza, V. Shifting Patterns of Seasonal Influenza Epidemics. Sci. Rep. 2018, 8. [Google Scholar] [CrossRef]
- Viboud, C.; Bjørnstad, O.N.; Smith, D.L.; Simonsen, L.; Miller, M.A.; Grenfell, B.T. Synchrony, Waves, and Spatial Hierarchies in the Spread of Influenza. Science 2006, 312, 447–451. [Google Scholar] [CrossRef]
- Salmon-Rousseau, A.; Piednoir, E.; Cattoir, V.; de La Blanchardière, A. Hajj-Associated Infections. Med. Mal. Infect. 2016, 46, 346–354. [Google Scholar] [CrossRef]
- Park, M.S.; Park, K.H.; Bahk, G.J. Combined Influence of Multiple Climatic Factors on the Incidence of Bacterial Foodborne Diseases. Sci. Total Environ. 2018, 610–611, 10–16. [Google Scholar] [CrossRef]
- Lal, A.; Ikeda, T.; French, N.; Baker, M.G.; Hales, S. Climate Variability, Weather and Enteric Disease Incidence in New Zealand: Time Series Analysis. PLoS ONE 2013, 8, e83484. [Google Scholar] [CrossRef] [PubMed]
- Kovats, R.S.; Edwards, S.J.; Charron, D.; Cowden, J.; D’Souza, R.M.; Ebi, K.L.; Gauci, C.; Gerner-Smidt, P.; Hajat, S.; Hales, S.; et al. Climate Variability and Campylobacter Infection: An International Study. Int. J. Biometeorol. 2005, 49, 207–214. [Google Scholar] [CrossRef] [PubMed]
- Stashevsky, P.S.; Yakovina, I.N.; Alarcon Falconi, T.M.; Naumova, E.N. Agglomerative Clustering of Enteric Infections and Weather Parameters to Identify Seasonal Outbreaks in Cold Climates. Int. J. Environ. Res. Public. Health 2019, 16. [Google Scholar] [CrossRef]
- Nichols, G.L.; Richardson, J.F.; Sheppard, S.K.; Lane, C.; Sarran, C. Campylobacter Epidemiology: A Descriptive Study Reviewing 1 Million Cases in England and Wales between 1989 and 2011. BMJ Open 2012, 2, e001179. [Google Scholar] [CrossRef] [PubMed]
- Djennad, A.; Lo Iacono, G.; Sarran, C.; Fleming, L.E.; Kessel, A.; Haines, A.; Nichols, G.L. A Comparison of Weather Variables Linked to Infectious Disease Patterns Using Laboratory Addresses and Patient Residence Addresses. BMC Infect. Dis. 2018, 18, 198. [Google Scholar] [CrossRef]
- Naumova, E.N.; Christodouleas, J.; Hunter, P.R.; Syed, Q. Effect of Precipitation on Seasonal Variability in Cryptosporidiosis Recorded by the North West England Surveillance System in 1990-1999. J. Water Health 2005, 3, 185–196. [Google Scholar] [CrossRef]
- Al-Hasan, M.N.; Lahr, B.D.; Eckel-Passow, J.E.; Baddour, L.M. Seasonal Variation in Escherichia Coli Bloodstream Infection: A Population-Based Study. Clin. Microbiol. Infect. 2009, 15, 947–950. [Google Scholar] [CrossRef]
- Eber, M.R.; Shardell, M.; Schweizer, M.L.; Laxminarayan, R.; Perencevich, E.N. Seasonal and Temperature-Associated Increases in Gram-Negative Bacterial Bloodstream Infections among Hospitalized Patients. PLoS ONE 2011, 6, e25298. [Google Scholar] [CrossRef]
- Freeman, J.T.; Anderson, D.J.; Sexton, D.J. Seasonal Peaks in Escherichia Coli Infections: Possible Explanations and Implications. Clin. Microbiol. Infect. 2009, 15, 951–953. [Google Scholar] [CrossRef]
- Talbot, T.R.; Poehling, K.A.; Hartert, T.V.; Arbogast, P.G.; Halasa, N.B.; Edwards, K.M.; Schaffner, W.; Craig, A.S.; Griffin, M.R. Seasonality of Invasive Pneumococcal Disease: Temporal Relation to Documented Influenza and Respiratory Syncytial Viral Circulation. Am. J. Med. 2005, 118, 285–291. [Google Scholar] [CrossRef] [PubMed]
- Harrison, L.H.; Armstrong, C.W.; Jenkins, S.R.; Harmon, M.W.; Ajello, G.W.; Miller, G.B., Jr; Broome, C.V. A Cluster of Meningococcal Disease on a School Bus Following Epidemic Influenza. Arch. Intern. Med. 1991, 151, 1005–1009. [Google Scholar] [CrossRef] [PubMed]
- Fisman, D.N. Seasonality of Infectious Diseases. Annu. Rev. Public Health 2007, 28, 127–143. [Google Scholar] [CrossRef]
- Cherrie, M.P.C.; Nichols, G.; Iacono, G.L.; Sarran, C.; Hajat, S.; Fleming, L.E. Pathogen Seasonality and Links with Weather in England and Wales: A Big Data Time Series Analysis. BMC Public Health 2018, 18, 1067. [Google Scholar] [CrossRef]
- Abat, C.; Chaudet, H.; Rolain, J.-M.; Colson, P.; Raoult, D. Traditional and Syndromic Surveillance of Infectious Diseases and Pathogens. Int. J. Infect. Dis. 2016, 48, 22–28. [Google Scholar] [CrossRef] [PubMed]
- Alarcon Falconi, T.M.; Estrella, B.; Sempértegui, F.; Naumova, E.N. Effects of Data Aggregation on Time Series Analysis of Seasonal Infections. Int. J. Environ. Res. Public. Health 2020, 17, 5887. [Google Scholar] [CrossRef]
- Kwiatkowski, D.; Phillips, P.C.B.; Schmidt, P.; Shin, Y. Testing the Null Hypothesis of Stationarity against the Alternative of a Unit Root. J. Econom. 1992, 54, 159–178. [Google Scholar] [CrossRef]
- Cleveland, R.B.; Cleveland, W.S.; McRae, J.E.; Terpenning, I.J. A Seasonal-Trend Decomposition Procedure Based on Loess. Journal of Official Statistics 1990, 6, 3–33. [Google Scholar]
- De Livera, A.M.; Hyndman, R.J.; Snyder, R.D. Forecasting Time Series With Complex Seasonal Patterns Using Exponential Smoothing. J. Am. Stat. Assoc. 2011, 106, 1513–1527. [Google Scholar] [CrossRef]
- Probst, W.N.; Stelzenmüller, V.; Fock, H.O. Using Cross-Correlations to Assess the Relationship between Time-Lagged Pressure and State Indicators: An Exemplary Analysis of North Sea Fish Population Indicators. ICES J. Mar. Sci. 2012, 69, 670–681. [Google Scholar] [CrossRef]
- R Core Team A Language and Environment for Statistical Computing. R Foundation for Statistical Computing, Vienna, Austria. URL Https://Www.R-Project.Org/ 2021.
- Huang, F.; Zhou, S.; Zhang, S.; Wang, H.; Tang, L. Temporal Correlation Analysis between Malaria and Meteorological Factors in Motuo County, Tibet. Malar. J. 2011, 10, 54. [Google Scholar] [CrossRef] [PubMed]
- Warren-Gash, C.; Bhaskaran, K.; Hayward, A.; Leung, G.M.; Lo, S.-V.; Wong, C.-M.; Ellis, J.; Pebody, R.; Smeeth, L.; Cowling, B.J. Circulating Influenza Virus, Climatic Factors, and Acute Myocardial Infarction: A Time Series Study in England and Wales and Hong Kong. J. Infect. Dis. 2011, 203, 1710–1718. [Google Scholar] [CrossRef] [PubMed]
- Dailiana, Z.H.; Rigopoulos, N.; Varitimidis, S.E.; Poultsides, L.; Petinaki, E.; Malizos, K.N. Clinical and Epidemiological Features of Upper-Extremity Infections Caused by Staphylococcus Aureus Carrying the PVL Gene: A Four-Year Study in Greece. Med. Sci. Monit. Int. Med. J. Exp. Clin. Res. 2008, 14, CR511–514. [Google Scholar]
- Tveten, Y.; Jenkins, A.; Kristiansen, B.-E. A Fusidic Acid-Resistant Clone of Staphylococcus Aureus Associated with Impetigo Bullosa Is Spreading in Norway. J. Antimicrob. Chemother. 2002, 50, 873–876. [Google Scholar] [CrossRef]
- Leekha, S.; Diekema, D.J.; Perencevich, E.N. Seasonality of Staphylococcal Infections. Clin. Microbiol. Infect. 2012, 18, 927–933. [Google Scholar] [CrossRef]
- Shaman, J.; Kohn, M. Absolute Humidity Modulates Influenza Survival, Transmission, and Seasonality. Proc. Natl. Acad. Sci. U. S. A. 2009, 106, 3243–3248. [Google Scholar] [CrossRef]
- Richet, H. Seasonality in Gram-Negative and Healthcare-Associated Infections. Clin. Microbiol. Infect. 2012, 18, 934–940. [Google Scholar] [CrossRef]
Figure 1.
Data analysis workflow.
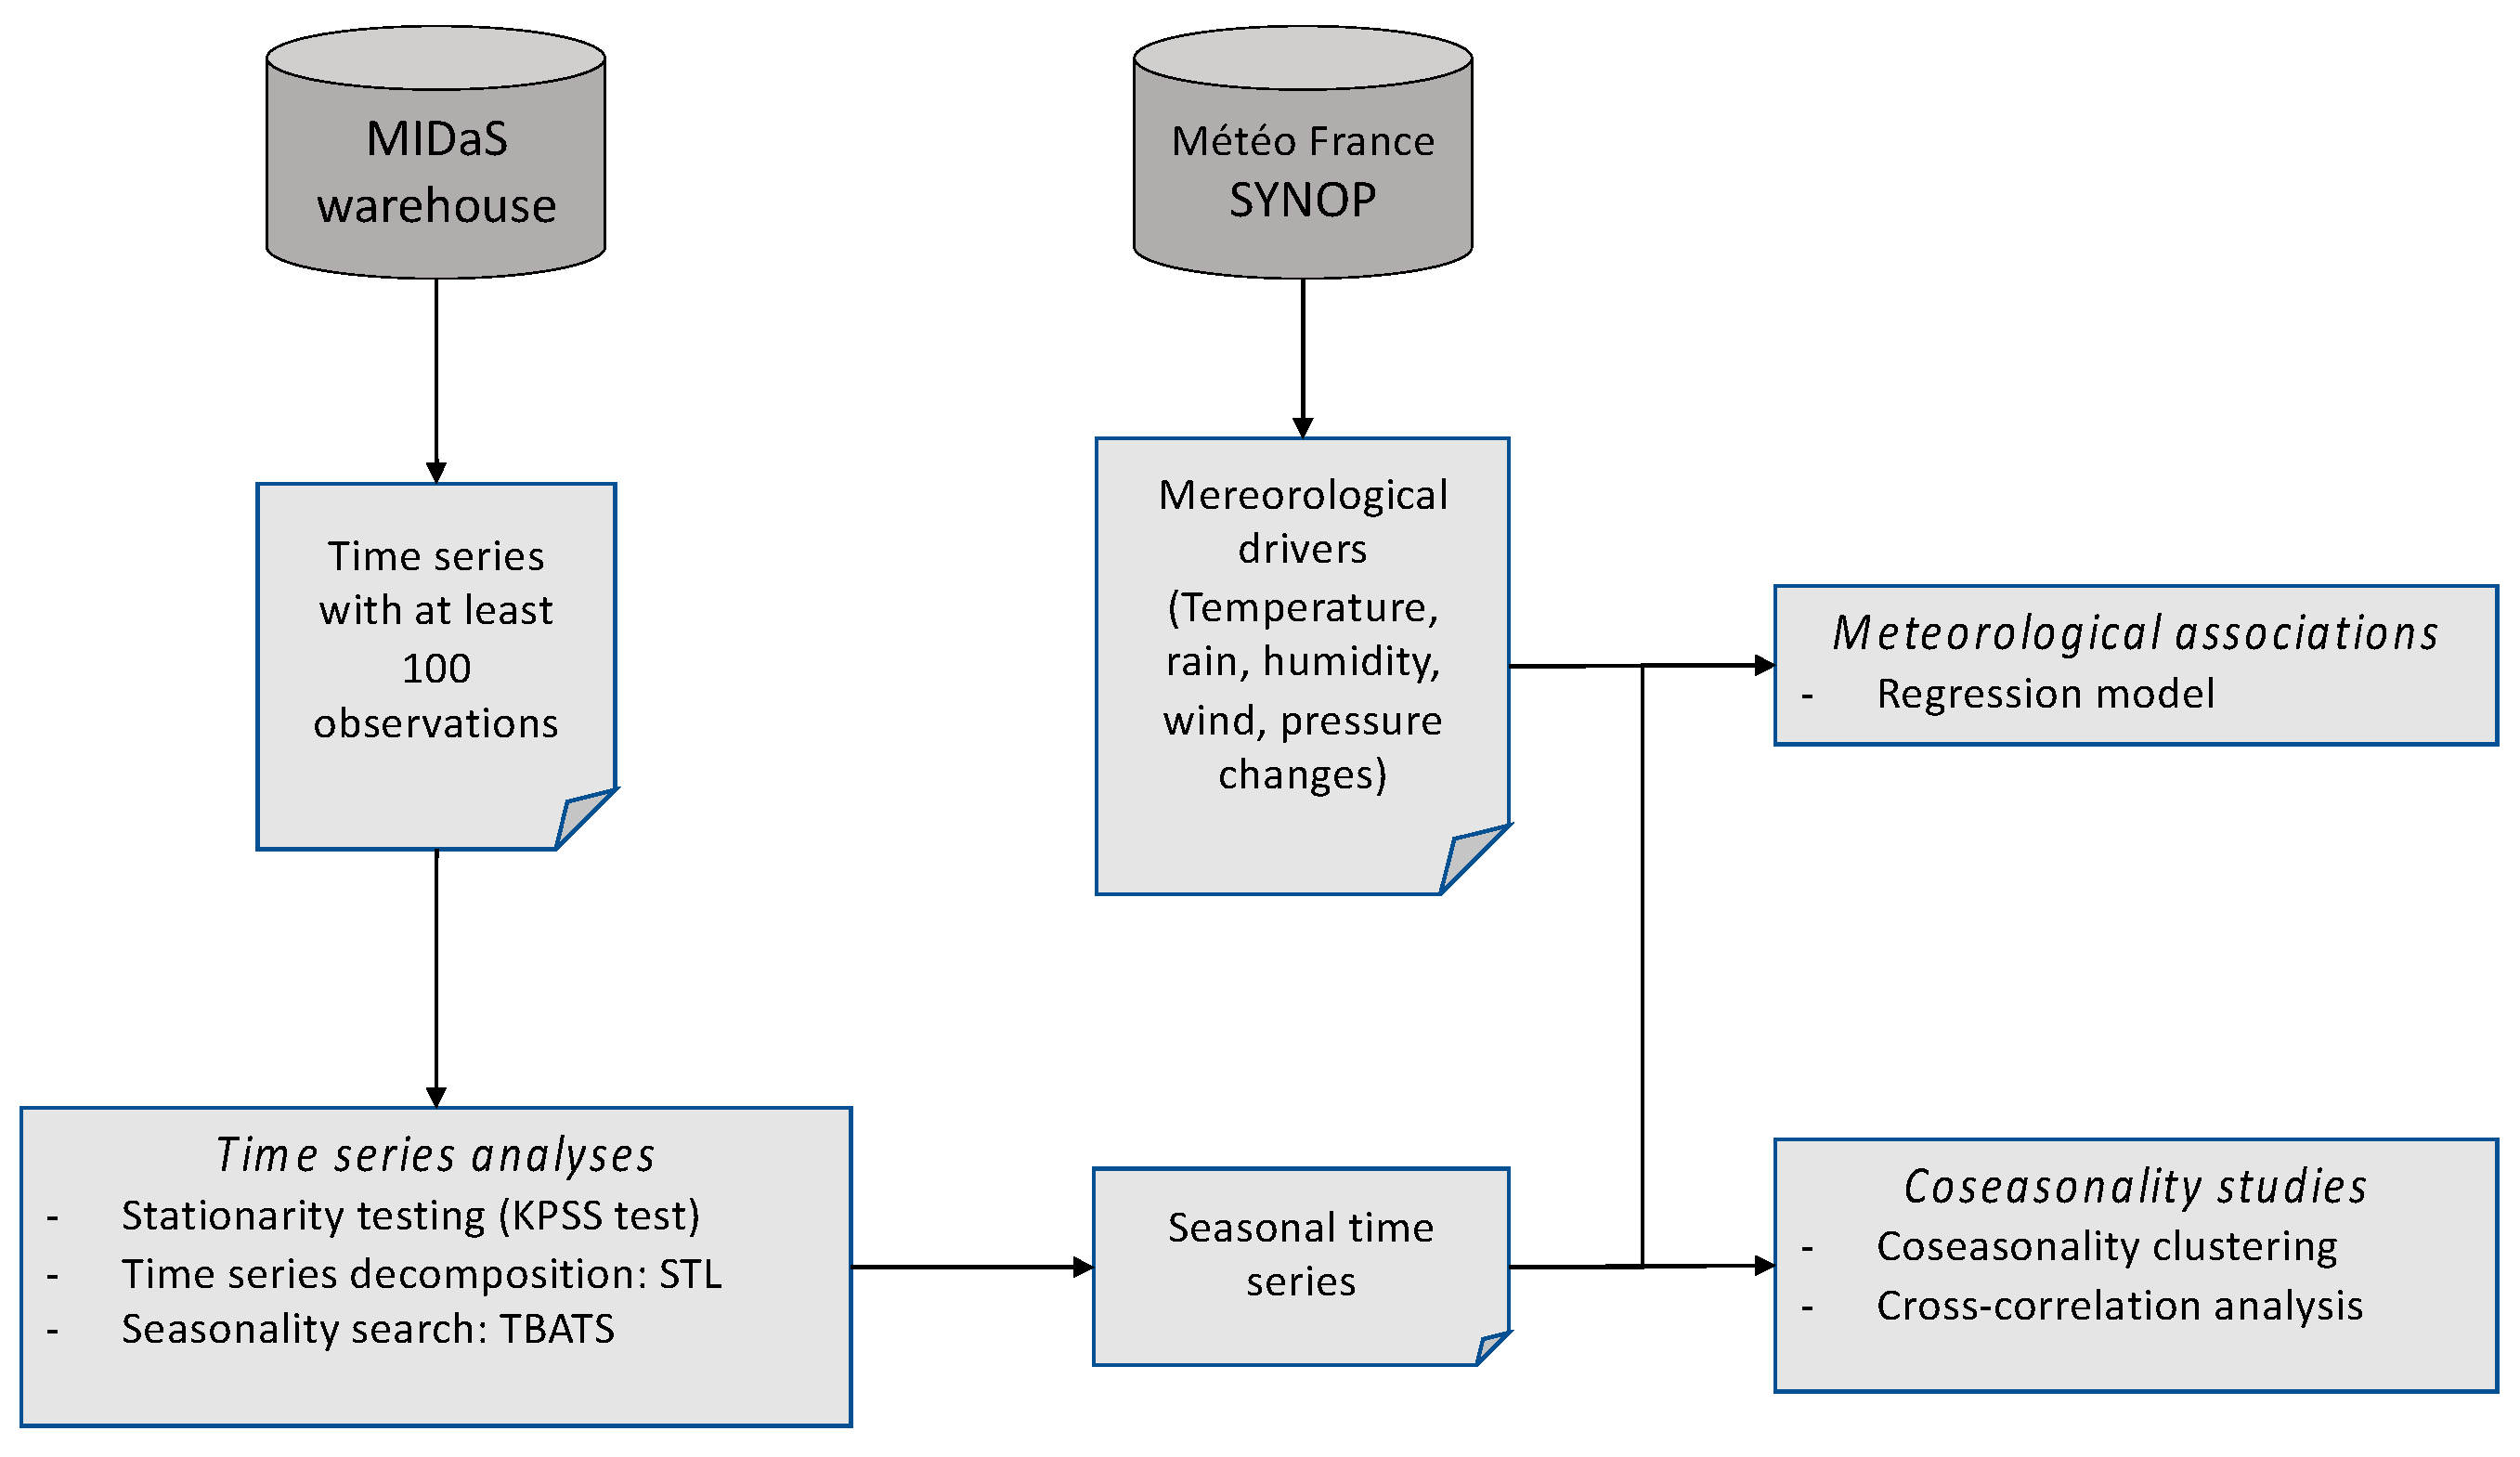
Figure 2.
Time series with seasonalities detected by TBATS analysis for the 15 most frequent bacterial species.Map color: Green: Seasonality detected; Yellow: No seasonality; White: Insufficient number of observations.Abbreviations: hosp - hospital-associated infections ; comm - community-acquired infections ; blood - blood samples; resp - respiratory samples; skin - skin samples; urine - urine samples.
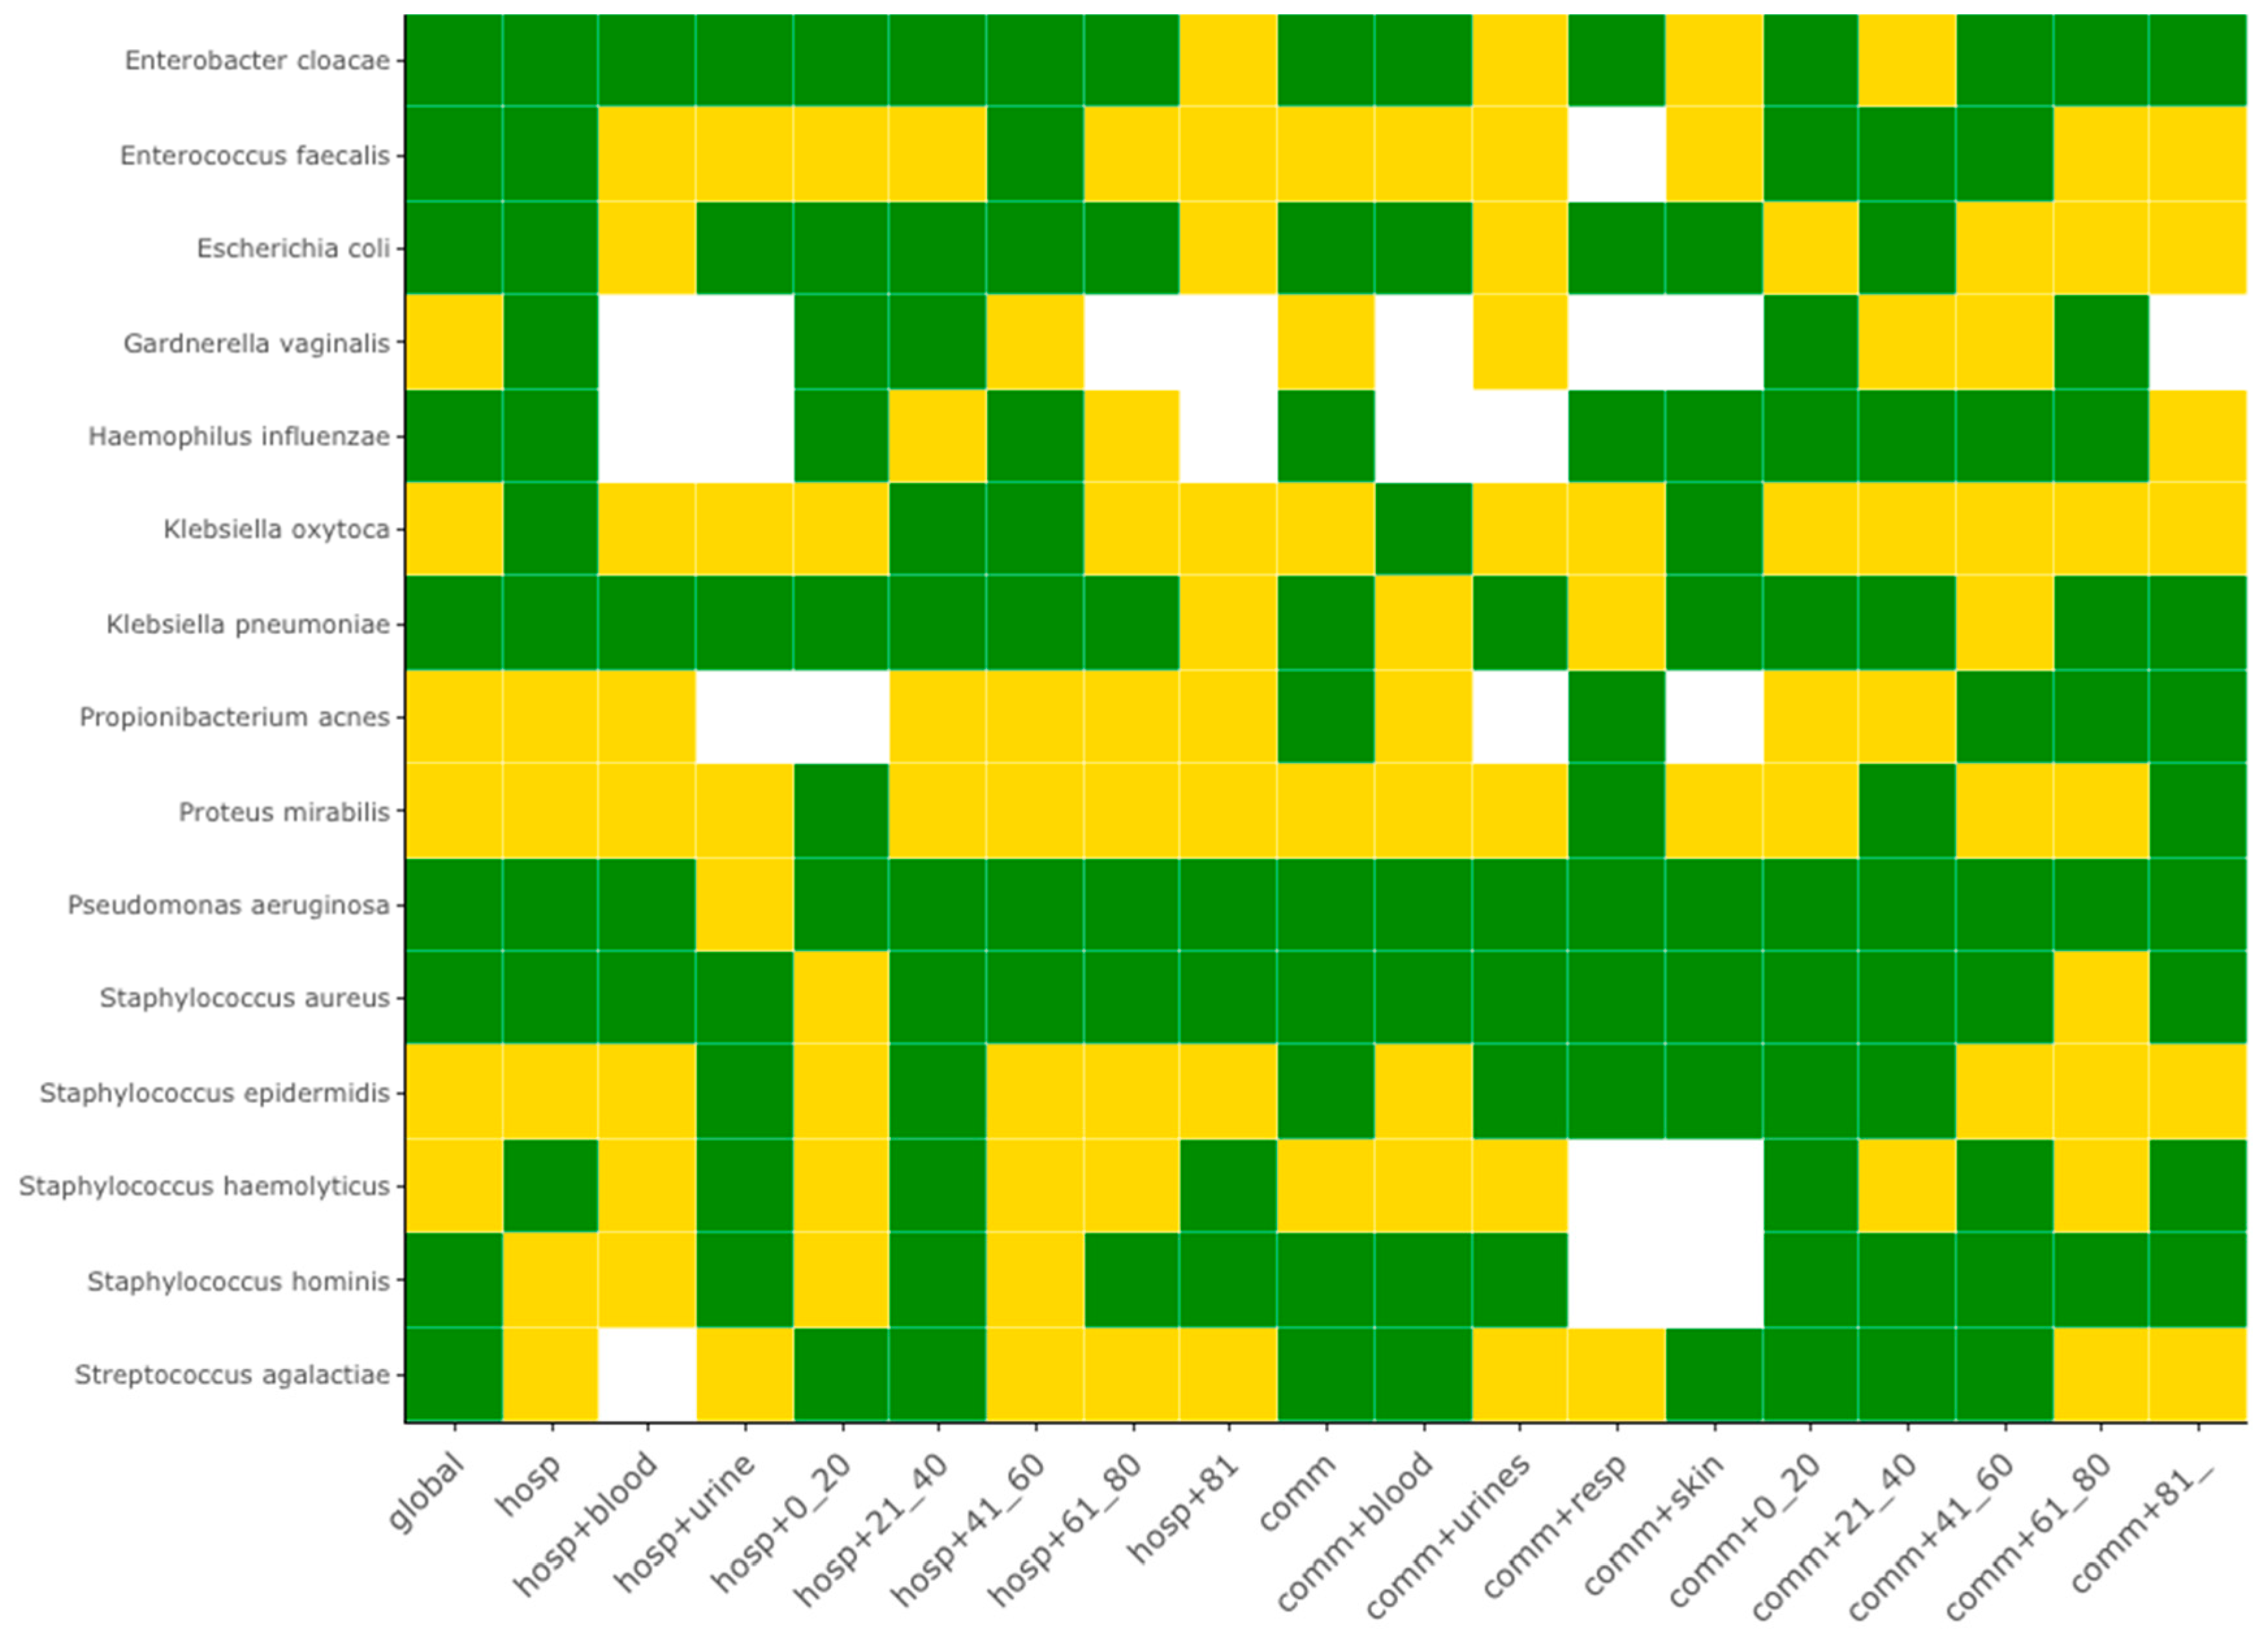
Figure 3.
Week of seasonality peak for community-acquired infections of the 15 most frequent bacterial species. Abbreviations: hosp - hospital-associated infections ; comm - community-acquired infections ; blood - blood samples; resp - respiratory samples; skin - skin samples; urine - urine samples.
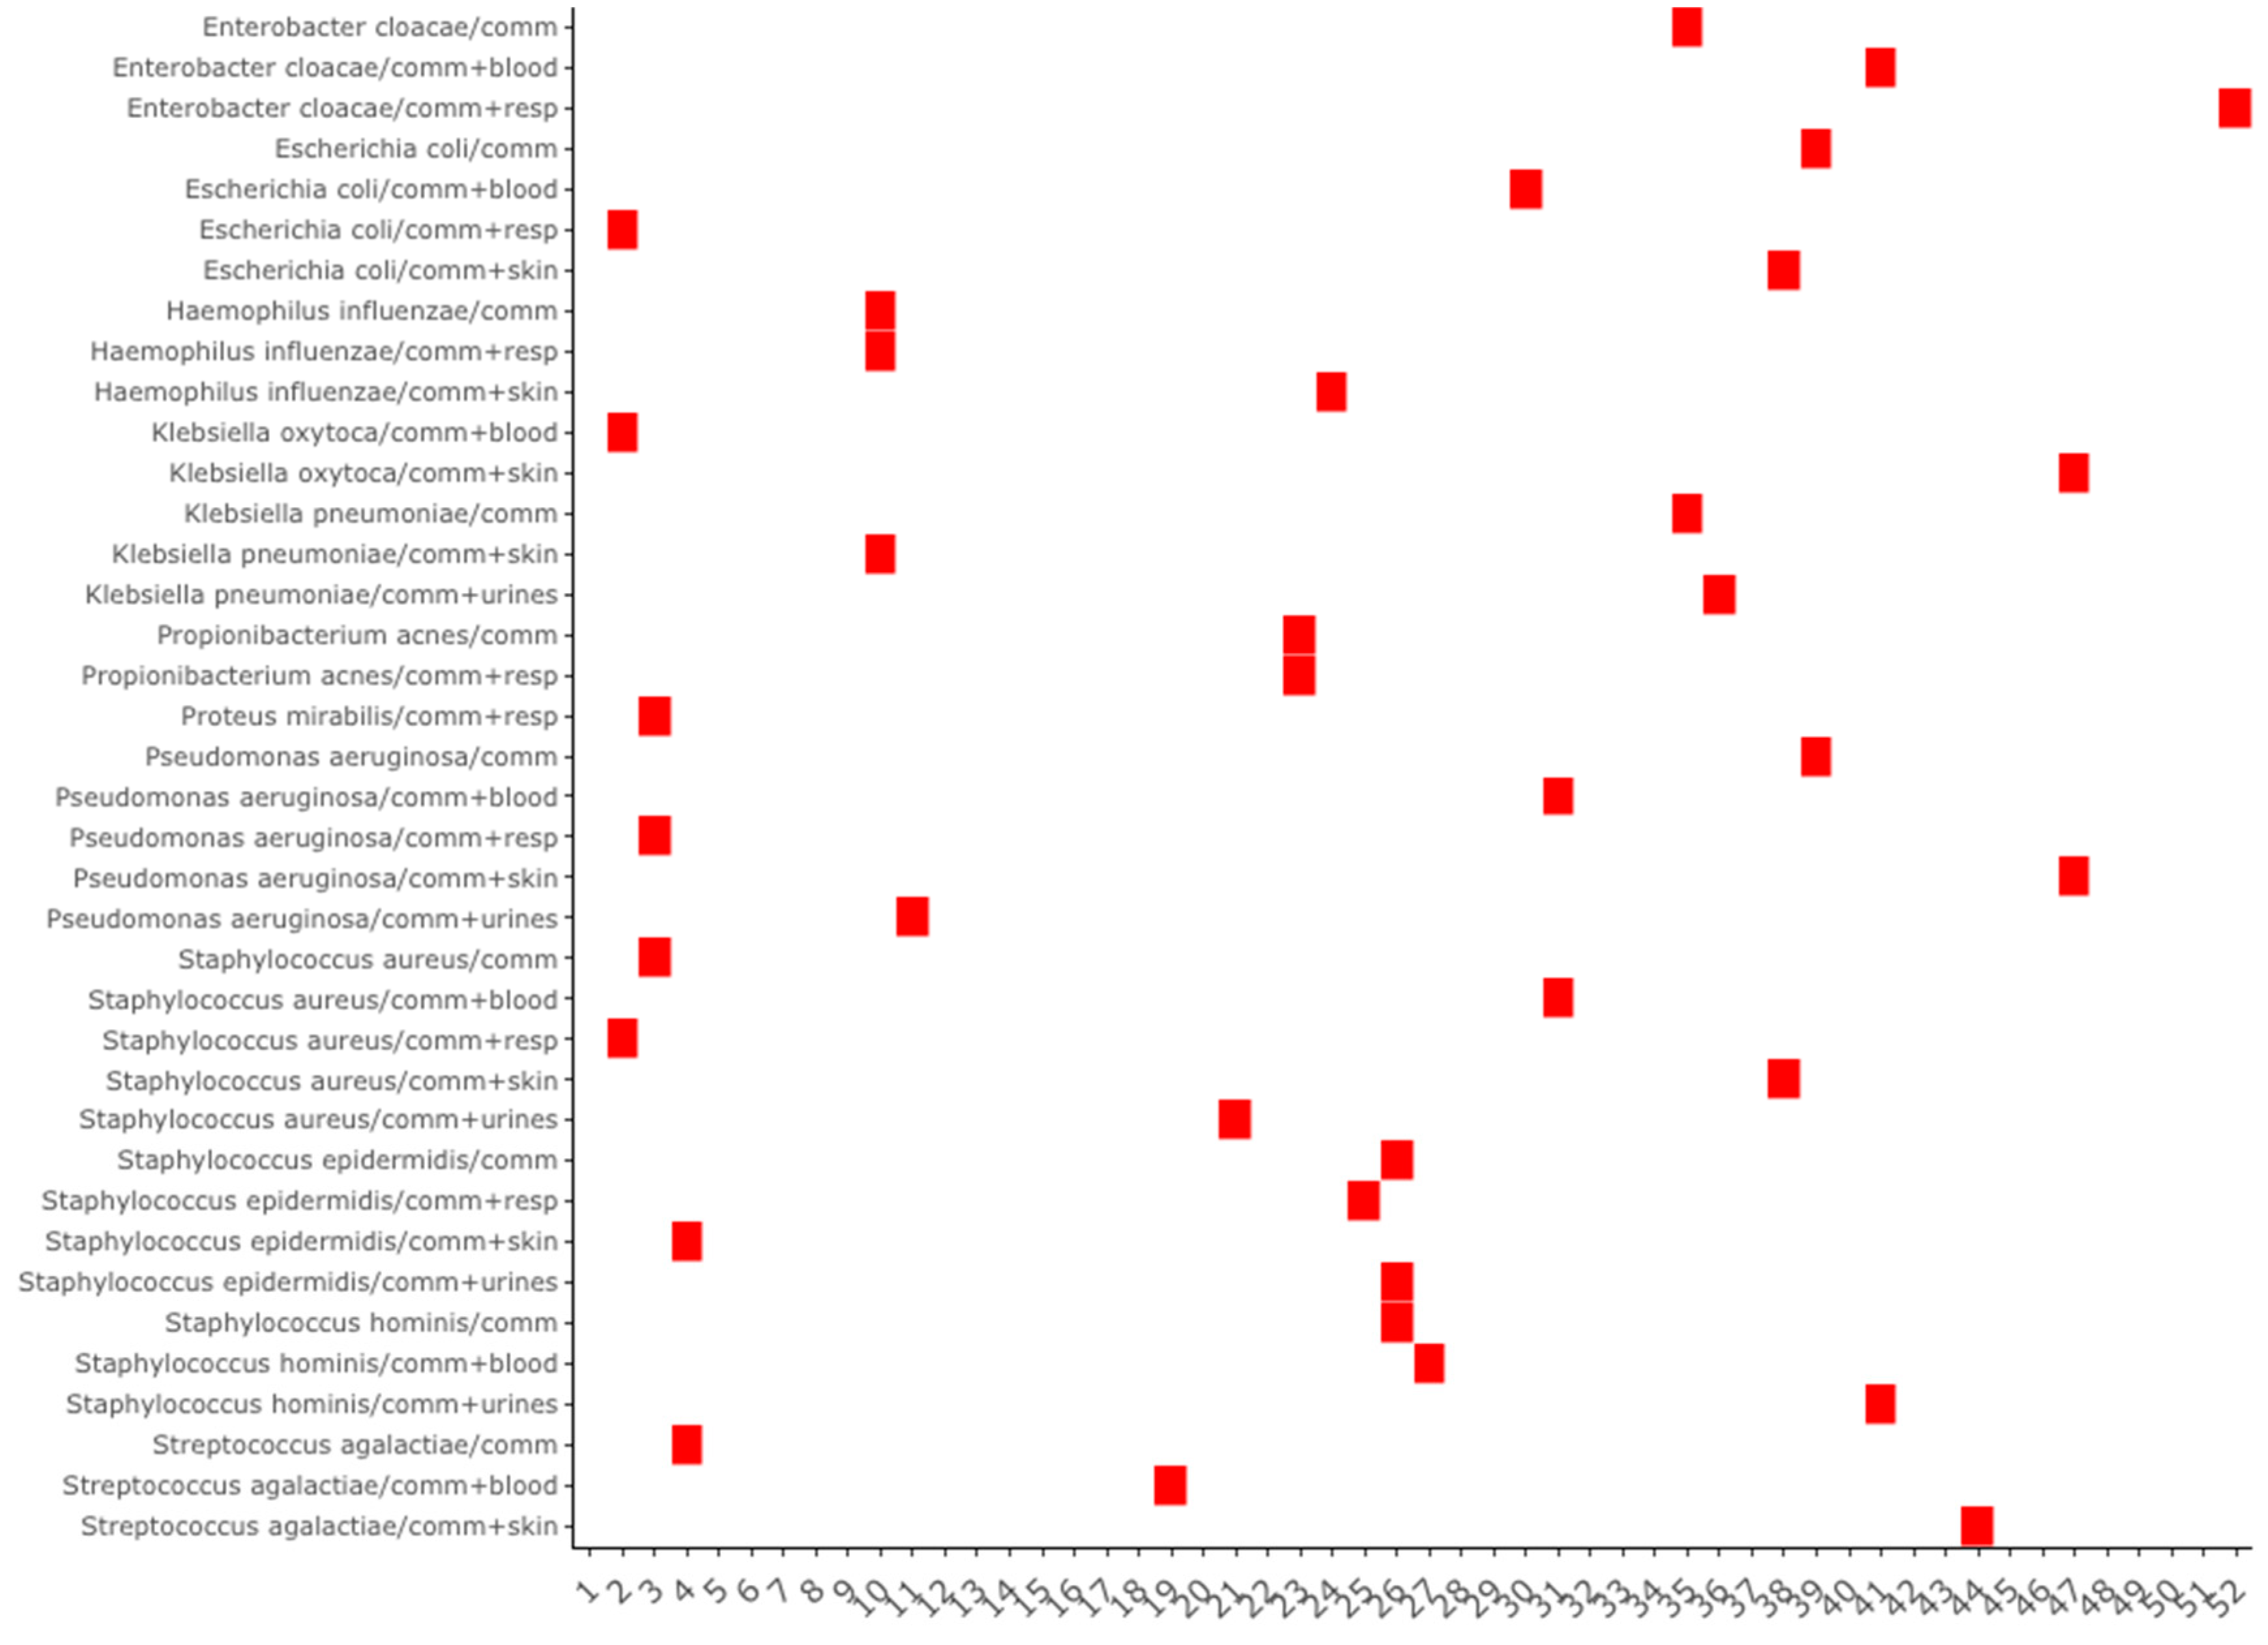
Figure 4.
Distribution of the number of seasonality peaks per week of the year for all samples of the 86 species.
Figure 4.
Distribution of the number of seasonality peaks per week of the year for all samples of the 86 species.
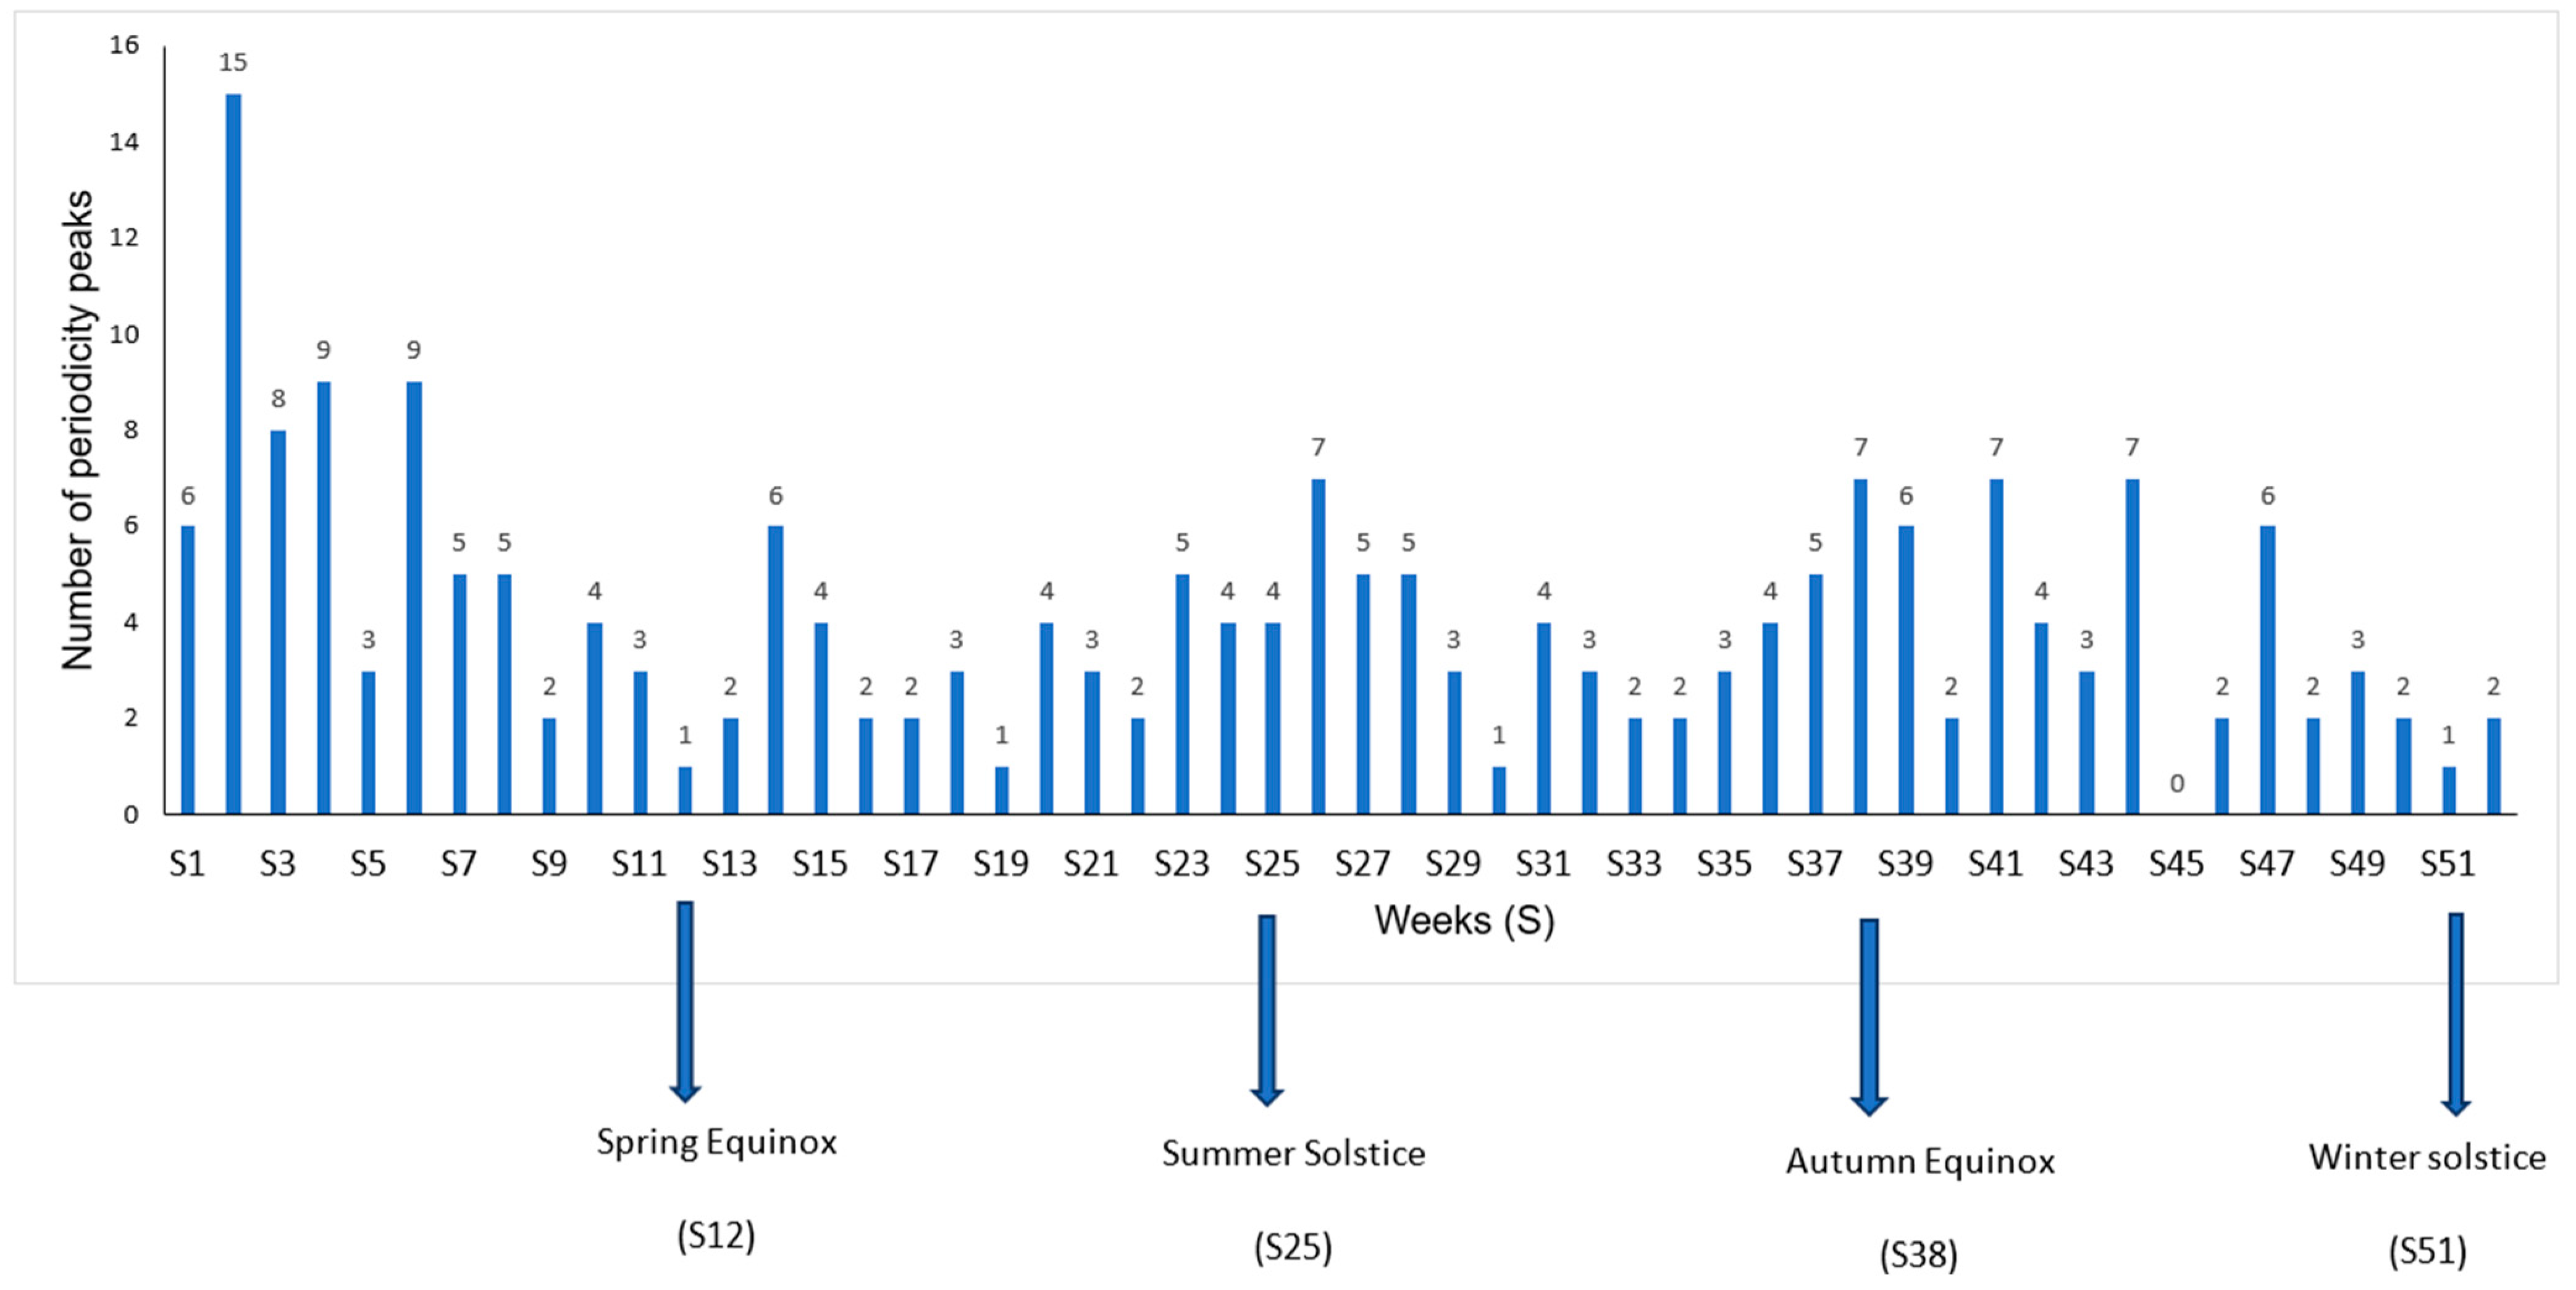
Figure 5.
Clustering of seasonal peak distances between community-related infections. Samples from the 15 most frequent species are in red.
Figure 5.
Clustering of seasonal peak distances between community-related infections. Samples from the 15 most frequent species are in red.
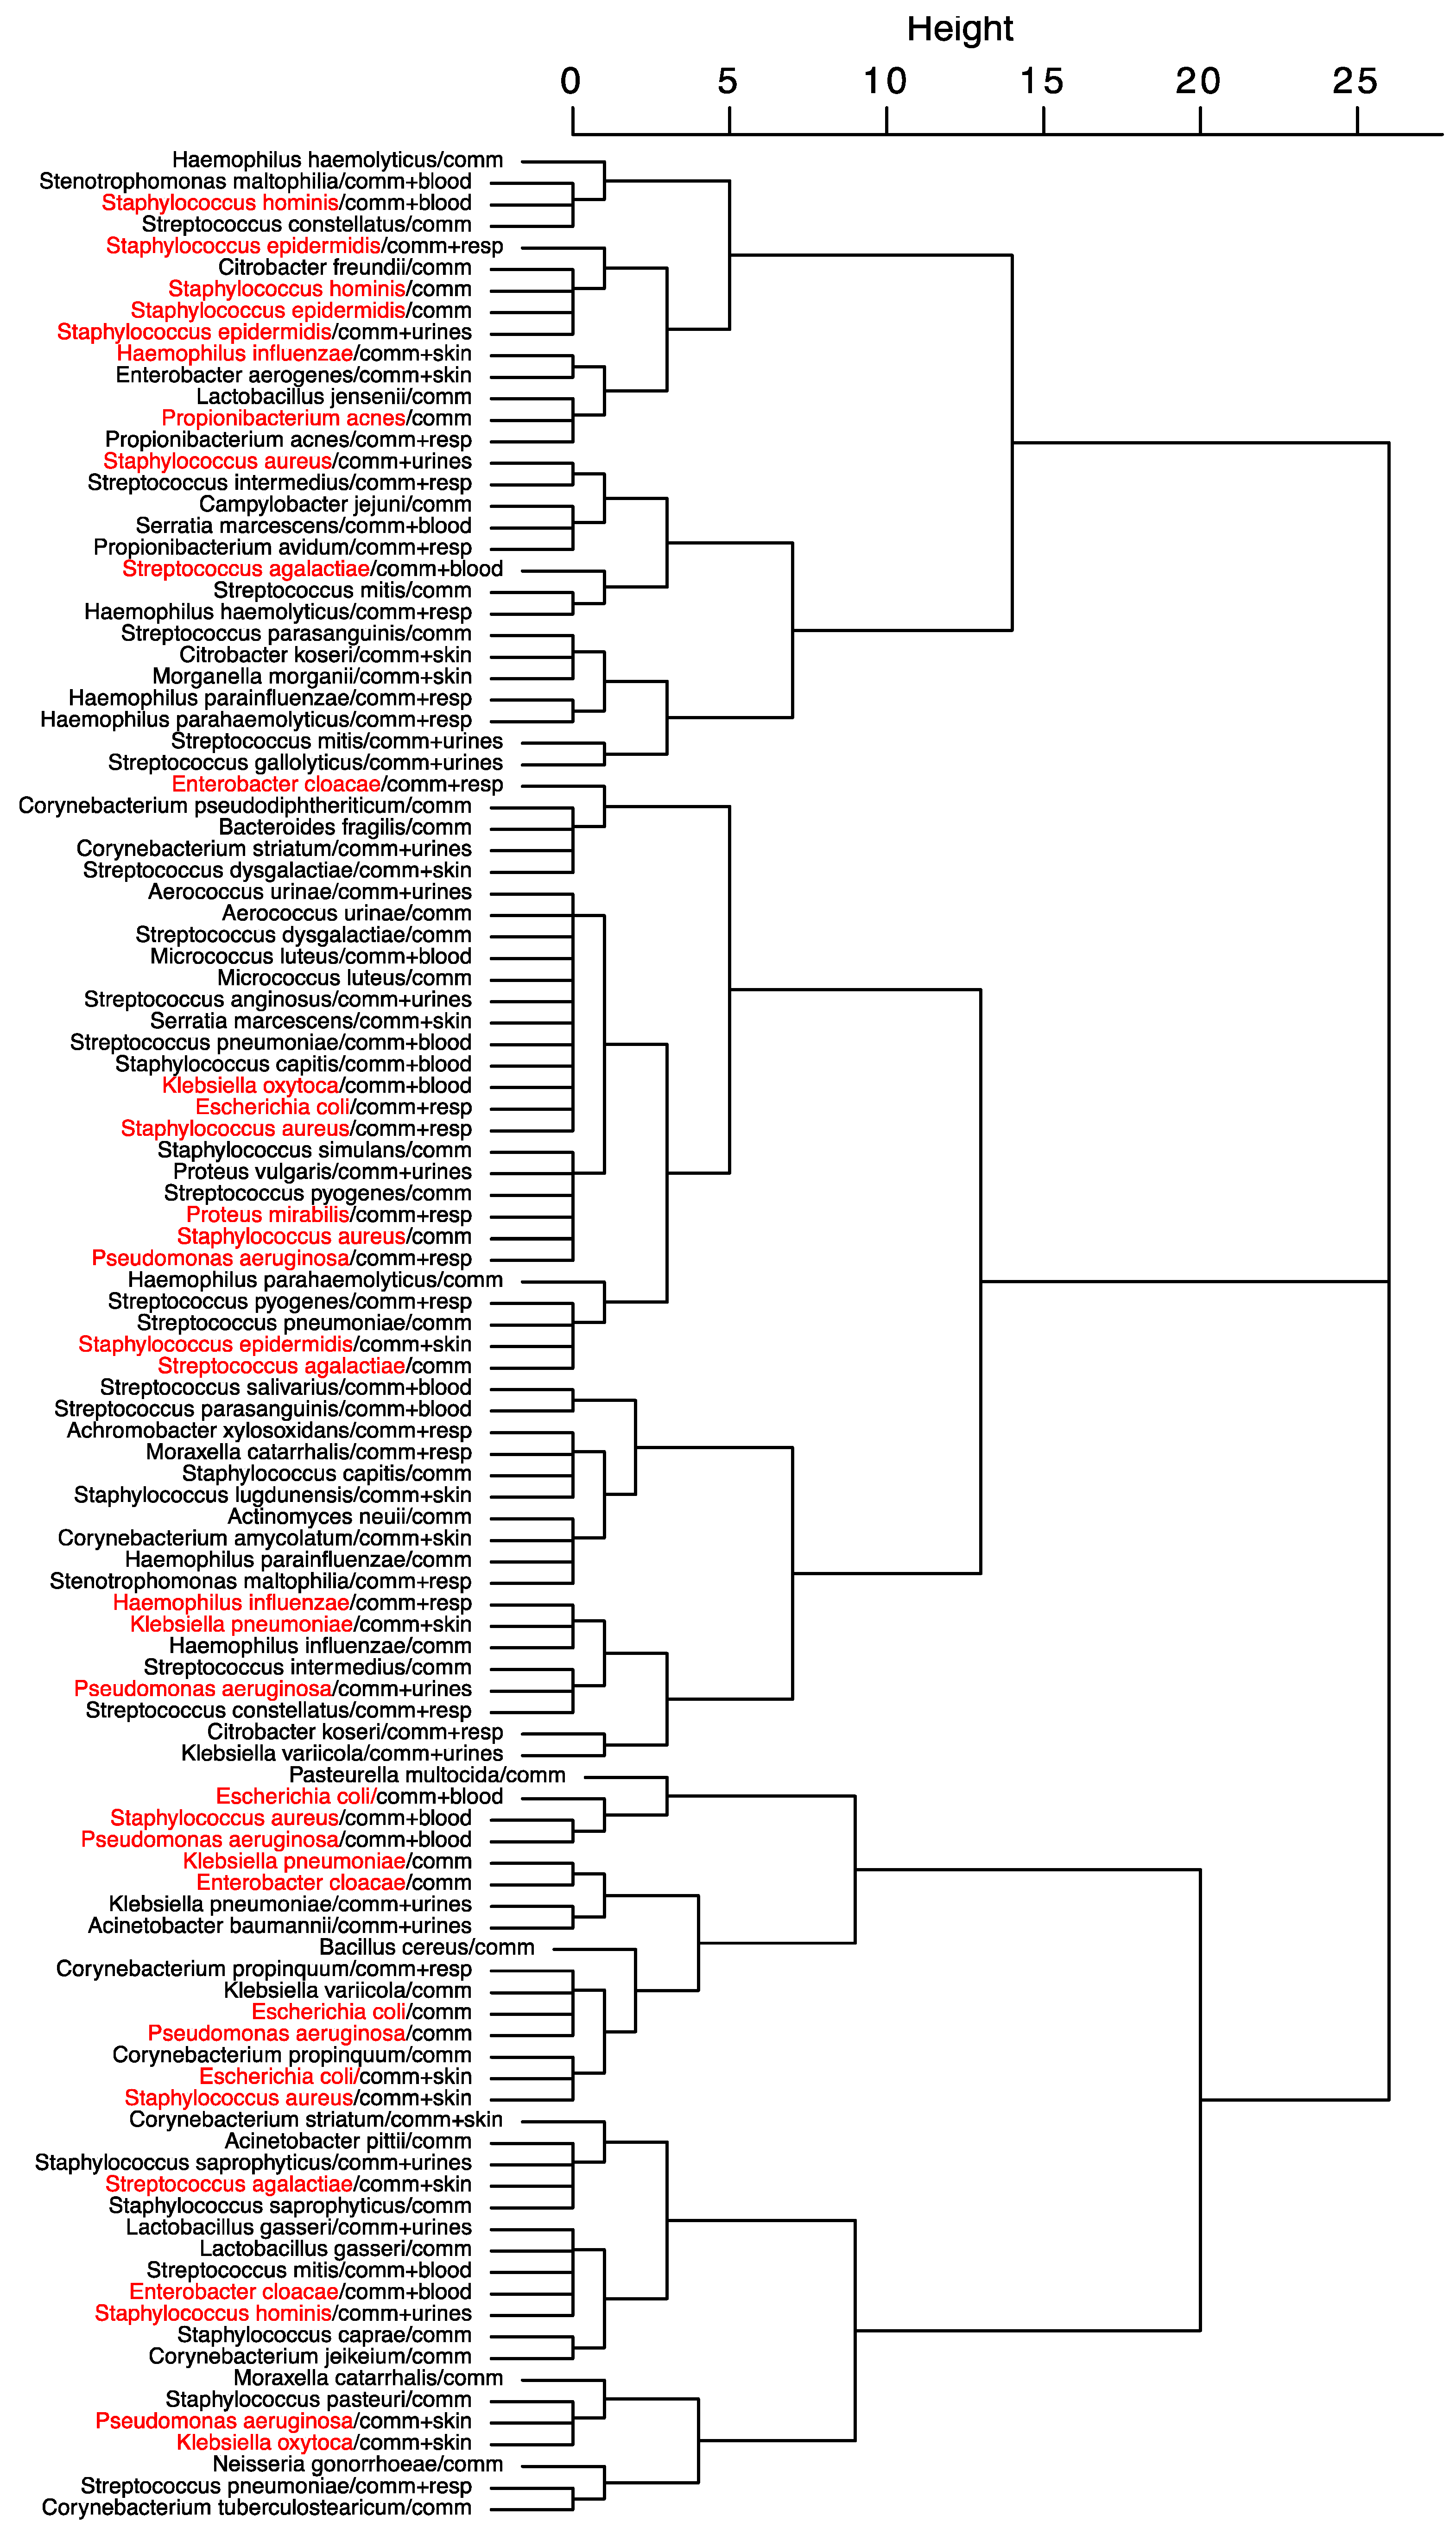
Figure 6.
Staphylococcus aureus cross-correlation correlogram of community-acquired vs respiratory samples (r= 0.542 for lag=0). The horizontal blue dashed lines indicate the significance levels.
Figure 6.
Staphylococcus aureus cross-correlation correlogram of community-acquired vs respiratory samples (r= 0.542 for lag=0). The horizontal blue dashed lines indicate the significance levels.
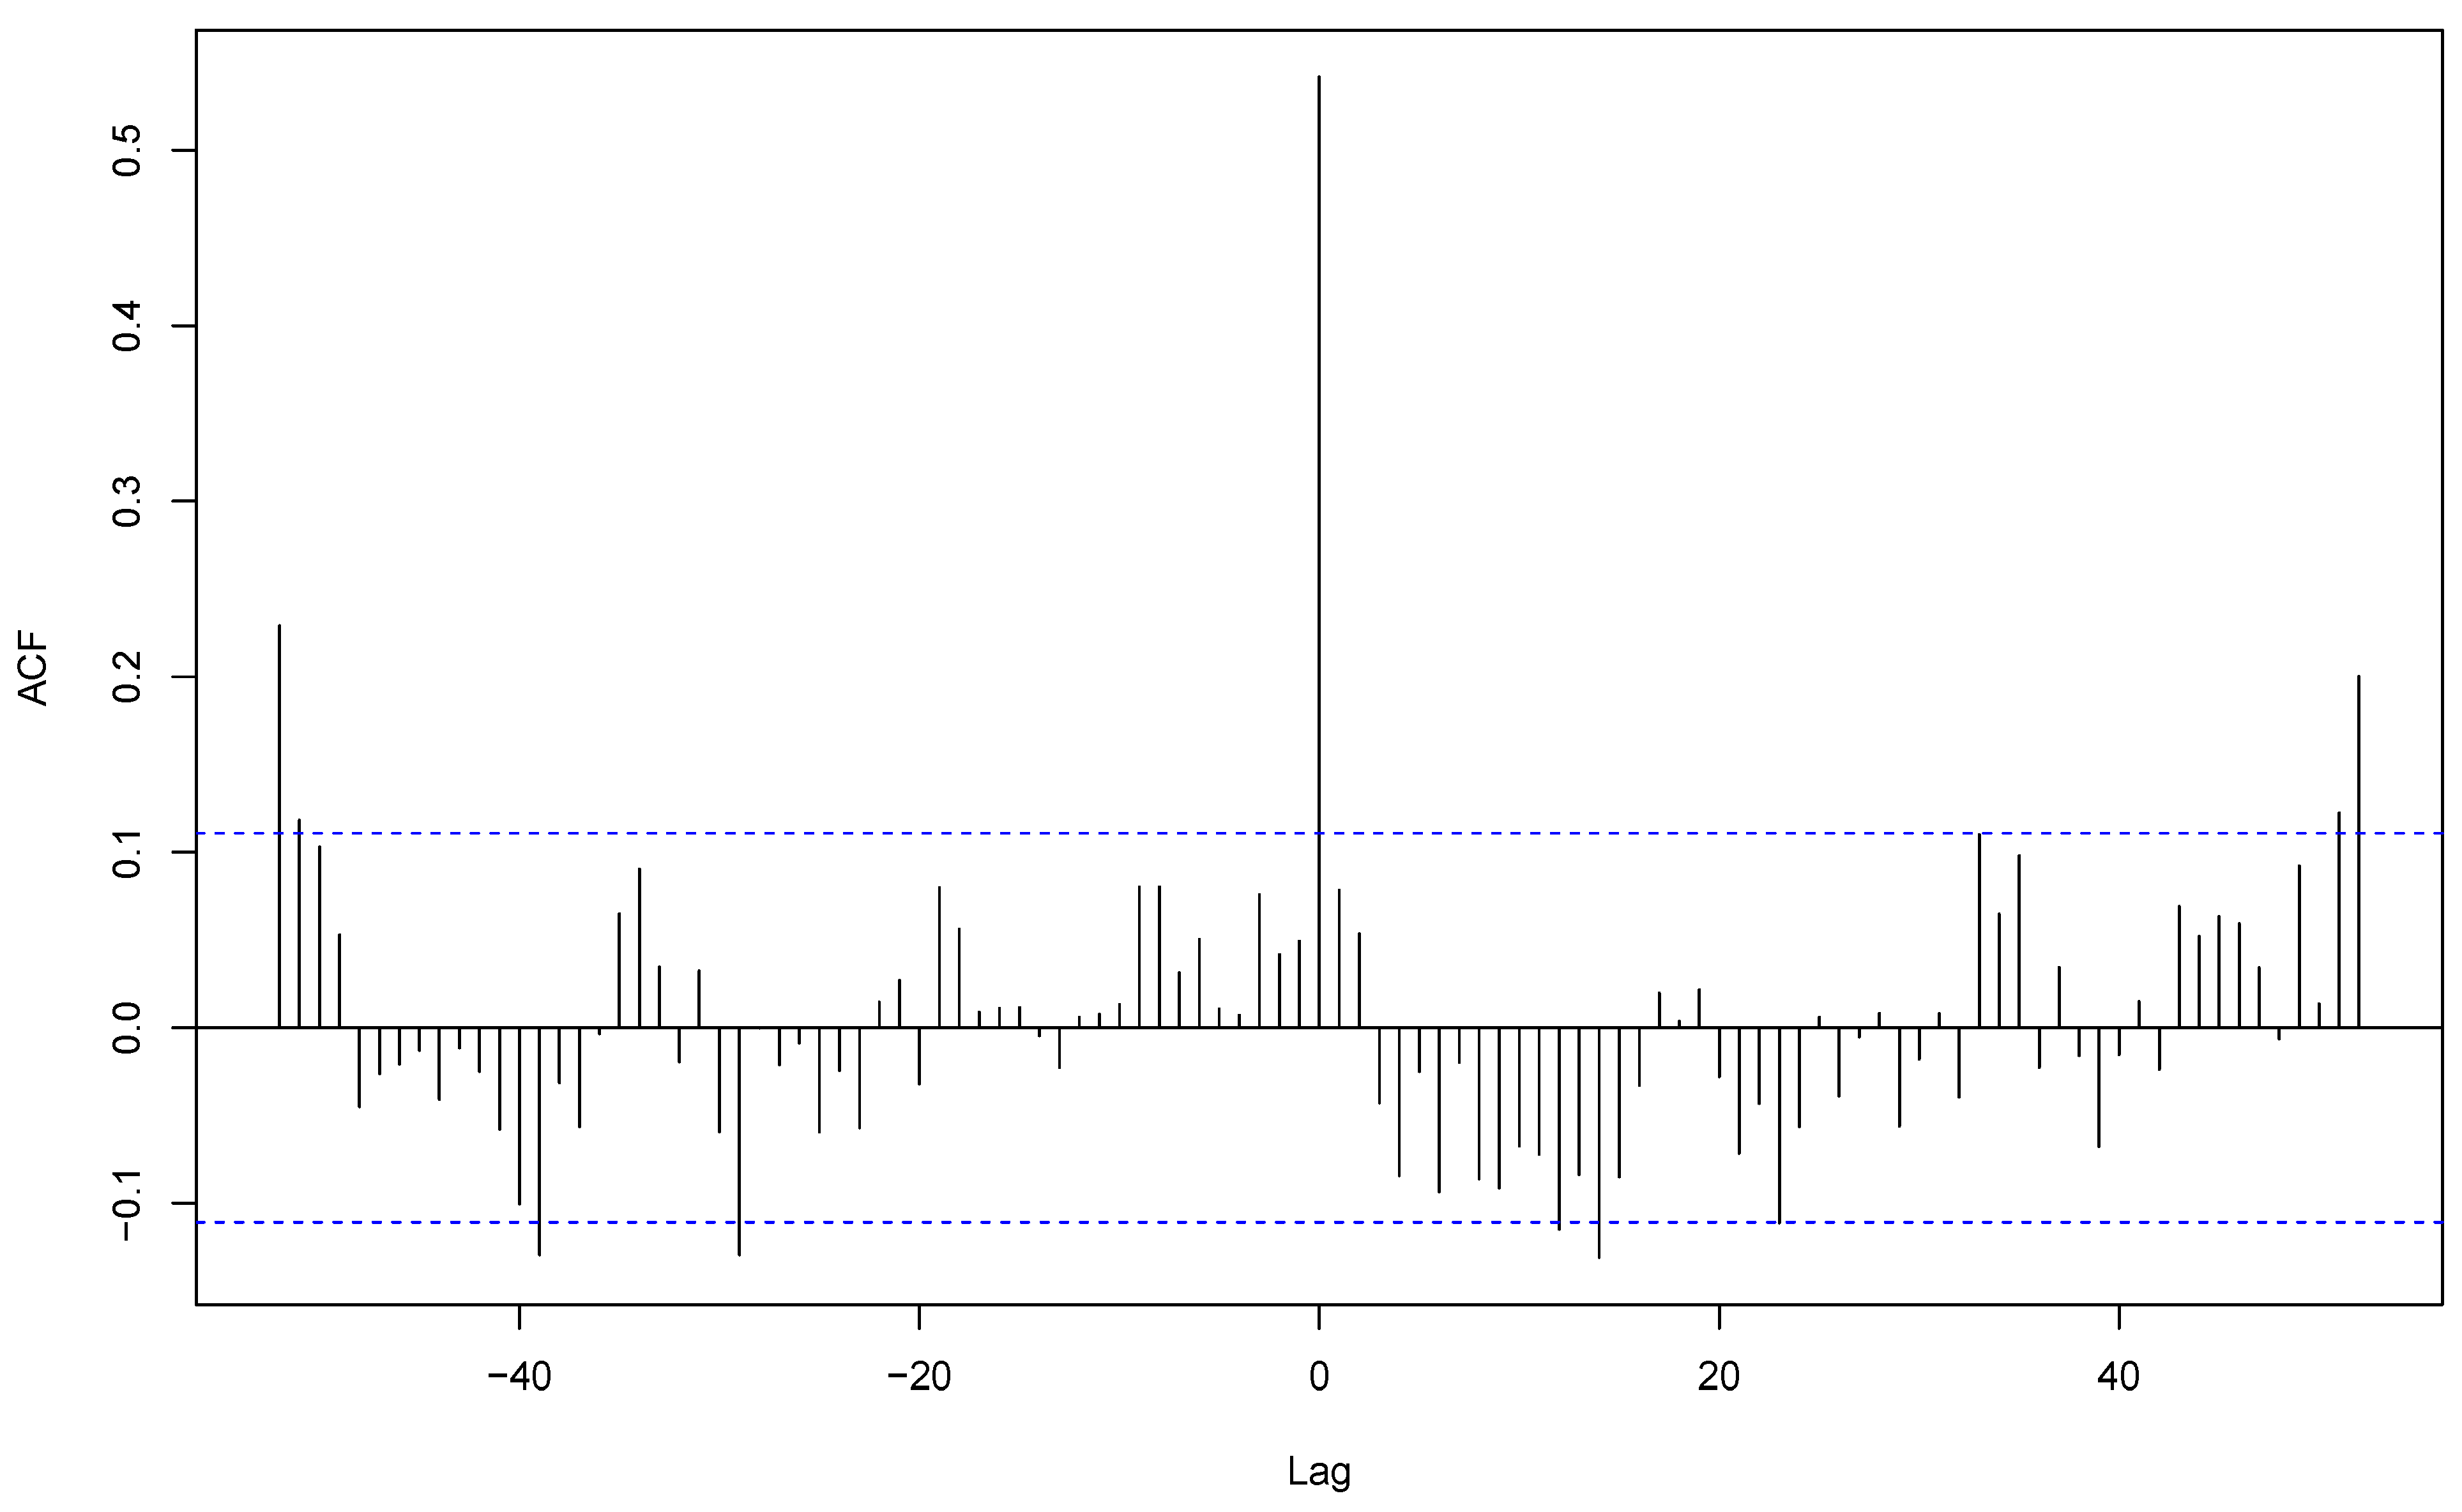
Figure 7.
Staphylococcus aureus cross-correlation correlogram of community-acquired skin vs respiratory infections (r= 0.154 for lag=-18). The horizontal blue dashed lines indicate the significance levels.
Figure 7.
Staphylococcus aureus cross-correlation correlogram of community-acquired skin vs respiratory infections (r= 0.154 for lag=-18). The horizontal blue dashed lines indicate the significance levels.
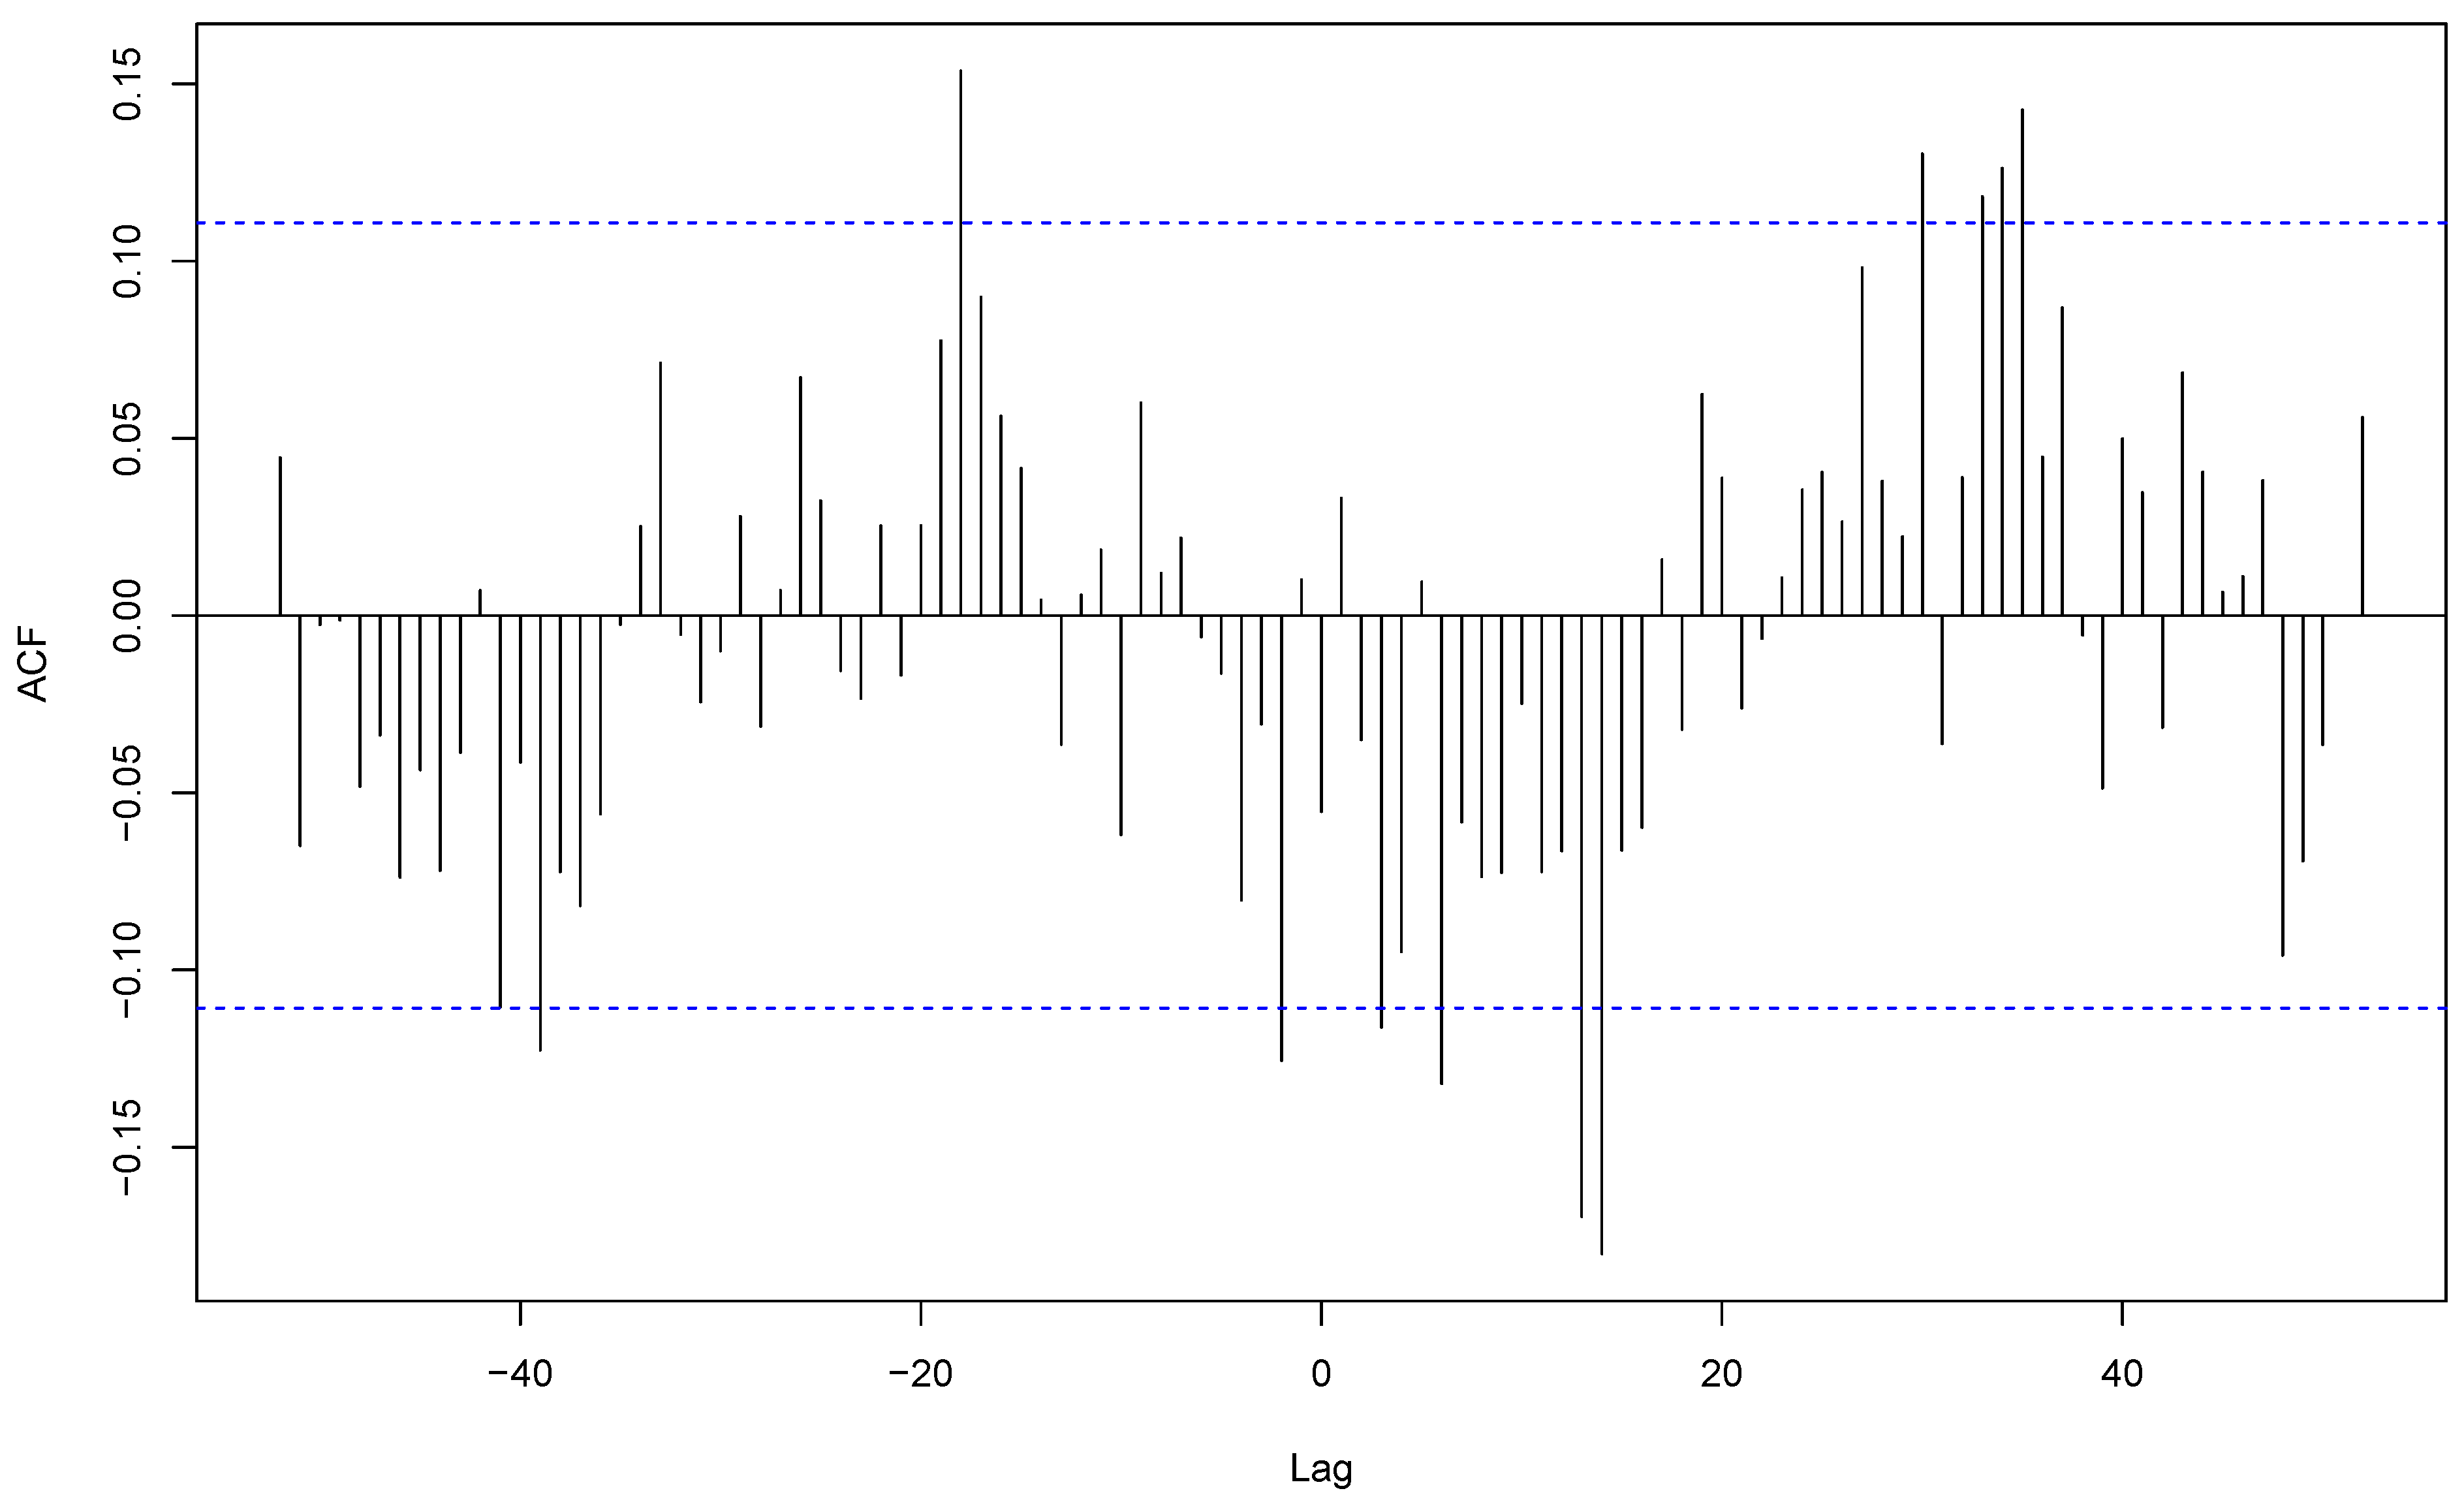

Table 1.
Descriptive statistics of the weekly incidences series for the 15 most frequent bacterial species.
Table 1.
Descriptive statistics of the weekly incidences series for the 15 most frequent bacterial species.
| N° | Pathogens | Min | 1st Qu | Median | Mean | 3rd Qu | Max |
|---|---|---|---|---|---|---|---|
| 1 | Enterobacter cloacae | 3 | 13 | 16 | 16.60 | 20 | 34 |
| 2 | Enterococcus faecalis | 9 | 23 | 27 | 27.75 | 32 | 48 |
| 3 | Escherichia coli | 109 | 135 | 145 | 145.4 | 155 | 203 |
| 4 | Gardnerella vaginalis | 3 | 16 | 22 | 23.46 | 30 | 51 |
| 5 | Haemophilus influenzae | 1 | 7 | 9 | 10.03 | 13 | 28 |
| 6 | Klebsiella oxytoca | 0 | 4 | 6 | 6.02 | 8 | 16 |
| 7 | Klebsiella pneumoniae | 18 | 31 | 35 | 36.06 | 41 | 66 |
| 8 | Propionibacterium acnes | 0 | 4 | 6 | 6.35 | 9 | 22 |
| 9 | Proteus mirabilis | 5 | 11 | 14 | 14.03 | 16 | 33 |
| 10 | Pseudomonas aeruginosa | 18 | 29 | 34 | 33.96 | 39 | 55 |
| 11 | Staphylococcus aureus | 45 | 67 | 74 | 74.04 | 80 | 111 |
| 12 | Staphylococcus epidermidis | 22 | 35 | 39 | 39.38 | 44 | 66 |
| 13 | Staphylococcus haemolyticus | 1 | 4 | 6 | 6.54 | 8 | 19 |
| 14 | Staphylococcus hominis | 0 | 6 | 8 | 8.04 | 10 | 23 |
| 15 | Streptococcus agalactiae | 7 | 18 | 22 | 21.52 | 26 | 39 |
Table 2.
Meteorological drivers associated with seasonal times series for the 15 most frequent species.
Table 2.
Meteorological drivers associated with seasonal times series for the 15 most frequent species.
| Pathogens | Sample size | Hospital-associated infections | p-value | Community-acquired infections | p-value | ||
|---|---|---|---|---|---|---|---|
| Samples | Drivers | Samples | Drivers | ||||
| Staphylococcus aureus | 23173 | all samples | temperature | 0.009 | all samples | rain | 0.004 |
| humidity | 0.011 | urines | rain | 0.037 | |||
| pressure change | 0.013 | pressure change | 0.039 | ||||
| urines | rain | 0.021 | |||||
| Staphylococcus epidermidis | 12325 | resp | rain | 0.018 | |||
| humidity | 0.030 | ||||||
| Klebsiella pneumoniae | 11287 | urines | humidity | 0.016 | |||
| Pseudomonas aeruginosa | 10631 | blood | rain | 0.020 | blood | humidity | 0.019 |
| skin | rain | 0.043 | |||||
| pressure change | 0.015 | ||||||
| Gardnerella vaginalis | 7344 | all samples | rain | 0.013 | |||
| urines | temperature | 0.011 | |||||
| Streptococcus agalactiae | 6735 | urines | temperature | 0.005 | resp | rain | 0.010 |
| rain | 0.013 | humidity | 0.029 | ||||
| Enterobacter cloacae | 5195 | all samples | wind | 0.045 | all samples | humidity | 0.002 |
| pressure change | 0.019 | ||||||
| Haemophilus influenzae | 3139 | all samples | humidity | 0.013 | all samples | humidity | 0.022 |
| blood | humidity | 0.008 | pressure change | 0.004 | |||
| blood | rain | 0.023 | |||||
| pressure change | 0.011 | ||||||
| urines | wind | 0.049 | |||||
| Staphylococcus hominis | 2516 | urines | pressure change | 0.043 | |||
| Staphylococcus haemolyticus | 2048 | all samples | humidity | 0.024 | |||
| urines | rain | 0.023 | |||||
| humidity | 0.033 | ||||||
| wind | 0.046 | ||||||
| Propionibacterium acnes | 1986 | all samples | humidity | 0.016 | |||
| skin | rain | 0.001 | |||||
| Klebsiella oxytoca | 1884 | all samples | rain | 0.041 | |||
Disclaimer/Publisher’s Note: The statements, opinions and data contained in all publications are solely those of the individual author(s) and contributor(s) and not of MDPI and/or the editor(s). MDPI and/or the editor(s) disclaim responsibility for any injury to people or property resulting from any ideas, methods, instructions or products referred to in the content. |
© 2024 by the authors. Licensee MDPI, Basel, Switzerland. This article is an open access article distributed under the terms and conditions of the Creative Commons Attribution (CC BY) license (http://creativecommons.org/licenses/by/4.0/).
Copyright: This open access article is published under a Creative Commons CC BY 4.0 license, which permit the free download, distribution, and reuse, provided that the author and preprint are cited in any reuse.


