
Submitted:
29 October 2024
Posted:
31 October 2024
You are already at the latest version
Abstract
In the realm of System Biology, it is a challenging endeavor to infer a gene regulatory network from time-series gene expression data. Numerous Boolean network inference techniques have emerged for reconstructing a gene regulatory network from a time series gene expression dataset. However, most of these techniques pose scalability concerns given their capability to consider only 2 to 3 regulatory genes over a specific target gene. To overcome this limitation, a novel inference method, LBF- MI, has been proposed in this research. This two-phase method utilizes limited Boolean functions and multivariate mutual information to reconstruct a Boolean gene regulatory network from time-series gene expression data. Initially, Boolean functions are applied to determine the optimum solutions. In case of failure, multivariate mutual information is applied to obtain the optimum solutions. This research conducted a performance-comparison experiment between LBF-MI and two other methods: Context Likelihood Relatedness, and Relevance Network. When examined on artificial as well as real time-series gene expression data, the outcomes exhibited that the proposed LBF-MI method outperformed Context Likelihood Relatedness and Relevance Network on artificial datasets, and two real Escherichia Coli datasets (E. coli gene regulatory network, and SOS response of E. coli regulatory network).
Keywords:
network inference
; gene regulatory network
; mutual information
; Boolean functions
1. Introduction
A directed graph, containing a set of molecular components such as genes, proteins, and mRNA, and their genetic interactions, is utilized to represent a gene regulatory network (GRN). Network inference means discovering genetic interactions from time series gene expression data. In system biology, reconstructing a GRN from time-series data is significantly intricate. Network inference facilitates identifying complex regulatory relationships among genes and thus exposes the regulatory mechanisms of an organism. It also assists researchers in understanding the regulatory relationships between genes and diseases [1,2]. The rapid progress in high-throughput technology has significantly increased the availability of extensive gene expression data, enabling researchers to reconstruct gene regulatory networks [3].
Based on various computational models including a Bayesian network [4], Differential equation [5], and Boolean network [6], numerous methods have been proposed for inferring GRNs. Because of its simplest representation, the Boolean network can portray a very large-scale network. Hence, it is the most anticipated approach for modeling GRNs and has been ubiquitously used in previous studies [7,8,9,10]. In the Boolean network, the state of a gene is represented by either 0(OFF) or 1(ON), and states are updated using Boolean functions. However, scalability is a major concern in most of the previous Boolean networks. For instance, three widely-known techniques (the reverse engineering algorithm (REVEAL) [11], Best-Fit [12], and Bayesian inference approach for a Boolean network (BIBN) [13], have constrained the regulatory genes to a range of 2 to 3 while reconstructing GRNs from time series gene expression data. To overcome this limitation, mutual information was utilized to reconstruct Boolean network from time-series gene expression. For example, a Relevance Network (RelNet) proposed by Butte et al. [14] calculates mutual information between every gene pair and keeps the interaction, which is greater than a threshold value. Context likelihood of relatedness (CLR) [15] introduced an adaptive background correction method on the relevance network to reduce false correlations. In another study, the algorithm for the reconstruction of accurate cellular networks (ARACNE) computes the mutual information between pairs of genes and employs the Data Preprocessing Inequality (DPI) method to eliminate the weakest edge within the gene triplet I(X,Y,Z) to reconstruct a gene regulatory network [16]. Although intriguing performances were achieved in each study, they were not able to represent multivariate mutual information due to considering only pairwise relations.
To overcome the aforementioned limitations, this research presents a novel method, LBF-MI, which employs the limited Boolean functions and multivariate mutual information to infer the gene regulatory network from time-series gene expression data. LBF-MI operates in two steps. First, it exhaustively searches a regulatory gene with all possible combinations for a target gene and determines the best-fitting function, which minimizes errors to 0. If it fails to find the optimum solution, it then exhaustively searches regulatory genes set with all possible combinations for a target gene and finds the maximum mutual information, which denotes the optimal solution. For each of the target genes, this process is executed independently. All inference results are combined to establish the decisive inferred Boolean network. To evaluate the performance of the LBF-MI, it has been compared with two widely used approaches: RelNet and CLR method. The experiment result demonstrated that LBF-MI outperformed all other methods in artificial as well as real gene expression datasets.
The remainder of the paper is organized as follows: Section 2 narrates the materials and method including Boolean network inference problem, structural performance metrics, random Boolean network, random Boolean network generation, generation of time-series gene expression dataset from random Boolean networks, and multivariate mutual information. Section 3 concentrates on the proposed approach of this research. Section 4 portrays the outcomes and comparative analysis of this research. Section 5 provides the conclusion and future research direction.
2. Materials and Methods
2.1. Boolean Network Inference Problem
The Boolean network inference problem can be defined as inferring a set of interactions between target genes and regulatory genes, as well as a set of update functions from time-series gene expression data. The inference performance can be assessed by comparing the Boolean trajectories of the inferred network with those of the target network. Let (t) is the Boolean trajectories of the observed gene expression data and is the estimated gene expression data. Gene-wise dynamics consistency can be defined by comparing the similarities between (t) and ’(t), as follows:
Where S is the total number of time steps, is the time lag, and is a indicator function that returns 1 if the condition is true and otherwise return 0. In this study, is set to 1, and comaprisrons start at .
2.2. Structural Performance Matrices
If the gold standard network is known, the structural performance between the target network, G(V,A), and the predicted network, G(V’,A’) can be evaluated. The F-Score is computed using Equation 1.
Here p and r denote precision and recall are denoted by p and r respectively. Equation 2 represents Precision as the ratio of accurately inferred connections over the aggregate number of predictions.
Here TP (True Positive) denotes the number of the connections that are inferred by the LBFMI algorithm and also actually exist in the target network, and FP (False Positive) represents the number of connections inferred by the LBF-MI algorithm but does not exist in the target network, respectively. Recall can be computed utilizing Equation 3 as the ratio of correctly predicted connections over the total number of actual connections.
Here FN (False negative) denotes connections that exist in the target network but cannot be inferred by the LBF-MI algorithm.
2.3. A Random Boolean Network
To represent gene regulation, In 1969 Kauffman introduced a Boolean network comprising a set of nodes } and a set of Boolean functions (to update the value of each node) [17]. 0 and 1 represent the states of genes in a Boolean network where 1 symbolizes the gene being ”ON” or expressed, and 0 represents the gene’s state as ”OFF” or not expressed. A state vector of all nodes represents the state of the Boolean network. In a random Boolean network, when connected by a directed link, nodes and can have any of the two regulatory relationships: positive (“activation”) or negative (“inhibition”). To determine the binary value of the variable at time , a Boolean function is applied on the values of other variables which have a direct link to at Equation 4 exhibits this computation.
After that, a synchronous update occurs on all the network variables.
2.4. Generation of Random Boolean Networks
In this study, LBF-MI algorithm is evaluated extensively on the artificial and real time-series gene expression datasets. To produce artificial time-series gene expression datasets, the Barabasi-Albert (BA) model was applied to construct random Boolean networks. In recent times this model is one of the most widely anticipated approaches for modeling a gene regulatory network. Given the number of nodes and a probability that two arbitrary nodes are connected, the following constraints have been imposed for generating a random network:
• Minimum two nodes are required for connectivity
• It is essential for each node to possess at least one incoming edge and at least one outgoing edge
Figure 1 exhibits the pseudo-code for the Barab´asi–Albert (BA) model where the added parameters in each iteration are: the desired number of nodes (), the number of nodes in the seed network (), and the number of edges to be added at each iteration ().
2.5. Generation of Time-Series Gene Expression Dataset from Random Boolean Networks
The Barabasi–Albert (BA) model, proposed by Barbasi et al. [18], is frequently employed by the researchers to generate a scale-free random Boolean network [6]. In this study, 10 groups of random Boolean networks were created, each with varying network sizes ranging from || = 10 to 100, with edges || = 2.||. To generate time-series gene expression datasets for various random Boolean network sizes, the following steps were executed:
- Consider a random initial state in which each value represents the state of a gene.
- Then, formulate a random update function, which considers any of the two Boolean functions: AND or OR while updating each gene.
- Calculate the next state.
- Repeat step 3 until a steady state is found.
2.6. Multivariate Mutual Informational
Our proposed approach selects a regulatory variable (gene) or a set of regulatory variables (genes) that is based on some concepts of information theory. First, the entropy of a discrete random variable (gene) is defined by Equation 5.
In addition, the joint entropy of two discrete random variables and with a joint probability distribution is defined by Equation 7.
Moreover, the entropy of a set of variables measures the uncertainty with their joint distribution. If are discrete random variables, the joint entropy can be denoted by Equation 8.
Here is the joint probability mass function of .
We used the mutual information of two discrete variables using Equation 9.
Finally, Equation 10 calculates the multivariate mutual information between target gene and the set of regulatory genes .
The larger the mutual information , the more dependent the regulatory genes are on the target gene.
3. Proposed Method
This research proposes a novel method, LBF-MI, to infer a gene regulatory network from time-series gene expression data. The overall framework of the proposed method is illustrated in Figure 2.
A real-time series gene expression dataset is considered as input and is converted into a Boolean gene expression dataset using the K-means algorithm [19]. It divides the gene expression values of each gene into two clusters, called 1(ON), and 0(OFF), which represent higher and lower than the average gene expression level, respectively. The proposed LBF-MI works in two steps.
- a)
- Consider a target gene, and a regulatory gene, In this study, a one-time gap is used between a target gene and a regulatory gene. Furthermore, two parameters, and , are defined where represents a single regulatory gene, and represents the maximum regulatory genes for a target gene. is set to 4 in this work. For a given target gene, initially, an exhaustive search was conducted for its regulatory interactions, considering two Boolean functions and and the optimal fitting function was identified that approximates the gene-wise dynamics consistency to 1. Gene-wise dynamics consistency (see Materials and Methods section for more details) is the similarity between the predicted Boolean time-series data and the observed data If there is no difference between the Boolean time-series data and , an optimal regulatory gene is obtained. Otherwise, step 2 is executed.
- a)
- In the second phase, this research conducts an exhaustive search for regulatory gene tuples using multivariate mutual information. The multivariate mutual information measures how much information is shared among the target gene and regulatory genes by considering both their entropies and their joint entropy (see Materials and Methods section). First, a value of equal to 1 is selected, specifying the computation of mutual information between a target gene and a regulatory gene. Subsequently, the value of is incremented by 1 iteratively until reaches the limit of Finally, the best tuple with the highest mutual information score were selected. It is worth mentioning that step 1 and step 2 are executed independently for every target gene. All results are combined to construct a final random Boolean network.
4. Results
In this research, two types of gene expression datasets: artificial gene expression dataset and real gene expression dataset were used. At first artificial gene expression dataset was utilized to evaluate the proposed method, which was later compared with two well-known methods called RelNet, and Context Likelihood Relatedness method (CLR). The proposed method is then applied to two real expression datasets called SOS DNA and fission yeast cell cycle.
4.1. Performance on Artificial Gene Expression Dataset
To evaluate the proposed method, ten groups of randomly generated networks were constructed using the Barabasi–Albert (BA) model with different network sizes (|| = 10, 20, 30, . . . , 100) and || = 2 · ||. For every network size, ten networks were generated, resulting in a total of 100 networks. Following that, 100 time-series gene expression datasets were generated, and the maximum time-step () was configured to | + 10 for the Barabasi–Albert (BA) model. The LBF-MI method was compared with two well-known methods, RelNet and CLR, over 100 artificial gene expression datasets for structural accuracy. The X-axis of Figure 3 represents the average F-score values in each group, whereas the Y-axis values show each group ranging from 10 to 100 nodes in the network. Figure 3 illustrates that the average F-score is higher when the network size is smaller, and it decreases as the network size increases. The justification for this is that the number of incoming links essentially represents the complexity of an inference problem for each network. It is evident from Figure 3 that, among the three methods, LBFMI’s performance is notably superior to the performances of RelNet and CLR in terms of F-score.
4.2. Performance on the Real Gene Expression Dataset
To validate the performance of LBF-MI, it was experimented on two biological networks: Escherichia coli (E. coli) gene regulatory network and SOS response of the E. coli gene regulatory network.
4.2.1. Case Study 1: E. coli Gene Regulatory Network
LBF-MI was assessed with a time-series gene expression dataset derived from an E. coli gene regulatory network consisting of 6 nodes and 9 interactions, which was generated by GeneNetWeaver (GNW) tool [20]. Initially, real-valued gene expression dataset was generated from the E. coli network, and then, it was converted into a Boolean dataset using a K-means clustering algorithm-based discretization method. The gold standard structure of E. coli gene regulatory network is shown in Figure 4. LBF-MI inferred E. coli gene regulatory network by accurately constructing all of the 9 interactions. On the other hand, RelNet, and CLR correctly inferred 2 and 2 interactions, respectively.
In Table 1, the proposed approach has achieved higher values for F-score (0.6000), Precision (0.4285), and Recall (1.000) compared to RelNet and CLR. This implies that the proposed method has significantly outperformed RelNet and CLR methods in terms of structural accuracy.
4.2.2. Case Study 2: Regulatory Network of the SOS Response of E.coli
A Boolean network model for SOS response of the E. coli consisting of 6 nodes and 10 interactions (Self-loop is not considered) was presented in a previous study by Shao et al. [21], which also provided a time-series gene expression dataset of Boolean values represented in Table 2.
Figure 5 illustrates the interactions between nodes, with a positive interaction depicted by an arrow connecting two genes, while negative interactions are represented by lines ending with a bar. The maximum time step of the time-series gene expression data was set to 8.
On the other hand, Figure 6 illustrates the inferred network by LBF-MI where green, red, and blue interactions denote true positive, false positive, and false negative predictions, respectively. As shown in Figure 6, LBF-MI correctly inferred 7 out of 10 interactions. In contrast, RelNet, and CLR correctly inferred 6, and 5 interactions, respectively.
Table 3 presents the evaluation of inference performance, including F-score, Precision, and Recall, for LBF-MI, RelNet, and CLR on the regulatory network of the SOS response in E. coli. LBF-MI has achieved an F-score of 0.7000, Precision of 0.6666, and Recall of 0.5263, respectively. These values are higher than those obtained by RelNet and CLR. LBF-MI exhibited significantly better performance than RelNet and CLR in terms of structural accuracy.
4.3. Computation Time Comparisons
The comparative analysis of the running times for LBF-MI, RelNet, and CLR across 10 BA random networks is depicted in Figure 7. All simulations were conducted on a PC equipped with an Intel Core i5 1.60GHz processor and 8GB of memory, utilizing a single core. The Y-axis values denote the average logarithmic running times of LBF-MI, RelNet, and CLR. Among these methods, CLR exhibited the fastest performance. Conversely, LBF-MI recorded the slowest time due to its exploration of a larger problem space. This suggests that our approach achieves high-quality solutions at the expense of longer search times. Time units are measured in milliseconds.
5. Discussion and Conclusions
Reconstructing a gene regulatory network from time-series gene expression data is a challenging task in systems biology. Researchers have developed numerous inference methods for network inference. However, most of these methods are not scalable because of limiting the regulatory genes from 1 to 3. To obtain better scalability, this research proposes a novel method named LBF-MI which has constrained the number of regulatory genes by 4, enhancing its scalability compared to other existing methods. While some other well-known methods inferred gene regulatory networks through pairwise mutual information, LBF-MI, in contrast, inferred networks using multivariate mutual information, a common approach in systems biology. A performance evaluation of the proposed method was conducted on artificial datasets and two real networks, namely the E. coli gene regulatory network and the SOS response of E. coli regulatory network. LBF-MI demonstrated superior accuracy compared to other state-of-the-art methods in both artificial and real gene expression datasets. A limitation of LBF-MI is that it has the slowest running times. A parallel implementation can be conducted to reduce the search time in the forthcoming research. Moreover, a neural network can be utilized alongside multivariate mutual information to infer a gene regulatory network more accurately from time-series data.
Author Contributions
Conceptualization, S.B.; methodology, S.B. and H.L.G; software, S.B. and H.L.G; validation, S.B. and H.L.G; formal analysis, S.B.; investigation, H.L.G; resources, S.B., M.F.B.H. and H.L.G; data curation, S.B.; writing—original draft preparation, S. B., N.A.K. and M.F.B.H.; writing—review and editing, S.B., F.A.F., S. A., S.M., N.A.K. and M.F.B.H.; visualization, H.L.G; supervision, S.B., F.A.F., S. A. and S.M.; project administration, H.L.G.; funding acquisition, F.A.F., S. A. and S.M. All authors have read and agreed to the published version of the manuscript.
Institutional Review Board Statement
Not applicable.
Informed Consent Statement
Not applicable.
Data Availability Statement
All the data used in this study can be obtained from the corresponding author upon a reasonable request.
Conflicts of Interest
The authors declare no conflicts of interest.
References
- Gkmen, A.; Frank, E.-S. Inferring the conservative causal core of gene regulatory networks. BMC systems biology 2010, 4, 1–13. [Google Scholar] [CrossRef]
- Yingjun, L.V.; Endong, B. Apoptosis induced in chicken embryo fibroblasts in vitro by a polyinosinic: polycytidylic acid copolymer. Toxicology in Vitro 2009, 23, 1360–1364. [Google Scholar] [CrossRef]
- Stefan, R.M.; Piyush, B.M.; Melissa, J.D.; Mark, A.R. Supervised, semi-supervised and unsupervised inference of gene regulatory networks. Briefings in Bioinformatics 2013, 15, 195–211. [Google Scholar] [CrossRef]
- Seiya, I.; Takao, G.; Satoru, M. Estimation of Genetic Networks and Functional Structures Between Genes by Using Bayesian Networks and Nonparametric Regression. Pacific Symposium on Biocomputing 2002, 7, 175–186. [Google Scholar] [CrossRef]
- Ting, C.; Hongyu, L.H.; George, M.C. Modeling Gene Expression with Differential Equations. Pacific Symposium on Biocomputing. Pacific Symposium on Biocomputing 1999, 4, 29–40. [Google Scholar]
- Stuart, A.K. Metabolic stability and epigenesis in randomly constructed genetic nets. Journal of Theoretical Biology 1969, 22, 437–467. [Google Scholar]
- Barman, S.; Kwon, Y. K. A novel mutual information-based Boolean network inference method from time-series gene expression data. PloS one 2017, 12, e0171097. [Google Scholar] [CrossRef] [PubMed]
- Barman, S.; Kwon, Y. K. A Boolean network inference from time-series gene expression data using a genetic algorithm. Bioinformatics 2018, 34, i927–i933. [Google Scholar] [CrossRef] [PubMed]
- Barman, S.; Kwon, Y. K. A neuro-evolution approach to infer a Boolean network from time-series gene expressions. Bioinformatics 2020, 36, i762–i769. [Google Scholar] [CrossRef] [PubMed]
- Zhang, D.; Gao, S.; Liu, Z. P.; Gao, R. LogicGep: Boolean networks inference using symbolic regression from time-series transcriptomic profiling data. Briefings in Bioinformatics 2024, 25, bbae286. [Google Scholar] [CrossRef] [PubMed]
- Liang, S.; Fuhrman, S.; Somogyi, R. Reveal, a general reverse engineering algorithm for inference of genetic network architectures. Pacific Symposium on Biocomputing 1998, 18–29. [Google Scholar]
- Harri, L.; Ilya, S.; Olli, Y.-H. On Learning Gene Regulatory Networks Under the Boolean Network Model. Machine Learning 2003, 52, 147–167. [Google Scholar] [CrossRef]
- Shengtong, H.; Raymond, K.W.W.; Thomas, C.M.L.; Linghao, S.; Shuo-Yen, R.L.; Xiaodan, F. A Full Bayesian Approach for Boolean Genetic Network Inference. PloS one 2014, 9, e115806. [Google Scholar] [CrossRef]
- Atul, J.B.; Isaac, S.K. Mutual information relevance networks: Functional genomic clustering using pairwise entropy measurements. Pacific Symposium on Biocomputing 2000, 5, 418–429. [Google Scholar] [CrossRef]
- Jeremiah, J.F.; Boris, H.; Joshua, T.T.; Ilaria, M.; Jamey, W.; Guillaume, C.; Simon, K.; James, J.C.; Timothy, S.G. Large-Scale Mapping and Validation of Escherichia coli Transcriptional Regulation from a Compendium of Expression Profiles. PLOS Biology 2007, 5, e8. [Google Scholar] [CrossRef]
- Adam, A.M.; Ilya, N.; Katia, B.; Chris, W.; Gustavo, S.; Riccardo Dalla, F.; Andrea, C. ARACNE: An Algorithm for the Reconstruction of Gene Regulatory Networks in a Mammalian Cellular Context. BMC bioinformatics 2006, 7 Suppl 1, S7. [Google Scholar] [CrossRef]
- Kauffman, S.A. Metabolic stability and epigenesis in randomly constructed genetic nets. Journal of theoretical biology 22, 437–467. [CrossRef] [PubMed]
- Albert-László, B.; Réka, A. Emergence of Scaling in Random Networks. Science (New York, N.Y.) 1999, 286, 509–512. [Google Scholar] [CrossRef]
- James, M. Some methods for classification and analysis of multivariate observations. 1967; 281–297. [Google Scholar]
- Thomas, S.; Daniel, M.; Dario, F. GeneNetWeaver: In silico benchmark generation and performance profiling of network inference methods. Bioinformatics 2011, 27, 2263–2270. [Google Scholar] [CrossRef]
- Bin, S.; Xiang, L.; Dongliang, Z.; Jiayi, W.; Qi, O. From Boolean Network Model to Continuous Model Helps in Design of Functional Circuits. Plos One 2015, 10, 1–12. [Google Scholar] [CrossRef]
Figure 1.
Pseudo-code for the Barabasi–Albert (BA) model.
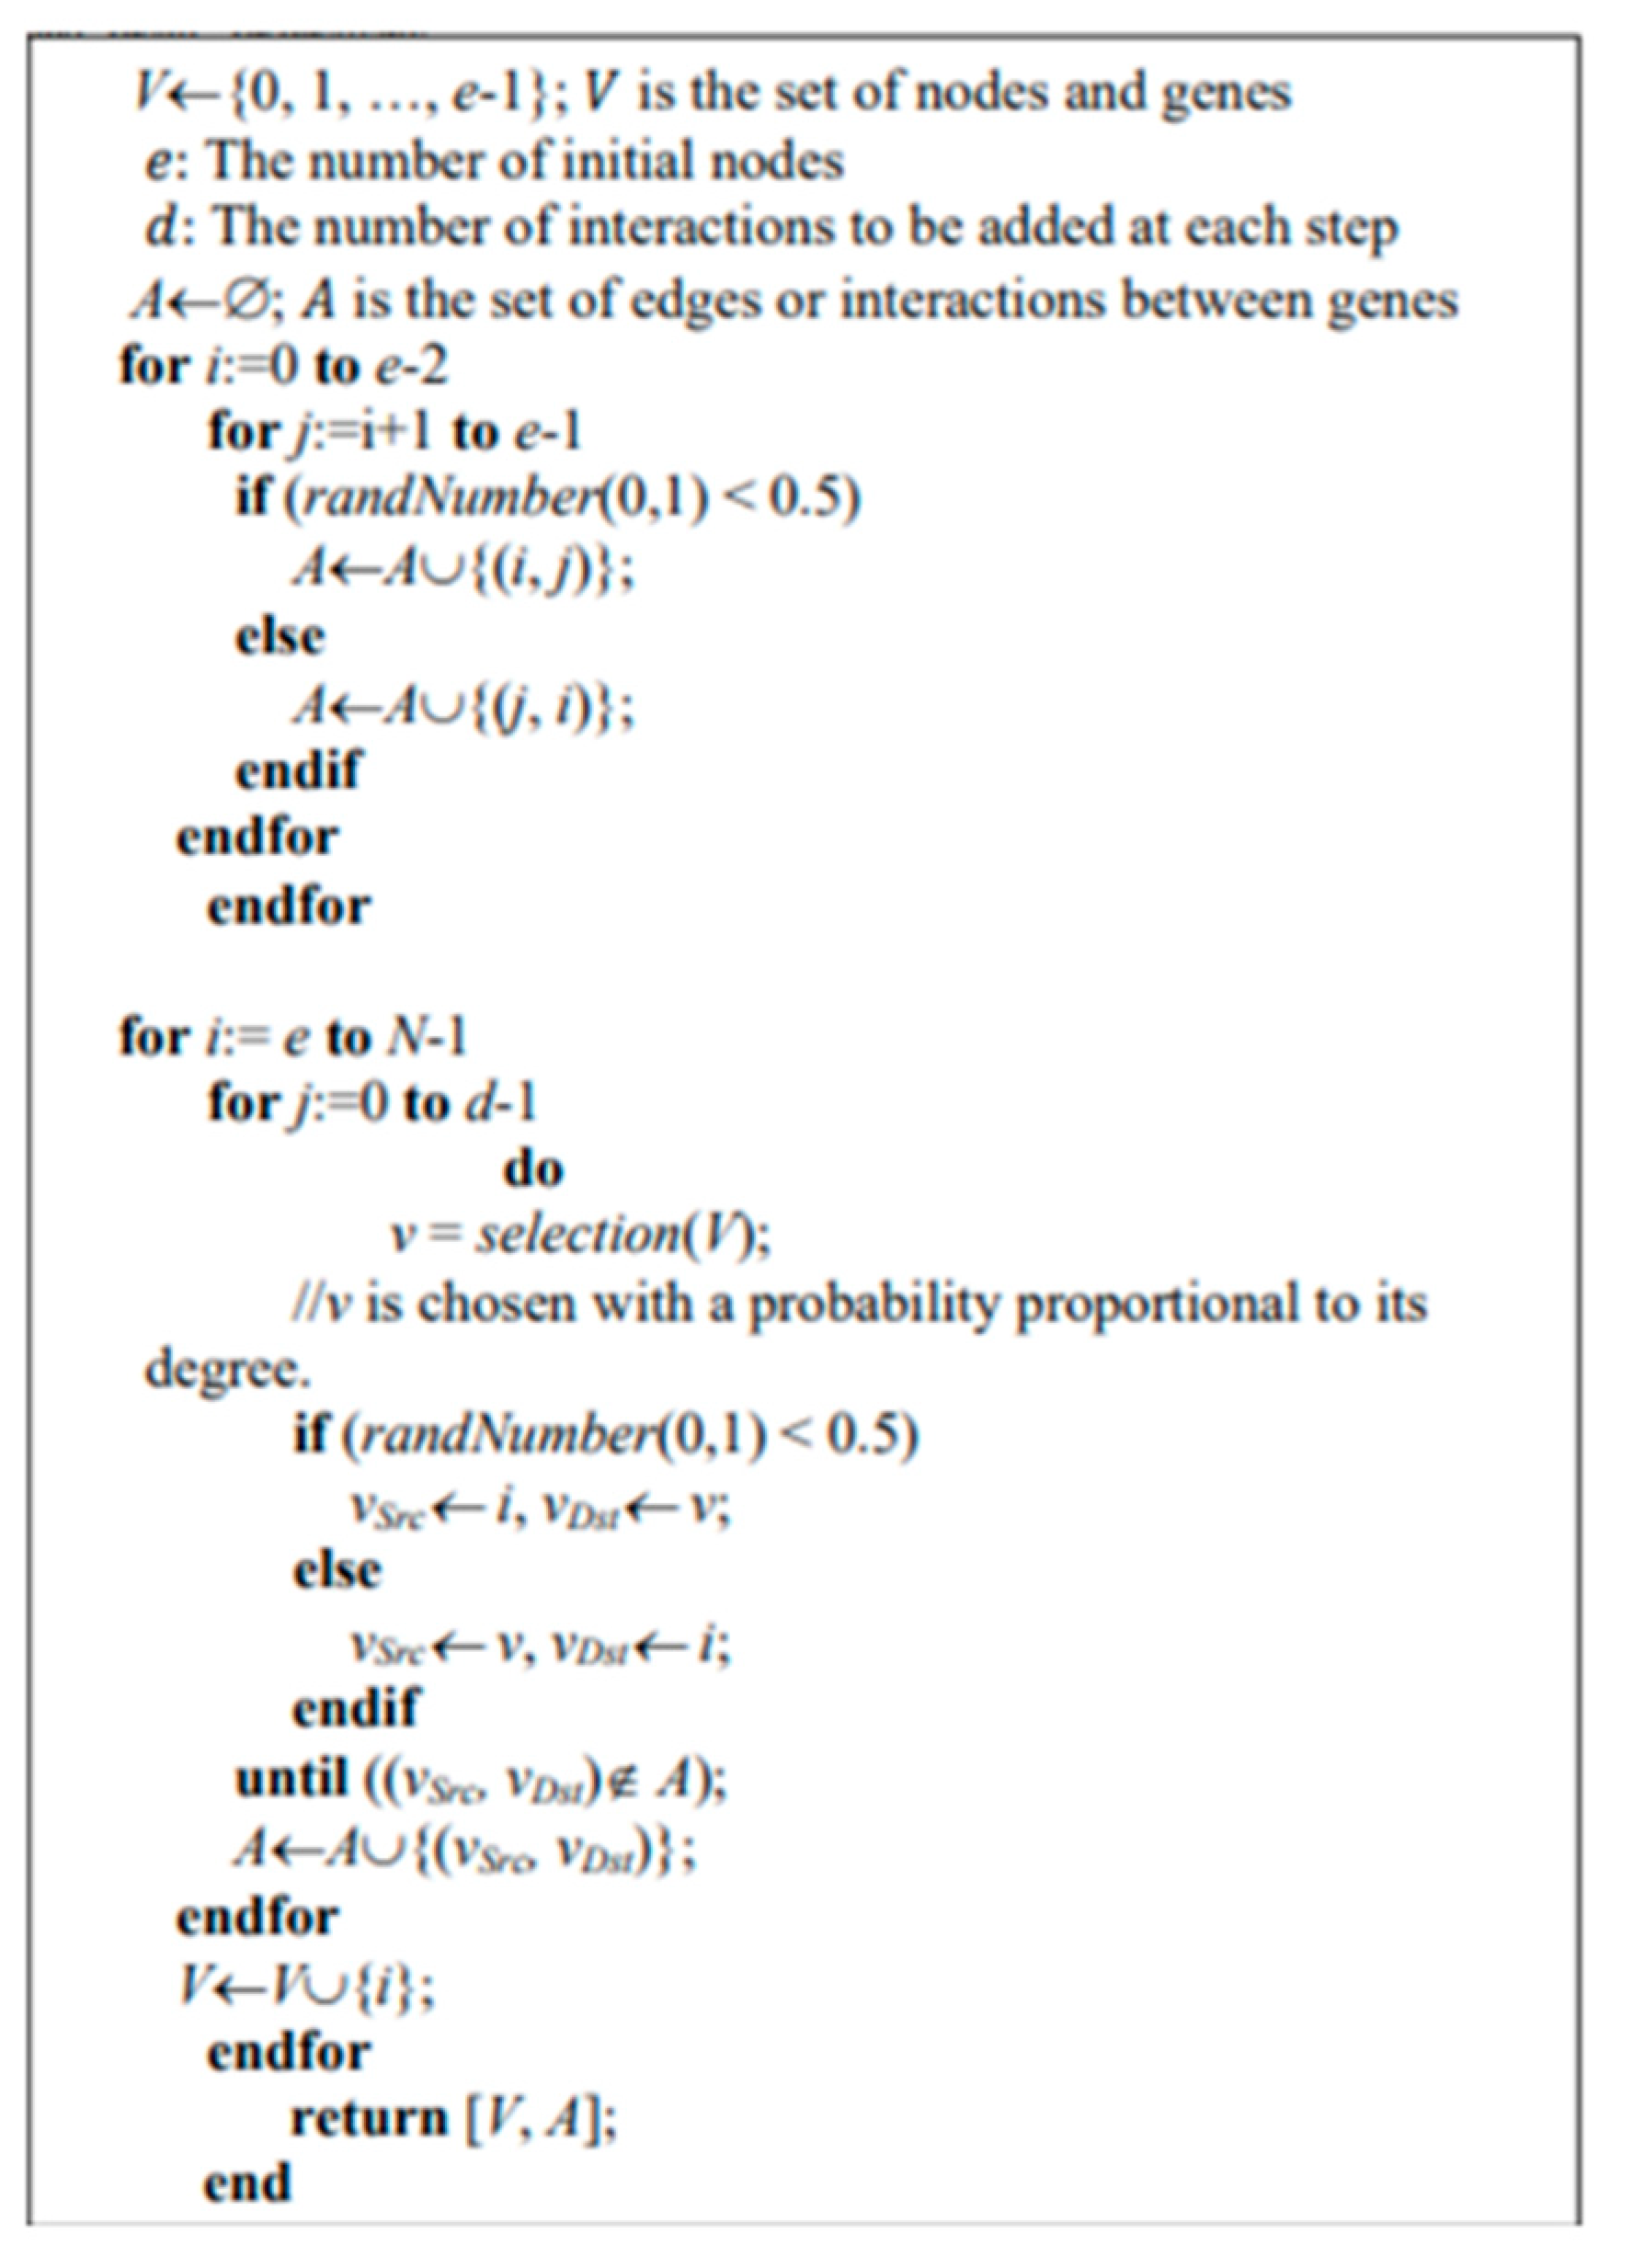
Figure 2.
Overall framework of LBF-MI.

Figure 3.
Comparisons of F-score between LBF-MI and other methods in BA random Networks.

Figure 4.
Gold standard structure of E. coli network consisting of 6 nodes and 9 interactions.
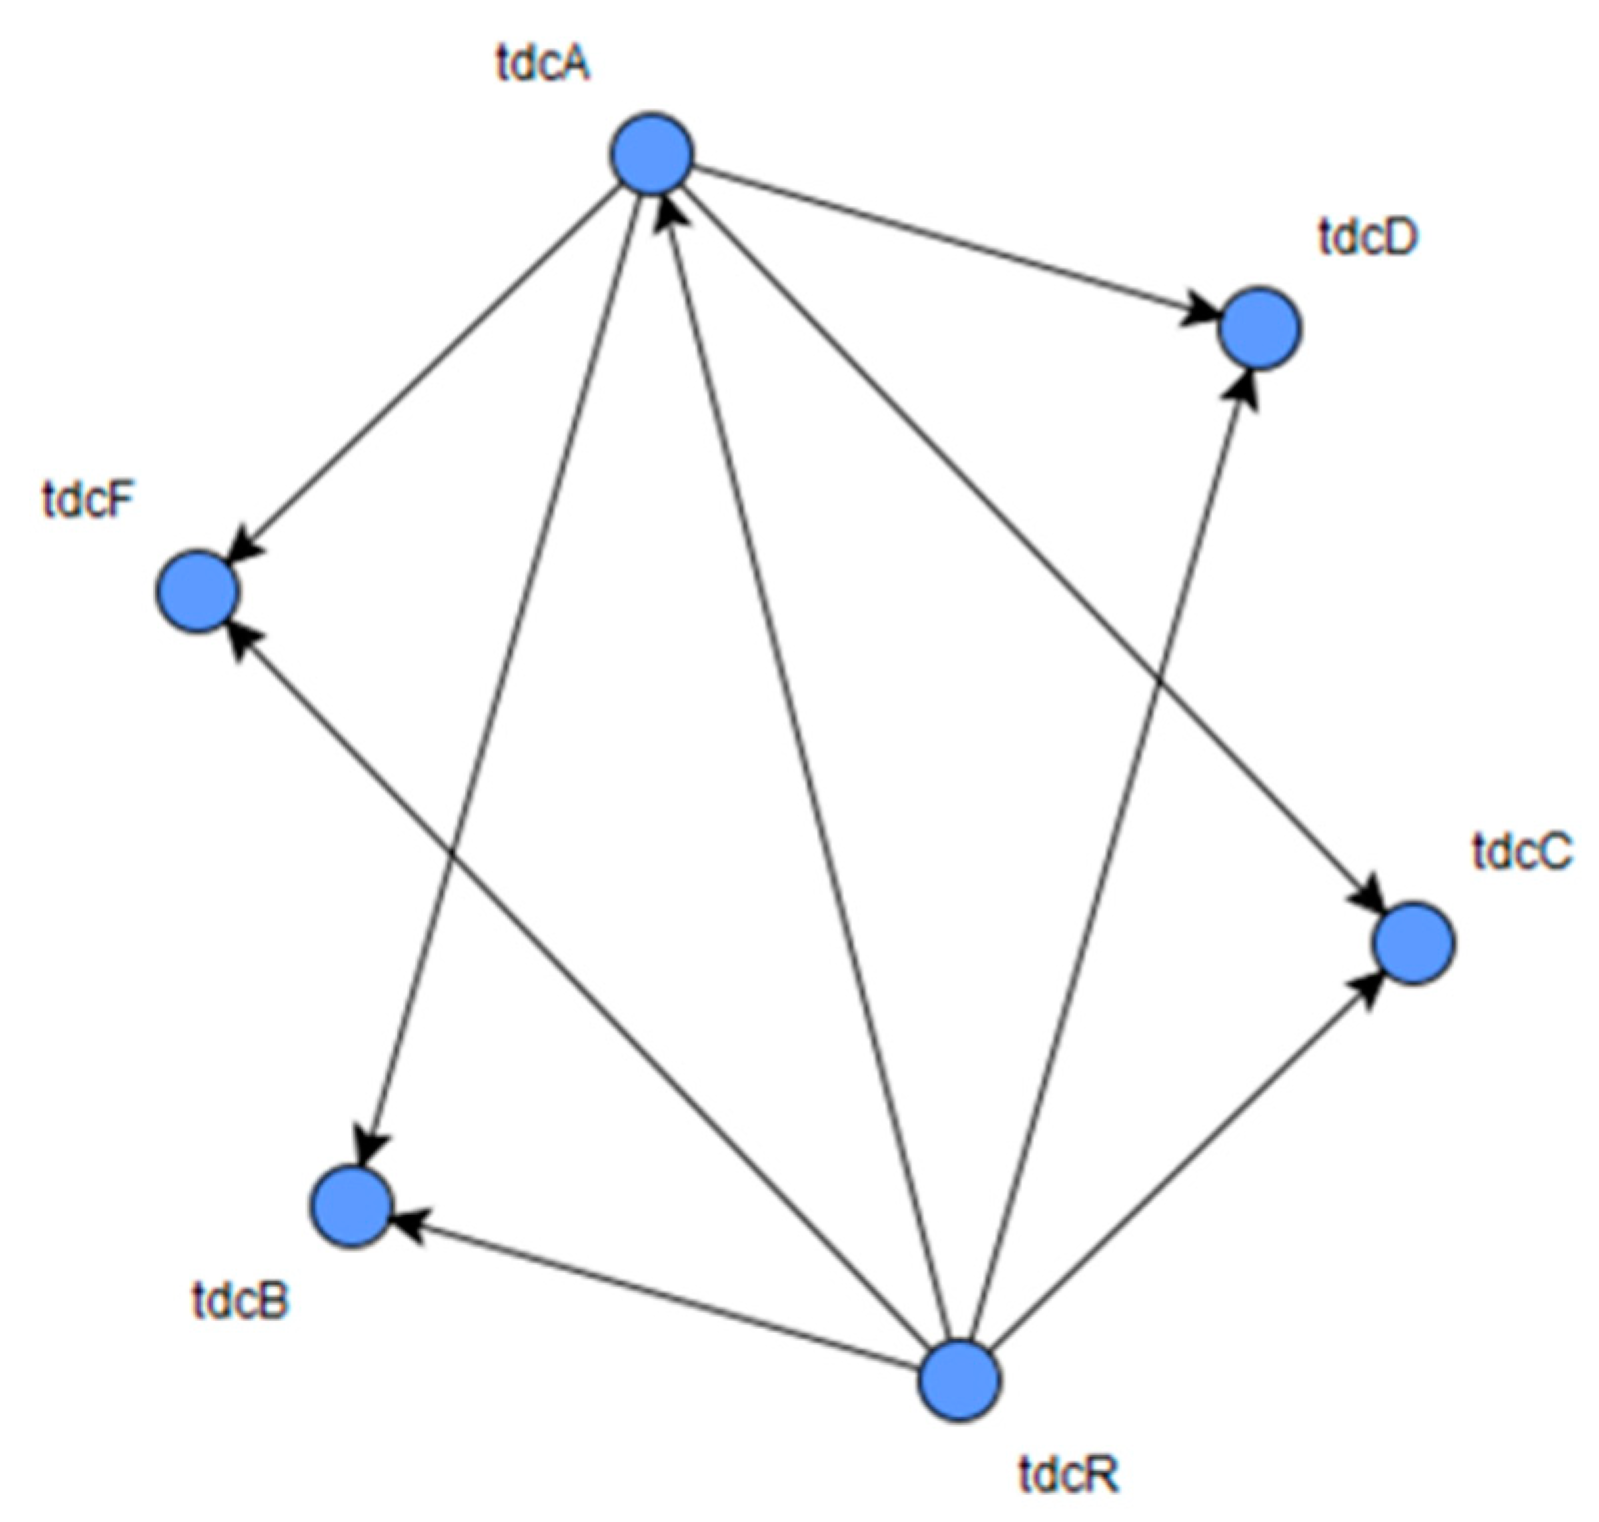
Figure 5.
Gold standard structure of SOS response E.coli regulatory network consisting of 6 nodes and 10 interactions.
Figure 5.
Gold standard structure of SOS response E.coli regulatory network consisting of 6 nodes and 10 interactions.
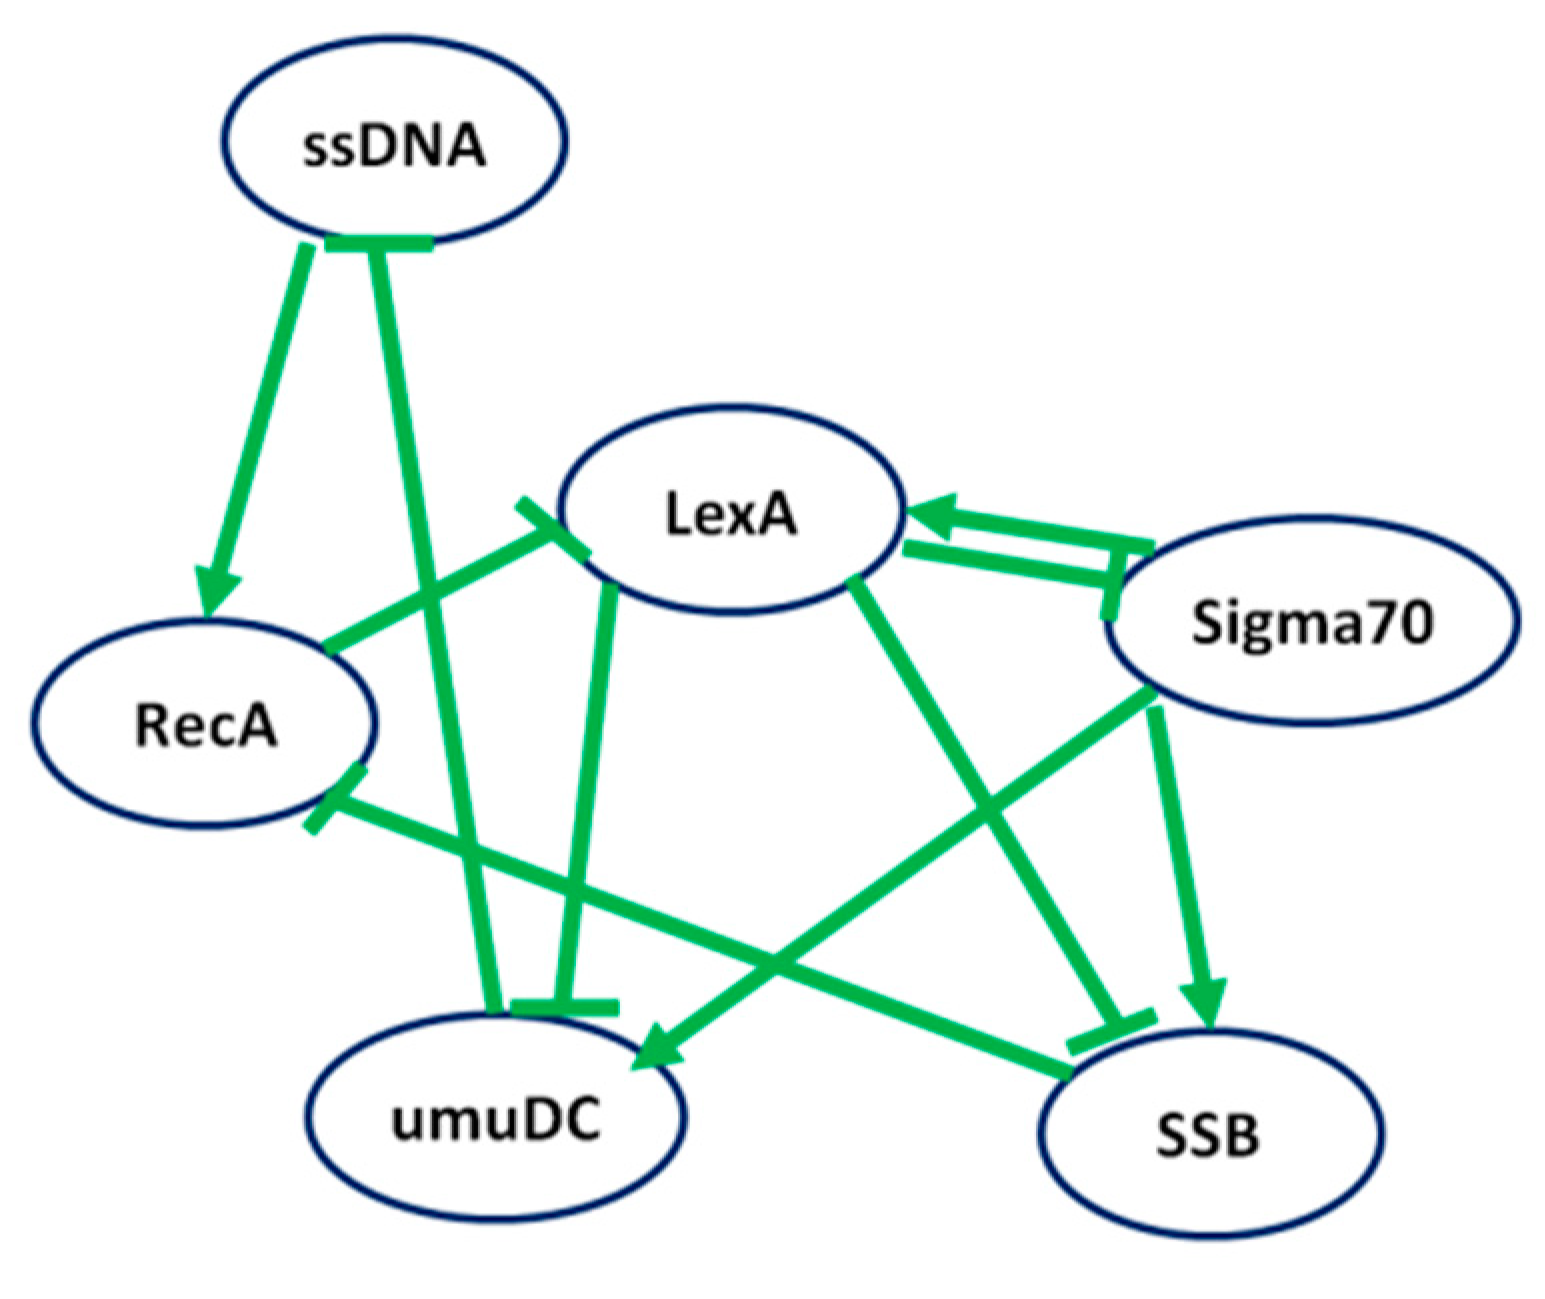
Figure 6.
Inference performance of LBF-MI for SOS response E. coli Regulatory Network.
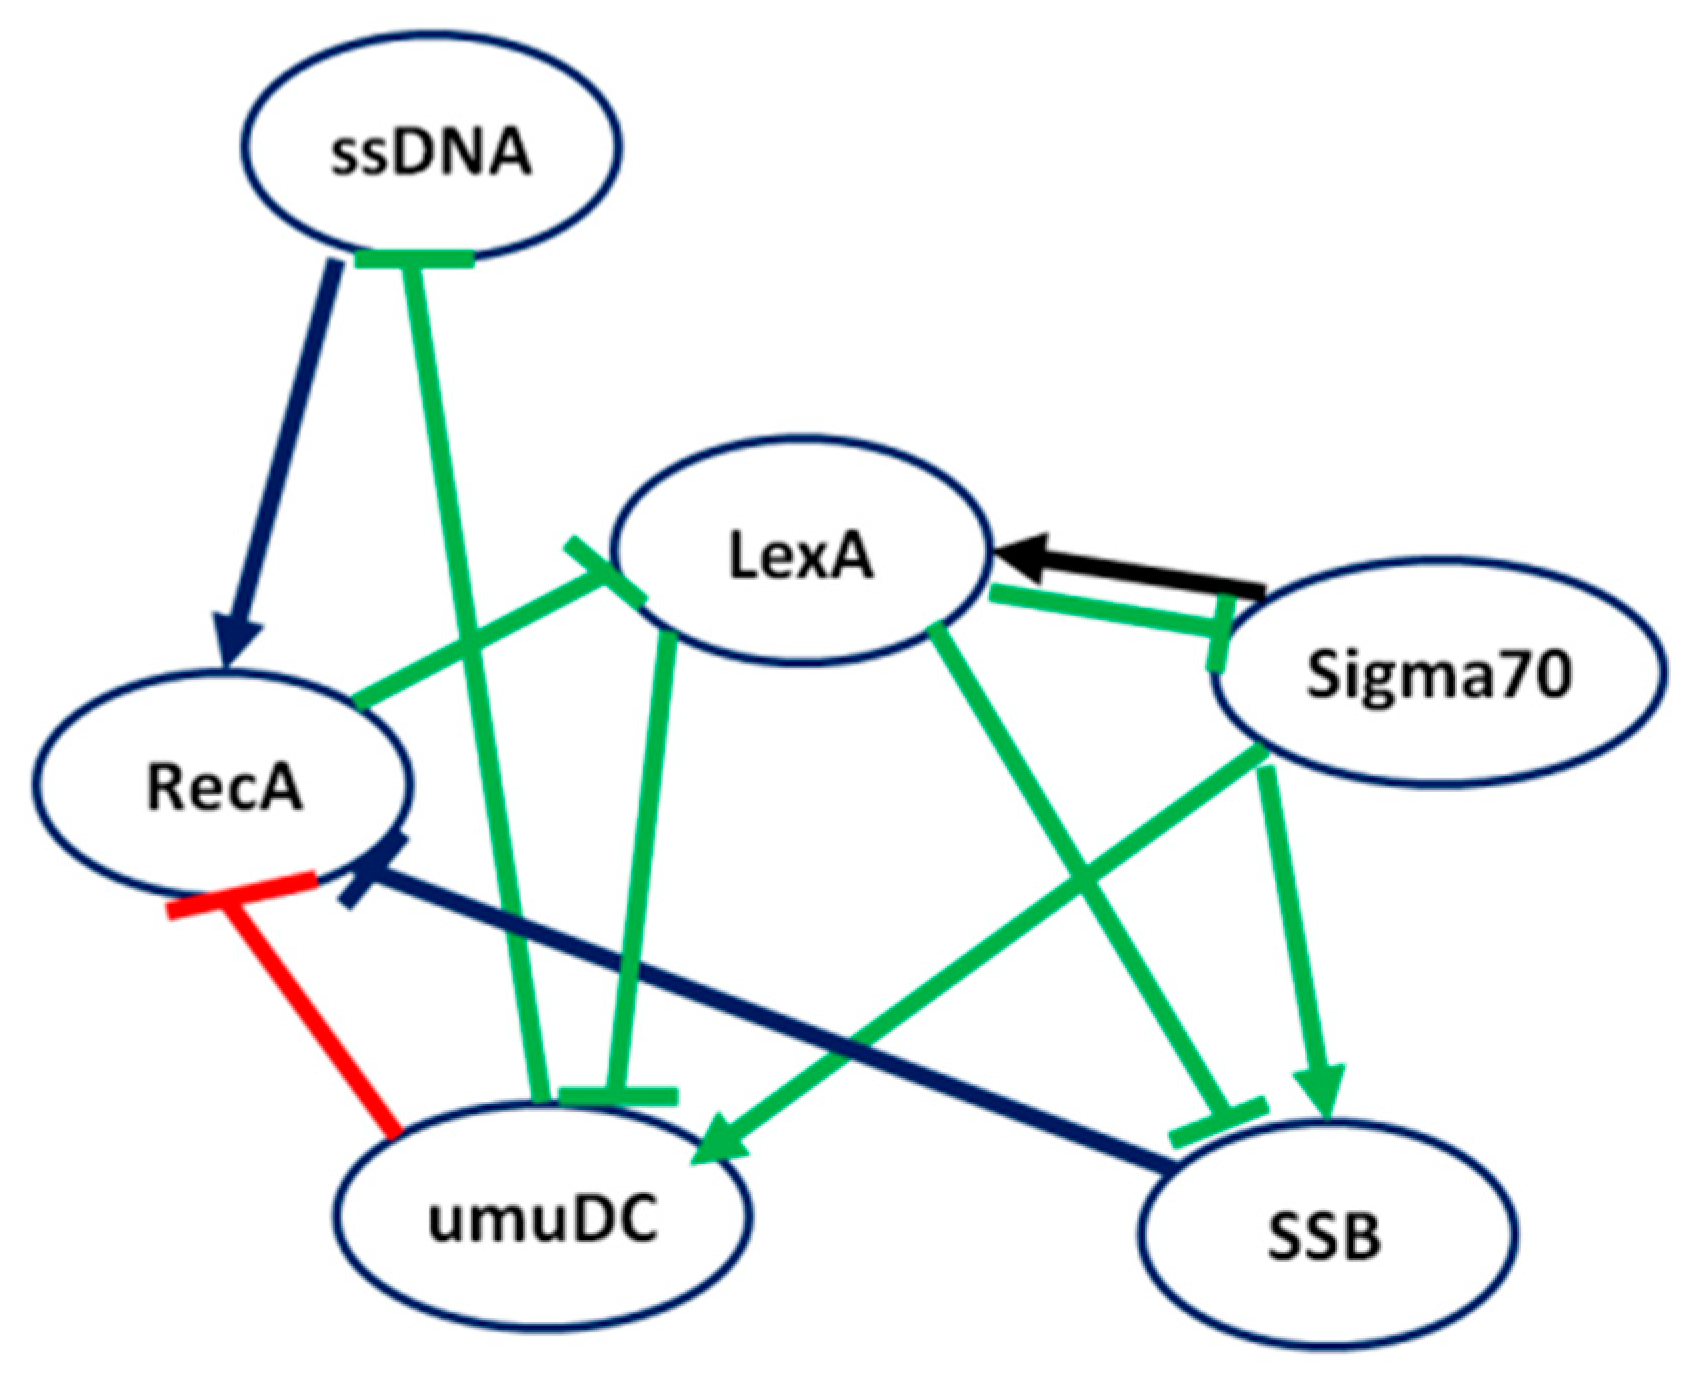
Figure 7.
Comparison of the running time among LBF-MI, RelNet and CLR.
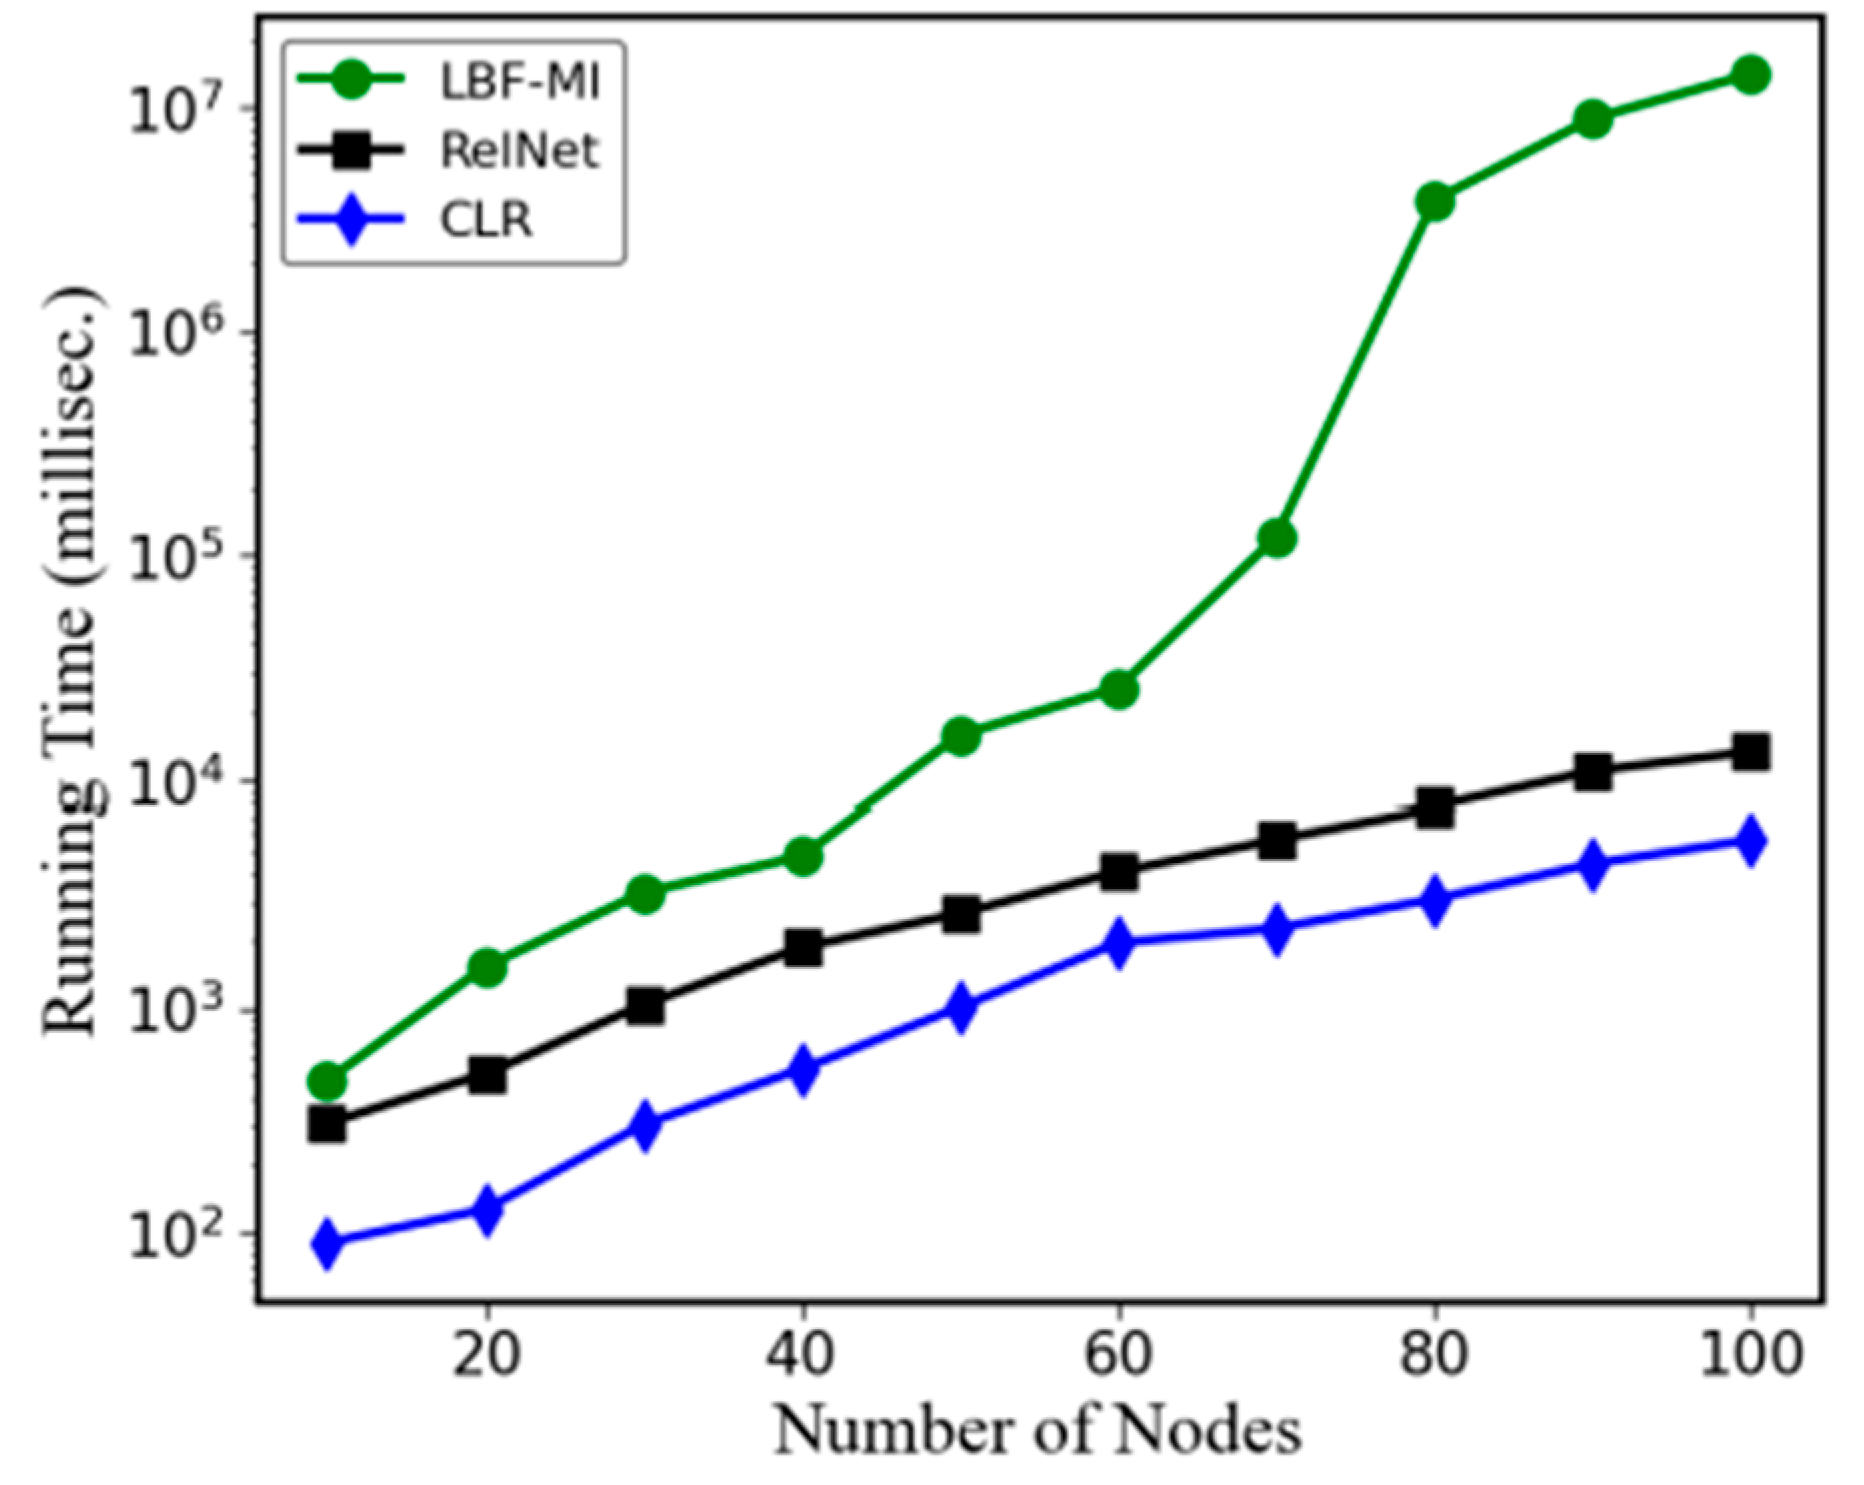

Table 1.
The F-score, precision and recall for LBF-MI, RelNet, and CLR over the regulatory network of the SOS response in E.coli.
Table 1.
The F-score, precision and recall for LBF-MI, RelNet, and CLR over the regulatory network of the SOS response in E.coli.
| Methods | F-Score | Precision | Recall |
|---|---|---|---|
| LBF-MI | 0.6000 | 0.4285 | 1 |
| RelNet | 0.1999 | 0.1888 | 0.2222 |
| CLR | 0.1904 | 0.1666 | 0.2222 |
Table 2.
The F-score, precision and recall for LBF-MI, RelNet, and CLR over the regulatory network of the SOS response in E.coli.
Table 2.
The F-score, precision and recall for LBF-MI, RelNet, and CLR over the regulatory network of the SOS response in E.coli.
| Time | ssDNA | RecA | LexA | Sigma 70 | UmuD C | SSB |
|---|---|---|---|---|---|---|
| 1 | 1 | 0 | 1 | 0 | 0 | 0 |
| 2 | 1 | 1 | 1 | 0 | 0 | 0 |
| 3 | 1 | 1 | 0 | 0 | 0 | 0 |
| 4 | 1 | 1 | 0 | 1 | 0 | 0 |
| 5 | 1 | 1 | 0 | 1 | 1 | 1 |
| 6 | 0 | 0 | 0 | 1 | 1 | 1 |
| 7 | 0 | 0 | 1 | 1 | 1 | 1 |
| 8 | 0 | 0 | 1 | 0 | 0 | 0 |
Table 3.
The F-score, precision and recall for LBF-MI, RelNet, and CLR over the regulatory network of the SOS response in E.coli.
Table 3.
The F-score, precision and recall for LBF-MI, RelNet, and CLR over the regulatory network of the SOS response in E.coli.
| Methods | F-Score | Precision | Recall |
|---|---|---|---|
| LBF-MI | 0.7000 | 0.8750 | 0.7000 |
| RelNet | 0.6666 | 0.7500 | 0.6000 |
| CLR | 0.5263 | 0.5555 | 0.5000 |
Disclaimer/Publisher’s Note: The statements, opinions and data contained in all publications are solely those of the individual author(s) and contributor(s) and not of MDPI and/or the editor(s). MDPI and/or the editor(s) disclaim responsibility for any injury to people or property resulting from any ideas, methods, instructions or products referred to in the content. |
© 2024 by the authors. Licensee MDPI, Basel, Switzerland. This article is an open access article distributed under the terms and conditions of the Creative Commons Attribution (CC BY) license (http://creativecommons.org/licenses/by/4.0/).
Copyright: This open access article is published under a Creative Commons CC BY 4.0 license, which permit the free download, distribution, and reuse, provided that the author and preprint are cited in any reuse.


