Submitted:
30 October 2024
Posted:
30 October 2024
You are already at the latest version
Abstract
Citizens Advice on Prescription (CAP), a Liverpool (UK) based service, provides welfare advice and link worker social prescribing support to people experiencing and at risk of financial or social hardship. CAP, which receives referrals from healthcare and third sector services, aims to improve service users’ financial security, health, and wellbeing. A mixed-method Social Return on Investment (SROI) analysis was used to evaluate the service. Between May 2022 and November 2023, a subset of service users (n=538) completed the Short Warwick-Edinburgh Mental Wellbeing Survey (SWEMWBS) at baseline and 2-month follow-up. Supporting quantitative and qualitative economic data was also collected (Feb 2023 - Feb 2024) through semi-structured interviews (n=16). Social value changes were generated using the change in SWEMWBS scores and social valuations from the Mental Health Social Value Bank (MHSVB). SROI ratios were calculated from change of social value against service provision costs. The mean service provision cost was £148.66 per person. The overall study reported a positive SROI return of £1: £3.40-£4.69. Results indicate that non-clinical support services, like CAP, can be an effective intervention to address the wider determinants of health and wellbeing.
Keywords:
Social Return on Investment (SROI)
; Citizens Advice
; socio-economic deprivation
; wellbeing
; non-clinical services for health
; signposting
; advice on prescription
1. Introduction
The association between socioeconomic deprivation and poor health and wellbeing is well established [1,2] Reduced access to resources which promote or sustain health within economically deprived populations is linked to both increased mortality and long-term health issues (morbidity) throughout the lifespan [3,4]. Financial insecurity, due to irregular, reduced, or low income (including long-term unemployment) is linked to increased vulnerability to mental distress and common mental health disorders, including anxiety and depression [5,6]. The post-2007 global economic crisis and the UK political response of austerity measures, including cuts to public funding, as well as the reduction in wages in real terms has had a prolonged negative socioeconomic impact [7] Financial pressures on the most vulnerable in society were also compounded with the major welfare changes implemented with the 2012 Welfare Reform act and the introduction of the Universal Credit system [8,9] The detrimental impact of these welfare reforms on chronic health conditions, including mental health and wellbeing, have been widely reported [10,11,12]. In more recent years, the socioeconomically vulnerable have been hit harder by both the health and economic impacts of the COVID-19 pandemic, as well as the rise in fuel prices and food costs driven by a combination of global events [8]. This combination of increased cost-of living pressures and reduced public funding, including reduced welfare support, are drivers of the expanding gap between the poorest and most affluent in UK society [9,10].
Socioeconomic disparity between the North and the South of the UK is also well documented [13]. with current differences in life expectancy of up to 20-years in females and 27-years in males between affluent Southern areas and deprived Northern areas of the UK [14]. Lower levels of life expectancy are particularly clustered in urban areas in the North of England, in major cities such as Liverpool, Leeds, Newcastle, Manchester, and Blackpool [15]. Liverpool has some of the highest overall levels of socioeconomic deprivation in the UK. Out of 317 English local authorities, Liverpool ranks 3rd in terms of health deprivation and disability, 4th for income deprivation and poverty, and 5th for employment deprivation [16].
The root cause of a significant proportion of health and social care usage in socioeconomically deprived populations is not only due to poor health or wellbeing, but also seeking advice on non-clinical issues including inadequate housing, welfare support, and debt or legal issues [17]. People living in socioeconomic deprivation often approach General Practitioners (GPs) or other healthcare professionals for help with these problems, which healthcare staff have neither the expertise nor time to provide [18,19].
In recent years local authorities, third sector and academics have explored using non-clinical support services, such as welfare and legal services, and social prescribing, alongside healthcare services to improve individuals’ health and wellbeing. Since the Legal Aid, Sentencing and Punishment of Offenders (LASPO) Act of 2012 there has been a significant reduction in free welfare legal services in the UK, with charitable organizations, including Citizen’s Advice, becoming the principal providers [20]. Demand for Citizen’s Advice services has more than doubled in the last four years, with crisis support, including heating payments and access to food banks, reflecting significant increased needs [21]. Social Prescribing, also known as community referral, was developed as a non-medical intervention to provide support for an individual’s social, emotional, and practical needs [22]. Social Prescribing provision is currently part of the NHS contractual requirement for Primary Care Networks (PCNs) where healthcare professionals refer patients to a social prescribing link worker, who helps identify a range of suitable non-clinical activities or support groups in the patient’s local community [23].
A range of small-scale studies have reported that welfare support interventions do improve financial security, with the monetary benefits being greater than the cost-of-service provision [24,25,26]. Many of these studies report improved mental health and reduced stress-related conditions for service users, although the quantitative impact of these mental health or wellbeing changes on the cost effectiveness of services has not been reported. Social prescribing interventions have also been linked to improvements in anxiety levels, wellbeing, and quality of life, with these changes reported to be cost-effective [27], and linked to reductions in healthcare use [22].
Citizens Advice on Prescription (CAP) is a novel intervention that combines both welfare and social prescribing support, which was developed as a collaboration between Citizen’s Advice Liverpool and Liverpool NHS, to help to alleviate poverty and address the underlying causes of ill health [28]. The service was initially trialed in GP surgeries (2014), has since been extended to all Liverpool primary care GP surgeries (2015) and secondary care services, including mental health services (2015), cancer services (2015), respiratory services (2018), and perinatal services (2021). CAP also enables organizations (including third sector) that support people experiencing mental distress to refer into the service. Once referred, the patient is contacted within two working days of referral, with a full assessment carried out within two weeks to identify issues and develop an individualized support plan for the service user.
The full CAP evaluation was a multi-methods study led by the University of Liverpool which included impact evaluation using instrumental variable analysis, and qualitative investigation of service users and stakeholders experience of the service [submitted; in preparation]. The SROI evaluation, led by Bangor University, evaluated the impact of the intervention on service users’ wellbeing and determined the cost effectiveness of the service.
SROI is a pragmatic type of social cost-benefit analysis (CBA) commonly used to evaluate complex interventions [29,30]. SROI allows a bottom-up stakeholder perspective and a mixed method approach to outcomes that are relevant to stakeholders, by allocating financial proxies for outcomes which often do not have market values [31]. This approach is recommended in His Majesty’s (HM) Treasury Green Book (UK) [32], with the framework for SROI described in the Cabinet Office ‘A Guide to Social Return on Investment’ [33].
2. Materials and Methods
The six key stages of SROI evaluation outlined in the 2012 Cabinet Office Guide [33], are discussed in the following sections.
Stage 1: identifying stakeholders
As the aim of the SROI evaluation was to evaluate the impact of CAP on service users’ wellbeing, service users were the only stakeholders included in this SROI evaluation. Eligible participants were patients (aged 16 or over) who were identified by health service professionals as being at financial risk or requiring social support and who were referred to CAP. Participants had capacity to provide informed consent, were able to speak English and were able to complete the SWEMWBS questionnaire during phone or in-person interviews with CAP staff.
Due to the wide range of referral routes into the service, sub-analysis was also carried out by the main referral pathways. Primary Care referrals were from GP surgeries, either by GPs or other health professionals. Secondary Care referrals were through the various secondary care referral pathways, as well as third sector mental health organisations in the Liverpool area. Perinatal referrals came through health visitors, midwives, children’s centres, and perinatal mental health services. The perinatal service also worked closely with the Non English Speaking Team (NEST) at Liverpool Women’s Hospital to provide the service for this particularly vulnerable population.
Stage 2: developing a theory of change model
Theory of Change models are a way to explore the linkages and underlying assumptions between inputs, outputs and expected outcomes of an intervention [34]. The theory of change model shown in Figure 1 was developed for the CAP trial by the University of Liverpool research team (in publication). Primary outcomes predicted from the model were reduced mental health problems, and improved overall well-being.
Stage 3: calculating inputs
Cost for CAP service provision were the only costs included in this evaluation. Service costs were calculated as average service costs per service user, using total service costs divided by the total number of service users for the financial year 2022-23 (the only full financial year during the evaluation).
Stage 4: evidencing and valuing outcomes
The outcome for the SROI was the improvement in service user’s mental wellbeing, measured using the SWEMWBS questionnaire. SWEMWBS measures a range of aspects that affect mental wellbeing, including levels of stress, social connection, and self-confidence [35]. The questionnaire consists of seven statements; I’ve been feeling optimistic about the future; I’ve been feeling useful; I’ve been feeling relaxed: I’ve been dealing with problems well; I’ve been thinking clearly; I’ve been feeling closer to other people; I’ve been able to make up my own mind about things. Participants are asked to answer, based on how they have been feeling in the last two weeks, giving a rating for each question of 1 (none of the time) to 5 (all the time), with a possible overall score range of 7 to 35.
Mental wellbeing valuation using the SWEMWBS questionnaire is an established and robust method for estimating the financial (social) value of health and wellbeing-related outcomes that does not have a market value [32]. The Mental Health Social Value Calculation is used to allocate financial valuations to the SWEMWBS total score, with changes in SWEMWBS scores at baseline and follow-up used to calculate change in social value generated [36].
SWEMWBS questionnaires were collected by CAP staff. Service users were asked if they consented to be part of the evaluation and complete a baseline SWEMWBS questionnaire in their initial CAP interview. They were also asked if they agreed to be contacted after approximately 2 months to complete a follow-up questionnaire. Follow-up contact was attempted up to 3 times. SWEMWBS questionnaires were completed predominantly by phone, with face-to-face interviews also used for some referrals. Only service users that completed both baseline and follow-up questionnaires were included in the SROI evaluation.
Stage 5: establish impact
When evaluating complex interventions and/or interventions in complex systems, it is important that steps are taken to reduce the risk of overclaiming the benefits of the intervention. With SROI evaluations this is addressed by considering the following factors:
Deadweight: the acknowledgement that there is likely to be a proportion of the reported outcomes that would have happened anyway.
Attribution: the proportion of the outcome directly attributed to the intervention by participants, rather than other factors in their lives.
Displacement: whether participants had to give up any other activities that could have contributed to the outcomes in order to take part in the intervention.
SROI evaluations also consider the drop-off of the intervention, i.e., a measure of how long the impact of the intervention is expected to last. A drop off measure of 1-year time frame was estimated for this evaluation, based on previous studies, and validated by the additional health economic questions included in this study.
A 27% standard deadweight percentage was subtracted from the social value calculated from the change in SWEMWBS scores, as recommended by established methodology [36]. Levels of attribution, displacement, and drop off were measured by the inclusion of additional health economics questions that are provided in Appendix A, as supplementary material. This data was collected alongside the qualitative investigation of service users experience of the CAP service. Reported levels of attribution and displacement were used to calculate a sensitivity range for the SROI evaluation. The drop-off measure was used to validate the 1 year drop-off range estimated for this SROI evaluation.
Stage 6: calculating the SROI
SROI ratios were calculated to compare the SWEMWBS based social value change per participant, compared to the service cost per participant, with the SROI ratio expressed as the social value created per GBP 1 invested in the service, see Equation 1
SROI ratio = Social value change per participant
Cost of CAP service per participant
Sensitivity analysis was also carried out to estimate the social value change estimated by participants to be due to the CAP service, as opposed to any other factors (measure of attribution or displacement), see Equation 2.
SROI ratio = Social value change reported per participant -(% attribution + displacement)
Cost of CAP service per participant
3. Results
3.1. Demographics of Service Users and SWEMWBS Responses
SWEMWBS data was collected over a 20-month period (May22-Nov23). During this time, there were a total of 13,294 CAP service users, of which 2,133 (16%) completed SWEMWBS at baseline, and 538 (4%) completed SWEMWBS at baseline and follow-up. Only the 538 respondents who completed both baseline and follow-up questionnaires were included in the SROI analysis, but total service user and baseline SWEMWBS respondent demographics are also provided, as comparators (see Table 1).
Primary Care referrals accounted for 84.0% of total service users, with Secondary Care referrals making up 7.5% and Perinatal referrals making up 8.5% of service users. Both baseline SWEMWBS respondents and SROI respondents had comparative levels of Primary Care referrals (around 82%) but were under-representative of Secondary Care referrals (around 5%) and over representative of Perinatal referrals (around 12%).
Females made up a higher ratio of total service users (1:1.6) in all pathways. This higher service usage may reflect that women are more likely to be eligible for the CAP service due to financial or social hardships. The ratio of women was also incrementally higher in baseline SWEMWBS respondents and SROI respondents (1:2.0 and 1:2.1, respectively), meaning women are over-represented in the SROI evaluation. The ratio of white: BAME ethnicities was consistent (at around 1:0.2) across Primary Care and Secondary Care referrals, which is in line with reported ethnicity of the Liverpool population (of 84%:16% white: BAME) [37]. With Perinatal referrals, BAME made up around half of all service users (with a ratio of 1:1.1), reflecting that many service users were referred through the Non-English Speaking Team (NEST) service. However, the ratio of BAME participants was lower in the baseline SWEMWBS and SROI respondents (at 1:0.7 and 1:0.8, respectively) indicating that BAME perinatal service users were under represented in the SROI evaluation of Perinatal services.
The average service user age was 51.7 (±17.0), with the age of Primary Care referrals (52.4±17.1), being marginally higher than Secondary Care referrals (47.9±10.1). Perinatal referrals were younger (32.3±6.7), as expected for this cohort. The age of baseline SWEMWBS respondents and SROI respondents was generally in line with total service users.
Baseline SWEMWBS scores for the Primary Care route were slightly higher than for Secondary Care referrals (18.1 and 17.1, respectively) and were similar for SROI respondents (19.0 and 16.9, respectively) indicating that the baseline wellbeing of those that were included in the SROI evaluation were representative of the larger number of baseline SWEMWBS respondents. The baseline SWEMWBS score for Perinatal care was notably higher, at 24.7 and marginally higher at 25.9 for SROI respondents. Only Primary Care and Secondary Care referrals reported a change from baseline to 2-month follow-up (an increase of 0.9 and 1.5, respectively), with Perinatal referrals reporting no change (0.0).
3.2. Total Service Costs and Average Service User Costs
Total CAP service costs for the financial year 2022-23 were £1,254,417, with the majority (89%) covering staff costs, see Table 2. Overhead costs of £126,646 (10%), included office costs, as well as room hire in GP surgeries (£10,800) to provide the CAP service in primary care locations. Also included were community partner payments (£29,600), a nominal support payment to the 5 social prescribing services most referred to by CAP link workers each month. Routine data administration and evaluation costs made up £10,840 (1%) of service costs.
During the period April 2022 to March 2023, there were 8,438 CAP service users. The average service cost per service user was calculated by dividing total costs for the 2022/2023 financial year by the number of service users, to give an average service cost per service user of £148.66.
3.3. Calculating the Social Value Change and SROI Ratios
Due to the comparatively large number of service users included in this SROI evaluation (n=528), the total social value change, along with mean changes in social value are reported in Table 3. Individuals’ social value changes are also available from the corresponding author, on request.
A standard 27% was deducted from the sum of social value change to account for displacement (what would have happened anyway, regardless of the CAP intervention). This was then divided by the number of service users per pathway, to give average social value change per service user for each of the service pathways, as well as the overall service.
There was a positive change in social value (of £697.52 per person) reported for the overall service, with Secondary Care referrals reporting the largest average social value change (£1,802.75), followed by Primary Care referrals (£701.63). and Perinatal referrals (£133.73).
SROI ratios were then calculated by dividing the average social value change per person by the average service cost per person. The overall service gave a positive SROI return of £1:£4.69 (i.e. £4.49 of social value was created for every £1 invested in the service). Both Primary Care and Secondary Care referrals gave a social value gain for each £1 spent on the service (£1:£4.72 and £1:£12.13), whereas with Perinatal referrals, the social value gain was less than the cost of service provision (£1:£0.90).
3.4. Sensitivity Analysis: Consideration of Attribution and Displacement
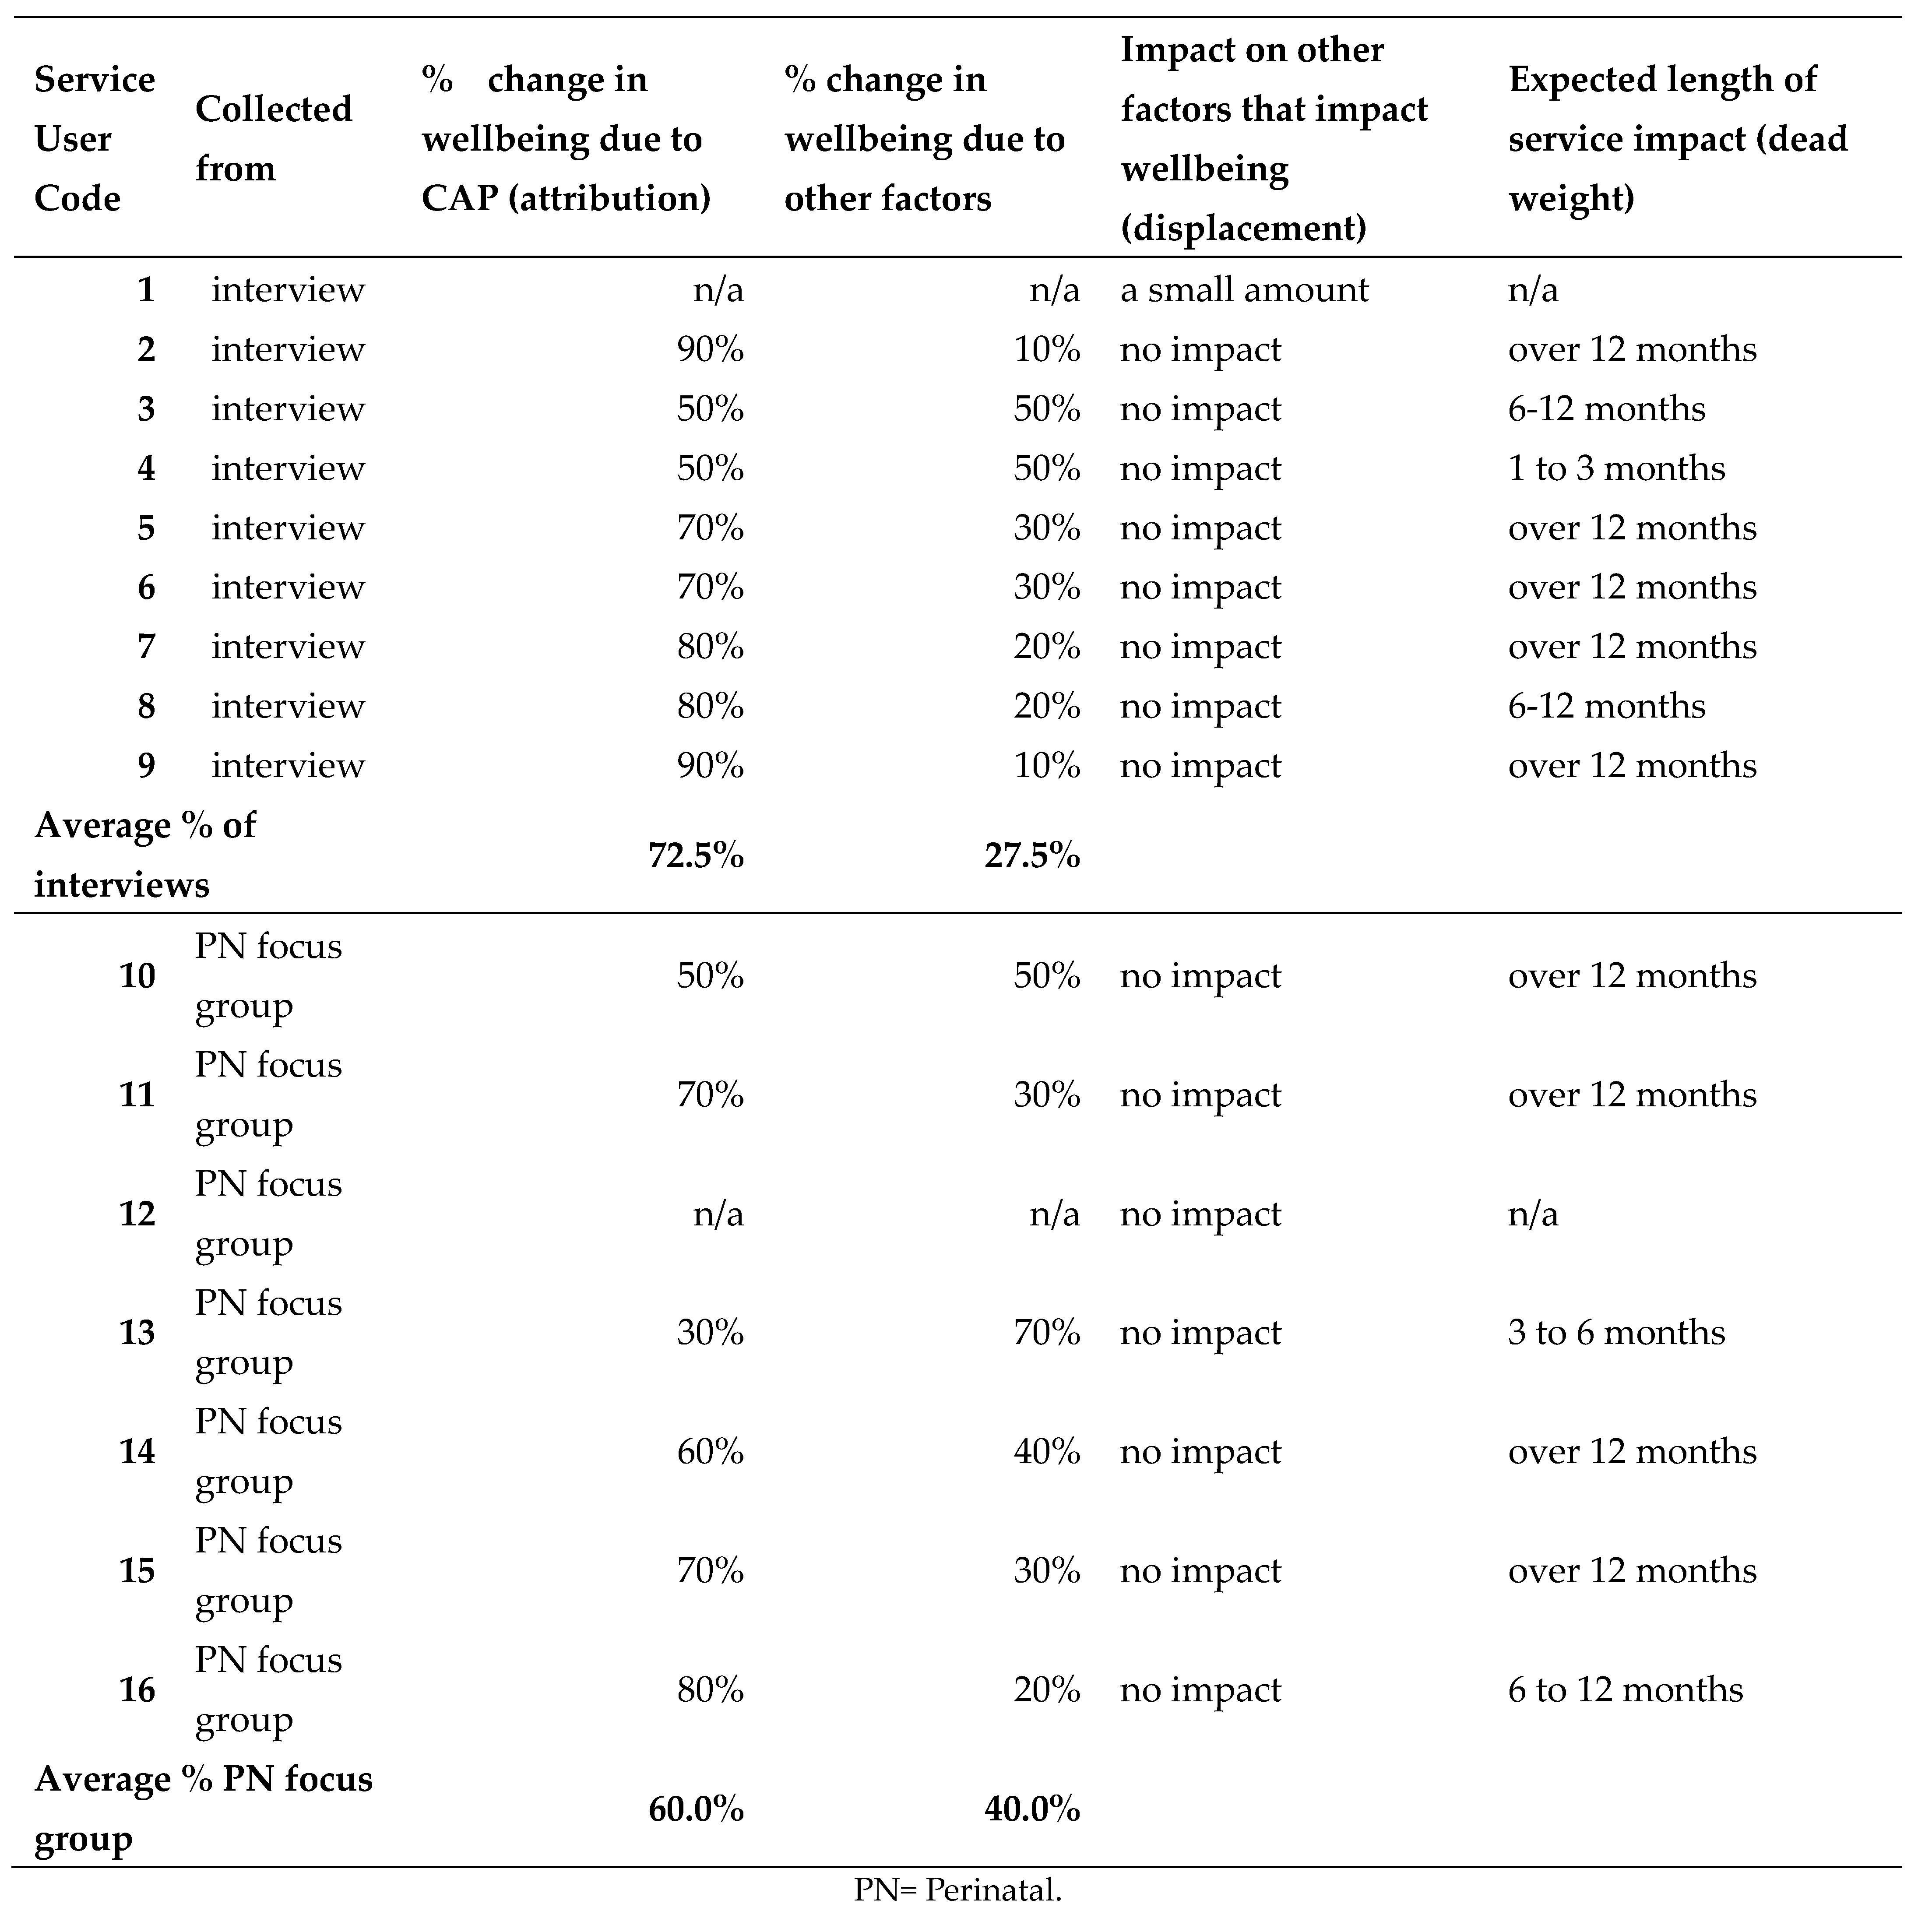
Information on attribution, displacement and drop off was collected as part of the semi-structured 1 to 1 qualitative interviews (n=9, out of 13 possible interviewees). An additional focus group was also run to collect information from Perinatal referees (n=7), as no perinatal referees were recruited for 1 to 1 interviews.
Of these 16 service users, 14 reported the percentage of change to their wellbeing they attributed to the service (attribution), with participants across Primary Care and Secondary Care reporting on average a higher level of attribution (72.5%) compared to those using the Perinatal referral pathway (60.0%). The level of attribution was used to calculate the sensitivity analysis for the SROI.
All 16 respondents reported on displacement i.e. the impact of the service on other factors that might impact their wellbeing. Only 1 person reported that they had had to give up other activities that may have affected their wellbeing to take part in the service, with the level of this impact reported as being small. This indicates that there was negligible displacement due to the service, so an adjustment for displacement did not need to be included as part of the sensitivity analysis.
Of the 14 service users who reported on expected length of service impact (drop off) the majority (12) thought that the impact would be for 6-12 months or over 12 months, which was in line with the 1-year time horizon used for the SROI evaluation. All individual data on attribution, displacement and drop off are provided in supplementary information in Appendix A.
As the number of interviewees reporting on attribution (n=14) represented a very small number of SROI respondents (n=538), rather than assuming all service users would report similar levels, the attribution levels reported were used to calculate a sensitivity range for the SROI ratios of between the impact reported by the interviewees (of 72.5% for Primary and Secondary referrals, and 60.0% for perinatal referrals) and no impact (100%). So, the level of social value generated for the Primary Care and Secondary referral pathways, used a sensitivity range of 72.5-100%. This was also used for the overall service, as Primary and Secondary Care pathways make up over 90% of all referrals. Perinatal referrals used a sensitivity range of 60-100%. When these sensitivity ranges are applied to the SROI ratios they give an overall range for the whole CAP service of £1:£3.40-4.69, with the two referral pathways reporting a positive SROI return having a range of £1:£3.42-4.72 for Primary Care referrals and £1:£8.79-12.13 for Secondary Care referrals. Perinatal service SROI gave a sensitivity range of £1:£0.54-£0.90.
3.5. Qualitative Feedback on the CAP Service
Interview participants also had the opportunity to give some qualitative feedback on the service as part of the additional health economic questions. Feedback was that the service was highly valued, convenient and they intended to continue to use the service for further support. They felt that it put them in a better position to take up other opportunities and some mentioned that they didn’t realise how stressed they were until the pressure was relieved. All but one service user who provided qualitative feedback (n=14) reported feeling that their wellbeing had improved since using the service, with the improvement mainly due to using the service.
However, participants also highlighted ongoing concern about the impact of future financial stressors, including PIP reviews, redundancy risks and further financial strain over school holidays, indicated that ongoing access to CAP is likely to be important aspect of the service for some service users.
4. Discussion
4.1. Overall Findings
The findings of this study report that the CAP service, using a combination of welfare advice and link-worker social prescribing support, does improve service users’ wellbeing as measured by the SWEMWBS questionnaire, with an overall positive SROI return of £1:£3.40-£4.69 reported. A novel finding of this study is that there is a notable difference in SROI return by service referral pathway. Although Secondary Care referrals gave the highest SROI return (£1:£8.79-£12.13), the number of respondents was low (n=31) and came from of a disparate range of secondary referral services, with around half coming from mental health services, but referrals also from cancer and respiratory services. Because of this, further work is required to understand the potential of the service through the various Secondary Care services currently referring to CAP. The level of SROI reported by Primary Care referrals (£1:£3.42-£4.72) is particularly important, as 84% of CAP service users are referred through this pathway. Although there is an over-representation of female respondents in all SROI included referrals, the demographics of SROI included Primary Care referrals was generally in line with total service Primary Care referrals, indicating that the included respondents are likely to be representative of total service users and this level of return is likely to be a realistic measure of total CAP service referrals through this pathway.
In comparison, Perinatal referrals reported SROI ratios of less than 1, as the Social Value gain was less than the service costs (£1:£0.54-£0.90). Perinatal referrals differed from Primary Care and Secondary Care in having comparatively high SWEMWBS scores at baseline and reporting no change at follow up. There could be various explanations as to why we see very little change in wellbeing in the perinatal group. A decline in wellbeing in the absence of the intervention might be expected since these service users have generally experienced adverse social welfare events just prior to receiving support. Also, other social conditions were declining for families during this period due to the cost of living crisis. These service users are also going through the experience of having a new child and this is likely to have influenced their wellbeing over time, particularly if post-natal depression or family disharmony arises . One factor highlighted by the CAP team was the disproportionate level of inadequate housing issues experienced by Perinatal referrals (29%) compared to all CAP service users (12%) (data from CAP 2022-23 figures, personal correspondence). Qualitative research also highlighted that housing issues were experienced both by Perinatal referrals and patients with young families referred though the other pathways (data in publication). These were often long-term issues, with patients reporting that although the CAP service was invaluable in providing support and driving improvements in living conditions, that these changes and any linked improvement in wellbeing tock considerably more time than the two month follow up period used in this study. So, it could be that if this group’s wellbeing would have declined in the absence of the intervention, that the maintenance of wellbeing reported in this study due to the intervention was a positive outcome. However, more data over a longer period of time is needed from this group to verify the impact of the intervention.
4.2. Comparison with Previous Studies
The SROI findings reported here are in line with previous UK studies on welfare advice or social prescribing services. Three previous SROI studies on Citizens Advice or similar welfare services reported ranges of £1:£3.31, £1:£6.01 and £1:£6.23 [27,38,39]. Evaluations of social prescribing have been reported to be cost-effective [27]. A community hub for chronic conditions in North Wales reported a positive SROI return of £1:£2.60-£5.15 [40]. A small study of a social prescribing scheme receiving referrals from GP practices in London also reported a wellbeing improvement with an associated positive SROI return of £1:£3.51-£8.56 [41]. So, the findings from this evaluation corroborate the evidence from previous smaller studies, that welfare and social prescribing interventions produce positive social value by improving service users’ mental health and wellbeing.
4.3. Strengths of the Study
The study was a natural experiment, with the intervention taking place in a complex environment. Economic evaluations alongside natural experiments are becoming a more recognised and needed approach to addressing the socioeconomic determinants of health and the evaluation of services to mitigate adverse effects of socioeconomic hardship [31,42]. The study investigated a novel non-clinical intervention to improve wellbeing in socioeconomically disadvantaged populations, and we report that this approach is an effective and cost-effective intervention, with the change in wellbeing and the associated Social Value change being greater than costs for the service. We also highlight that the application of this non-clinical intervention had significant variation across referral pathways, which is an important consideration for future service focus and potential future roll out of these types of services. As our evaluation included a relatively large sample for a SROI evaluation, and SROI participants were demographically representative of all service users, it seems likely that the findings are reliable. In addition, as the SROI was part of a multi-evaluation approach we are able to represent data in the various ways necessary for a complex intervention, giving a more nuanced understanding of its impact.
4.4. Weaknesses of the Study
Although the overall sample size was relatively large for an SROI evaluation, we recognise that this only represented 4% of total service users in this period with Secondary Care referrals under-represented and Perinatal referrals overrepresented. The disparate nature of secondary services meant that it was not possible to determine if the positive return reported for this pathway would be comparable for all secondary services. We also acknowledge that the 2-month follow up period used in this study was too short to capture many of the long term issues and associated wellbeing changes that are experienced by the Perinatal referrals. However, the major limitation of this study is that the intervention tock place in a complex environment with no control group. The SROI methodology interprets change from baseline as a causal effect of the program, with the assumption made that in the absence of the intervention there would have been no change in SWEMWBS score. This is probably an unrealistic assumption. People are referred to the CAP service because something has gone wrong, often quite severe social welfare issues. It is implausible that wellbeing would have been unchanged following such issues in the absence of the intervention. So, no change in wellbeing or even a small decline in well-being could still be consistent with a large program effect on well-being.
5. Conclusions
CAP, a welfare and social prescribing support service, can create positive social value through improvements in self-reported wellbeing in people who are experiencing or at-risk of financial or social hardship. At a time of increasing socioeconomic disparity in the UK, analysts need to widen their evaluative space using natural experiments such as that reported here.
Supplementary Materials
to be added Supplementary Material 1= additional health economic questions. Supplementary Material 2 = full list of social value pre- and post- for all SROI respondents. Supplementary Material 3 = reporting on levels of Attribution, Displacement and Drop-off.
Author Contributions
The study concept, study design and evaluation methodology were conceived by NH, RTE, RG, MG and VE. RG conducted data analysis and the first draft of the manuscript. BB, RP and CM facilitated access to the data, supported the coding of the data and provided background information on the intervention implementation and helped with the interpretation of the results. BB supported methodological discussion. KA and RAdC provided additional support in collecting qualitative data and interpretation of qualitative interviews as well as facilitating focus groups. All authors provided edits and critiqued the manuscript and all authors have read and agreed to the published version of the manuscript.
Funding
The project was funded by NIHR grant number NIHR202465 and The Health Foundation , grant number Ref: 425315. MG and BB are part funded by the National Institute for Health and Care Research Applied Health Collaboration North-West Coast (NIHR ARC NWC). The views expressed I the paper are those of the authors, not necessarily those of the National Institute of Heath and Care research (NIHR) or the Department of Health and Social Care (DHSC).
Institutional Review Board Statement
The study was conducted according to the guidelines for the Declaration of Helsinki and approved by Ethics Committee of the University of Liverpool Central University Research Ethics Committee C (protocol code 10313 with date of approval 13/06/2022).
Informed Consent Statement
Informed consent was obtained from all subjects involved in the study.
Data Availability Statement
all data has been made available within the paper or as supplementary material.
Acknowledgments
A special thanks to the CAP team for all survey data collection and ongoing discussions throughout the project, without which this evaluation would not have been possible. Many things to the wider research team at the University of Liverpool for their support and collaboration throughout the project. Thanks also to Dr Catherine Lawrence for proof reading and feedback on the manuscript.
Conflicts of Interest
The authors declare no conflicts of interest. The funders had no role in the design of the study; in the collection, analyses, or interpretation of data; in the writing of the manuscript; or in the decision to publish the results.
Appendix A
Section 1) Additional health economic questions
1.On a scale of 0 to 10 (where 0 is no change and 10 is maximum change) how much do you feel that any improvement in your health and wellbeing:
a) is due to using the Citizens' Advice CAP service?
b) would have happened anyway even if you hadn't used the Citizens’ advice CAP service?
The answers to a) and b) should add up to a total of 10
2. Did attending the Citizens Advice CAP service mean you had to cut back on other activities that benefited your health and wellbeing?
Prompt: If participant answers "yes" please ask "How much did this effect these activities:
a small amount a moderate amount a large amount a very large amount
3.How long do you feel that any changes due to attending the Citizens advice service will last:
less than a month 3 months 6 months a year longer than a year
Section 2) Responses to additional health economic questions
References
- Marmot, M. Health equity in England: the Marmot review 10 years on. BMJ 2020, 368. [Google Scholar] [CrossRef] [PubMed]
- Edwards, R.T. , & Lawrence, C.L. (Eds.) Health economics and well-being and well-becoming across the life-course. Oxford University Press: 2024;
- Graham, H. Unequal lives; McGraw-Hill Education (UK): 2007;
- Graham, H. Understanding health inequalities; McGraw-hill education (UK): 2009;
- Jenkins, R.; Bebbington, P.; Brugha, T.; Bhugra, D.; Farrell, M.; Coid, J.; Singleton, N.; Meltzer, H. Mental disorder in people with debt in the general population. Public Health Medicine 2009, 6, 88–92. [Google Scholar]
- Fitch, C.; Hamilton, S.; Bassett, P.; Davey, R. The relationship between personal debt and mental health: a systematic review. Mental Health Review Journal 2011, 16, 153–166. [Google Scholar] [CrossRef]
- Farnsworth, K. In From economic crisis to a new age of austerity: the UK; Farnsworth, K., Irving, Z., Eds.; Social Policy in Challenging Times: Economic Crisis and Welfare Systems; Bristol University Press: 2011; pp 251–270.
- UK Parliament Rising Cost of Living in the UK.
- Joseph Rountree Foundation UK Poverty 2024.
- Broadbent, P.; Thomson, R.; Kopasker, D.; McCartney, G.; Meier, P.; Richiardi, M.; McKee, M.; Katikireddi, S.V. The public health implications of the cost-of-living crisis: outlining mechanisms and modelling consequences. The Lancet Regional Health–Europe.
- UNICEF Child Poverty in the Midst of Wealth.
- Whitehead, M.; Bambra, C.; Barr, B.; Bowles, J.; Caulfield, R.; Doran, T.; Harrison, D.; Lynch, A.; Pleasant, S.; Weldon, J. Due North: report of the inquiry on health equity for the North. 2014.
- Pickett, K.; Taylor-Robinson, D.; Erlam, J. Child of the North: Building a fairer future after COVID-19. 2021.
- Alexiou, A.; Fahy, K.; Mason, K.; Bennett, D.; Brown, H.; Bambra, C.; Taylor-Robinson, D.; Barr, B. Local government funding and life expectancy in England: a longitudinal ecological study. The Lancet Public Health 2021, 6, e641–e647. [Google Scholar] [CrossRef] [PubMed]
- AnonymousOffice for National Statistics: data and analysis from Census 2021. (accessed Nov 10th, 2023).
- AnonymousLiverpool City Council: indexes of multiple deprivation. (accessed Nov 30th, 2023).
- Citizen's Advice Advice in Practice.
- Finn, D.; Goodship, J. Take-up of benefits and poverty: an evidence and policy review. JRF/CESI Report, 2014. [Google Scholar]
- Pleasence, P.; Balmer, N.J.; Buck, A. The Health Cost of Civil-Law Problems: Further Evidence of Links Between Civil-Law Problems and Morbidity, and the Consequential Use of Health Services. Journal of Empirical Legal Studies 2008, 5, 351–373. [Google Scholar] [CrossRef]
- Low Commission on the Future of Advice and Legal Support (England and, Wales); Low, C.M. Low Commission on the Future of Advice and Legal Support (England and Wales); Low, C.M. Tackling the Advice Deficit: A strategy for access to advice and legal support on social welfare law in England and Wales; Legal Action Group: 2014;
- AnonymousCitizen's Advice: data dashboard. (accessed March 18th, 2024).
- The King's Fund What is Social Prescribing? (accessed November 30th, 2023).
- AnonymousWhat is Social Prescribing. https://www.england.nhs.uk/personalisedcare/social-prescribing/ (accessed 08/08/, 2024).
- Reece, S.; Sheldon, T.A.; Dickerson, J.; Pickett, K.E. A review of the effectiveness and experiences of welfare advice services co-located in health settings: A critical narrative systematic review. Soc. Sci. Med. 2022, 296, 114746. [Google Scholar] [CrossRef] [PubMed]
- Granger, R.; Genn, H.; Tudor Edwards, R. Health economics of health justice partnerships: A rapid review of the economic returns to society of promoting access to legal advice. Frontiers in Public Health 2022, 10, 1009964. [Google Scholar] [CrossRef] [PubMed]
- Alliance, A.S. The Role of Advice Services in Health Outcomes Evidence Review and Mapping Study: The Role of Advice Services in Health. London 2015. [Google Scholar]
- Polley, M.; Seers, H.; Toye, O.; Henkin, T.; Waterson, H.; Bertotti, M.; Chatterjee, H.J. Building the economic evidence case for social prescribing. 2023.
- The Health Foundation Citizens Advice Ways to Wellbeing for All. (accessed Sept 3rd, 2023).
- Michaelson, J.; Mahony, S.; Schifferes, J. Measuring wellbeing: A guide for practitioners. New Economics Foundation, London, 2012. [Google Scholar]
- Skivington, K.; Matthews, L.; Simpson, S.A.; Craig, P.; Baird, J.; Blazeby, J.M.; Boyd, K.A.; Craig, N.; French, D.P.; McIntosh, E. A new framework for developing and evaluating complex interventions: update of Medical Research Council guidance. BMJ 2021, 374. [Google Scholar] [CrossRef] [PubMed]
- Edwards, R.T.; McIntosh, E. Applied health economics for public health practice and research; Oxford University Press: 2019;
- Treasury, H.M. The green book: Central government guidance on appraisal and evaluation. London: HM Treasury, 2018. [Google Scholar]
- Nicholls, J.; Lawlor, E.; Neitzert, E.; Goodspeed, T. A guide to social return on investment. 2012.
- Jackson, E.T. Interrogating the theory of change: evaluating impact investing where it matters most. Journal of sustainable finance & investment 2013, 3, 95–110. [Google Scholar]
- Tennant, R.; Hiller, L.; Fishwick, R.; Platt, S.; Joseph, S.; Weich, S.; Parkinson, J.; Secker, J.; Stewart-Brown, S. The Warwick-Edinburgh mental well-being scale (WEMWBS): development and UK validation. Health and Quality of life Outcomes 2007, 5, 1–13. [Google Scholar] [CrossRef] [PubMed]
- Trotter, L.; Rallings Adams, M.K. Valuing improvements in mental health: Applying the wellbeing valuation method to WEMWBS. HACT: London, UK, 2017. [Google Scholar]
- Liverpool City Council Ethnicity -Census 2021. (accessed 18/03/, 2004).
- Mantell Gwynedd Your Place or Ours: considering the social impact of the South Denbighshire Community Partnership and Citizens Advice Denbighshire “Your Place or Ours” Project, in the first two years -1January 2018 to December 2020.
- Mantell Gwynedd Family Matters: considering the social impact of the Citizens Advice Denbighshire Family Matters project 2017/18 worked in partnership with Betsi Cadwaladr University Health Board.
- Jones, C.; Hartfiel, N.; Brocklehurst, P.; Lynch, M.; Edwards, R.T. Social return on investment analysis of the health precinct community hub for chronic conditions. International journal of environmental research and public health 2020, 17, 5249. [Google Scholar] [CrossRef] [PubMed]
- Bertotti, M.; Temirov, O. Outcome and economic evaluation of City and Hackney Social Prescribing scheme. 2020.
- Deidda, M.; Geue, C.; Kreif, N.; Dundas, R.; McIntosh, E. A framework for conducting economic evaluations alongside natural experiments. Soc. Sci. Med. 2019, 220, 353–361. [Google Scholar] [CrossRef] [PubMed]
Figure 1.
Theory of Change Model for the CAP intervention.
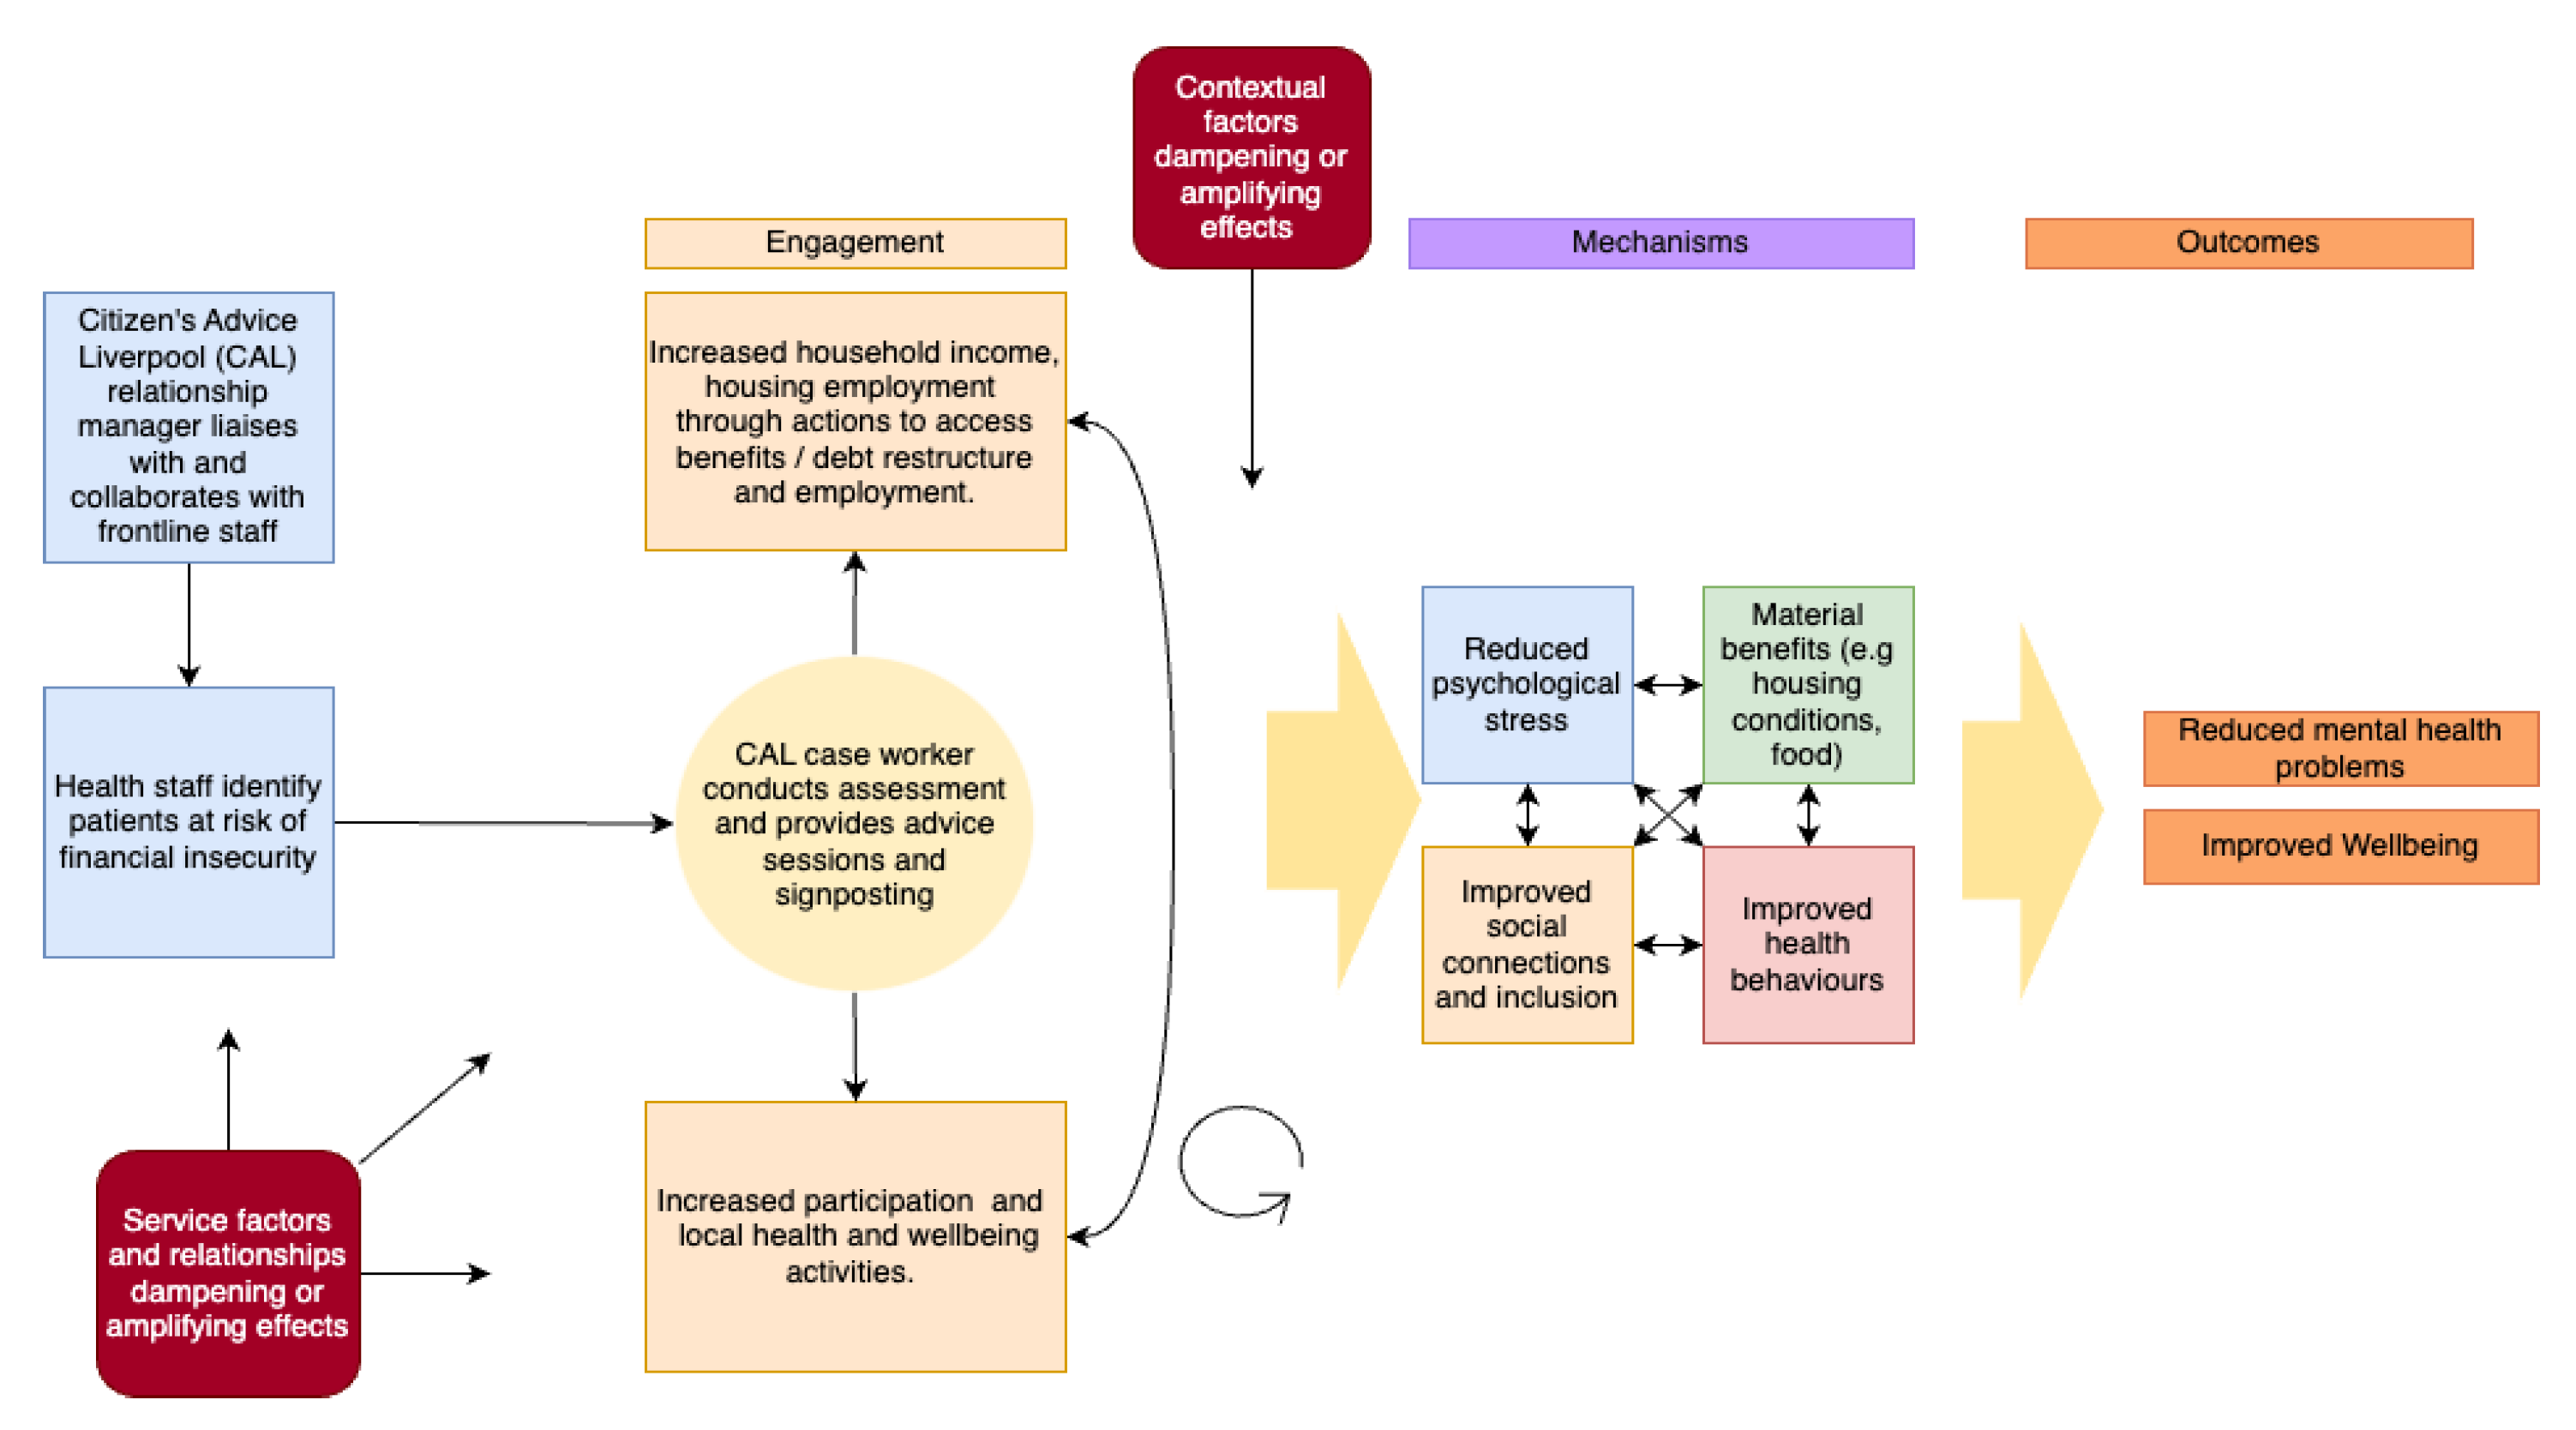

Table 1.
CAP service user demographics and SWEMWBS responses. Results are shown for total CAP service and for the three main referral pathways.
Table 1.
CAP service user demographics and SWEMWBS responses. Results are shown for total CAP service and for the three main referral pathways.
| Primary Care referrals | Secondary Care referrals | Perinatal referrals | Total referrals | |
|---|---|---|---|---|
| Total CAP service users | ||||
| Number of service users | 11,167 | 997 | 1,130 | 13,294 |
| % of service users | 84.0% | 7.5% | 8.5% | |
| Gender: ratio of male: female* | 1:1.4 | 1:1.1 | 1:17.3 | 1:1.6 |
| Ethnicity: ratio of white: BAME** | 1:0.2 | 1:0.2 | 1:1.1 | 1:0.3 |
| Age (±SD) | 52.4(±17.1) | 47.9 (±10.1) | 32.3 (±6.7) | 51.7 (±17.0) |
| Baseline SWEMWBS respondents | ||||
| Number of respondents | 1,967 | 121 | 304 | 2,393 |
| % of baseline respondents | 82.2% | 5.1% | 12.7% | |
| Gender: ratio of male: female* | 1:1.6 | 1:1.5 | 1:22.3 | 1:2.0 |
| Ethnicity: ratio of white: BAME** | 1:0.2 | 1:0.1 | 1:0.7 | 1:0.3 |
| Age (±SD) | 51.9(±15.8) | 52.8 (±12.4) | 31.6 (± 6.6) | 51.0 (±15.9) |
| Baseline SWEMWBS score (±SD) | 18.1(±6.5) | 17.1 (±5.5) | 24.7 (±6.8) | 19.5 (±6.8) |
| SROI included respondents | ||||
| Number of respondents | 443 | 31 | 64 | 538 |
| % of SROI respondents | 82.3% | 5.8% | 11.9% | |
| Gender: ratio of male: female* | 1:1.8 | 1:0.9 | 1:31.0 | 1:2.1 |
| Ethnicity: ratio of white: BAME** | 1:0.2 | 1:0.2 | 1:0.8 | 1:0.2 |
| Age (±SD) | 53.3(±15.7) | 49.2(±12.9) | 32.4(±8.4) | 52.3 (±16.0) |
| Baseline SWEMEBS scores (±SD) | 19.0(±6.4) | 16.9(±5.6) | 25.9(±6.4) | 19.7(±6.8) |
| Follow-up SWEMWBS scores (±SD) | 19.9(±6.7) | 18.4 (±6.4) | 25.9(±6.3) | 20.6(±6.9) |
| Change in SWEMWBS scores (±SD) | 0.9 (±5.9) | 1.5 (±6.8) | 0.0 (±5.8) | 0.8(±5.9) |
* Gender is presented as a ratio of male: female, to allow for the missing gender classification data for total service users (5%) and SWEMWBS respondents (1%).** Ethnicity is presented as a ratio of white: BAME, to allow for the missing ethnicity classification data for total service users (9%) and SWEMWBS respondents (2%).
Table 2.
Costs for CAP service and average cost per service user.
| Cost type | Costs for financial year 2022-23 |
|---|---|
| Staff costs £ (%) | £1,116,931 (89%) |
| Overhead costs £ (%) | £126,646 (10%) |
| Service data collection and evaluation costs £ (%) | £10,840 (1%) |
| Total Costs | £1,254,417 |
| Total unique service users’ April 22-March 23 | 8,438 |
| Average service cost per service user | £148.66 |
Table 3.
Change in social value and SROI ratios for the CAP service.
| Referral pathway | Service users (n=) | Sum SV at baseline | Sum SV at follow up | Change in SV | Change in SV - deadweight (27%) | Average SV change pp | Average service cost pp | SROI ratio |
|---|---|---|---|---|---|---|---|---|
| Primary care referrals | 443 | £6,144,876 | £6,570,657 | £425,781 | £310,820 | £701.63 | £148.66 | £4.72 |
| Secondary care referrals | 31 | 337448 | 414003 | £76,555 | £55,885 | £1,802.75 | £148.66 | £12.13 |
| Perinatal referrals | 64 | £1,378,276 | £1,390,000 | £11,724 | £8,559 | £133.73 | £148.66 | £0.90 |
| Total service | 538 | £7,860,600 | £8,374,660 | £514,060 | £375,264 | £697.52 | £148.66 | £4.69 |
SV= social value; DW= deadweight (=27%); pp = per person.
Disclaimer/Publisher’s Note: The statements, opinions and data contained in all publications are solely those of the individual author(s) and contributor(s) and not of MDPI and/or the editor(s). MDPI and/or the editor(s) disclaim responsibility for any injury to people or property resulting from any ideas, methods, instructions or products referred to in the content. |
© 2024 by the authors. Licensee MDPI, Basel, Switzerland. This article is an open access article distributed under the terms and conditions of the Creative Commons Attribution (CC BY) license (http://creativecommons.org/licenses/by/4.0/).
Copyright: This open access article is published under a Creative Commons CC BY 4.0 license, which permit the free download, distribution, and reuse, provided that the author and preprint are cited in any reuse.


