Submitted:
25 October 2024
Posted:
29 October 2024
You are already at the latest version
Abstract
I introduce the Onion Ring Hypothesis (ORH), to explain measurable, shared, and repeated bedrock and landform geometries that appear to reveal universal explosion patterns of shockwaves from cosmic impacts. In this paper I discuss, target rocks in known and researched structures: Vredefort Crater in South Africa, the Chicxulub structure in Yucatan, Mexico, and the Nördlinger-Ries crater in Germany. I developed this model in response to a challenge to describe the complexity of cosmic explosion patterns on the landscape in the simplest terms. In this case, my illustrations and images show how the ORH model rests on the concept of tessellation, the making of a tile-like pattern, combined with patterns generated from red onion slices to demonstrate the intersection of impact structures and substructures akin to raindrop ripples on a pond overlapping and spreading. The implications of this are profound: by embracing wave physics as this model demonstrates, it leads us to wonder if perhaps the natural landscape IS the cratered landscape. Much impact literature focuses on single impact’ structures, whether by asteroid or comet, and sometimes emphasizing how big the structures are. This reasoning unnecessarily restricts discussion to singular events, not a widespread impact fragment swarm. Data accumulates to show that signatures of impact generated signatures are not just in the northern hemisphere, as new research in South America has datable horizons of impact evidence corresponding to North American and European sites (2). Enough evidence has been studied that YDB scientists propose the black mat be a datum layer like the worldwide Iridium and Platinum-rich Cretaceous-Tertiary boundary denoting the extinction of all non-avian dinosaurs from the Chicxulub impact 65-66 mya (3). Since 2007 when I learned of the possibility of a cometary origin for the Terminal Pleistocene extinctions, the idea of a single bolide causing such damage and extinctions appears questionable. My focus is on the idea of the Earth passing through the tail of a large comet, wherein millions of fragments were likely to strike the Earth. The operative hunch is that for an impact event to cause that much damage, there must be visible, recognizable signatures on modern landscapes of impact origin. This hypothesis is supported by Wolbach, Ballard, Mayewski, etal who suggest that their findings of YDB data from sites in the US, Europe, and Central and South America, along with chemical and impact-related material in the Greenland and Antarctic ice sheets are heterogeneous, like YDB samples, and are consistent with the distribution of findings to point at impact swarms from a fragmented comet (4). The larger point of this discussion is in response to critics of the Younger Dryas Comet hypothesis, also known as the Younger Dryas Boundary (YDB) event, believed by supporters as responsible for the extinctions of 32 or more genera of megafaunal mammals during the terminal Pleistocene epoch. The remains of extinct animals such as giant ground sloths, Bison antiquus, North American camel, horses, saber tooth cats, mastodons, and mammoths, and stone tools of the Clovis people who hunted them are found below a carbon-rich “black mat”(3) (which I call a “burn layer”) containing impact signatures such as magnetic and/or nonmagnetic silicate, carbon, metallic spherules, impact glass, nanodiamonds and evidence of widespread biomass burning circa 12,850+/- 50 calendar years BP. Above this layer, the extinct Pleistocene animals and Clovis culture are not found, although some megafauna survived into the very early Holocene in isolated populations. YDB researchers point to accumulating data such as burn layers or “black mats” as a datum layer akin to the Chicxulub impact iridium layer of 65 mya. (1) Full disclosure: I am not a trained scientist, but a professional landscape architect and land use planner. It is my job to pay attention to landscape patterns for developable areas and those to leave alone. To support the impact swarm hypothesis, based on my own observations and reviewed literature in this paper, there must be geometries that show traces of cosmic detonations on or above ground. My discovery of the impact ring patterns in the Onion Ring Hypothesis led to asking where else this patterning occurs, leading to multiple ways impact dynamics are reflected in several mapping technologies.
Keywords:
Vredefort
; Chicxulub
; Nördlinger-Ries
; tessellation
; Younger Dryas
; cosmic impacts
; DEM
; magnetic anomaly
A long time ago I understood the Onion Skin theory to mean how the layers on Earth are part of the outdated belief of Uniformitarianism that described the gradual buildup of sedimentary rock by weathering and cycling, over millions of years, as proposed by James Hutton (1726-1797), one of the fathers of modern geology. Catastrophism is the topic of this paper, that some geologic changes can happen fast, as in the case for cosmic impacts on Earth, such as the Chicxulub impact 65 million years ago, and the Vredefort Crater in South Africa 2.86 billion years ago. And while a small impact compared to the other two, I include the Nördlinger-Ries crater in Germany because it is a developed and populated landscape. I started this study to help answer whether the suspected Younger Dryas Comet (Reference) was the culprit for massive extinctions of Pleistocene megafauna at the Terminal Pleistocene about 12,850 +/- calendar years ago [1,2].
Of the many registered impact structures around the world, a few of these cosmic events are linked to extinctions with global consequences. Some structures are visible on satellite imagery; others are buried under layers of marine sediment. Still others such as the recent Burckle Crater discovery by Dallas Abbot and team in the Indian Ocean left traces of its presence with giant chevrons (overwash deposits inland indicative of the impact of a mega-tsunami) in Madagascar on plateaus 600 feet above sea level. Other telltale chevrons are found on Australian western shores, and southern India. Fossils in the tsunami turbidites date to only about 5,000 years ago and may be associated with the Biblical flood of Noah [5]. Many recent impact structures have been found by magnetic anomaly maps, geology mapping, Lidar, digital elevation modeling (DEM), oil exploration and Google Earth. None of this recent research on impact events would be possible without remote sensing development technologies, and I am indebted to those technologies for a new way to see the planet.
I grew up hunting arrowheads and stone tools in North Carolina, learned about archaeology and became a flint knapper. I noticed how flint and obsidian fractured conchoidially and that quartz, glass, obsidian, flint fracture this way due to high silica content. These conchoidial features also contain waves rippling outward from the strike point of a hammer stone. This knowledge would aid me later in understanding land rippling from impact. Later, in college I wrote an essay on the extinction of the Ice Age animals for my North American Archaeology class at Boise State University in 1982. The effort earned an A- to bridge the gap between the overkill of Pleistocene megafauna by Clovis hunters, and climate change as being the main culprits for the animals’ demise. But the weak link between climate change and overhunting bothered me. The overkill hypothesis seemed implausible at best unless disease and diminished habitats from climate change made the remaining species vulnerable to overhunting. Post-graduation during my career, I checked the research to see if any new evidence turned up. Finally in 2007 Firestone, West et al. [1,2] proposed the Younger Dryas comet or its fragments was the cause of the extinctions based on international evidence gathered to support the hypothesis.
Critics of this hypothesis point to the lack of craters, a crater field, or a single crater responsible for the extinctions. YDB proponents point to the widening international body of evidence of large scale regional or continental wildfires as a cause of spontaneous ignition of forests and grasslands from comet bolide explosions. This carbon-rich layer, called the Black Mat is promoted as the datum layer of a cosmic event 12,850+/- 50 years before present (BP). [1,3]
My hunch was that there had to be geometry in the landscapes that could be candidates for an impact swarm; and through studying known craters over time, I discovered a replicable and scalable landscape pattern I call the Onion Ring Hypothesis (ORH). The ORH is used to describe geometries of intersecting impact explosions on the landscape using thin red onion slices to illustrate the patterns left on target materials from comet or asteroid collisions and low altitude explosions.
The YDB hypothesis made sense to me because of how neatly it coincided with the rapid disappearance of the Clovis stone tool culture and the animals they hunted in a brief time, with long term survival results. The impact event also lent credibility to global events such as the plunge into the Younger Dryas cold. One byproduct of ocean impacts would have been tsunamis and resultant submarine landslides which could have disrupted ocean currents such as thermohaline conveyor in the north Atlantic. The 1100-to-1200-year Younger Dryas would have been the time it took for these currents to right themselves again.[4,6]
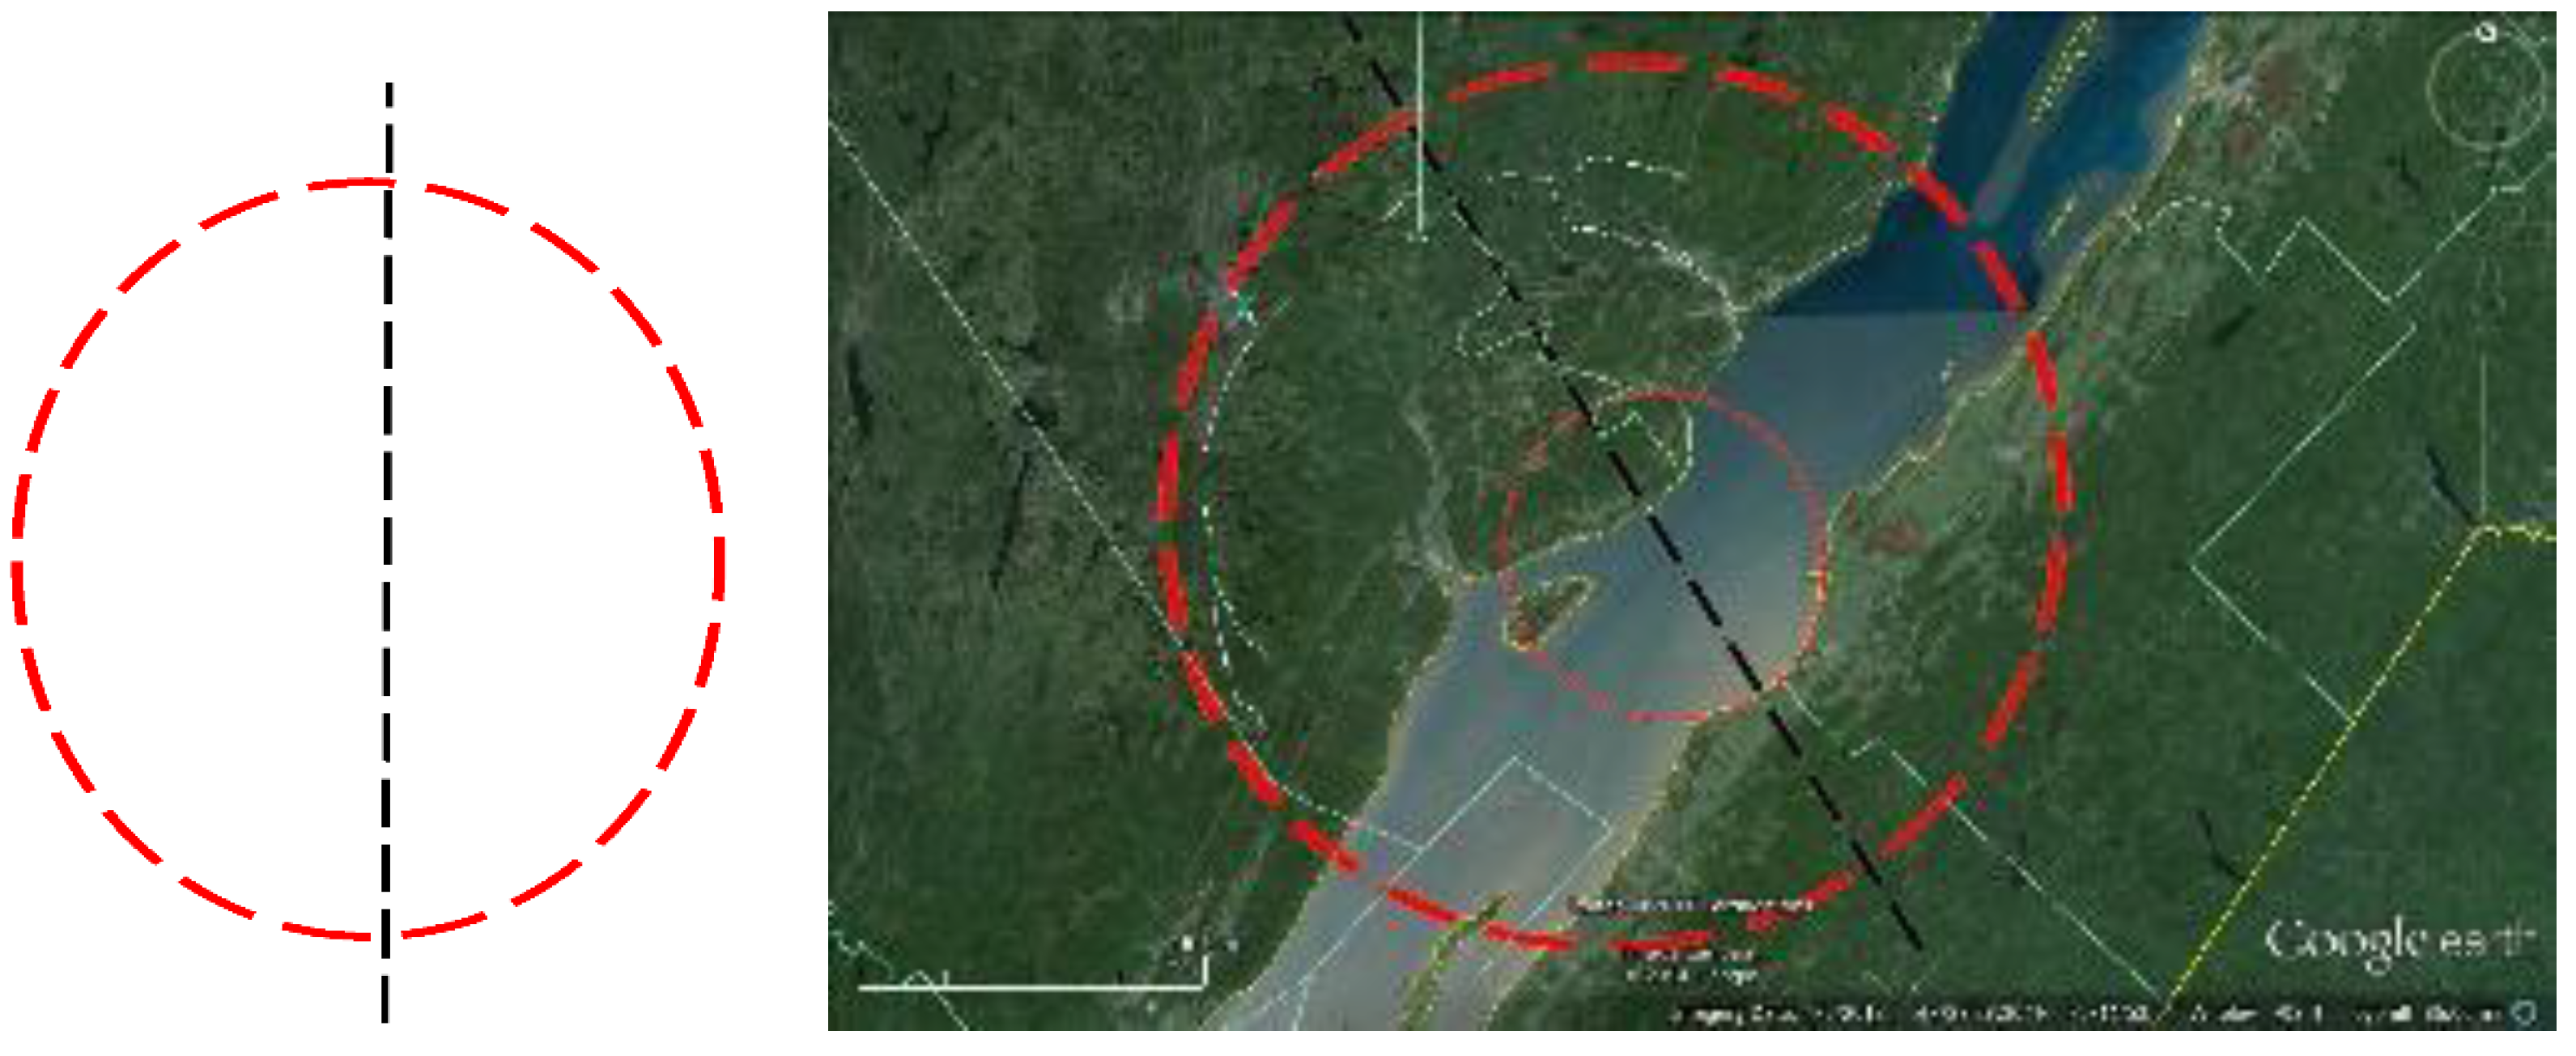
From 2007 to 2014 I read as much as I could on impact phenomena and studied many map types to discern impact shapes, physics, and ways to graphically capture physics and explore where else I could find impact geometry using Google Earth imagery. In 2014 I developed a preliminary model for showing rippling of landforms such as ridges, shorelines, or streams in Google Earth, and started applying this model to known impact structures to test out hypothesis of expanding rings beyond and within effective rims. As an early example, I applied the template to the Charlevoix impact crater in Quebec, Canada. In Google Earth one can modify the size, shape, and orientation of the template. With this overlay method altering the transparency in layers, a palimpsest is built where the interaction of the layers can be observed. In this image the axis is from SSE to NNW with clear widening of the gaps between rings.
Figure 1.
Left: impact template I made in Microsoft Word and applied to Google Earth satellite image of Charlevoix impact crater, Charlevoix, Canada. Curved grey lines between the inner and outer red circles are rivers and streams following the valleys created by the impact rippling. Located on the Saint Lawrence River, this is the site of frequent earthquakes up to 5.8 Richter, in eastern US and southeastern Canada.
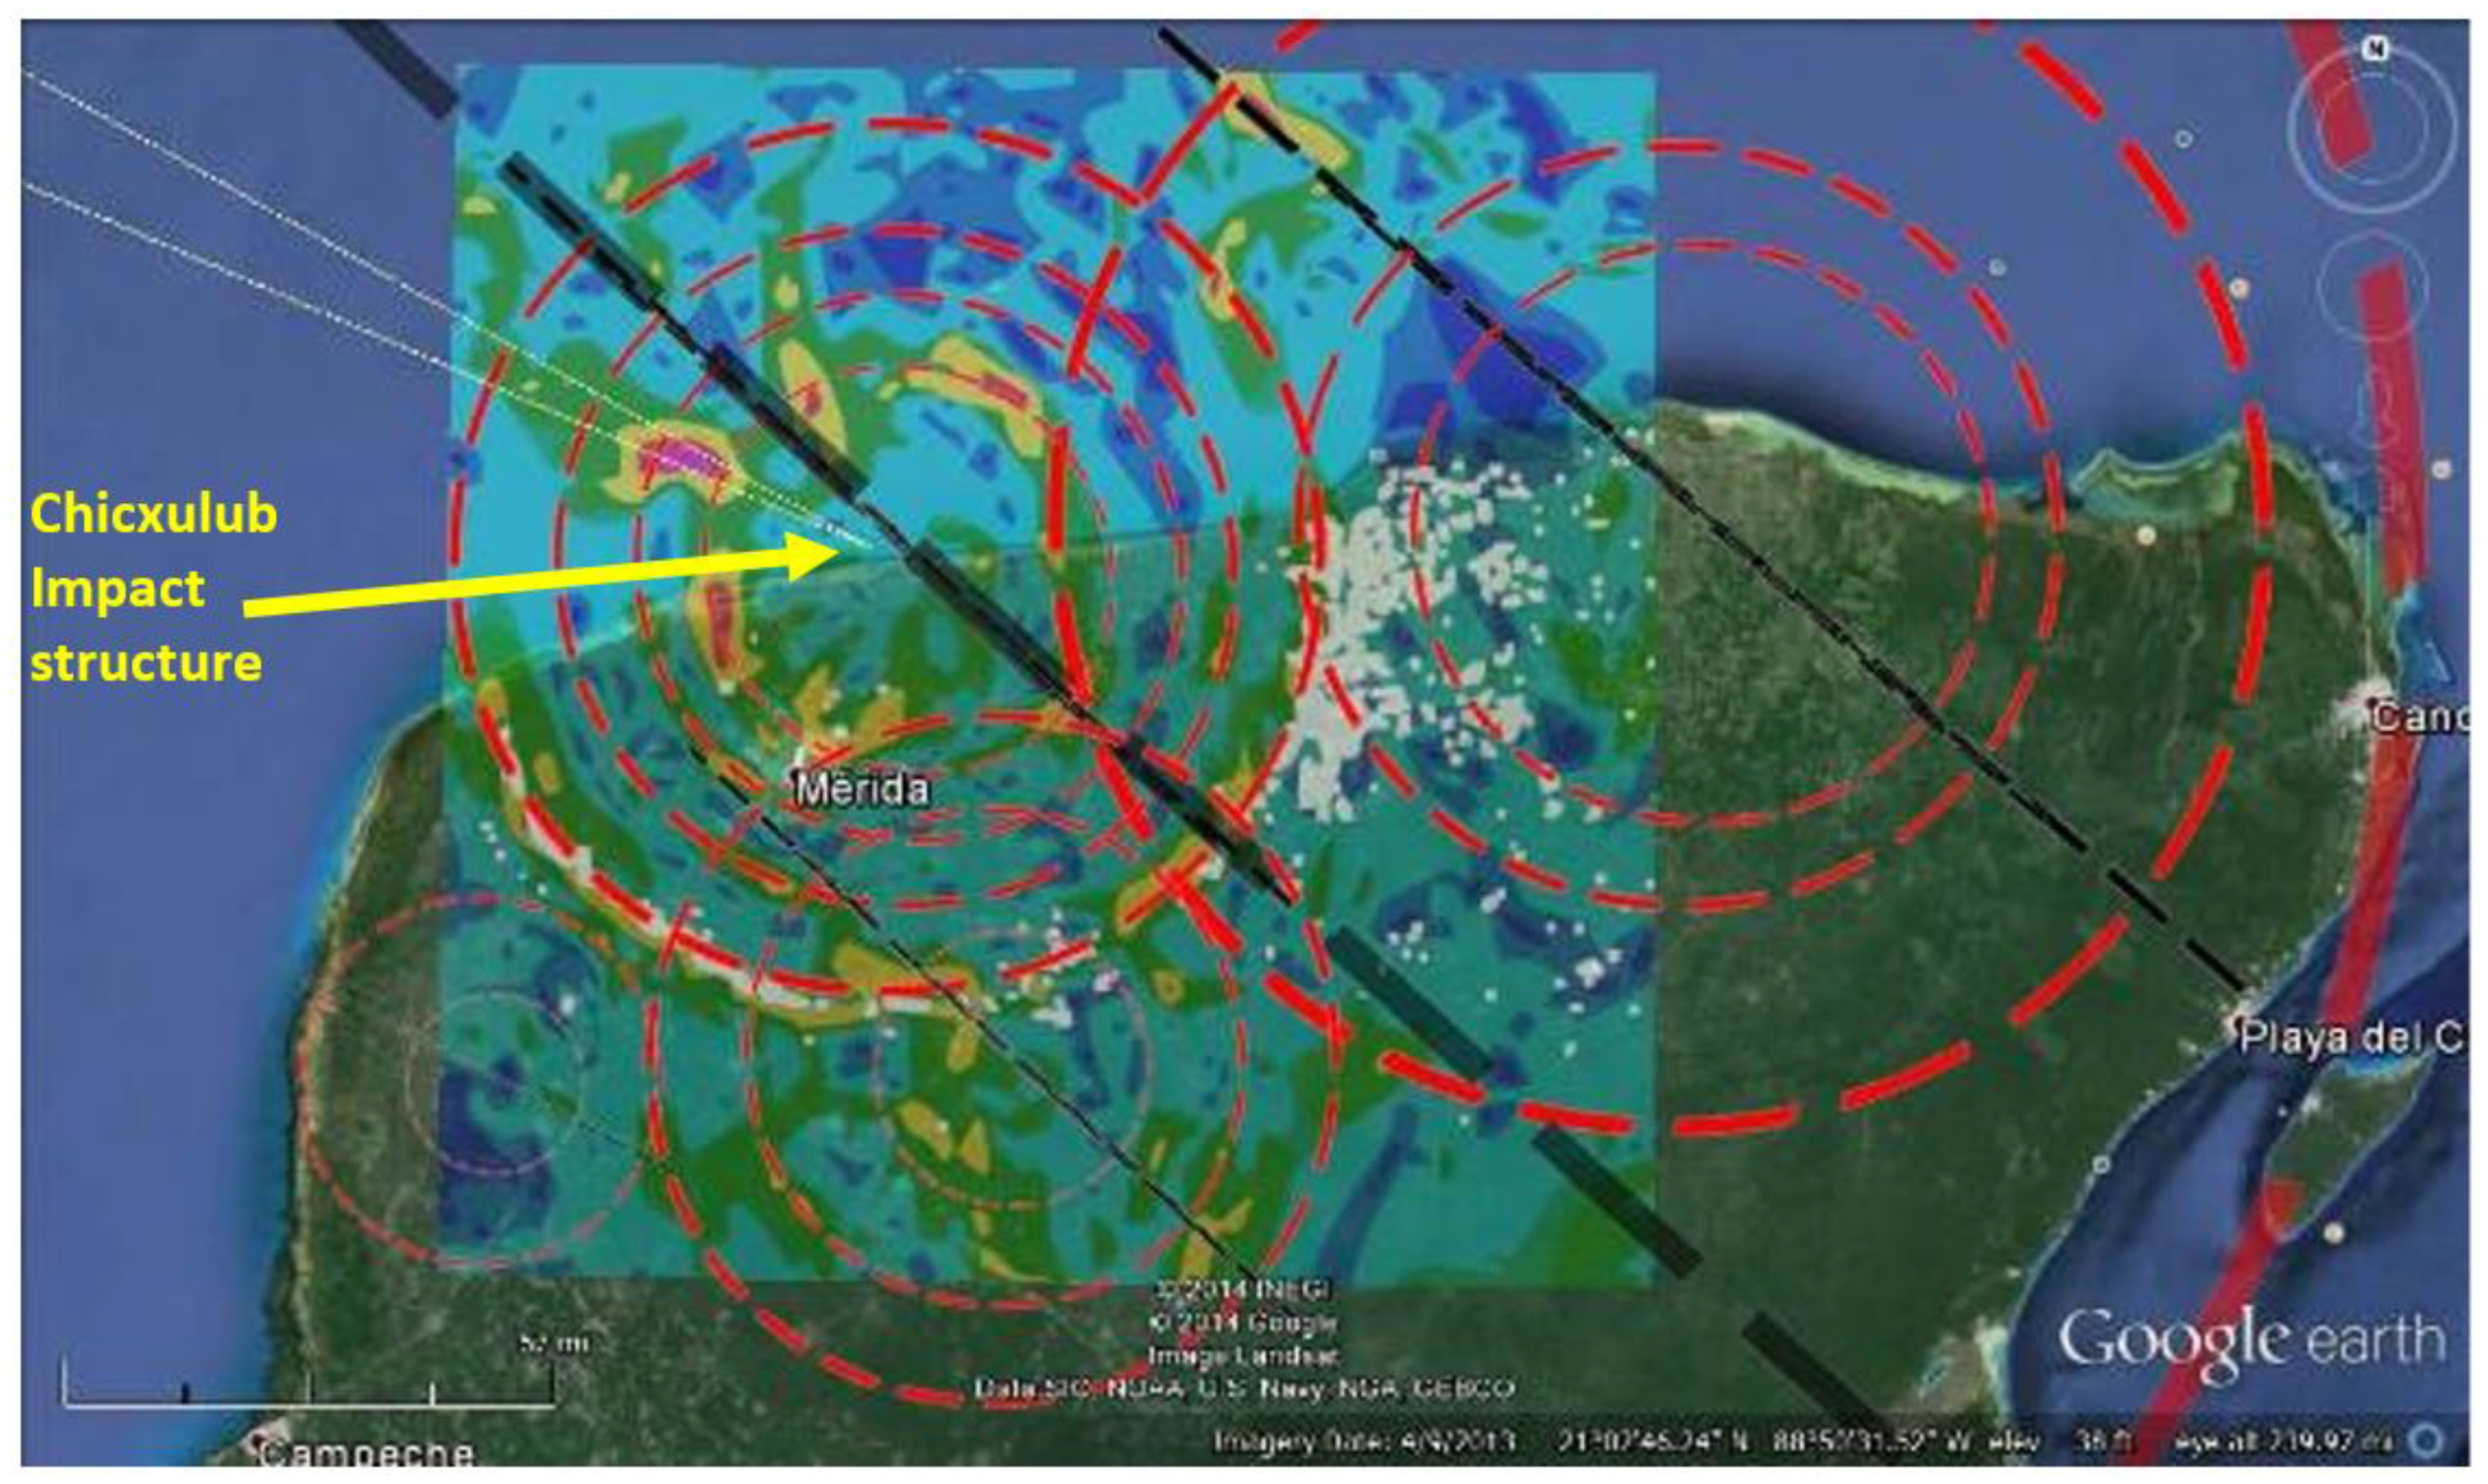
I also applied the template to the Chicxulub Crater magnetic anomaly map overlain on Google Earth image of the Yucatan. In this quick study the main structure shows that concentric rings follow unconsolidated sediment bands (dark blue) and ridges of higher magnetism (yellow, red, orange) indicating more solid, i.e., igneous, rocks. Does it appear there are other arcs and possible structures? Chicxulub was not alone, as some have speculated [9,10,11]. Not the topic of this paper, but however, there has been discussion Chicxulub may have been [at least] a doublet impact event. The main impact structure has been fully confirmed. However, the narrowing of rings symmetrically about the central axes show that at least a few impacts occurred at less than 90-degree entry path. On the one hand this explained so much of landscape geomorphology, and on the other, astounded me with the explosion template’s replication with many kinds of maps, created by remote sensing technology, such as bathymetry, Lidar, hydrology, wetland soils maps, and maps produced in other ways such as geology and fault maps. My own research, a subject on another paper, shows these same tessellated and rippling patterns on loose Quaternary soils, glacial outwash plains of the modern Pacific Northwest in Puget Sound and on former lake beds in Warner Valley, Oregon, which share the same geometries as Vredefort Crater and Chicxulub
Figure 2.
Application of impact template to Chicxulub, Yucatan. I applied copies of the template to major rings seen in the primary structure, seen in the top left. There are magnetic anomaly arcs around this structure. Was the Chicxulub bolide alone? Sources: Satellite image: Google Earth; Magnetic anomaly map, United States Geological Survey.
In June 2016 I had a brief in person discussion with Professor Don Brownlee, impact geologist and astrobiologist with the University of Washington Astronomy department about my findings. I learned from him that comets and asteroids explode the same way. Also, he said, comets can contain up to 75% rock, and the rest in frozen gases and ice. He then issued me a challenge: “If you are going to write a paper about [impact geometry, landscape pattern language], make it as simple as possible.” I struggled for a few years trying to produce an answer. That answer I present: the Onion Ring Hypothesis, or ORH for short.
The Onion Ring Hypothesis Model, Assumptions
Without a working model I had to make some assumptions about the physics of impact. My choice was to study geologic and ground patterns and find commonality between mapping technologies and use known impact structures, then from that develop a breakdown of how the ORH works. Therefore, my assumptions are that:
- -
- Impacts are linear explosions, with fragments blowing off incoming bolides in all directions on descent.
- -
- Fragments explode in fission-like fashion: smaller pieces from parent bolide detonation can be propelled to vaporization velocity, and themselves explode until either all material is vaporized, or fragments fall to Earth.
- -
- I therefore suspect that comets and asteroids may be like Dimorphos of NASAs Double Asteroid Redirect Test (DART) mission, which is described as a loosely held rubble pile of rock from rotational mass shedding and reaccumulation from Didymos. [7] It therefore may follow that one could expect imprints of larger and smaller impact structures on or in the landscape. This suggests that finer, softer materials binding more dense objects together in asteroids and comets may be more vaporizable and explode first, propelling rock as buckshot which explode, and their fragments explode as well. Therefore, the model should suggest the ground patterns should resemble a shotgun blast configuration if true.
- -
- -Seismic shaking and shockwave winds will move loose material. An assumption for on ground or low altitude cosmic explosions would be enough force to move loose and relatively light material, such loose rock and small boulders, topsoil, and river cobbles smaller than perhaps 30 cm diameter.
- -
- -Impact footprints have radial and parabolically arranged tile-like patterns. The impact structures in this study focus on those with bedrock as the target materials, and still the rippling pattern appears to “cut” the landscape bedrocks into patterns like the slice of an onion. The effect is like that of plasma-hot, hyper-velocity jets of energy directed downward and outward like gigantic pneumatic air gun blast. [15]
- -
- -Multiple explosions from a comet impact swarm would create a tessellated pattern of waves crossing each other on target material, solid or loose, much like taking a photo of rain drops in a puddle of water: this freezes the image as overlapping waves, or the target materials, solid or loose, left in ridges and troughs of their last repose from impact rippling. The resultant picture would be to capture wave physics in motion.
- -
- -Tessellation is the tiling or breaking up of an infinite surface with geometric shapes with no gaps in between, also a mosaic. The assumption is that we should see a mosaic pattern resulting from multiple impacts within larger impact structures or across the landscape in a swarm situation.
- -
- -Rippling of the landscape must be considered a direct byproduct of cosmic impact, resulting in seismic waves like earthquakes, only the shaking is caused from above. My analyses of maps and satellite imagery suggest intersecting ripples demonstrating ground shaking in last repose; ergo wave physics frozen in motion.
- -
- -Repetition of form: The rippling should have predictable patterning and measurable rings depending on impact entry trajectory. 90-degree impacts should show concentric rings around epicenters. Rings downstream from an angled impact should have wider spaces between the rings than those on the upstream side of the explosion. Therefore, there is a “cone of ballistics” that is recorded on the ground, and changes shape depending on its impact angle.
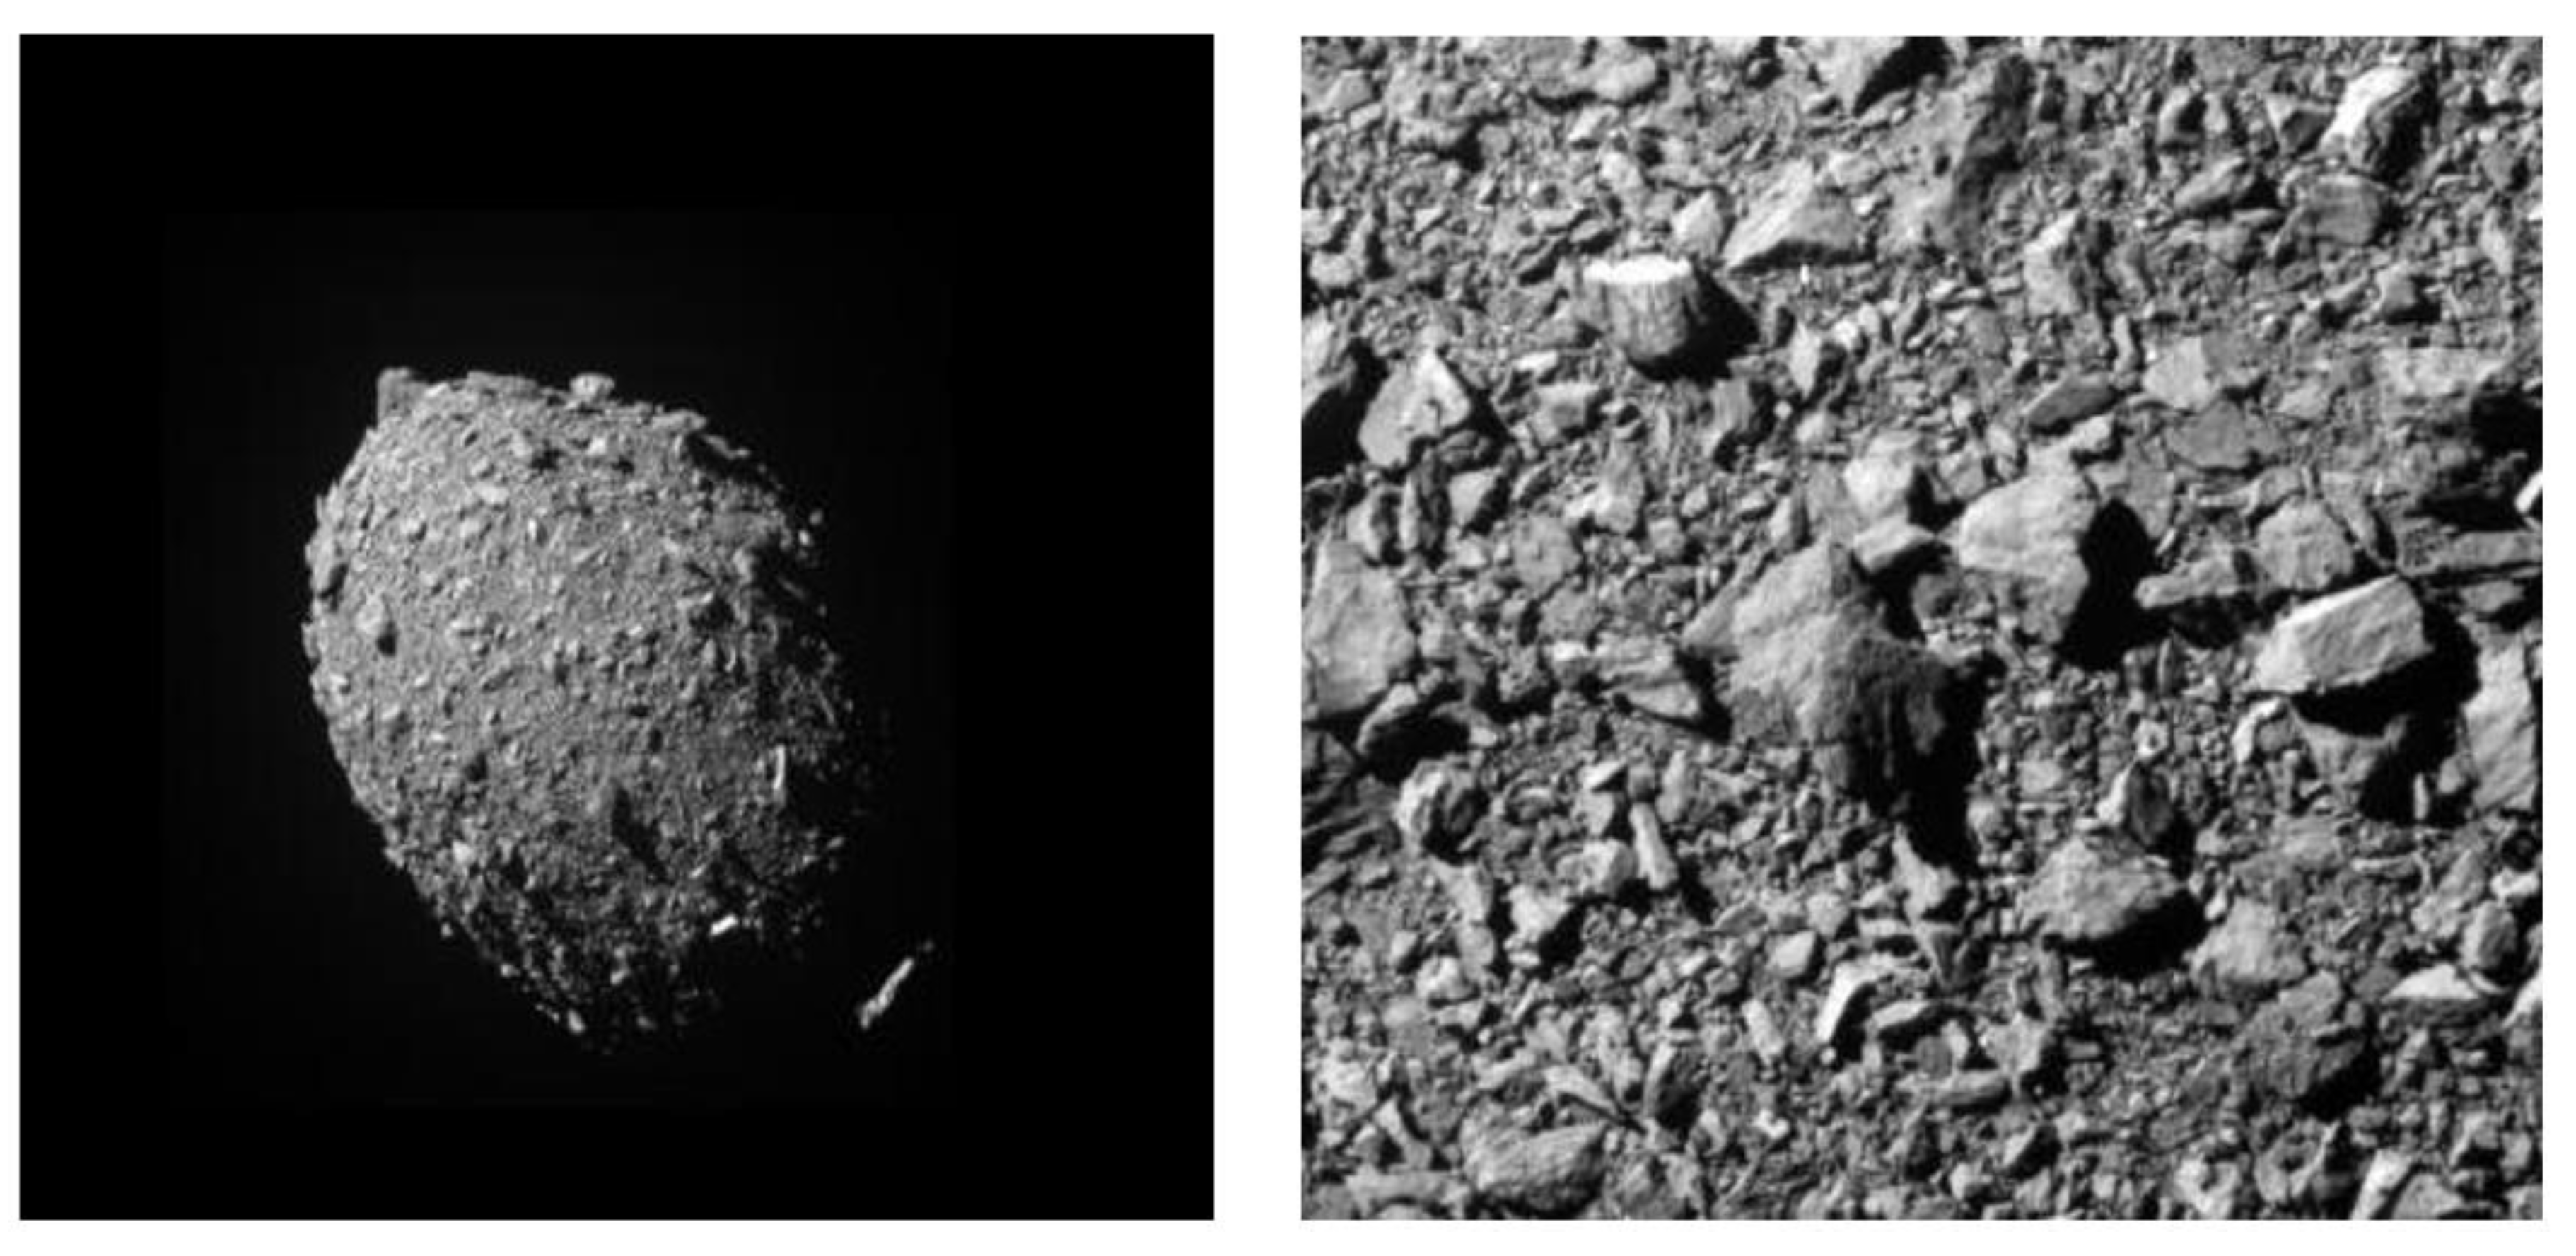
Below is Dimorphos two seconds, and 7 miles (12 kilometers) before impact. And on the right, the last image the DART impactor took of Dimorphos before striking the surface. The scale of the photograph is 100 feet per side. As can be seen from the image, some boulders are as large as houses, and the rocks are all loosely held gravitationally to the surface.
Figure 3.
Dimorphos, L: 12 km distant; R: closeup photo before impact. Image credits: NASA/Johns Hopkins APL.
Figure 3.
Dimorphos, L: 12 km distant; R: closeup photo before impact. Image credits: NASA/Johns Hopkins APL.
The Onion Ring Hypothesis Model Dissection
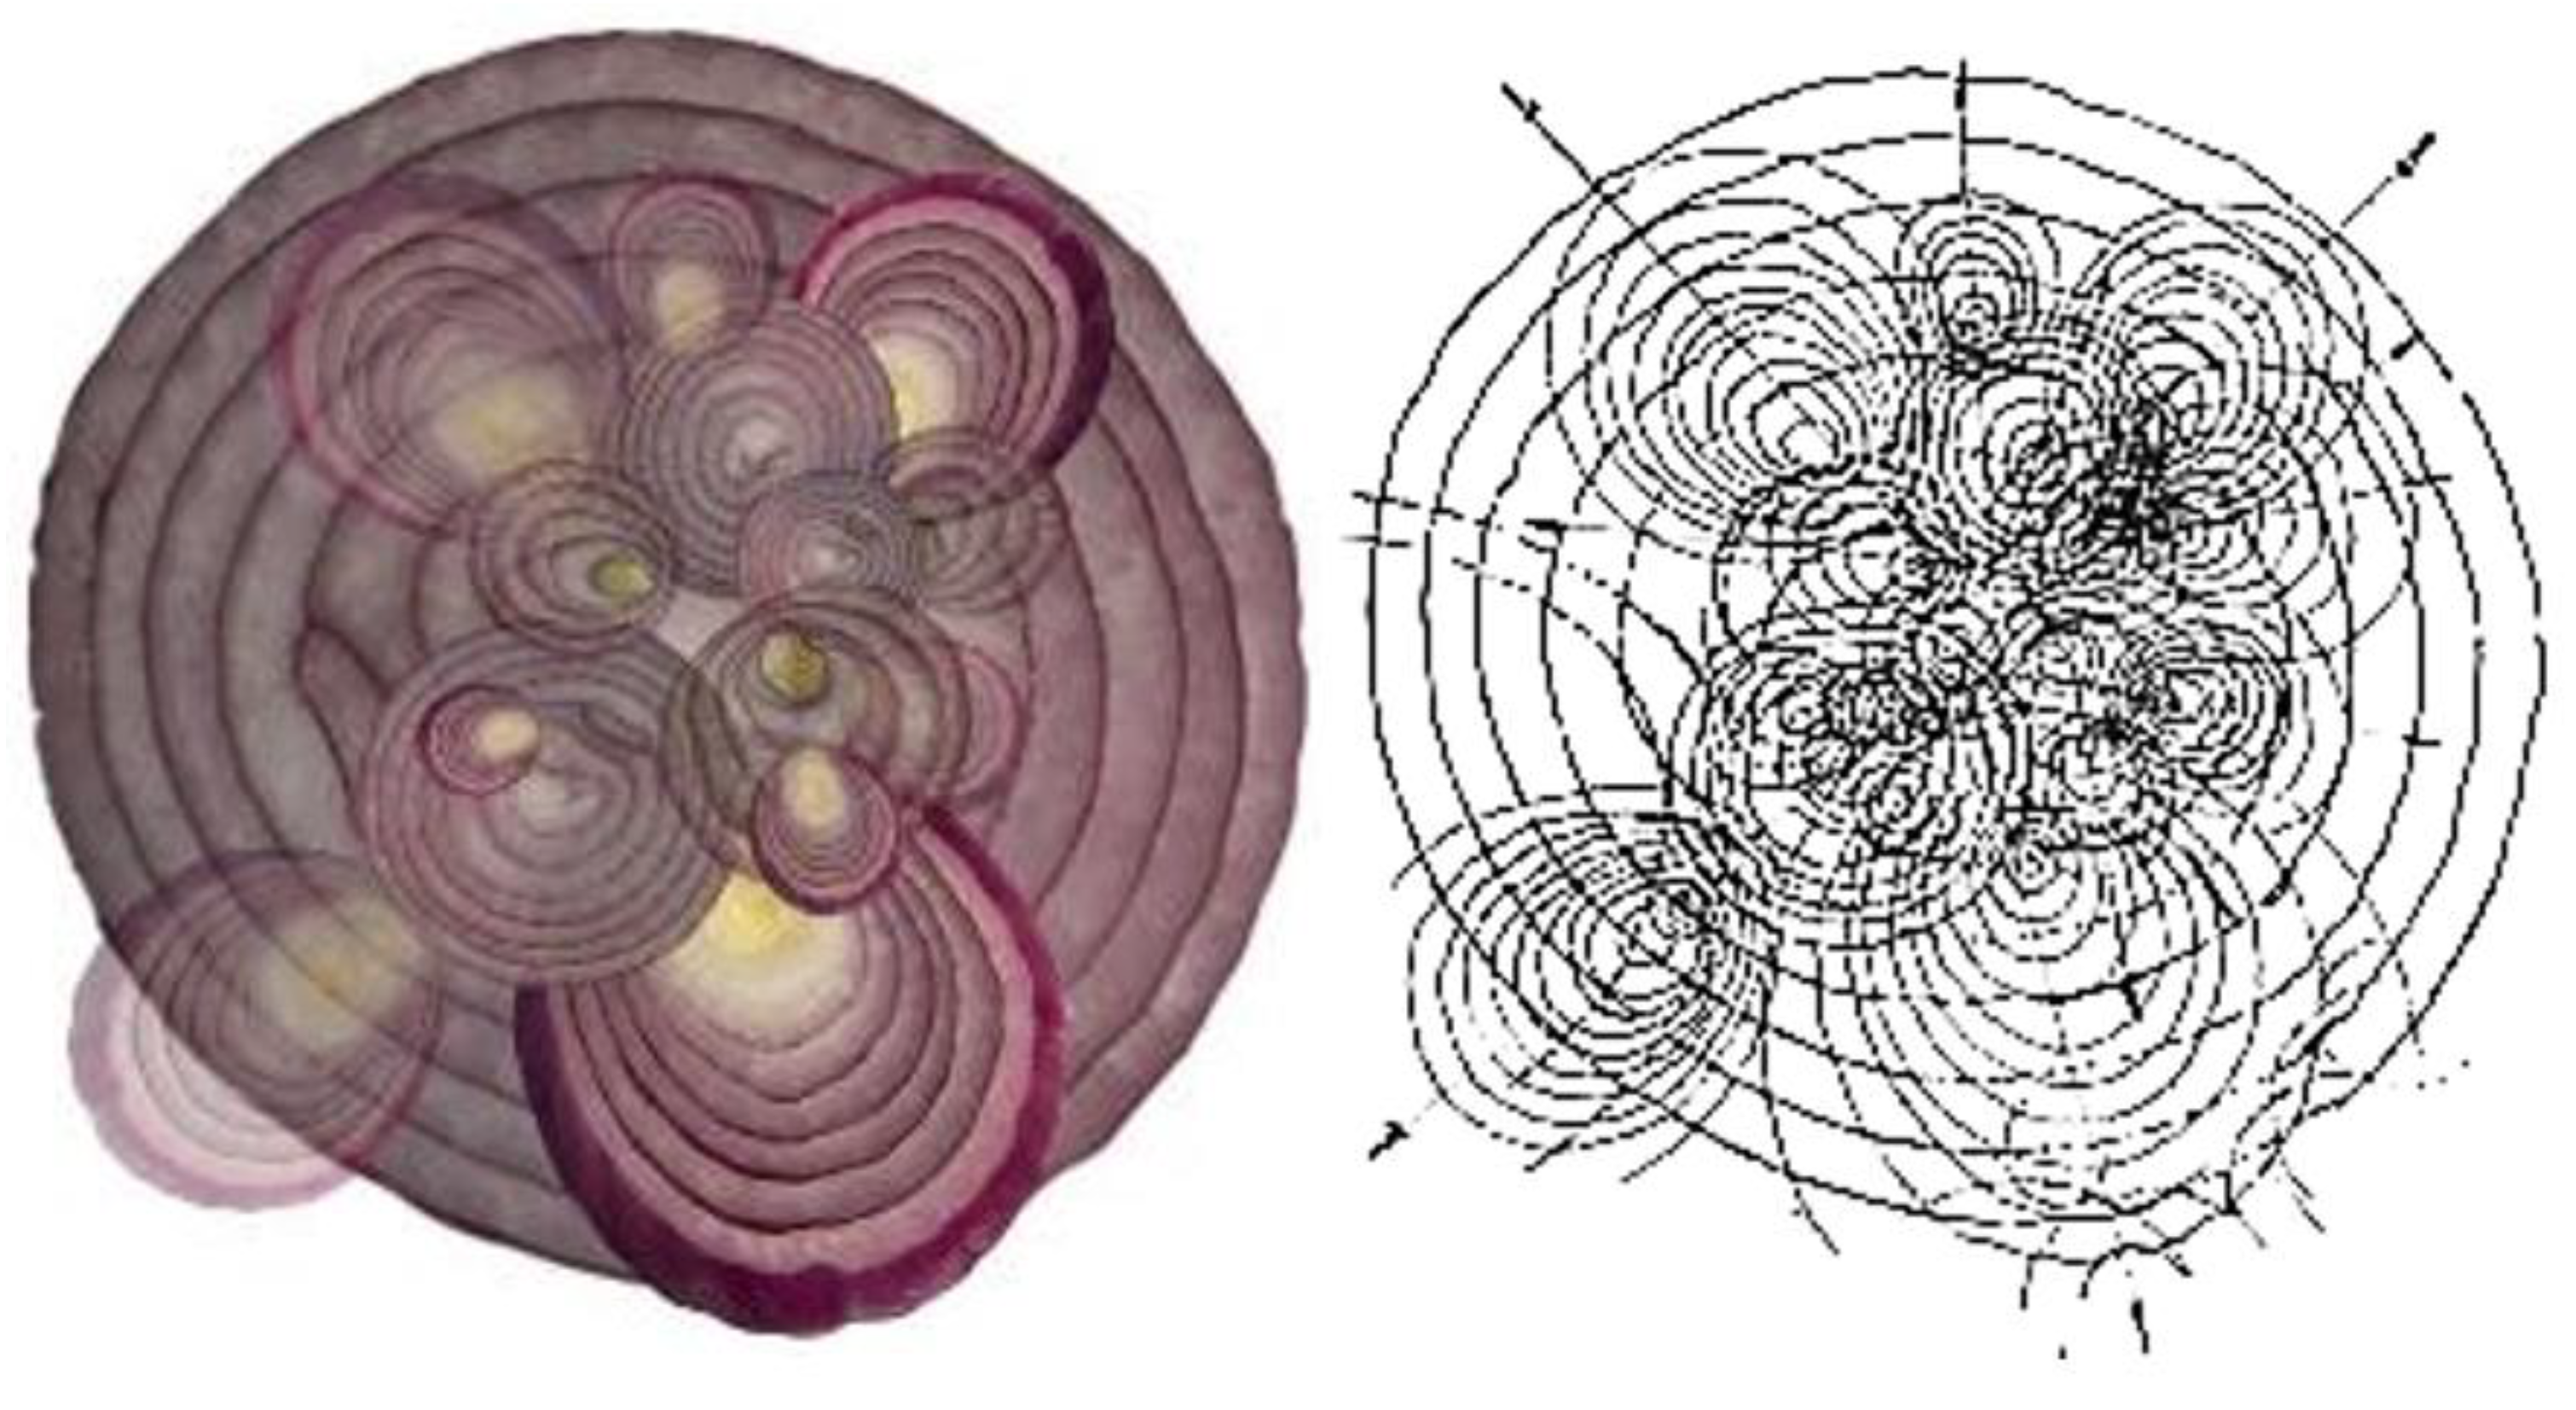
The easiest way to explain the ORH and discuss the geometries of impact structures according to my research is via drawings and images, so this study is a graphics and geometry driven process. Below are photographs of onions I cut with a knife to demonstrate how the cut plane represents the ground plane for 30- and 45-degree entry trajectories. As can be seen, the geometries show red rings farther or closer apart to each other in the angled cuts; and they would be equidistant in 90-degree cuts. Application of this hypothesis on known impact structures seems to bear this out.
Figure 4 shows the use of a red onion as a dissection of ground plane geometry explosion, at various angles and leave impact fingerprints reflecting shortening or elongation of the rings depending on entry trajectories away from the parent bolide. In Figure 5, the onion slice model, the angle of entry dictates the widening and tapering of the expansion rings, and that they are symmetrical about the axis of travel. In this image, I posit those (harder, denser) fragments from near-ground or low altitude airbursts, are accelerated from the parent comet body, creating their own impact patterns.
This ongoing explosion would then leave many overlapping smaller craters overlapping and obscuring the larger ones. Below in Figure 6, the grey cone represents the expanding shockwave of the incoming bolide. Therefore, it should follow that the greatest concentration of energy impacting target materials will be about impact epicenter.
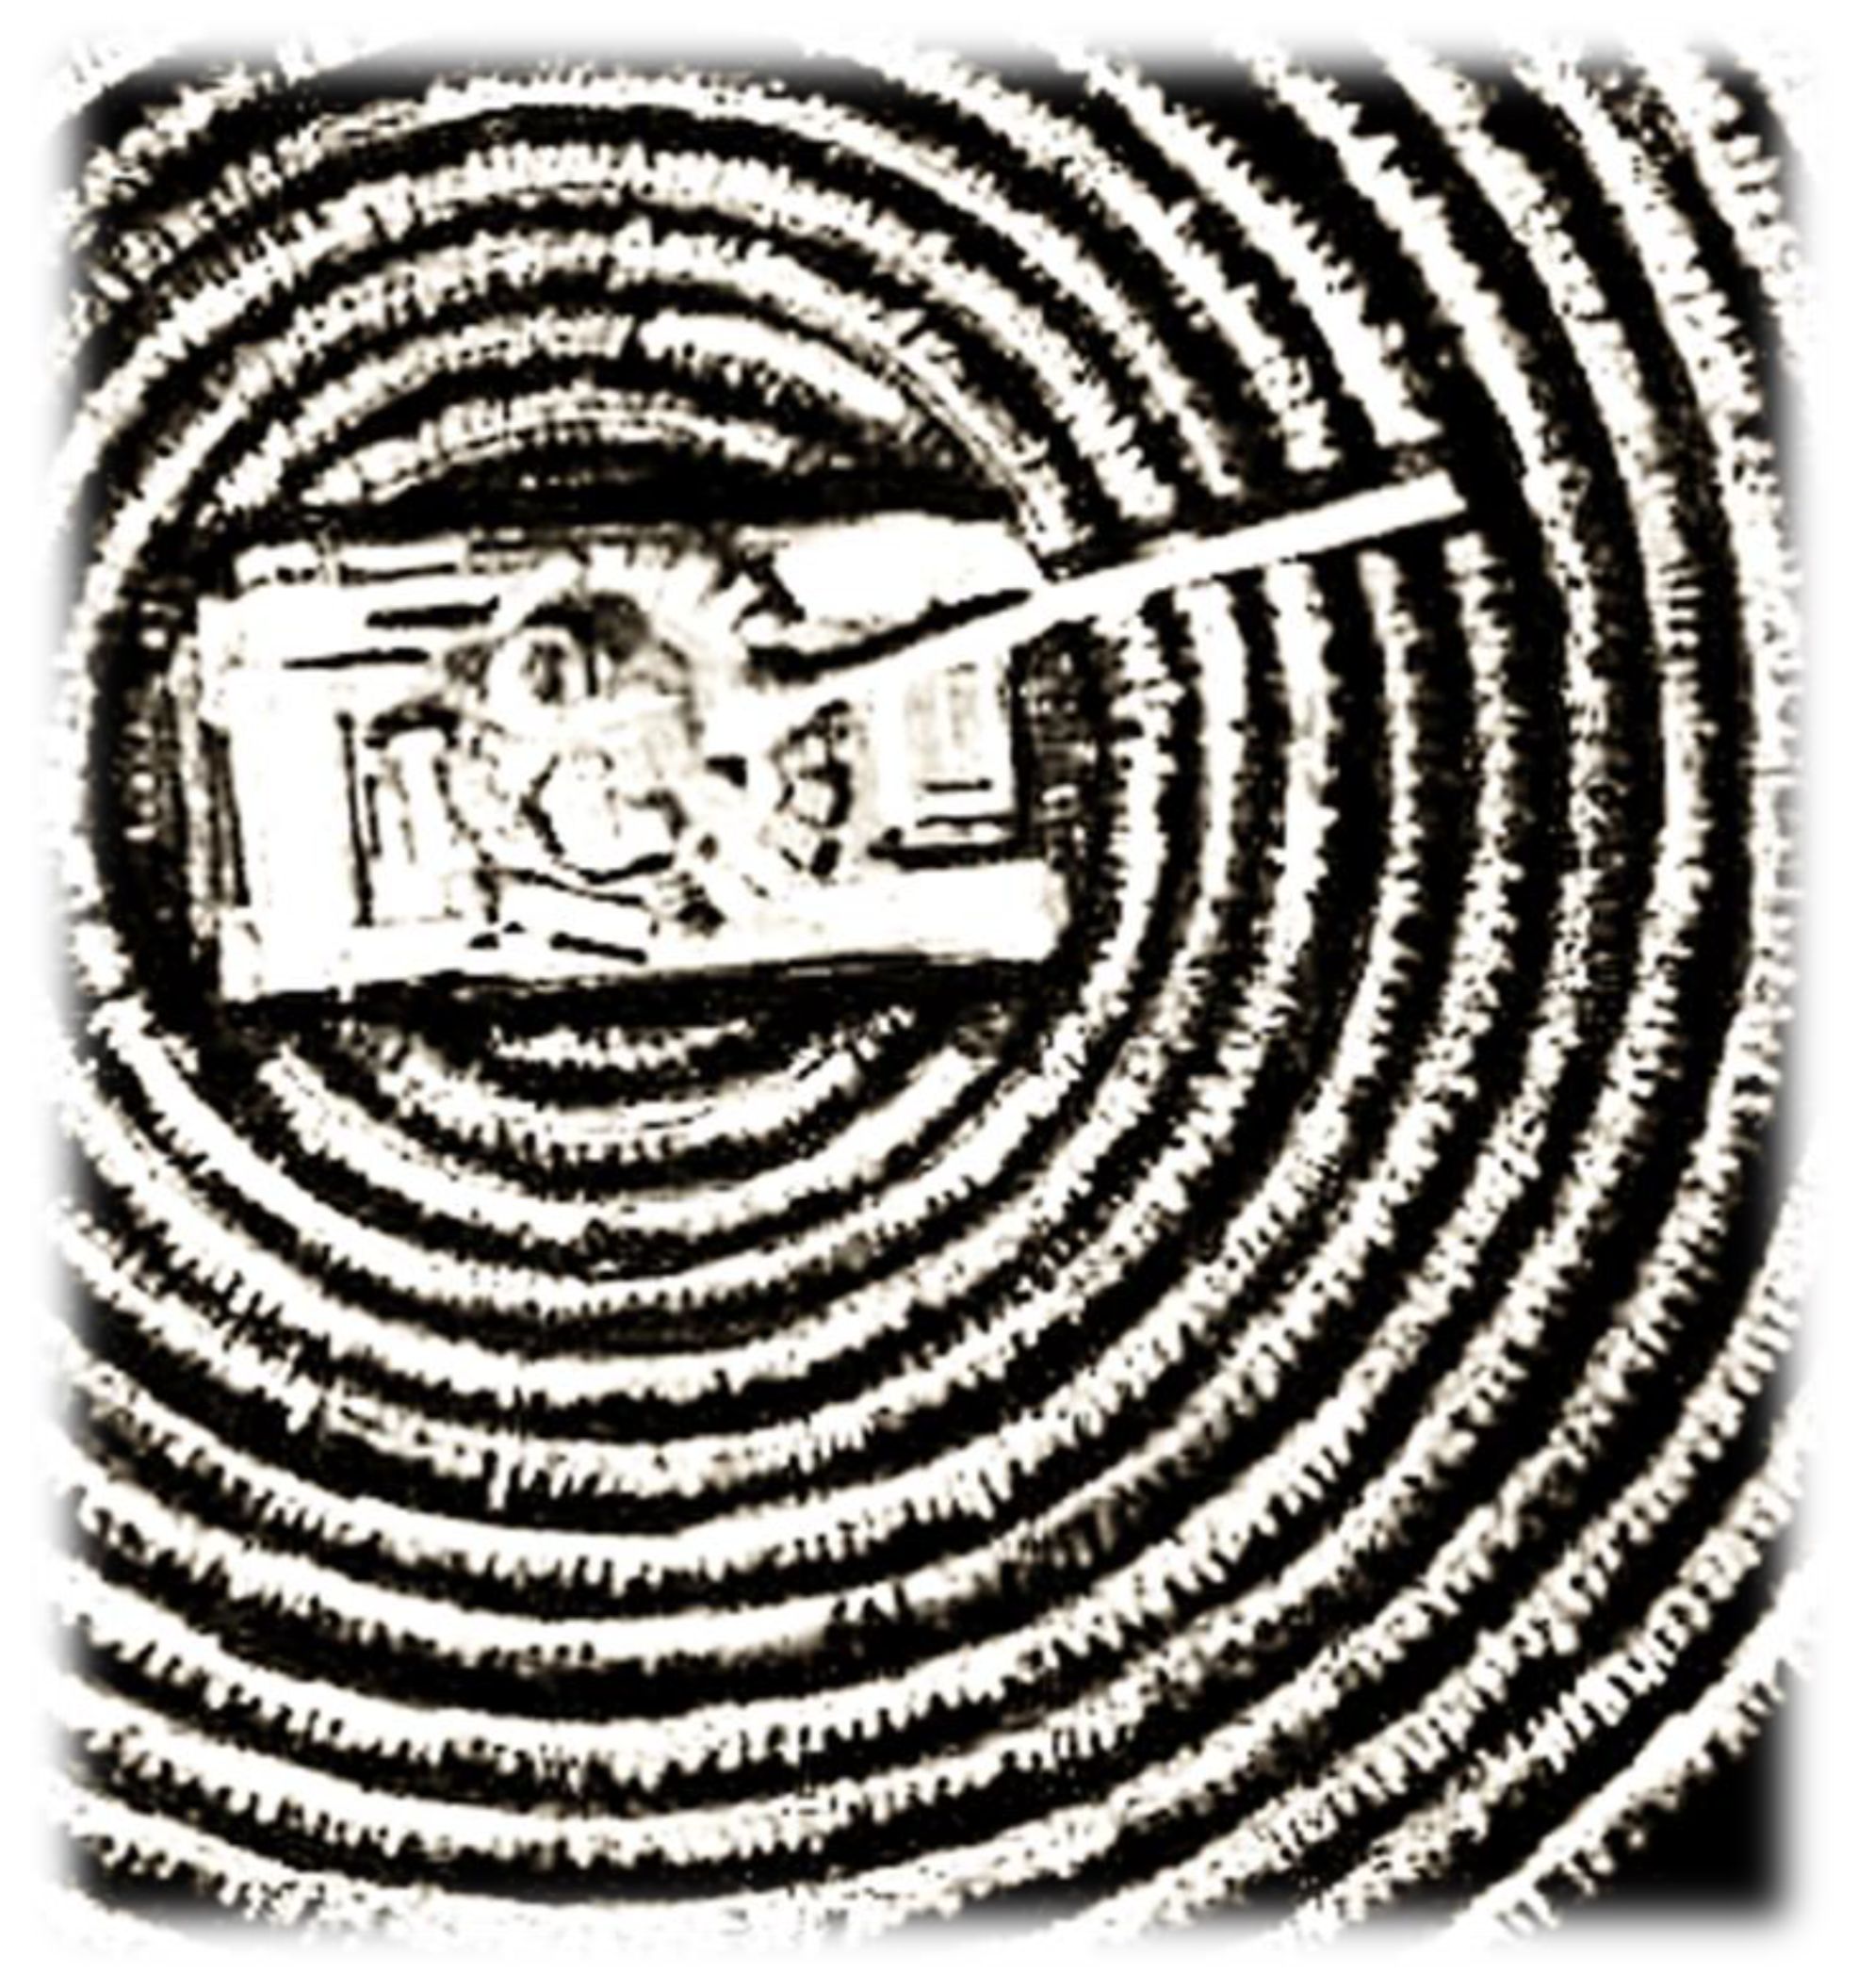
When the shockwave hits the ground, the rebound follows to create a rolling motion in the ground, rippling the landscape. But I wanted something that would show me the shockwaves of actual ballistics. The image below is a Russian tank from the Ukraine/Russia war in fall 2023 I saw on YouTube recently. A Ukrainian artillery shell, fired with precise GPS coordinates exploded just above the tank, producing a rippled ground pattern, illuminated and visible for a split second. I tried finding the video again to save the image but could not. In drawing this from memory, I leave out the detonation and smoke to illustrate the precise, measurable, regular waves across a wheat field. This is remarkably like the ring pattern of fractures and “rippling” that I observe in maps of impact landscapes. Though not nearly as big in scale as the impacts discussed in this paper, the artillery blast and ground wave replicated my idea of the rippling action noted in impact structures and beyond effective rims.
Figure 7.
Illustration by David Wright (medium: white pencil on black paper).
Arguments for Impact Swarms
M. Baillie of Queen’s University in Belfast, UK authored an insightful article making a case for significantly more impacts through the late Holocene Epoch [12]. Significantly, Baillie quotes Clube and Napier (1990, p. 258) who point to tree ring data from AD 400-600 during which many meteor showers were recorded. That could mean the Earth was passing through the debris tail of a comet. Clube and Napier surmise this might have been a period of risk from comet debris which is called a cosmic swarm meaning many “Tunguska-class” impacts in a brief period. The Tunguska explosion of 1908 was estimated to be 15 Kilotons TNT equivalent, or about a thousand times more powerful than the atomic bomb on Hiroshima in 1945 [13] [and currently is held as a standard measure of cosmic impactor explosive power]. Baillie goes on to say that craters are not being taken seriously [writing as of 2006], because no major impacts in a lifetime over five thousand years does not generate much public concern. However, asteroids and comets can break up due to gravitational tides such as Jupiter’s that break up bolides, such as the Shoemaker-Levy comet of 1994, which broke up into twenty-four or so fragments. Moreover, Baillie reminds us that 70 percent of impacts should happen in the oceans, and the rest on land, which could point to orphan tsunami deposits (evidence of tsunamis without a known originator); therefore, there should be 23 impacts in or over water for every 10 on or over land. He goes on to say [significantly for this paper] on the issue of craters and crater fields, “As a consequence of the lack of historical and archaeological interest there is no paradigm for reconsidering that circular lakes and ponds might be craters; few people are looking for craters” ([12], p. 102, underlined and italics, mine).
From my perspective in areas of unconsolidated sediments and aquifers such as those found in the Pacific Northwest, an impact might ripple the glacial outwash sands and gravels, loose soil, with abundant aquifer waters, rippling the land, and leaving the waves in their last reposes. Further, Boslough in his computer simulations showed that even an airburst 15 or so kilometers above ground will carry the shock wave to and into the ground depending on elevation. [14] LeCompte et al. (2018) propose that the Younger Dryas impact event results hypothetically were caused by “cosmic airburst/impacts, a term referring to atmospheric collisions by extraterrestrial bodies, typically producing explosive aerial disintegrations, sometimes along with small crater forming ground impacts.“ [bold, italics mine]. They refer to the international collection of impact proxies and correlations of datable evidence in 30 stratigraphic units in twelve countries to point at a 12,835 – 12,735 cal. B.P. datum window for the YDB comet. As with other studies they point to the global distribution of these proxies to make the case for a disintegrated comet with thousands of Tunguska-class explosions. Napier et al. (2013) in LeCompte (2018) is quoted as saying that 5,000 or more Tunguska magnitude and bigger impact detonations across at least the northern hemisphere could have been responsible for more than 2.5 million square kilometers of land burning up. This equals a total of ~3 percent of total yearly global biomass burning happening in a single day, whereas the international average biomass burning is around 2.0 million square kilometers per year. LeCompte etal also say that Tunguska and the Dakhleh impact events show that catastrophic air bursts can happen without leaving observable craters. But critical to describing the physical dynamics of impacts is how the impact proxies are formed: “Based on all available evidence, YDB spherules formed when high–temperature, hypervelocity jets descended to the ground from atmospheric explosions and melted terrestrial sediment, whether located on land, in glacial ice as detritus or as oceanic sediments [15]. This echoes the work done Boslough in his impact simulations, that the explosions can happen in the air, but the jets of energy and heat can still strike the ground, hitting the surface like a drum, and/or moving material without making an obvious looking crater.
Water As a Model for Impact Geometry
“If you want to understand the bedrock geology in an area, look at the water and what it is doing.”-Geology professor at University of Pennsylvania Landscape Architecture program, 1985.
My graduate school geology professor at the University of Pennsylvania made that statement in class, and it stuck in my head glue, the idea that water and its shapes was a big clue as to the geometries of surrounding landscapes and bedrock. Water is a powerful ally in this research: it seeks its own level with gravity. Water responds to seismic events, whether from impact or from earthquakes. In this case, I introduce the use of water rippling both as a model of impact shock waves, from a swarm of bolides and a resultant hypothetical landscape.
The idea is a picture of rain drops falling on a puddle or pond will have overlapping rings, and thereby, create tessellation. The assumption is that like water, shock energy propagates within and beyond the effective rims of impact structures and subsides, but the tessellated geometries of intersecting impact rings would be waves frozen in their last motion. Much of my research focused on examining waterways since it made sense that in impact structures water would seek low points between ridges, flow along curves, form a lake and then jump to another “ring” stream, then on to a lake or sea. Imagine having thrown handfuls of stones of diverse sizes or watching water fall from trees on a pond in the rain. It might generate a pattern like this. In using a stock raindrop photo below to illustrate ground motion from various sized impacts. I outlined highlights from the photo in blackline. I then colored the darker areas as water, the light areas as land. assuming multiple impactors to illustrate how landforms generated by impact or air burst can be formed.
The blackline drawing is a tracing of light and dark shapes in the photo, and then below, I shaded negative/dark spaces to represent water bodies to from a generalized gross outline of the rings, and drew on a hypothetical landcsape.
While this is simply a study of biomimicry for impact geometry, there are many places in the world with very similar landforms and bathymetry. This hypothesis does not attempt to suggest that impacts created all the textures of the Earth’s suraces, it is intended to show how shock rings can tessellate a landscape in such a way there is a discernible landscape pattern language of landscape attributes: forested areas, wetlands, wet soils, water bodies, arable and developable land, and movement patterns reflecting human responses to landscape geometry.
Shockwave Energy and Rippling
What I discovered in analyzing Vredefort, Chicxulub, and some impact craters on Mars was how fracture lines were curved, often parallel to each other, exactly equidistant concentrically, and still others taking on parabolic curves shown above. The physics of impact contains both the downward shock wave of the entering bolide, and its outward expanding shock wave. The rebound shock wave that in some cases creates a central peak uplift or raised center. The point is that the downward/outward and rebound shockwaves join to create a concentrically expanding rolling ground motion like that of earthquakes. There have been efforts to model this with computer simulations.
The Tunguska impact event of 1908 in Siberia is believed to have been a small (50-60 m. wide) asteroid explosion, but it had the explosive power of 12 megatons of TNT. By comparison, the Little Boy atomic bomb dropped on Hiroshima on August 6, 1945, had an explosive power of 15 megatons. Assuming a comet fragment impact storm, there may have been tens of thousands of Tunguska-class bolides, many much larger, and millions more smaller bolides and fragments. In the case of a single explosion, such as the Tunguska bolide, the upward rebounding shockwave catches up with the outward wave. In Figure 8, images show the development of shapes from water ripples to mimic how landforms can be generated from impact, where intersecting rings can result in removal of rock or landscape or create new ridges.
In Figure 9 superimposes the cone of impact on the Tunguska fireball, and in Figure 10, a close-up the explosion shockwave presses downward and outward on the ground while the rebound springs upward and outward, with both creating a ripple or series of ripples as the land settles down post impact. However, under the ORH the landscape is left with new features: re-oriented stream and drainage channels and rippled, dimpled, and otherwise altered landscapes.
Above is the Tunguska fireball simulation, 18 kilometers above the Earth, with a 35-degree air burst, showing how the impact energy is carried to the ground, by Dr. Mark Boslough of Sandia Labs in New Mexico. The distribution of energy in section and plan shows that since the explosion is symmetrical about the centerline of entry, the rings will be wider downstream than upstream. This image demonstrates that the ring structure shows a forward motion of impact momentum. Below is a closeup of the Tunguska fireball explosion simulation, with a crude graphic of mine showing the forward (downstream) shockwave, and the upward rebound shockwave. The idea here is that where the two shockwaves meet and traverse across the landscape, the forward and downward front wave pushes material radially downward and outward from the center; the rebound shockwave does the same but upward, creating fast-rolling ring expanding across the landscape.
Putting it all together:
A plan view of the above fireball explosion with the rippling effect would produce an image on the ground like the following illustration. The large concentric “onion ring” represents a 90-degree impact; and all the others are offshoots. To put it all together we can then use onion slices to describe a single impactor, which explodes into many other exploding impactors until vaporization and explosion energies are spent:
Figure 11.
Onion slices model, left. The closer ring sets are to the actual “epicenter” the more circular the rings become. Interestingly that is what makes it hard to visually find the actual epicenter because there are many others close to a “bullseye”.
Figure 11.
Onion slices model, left. The closer ring sets are to the actual “epicenter” the more circular the rings become. Interestingly that is what makes it hard to visually find the actual epicenter because there are many others close to a “bullseye”.
Water is a powerful ally in analyzing landscape geometries since water seeks its own level in troughs or weaknesses in rock fractures. The tessellation means that a stream or river will follow a trough then cross other rings to jump to another ring arc. Lakes, ponds, and their shorelines can reflect impact geometry though moved, rounded, or not by water and wind action and softness of the material. The white spaces between the lines would be areas of raised land, ridges, above or below water. The point is that if the lines on an arc disappear, they then reappear elsewhere in an extrapolated arc. The same is true for various maps as will be shown.
Therefore, the geometry of a single impact structure at many scales is simple. Overlapped impact structures from a storm of impact fragments is the chaos in the pattern language. However, if one structure is dissected, by extrapolating arcs of a river, ridge, shoreline, topographic elevation, geologic rock unit, and connecting the lines elsewhere, patterns soon begin to emerge.
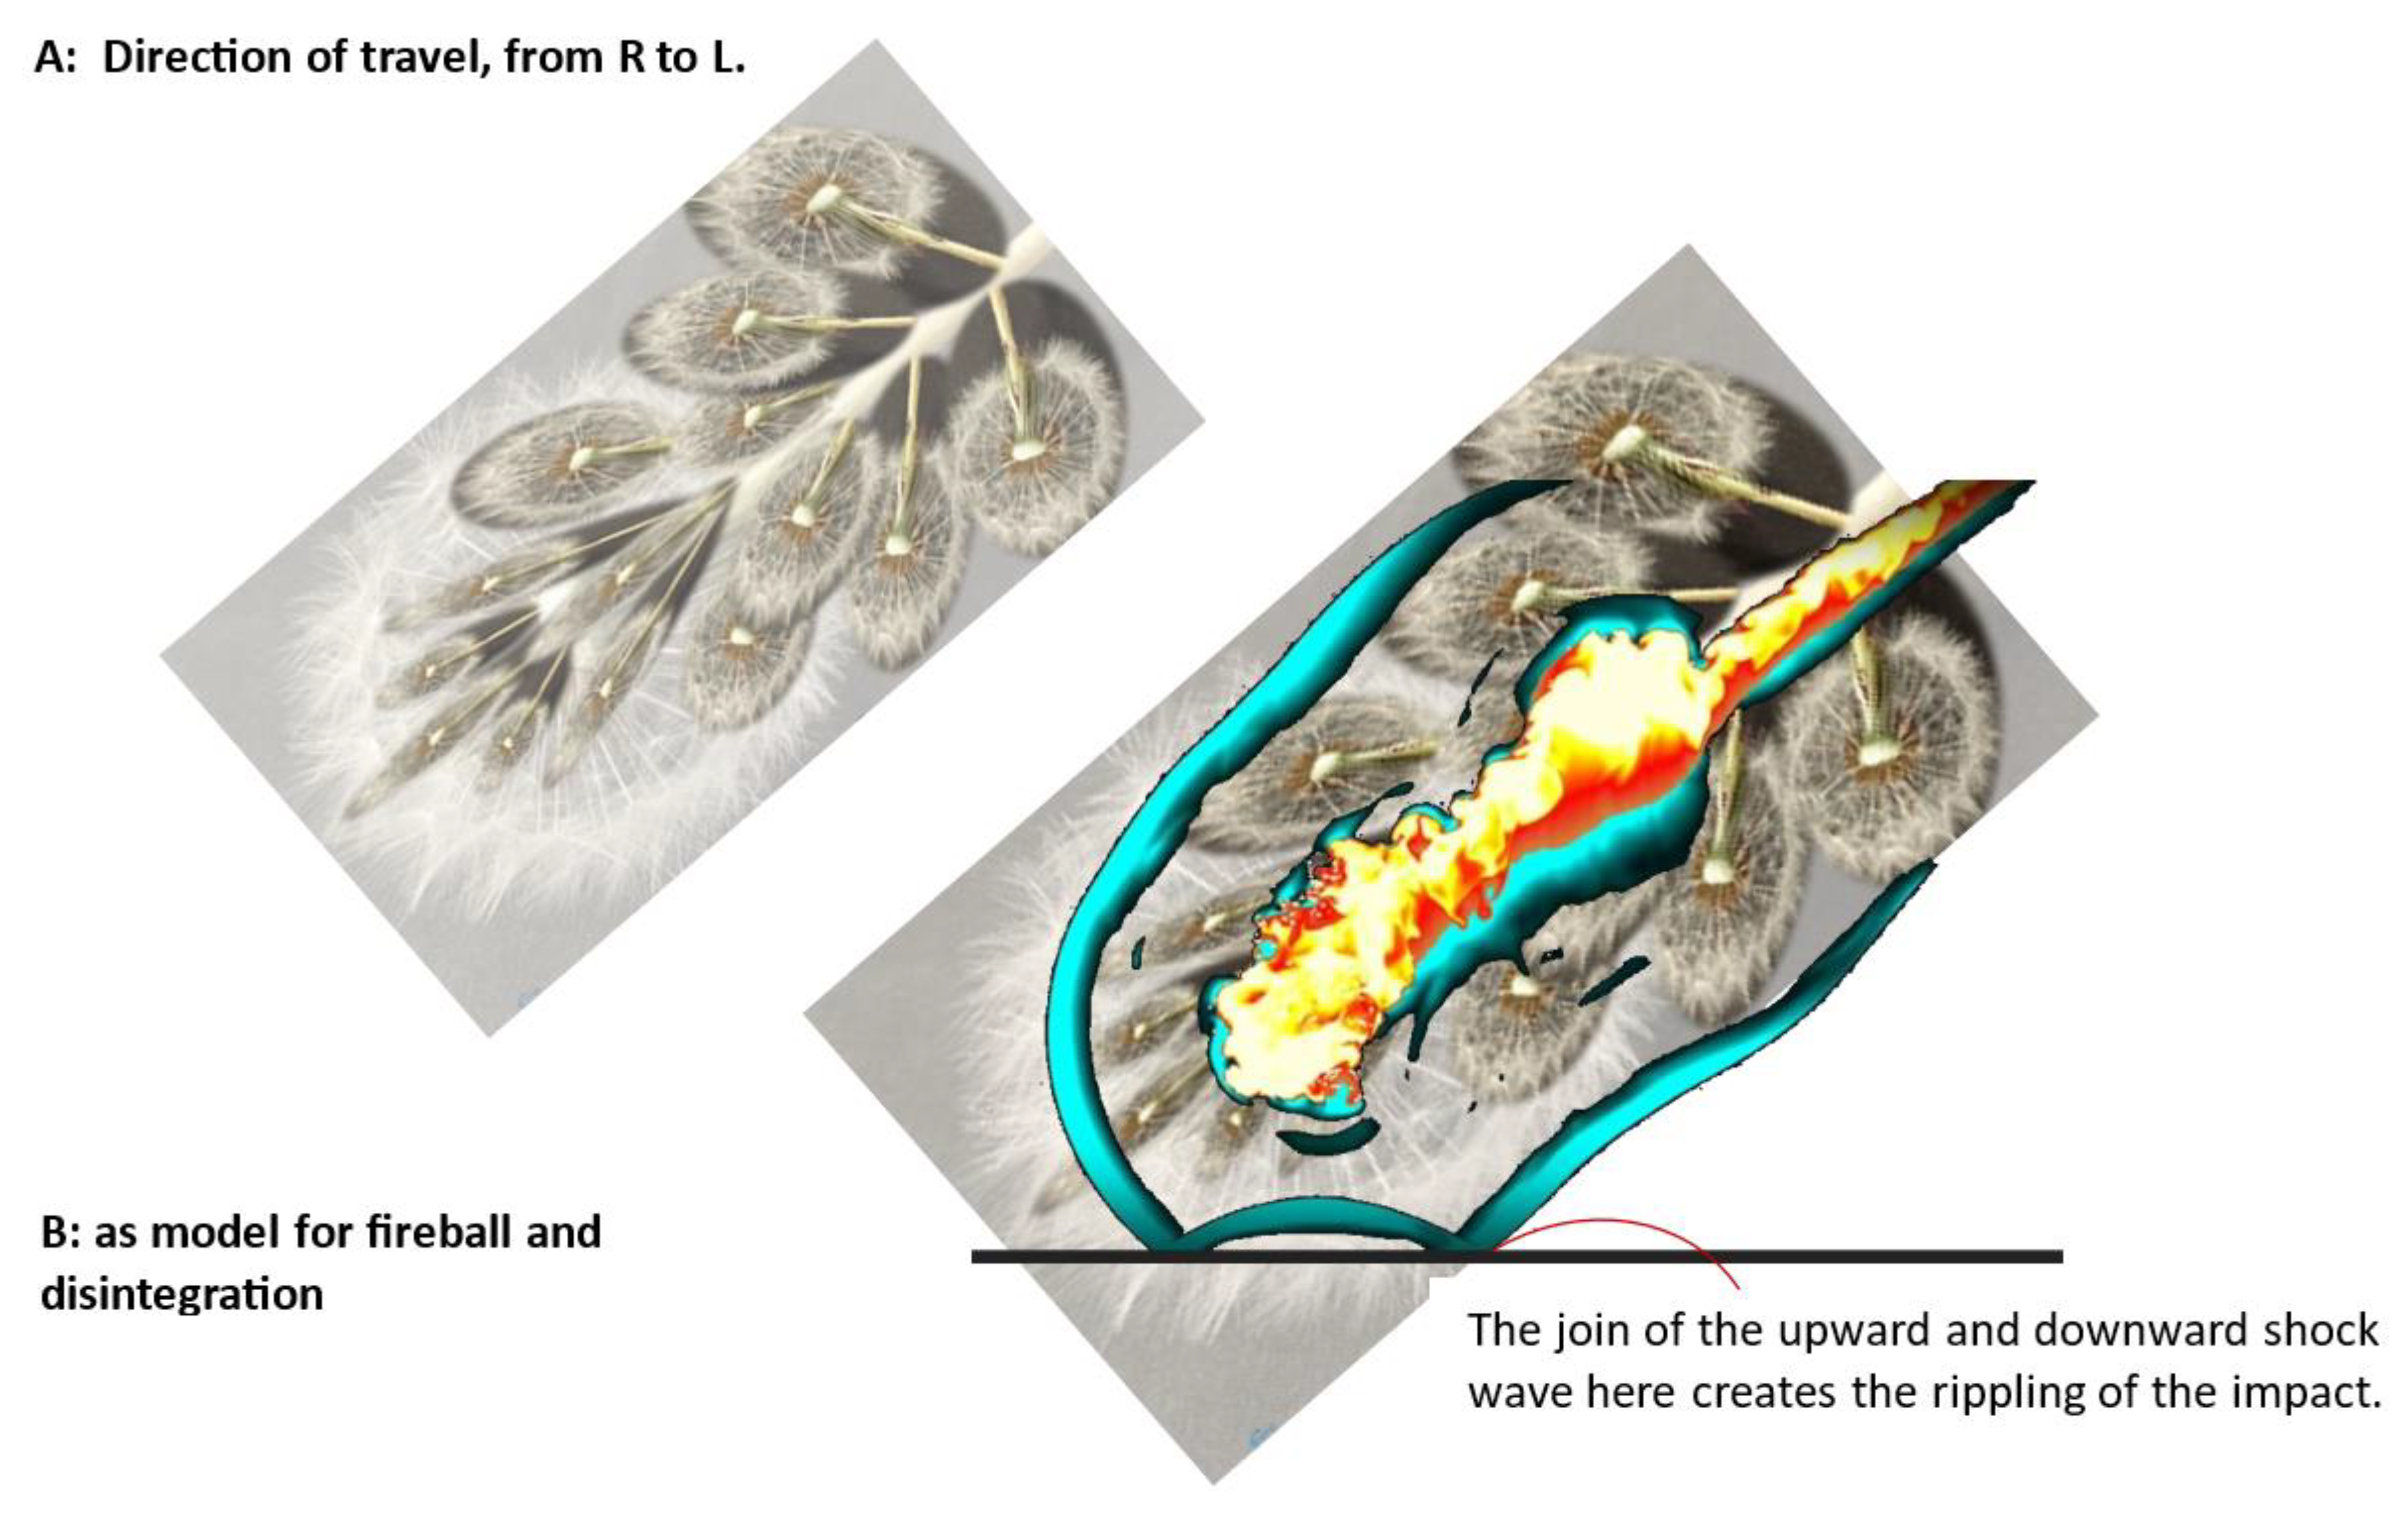
A way to describe the disintegration of an incoming bolide is to use a dandelion with seeds. The following image shows a dandelion, copied repeatedly showing what I see happening inside an exploding bolide in flight from right to left. And again, to use Dr. Boslough’s Tunguska fireball model and eliminating the black background, we see the internal explosion pattern I am attempting to describe.
Note the outward/downward shockwave and upward/outward rebound shockwave (in turquoise color), and how they meet and travel along the ground together. According to this model, all branches of the “dandelion comet” oriented to the ground would leave ring structures depending on explosion altitude and angle of entry. The group of fine hairs called the pappus on each dandelion seed catches the wind to be carried aloft. In this image, the spray of the pappus hairs represent micro explosions of impactor fragments in addition to the main bolide(s).
And, to refer to the DART images of Dimorphos, with rocks the size of houses, it is hypothesized in the following model that in the next image, the tufts at the end of a single seed would be the explosion of those rocks by hyper velocity detonation per Figure 13 A,B, below. It is these “micro impact structures” that make up the fine detail within impact structures, as illustrated by the ground, rock, hydrology, topography, and vegetation patterns. A YouTube video of Dr. Boslough’s simulated Tunguska explosion is here: https://www.youtube.com/watch?v=HjJuMFQyNyw
Figure 12.
Above: A at top: The idea is that each seed head cluster is a fragment of an incoming bolide, and all the seeds also vaporize. B, below, combines Boslough’s Tunguska fireball with the dandelion bolide disintegration model. Fireball image credit: M. Boslough, Sandia Laboratories. Dandelion photo, mockup, D. Wright.
Next, I present case studies to show how the ORH lends itself to a different interpretation of the ground plane, geologic geometries, and how magnetic anomaly mapping can be used to re-interpret the shapes of known impact structures. It is hoped that this demonstration can be a springboard to analyze contemporary landscapes and other maps, and remote sensing for new interpretations of the earth’s surface geometry.
I wish to point out also in my research and reinterpretation of map imagery, that the same shapes are often delineated in other maps including oil and gas maps, seismic history maps, and maps of earthquakes generated by hydraulic fracturing of target rocks for shale and gas exploration, topics for other papers.
Test Cases:
Applying the Onion Ring Hypothesis: Chicxulub, Vredefort, and Nordlinger-Ries Craters
In the following examples of applying the ORH to known impact craters, I use Chicxulub Crater of Yucatan, Mexico, the Vredefort Crater of South Africa, and the Nördlinger-Ries Crater of Germany, to show how the ORH applies to each case. For Chicxulub, I use a magnetic anomaly map. For Vredefort, analysis of the digital elevation map (DEM) will show yet another method of applying the ORH. For a European example, the surface geology map of the Nordlinger-Ries crater clearly shows the overlapping onion rings pattern of that impact’s disintegration and bedrock transformation.
CHICXULUB CRATER
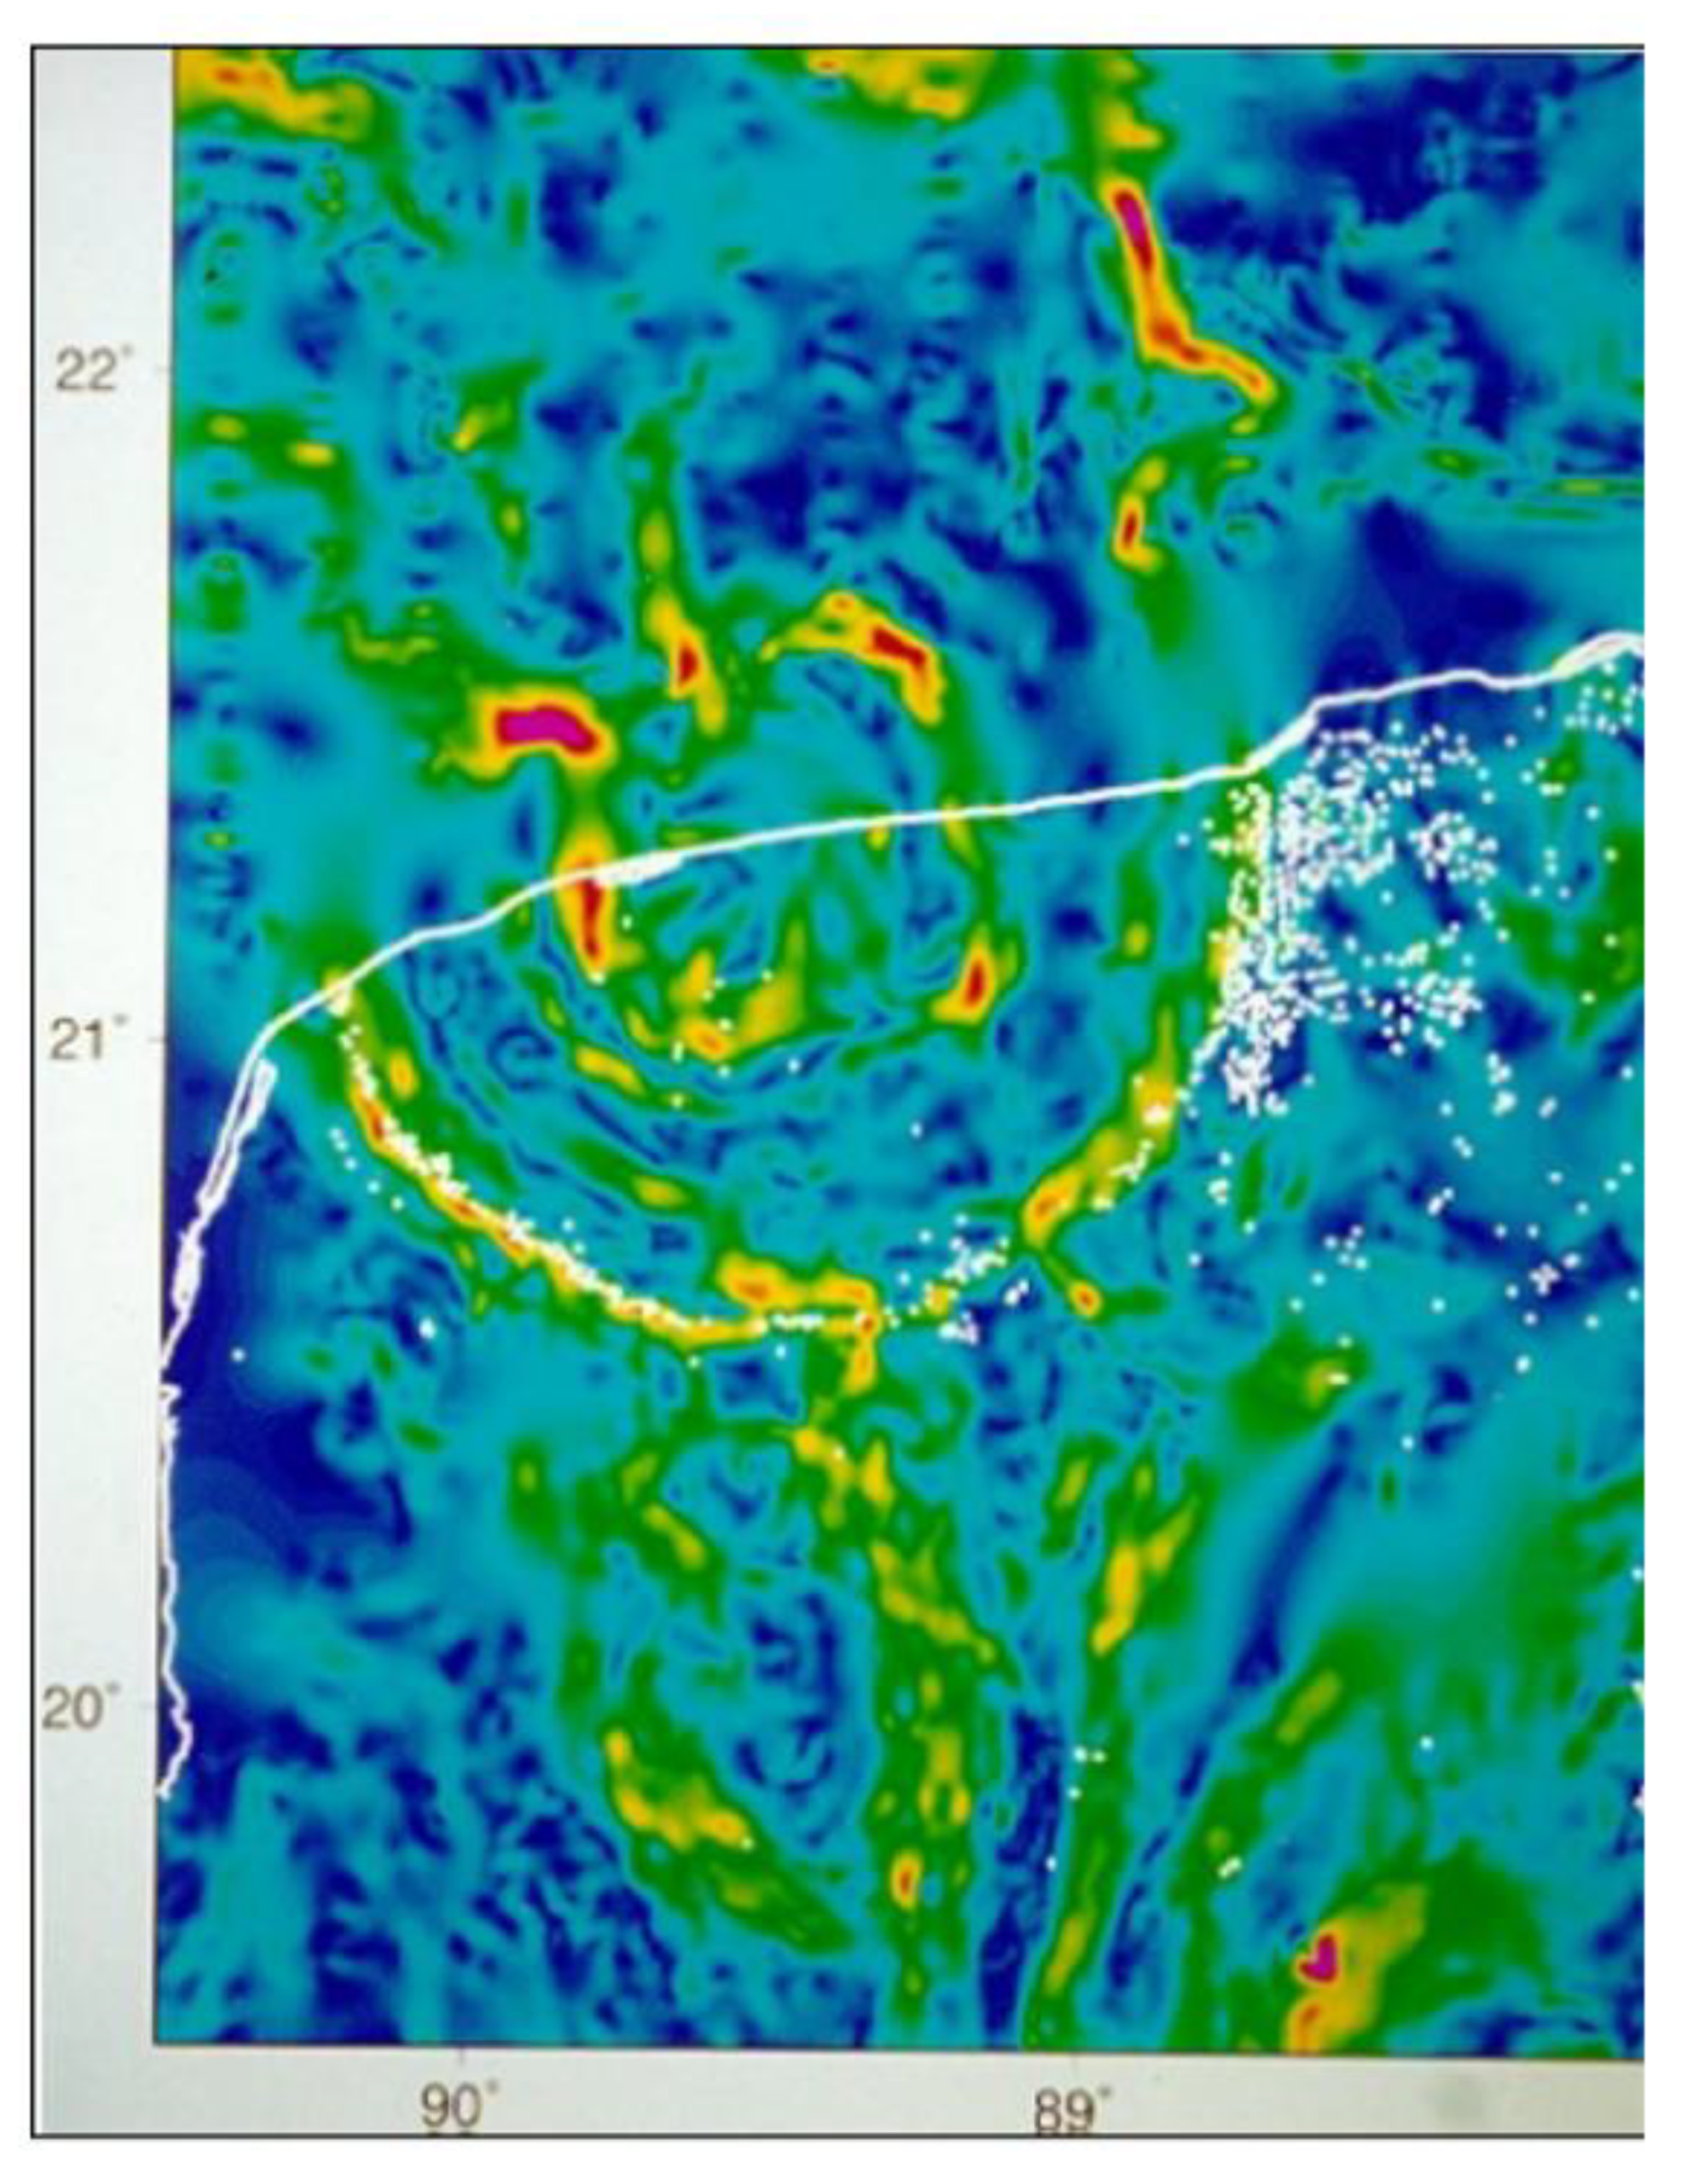
On the right, a magnetic anomaly map of the Chicxulub impact structure, dated 65 MYA at the Cretaceous-Triassic boundary, resulting in the mass extinction of non-avian dinosaurs. Half of the impact structure is buried under marine sediments, as Yucatan coastline (white) cuts through the center of the main crater. The white dots are locations of cenotes, which I believe are at intersections impact rings (joints in tessellation) which are weaknesses in the rock. On the right, center are clusters of cenotes, and if one looks loosely at them, a thick ring-like structure of cenotes is visible.
Magnetic anomaly maps record variations in the Earth’s magnetic field, between 25,000 to 65,000 Teslas (nT), and in this case, color shaded from high (red, orange, yellow,) for solid or igneous rock; and colors trending toward green and blue are unconsolidated materials such as sands, gravels, softer rocks. Magnetic imaging such as this can be adjusted for depth, for cross-sectional views and profile development. In the images canvas. I applied the ORH to the curvatures of the rings and shapes (top center on a painting in blackline); from that I was able to draw the black and white line drawing (lower left), then do a digital overlay on the original image (bottom center). The result was the painting of the structure (far right). My intent was to find the best way to show how these structures are built to demonstrate the movement of energy in waves. This dissection captures the power of impact as
the sum of multiple bolidal explosions. One observation I found remarkable about studying the shapes captured by the magnetometer is the extreme detail of the hundreds of structures down into the light to darker blue shades. Based on the ORH model it appears that the impactor was traveling southeast to northwest, at an angle less than 90 degrees.
Figure 14.
Chicxulub: Image sequence developing ring structures from magnetic anomaly map to painting.
Figure 14.
Chicxulub: Image sequence developing ring structures from magnetic anomaly map to painting.
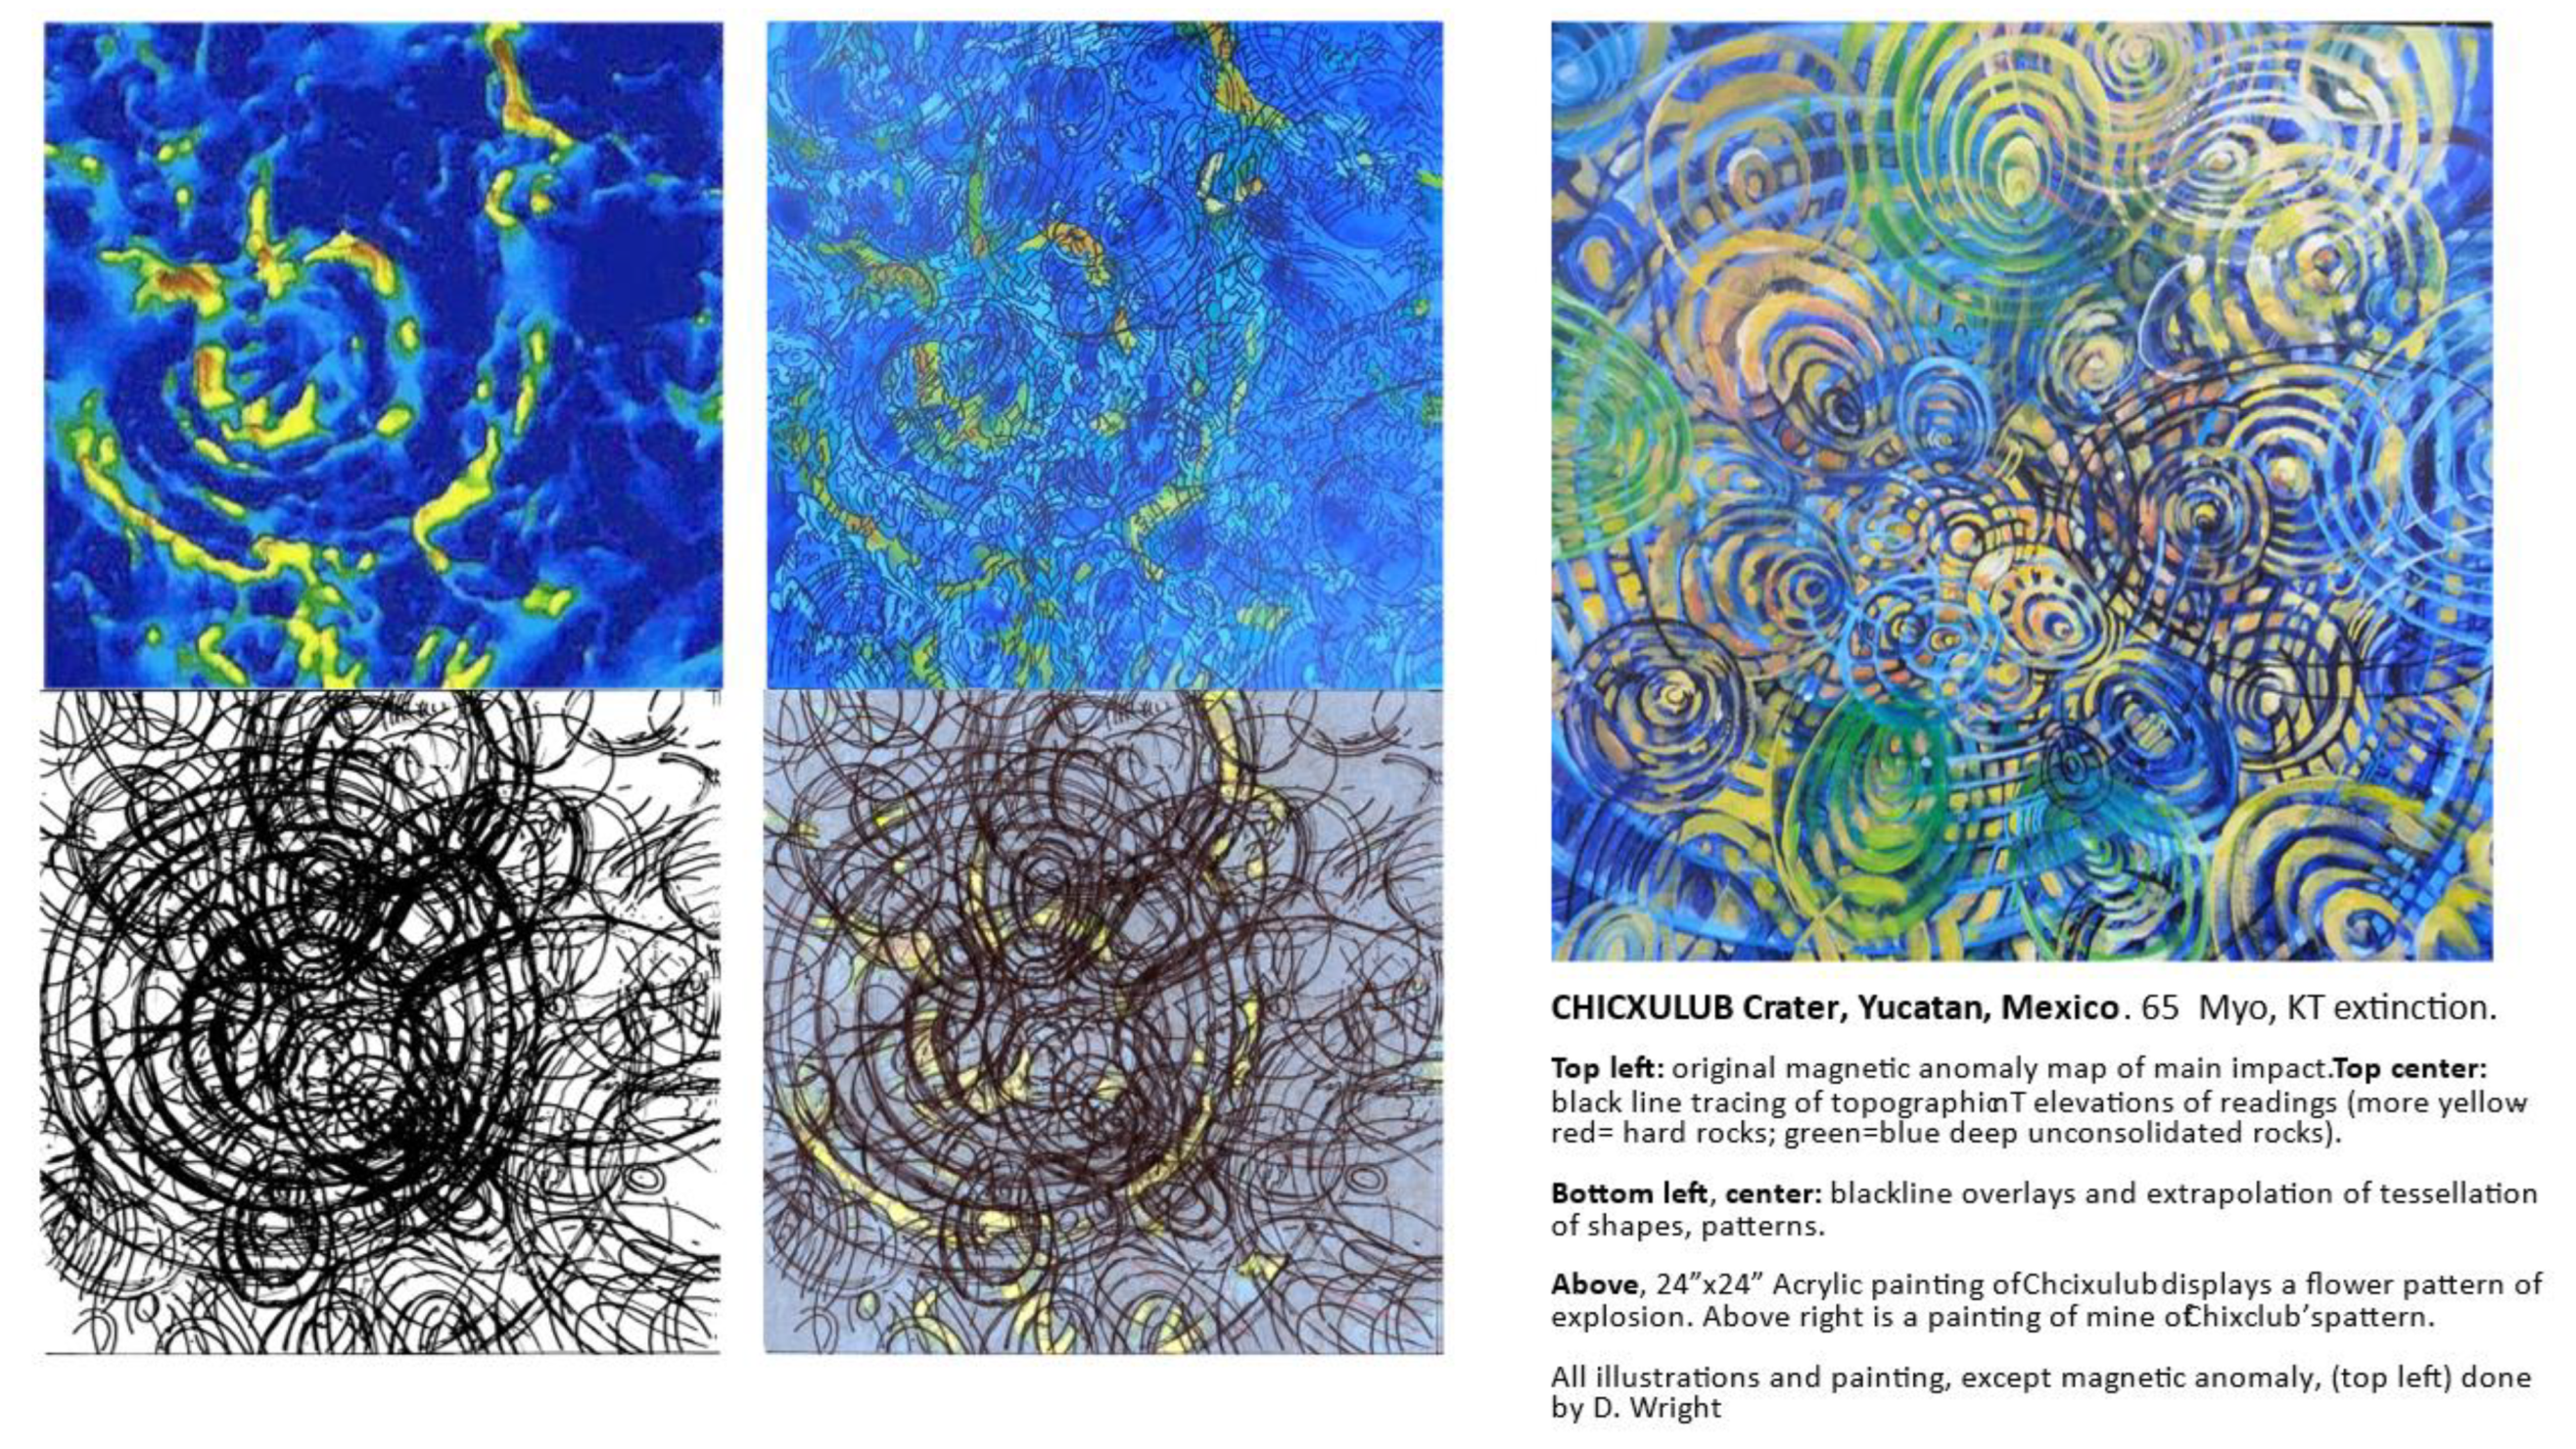
Also apparent are numerous large multi-ring structures radiating away from the parent bolide. Their tear-drop profiles show shallow entry explosion angles off the main parent bolide; and they too have their own offshoot structures. The lower center image is the composite, from which the top right painting is made. What is striking (no pun intended) about this analysis is to see structure footprints of hundreds of smaller and larger structures within and beyond the main impact.
Vredefort Crater
Vredefort Dome southwest of Johannesburg, South Africa is one of the largest, oldest, and most studied impact structures in the world. Over two billion years old, almost all the mountains that were generated by this event have eroded to where we now see the basement of the structure. Despite its age and severe erosion, the fractures, drainage channels, mountains and ridges describe an extraordinarily complex cratered landscape within the main structure.
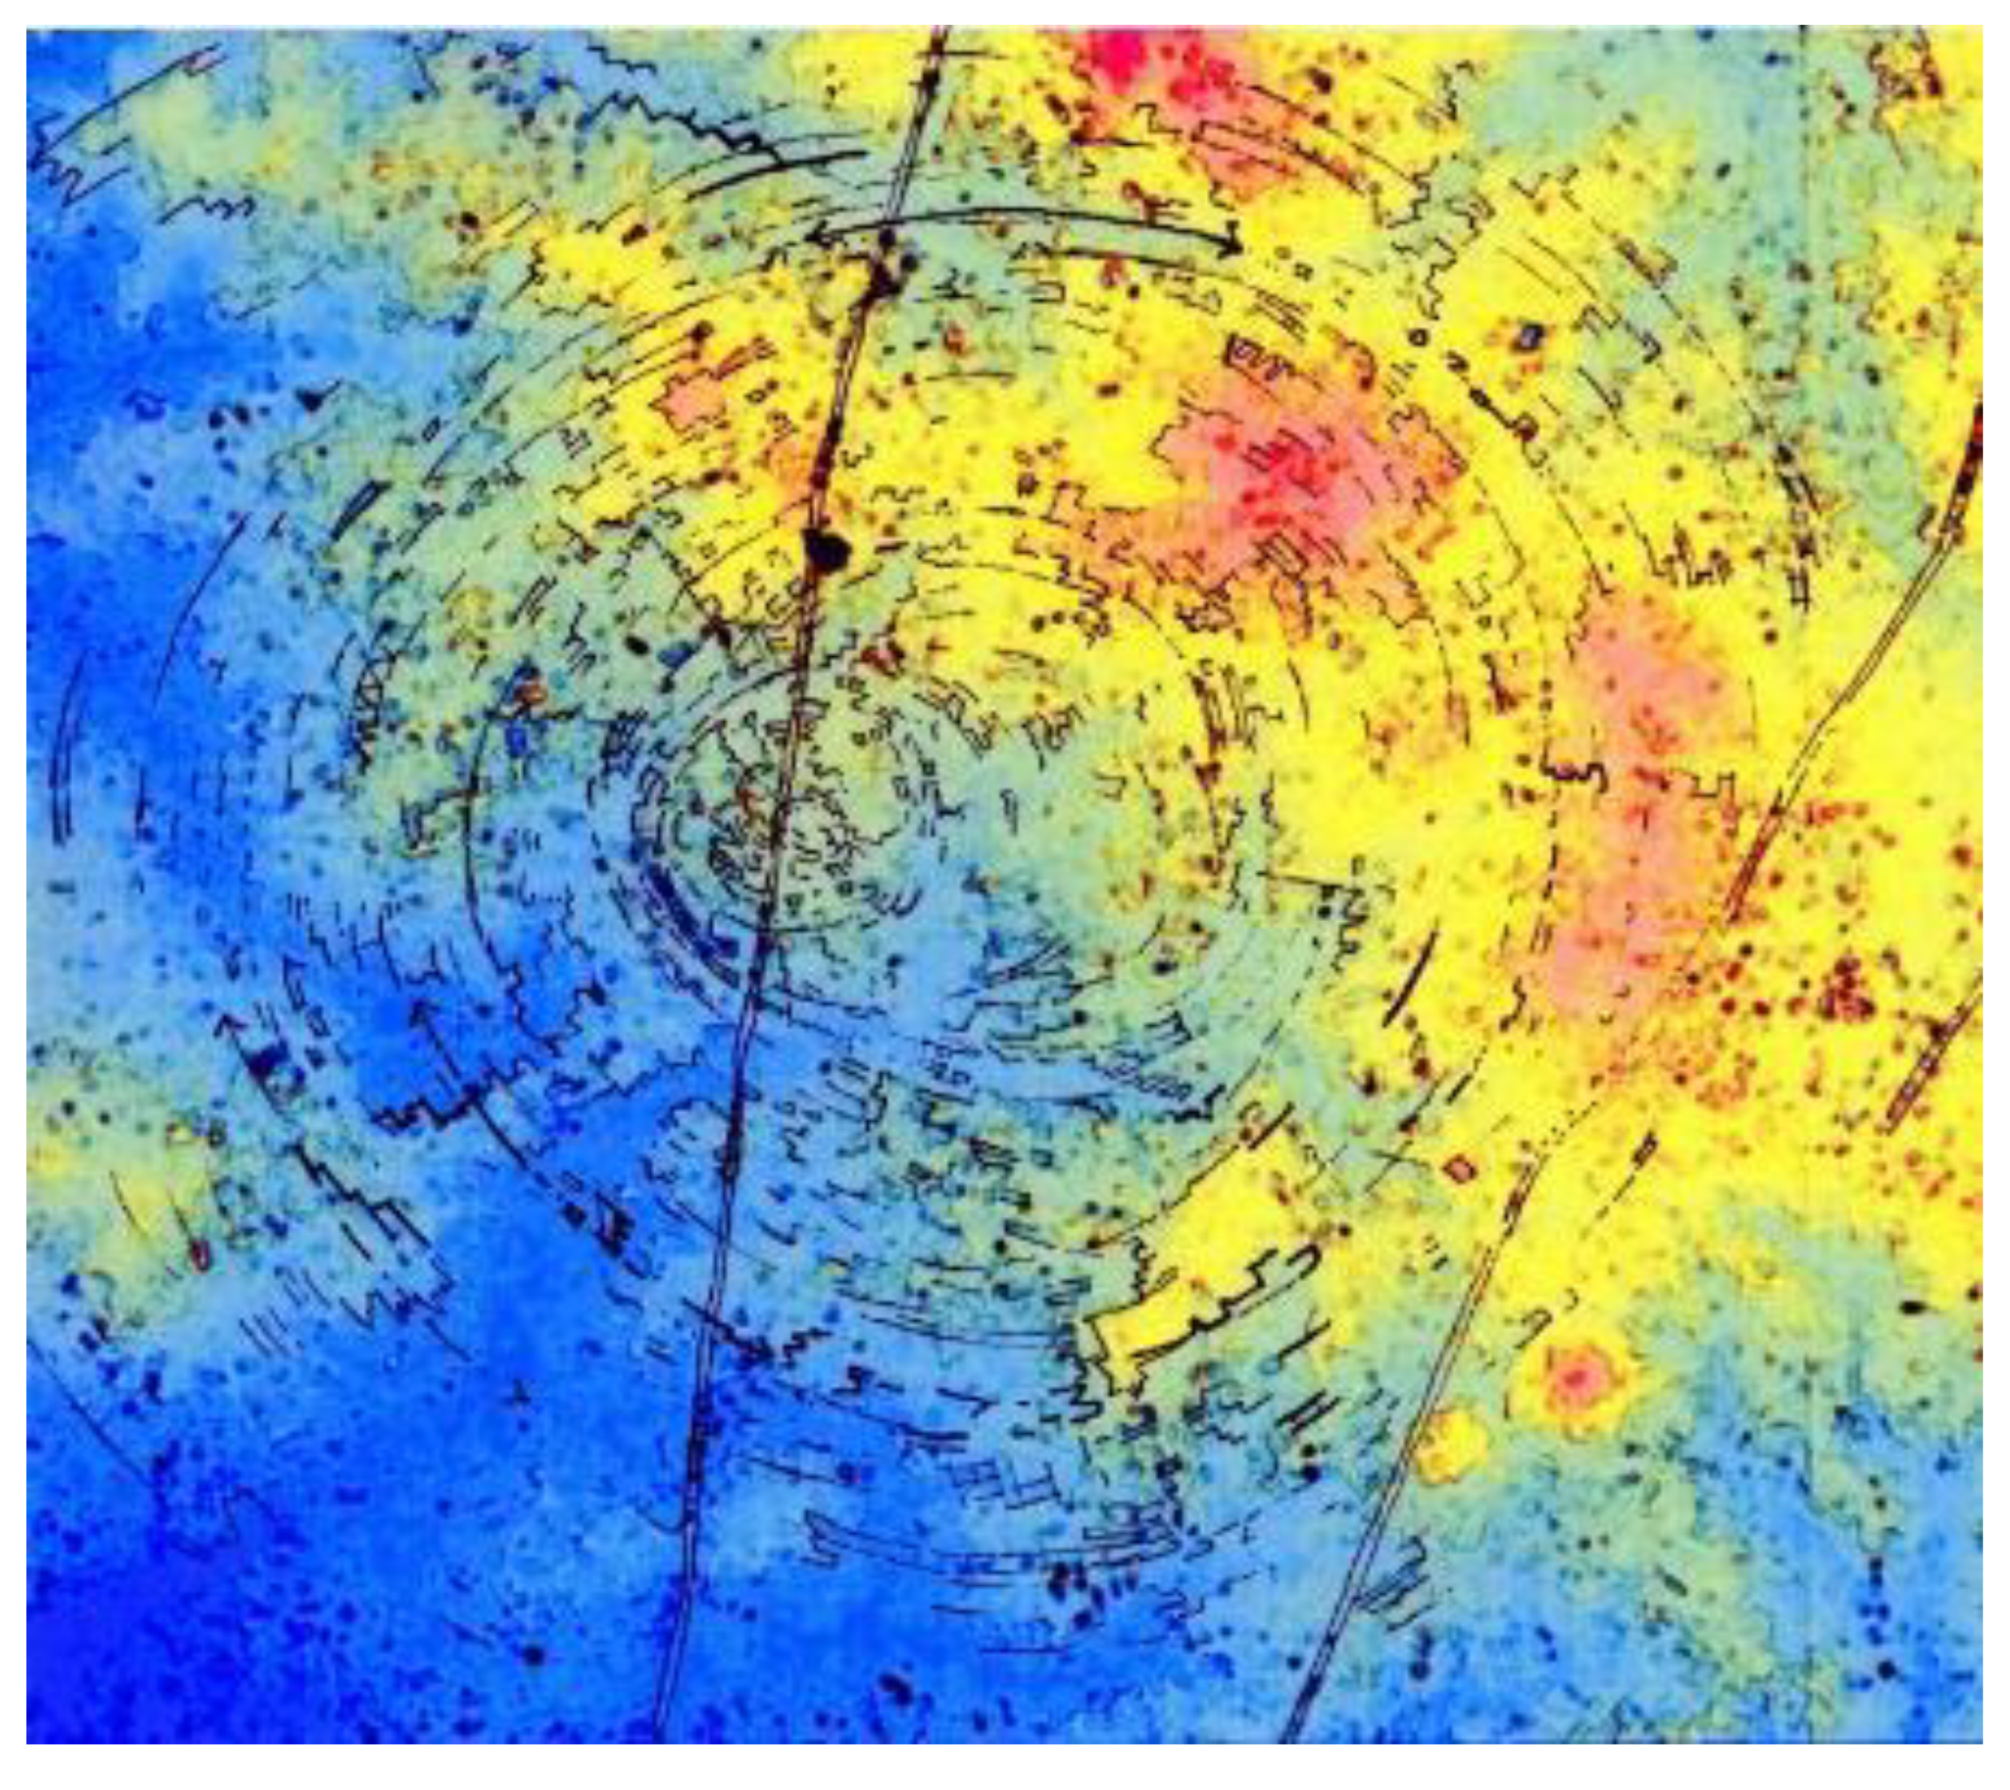
In the following figure of the Vredefort impact center, the same extrapolation of curvatures applies to the contour lines: the line is extended from wherever a change in direction is shown on the slope. Therefore, where a topographic line changes direction, it is from another impact blast within the main explosion. For a single impact, ground is excavated at right angles to the outward blast wind direction. It therefore follows that contour lines extended along a slope may be picked up again on another slope farther away, so the extrapolation of curves is applicable here as well.
Figure 15.
Above. Left image: Original Vredefort structure DEM at epicenter. Right: I hardened color boundaries to make it easier to track colors and curvatures.
Figure 15.
Above. Left image: Original Vredefort structure DEM at epicenter. Right: I hardened color boundaries to make it easier to track colors and curvatures.
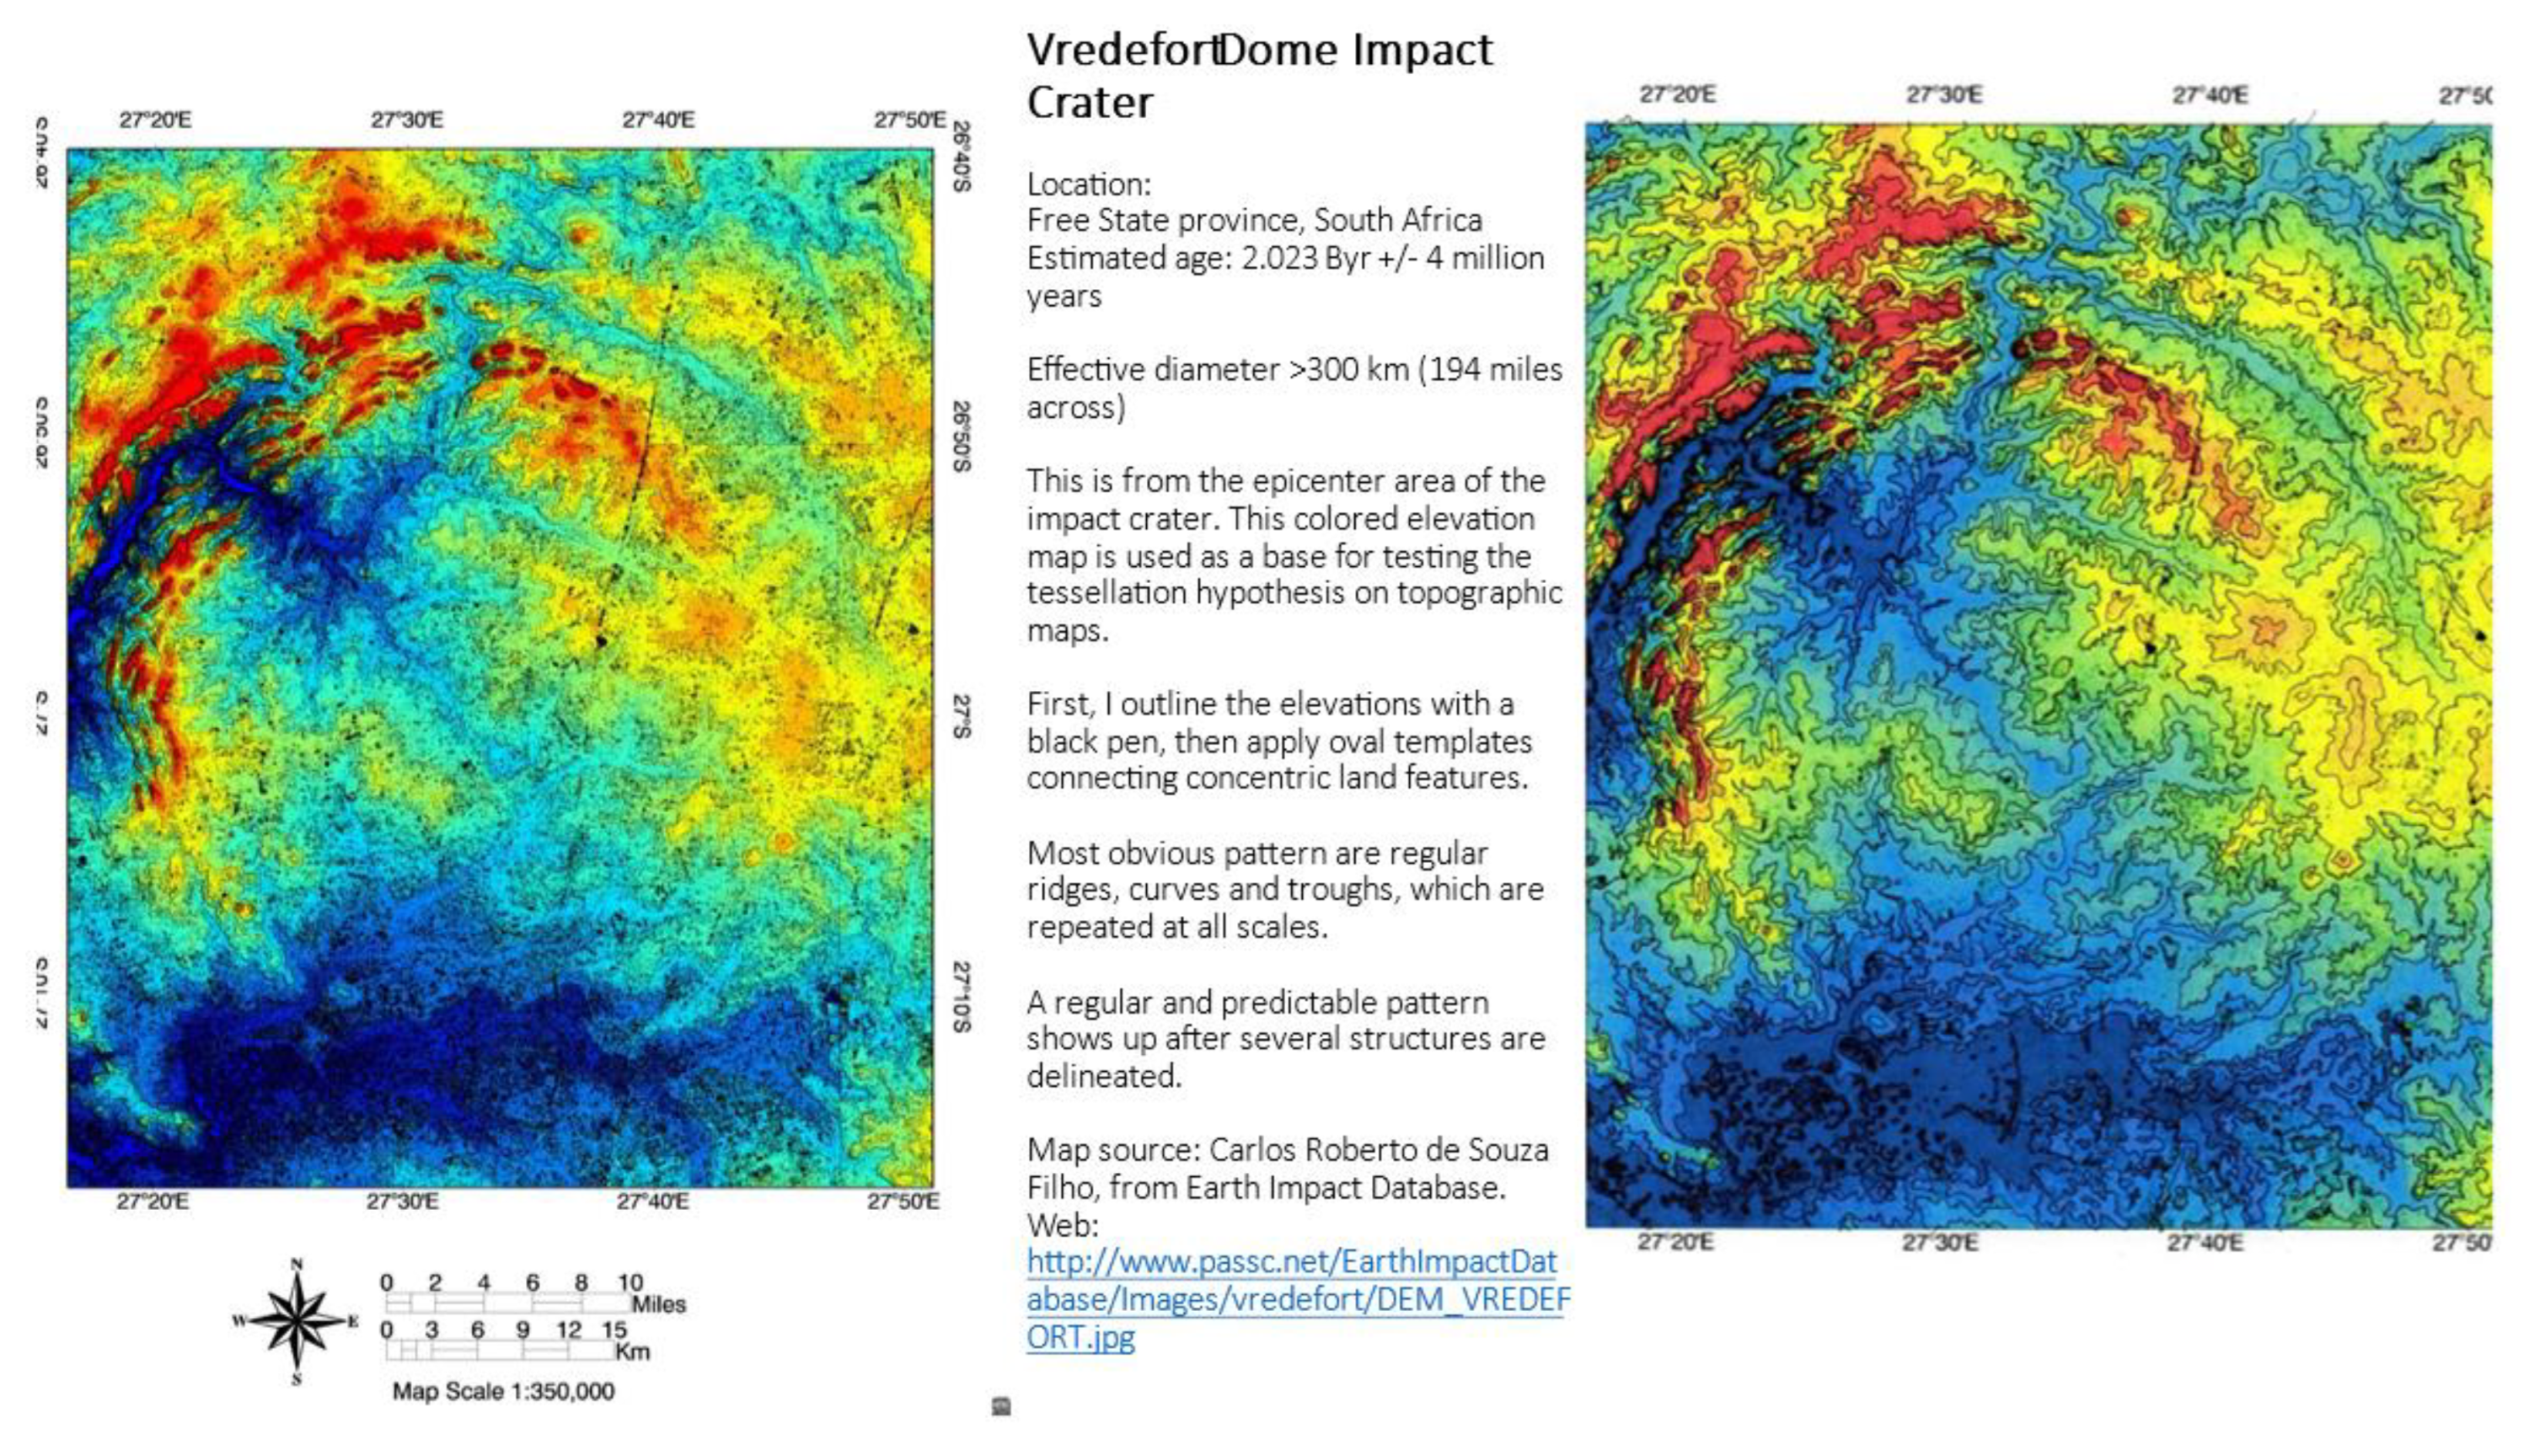
Figure 16.
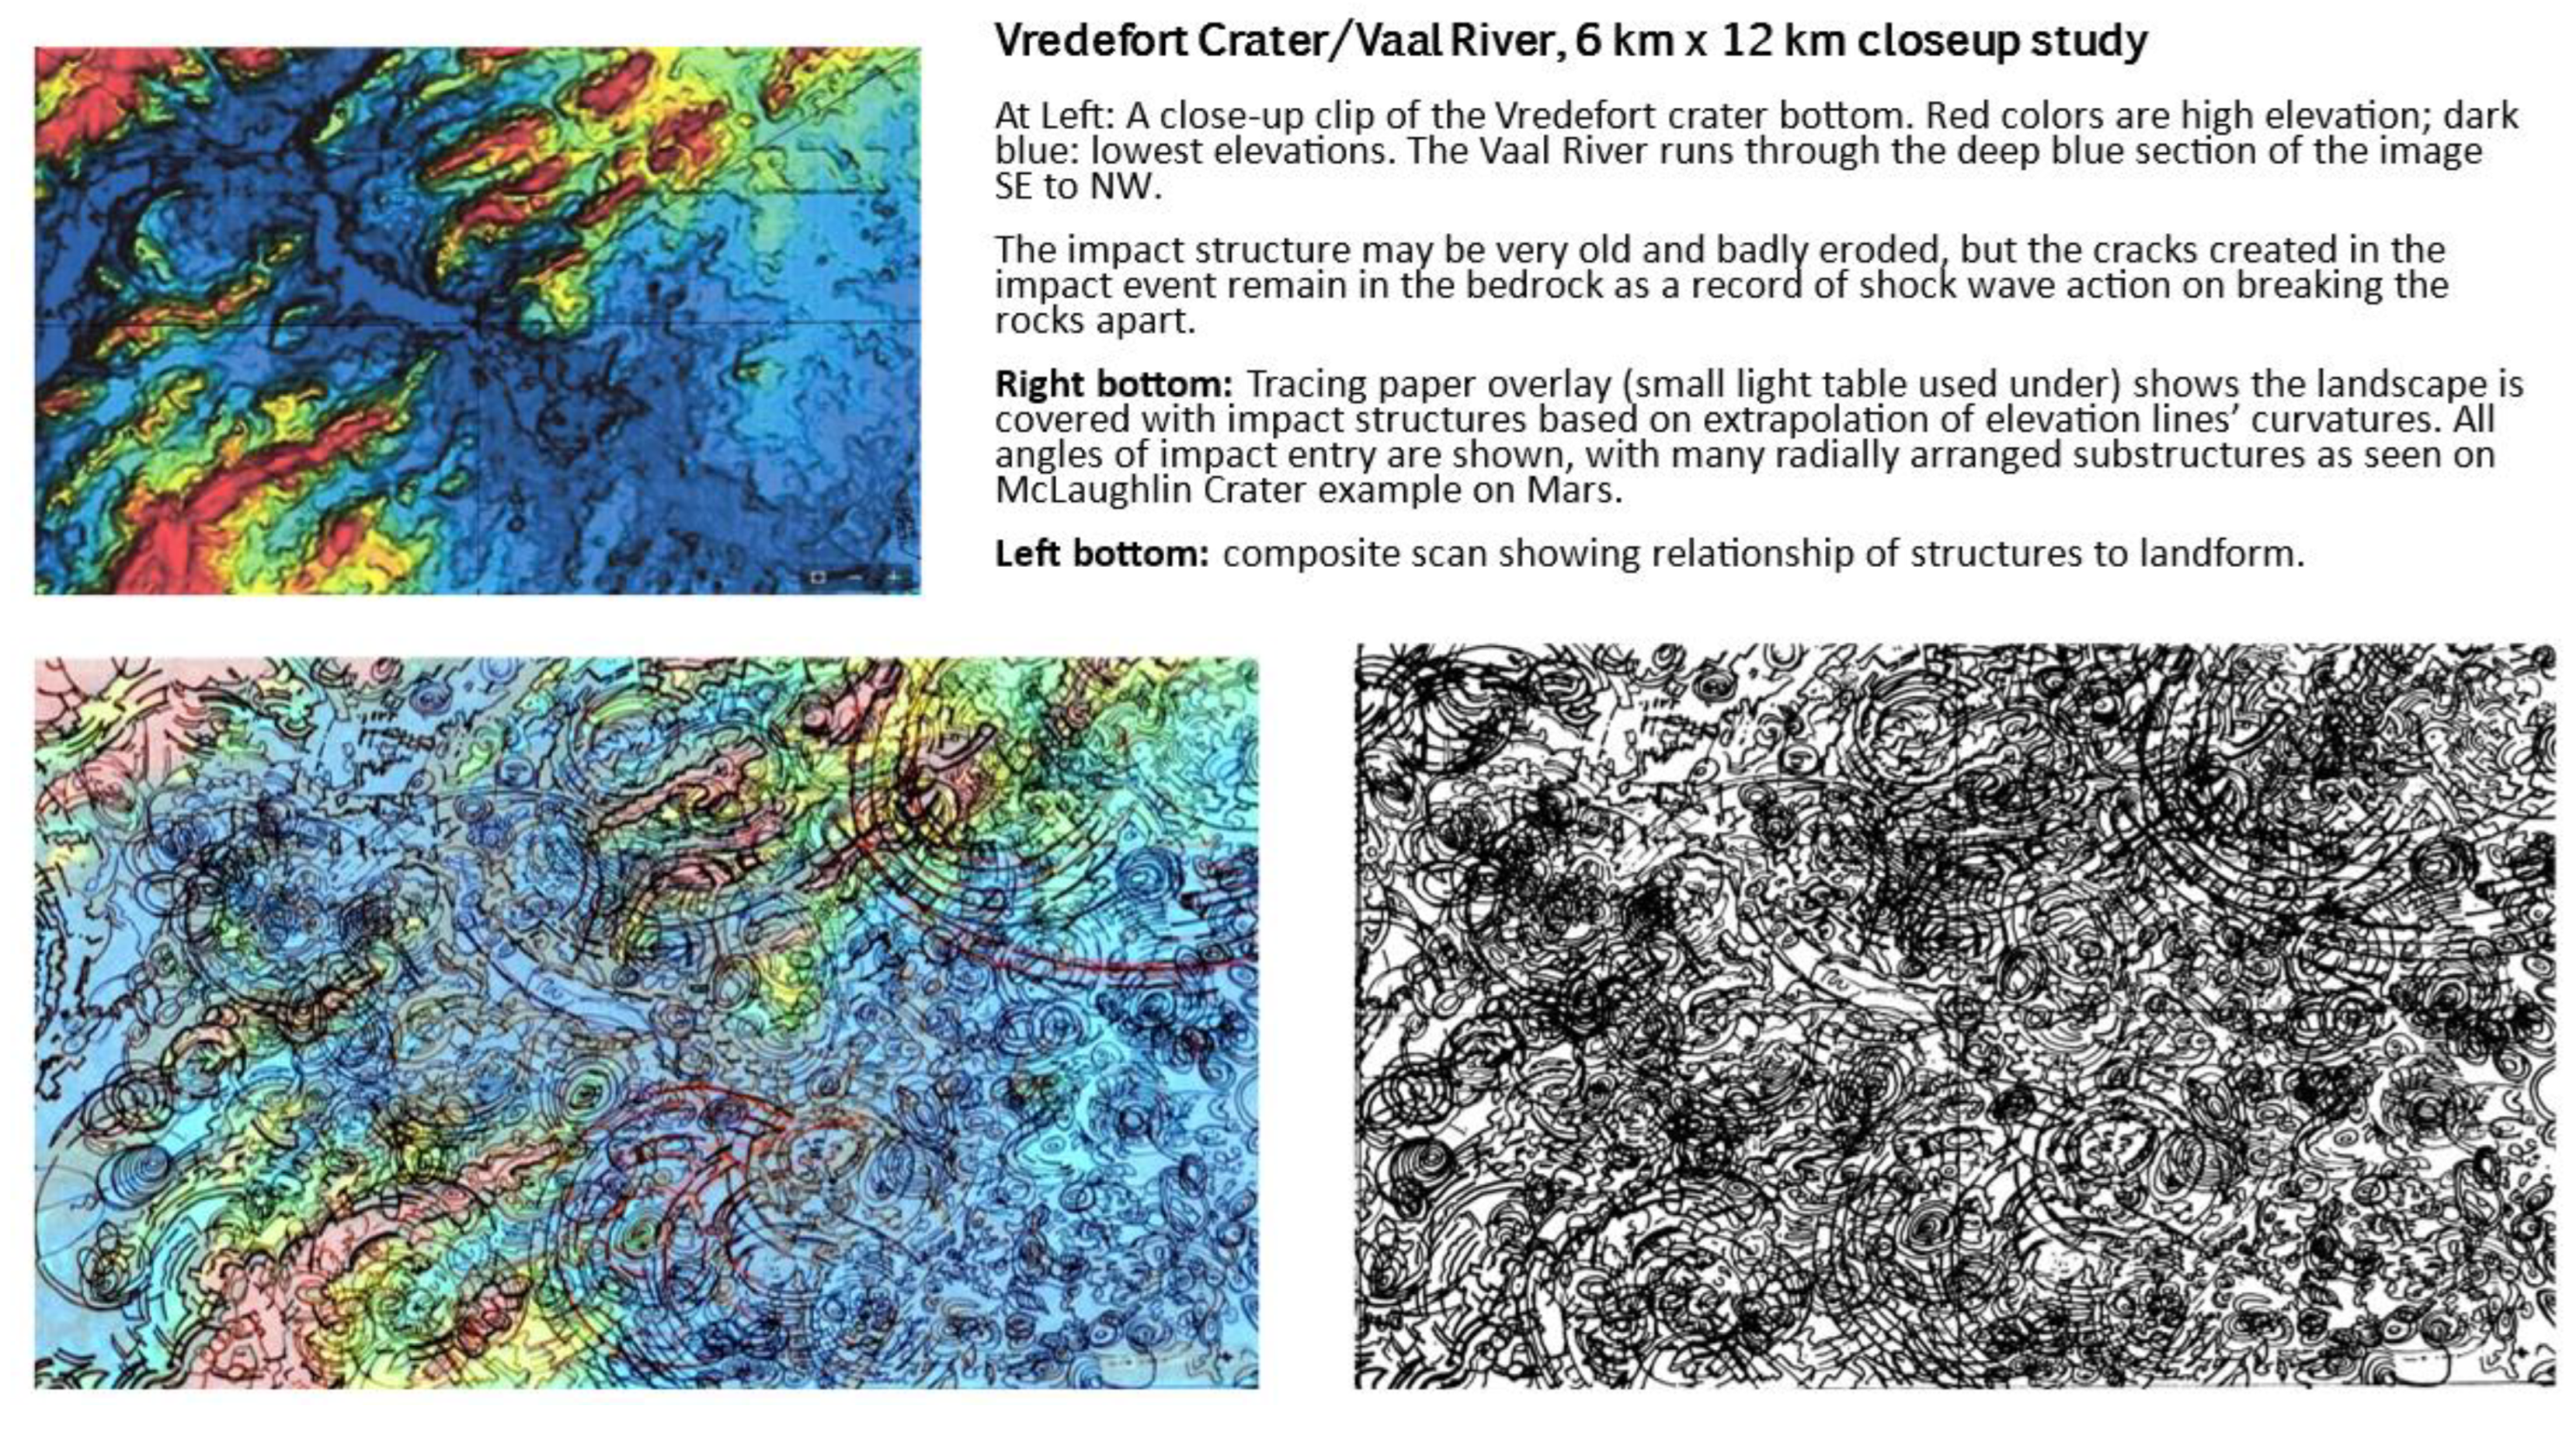
A closeup illustrating the use of clustered directional lines to delineate a single structure within Vredefort’s epicenter.
Figure 16.
A closeup illustrating the use of clustered directional lines to delineate a single structure within Vredefort’s epicenter.
Because of the complexity of so many overlapping impact structures in the image, it is easy to lose track of just one internal structure but using clustered directional lines and extrapolated curves help to focus on just one impact location within the center. It is evident in the illustration at left, of regularly spaced bands of shockwave-shaped rings expanding from an angled strike. Other curves intersect these rings at apparent right angles, but really are slight curves as part of other rings crossing each other. Note that the surface ground in this crater is all that remains of a mountain of a central peak, now eroded to its basement level, yet the fractures and signature geometry remain. Following is an analysis I did of a 6 km by 12 km section of Vredefort crater showing hundreds of microstructures within the larger ones. What is remarkable is that geometry is the same for each structure regardless of scale.
Figure 17.
Vredefort Crater closeup study. D. Wright illustration.
Nordlinger-Ries Crater, Germany
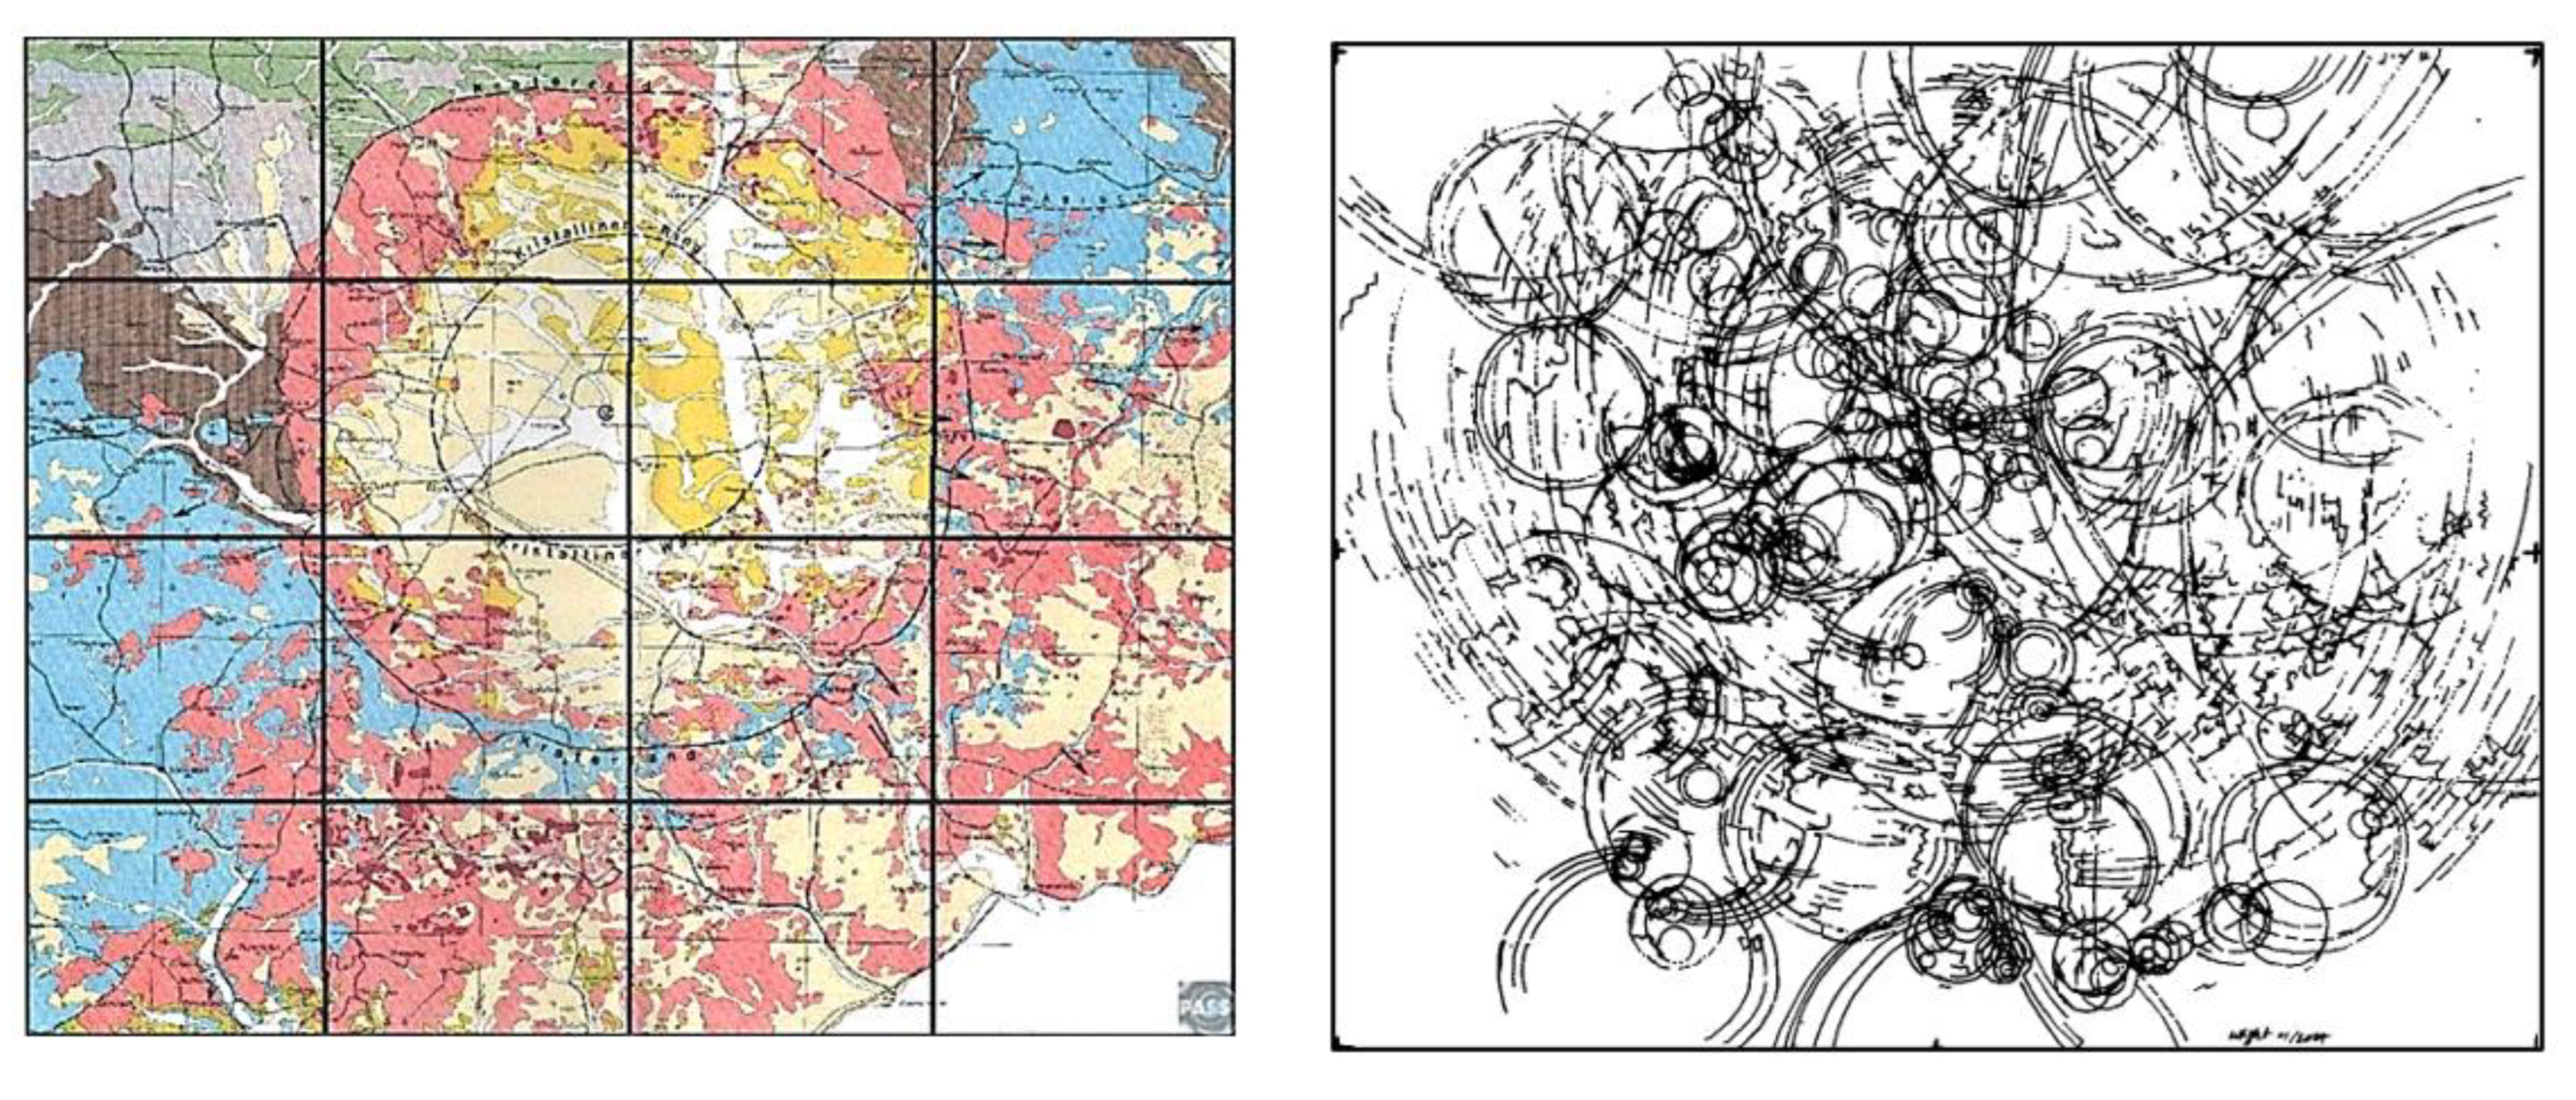
The Nordlinger Ries impact crater surface geology map as another example of applying the ORH to an impact crater in a working, inhabited modern European landscape. At 24 km wide, and approximately 15 million years old, the bolide is determined to be an Achondrite impactor. On the left, the geology map shows the inner crystalline ring (Kristalliner Ring), and on the right, extrapolations, and interpretation of the surface expressions of the geologic units take on these
structures and concentrically expanding rings. What is obvious from this interpretation is that the structures and expanding ripples of impacts go beyond the effective/crater rim (Kraterend). Note the similarities to Vredefort.
Figure 18.
Above: Nordlinger-Ries Crater geology map, left, blackline interpretations of the geometries of impacted bedrock in the structure and surroundings.
Figure 18.
Above: Nordlinger-Ries Crater geology map, left, blackline interpretations of the geometries of impacted bedrock in the structure and surroundings.
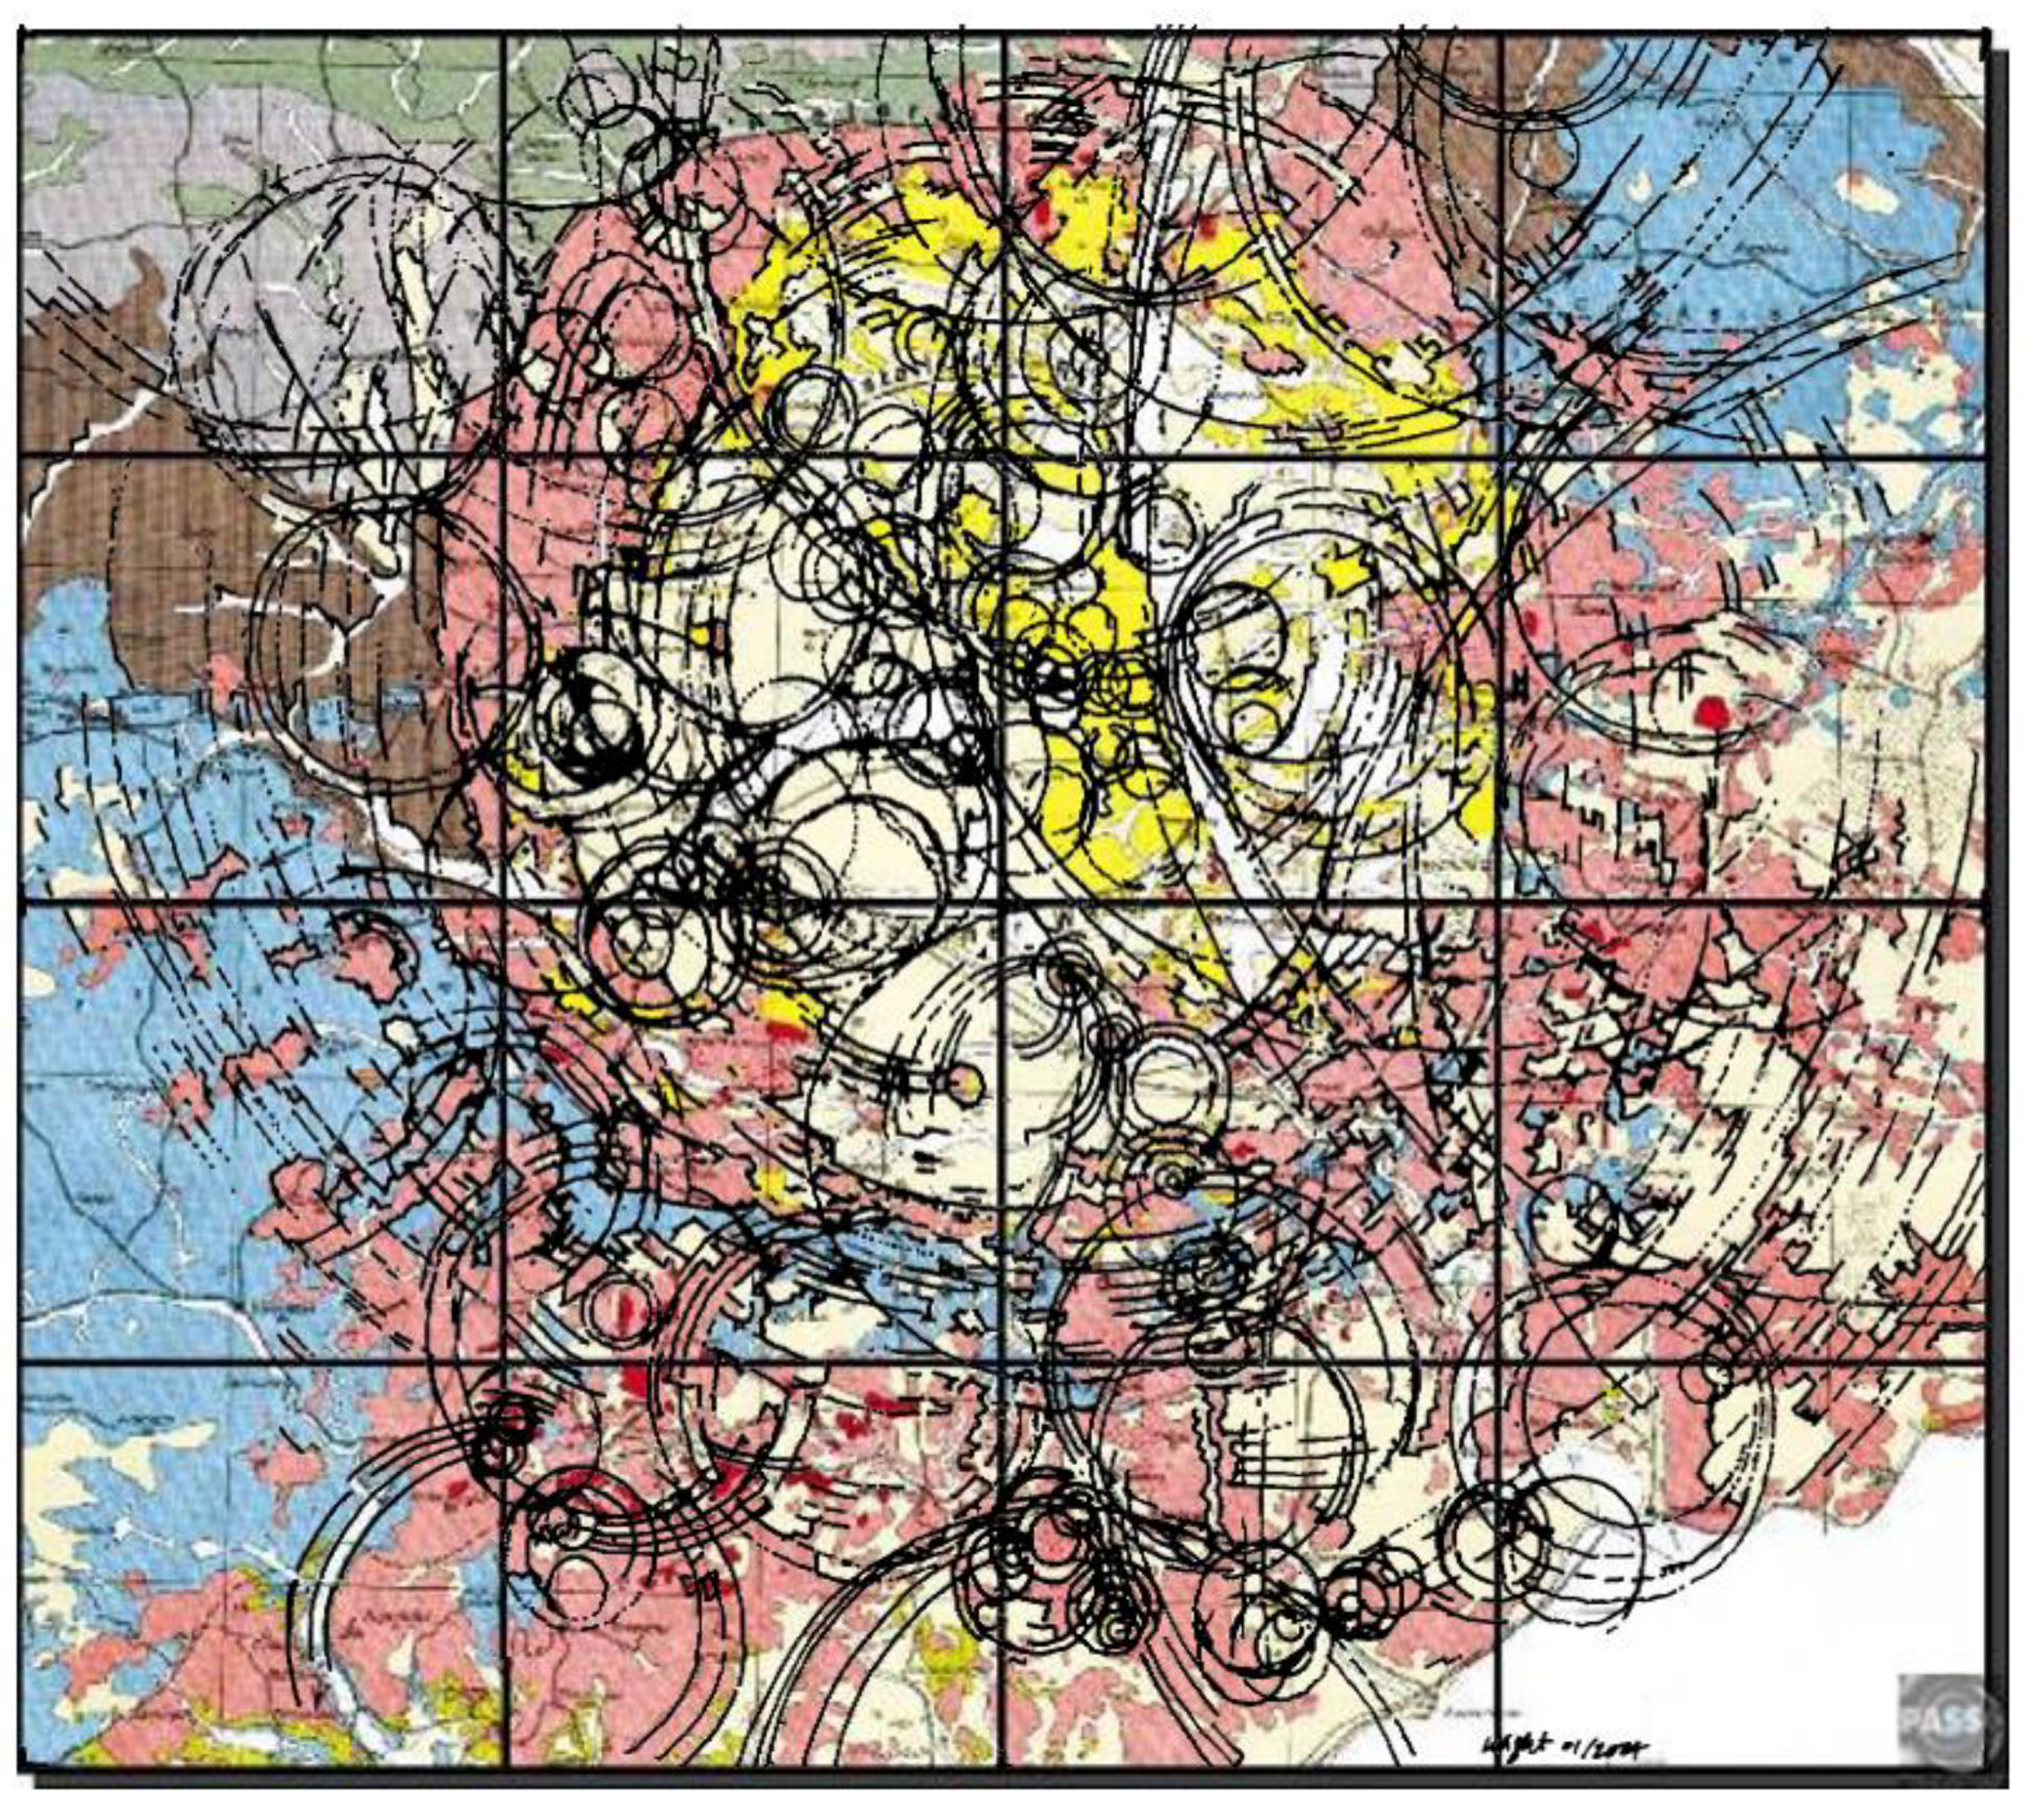
Alone, the geology map gives a general form of the structures’ circularity, and hints at other shapes. But when applying the ORH hypothesis and extending lines of curves (ignoring the rock types, but looking for continuations of shape), the patterns emerge more when I draw a blackline overlay on tracing paper (right). Then after scanning the image, I eliminate the white color to see through to the geology layer below as in the following image. Superimposed, the blackline tracing and rock types outline the patterns of a bolide exploding on the Earth: many very circular structures indicating near-90-degree impact entry, a ring of rising material (red/pink), and explosions just outside the effective rim (bottom half of image).
The most impressive aspect of this composite image is the strong correlation of the rock types and the geometries of impact explosion and fracturing, repositioning of the target rocks into a circular/parabolic/radially tessellated assemblage. The blackline analysis shows how clustered directional lines can highlight geometries of the different rock types, to describe individual impacts and direction of travel for the fragments. Beyond the main impact epicenter clustered directional lines show expanding ripples, while other impact fragments created their own structures complete with their sets of shockwave rippling, fracturing. Like Vredefort, Nordlinger-Ries shows regular ripple bands.
Figure 19.
Composite of Nordlinger-Ries geology and interpreted blackline analysis of impact geometries. Black line image by D. Wright.
Figure 19.
Composite of Nordlinger-Ries geology and interpreted blackline analysis of impact geometries. Black line image by D. Wright.
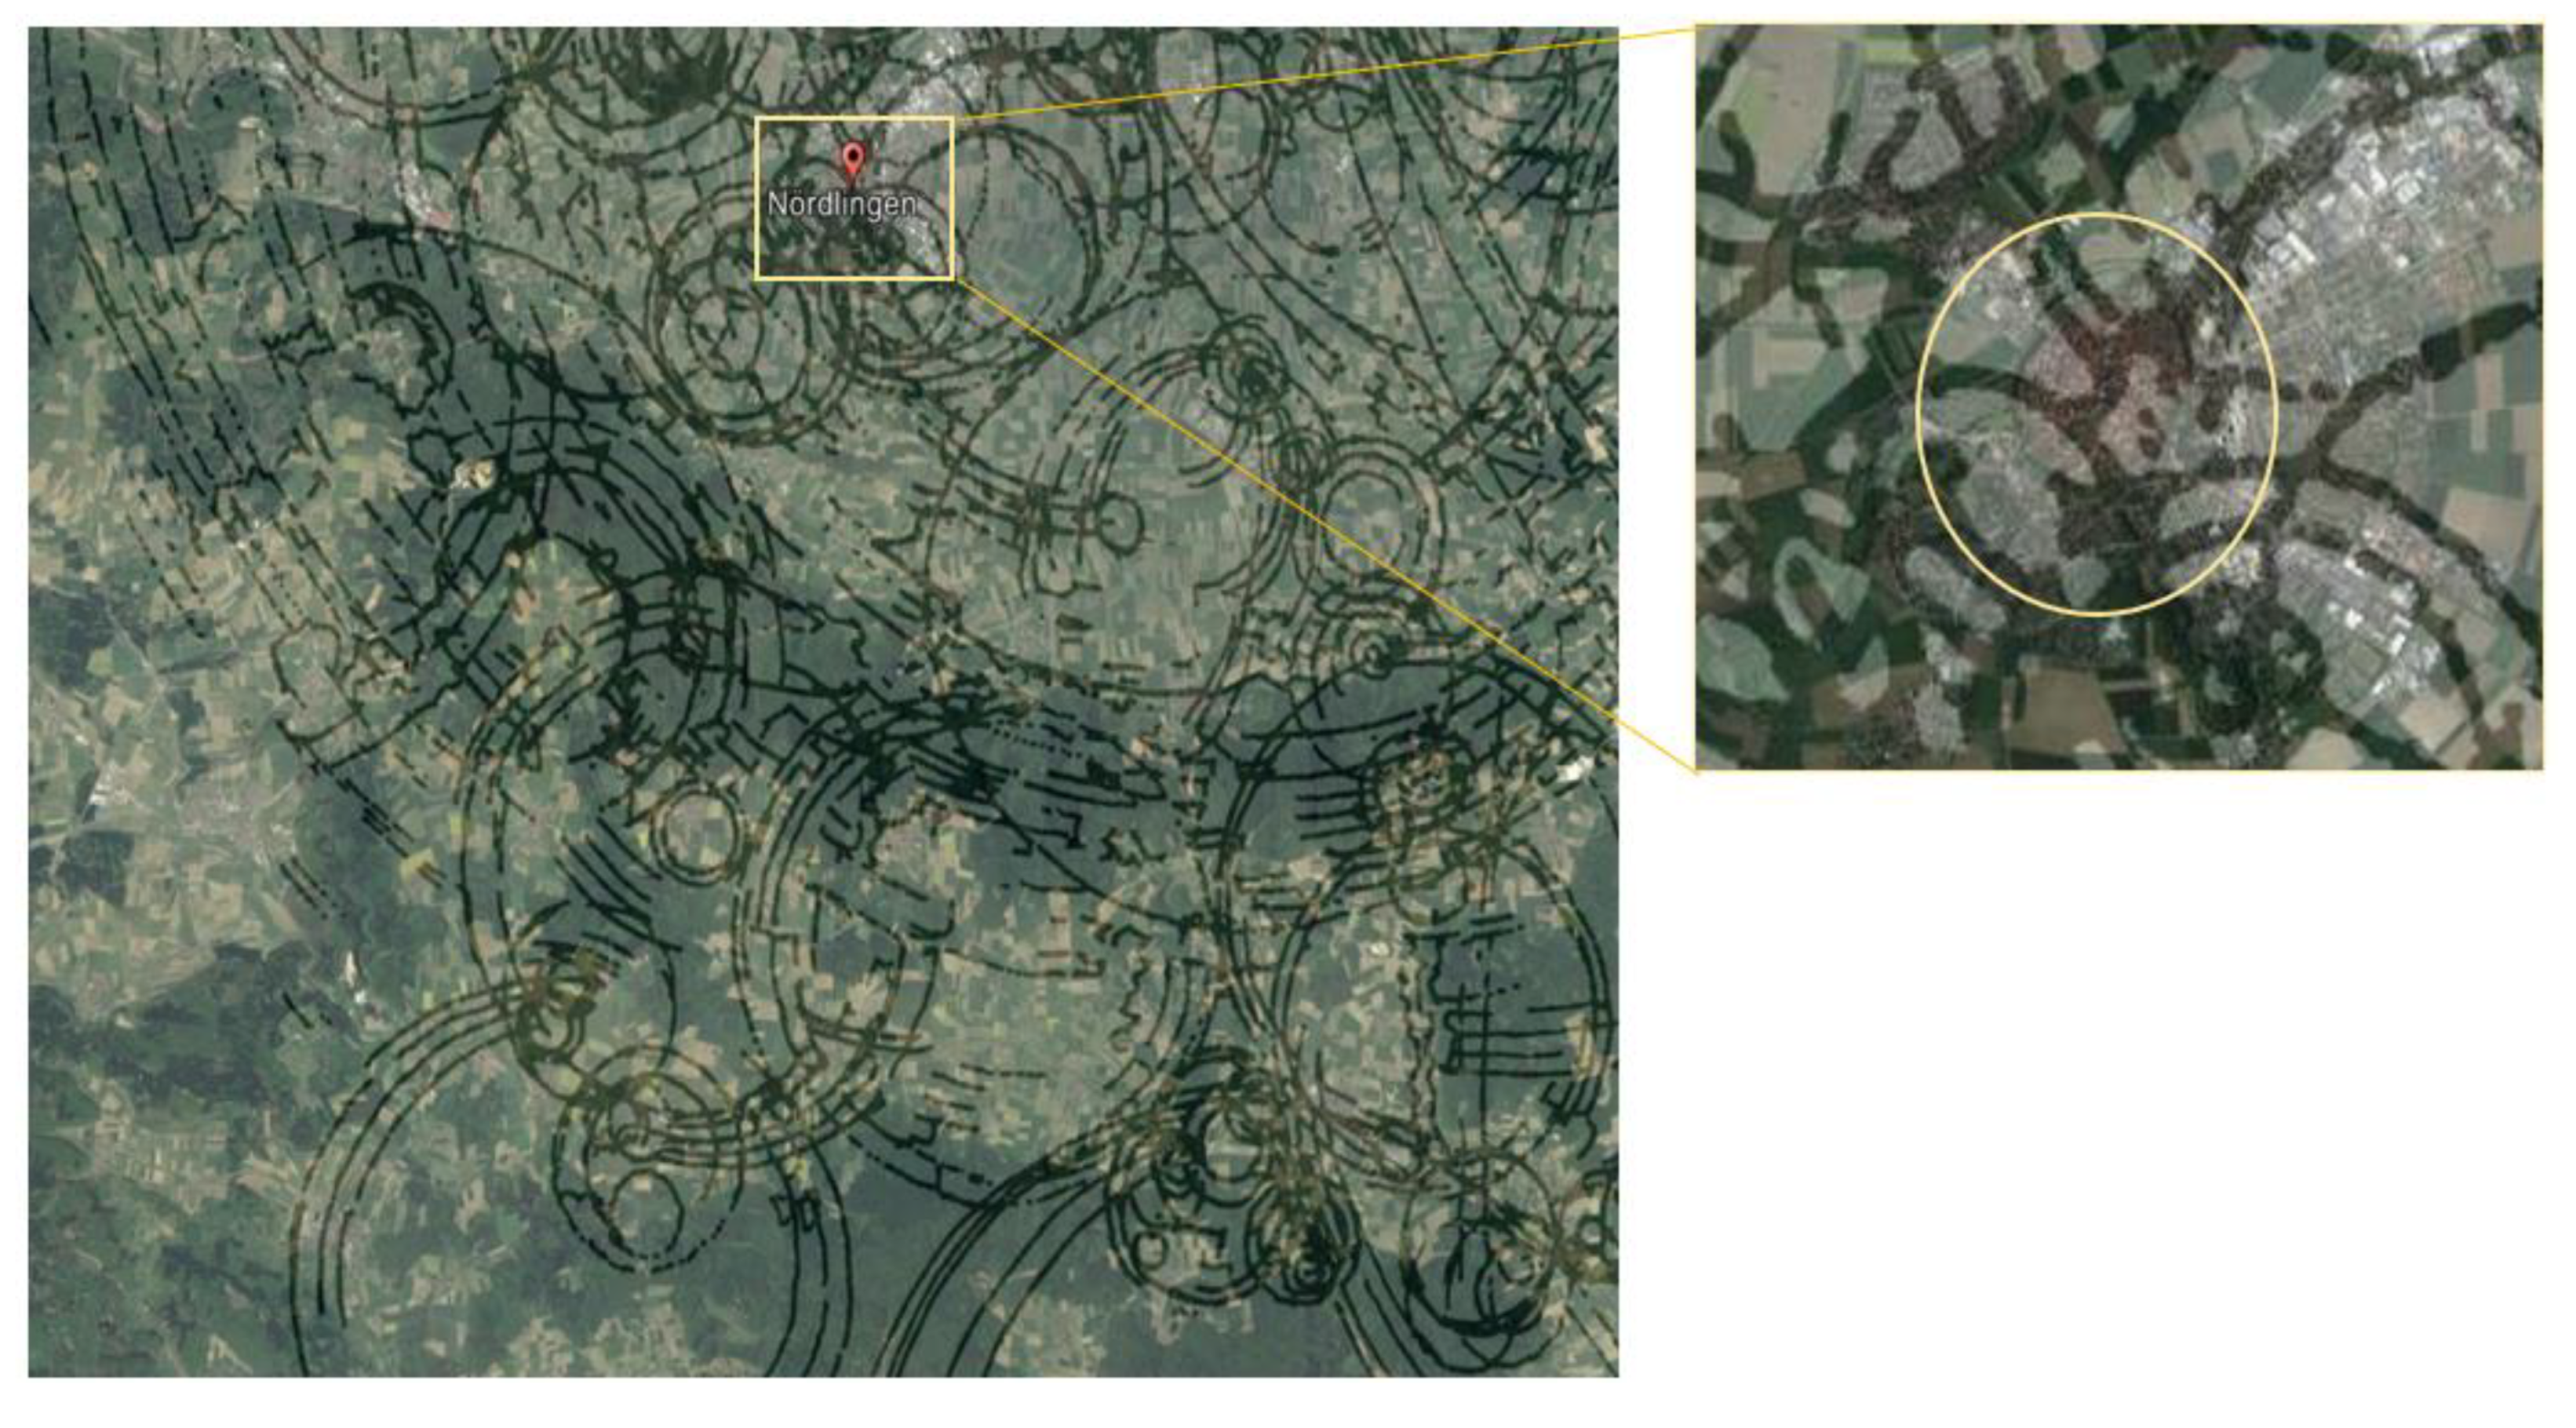
The following image is the same blackline drawing as a layer on Google Earth imagery of the Nordlinger-Ries crater.
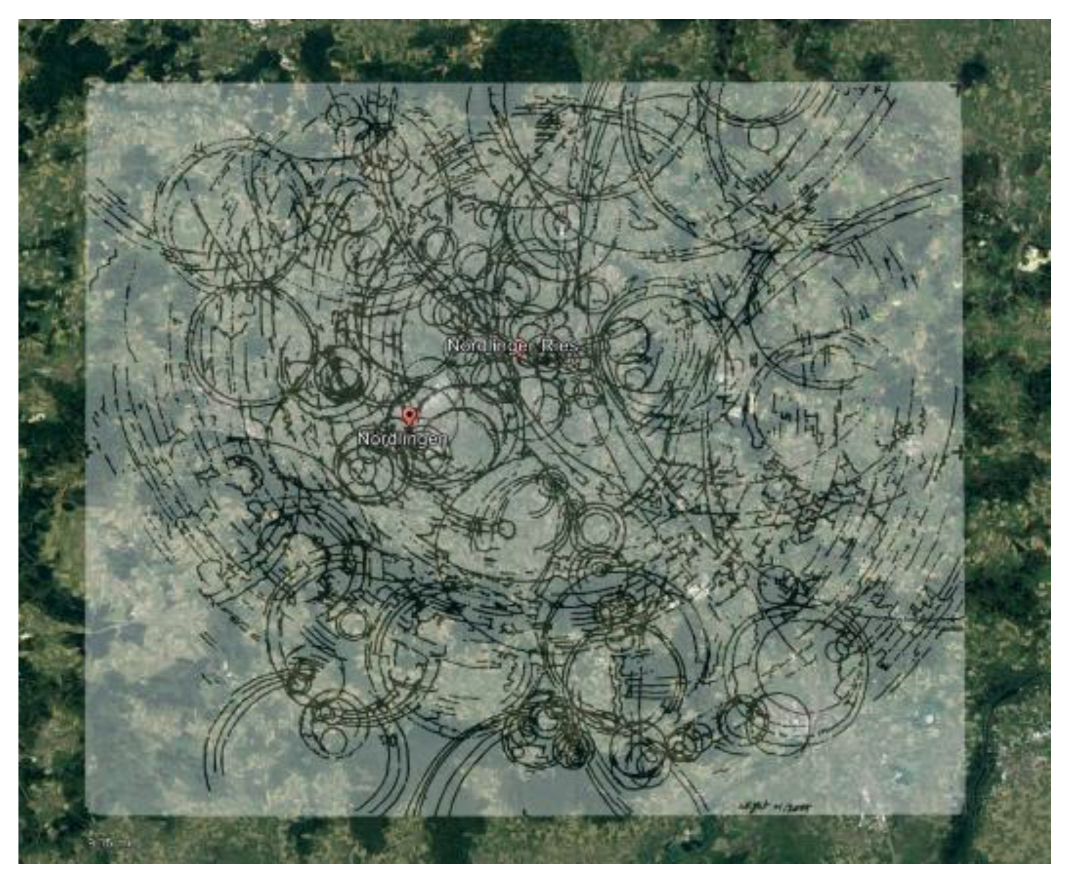
Looking closely at this composite shows right away, a strong relationship between the areas of tree cover along the southern effective rim, and impact structures beyond that rim. What is also noticeable is that inside the effective ring, and other ring sets is open land, occupied by hamlets and agricultural fields, as the following closeups will show. The next image shows the southern effective rim. Notice the strong geometric relationship between the rings as determined by the geology map, forested areas, and the allocation of land uses.
Figure 20.
Above: Nordlinger Ries blackline overlay showing how forested areas reflect curves of the impact rings. On the left, Nordlinger-Ries’ southern rim is dominated by forested slopes north of higher areas, while the ring basin is occupied by agriculture, roads, and residential areas. The response to the landscape here is so strong the old part of downtown Nordlingen occupies a small impact epicenter (inset).
Obviously, the structure is a drainage basin; and examination of forested areas within the structure also seem to match lines of intersecting and closely spaced arcs and tessellated land features, suggesting that these are lower, therefore, wetter areas than others, occupied by streams and wetlands. Other forested areas are on steep slopes facing towards the center of the basin. The land patterns so strongly reflect the local geometry that all developments and fields radiate outward, concentrically about the old core.
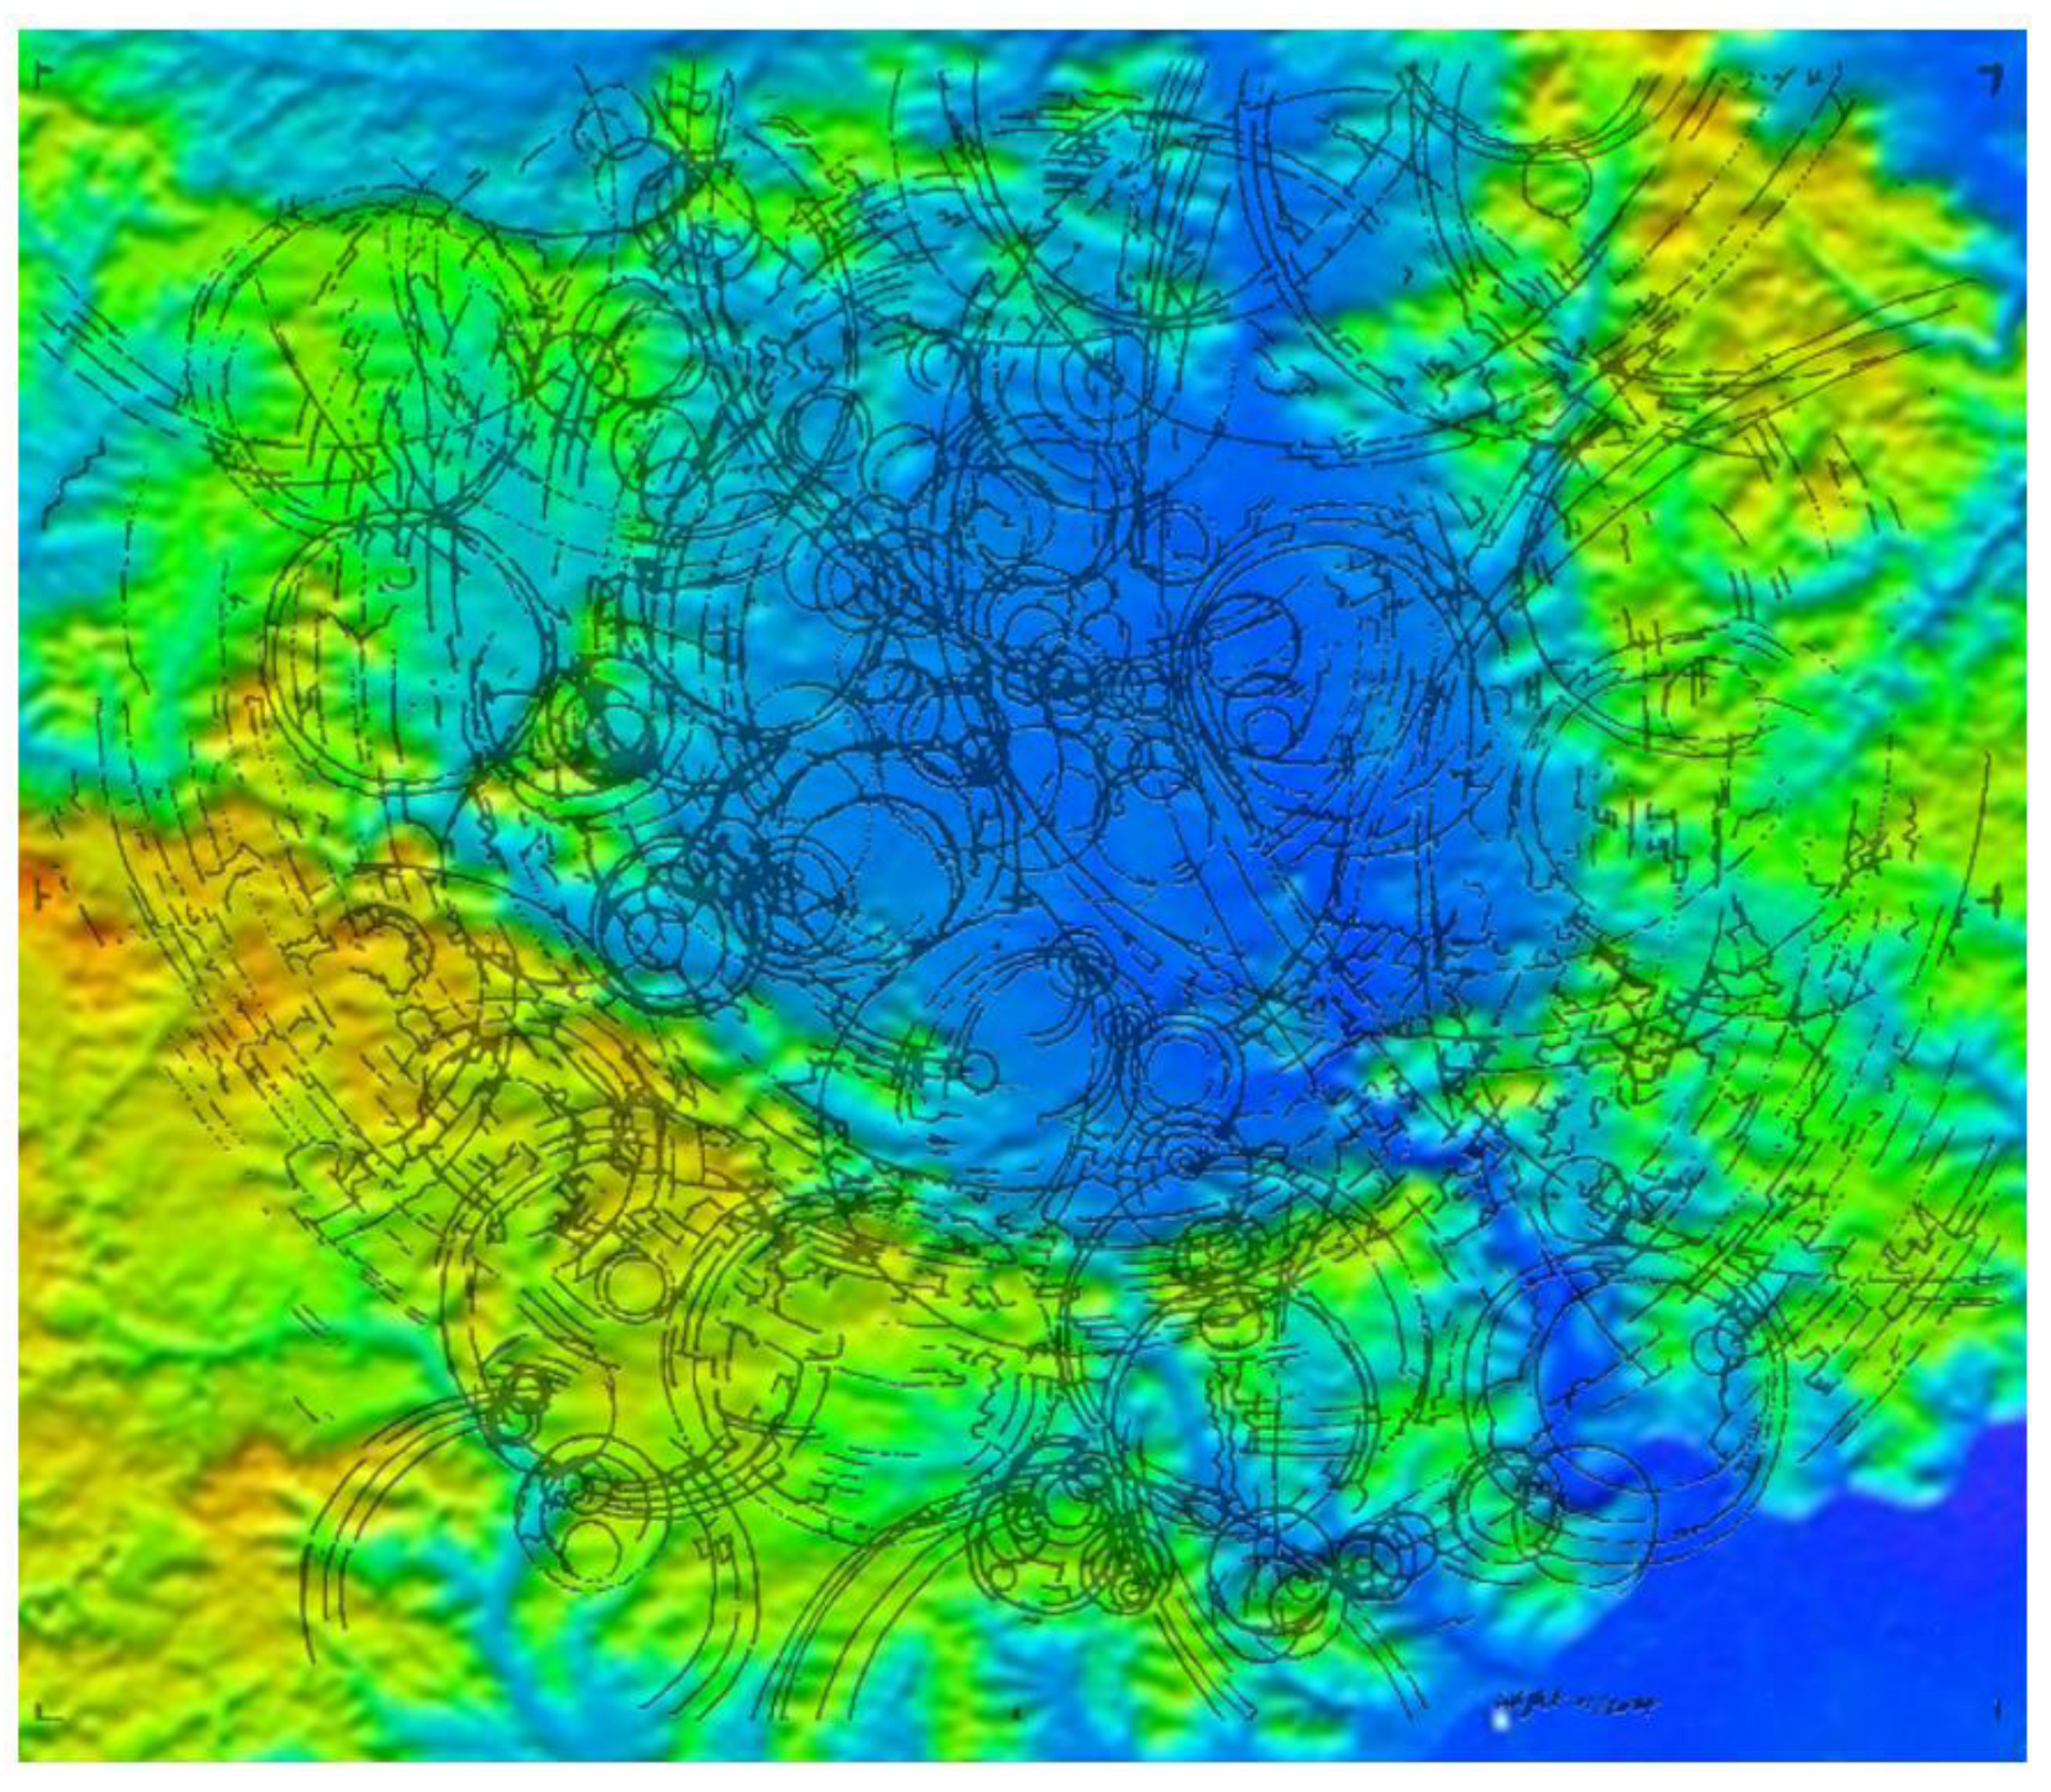
And finally, I superimpose the blackline tracing of the geologic map from earlier onto a color topographic DEM map of the Nordlinger-Ries crater. Again, the use of clustered directional lines delineates the ringlike patterns of the main and lesser structures down to a few meters across. The outlines of the geologic blocks, rock type boundaries, larger and smaller impact structures correspond to the color shaded topographic DEM image, also showing onion-ring like blocks and arcs.
Figure 21.
Correlation of geology blackline tracing with existing topography. Blackline Overlay Study: D. Wright, 2024. DEM image credit: https://francesjcooper.com/Ries_crater.html.
Figure 21.
Correlation of geology blackline tracing with existing topography. Blackline Overlay Study: D. Wright, 2024. DEM image credit: https://francesjcooper.com/Ries_crater.html.
Summary
The Onion Ring Hypothesis (ORH) is based on detailed hand-drawn extrapolations of shape outlines of maps to examine landscapes and geologic forms of known impacts. In these three analyses I demonstrate how the ORH is reflected in the intricate impact patterns of Vredefort’s topographic landscape pattern language, Chicxulub’s magnetic anomaly map, and Nordlinger-Ries underlying geology and current DEM topographic map. The landscape can be read as a permanent record of impact shock waves on the earth’s surface and crust until plate tectonics bury and melt the crust. The point is that the fractures, faulting, tilting of blocks and rippling will remain. The circular and parabolic shapes formed in these structures show that aside from the main impact effective rim, the detail of the interior and exterior land, geologic, and hydrologic land patterns need to be considered also. The detail matters because it shows the complexity of cosmic ballistics on target rocks and landscapes. In this case, the examples reviewed are direct impacts with ancient, buried target rocks, yet show a multiplicity of surrounding and interior impact “structurelets” of secondary and tertiary explosions.
In the case of Vredefort, the oldest of the three structures, it has been nearly eroded over more than 2 billion years to near basement levels, but the record of shockwave dynamics are imbedded in the fractures. Continued erosion over time has not eliminated the structure’s internal fracturing and impact geometries. Indeed, erosion and water flow have been in response to slopes carved by the impact; and tessellations that excavated channels for water to follow, created the present-day surface (and some subsurface) hydrological patterns. Rivers like the Vaal River running through it, and associated streams, all pick up arcs and rings by how the land has been shaped by impact and erosional forces. And it suggests that fractures and troughs created by impacts will be among the first places to be sought by water flow and subsequent erosion due to weaknesses in the target rocks. It follows then that plants also follow hydrologic patterns as the roots seek water, so vegetation patterns are another ally in determining ground patterns.
Depending on the size of the impactor, explosion energy, and angle of entry, the rings show predictable widening and narrowing of rings if incoming trajectories are less than 90 degrees; if at a right-angle impact angle as in the center of the Nordlinger-Ries structure or Chicxulub, the rings will be concentrically consistent measurable widths, with thinner rings close to epicenters, widening rings away from the epicenter, indicative of diminishing seismic wave energy with distance.
While these three structures are ancient impact events, they are good references due to how studied they are, and to demonstrate that the Onion Ring Hypothesis works with all three although millions of years separate them. And it is interesting that the center of an impact structure was the favored place to build a town like Nordlinger-Ries.
Why this study was started in the first place was to answer whether there was a piece of an impact storm that exploded over the Puget Sound region as part of the YDB event. Studying known impact structures was the place to start and test out the ORH and see where else it can be applied, and if it is applicable to modern landscapes now that we have that template. My next step is to apply the same hypothesis to modern landscapes and soils in search of markers of the Younger Dryas comet in the Pacific Northwest of Washington state and Oregon. In those studies, I will take the ORH in the field for physical evidence and use Lidar and satellite imagery to show the same impact pattern language is found on the modern landscape.
Although the Younger Dryas Boundary comet hypothesis is still very controversial, the fact remains that there are geometries on and in the ground that apparently display universal properties cosmic detonation (on Earth and Earth atmospheres) that result in decipherable landscape patterns like those of impacts. The lines are in the target rocks and surface expressions; they cannot be changed, but their provenance can be verified.
Finally, my reinterpretations of ancient and recent landscape geomorphology applied to the everyday landscape give new meaning and context for why human living and development patterns occur where they do, why land use ordinances allocate lands for development, agriculture, and resource protection, and that many of our streams and rivers follow contours set down not just by glaciation, volcanic activity, landslides, or erosion, but by active shaping of landscapes by impacts and airburst explosions.
References
- Evidence for an extraterrestrial impact 12,900 years ago that contributed to the megafaunal extinctions and the Younger Dryas cooling”, R. B. Firestone rbfirestone@lbl.gov, A. West, J. P. Kennett, +22, and W. S. Wolbach Authors Info & Affiliations, October 9, 2007. PNAS (Proceedings of the National Academy of Sciences of the United States. 104 (41) 16016-16021. [CrossRef]
- Pino, M., Abarzúa, A.M., Astorga, G. et al. Sedimentary record from Patagonia, southern Chile supports cosmic-impact triggering of biomass burning, climate change, and megafaunal extinctions at 12.8 ka. Sci Rep 9, 4413 (2019). [CrossRef]
- (3) Younger Dryas “black mats” and the Rancholabrean termination in North America”, C. Vance Haynes, Jr cml@email.arizona.eduAuthors Info & Affiliations, May 6, 2008 PNAS (Proceedings of the National Academy of Sciences of the United States. 105 (18) 6520-6525. [CrossRef]
- Wendy S. Wolbach, Joanne P. Ballard, Paul A. Mayewski, Victor Adedeji, Ted E. Bunch, Richard B. Firestone, Timothy A. French, George A. Howard, Isabel Israde-Alcántara, John R. Johnson, David Kimbel, Charles R. Kinzie, Andrei Kurbatov, Gunther Kletetschka, Malcolm A. LeCompte, William C. Mahaney, Adrian L. Melott, Abigail Maiorana-Boutilier, Siddhartha Mitra, Christopher R. Moore, William M. Napier, Jennifer Parlier, Kenneth B. Tankersley, Brian C. Thomas, James H. Wittke, Allen West, and James P. Kennett. “Extraordinary Biomass-Burning Episode and Impact Winter Triggered by the Younger Dryas Cosmic Impact ∼12,800 Years Ago. 1. Ice Cores and Glaciers”, The Journal of Geology Volume 126, Number 2, March 2018. [CrossRef]
- Abbott, Bryant, T. & Gusiakov, Viacheslav & Masse, W. (2007). Link: https://www.researchgate.net/publication/234527834_Megatsunami_of_the_World_Ocean_Did_They_Occur_in_the_Recent_Past.
- Firestone, R., West, A., and Warwick-Smith. The Cycle of Cosmic Catastrophes, Flood, Fire, And Famine in the History of Civilization, Bear and Company, Publishers, 2006, pp 327-338.
- Raducan, S.D., Jutzi, M., Cheng, A.F. et al. Physical properties of asteroid Dimorphos as derived from the DART impact. Nat Astron (2024). [CrossRef]
- M. Boslough, Airburst warning and response, Acta Astronautica, (2013), . [CrossRef]
- Siliezar, Juan, Harvard Staff Writer. “The cataclysm that killed the dinosaurs. New theory explains possible origin of plummeting Chicxulub impactor that struck off Mexico. February 15, 2021. Link: https://news.harvard.edu/gazette/story/2021/02/new-theory-behind-asteroid-that-killed-the-dinosaurs/.
- Yirka, Bob. “Research group suggests Chicxulub crater may have been caused by binary asteroids,” February 5, 2013, in Phys.org. Link: https://phys.org/news/2013-02-group-chicxulub-crater-binary-asteroids.html. This article refers to these authors:.
- Katarina Miljković, Gareth S. Collins, Sahil Mannick, Philip A. Bland, “Morphology and population of binary asteroid impact craters”, Earth and Planetary Science Letters, Volume 363, 2013, Pages 121-132, ISSN 0012-821X, (https://www.sciencedirect.com/science/article/pii/S0012821X12007194). [CrossRef]
- Baillie, Mike. “The case for significant numbers of extraterrestrial impacts through the late Holocene,” Journal of Quaternary Science, Vol. 22, pp. 101-109. Oct. 23, 2006. [CrossRef]
- Tedesco, E. F., "Tunguska event." Encyclopedia Britannica, December 5, 2023. https://www.britannica.com/event/Tunguska-event.
- Boslough, Mark, Sandia Laboratories NEWS RELEASE, December 17, 2007. “Sandia supercomputers offer new explanation of Tunguska disaster.” https://newsreleases.sandia.gov/releases/2007/asteroid.html.
- LeCompte, Malcolm. “Brief Overview of the Younger Dryas Cosmic Impact Datum Layer 12,800 Years Ago and Its Archaeological Utility.” Early Human Life on the Southeastern Coastal Plain (2018): n. pag. Print.
Figure 4.
Above: 30-degree and 40-degree impact ground planes simulation.
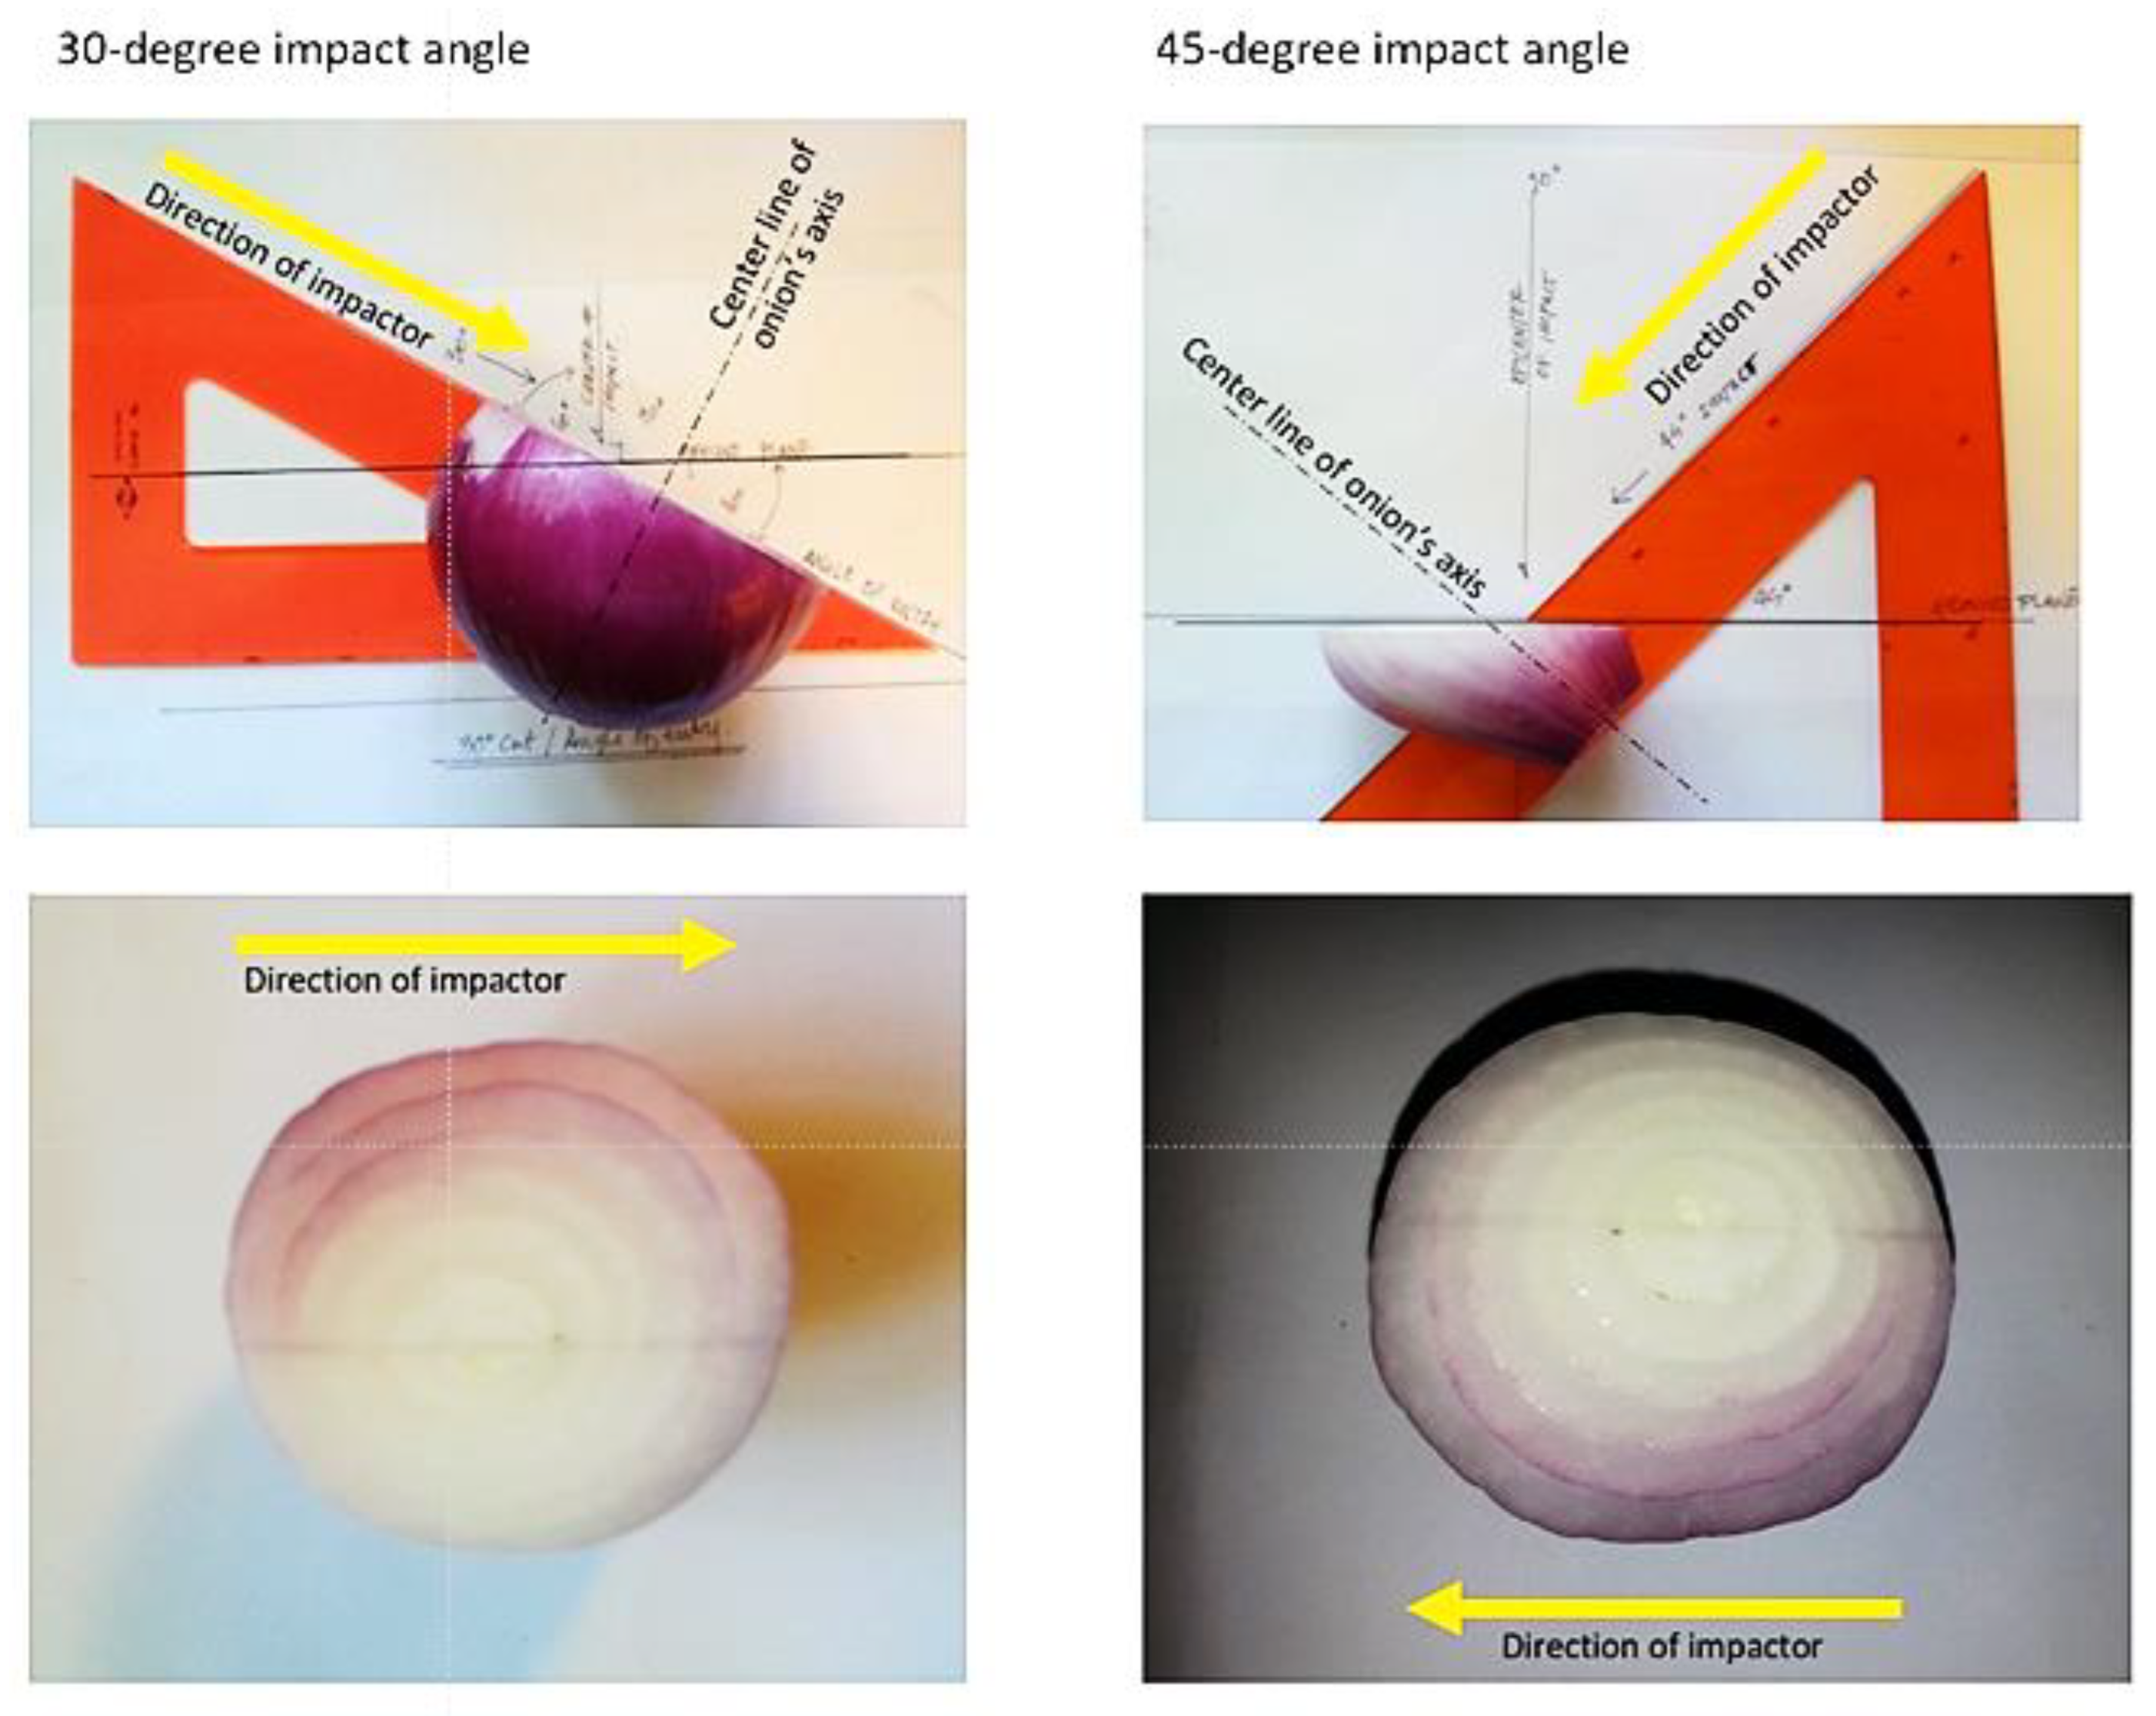
Figure 5.
Below: Expansion on the explosion angles, dynamics for multiple structures within a single impact cone. If the strike is close to perpendicularity, the expansion rings would be nearly concentric; but an angled strike shows widening to teardrop shapes away from the axis of entry.
Figure 5.
Below: Expansion on the explosion angles, dynamics for multiple structures within a single impact cone. If the strike is close to perpendicularity, the expansion rings would be nearly concentric; but an angled strike shows widening to teardrop shapes away from the axis of entry.
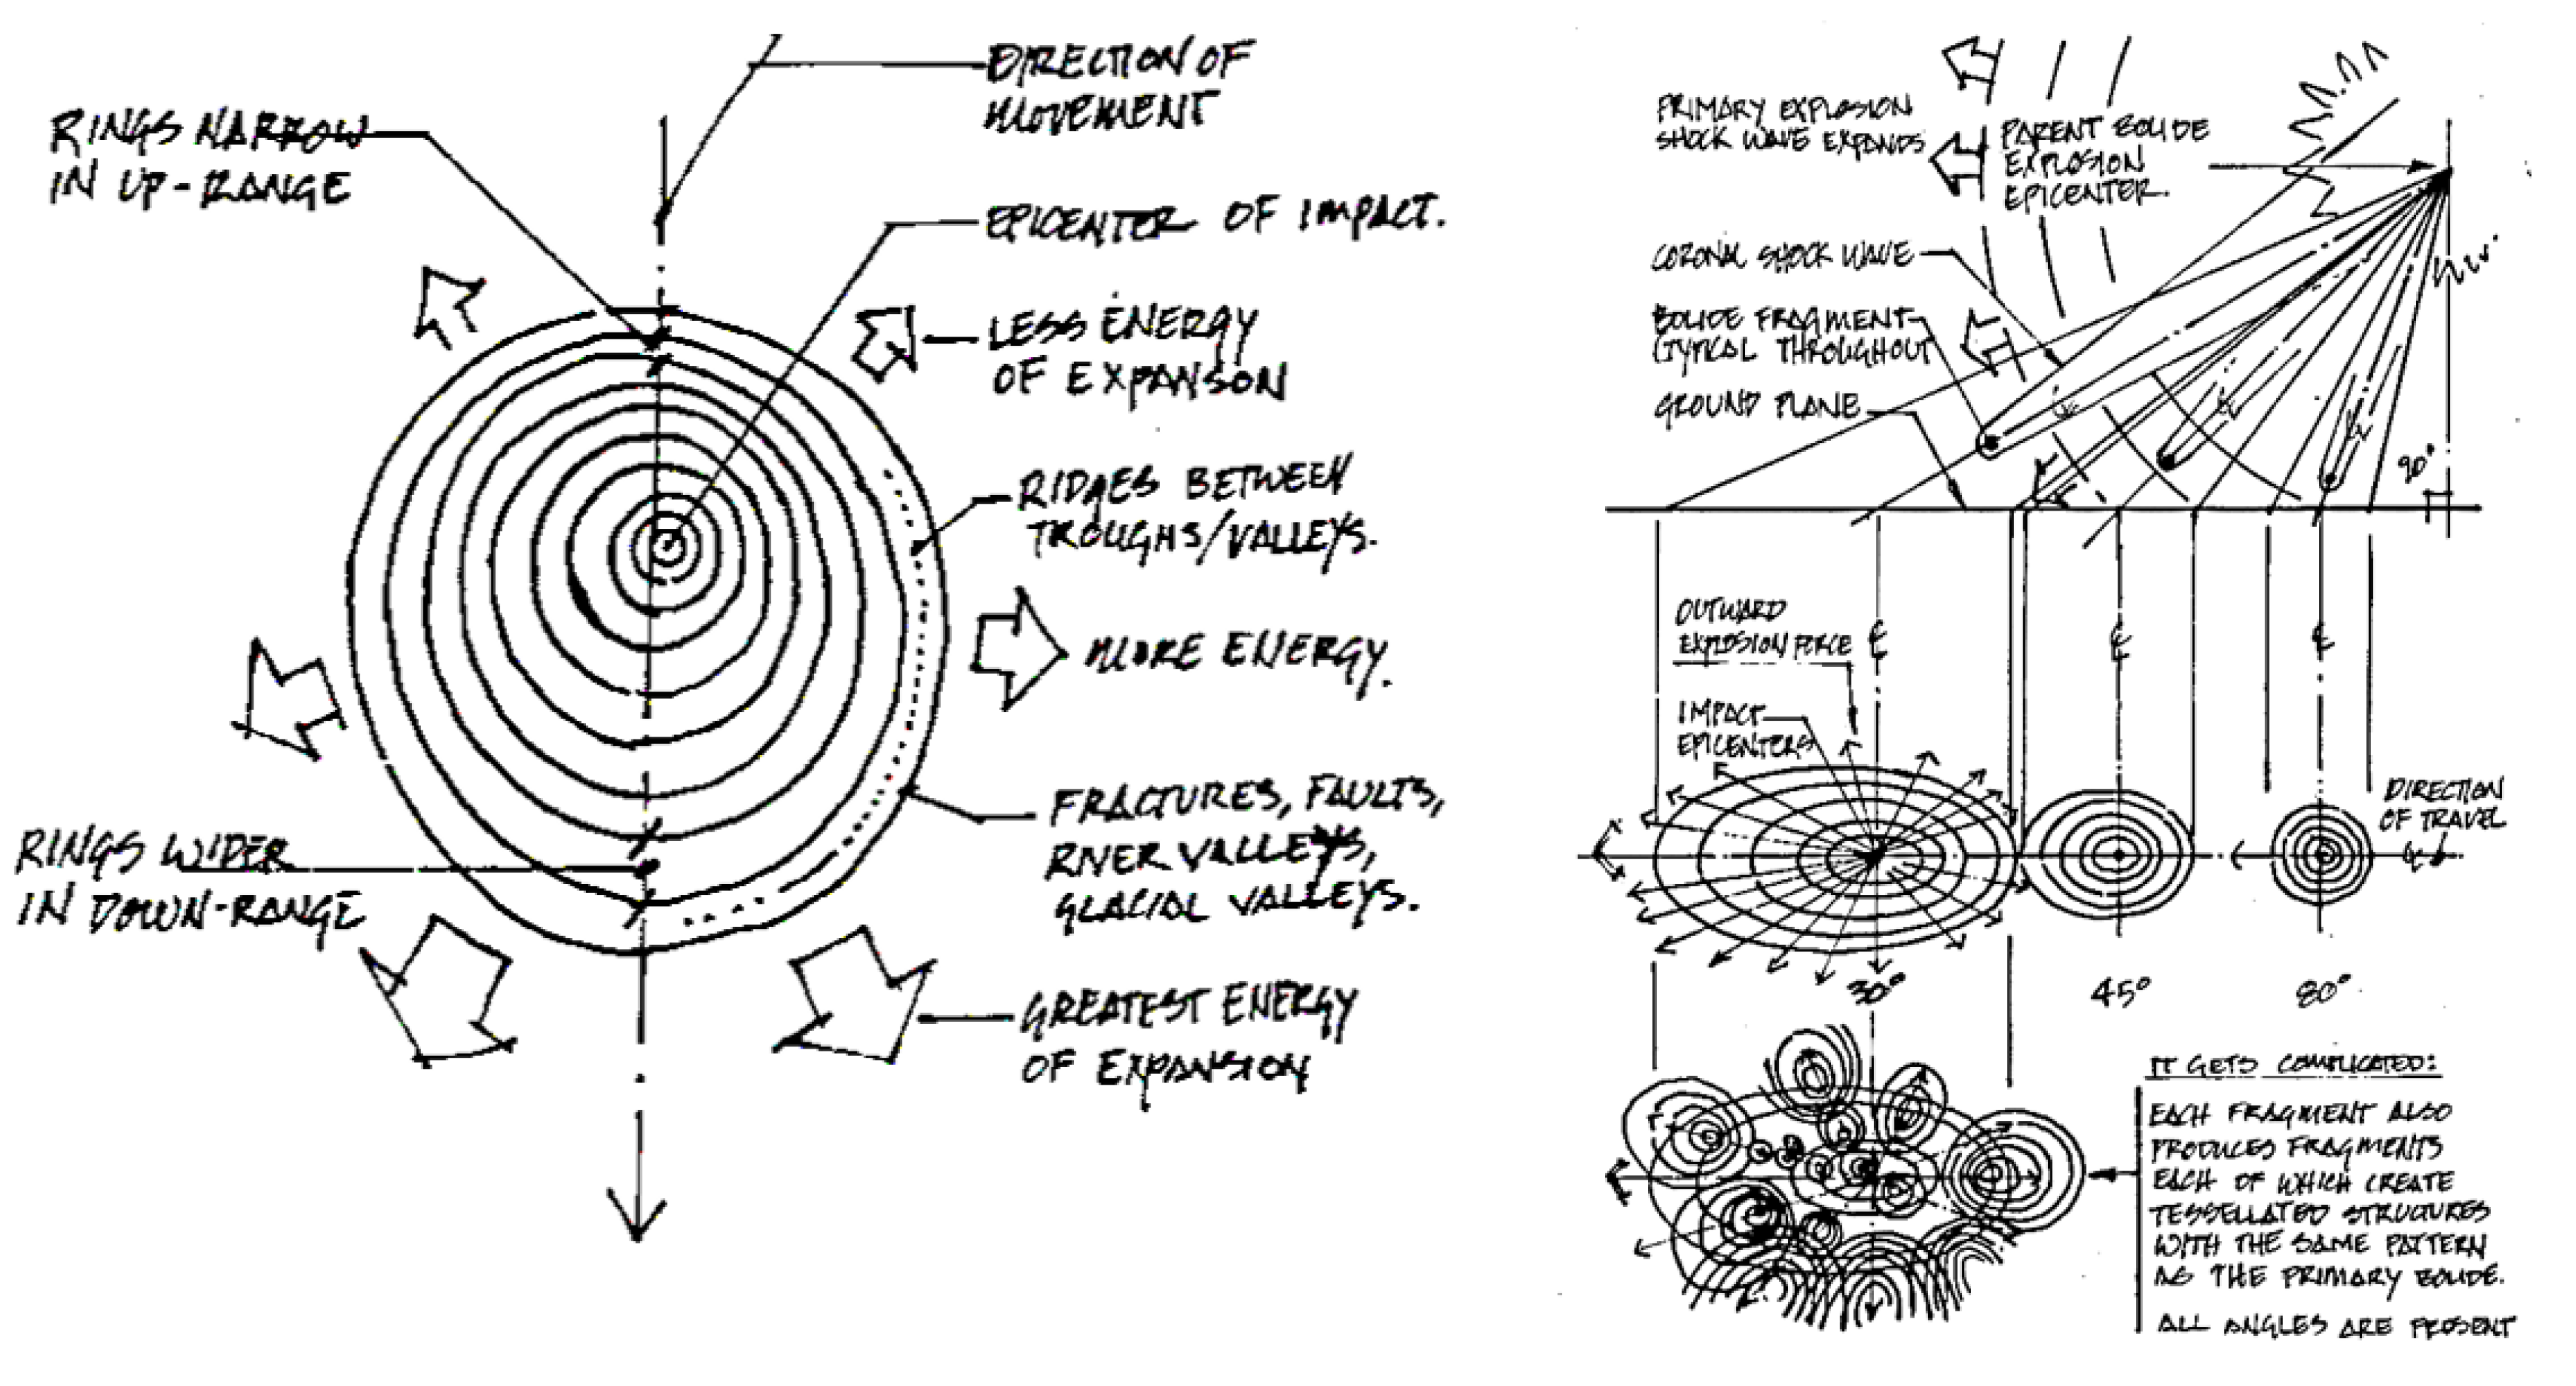
Figure 6.
The central cone of this illustration is a rough graphic of the shockwave, that after hitting the ground, will spread, creating the image above it. Illustration by D. Wright.
Figure 6.
The central cone of this illustration is a rough graphic of the shockwave, that after hitting the ground, will spread, creating the image above it. Illustration by D. Wright.
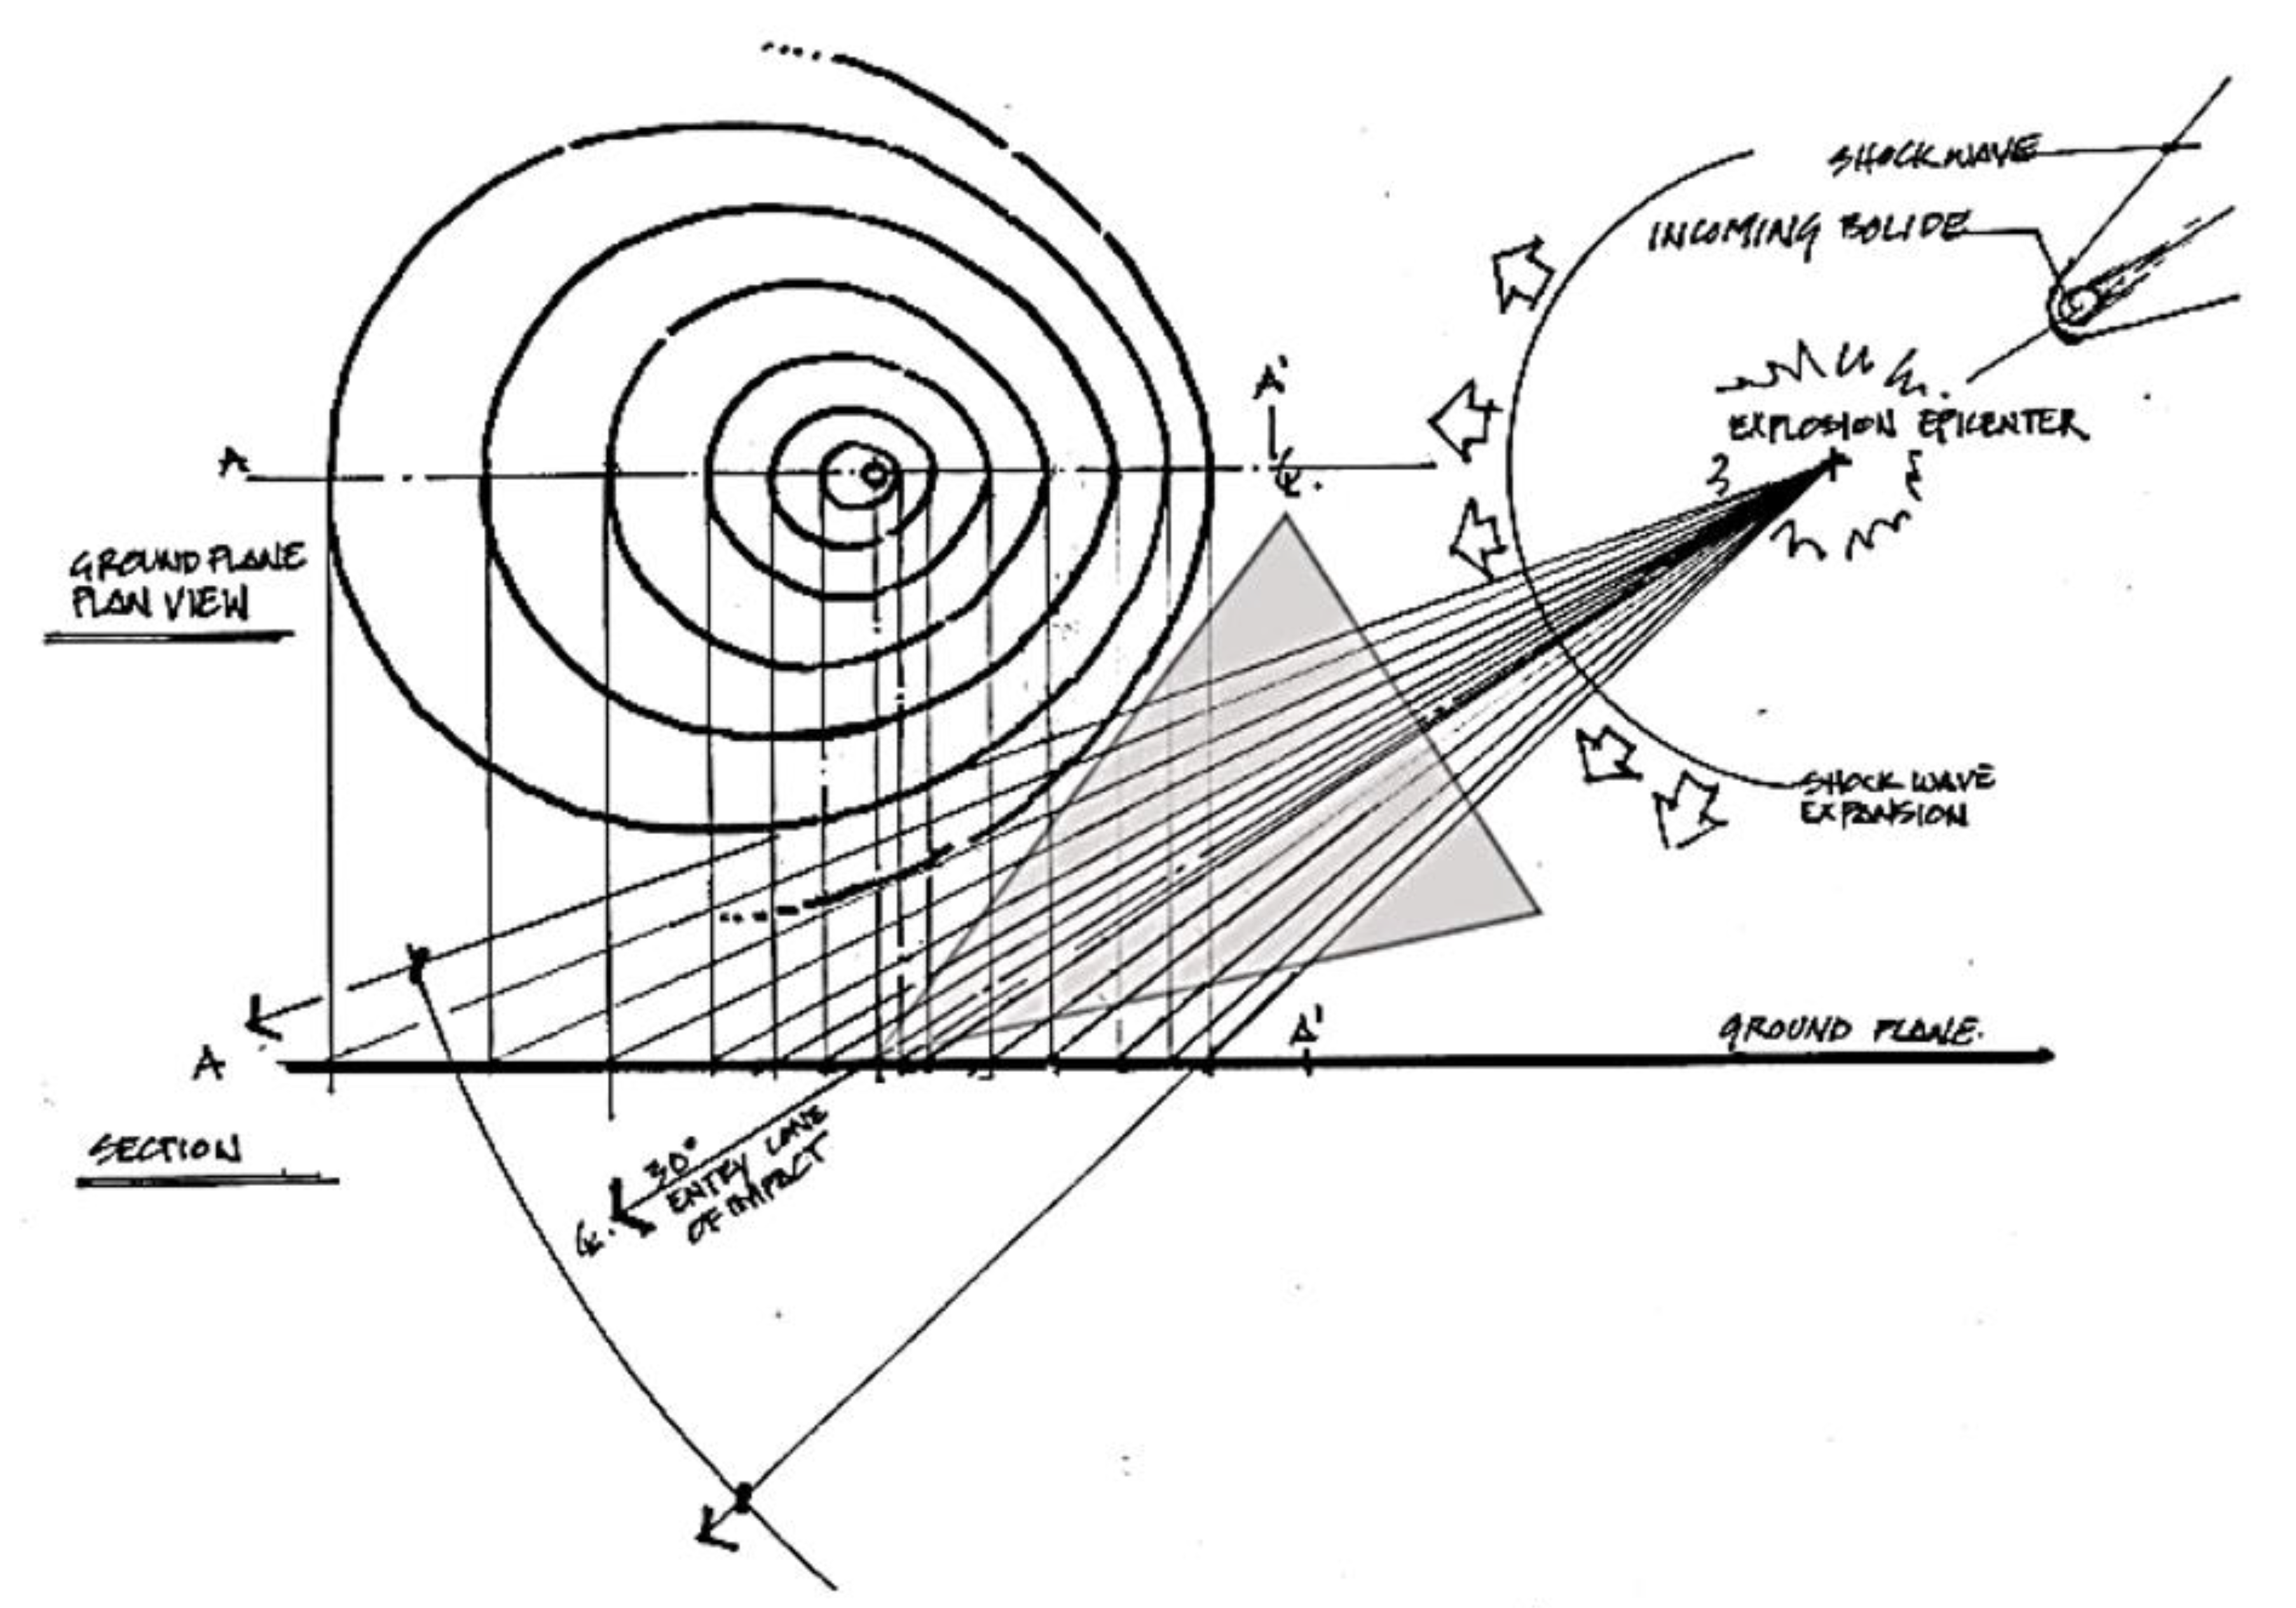
Figure 8.
Raindrops as model for land and water geomorphology.
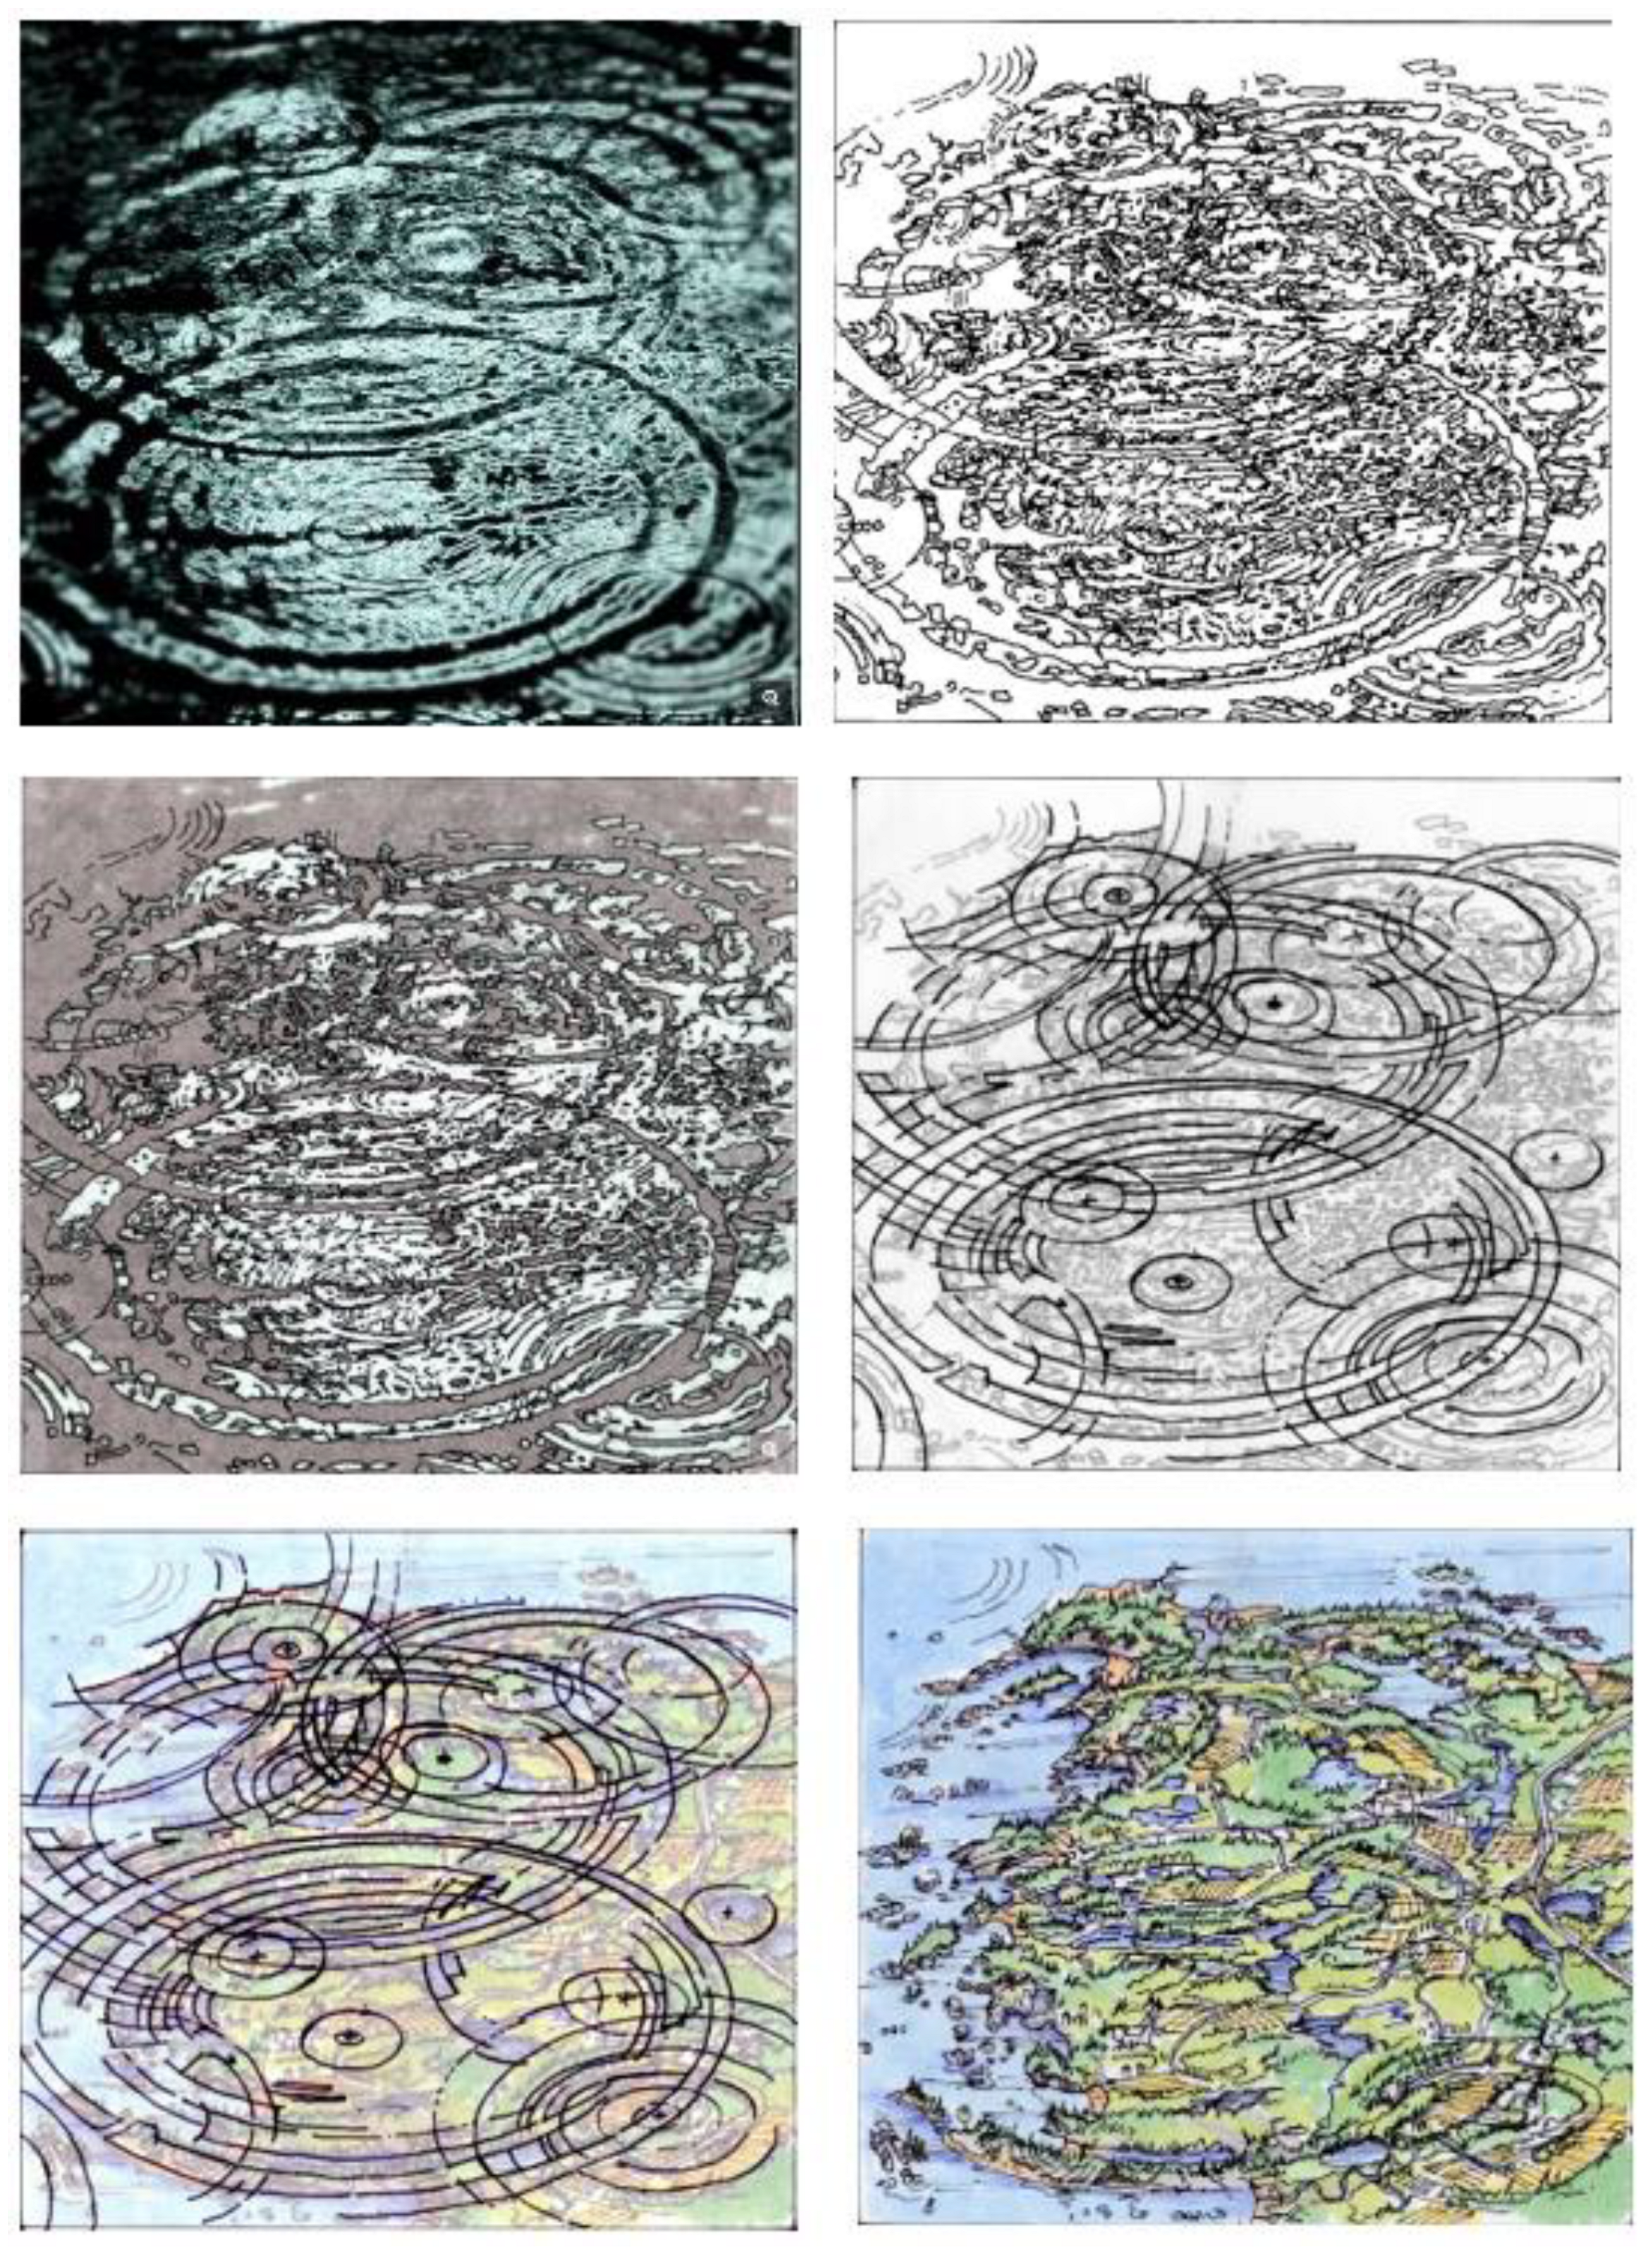
Figure 9.
Here, I superimpose the “impact cone” model onto Boslough’s Tunguska fireball simulation. His work on this subject has revealed that impact winds generated from such a fireball impact on the ground would have a similar expanding shock wave winds effect to the ORH geometry. Imagine then, thousands of explosions like this happening simultaneously over a day, as others have suggested like LeCompte et al. (2018). The chaos would be extreme. [15].
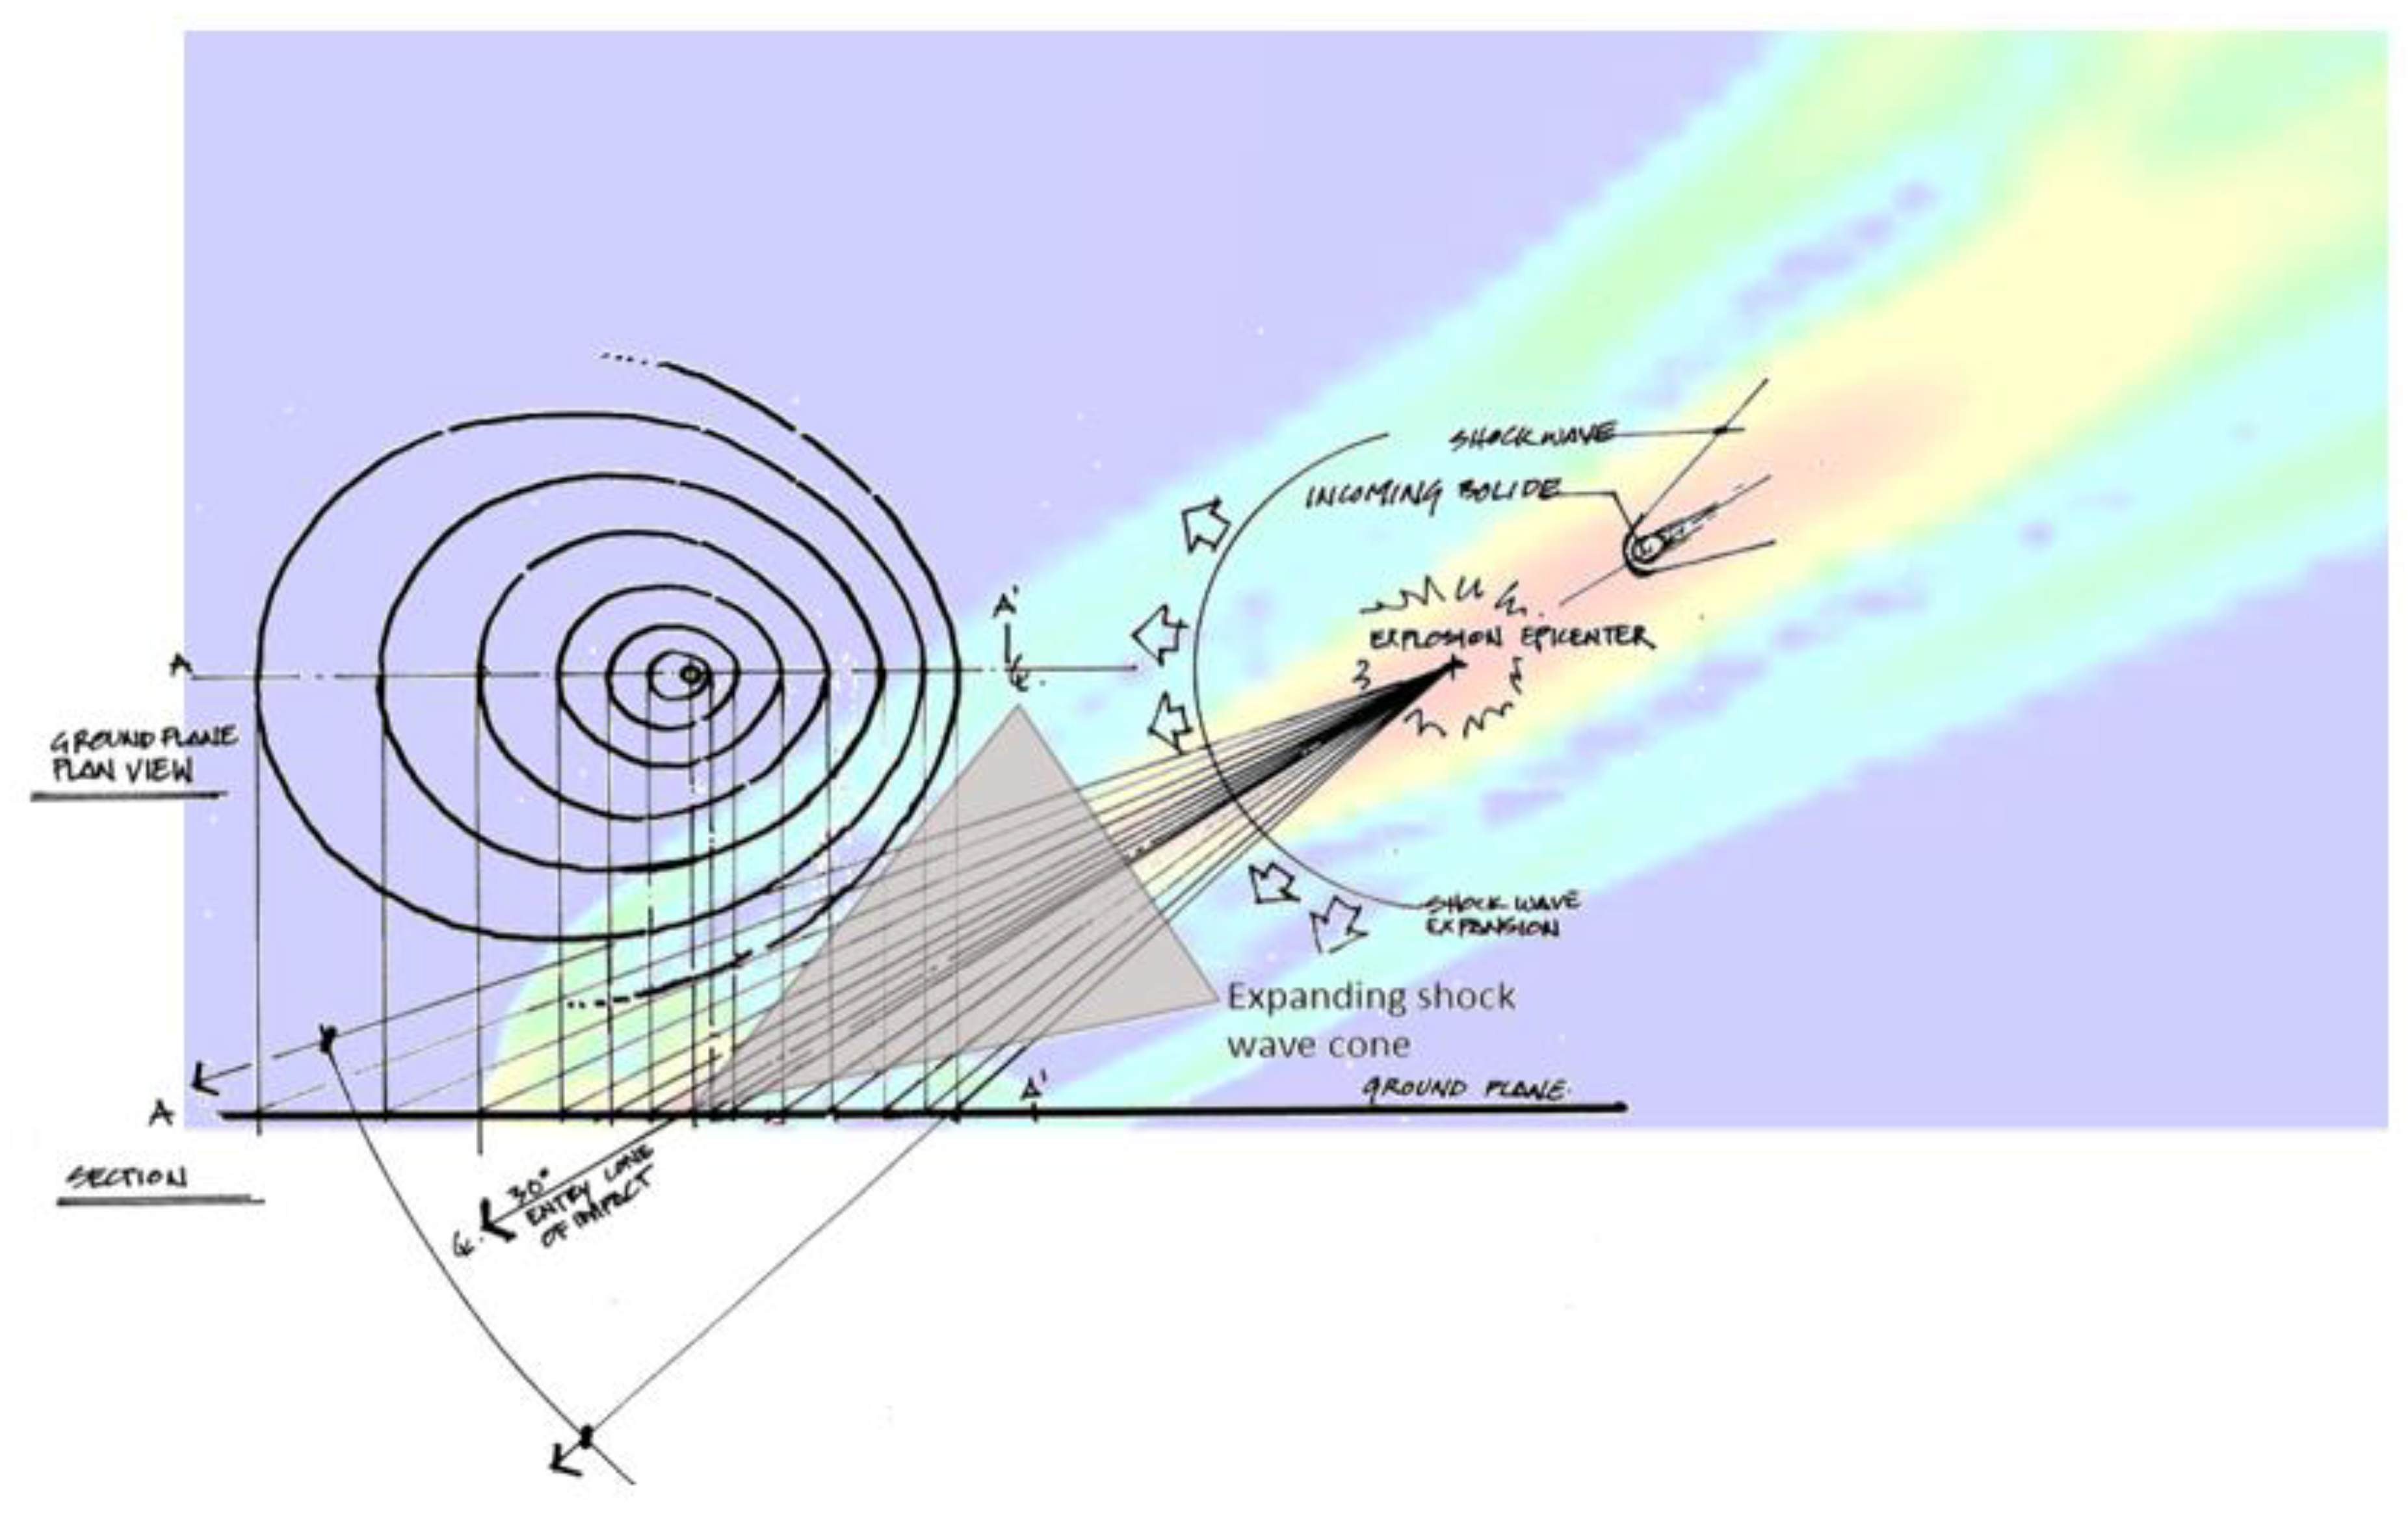
Figure 10.
This crude illustration, however exaggerated, shows the rolling motion created by both shock waves expanding across the landscape. As I illustrate in other images the waves go far beyond effective rims. Fireball image credit: graphic produced by Dr. Mark Boslough, Sandia Laboratories.
Figure 10.
This crude illustration, however exaggerated, shows the rolling motion created by both shock waves expanding across the landscape. As I illustrate in other images the waves go far beyond effective rims. Fireball image credit: graphic produced by Dr. Mark Boslough, Sandia Laboratories.
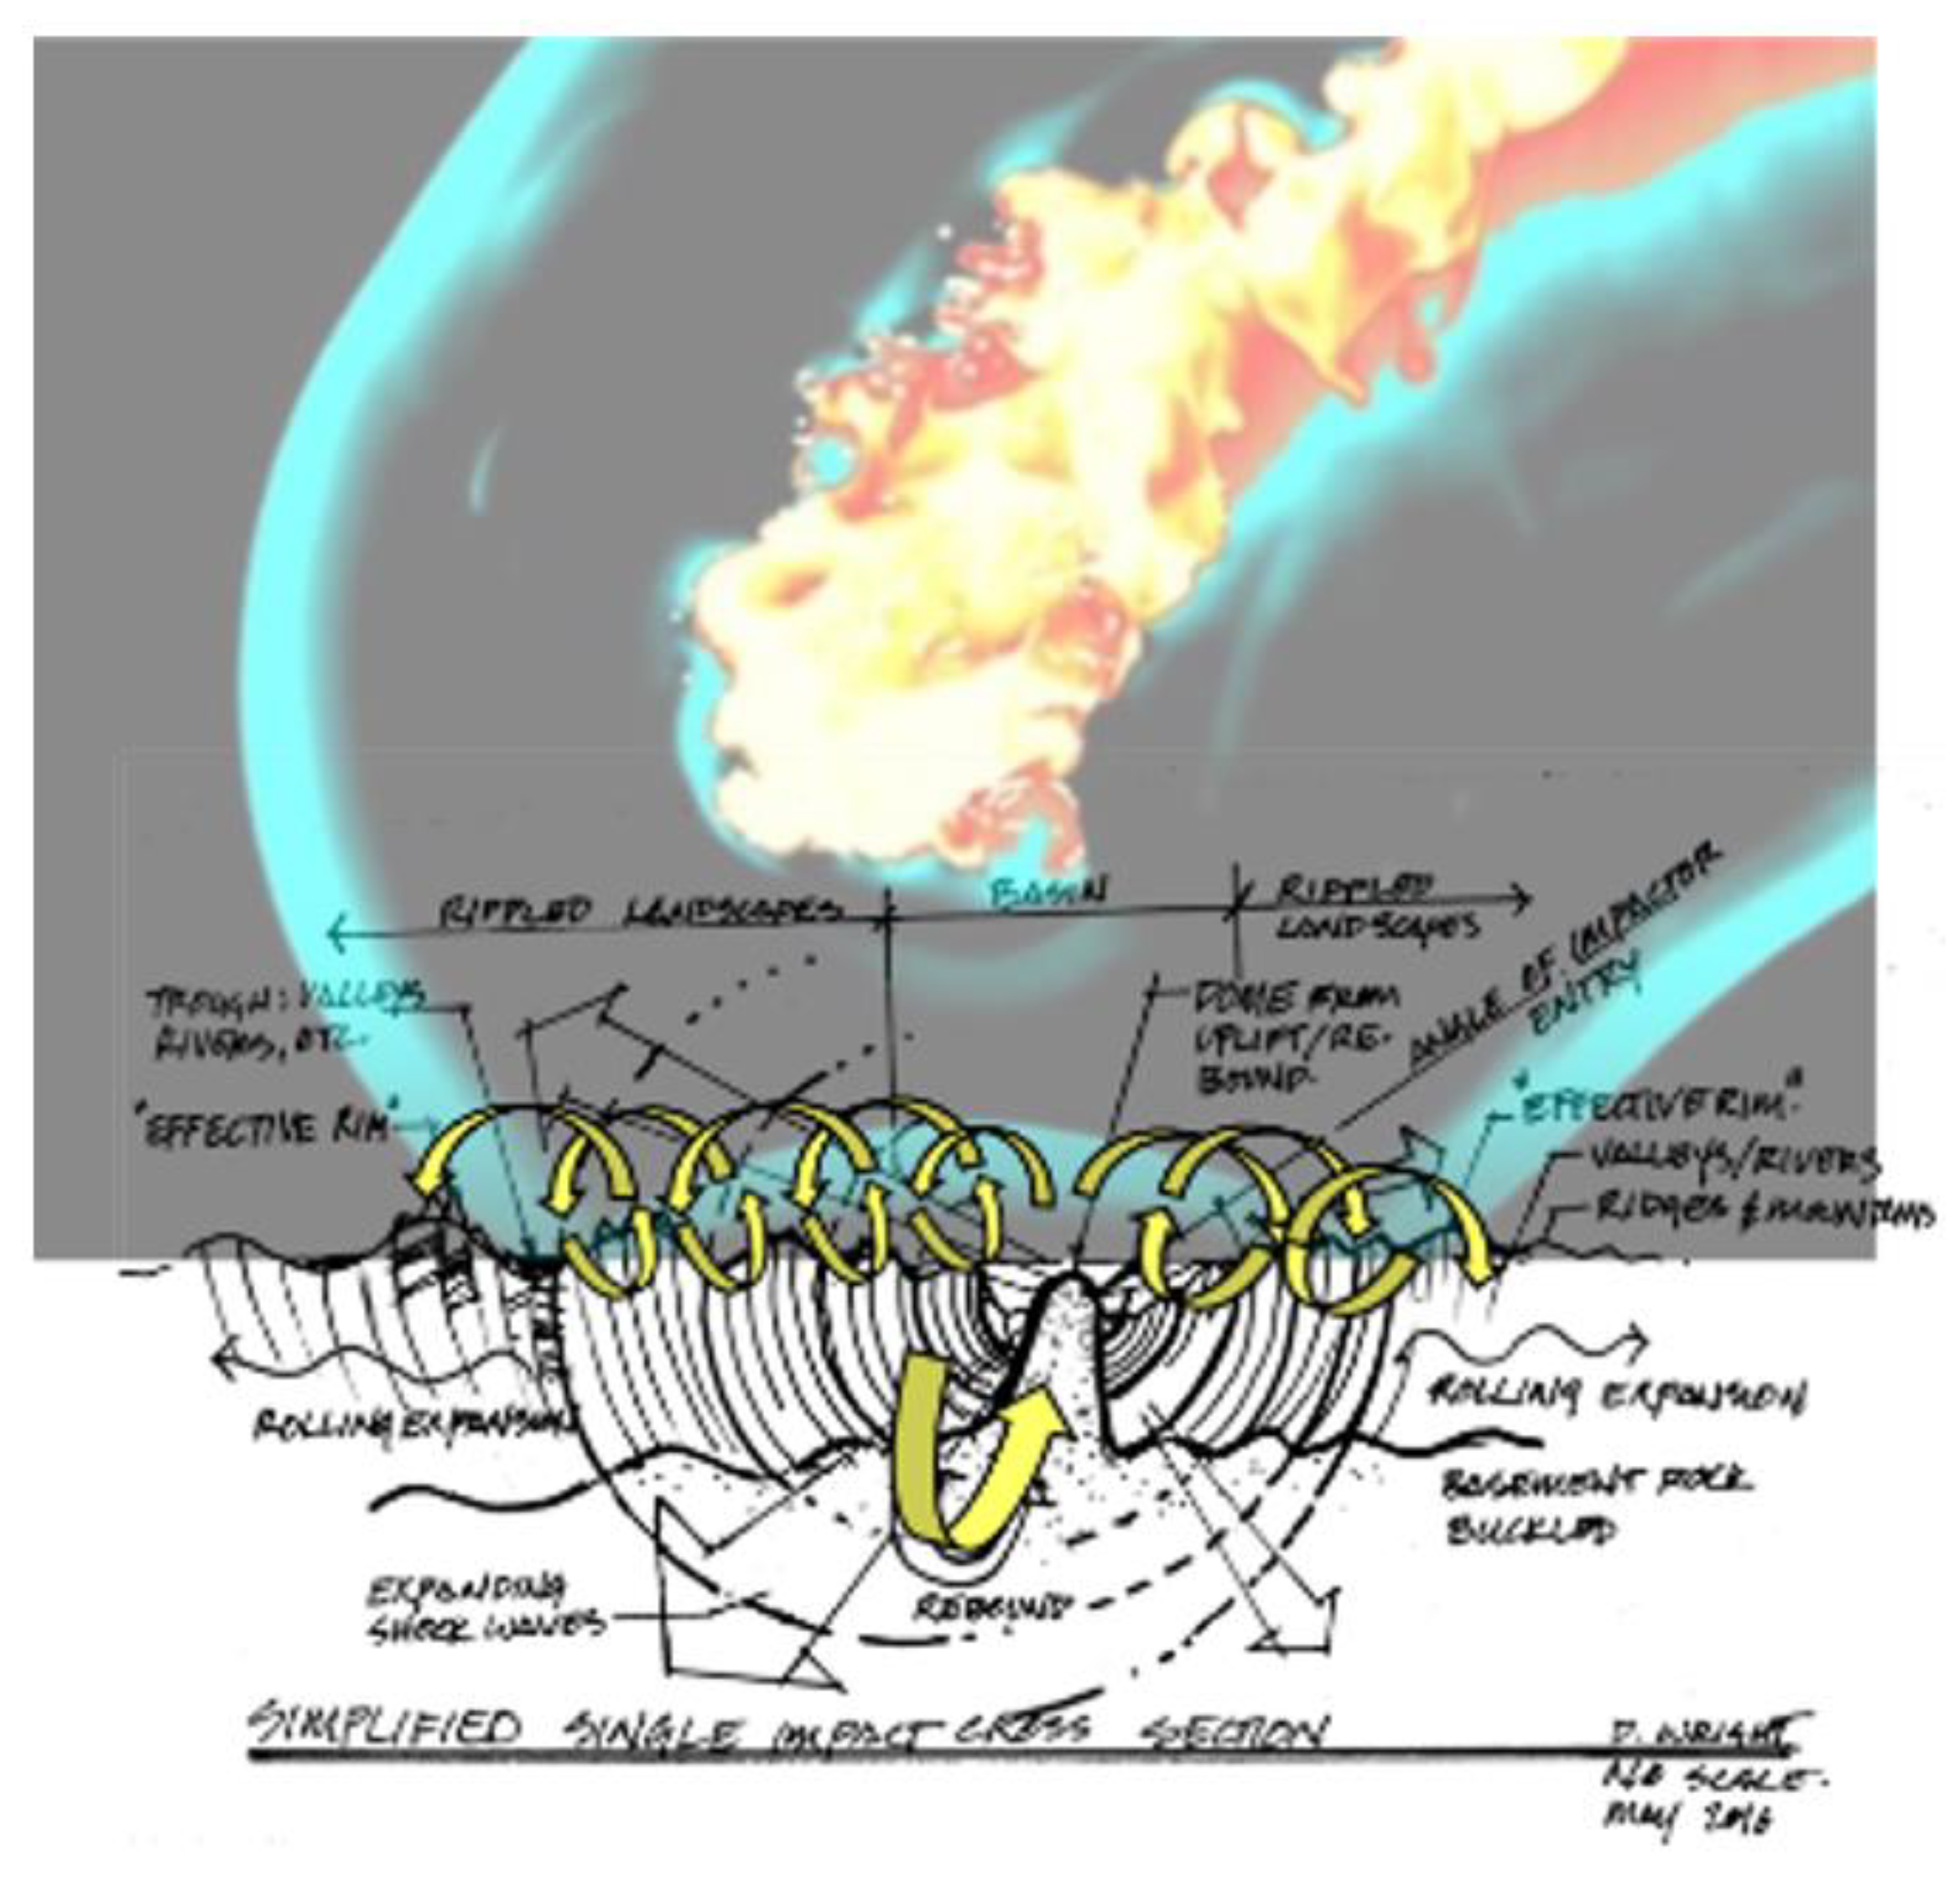
Figure 13.
Right: Magnetic anomaly map of Chicxulub Crater. Image credit: United States Geological Survey.
Figure 13.
Right: Magnetic anomaly map of Chicxulub Crater. Image credit: United States Geological Survey.
Disclaimer/Publisher’s Note: The statements, opinions and data contained in all publications are solely those of the individual author(s) and contributor(s) and not of MDPI and/or the editor(s). MDPI and/or the editor(s) disclaim responsibility for any injury to people or property resulting from any ideas, methods, instructions or products referred to in the content. |
© 2024 by the authors. Licensee MDPI, Basel, Switzerland. This article is an open access article distributed under the terms and conditions of the Creative Commons Attribution (CC BY) license (http://creativecommons.org/licenses/by/4.0/).
Copyright: This open access article is published under a Creative Commons CC BY 4.0 license, which permit the free download, distribution, and reuse, provided that the author and preprint are cited in any reuse.


