Submitted:
25 October 2024
Posted:
28 October 2024
You are already at the latest version
Abstract
Gliomas are malignant tumours arising from glial cells in the central nervous system (CNS), presenting significant clinical challenges. High-grade gliomas (HGGs) are particularly concerning as they are the primary cause of CNS cancer-related deaths. Low-grade gliomas (LGGs), which include diffuse types, represent only 15% of all glioma cases. this review aims to identify the critical hub genes associated with HGG and LGG, understand their proliferation, apoptosis, and mutation role in glioma, and their therapeutic potential as well. First, we identified the gene interaction networks by employing bioinformatics techniques, such as differential expression analysis, Venn enrichment, Cytoscape, and CytoHubba analyses. Next, we summarized the role of hub genes, addressing recent advancements and emerging evidence related to the identified hub genes to provide a comprehensive understanding. The analysis revealed ten hub genes: CCNB1, TOP2A, CENPF, NEK2, ASPM, TPX2, PBK, RRM2, KIF15, and ATAD2. Most hub genes showed elevated expression in HGG compared to LGG, and a strong positive correlation with glioma pathology. Also, might hold significant therapeutic potential, particularly CCNB1, CENPF, NEK2, and TPX2, due to their crucial biological functions and the results of gene mania analysis. This review offers an overview and comprehensive knowledge of the hub genes in glioma pathology, which may inform future research and clinical trials aimed at developing targeted therapeutic strategies.
Keywords:
glioma
; high-grade glioma
; low-grade glioma
; hub genes
; bioinformatics
; glioma therapy
; gene therapy
; genomics
1. Inrtoduction
Gliomas are tumours originating from the abnormal proliferation of glial cells[1], which generally support the neurons and contribute to the central nervous system’s (CNS) functioning.[2] Predominantly found in the brain but also capable of forming in the spinal cord[3], gliomas are characterized by their malignant nature, signifying their cancerous attributes.[4,5] Despite some gliomas exhibiting a gradual growth rate, they remain primary brain tumours, exclusive to the brain tissue.[6] Noteworthy is the limited propensity for gliomas to metastasize beyond the confines of the brain or spinal cord.[7] Nevertheless, their inherent life-threatening nature arises due to the challenges posed by surgical interventions[8,9], with the tumours often infiltrating intricate regions of the brain. The multifaceted treatment of gliomas typically involves a combination of surgical procedures, radiation therapy, and chemotherapy[10,11], the selection of which is contingent upon factors such as tumour type[12], grade[13], location[14], and the overall health status of the afflicted individual.[15] The prognosis for gliomas varies considerably, underscoring the imperative for ongoing research to advance therapeutic modalities for these formidable CNS neoplasms.[16,17]
High-grade gliomas (HGG) stand as the primary contributor to cancer-related mortality within the CNS for both pediatric and adult populations.[18,19] The persistent clinical challenges associated with these tumours underscore the inadequacy of the current comprehension of glioma pathophysiology.[20] While gliomas exhibit extensive infiltration within the brain and spinal cord[21], occurrences of growth beyond the confines of the CNS are exceptionally uncommon.[22] Glioma progression is solely driven by intrinsic cellular mechanisms and heavily influenced by key dependencies within the tumour microenvironment.[23] Notably, neurons emerge as a pivotal constituent of the glioma microenvironment, exerting a regulatory role in malignant growth through an activity-dependent mechanism.[24] HGGs are categorized based on their level of aggressiveness, determined by the growth rate, into either anaplastic astrocytomas (grade III) or glioblastoma multiforme (GBM).[25,26] These tumours often infiltrate neighboring healthy tissue[27], making surgical removal a significant challenge. Predominantly originating in the cerebral hemispheres, including the frontal, parietal, and temporal lobes[28], as well as the central regions of the brain such as the thalamus[29], these tumours tend to spread to other areas of the brain and the spinal cord. The extensive infiltration and potential for metastasis add complexity to the treatment of HGGs, highlighting the need for comprehensive therapeutic strategies.[30,31]
Low-grade gliomas (LGG) encompass benign tumours categorized as grade I and grade II according to the World Health Organization (WHO) classification.[32] LGG may arise from genetic mutations or environmental factors influencing their growth.[33] The clinical presentation varies depending on the tumour’s size and location.[34] Predominantly observed in children at a young age[35], early diagnosis and prompt treatment are imperative for an improved prognosis.[36] Despite a lack of well-defined causes for gliomas, the risk factors contributing to their development remain poorly understood. Notably, therapeutic irradiation are a significant environmental factor, that elevates the risk not only for LGGs but for all brain tumors.[37] Despite constituting only 15% of all gliomas, diffuse low-grade gliomas (dLGGs) have garnered growing attention over the past decade.[38] Substantial progress has been made in understanding their natural history and clinical variability. The WHO has played a pivotal role in this advancement, by issuing an enhanced pathological classification of gliomas, which integrates histological characteristics with molecular markers. This updated classification system offers a deeper and more detailed understanding of dLGGs.[39]
Astrocytomas and oligodendrogliomas are the most prevalent grade II gliomas, particularly affecting children and young adults.[40] Most grade II gliomas exhibit an infiltrative nature, indicating that tumour cells disperse beyond a confined area[41], rendering surgical cures often unattainable.[42] These tumours exhibit slow growth over an extended period[43], yet many eventually transform into HGGs, posing a life-threatening risk.[44] A characteristic feature of most grade II gliomas is the presence of DNA mutations in the IDH1 or IDH2 gene, with gliomas carrying an IDH mutation generally displaying a slower growth rate than those without. Particular grade II gliomas with an IDH mutation may also display a DNA abnormality known as 1p/19q co-deletion. Gliomas with this co-deletion have demonstrated notably favorable responses to chemotherapy.[45,46] Despite extensive research on glioma progression, the key functional genes have yet to be identified.
Cancer cell migration is a significant factor in tumour invasion. Targeting this migration with targeted therapies offers a promising strategy for managing disease progression.[47] Metabolic remodeling in tumours, especially gliomas, has gained significance due to advances in metabolomics that have revealed important tumor metabolites.[48,49] These metabolites supply energy, support growth, influence the expression of oncogenes and tumor suppressor genes, and impact epigenetic modifications.[50,51,52] Although the intricate role of metabolic reprogramming in gliomas remains underexplored[53], understanding these mechanisms is crucial for developing new treatment strategies. Cell proliferation and migration contribute to the aggressive characteristics of gliomas and their unfavorable prognosis. These factors complicate treatment and underscore the necessity for continued research into therapies that can effectively target both aspects of glioma biology.
LGGs are incurable primary brain tumours located primarily in the frontal and temporal lobes. Patients frequently experience epileptic seizures, while other symptoms, such as headaches, lethargy, and cognitive changes, are less common. These tumours generally grow slowly and infiltrate surrounding tissue, but their behavior can vary widely. Some LGGs may remain stable for many years, while others can progress rapidly, leading to significant neurological complications and potentially resulting in death.[54,55] Most patients with LGGs eventually experience a tumour transformation into a higher-grade form, a process belonging to malignant, anaplastic transformation, or malignant progression. This shift significantly worsens the prognosis[56], with median 5-year overall survival ranging from 69.2% to 93.5% for LGG patients.[57] In contrast, patients with HGGs typically have a median survival of only one to two years.[58] The timing of malignant transformation in LGG patients varies. Clinical studies show a wide range in the 5-year malignancy-free survival rates, from 30% to 70%.[56,59,60] Some reports suggest that all LGGs will eventually undergo malignant transformation during their clinical course.[61] Radiologically, this transformation is often identified by the new appearance of contrast enhancement on MRI scans, or it may be confirmed histopathologically by evidence of malignant degeneration in tissue samples obtained during biopsy or surgery.[59]
The primary aim of our review is to accurately identify hub genes associated with HGG and LGG using bioinformatics analysis. Moreover, to elucidate the biological functions of these genes in cell reproduction and division, and to explore the specific roles each gene plays in glioma proliferation and mutation through their expression profiles, by drawing on the latest research findings. Additionally, we will emphasize the therapeutic potential of these genes, particularly those that could be crucial in glioma gene therapy. A comprehensive summary of the literature related to core glioma genes is also provided.
1. Bio-informatics methods and results.
Bioinformatics analysis through R Studio and Cytoscape software involved in exploring the role of hub genes (top ten) critical in the molecular network. We sourced gene expression data from the GEO database https://www.ncbi.nlm.nih.gov/geo/, focusing on downloaded datasets as detailed in Table 1 GSE50161[62] and GSE107850[63]. Moreover, the GSE50161 dataset includes gene expression profiles of HGG, derived from surgical tumor samples as the disease group, with ordinary brain white matter serving as the control group.[62]

Table 1.
Data information.
| Sample Number | Data Generation Platform | Data Type | Experiment design | Sample Size / VolumeDisease Control |
|---|---|---|---|---|
| GSE50161 | GPL570 | High grade glioma | Clinical trials of immunotherapy | n=130 samples117 13 |
| GSE107850 | GPL14951 | Low grade glioma | Clinical trials of chemotherapy and radiotherapy | n=195 samples195 0 |
Table 1: GEO downloaded data for our study, belongs to gene expression profiles from high-grade and low-grade glioma, including sample numbers, data generation platforms, types, experimental designs, and sample sizes.
In contrast, GSE107850 comprises samples from LGG patients, many of whom underwent temozolomide (TMZ) and radiotherapy (RT) as part of the EORTC22033-26033 clinical trial, without a control group involved. This variability potentially impacts the gene expression profiles. To establish a consistent baseline for analysis, we merged the control samples with the glioma samples, creating two datasets: “high_Matrix.txt” for high-grade gliomas and “low_Matrix.txt” for low-grade gliomas. This approach enables a thorough examination of differential gene expression across glioma grades. A significant limitation of the GSE107850 dataset is that it includes low-grade glioma patients who received chemotherapy and radiotherapy (RT). These treatments could influence the observed differential gene expression patterns, complicating the distinction between disease-related changes and those induced by therapies. The bioinformatics analysis yielded several key findings as follows:
1.1. Differential Expression Analysis
The main objective of this analysis was to identify differential expression genes (DEGs)in HGG and LGG samples, facilitating the data extraction necessary for Venn analysis. This investigation began with retrieving glioma profiles, categorized by grade, from the GEO database. Subsequently, differential expression analysis was conducted by comparing gene expression patterns in glioma tissues with those in non-tumorous brain tissues (ordinary white matter), identifying DEGs. We utilized R Studio to analyze differential expression under varying conditions to explore the regulatory mechanisms of gene expression in both standard and glioma groups. Specific R packages, including “Diseases.diff.R,” were utilized to process the datasets and generate a heat map. Subsequently, we used the R programming language to integrate the expression data, preparing it for the construction of a predictive model in the next phase of analysis.
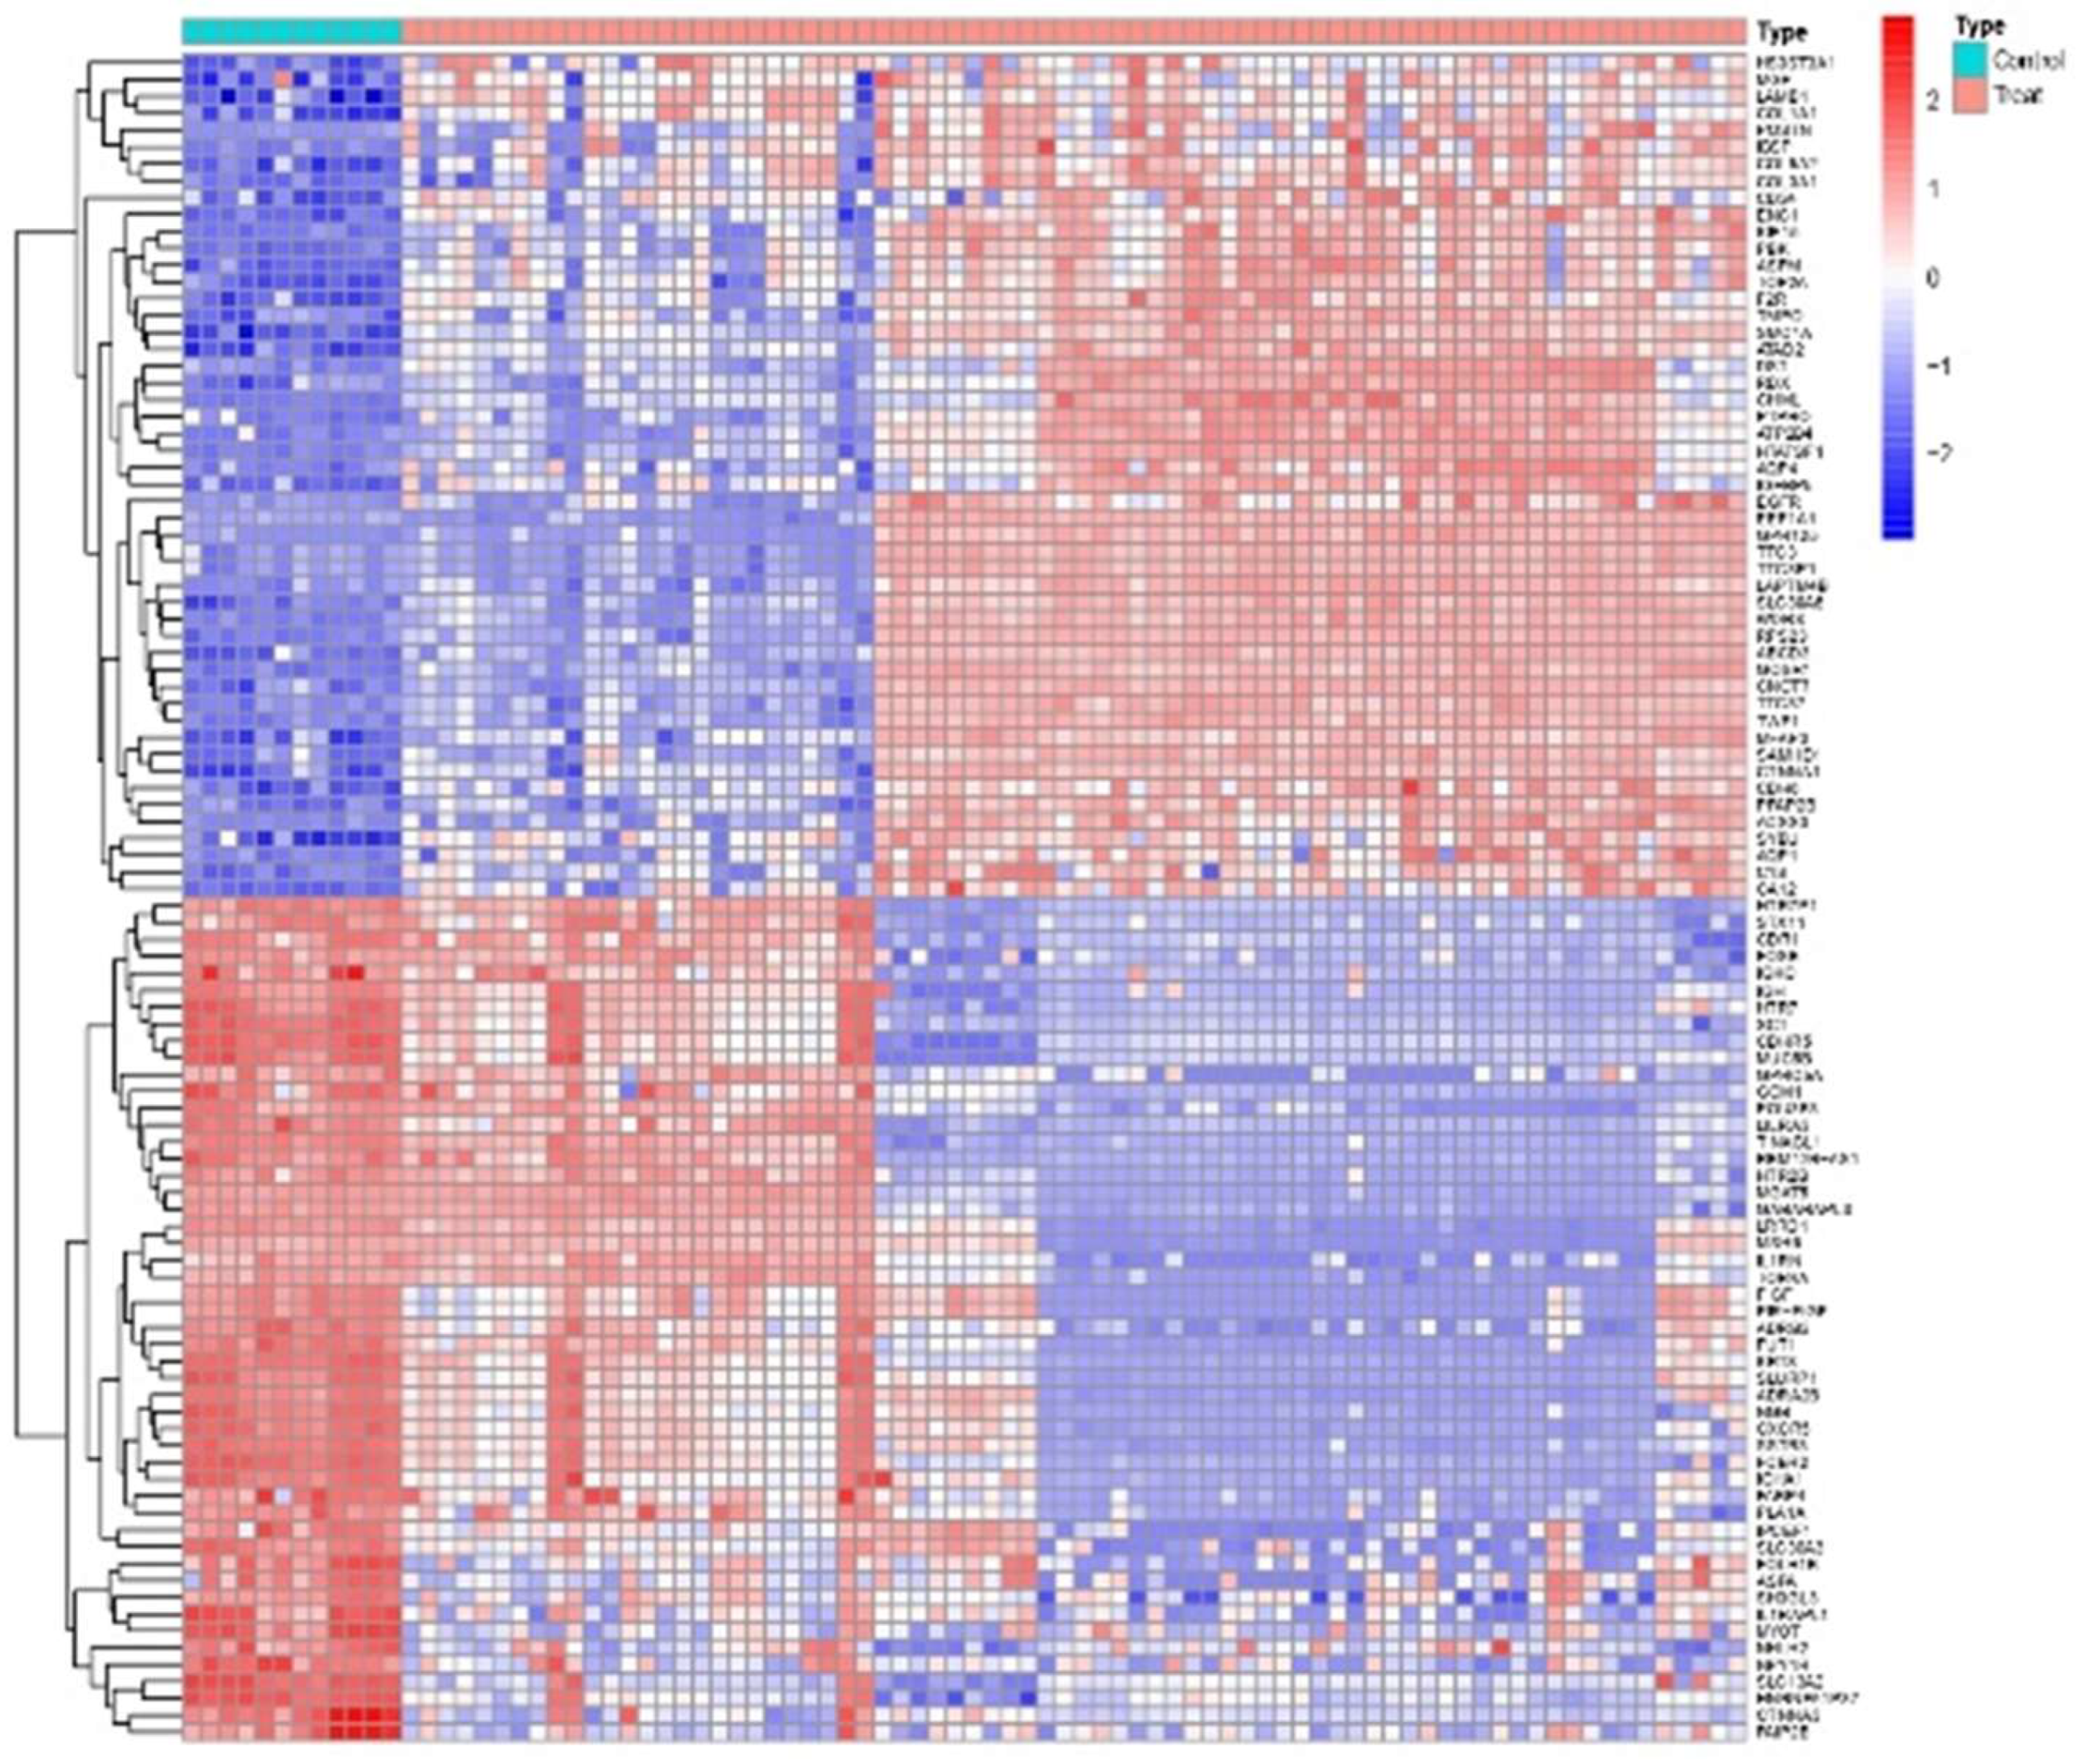
The analysis revealed statistically significant differential gene expression in the HGG group as re, with the same approach being applied to the LGG group, we can observe the differential expression of genes between high-grade glioma (HGG) samples and normal brain tissues as shown in the heat map Figure 1. The clustering map reveals distinct patterns of gene expression that differentiate high-grade glioma (HGG) samples from normal tissues. However, clusters of those highly upregulated genes in HGG samples are highlighted in bright red, indicating their likely involvement in pathways associated with glioma progression. Thus, some genes are markedly downregulated in HGG shown in blue, which may indicate suppression of normal brain functions Overall, the heat map provides a clear visual representation of the differential expression patterns, highlighting key genes that could serve as potential biomarkers or therapeutic targets in high-grade glioma.
Figure 1.
Heat map of HGG. Figure 1: Each row represents a gene, and each column represents a sample. The color scale indicates the level of gene expression that differentiates HGG samples (red scale) from normal tissues (green scale), with red colors representing upregulated genes and blue colors representing downregulated genes. The dendrograms at the top and sideshow the hierarchical clustering of samples and genes, respectively.
1.2. Venn Analysis of Intersection Genes
Initially, we performed a Venn analysis to identify the number of upregulated and downregulated genes in HGG and LGG samples. This analysis enabled us to pinpoint the intersecting genes between the two grades, focusing on those with statistically significant differences. The “interGenes.List.txt” file generated during this process will be crucial for further analyses. Our results revealed that LGG samples exhibited more upregulated and downregulated genes compared with HGG samples, indicating a greater enrichment of gene expression changes in LGG.
1.3. Cytoscape Analysis
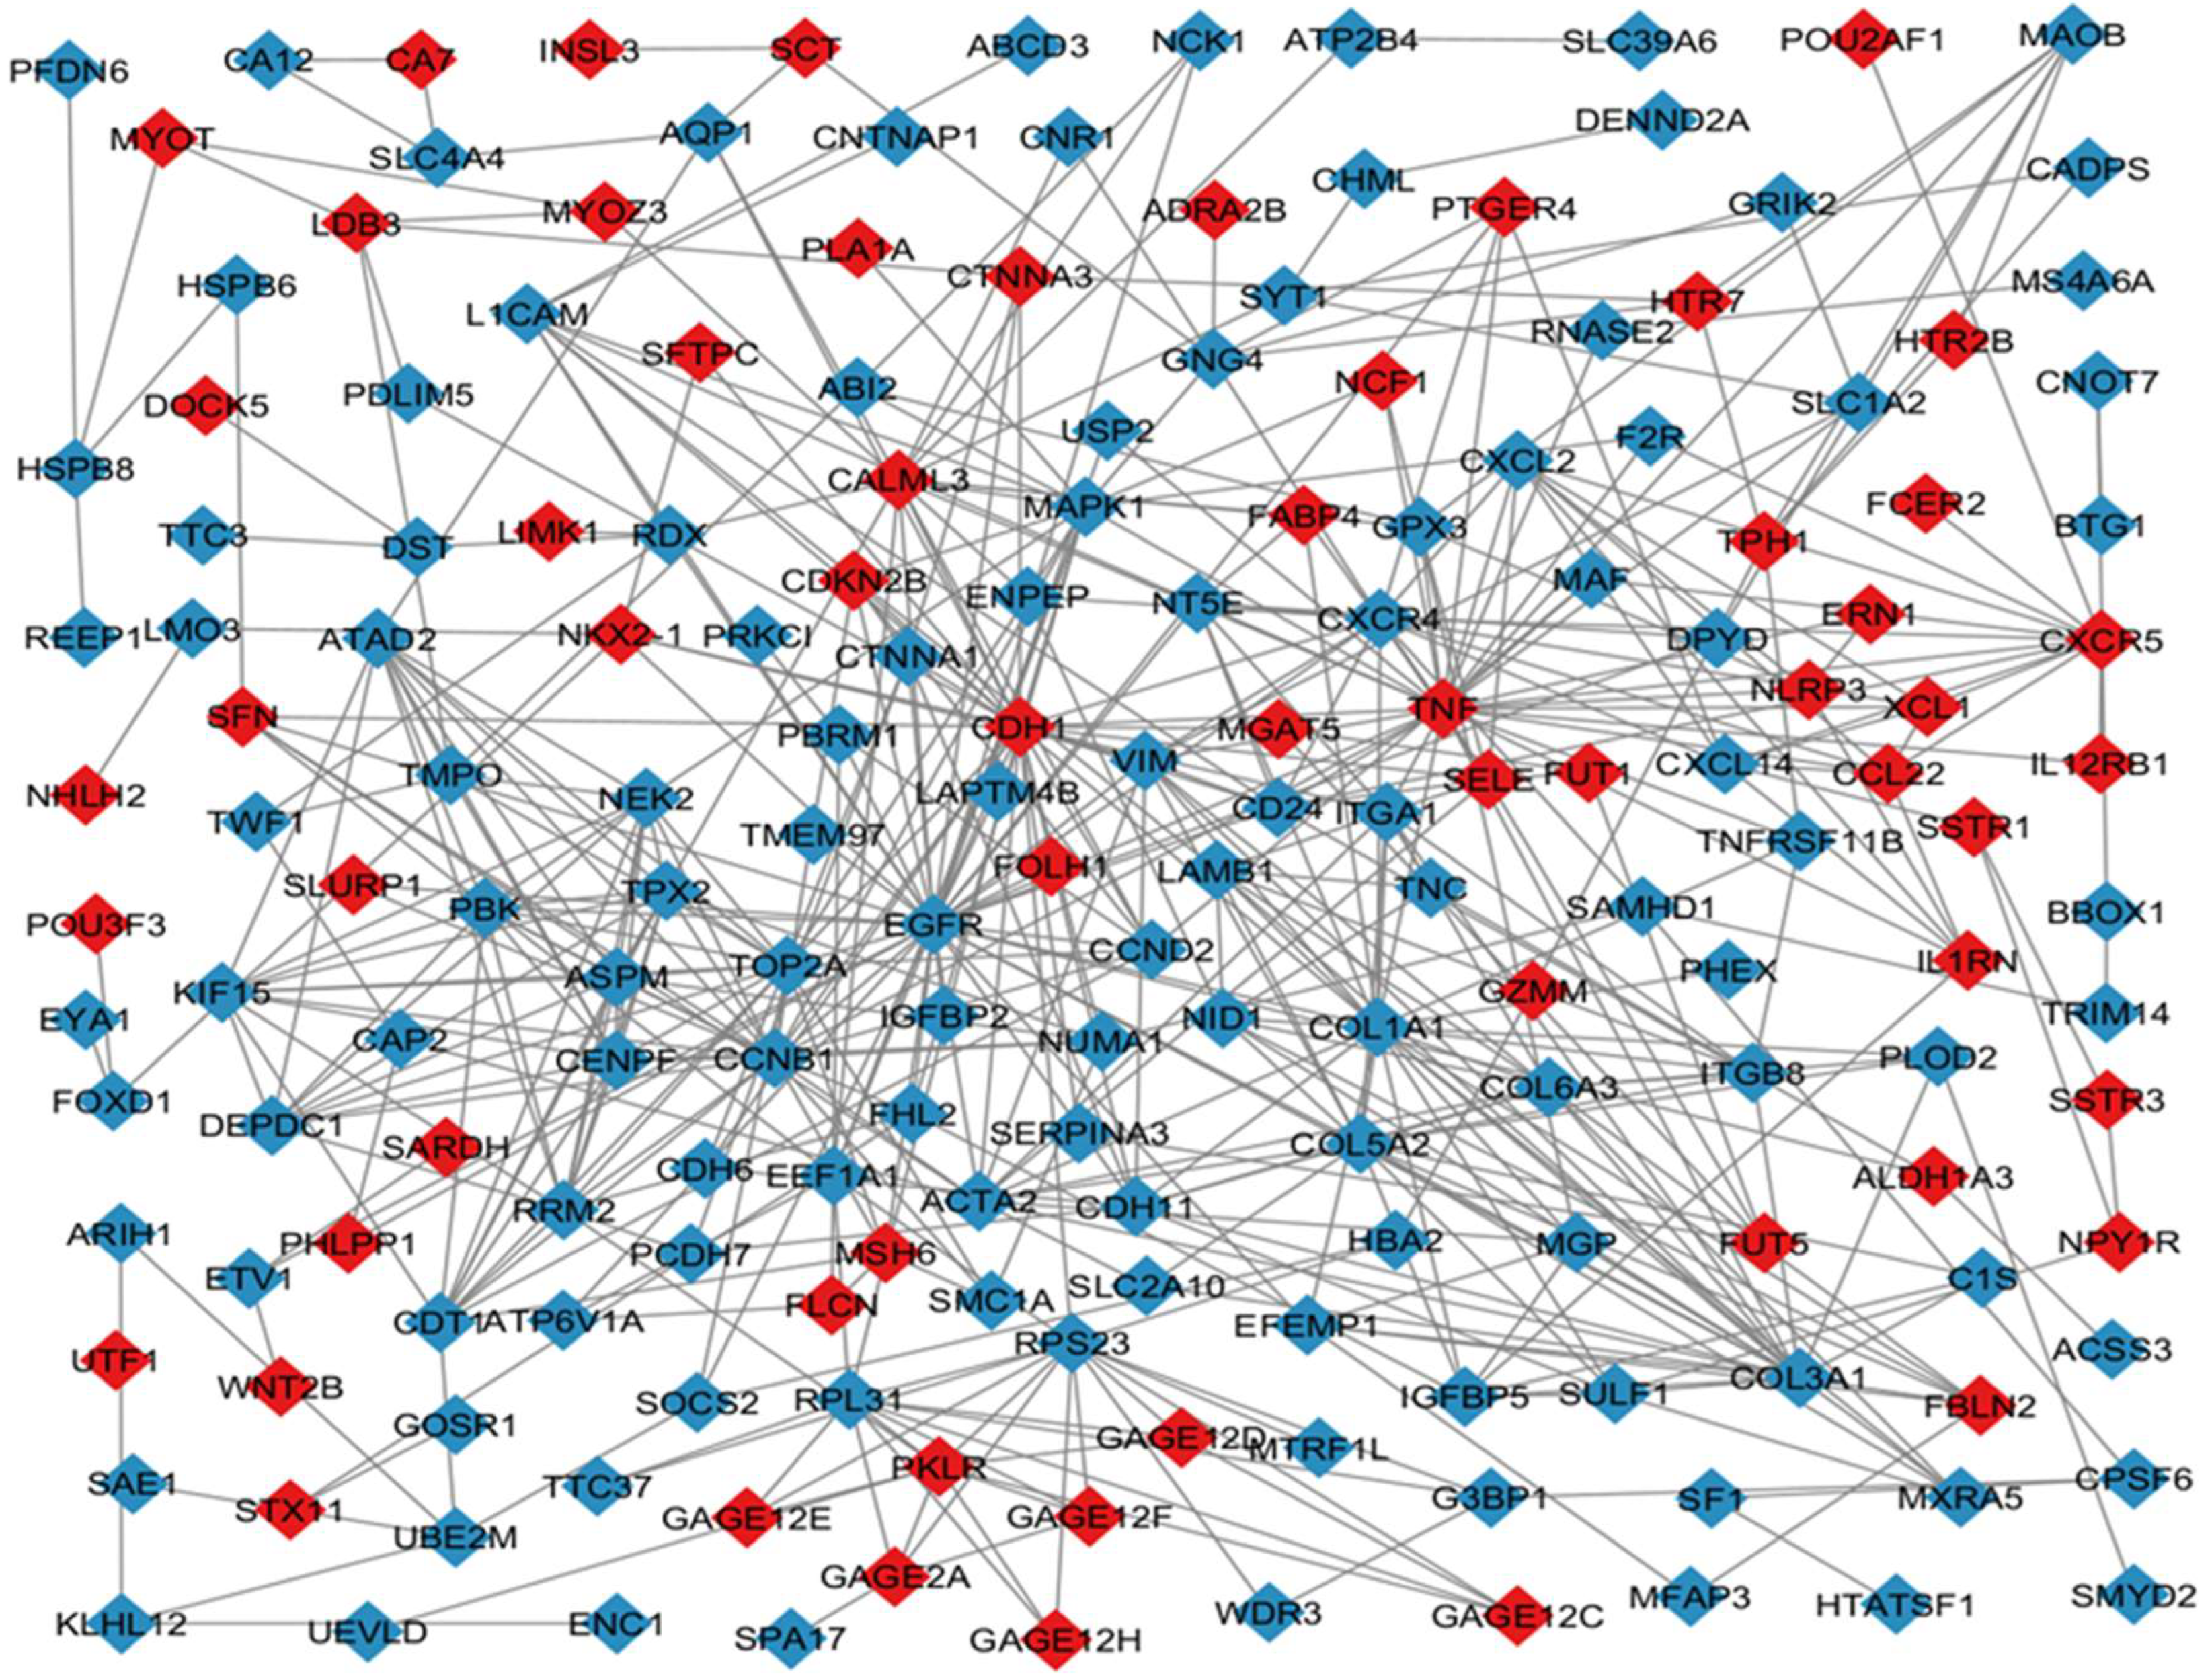
Subsequently, to explore the relationship between core genes and glioma progression, we utilized Cytoscape, a comprehensive offline platform designed for constructing gene regulatory networks. This tool is essential for visualizing and constructing molecular communication networks, allowing us to correlate these networks with gene expression profiles and better understand their role in glioma pathology. The graphical representation in this tool utilizes nodes and edges, where nodes depict biological entities such as genes and proteins, and edges illustrate the connectivity between these entities. Optimal utilization of cytoscape is achieved when it is integrated with extensive databases containing information on protein–dNA interactions, protein-protein interactions, gene expression data, and genetic connections. This integration enhances Cytoscape’s ability to elucidate complex molecular relationships and signaling pathways within biological systems, making it a powerful tool for understanding the underlying mechanisms of glioma progression.[64]
To further analyze the data, we used Cytoscape software to examine the “interGenes.List.txt” file, which helped us visually distinguish between upregulated and downregulated genes, as depicted in Figure 2 Before running the analysis, we prepared and imported two essential files into Cytoscape: one containing the gene list and the other detailing the node type to indicate whether the genes were up- or down-regulated. In the visualization, nodes were colour-coded, with blue representing upregulated genes and red indicating downregulated genes.
Figure 2.
Cytoscape graph. Figure 2: This network graph depicts the relationships between upregulated and downregulated genes identified in HGG and LGG. Nodes represent individual genes, with blue nodes indicating upregulated genes and red nodes indicating downregulated genes. Edges (lines) between nodes indicate known or predicted interactions between these genes. The size of each node is proportional to the degree of differential expression, with larger nodes representing genes with higher fold changes. Key hub genes with multiple connections are highlighted, indicating their potential central role in the regulatory network. This visualization helps understand the complex interactions and possible regulatory mechanisms underlying the observed gene expression changes.
1.4. CytoHubba Analysis
In addition, the CytoHubba plugin in Cytoscape was used to identify the top 10 hub genes within the macro-module, outlining the core gene network and highlighting the essential genes likely involved in glioma progression. Hub genes represented the most connections in the network, indicating their centrality and potential importance in biological processes.[65] As shown in Figure 3, the significance of hub genes is visually represented using a color scale. Nodes corresponding to hub genes are color-coded, with a gradient from red to yellow indicating the degree of connectivity or centrality of the genes within the network. Red represents genes with the highest degree of connectivity or centrality, signifying their critical and influential roles within the network and their importance in the biological processes under investigation. Yellow represents genes with a lower degree of connectivity or centrality, indicating that while they are still important, they have fewer connections or interactions compared to those represented in red. This color distinction provides insights into their significance within the overall molecular interactions of the macro-module.
Figure 3.
Hub genes network. Figure 3: Network Graph of Intersected Hub Genes in HGG and LGG: This graph depicts the intersecting hub genes between high-grade gliomas (HGG) and low-grade gliomas (LGG). These shared genes are crucial for understanding common molecular pathways and mechanisms that contribute to glioma progression and nerve tissue repair in the CNS, offering potential targets for therapeutic intervention across different glioma grades. The color grading from red to yellow typically represents the degree of connectivity or centrality of the genes within the network, the red represents genes with the highest degree of connectivity or centrality. These genes are often the most critical and influential within the network, playing key roles in the biological processes being studied. Yellow represents genes with a lower degree of connectivity or centrality, while still important, have fewer connections or interactions compared to those in red. This color gradient helps to visually distinguish the most significant hub genes from the less connected ones within the network.
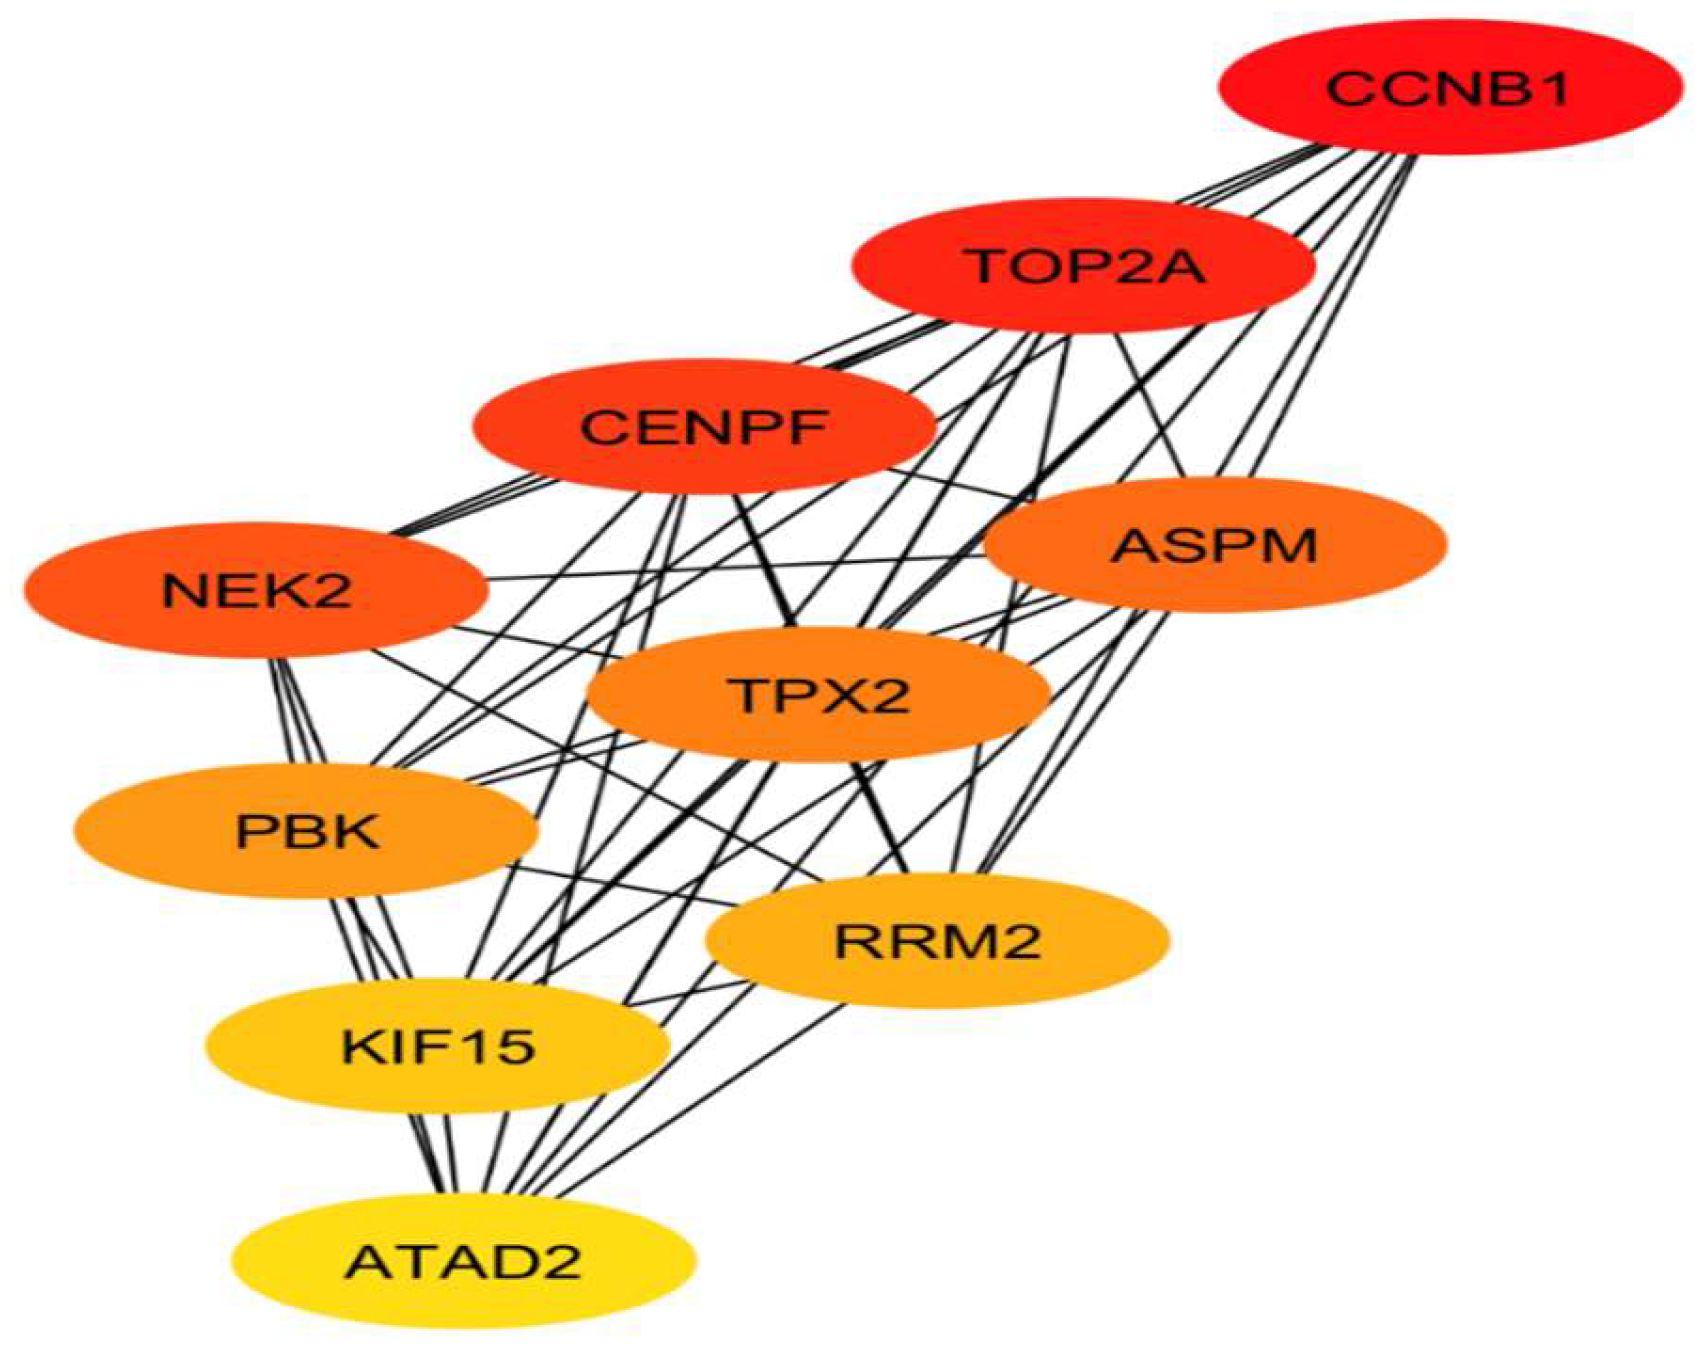
The gene network was imported into Cytoscape software, where we employed the “cytoHubba” plugin to conduct further analysis. We set the imported gene network as the target and selected the top 10 hub genes based on the Maximum Clique Centrality (MCC) ranking method. After configuring the analysis parameters, we generated a graphical representation of the gene network, as illustrated in Figure 3, along with a corresponding ranking table in Table 2. According to this ranking, the gene CCNB1 emerged as the top hub gene with the highest expression score, while ATAD2 ranked tenth, indicating the lowest score among the top hub genes.
Table 2.
Top 10 Hub genes.
| Ranking | Name | Type |
|---|---|---|
| 1 | CCNB1 | Up-regulated |
| 2 | TOP2A | Up-regulated |
| 3 | CENPF | Up-regulated |
| 4 | NEK2 | Up-regulated |
| 5 | ASPM | Up-regulated |
| 6 | TPX2 | Up-regulated |
| 7 | PBK | Up-regulated |
| 8 | RRM2 | Up-regulated |
| 9 | KIF15 | Up-regulated |
| 10 | ATAD2 | Up-regulated |
Table 2: Table of top 10 intersected hub genes between HGG and LGG: This table ranks the top 10 hub genes that are common to both high-grade gliomas (HGG) and low-grade gliomas (LGG). These genes are identified based on their significance and centrality in gene interaction networks. CCNB1 has the highest score and ATAD2 has the lowest score, underscoring their potential roles in glioma pathogenesis and the repair of damaged nerve tissue in the CNS.
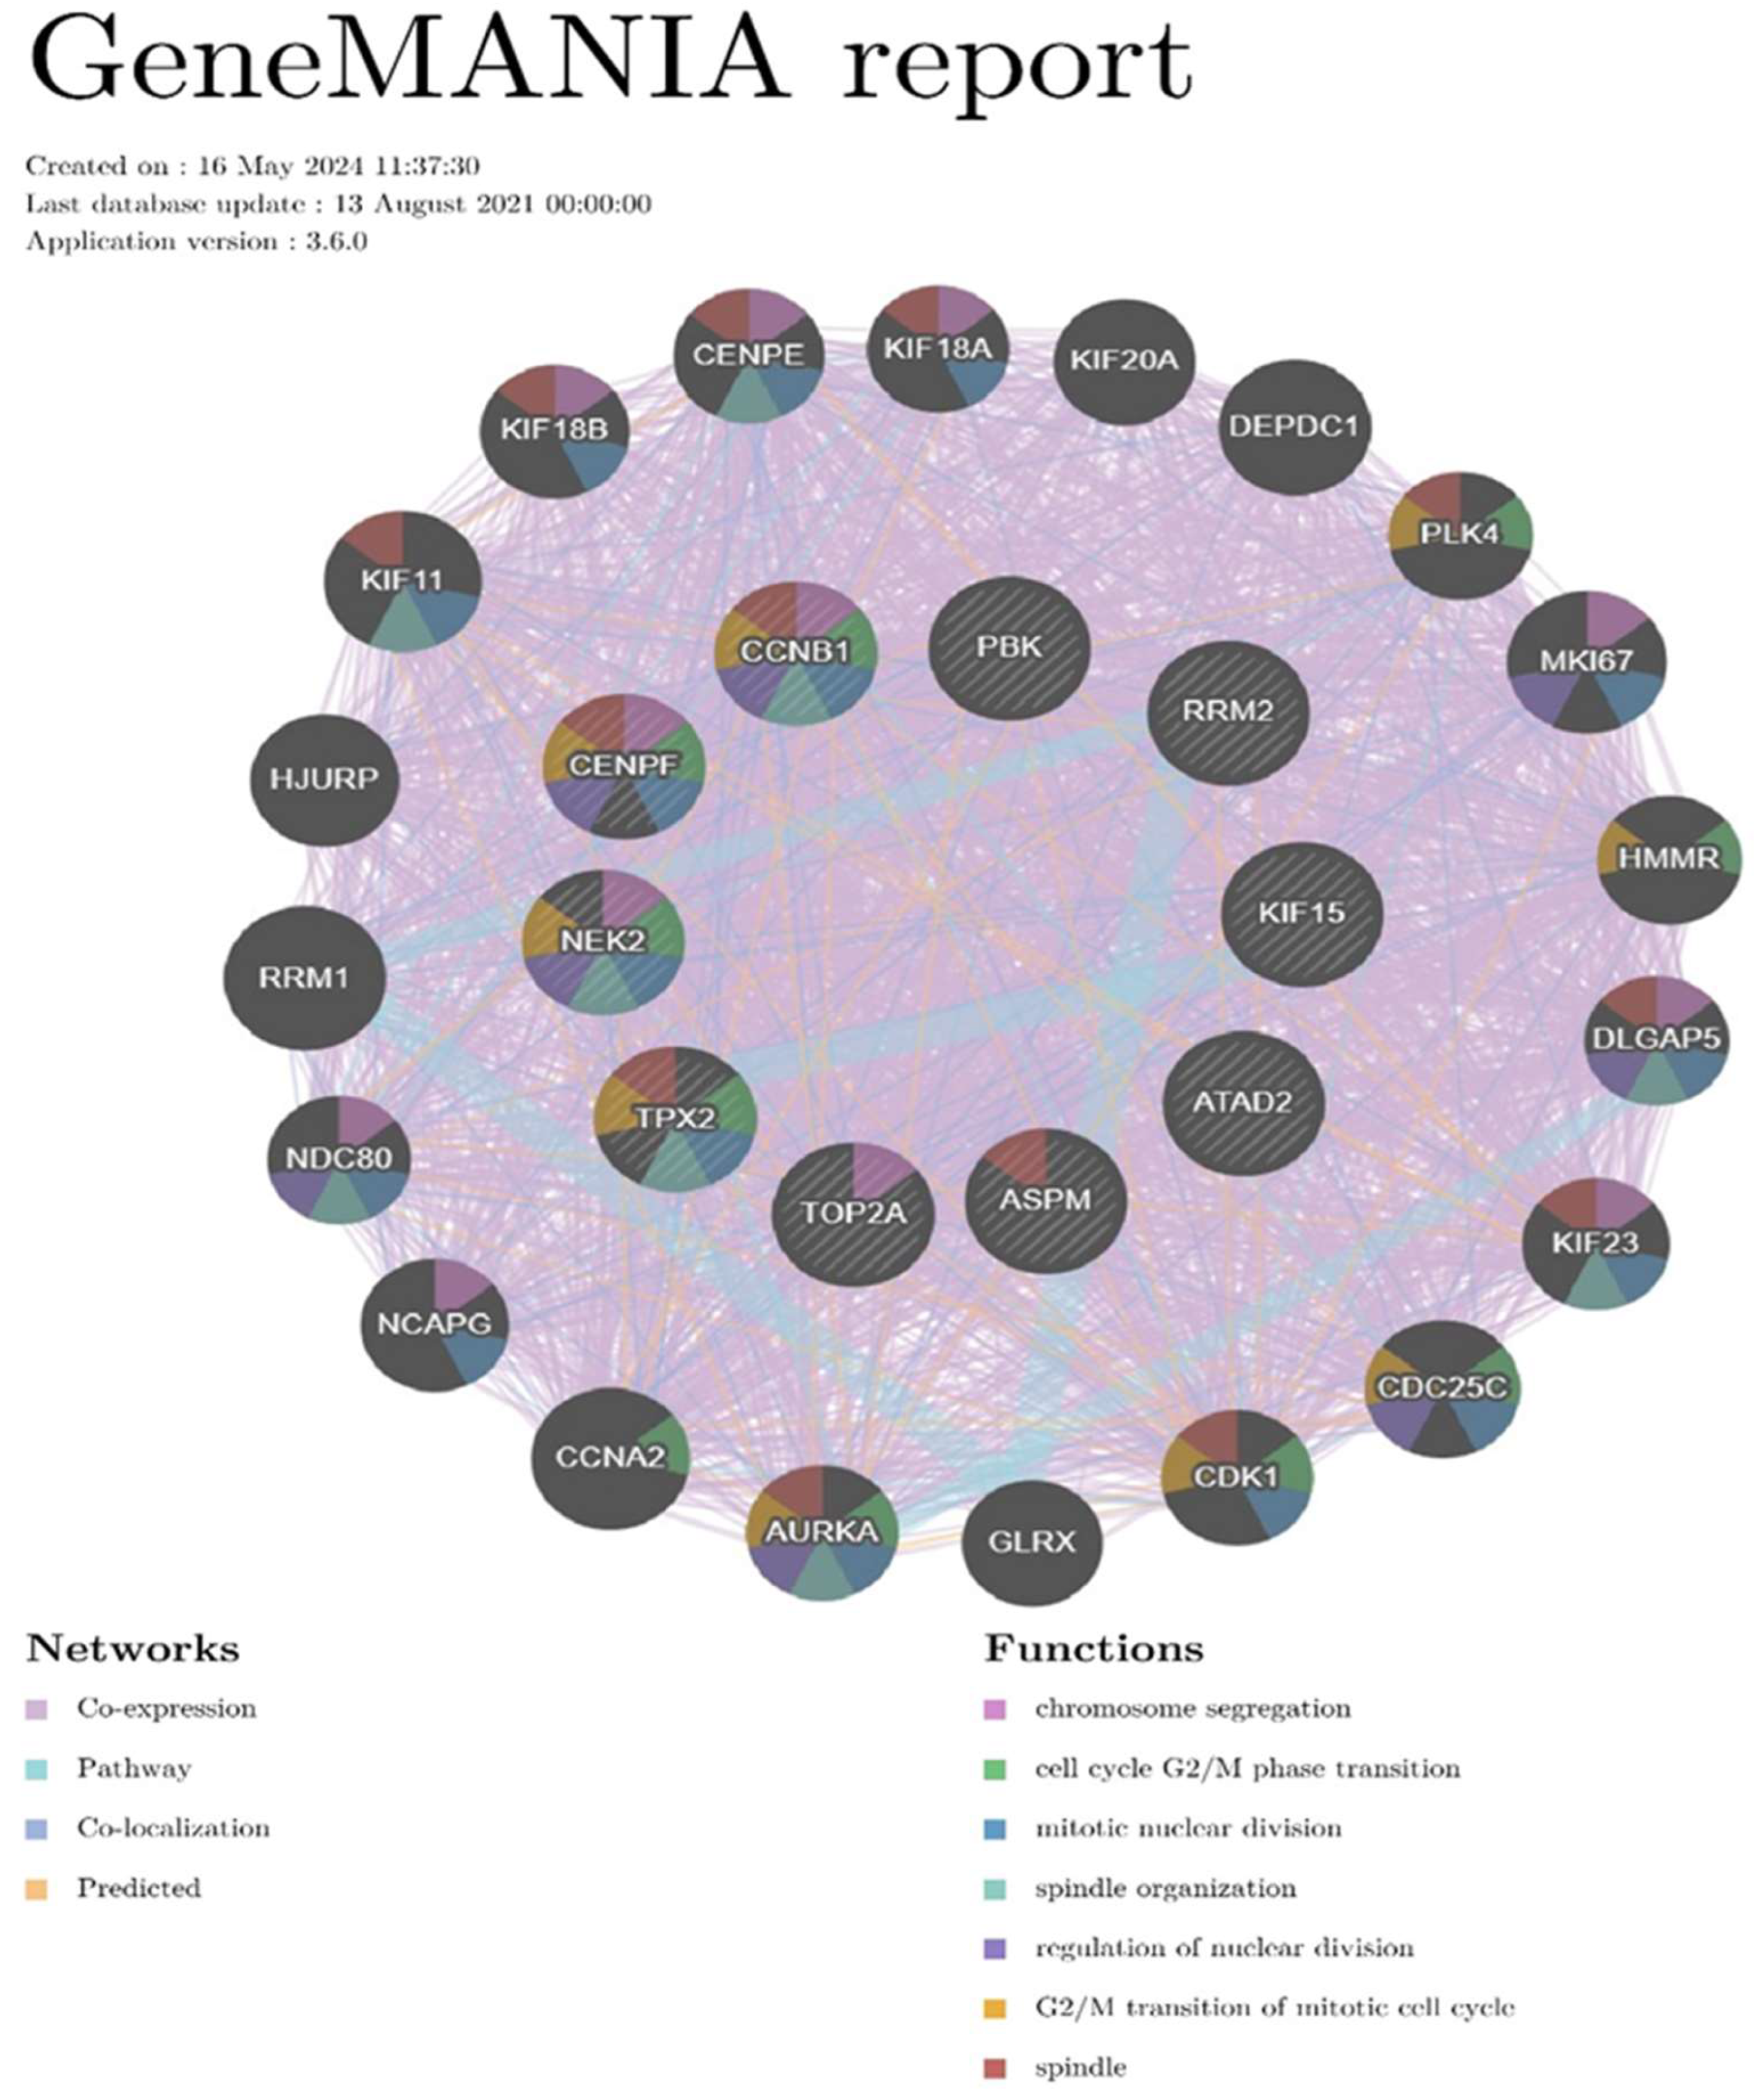
1.5. Gene Mania Analysis
A Gene Mania is a gene-gene interaction network that can be automatically laid out and visualized, where each gene corresponds to a node, and the interactions are represented by edges.[66] This process enables the automated layout and visualization of a Gene Mania, offering valuable insights into the characteristics and relationships of the genes within the network. We utilized the Gene Mania website to explore the relationships and connections of our hub genes with other genes. By inputting our hub genes into the search tool, we generated a network graph illustrating their interactions. We then used the tool’s functions to highlight the most significant biological roles associated with these hub genes, which were visually represented by different colors within each node. Key biological functions identified included mitotic nuclear division, chromosome segregation, spindle formation, cell cycle G2/M phase transition, spindle organization, regulation of nuclear division, and G2/M transition of the mitotic cell cycle. These functions underscore the critical involvement of these genes in glioma progression. As depicted in Figure 4.
Figure 4.
GeneMANIA report. Figure 4: GeneMANIA report illustrates the biological function network and interactions among key glioma genes. This network highlights gene functions such as cell proliferation, apoptosis, and repair mechanisms, revealing their interconnected roles in glioma pathology. CCNB1, CENPF, NEK2, and TPX2 have most of the biological functions in cell division and proliferation among glioma, however, affects glioma progression, and may be considered a therapeutic target in glioma gene therapy.
2. Research Progress About Hub Genes Involved in Gliomas
2.1. Review Methods
The reviewing methodology employed in this study relied on summarizing 72 out of 140 studies under inclusion criteria, as a systemic or narrative review, and the main outcomes of these studies were subjected to recapitulation. The primary objective of this review is to elucidate the biological functions of the hub genes associated with HGG and LGG, in cell reproduction and division, and to explore the specific roles each gene plays in glioma proliferation and mutation through their expression profiles, by drawing on the latest research findings. Table 3 outlines the inclusion and exclusion criteria we followed in our study.
Table 3.
Inclusion/exclusion criteria.
| Index | Inclusion criteria | Exclusion criteria |
|---|---|---|
| Types | Prospective/Retrospective cohort, Systemic review, Meta-analysis, Randomized controlled trial, etc. | *Case reports, Experts’ opinions, and Personal websites. * Non-affluent abstract (lack of required data) |
| Time of the study | New publications after 2007-2024 | Old publications before 2007 |
| Language of the study | Publications in English or translated to English | Non-English publications |
| Methods | *Quantitative *Studies depend on clinical trials and clinical systemic analysis. |
*Qualitative *Studies depend on questionnaire or interview |
Table 3: summarizes the criteria used to determine the eligibility of studies included in the systematic review. It outlines the types of studies considered, the timeframe for publication, language requirements, and the methodological approaches employed. Only prospective and retrospective cohort studies, systematic reviews, meta-analyses, and randomized controlled trials published between 2007 and 2024 in English or translated to English were included. Qualitative studies based on questionnaires or interviews were excluded.
We used the new updated version PRISMA 2020 flowchart, represented by Figure 5 which illustrates the schematic flow criteria. However, PRISMA originally published in 2009, aimed to improve transparency in systematic reviews by detailing the rationale, methods, and findings of the review process. With advancements in methodology and terminology over the past decade, an updated version, PRISMA 2020, has been introduced by Matthew JP, et al.[67] This new guideline offers enhanced reporting guidance to reflect improved practices in study identification, selection, appraisal, synthesis, and meeting the study’s eligibility requirements.
Figure 5.
Preferred Reporting Items for Systematic Reviews and Meta-Analyses 2020 flow chart (PRISMA). Figure 5: PRISMA flow diagram illustrating the identification, screening, eligibility, and inclusion of studies for the systematic review. A total of 162 studies were initially identified from various databases and registers, with 18 excluded due to duplication. After screening, 144 studies were included based on title and abstract, and 40 were excluded due to old publications or non-English language. Finally, 72 studies were selected for review after eligibility checks, focusing on hub genes related to high-grade glioma (HGG) and low-grade glioma (LGG).

2.2. Review Findings
We identified ten essential hub genes via bioinformatics analysis within our datasets; CCNB1, TOP2A, CENPF, NEK2, ASPM, TPX2, PBK, RRM2, KIF15, and ATAD2. We conducted a comprehensive narrative review to provide an overview of the most recent research findings related to these genes. This review encompasses various aspects, including their biological functions, dysregulation, mutations, expression profiles in glioma, and their potential as therapeutic targets or prognostic markers.
2.2.1. CCNB1
Cyclin B1 is a key regulatory protein intricately involved in mitosis. It interacts with p34 (Cdk1) to form the maturation-promoting factor (MPF), which is essential for driving cell cycle progression. Notably, two distinct transcripts of Cyclin B1 have been identified: one is constitutively expressed, while the other is regulated by the cell cycle and is predominantly active during the G2/M phase. This variation in transcripts results from the use of alternate transcription initiation sites, highlighting a sophisticated regulatory mechanism that governs Cyclin B1 expression at different stages of the cell cycle.[68,69]
CCNB1 has been implicated in tumour initiation and progression, operating through a diverse range of transcripts. One transcript is particularly notable for its predominant expression during the G2/M phase and its regulation by the cell cycle.[70] Transcript diversity in CCNB1 is believed to arise from the utilization of alternative transcriptional start points. Additionally, CCNB1 is known to be upregulated during cell division, proliferation, and apoptosis processes.[71] GO and KEGG analyses have shown that CCNB1 is positioned downstream in the cell cycle signaling pathway. Studies indicate that CCNB1 exhibits elevated expression levels in patients with glioblastoma (GBM) compared to control groups. Furthermore, this increased expression is associated with disease-free survival and overall survival rates among GBM patients. These findings suggest a potential link between CCNB1 overexpression, accelerated mitosis, and the promotion of GBM tumour cell proliferation and invasion, highlighting its significant role in the initiation and progression of GBM.[72] Elevated expression levels of CCNB1 have been observed to correlate with high-grade gliomas (HGG) and advanced stages of gliomas. Furthermore, it is suggested that CCNB1 may play a crucial role in the progression of glioblastoma by mediating the cell cycle.[73] Yue, et al., have demonstrated by a vitro experiments that the overexpression of Cyclin B1 effectively reverses the cell cycle arrest occurring at the G2/M transition and the inhibited proliferation of glioma cells resulting from USP39 knockdown.[74]
2.2.2. TOP2A
Topoisomerase IIα plays a critical role in alleviating topological DNA stress during transcription, chromosome condensation, and chromatid separation. This enzyme enables the transient breaking and rejoining of two strands of duplex DNA, allowing them to pass through one another. Notably, two forms of this enzyme exist, likely arising from a gene duplication event.[75] Several investigations have explored the expression of TOP2A and its clinical implications in glioma. However, six independent studies have been retrieved from the Oncomine database and observed that TOP2A exhibits high expression in glioma tissues compared to corresponding normal controls. These findings were further corroborated in clinical specimens at the protein level. Immunohistochemically analysis revealed a significant correlation between TOP2A overexpression and parameters such as grade stage, KI67 positivity, IDH1 mutation status, and patient age.[76]
Strong association between elevated TOP2A expression and poor survival outcomes among glioma patients, whereas silencing of TOP2A hindered glioma cell proliferation and aggressiveness. Moreover, a direct interaction between TOP2A and β-catenin has been identified, facilitating the translocation of β-catenin into the nucleus. Mechanistically, TOP2A has been shown to promote glioma cell growth and invasion in a β-catenin-dependent manner. Additional significant findings underscore TOP2A as a crucial activator of the Wnt/β-catenin pathway in glioma, promoting cellular growth, migration, and invasion.[77] Genomic alterations in HGG have been investigated, along with their associated transcriptomic patterns. However, via computational analyses and biochemical assays, the impact of TOP2A variants on enzyme activities was explored. Notably, within a cohort of 135 IDH-wild-type glioblastomas (GBMs), a novel recurrent mutation was identified in the TOP2A gene, which encodes topoisomerase 2A. Among the four samples harbouring this TOP2A variant, transcriptomic analyses revealed consistent alterations indicative of splicing dysregulation. The deleterious TOP2A mutation observed in these GBMs was found to result in transcriptional deregulation, potentially contributing to the pathology of the disease.[78]
2.2.3. CENPF
Centromere protein F (CENPF) is a human protein encoded by the CENPF gene. Primary functions include involvement in chromosome segregation during cell division and playing a role in orienting microtubules to form cellular cilia.[79] During the G2 phase of the cell cycle, CENPF is associated with the nuclear matrix. While the cell progresses into late G2, this protein becomes a component of the kinetochore, which is a disc-shaped protein complex facilitating the attachment of the centromere of sister chromatids to microtubules, thereby forming the spindle apparatus necessary for separating the chromatids during cell division. CENPF relocates to the spindle midzone in late anaphase and during telophase, it localizes to the intercellular bridge. Mutations in CENPF lead to defective cell division, which is particularly evident during early developmental stages.[80]
In human neuroblastoma cell lines, the knockdown of CENPE leads to a significant inhibition of cell proliferation both in vitro and in vivo.[81] In the Human Protein Atlas (HPA) database, CENPF is one of the genes that exhibit substantial protein expression levels. Univariate and multivariate Cox regression analyses conducted using the CGGA database revealed that only CENPF displayed independent influencing factors. Gene Set Enrichment Analysis (GSEA) identified CENPF as significantly enriched in several key pathways, including the cell cycle, P53 signalling, MAPK signalling, DNA replication, spliceosome, ubiquitin-mediated proteolysis, focal adhesion, cancer pathways, and glioma pathways. The study revealed a core module strongly associated with glioma development, with CENPF emerging as a critical gene within this context. These associated signalling pathways were identified through comprehensive bioinformatics analyses, positioning CENPF as a potential biomarker candidate in glioma research.[82]
Increased expression of CENPE was observed in GBM tissues, and this upregulation was correlated with clinical stage and unfavourable overall survival among glioma patients. CENPE Inhibition of the expression led to the inhibition of proliferation in U251 and U87 cells. Moreover, cell cycle assays indicated that CENPE primarily regulates the transitions between the G0–G1 and G2/M phases. The investigation revealed that CENPE regulates GBM proliferation primarily through the WEE1 G2 checkpoint kinase (WEE1) pathway. It was found that CENPE can bind to WEE1, thereby influencing cell cycle progression and proliferation in GBM cells.[83]
2.2.4. NEK2
Serine/threonine-protein kinase NEK2 is an enzyme encoded by the NEK2 gene in humans.[84] NEK2 has been demonstrated to interact with MAPK1 and NDC80. NEK2 plays a crucial role in controlling centrosome separation and bipolar spindle formation during mitosis, as well as chromatin condensation during meiosis.[85] It achieves this by regulating centrosome separation through the phosphorylation of centrosome proteins, leading to their displacement from the centrosomes.[86]
NEK2 has been identified as significantly upregulated in GBM, and its higher expression correlates with a poorer prognosis. The knockdown of NEK2 attenuates cell proliferation, migration, invasion, and tumorigenesis in GBM, whereas NEK2 overexpression promotes disease progression. Specifically, NEK2 facilitates GBM progression through the activation of non-canonical NF-κB signalling. These findings suggest that targeting the NEK2-NF-κB axis could hold promise as a potential therapeutic strategy for GBM treatment.[87] Elevated expression of NEK2 in glioma is associated with poor clinical outcomes. Single-cell sequencing of GBM samples has shown that NEK2 is upregulated in a subset of positive neural progenitor cells (P-NPCs). These cells exhibit significant proliferation and progression properties and are likely to activate G2M checkpoint pathways. NEK2 is crucial in regulating glioblastoma progression by targeting the cell cycle. These findings suggest the potential for developing novel therapies targeting NEK2 in the treatment of GBM.[88]
Clinically, the expression of NEK2 in patients with glioma is closely associated with EZH2 expression and correlates with a poor prognosis. Additionally, NEK2 expression is significantly elevated in recurrent tumors after therapeutic failure compared to primary untreated tumors in matched GBM patients. NEK2 is identified as one of the most differentially expressed kinase-encoding genes in cultures containing glioma stem cells (GSCs), known as glioma spheres. Thus, NEK2 is essential for in vitro clonogenicity and in vivo tumor propagation, conferring radioresistance and underscoring its critical role in glioma progression and treatment resistance.[89]
2.2.5. ASPM
The Abnormal spindle-like microcephaly-associated protein, encoded by the ASPM gene in humans, is located on chromosome 1 at band q31 (1q31).[90] Mutations or defects in the ASPM gene are associated with autosomal recessive primary microcephaly.[91] The ASPM gene called MCPH5 (Microcephaly Primary Hereditary 5)[92], is the most frequently mutated gene within the microcephaly family. It plays a crucial role in regulating neurogenesis and determining the size of the cerebral cortex.[93] Mutations in ASPM are associated with primary microcephaly, a condition characterized by a significantly reduced head size due to abnormal brain development.[94] Understanding the function of ASPM is essential for unraveling the mechanisms underlying neurogenesis and cerebral cortical growth.
ASPM mRNA levels have been notably increased in glioma tissues, with higher ASPM mRNA expression correlating with a worse disease prognosis. Moreover, ASPM was highly expressed in glioma cell lines such as U87-MG and U251. Knockdown of ASPM expression in these cells significantly inhibited proliferation, migration, and invasion abilities and induced G0/G1 phase cell cycle arrest.[95,96] Furthermore, down-regulation of ASPM suppressed glioma growth in nude mice models. ASPM promoter was predicted to have five potential binding sites for the transcription factor FoxM1. Overexpression of FoxM1 led to a significant increase in ASPM expression and promoted the proliferation and migration of glioma cells. However, this effect was reversed upon ASPM ablation, suggesting that FoxM1-mediated regulation of ASPM contributes to the oncogenic properties of glioma cells.[95,97,98]
The expression of ASPM was found to be strongly correlated with tumor grade, exhibiting an increase in recurrence compared to the initial lesion, regardless of the primary tumor’s initial grade.[99] However, ASPM expression was observed to increase over serial passages in glioma spheres in vitro, and in mouse xenografts in vivo. These findings suggest that ASPM is progressively upregulated during glioma development and recurrence, underscoring its potential as a biomarker for tumor aggressiveness and progression.[100] ASPM is highly expressed in various tumor cell lines, suggesting its crucial role in tumorigenesis. Recent studies have demonstrated ASPM overexpression in malignant gliomas, while its knockdown has been shown to effectively inhibit tumour proliferation.[101] These findings highlight the potential of ASPM as a therapeutic target in cancer, particularly malignant gliomas, and emphasize the need for further research into its specific role in tumorigenesis and therapeutic interventions.
2.2.6. TPX2
The Targeting Protein for Xklp2, encoded by the TPX2 gene in humans, plays a vital role as a spindle assembly factor during the M phase of the cell cycle.[102] It is essential for initiating the formation and growth of microtubules[103]. TPX2 features two nuclear localization signal (NLS) domains, which facilitate its transport to the microtubules. These NLS domains are found at both the amino-terminal and carboxy-terminal ends of the protein.[104] The presence of these domains is critical for TPX2’s function in microtubule organization and the assembly of the mitotic spindle during cell division.[105]
Elevated TPX2 levels have been observed in several glioma cell lines, where it promotes cellular proliferation, decreases the proportion of cells in the G0/G1 phase[106], and enhances invasive behavior in U251 and U87 cells. TPX2 is significantly overexpressed in various cancers, including human malignant astrocytoma, suggesting a potential involvement in tumor progression.[107] Additionally, as demonstrated by immunohistochemistry and immunofluorescence staining, TPX2 has been localized to the nucleus in astrocytoma tissues. Further analysis using real-time PCR and Western blotting has shown that TPX2 expression is markedly higher in high-grade astrocytoma tissues and cell lines compared to low-grade astrocytoma tissues and normal cell line.[108] Research indicates that TPX2 may facilitate glioma progression by activating the protein kinase B (AKT) signaling pathway.[109]
2.2.7. PBK
The PDZ-binding kinase (PBK) gene in humans encodes the Lymph Okine-activated killer T-cell-originated protein kinase, an enzyme known for its serine/threonine kinase activity and its association with the dual-specific mitogen-activated protein kinase kinase (MAPKK) family.[110,111] Research indicates that mitotic phosphorylation is essential for its catalytic function. This kinase, active during mitosis, likely plays a role in activating lymphoid cells and supporting testicular functions, potentially contributing to spermatogenesis.[110]
The reduction of PBK gene expression through gene knockdown resulted in decreased cell viability and sphere formation. Additionally, in one culture, there was an observed increase in apoptosis. A study focused on identifying and functionally validating PBK proposes that targeting PBK could be a promising molecular strategy for treating GBM.[112] High expression of the PBK gene has been observed in glioblastoma samples, correlating with significantly worse survival rates compared to normal brain samples. This indicates that PBK could serve as a potential prognostic factor for glioblastoma. Furthermore, targeting PBK may hold promise as a therapeutic strategy for GBM treatment.[113]
Recently, a chemo radio-resistant oncogenic signature has been identified and validated in GBM, which includes PBK as one of three key genes. This discovery was made through comprehensive silica analysis, highlighting PBK’s role as a biomarker with predictive properties. The signature, consisting of CDK1, PBK, and CHEK1 overexpression, is implicated in driving the cell cycle, thus promoting tumor progression in GBM.[114] Additional independent gene expression datasets have verified the abnormal expression of PBK in medulloblastoma. Survival analysis revealed a significant association between higher PBK expression levels and poorer clinical outcomes in non-wingless medulloblastomas.[115]
2.2.8. RRM2
The RRM2 gene in humans produces the ribonucleoside-diphosphate reductase subunit M2, a key component of ribonucleotide reductase. This enzyme is crucial for DNA synthesis and repair, as it catalyzes the conversion of ribonucleotides into deoxyribonucleotides, which are necessary for DNA replication and repair.[116] The production of RRM2 is carefully controlled and occurs in a cell-cycle-dependent manner[117], with increased synthesis during the S phase, when DNA replication takes place. Abnormalities in the expression or function of RRM2 can lead to genomic instability and are linked to various diseases, including cancer, underscoring its importance in maintaining cellular stability and offering potential therapeutic targets.[118,119]
Overexpression of the RRM2 gene has been associated with promoting rapid cell proliferation by increasing the levels of deoxyribonucleotide triphosphates (dNTPs), which can contribute to the development of various cancers.[120,121,122] Elevated RRM2 expression has been observed in glioma tissues, as evidenced by data from The Cancer Genome Atlas (TCGA), Western blot analyses, and immunohistochemistry. Additionally, higher RRM2 levels are negatively correlated with the survival of glioma patients. When RRM2 was knocked down using RNA interference (RNAi), RNA sequencing revealed an upregulation of genes involved in apoptosis, proliferation, cell adhesion, and the negative regulation of signaling.[123] In vitro experiments using stable transfection techniques to reduce RRM2 levels revealed specific changes in cell behavior. In an in vivo setting, the reduction of RRM2 expression led to decreased tumor growth and the suppression of the AKT and ERK1/2 signaling pathways.[124]
These observations suggest that targeting RRM2 could be a promising strategy for glioma treatment, impacting apoptosis, cell proliferation, and signaling pathways.[125] Silencing RRM2 in GBM cells significantly reduced their proliferation, invasion, and migration, while increasing apoptosis. In contrast, RRM2 overexpression enhanced proliferation, migration, and invasion, but decreased apoptosis in these cells. In vivo, RRM2 overexpression also led to faster tumor growth in GBM cells. These results collectively highlight RRM2’s role in driving the aggressiveness of glioblastoma cells by promoting growth and invasive behaviors while suppressing programmed cell death.[126]
2.2.9. KIF15
Kinesin family member 15 (KIF15) is a protein encoded by the KIF15 gene in humans. It belongs to the kinesin superfamily and functions as a motor protein. KIF15 plays a crucial role in maintaining the separation of half-spindles during cell division by counteracting forces generated by other motor proteins.[127] KIF15 is expressed in all cells during mitosis and post-mitotic neurons that are actively growing axons. Its primary function lies in maintaining the bipolar microtubule spindle apparatus during cell division, and it shares overlapping functions with other kinesin and KIF11.[128] KIF15 is believed to promote spindle assembly by cross-linking and sliding along microtubules,[129] which creates separation between centrosomes and contributes to proper spindle formation. This activity is crucial for ensuring accurate chromosome segregation and cell division.[130]
KIF15 has been found to be significantly upregulated in glioma tumor tissues, demonstrating a positive correlation with pathological staging, recurrence risk, and unfavorable prognosis. Its inhibition through silencing techniques has been shown to effectively impede cell proliferation and stemless in glioma cells, leading to cell cycle arrest in the G2 phase and induction of apoptosis. In vivo studies have further validated the suppressive effect of KIF15 knockdown on tumor growth. Mechanistic investigations have elucidated the regulatory role of KIF15 knockdown on apoptosis- and cell cycle-related proteins, shedding light on its function as a tumor promoter in glioma progression. Notably, KIF15 emerges as a potential prognostic marker for glioma and a promising therapeutic target for the development of novel glioma therapies.[131]
Evidence suggests that KIF15 plays a crucial role in glioblastoma progression as a potential genetic factor. Moreover, elevated expression levels of KIF15 have been observed in GBM tumor tissues, showing correlations with tumor size, clinical stage, and other relevant clinical features. Upon knockout of the KIF15 gene, there was a notable suppression in the proliferation capability of glioblastoma cells. Furthermore, KIF15 was found to promote the growth of glioblastoma tumors in murine models, underlining its significance in glioblastoma pathogenesis.[132]
2.2.10. ATAD2
The ATPase family AAA domain-containing protein 2 (ATAD2), also referred to as ATPase proteins, is comprised of approximately 200 amino acids and tends to oligomerize into hexamers over time. This enzymatic structure harbors ATP binding sites that facilitate the hydrolysis of ATP into ADP and phosphate ions, liberating energy in the process.[133] These energy stores play a critical role in sustaining vital biological processes in organisms, including but not limited to DNA replication, priming, and remodeling; protein synthesis, modification, and degradation; as well as the transport of nutrients and metabolites.[134] garnered attention as a recently identified oncogene tightly linked with epigenetic alterations in various human cancers.[135,136] Acting as a coactivator for transcription factors, ATAD2 plays a role in epigenetic modifications and can modulate the expression of downstream oncogenes or tumor suppressors, potentially in collaboration with enhancer of zest homologue 2 (EZH2). The close association between ATAD2 and cancer has emerged as a prominent research focus, highlighting the significant implications of ATPase-related mechanisms in cancer biology.[137]
The upregulation of ATAD2 through exogenous overexpression significantly increased the expression of PLK4 in GBM cells. This mechanistic link suggests that ATAD2-dependent transcriptional regulation of PLK4 contributes to enhanced cell proliferation and tumorigenesis, as indicated by recent research findings.[138] The exogenous ATAD2 can lead to a substantial increase in the expression levels of Polo-like kinase 4 (PLK4), thereby promoting the initiation of GBM and its resistance to radiation therapy. This reveals that ATAD2 might play a pivotal role as a regulator of PLK4 transcription in GBM, influencing its oncogenic and therapeutic resistance properties.[139]
Table 4.
Summary of the main updated studies.
| Title | ReferencesAuthors Year | Key points of finding |
|---|---|---|
| CCNB1 | ||
| Hub biomarkers for the diagnosis and treatment of glioblastoma based on microarray technology. | Cui, K, et al. (2021)[72] | CCNB1 exhibits elevated expression levels in patients with glioblastoma (GBM) compared to control groups, increased expression is associated with disease-free survival and overall survival rates among GBM patients. |
| USP39-mediated deubiquitination of Cyclin B1 promotes tumor cell proliferation and glioma progression. | Xiao, Y, et al. (2023)[74] | Overexpression of Cyclin CCNB1 effectively reverses the cell cycle arrest occurring at the G2/M transition and the inhibited proliferation of glioma cells resulting from USP39 knockdown. |
| TOP2A | ||
| DNA topoisomerase II alpha promotes the metastatic characteristics of glioma cells by transcriptionally activating β-catenin. | Liu, Y, et al. (2022)[77] | Silencing of TOP2A hindered glioma cell proliferation and aggressiveness. |
| Targeted sequencing of cancer-related genes reveals a recurrent TOP2A variant which affects DNA binding and coincides with global transcriptional changes in glioblastoma. | Gielniewski, B, et al. (2023)[78] | The deleterious TOP2A mutation observed in these IDH-wild-type glioblastomas (GBMs), and potentially contributing to the pathology of the disease. |
| CENPF | ||
| Transcriptome analysis revealed CENPF associated with glioma prognosis. | Zhang, M, et al. (2021)[82] | CENPF is one of the genes that exhibit substantial protein expression levels, and strongly associated with glioma development, CENPF as a potential biomarker candidate in glioma research |
| CENPE promotes glioblastomas proliferation by directly binding to WEE1. | Ma, C, et al. (2020)[83] | CENPE regulates GBM proliferation primarily through the WEE1 G2 checkpoint kinase (WEE1) pathway, thereby influencing cell cycle progression and proliferation in GBM cells. |
| NEK2 | ||
| NEK2 enhances malignancies of glioblastoma via NIK/NF-Κb pathway. | Xiang, J, et al. (2022)[87] | NEK2 has been identified as significantly upregulated in GBM, and knockdown of NEK2 attenuates cell proliferation, migration, invasion, and tumorigenesis in GBM, |
| CCNA2 and NEK2 regulate glioblastoma progression by targeting the cell cycle. | Zhou, H, et al. (2024)[88] | Elevated expression of NEK2 in glioma is associated with poor clinical outcomes, and upregulated in a subset of positive neural progenitor cells (P-NPCs), NEK2 is crucial in regulating glioblastoma progression. |
| ASPM | ||
| ASPM Is a Prognostic Biomarker and Correlates With Immune Infiltration in Kidney Renal Clear Cell Carcinoma and Liver Hepatocellular Carcinoma. | Deng, T, et al. (2022)[99] | ASPM was found to be strongly correlated with tumor grade, exhibiting an increase in recurrence compared to the initial lesion. |
| ASPM is a predictor of overall survival and has therapeutic potential in endometrial cancer. | Zhou, J, et al. (2020)[101] | Recent studies have demonstrated ASPM overexpression in malignant gliomas, while its knockdown has been shown to effectively inhibit tumour proliferation. |
| TPX2 | ||
| High TPX2 expression results in poor prognosis, and Sp1 mediates the coupling of the CX3CR1/CXCL10 chemokine pathway to the PI3K/Akt pathway through targeted inhibition of TPX2 in endometrial cancer. | Yang, M, et al. (2024)[106] | Elevated TPX2 levels have been observed in several glioma cell lines, where it promotes cellular proliferation, decreases the proportion of cells in the G0/G1 phase. |
| CircPOSTN/miR-361-5p/TPX2 axis regulates cell growth, apoptosis and aerobic glycolysis in glioma cells. | Long, N, et al. (2020)[109] | TPX2 may facilitate glioma progression by activating the protein kinase B (AKT) signaling pathway. |
| PBK | ||
| Identification of CDK1, PBK, and CHEK1 as an Oncogenic Signature in Glioblastoma: A Bioinformatics Approach to Repurpose Dapagliflozin as a Therapeutic Agent. | Chinyama, H, et al. (2023)[114] | PBK is one of three key genes, and highlighting PBK’s role as a biomarker with predictive properties in GBM. |
| Identification of PBK as a hub gene and potential therapeutic target for medulloblastoma. | Deng, Y, et al. (2022)[115] | Abnormal expression of PBK in medulloblastoma, and significant association between higher PBK expression levels and poorer clinical outcomes in non-wingless medulloblastomas. |
| RRM2 | ||
| RRM2 is a potential prognostic biomarker with functional significance in glioma. | Sun, H, et al. (2019)[123] | Elevated RRM2 expression is negatively correlated with the survival of glioma patients. When RRM2 was knocked down using RNA interference (RNAi), RNA sequencing revealed an upregulation of genes involved in apoptosis, proliferation, cell adhesion, and the negative regulation of signaling. |
| Inhibition of RRM2 radiosensitizes glioblastoma and uncovers synthetic lethality in combination with targeting CHK1. | Corrales, S, et al. (2023)[125] | Targeting RRM2 could be a promising strategy for glioma treatment, impacting apoptosis, cell proliferation, and signaling pathways. |
| KIF15 | ||
| Identification of KIF15 as a potential therapeutic target and prognostic factor for glioma. | Wang, Q, et al. (2020)[131] | KIF15 has been found to be significantly upregulated in glioma tumor tissues, demonstrating a positive correlation with pathological staging, recurrence risk, and unfavorable prognosis. Elucidated the regulatory role of KIF15 knockdown on apoptosis- and cell cycle-related proteins. |
| Kinesin family member 15 can promote the proliferation of glioblastoma. | Wang, L, et al. (2022)[132] | KIF15 plays a crucial role in glioblastoma progression as a potential genetic factor. Elevated expression levels of KIF15 have been observed in GBM tumor tissues, showing correlations with tumor size, clinical stage. |
| ATAD2 | ||
| Polo-like kinase4 promotes tumorigenesis and induces resistance to radiotherapy in glioblastoma. | Wang, J, et al. (2019)[138] | Upregulation of ATAD2 through exogenous overexpression significantly increased the expression of PLK4 in GBM cells, and ATAD2-dependent transcriptional regulation of PLK4 contributes to enhanced cell proliferation and tumorigenesis, as indicated by recent research findings. |
| Tumor-Promoting ATAD2 and Its Preclinical Challenges. | Liu, H, et al. (2022)[139] | Exogenous ATAD2 can lead to a substantial increase in the expression levels of PLK4, thereby promoting the initiation of GBM and its resistance to radiation therapy. This reveals that ATAD2 might play a pivotal role as a regulator of PLK4 transcription in GBM. |
Table 4: Summary of recent key studies related to ten hub genes involved in HGG and LGG progression, highlighting their potential roles as biomarkers and therapeutic targets in glioma.
3. Summary and Discussion
Distinguishing between LGG and HGG patients poses a significant challenge for researchers in formulating effective evaluation and treatment strategies.[140] Previous investigations have employed several handcrafted features extracted from laboratory data, specifically focusing on tumor texture and volume, to categorize tissues as either LGG or HGG.[141] Glioma, constituting approximately 70-80% of malignancies in the CNS, stands as the most prevalent primary brain tumor.[142] Among patients diagnosed with LGG, the median overall survival time is approximately 7 years.[143] Alternatively, for HGG this period reduces to approximately 18 months.[144] These statistics underscore the varying prognosis associated with different grades of glioma.
The objective of our study was to accurately identify hub genes associated with LGG and HGG using software tools like R Studio and Cytoscape, focusing specifically on a subset of 249 intersecting genes. We analysed the datasets GSE50161 and GSE107850 (as detailed in the Table 1) to determine the up- and down-regulated DEGs for both HGG and LGG. Our analysis revealed that LGG samples exhibit a greater number of up- and down-regulated genes compared to HGG samples, and that both disease groups show more significant gene regulation than the control groups. Using Venn analysis, we identified a list of intersecting genes, which were subsequently analyzed in Cytoscape to determine the most highly expressed genes, termed “hub genes,” among LGG and HGG samples. The identified hub genes (CCNB1, TOP2A, CENPF, NEK2, ASPM, TPX2, PBK, RRM2, KIF15, and ATAD2) were notable for having the highest expression scores and the most connections within the gene network.
We undertook a thorough systemic review of 72 studies (as described in Figure 5 – PRISMA flow chart) to assess the most recent advancements regarding the ten hub genes identified in our analysis. This review demonstrated that many of these genes show a robust positive correlation with glioma, with some playing critical roles in therapy. Specifically, CCNB1, TOP2A, CENPF, NEK2, ASPM, PBK, and KIF15 were found to be highly correlated with HGG, showing increased expression during crucial processes such as cell division, proliferation, progression, and apoptosis in glioma cells. In contrast, TPX2 and RRM2 exhibited weaker correlations and were predominantly expressed in LGG. Furthermore, ATAD2, the lowest-ranked gene in our analysis, displayed a weak and indirect association with glioma progression and proliferation. Our review also highlighted that targeting the hub genes CCNB1, TOP2A, CENPF, NEK2, ASPM, PBK, and KIF15 holds significant therapeutic potential. Among these, NEK2, ASPM, and KIF15 have been particularly noted for their potential as prognostic markers in glioma therapy, suggesting that interventions aimed at these genes could offer promising strategies for treating glioma. However, Gene Mania analysis (Figure 4) revealed that CCNB1, CENPF, NEK2, and TPX2 are particularly prominent in biological functions related to cell division and the mitotic cycle. This suggests that these genes may play a crucial role in mutations and progression during glioma development.
The discovery of key hub genes in glioma, such as NEK2, ASPM, and KIF15, presents promising opportunities for future research and therapeutic development. Understanding the molecular mechanisms by which these genes drive glioma progression is essential. Techniques like CRISPR-Cas9, RNA interference, and small molecule inhibitors should be explored in preclinical models to assess their potential. Large-scale clinical trials are needed to evaluate the efficacy and safety of targeting these genes. Additionally, integrating bioinformatics with genomics and personalized medicine could refine therapeutic approaches, leading to more effective treatments and improved outcomes for glioma patients.
4. Conclusion
This study highlights the critical challenge of distinguishing between low-grade gliomas (LGG) and high-grade gliomas (HGG), a distinction crucial for effective diagnosis and treatment. Key genes such as CCNB1, TOP2A, CENPF, NEK2, ASPM, PBK, and KIF15 are strongly linked to glioma progression, particularly in LGG. Gene Mania analysis confirmed the central roles of CCNB1, CENPF, NEK2, and TPX2 in cell division and mitosis, making them promising therapeutic targets.
Future research should explore the molecular mechanisms of these genes in glioma pathogenesis using advanced techniques like CRISPR-Cas9 and RNA interference. Clinical trials are necessary to assess the efficacy of targeting these hub genes. Integrating bioinformatics with functional genomics and personalized medicine will enhance the development of targeted therapies, potentially improving outcomes for glioma patients.
Author Contributions
Issam AbuQeis authored and edited the original manuscript. Abeer Teeti provided critical editing for the English writing. Yu Zou was responsible for the literature review and conducted the bioinformatics analysis. Monther Ajaj and Amro Teeti contributed to the design and thematic development of the study. Ying-Chun Ba supervised the research and revised the manuscript. Ting-Hua Wang contributed to the final revision and framing of the study.
Funding
None.
Data Availability Statement
Data reported in this study are available from the corresponding author upon reasonable request.
Acknowledgments
None.
Conflicts of Interest
The authors declare no conflict of interest.
Ethics Statement
Not applicable.
References
- Charles, N. A.; Holland, E. C.; Gilbertson, R.; Glass, R.; Kettenmann, H. The brain tumor microenvironment. Glia 2012, 60(3), 502–514. [Google Scholar] [CrossRef] [PubMed]
- Araque, A.; Navarrete, M. Glial cells in neuronal network function. Philos Trans R Soc Lond B Biol Sci 2010, 365(1551), 2375–2381. [Google Scholar] [CrossRef]
- Grady, C.; Melnick, K.; Porche, K.; Dastmalchi, F.; Hoh, D. J.; Rahman, M.; Ghiaseddin, A. Glioma Immunotherapy: Advances and Challenges for Spinal Cord Gliomas. Neurospine 2022, 19(1), 13–29. [Google Scholar] [CrossRef]
- Wang, J.; Zuo, J.; Wang, M.; Ma, X.; Gao, K.; Bai, X.; Wang, N.; Xie, W.; Liu, H. Polo-like kinase 4 promotes tumorigenesis and induces resistance to radiotherapy in glioblastoma. Oncol Rep 2019, 41(4), 2159–2167. [Google Scholar] [CrossRef] [PubMed]
- Li, S.; Wang, C.; Chen, J.; Lan, Y.; Zhang, W.; Kang, Z.; Zheng, Y.; Zhang, R.; Yu, J.; Li, W. Signaling pathways in brain tumors and therapeutic interventions. Signal Transduction and Targeted Therapy 2023, 8(1), 8. [Google Scholar] [CrossRef] [PubMed]
- Samad, M. A.; Nathani, K. R.; Choudry, U. K.; Waqas, M.; Khan, S. A.; Enam, S. A. Evidence-based advances in glioma management. IJS Short Reports.
- Xu, C.; Xiao, M.; Li, X.; Xin, L.; Song, J.; Zhan, Q.; Wang, C.; Zhang, Q.; Yuan, X.; Tan, Y.; et al. Origin, activation, and targeted therapy of glioma-associated macrophages. Front Immunol 2022, 13, 974996. [Google Scholar] [CrossRef]
- Yalamarty, S. S. K.; Filipczak, N.; Li, X.; Subhan, M. A.; Parveen, F.; Ataide, J. A.; Rajmalani, B. A.; Torchilin, V. P. Mechanisms of Resistance and Current Treatment Options for Glioblastoma Multiforme (GBM). Cancers (Basel). [CrossRef]
- Hanif, F.; Muzaffar, K.; Perveen, K.; Malhi, S. M.; Simjee Sh, U. Glioblastoma Multiforme: A Review of its Epidemiology and Pathogenesis through Clinical Presentation and Treatment. Asian Pac J Cancer Prev 2017, 18(1), 3–9. [Google Scholar] [CrossRef]
- Sevastre, A. S.; Costachi, A.; Tataranu, L. G.; Brandusa, C.; Artene, S. A.; Stovicek, O.; Alexandru, O.; Danoiu, S.; Sfredel, V.; Dricu, A. Glioblastoma pharmacotherapy: A multifaceted perspective of conventional and emerging treatments (Review). Exp Ther Med 2021, 22(6), 1408. [Google Scholar] [CrossRef]
- Angom, R. S.; Nakka, N. M.; Bhattacharya, S. Advances in Glioblastoma Therapy: An Update on Current Approaches. In Brain Sciences, 2023; Vol. 13.
- Yang, K.; Wu, Z.; Zhang, H.; Zhang, N.; Wu, W.; Wang, Z.; Dai, Z.; Zhang, X.; Zhang, L.; Peng, Y.; et al. Glioma targeted therapy: insight into future of molecular approaches. Mol Cancer 2022, 21(1), 39. [Google Scholar] [CrossRef]
- Shikalov, A.; Koman, I.; Kogan, N. M. Targeted Glioma Therapy—Clinical Trials and Future Directions. In Pharmaceutics, 2024; Vol. 16.
- Carrera, D.; Hayes, J.; Mueller, S.; Shelton, S.; Weinschenk, T.; Song, C.; Fritsche, J.; Schoor, O.; Kuttruff-Coqui, S.; Hilf, N.; et al. IMMU-52. SELECTION OF GLIOMA T-CELL THERAPY TARGETS BASED ON THE ANALYSIS OF TUMOR IMMUNOPEPTIDOME AND EXPRESSION PROFILES. Neuro-Oncology 2017, 19, vi124–vi124. [Google Scholar] [CrossRef]
- Weller, M.; van den Bent, M.; Preusser, M.; Le Rhun, E.; Tonn, J. C.; Minniti, G.; Bendszus, M.; Balana, C.; Chinot, O.; Dirven, L.; et al. EANO guidelines on the diagnosis and treatment of diffuse gliomas of adulthood. Nature Reviews Clinical Oncology 2021, 18(3), 170–186. [Google Scholar] [CrossRef] [PubMed]
- Zeng, Z.; Chen, Y.; Geng, X.; Zhang, Y.; Wen, X.; Yan, Q.; Wang, T.; Ling, C.; Xu, Y.; Duan, J.; et al. NcRNAs: Multi-angle participation in the regulation of glioma chemotherapy resistance (Review). Int J Oncol. [CrossRef]
- Lawrie, T. A.; Gillespie, D.; Dowswell, T.; Evans, J.; Erridge, S.; Vale, L.; Kernohan, A.; Grant, R. Long-term neurocognitive and other side effects of radiotherapy, with or without chemotherapy, for glioma. Cochrane Database Syst Rev 2019, 8(8), Cd013047. [Google Scholar] [CrossRef] [PubMed]
- Leary, J. B.; Anderson-Mellies, A.; Green, A. L. Population-based analysis of radiation-induced gliomas after cranial radiotherapy for childhood cancers. Neurooncol Adv 2022, 4(1), vdac159. [Google Scholar] [CrossRef] [PubMed]
- Liu, J.; Cao, S.; Imbach, K. J.; Gritsenko, M. A.; Lih, T.-S. M.; Kyle, J. E.; Yaron-Barir, T. M.; Binder, Z. A.; Li, Y.; Strunilin, I.; et al. Multi-scale signaling and tumor evolution in high-grade gliomas. Cancer Cell, 1217. [Google Scholar] [CrossRef]
- Pineda, E.; Domenech, M.; Hernández, A.; Comas, S.; Balaña, C. Recurrent Glioblastoma: Ongoing Clinical Challenges and Future Prospects. Onco Targets Ther 2023, 16, 71–86. [Google Scholar] [CrossRef]
- Alvi, M. A.; Ida, C. M.; Paolini, M. A.; Kerezoudis, P.; Meyer, J.; Barr Fritcher, E. G.; Goncalves, S.; Meyer, F. B.; Bydon, M.; Raghunathan, A. Spinal cord high-grade infiltrating gliomas in adults: clinico-pathological and molecular evaluation. Modern Pathology 2019, 32(9), 1236–1243. [Google Scholar] [CrossRef]
- Krishna, S.; Choudhury, A.; Keough, M. B.; Seo, K.; Ni, L.; Kakaizada, S.; Lee, A.; Aabedi, A.; Popova, G.; Lipkin, B.; et al. Glioblastoma remodelling of human neural circuits decreases survival. Nature 2023, 617(7961), 599–607. [Google Scholar] [CrossRef]
- Sharma, P.; Aaroe, A.; Liang, J.; Puduvalli, V. K. Tumor microenvironment in glioblastoma: Current and emerging concepts. Neurooncol Adv 2023, 5(1), vdad009. [Google Scholar] [CrossRef] [PubMed]
- Venkatesh, H. S.; Johung, T. B.; Caretti, V.; Noll, A.; Tang, Y.; Nagaraja, S.; Gibson, E. M.; Mount, C. W.; Polepalli, J.; Mitra, S. S.; et al. Neuronal Activity Promotes Glioma Growth through Neuroligin-3 Secretion. Cell 2015, 161(4), 803–816. [Google Scholar] [CrossRef]
- Vidyadharan, S.; Prabhakar Rao, B. V.; Perumal, Y.; Chandrasekharan, K.; Rajagopalan, V. Deep Learning Classifies Low- and High-Grade Glioma Patients with High Accuracy, Sensitivity, and Specificity Based on Their Brain White Matter Networks Derived from Diffusion Tensor Imaging. In Diagnostics, 2022; Vol. 12.
- Park, Y. W.; Vollmuth, P.; Foltyn-Dumitru, M.; Sahm, F.; Ahn, S. S.; Chang, J. H.; Kim, S. H. The 2021 WHO Classification for Gliomas and Implications on Imaging Diagnosis: Part 2—Summary of Imaging Findings on Pediatric-Type Diffuse High-Grade Gliomas, Pediatric-Type Diffuse Low-Grade Gliomas, and Circumscribed Astrocytic Gliomas. Journal of Magnetic Resonance Imaging 2023, 58(3), 690–708. [Google Scholar] [CrossRef]
- Teng, G.; Wang, Q.; Zhang, H.; Xiangli, W.; Yang, H.; Qi, X.; Cui, X.; Idrees, B. S.; Wei, K.; Khan, M. N. Discrimination of infiltrative glioma boundary based on laser-induced breakdown spectroscopy. Spectrochimica Acta Part B: Atomic Spectroscopy 2020, 165, 105787. [Google Scholar] [CrossRef]
- Liu, D.; Liu, Y.; Hu, X.; Hu, G.; Yang, K.; Xiao, C.; Hu, J.; Li, Z.; Zou, Y.; Chen, J.; et al. Alterations of white matter integrity associated with cognitive deficits in patients with glioma. Brain Behav 2020, 10(7), e01639. [Google Scholar] [CrossRef] [PubMed]
- Rehman, P.; Wali, R. 10-Year-Old Pakistani Boy With Multiple Malignancies: Loss Of Pms2-Constitutional Mismatch Repair Deficiency. Journal of Ayub Medical College Abbottabad 2022, 34. [Google Scholar] [CrossRef] [PubMed]
- Rallis, K. S.; George, A. M.; Wozniak, A. M.; Bigogno, C. M.; Chow, B.; Hanrahan, J. G.; Sideris, M. Molecular Genetics and Targeted Therapies for Paediatric High-grade Glioma. Cancer Genomics Proteomics 2022, 19(4), 390–414. [Google Scholar] [CrossRef] [PubMed]
- Kollis, P. M.; Ebert, L. M.; Toubia, J.; Bastow, C. R.; Ormsby, R. J.; Poonnoose, S. I.; Lenin, S.; Tea, M. N.; Pitson, S. M.; Gomez, G. A.; et al. Characterising Distinct Migratory Profiles of Infiltrating T-Cell Subsets in Human Glioblastoma. Front Immunol 2022, 13, 850226. [Google Scholar] [CrossRef] [PubMed]
- Toader, C.; Eva, L.; Costea, D.; Corlatescu, A. D.; Covache-Busuioc, R. A.; Bratu, B. G.; Glavan, L. A.; Costin, H. P.; Popa, A. A.; Ciurea, A. V. Low-Grade Gliomas: Histological Subtypes, Molecular Mechanisms, and Treatment Strategies. Brain Sci. [CrossRef]
- Toader, C.; Eva, L.; Costea, D.; Corlatescu, A. D.; Covache-Busuioc, R.-A.; Bratu, B.-G.; Glavan, L. A.; Costin, H. P.; Popa, A. A.; Ciurea, A. V. Low-Grade Gliomas: Histological Subtypes, Molecular Mechanisms, and Treatment Strategies. In Brain Sciences, 2023; Vol. 13.
- Gilard, V.; Tebani, A.; Dabaj, I.; Laquerrière, A.; Fontanilles, M.; Derrey, S.; Marret, S.; Bekri, S. Diagnosis and Management of Glioblastoma: A Comprehensive Perspective. J Pers Med. [CrossRef]
- Greuter, L.; Guzman, R.; Soleman, J. Pediatric and Adult Low-Grade Gliomas: Where Do the Differences Lie? Children (Basel). [CrossRef]
- Li, X.; Li, R.; Ren, H.; Liu, H.; Liu, H. Predicting factors of tumor progression in adult patients with low-grade glioma within five years after surgery. Translational Cancer Research 2021, 10(4), 1907–1915. [Google Scholar] [CrossRef]
- Louis, D. N.; Perry, A.; Reifenberger, G.; von Deimling, A.; Figarella-Branger, D.; Cavenee, W. K.; Ohgaki, H.; Wiestler, O. D.; Kleihues, P.; Ellison, D. W. The 2016 World Health Organization Classification of Tumors of the Central Nervous System: a summary. Acta Neuropathol 2016, 131(6), 803–820. [Google Scholar] [CrossRef]
- Fathallah-Shaykh, H. M.; DeAtkine, A.; Coffee, E.; Khayat, E.; Bag, A. K.; Han, X.; Warren, P. P.; Bredel, M.; Fiveash, J.; Markert, J.; et al. Diagnosing growth in low-grade gliomas with and without longitudinal volume measurements: A retrospective observational study. PLoS Med 2019, 16(5), e1002810. [Google Scholar] [CrossRef]
- Jooma, R.; Waqas, M.; Khan, I. Diffuse Low-Grade Glioma - Changing Concepts in Diagnosis and Management: A Review. Asian J Neurosurg 2019, 14(2), 356–363. [Google Scholar] [CrossRef]
- Cao, J.; Yan, W.; Zhan, Z.; Hong, X.; Yan, H. Epidemiology and risk stratification of low-grade gliomas in the United States, 2004-2019: A competing-risk regression model for survival analysis. Front Oncol 2023, 13, 1079597. [Google Scholar] [CrossRef]
- Whitfield, B. T.; Huse, J. T. Classification of adult-type diffuse gliomas: Impact of the World Health Organization 2021 update. Brain Pathology 2022, 32(4), e13062. [Google Scholar] [CrossRef] [PubMed]
- Al Sharie, S.; Abu Laban, D.; Al-Hussaini, M. Decoding Diffuse Midline Gliomas: A Comprehensive Review of Pathogenesis, Diagnosis and Treatment. Cancers (Basel). [CrossRef]
- Yan, Z.; Wang, J.; Dong, Q.; Zhu, L.; Lin, W.; Jiang, X. Predictors of tumor progression of low-grade glioma in adult patients within 5 years follow-up after surgery. Front Surg 2022, 9, 937556. [Google Scholar] [CrossRef] [PubMed]
- Choi, B. M.; Cheong, J. H.; Ryu, J. I.; Won, Y. D.; Min, K.-W.; Han, M.-H. Significant Genes Associated with Mortality and Disease Progression in Grade II and III Glioma. In Biomedicines, 2024; Vol. 12.
- Tesileanu, C. M. S.; Vallentgoed, W. R.; Sanson, M.; Taal, W.; Clement, P. M.; Wick, W.; Brandes, A. A.; Baurain, J. F.; Chinot, O. L.; Wheeler, H.; et al. Non-IDH1-R132H IDH1/2 mutations are associated with increased DNA methylation and improved survival in astrocytomas, compared to IDH1-R132H mutations. Acta Neuropathol 2021, 141(6), 945–957. [Google Scholar] [CrossRef]
- Yan, H.; Parsons, D. W.; Jin, G.; McLendon, R.; Rasheed, B. A.; Yuan, W.; Kos, I.; Batinic-Haberle, I.; Jones, S.; Riggins, G. J.; et al. IDH1 and IDH2 mutations in gliomas. N Engl J Med 2009, 360(8), 765–773. [Google Scholar] [CrossRef] [PubMed]
- Rosén, E.; Mangukiya, H. B.; Elfineh, L.; Stockgard, R.; Krona, C.; Gerlee, P.; Nelander, S. Inference of glioblastoma migration and proliferation rates using single time-point images. Communications Biology 2023, 6(1), 402. [Google Scholar] [CrossRef] [PubMed]
- Sun, L.; Zhang, H.; Gao, P. Metabolic reprogramming and epigenetic modifications on the path to cancer. Protein Cell 2022, 13(12), 877–919. [Google Scholar] [CrossRef] [PubMed]
- Thakur, C.; Chen, F. Connections between metabolism and epigenetics in cancers. Semin Cancer Biol 2019, 57, 52–58. [Google Scholar] [CrossRef]
- Poljsak, B.; Kovac, V.; Dahmane, R.; Levec, T.; Starc, A. Cancer Etiology: A Metabolic Disease Originating from Life’s Major Evolutionary Transition? Oxid Med Cell Longev 2019, 2019, 7831952. [Google Scholar] [CrossRef]
- Kaelin, W. G., Jr.; McKnight, S. L. Influence of metabolism on epigenetics and disease. Cell 2013, 153(1), 56–69. [Google Scholar] [CrossRef]
- Nencioni, A.; Caffa, I.; Cortellino, S.; Longo, V. D. Fasting and cancer: molecular mechanisms and clinical application. Nat Rev Cancer 2018, 18(11), 707–719. [Google Scholar] [CrossRef]
- Dong, W.; Wang, L.; Pan, Y.; Tu, Q.; He, T.; Zhou, T.; Yuan, J.; Tong, M. PLU1 Promotes the Proliferation and Migration of Glioma Cells and Regulates Metabolism. Technol Cancer Res Treat 2023, 22, 15330338231175768. [Google Scholar] [CrossRef]
- Jakola, A. S.; Myrmel, K. S.; Kloster, R.; Torp, S. H.; Lindal, S.; Unsgård, G.; Solheim, O. Comparison of a strategy favoring early surgical resection vs a strategy favoring watchful waiting in low-grade gliomas. Jama 2012, 308(18), 1881–1888. [Google Scholar] [CrossRef] [PubMed]
- Smith, J. S.; Chang, E. F.; Lamborn, K. R.; Chang, S. M.; Prados, M. D.; Cha, S.; Tihan, T.; Vandenberg, S.; McDermott, M. W.; Berger, M. S. Role of extent of resection in the long-term outcome of low-grade hemispheric gliomas. J Clin Oncol 2008, 26(8), 1338–1345. [Google Scholar] [CrossRef] [PubMed]
- Bogdańska, M. U.; Bodnar, M.; Piotrowska, M. J.; Murek, M.; Schucht, P.; Beck, J.; Martínez-González, A.; Pérez-García, V. M. A mathematical model describes the malignant transformation of low grade gliomas: Prognostic implications. PLoS One 2017, 12(8), e0179999. [Google Scholar] [CrossRef]
- Ward, R.; Jones, H. M.; Witt, D.; Boop, F.; Bouffet, E.; Rodriguez-Galindo, C.; Qaddoumi, I.; Moreira, D. C. Outcomes of Children With Low-Grade Gliomas in Low- and Middle-Income Countries: A Systematic Review. JCO Glob Oncol 2022, 8, e2200199. [Google Scholar] [CrossRef]
- Mangiola, A.; Anile, C.; Pompucci, A.; Capone, G.; Rigante, L.; De Bonis, P. Glioblastoma therapy: going beyond Hercules Columns. Expert Rev Neurother 2010, 10(4), 507–514. [Google Scholar] [CrossRef]
- Chaichana, K. L.; McGirt, M. J.; Laterra, J.; Olivi, A.; Quiñones-Hinojosa, A. Recurrence and malignant degeneration after resection of adult hemispheric low-grade gliomas. J Neurosurg 2010, 112(1), 10–17. [Google Scholar] [CrossRef]
- Sakarunchai, I.; Sangthong, R.; Phuenpathom, N.; Phukaoloun, M. Free survival time of recurrence and malignant transformation and associated factors in patients with supratentorial low-grade gliomas. J Med Assoc Thai, 1542. [Google Scholar]
- Romanowski, C. A. J.; Hoggard, N.; Jellinek, D. A.; Levy, D.; Wharton, S. B.; Kotsarini, C.; Batty, R.; Wilkinson, I. D. Low Grade Gliomas. Can We Predict Tumour Behaviour from Imaging Features? The Neuroradiology Journal. [CrossRef]
- Griesinger, A. M.; Birks, D. K.; Donson, A. M.; Amani, V.; Hoffman, L. M.; Waziri, A.; Wang, M.; Handler, M. H.; Foreman, N. K. Characterization of distinct immunophenotypes across pediatric brain tumor types. J Immunol 2013, 191(9), 4880–4888. [Google Scholar] [CrossRef] [PubMed]
- Gao, Y.; Weenink, B.; van den Bent, M. J.; Erdem-Eraslan, L.; Kros, J. M.; Sillevis Smitt, P.; Hoang-Xuan, K.; Brandes, A. A.; Vos, M.; Dhermain, F.; et al. Expression-based intrinsic glioma subtypes are prognostic in low-grade gliomas of the EORTC22033-26033 clinical trial. Eur J Cancer 2018, 94, 168–178. [Google Scholar] [CrossRef]
- Tandon, G.; Yadav, S.; Kaur, S. Chapter 24 - Pathway modeling and simulation analysis. In Bioinformatics, Singh, D. B., Pathak, R. K. Eds.; Academic Press, 2022; pp 409-423.
- Bordini, M.; Zappaterra, M.; Soglia, F.; Petracci, M.; Davoli, R. Weighted gene co-expression network analysis identifies molecular pathways and hub genes involved in broiler White Striping and Wooden Breast myopathies. Scientific Reports 2021, 11. [Google Scholar] [CrossRef]
- Franz, M.; Lopes, C.; Huck, G.; Dong, Y.; Sumer, S.; Bader, G. Cytoscape.js: A graph theory library for visualisation and analysis. Bioinformatics (Oxford, England). [CrossRef]
- Page, M.; McKenzie, J.; Bossuyt, P.; Boutron, I.; Hoffmann, T.; Mulrow, C.; Shamseer, L.; Tetzlaff, J.; Akl, E.; Brennan, S.; et al. The PRISMA 2020 statement: An updated guideline for reporting systematic reviews. BMJ 2021, 372, n71. [Google Scholar] [CrossRef]
- Xiang, B.; Chen, M.-L.; Gao, Z.-Q.; Mi, T.; Shi, Q.-L.; Dong, J.-J.; Tian, X.-M.; Liu, F.; Wei, G.-H. CCNB1 is a novel prognostic biomarker and promotes proliferation, migration and invasion in Wilms tumor. BMC Medical Genomics 2023, 16(1), 189. [Google Scholar] [CrossRef] [PubMed]
- Li, B.; Zhu, H. B.; Song, G. D.; Cheng, J. H.; Li, C. Z.; Zhang, Y. Z.; Zhao, P. Regulating the CCNB1 gene can affect cell proliferation and apoptosis in pituitary adenomas and activate epithelial-to-mesenchymal transition. Oncol Lett 2019, 18(5), 4651–4658. [Google Scholar] [CrossRef]
- Shi, Y.; Guo, S.; Wang, Y.; Liu, X.; Li, Q.; Li, T. Lamprey Prohibitin2 Arrest G2/M Phase Transition of HeLa Cells through Down-regulating Expression and Phosphorylation Level of Cell Cycle Proteins. Sci Rep 2018, 8(1), 3932. [Google Scholar] [CrossRef]
- Schnittger, A.; De Veylder, L. The Dual Face of Cyclin B1. Trends Plant Sci 2018, 23(6), 475–478. [Google Scholar] [CrossRef] [PubMed]
- Cui, K.; Chen, J. H.; Zou, Y. F.; Zhang, S. Y.; Wu, B.; Jing, K.; Li, L. W.; Xia, L.; Sun, C.; Dong, Y. L. Hub biomarkers for the diagnosis and treatment of glioblastoma based on microarray technology. Technol Cancer Res Treat 2021, 20, 1533033821990368. [Google Scholar] [CrossRef] [PubMed]
- Ducray, F.; Idbaih, A.; de Reyniès, A.; Bièche, I.; Thillet, J.; Mokhtari, K.; Lair, S.; Marie, Y.; Paris, S.; Vidaud, M.; et al. Anaplastic oligodendrogliomas with 1p19q codeletion have a proneural gene expression profile. Mol Cancer 2008, 7, 41. [Google Scholar] [CrossRef]
- Xiao, Y.; Chen, X.; Hu, W.; Ma, W.; Di, Q.; Tang, H.; Zhao, X.; Huang, G.; Chen, W. USP39-mediated deubiquitination of Cyclin B1 promotes tumor cell proliferation and glioma progression. Transl Oncol 2023, 34, 101713. [Google Scholar] [CrossRef]
- Deweese, J. E.; Osheroff, N. The DNA cleavage reaction of topoisomerase II: wolf in sheep’s clothing. Nucleic Acids Res 2009, 37(3), 738–748. [Google Scholar] [CrossRef] [PubMed]
- Zhou, T.; Wang, Y.; Qian, D.; Liang, Q.; Wang, B. Over-expression of TOP2A as a prognostic biomarker in patients with glioma. Int J Clin Exp Pathol, 1228. [Google Scholar]
- Liu, Y.; Ma, J.; Song, J. S.; Zhou, H. Y.; Li, J. H.; Luo, C.; Geng, X.; Zhao, H. X. DNA topoisomerase II alpha promotes the metastatic characteristics of glioma cells by transcriptionally activating β-catenin. Bioengineered 2022, 13(2), 2207–2216. [Google Scholar] [CrossRef]
- Gielniewski, B.; Poleszak, K.; Roura, A.-J.; Szadkowska, P.; Jacek, K.; Krol, S. K.; Guzik, R.; Wiechecka, P.; Maleszewska, M.; Kaza, B.; et al. Targeted sequencing of cancer-related genes reveals a recurrent TOP2A variant which affects DNA binding and coincides with global transcriptional changes in glioblastoma. International Journal of Cancer 2023, 153(5), 1003–1015. [Google Scholar] [CrossRef]
- Waters, A. M.; Asfahani, R.; Carroll, P.; Bicknell, L.; Lescai, F.; Bright, A.; Chanudet, E.; Brooks, A.; Christou-Savina, S.; Osman, G.; et al. The kinetochore protein, CENPF, is mutated in human ciliopathy and microcephaly phenotypes. J Med Genet 2015, 52(3), 147–156. [Google Scholar] [CrossRef] [PubMed]
- Filges, I.; Bruder, E.; Brandal, K.; Meier, S.; Undlien, D. E.; Waage, T. R.; Hoesli, I.; Schubach, M.; de Beer, T.; Sheng, Y.; et al. Strømme Syndrome Is a Ciliary Disorder Caused by Mutations in CENPF. Hum Mutat 2016, 37(4), 359–363. [Google Scholar] [CrossRef] [PubMed]
- Balamuth, N. J.; Wood, A.; Wang, Q.; Jagannathan, J.; Mayes, P.; Zhang, Z.; Chen, Z.; Rappaport, E.; Courtright, J.; Pawel, B.; et al. Serial transcriptome analysis and cross-species integration identifies centromere-associated protein E as a novel neuroblastoma target. Cancer Res 2010, 70(7), 2749–2758. [Google Scholar] [CrossRef]
- Zhang, M.; Zhang, Q.; Bai, J.; Zhao, Z.; Zhang, J. Transcriptome analysis revealed CENPF associated with glioma prognosis. Math Biosci Eng 2021, 18(3), 2077–2096. [Google Scholar] [CrossRef] [PubMed]
- Ma, C.; Wang, J.; Zhou, J.; Liao, K.; Yang, M.; Li, F.; Zhang, M. CENPE promotes glioblastomas proliferation by directly binding to WEE1. Transl Cancer Res 2020, 9(2), 717–725. [Google Scholar] [CrossRef]
- Westwood, I.; Cheary, D. M.; Baxter, J. E.; Richards, M. W.; van Montfort, R. L.; Fry, A. M.; Bayliss, R. Insights into the conformational variability and regulation of human Nek2 kinase. J Mol Biol 2009, 386(2), 476–485. [Google Scholar] [CrossRef]
- Bahmanyar, S.; Kaplan, D. D.; Deluca, J. G.; Giddings, T. H., Jr.; O’Toole, E. T.; Winey, M.; Salmon, E. D.; Casey, P. J.; Nelson, W. J.; Barth, A. I. beta-Catenin is a Nek2 substrate involved in centrosome separation. Genes Dev 2008, 22(1), 91–105. [Google Scholar] [CrossRef]
- Kalkan, B. M.; Ozcan, S. C.; Cicek, E.; Gonen, M.; Acilan, C. Nek2A prevents centrosome clustering and induces cell death in cancer cells via KIF2C interaction. Cell Death & Disease. [CrossRef]
- Xiang, J.; Alafate, W.; Wu, W.; Wang, Y.; Li, X.; Xie, W.; Bai, X.; Li, R.; Wang, M.; Wang, J. NEK2 enhances malignancies of glioblastoma via NIK/NF-κB pathway. Cell Death & Disease. [CrossRef]
- Zhou, H. Y.; Wang, Y. C.; Wang, T.; Wu, W.; Cao, Y. Y.; Zhang, B. C.; Wang, M. D.; Mao, P. CCNA2 and NEK2 regulate glioblastoma progression by targeting the cell cycle. Oncol Lett 2024, 27(5), 206. [Google Scholar] [CrossRef]
- Wang, J.; Cheng, P.; Pavlyukov, M.; Yu, H.; Zhang, Z.; Kim, S.; Minata, M.; Mohyeldin, A.; Xie, W.; Chen, D.; et al. Targeting NEK2 attenuates glioblastoma growth and radioresistance by destabilizing histone methyltransferase EZH2. The Journal of clinical investigation 2017, 127. [Google Scholar] [CrossRef]
- Naseer, M. I.; Abdulkareem, A. A.; Muthaffar, O. Y.; Sogaty, S.; Alkhatabi, H.; Almaghrabi, S.; Chaudhary, A. G. Whole Exome Sequencing Identifies Three Novel Mutations in the ASPM Gene From Saudi Families Leading to Primary Microcephaly. Front Pediatr 2020, 8, 627122. [Google Scholar] [CrossRef]
- Kaindl, A. M.; Passemard, S.; Kumar, P.; Kraemer, N.; Issa, L.; Zwirner, A.; Gerard, B.; Verloes, A.; Mani, S.; Gressens, P. Many roads lead to primary autosomal recessive microcephaly. Prog Neurobiol 2010, 90(3), 363–383. [Google Scholar] [CrossRef] [PubMed]
- Kim, H.-T.; Lee, M.-S.; Choi, J.-H.; Jung, J.-Y.; Ahn, D.-G.; Yeo, S.-Y.; Choi, D.-K.; Kim, C.-H. The microcephaly gene aspm is involved in brain development in zebrafish. Biochemical and Biophysical Research Communications 2011, 409(4), 640–644. [Google Scholar] [CrossRef] [PubMed]
- Ali, F. Cerebral Cortex Evolution and the Gene. In eLS, 2009.
- Hornick, J. E.; Karanjeet, K.; Collins, E. S.; Hinchcliffe, E. H. Kinesins to the core: The role of microtubule-based motor proteins in building the mitotic spindle midzone. Semin Cell Dev Biol 2010, 21(3), 290–299. [Google Scholar] [CrossRef]
- Zeng, W. J.; Cheng, Q.; Wen, Z. P.; Wang, J. Y.; Chen, Y. H.; Zhao, J.; Gong, Z. C.; Chen, X. P. Aberrant ASPM expression mediated by transcriptional regulation of FoxM1 promotes the progression of gliomas. J Cell Mol Med 2020, 24(17), 9613–9626. [Google Scholar] [CrossRef]
- Vulcani-Freitas, T. M.; Saba-Silva, N.; Cappellano, A.; Cavalheiro, S.; Marie, S. K.; Oba-Shinjo, S. M.; Malheiros, S. M.; de Toledo, S. R. ASPM gene expression in medulloblastoma. Childs Nerv Syst 2011, 27(1), 71–74. [Google Scholar] [CrossRef]
- Wierstra, I. The transcription factor FOXM1 (Forkhead box M1): proliferation-specific expression, transcription factor function, target genes, mouse models, and normal biological roles. Adv Cancer Res 2013, 118, 97–398. [Google Scholar] [CrossRef]
- Dai, B.; Kang, S. H.; Gong, W.; Liu, M.; Aldape, K. D.; Sawaya, R.; Huang, S. Aberrant FoxM1B expression increases matrix metalloproteinase-2 transcription and enhances the invasion of glioma cells. Oncogene 2007, 26(42), 6212–6219. [Google Scholar] [CrossRef] [PubMed]
- Deng, T.; Liu, Y.; Zhuang, J.; Tang, Y.; Huo, Q. ASPM Is a Prognostic Biomarker and Correlates With Immune Infiltration in Kidney Renal Clear Cell Carcinoma and Liver Hepatocellular Carcinoma. Front Oncol 2022, 12, 632042. [Google Scholar] [CrossRef]
- Bikeye, S.-N. N.; Colin, C.; Marie, Y.; Vampouille, R.; Ravassard, P.; Rousseau, A.; Boisselier, B.; Idbaih, A.; Calvo, C. F.; Leuraud, P.; et al. ASPM-associated stem cell proliferation is involved in malignant progression of gliomas and constitutes an attractive therapeutic target. Cancer Cell International 2010, 10(1), 1. [Google Scholar] [CrossRef]
- Zhou, J. W.; Wang, H.; Sun, W.; Han, N. N.; Chen, L. ASPM is a predictor of overall survival and has therapeutic potential in endometrial cancer. Am J Transl Res, 1942. [Google Scholar]
- Shao, T.; Jiang, X.; Bao, G.; Li, C.; Guo, C. Comprehensive Analysis of the Oncogenic Role of Targeting Protein for Xklp2 (TPX2) in Human Malignancies. Dis Markers 2022, 2022, 7571066. [Google Scholar] [CrossRef]
- Alfaro-Aco, R.; Thawani, A.; Petry, S. Structural analysis of the role of TPX2 in branching microtubule nucleation. J Cell Biol 2017, 216(4), 983–997. [Google Scholar] [CrossRef] [PubMed]
- Smertenko, A.; Clare, S. J.; Effertz, K.; Parish, A.; Ross, A.; Schmidt, S. A guide to plant TPX2-like and WAVE-DAMPENED2-like proteins. Journal of Experimental Botany 2021, 72(4), 1034–1045. [Google Scholar] [CrossRef] [PubMed]
- Ma, N.; Tulu, U. S.; Ferenz, N. P.; Fagerstrom, C.; Wilde, A.; Wadsworth, P. Poleward transport of TPX2 in the mammalian mitotic spindle requires dynein, Eg5, and microtubule flux. Mol Biol Cell 2010, 21(6), 979–988. [Google Scholar] [CrossRef]
- Yang, M.; Mao, X.; Li, L.; Yang, J.; Xing, H.; Jiang, C. High TPX2 expression results in poor prognosis, and Sp1 mediates the coupling of the CX3CR1/CXCL10 chemokine pathway to the PI3K/Akt pathway through targeted inhibition of TPX2 in endometrial cancer. Cancer Medicine 2024, 13(5), e6958. [Google Scholar] [CrossRef]
- Gu, J. J.; Zhang, J. H.; Chen, H. J.; Wang, S. S. TPX2 promotes glioma cell proliferation and invasion via activation of the AKT signaling pathway. Oncol Lett 2016, 12(6), 5015–5022. [Google Scholar] [CrossRef] [PubMed]
- Li, B.; Qi, X. Q.; Chen, X.; Huang, X.; Liu, G. Y.; Chen, H. R.; Huang, C. G.; Luo, C.; Lu, Y. C. Expression of targeting protein for Xenopus kinesin-like protein 2 is associated with progression of human malignant astrocytoma. Brain Res 2010, 1352, 200–207. [Google Scholar] [CrossRef]
- Long, N.; Chu, L.; Jia, J.; Peng, S.; Gao, Y.; Yang, H.; Yang, Y.; Zhao, Y.; Liu, J. CircPOSTN/miR-361-5p/TPX2 axis regulates cell growth, apoptosis and aerobic glycolysis in glioma cells. Cancer Cell International 2020, 20(1), 374. [Google Scholar] [CrossRef]
- Ayllón, V.; O’Connor, R. PBK/TOPK promotes tumour cell proliferation through p38 MAPK activity and regulation of the DNA damage response. Oncogene 2007, 26(24), 3451–3461. [Google Scholar] [CrossRef]
- Ma, H.; Zhang, J.; Shi, Y.; Wang, Z.; Nie, W.; Cai, J.; Huang, Y.; Liu, B.; Wang, X.; Lian, C. PBK correlates with prognosis, immune escape and drug response in LUAD. Scientific Reports 2023, 13(1), 20452. [Google Scholar] [CrossRef]
- Joel, M.; Mughal, A. A.; Grieg, Z.; Murrell, W.; Palmero, S.; Mikkelsen, B.; Fjerdingstad, H. B.; Sandberg, C. J.; Behnan, J.; Glover, J. C.; et al. Targeting PBK/TOPK decreases growth and survival of glioma initiating cells in vitro and attenuates tumor growth in vivo. Mol Cancer 2015, 14, 121. [Google Scholar] [CrossRef]
- Dong, C.; Fan, W.; Fang, S. PBK as a Potential Biomarker Associated with Prognosis of Glioblastoma. J Mol Neurosci 2020, 70(1), 56–64. [Google Scholar] [CrossRef] [PubMed]
- Chinyama, H. A.; Wei, L.; Mokgautsi, N.; Lawal, B.; Wu, A. T. H.; Huang, H.-S. Identification of CDK1, PBK, and CHEK1 as an Oncogenic Signature in Glioblastoma: A Bioinformatics Approach to Repurpose Dapagliflozin as a Therapeutic Agent. In International Journal of Molecular Sciences, 2023; Vol. 24.
- Deng, Y.; Wen, H.; Yang, H.; Zhu, Z.; Huang, Q.; Bi, Y.; Wang, P.; Zhou, M.; Guan, J.; Zhang, W.; et al. Identification of PBK as a hub gene and potential therapeutic target for medulloblastoma. Oncol Rep 2022, 48(1), 125. [Google Scholar] [CrossRef]
- Wu, L.; Yin, L.; Ma, L.; Yang, J.; Yang, F.; Sun, B.; Nianzeng, X. Comprehensive bioinformatics analysis of ribonucleoside diphosphate reductase subunit M2(RRM2) gene correlates with prognosis and tumor immunotherapy in pan-cancer. Aging (Albany NY), 7890. [Google Scholar] [CrossRef]
- Grolmusz, V. K.; Karászi, K.; Micsik, T.; Tóth, E. A.; Mészáros, K.; Karvaly, G.; Barna, G.; Szabó, P. M.; Baghy, K.; Matkó, J.; et al. Cell cycle dependent RRM2 may serve as proliferation marker and pharmaceutical target in adrenocortical cancer. Am J Cancer Res, 2041. [Google Scholar]
- Zuo, Z.; Zhou, Z.; Chang, Y.; Liu, Y.; Shen, Y.; Li, Q.; Zhang, L. Ribonucleotide reductase M2 (RRM2): Regulation, function and targeting strategy in human cancer. Genes Dis 2024, 11(1), 218–233. [Google Scholar] [CrossRef]
- Lopez-Contreras, A. J.; Specks, J.; Barlow, J. H.; Ambrogio, C.; Desler, C.; Vikingsson, S.; Rodrigo-Perez, S.; Green, H.; Rasmussen, L. J.; Murga, M.; et al. Increased Rrm2 gene dosage reduces fragile site breakage and prolongs survival of ATR mutant mice. Genes Dev 2015, 29(7), 690–695. [Google Scholar] [CrossRef]
- Morikawa, T.; Maeda, D.; Kume, H.; Homma, Y.; Fukayama, M. Ribonucleotide reductase M2 subunit is a novel diagnostic marker and a potential therapeutic target in bladder cancer. Histopathology 2010, 57(6), 885–892. [Google Scholar] [CrossRef]
- Liu, X.; Zhou, B.; Xue, L.; Yen, F.; Chu, P.; Un, F.; Yen, Y. Ribonucleotide reductase subunits M2 and p53R2 are potential biomarkers for metastasis of colon cancer. Clin Colorectal Cancer 2007, 6(5), 374–381. [Google Scholar] [CrossRef]
- Rahman, M. A.; Amin, A. R.; Wang, D.; Koenig, L.; Nannapaneni, S.; Chen, Z.; Wang, Z.; Sica, G.; Deng, X.; Chen, Z. G.; et al. RRM2 regulates Bcl-2 in head and neck and lung cancers: a potential target for cancer therapy. Clin Cancer Res 2013, 19(13), 3416–3428. [Google Scholar] [CrossRef] [PubMed]
- Sun, H.; Yang, B.; Zhang, H.; Song, J.; Zhang, Y.; Xing, J.; Yang, Z.; Wei, C.; Xu, T.; Yu, Z.; et al. RRM2 is a potential prognostic biomarker with functional significance in glioma. Int J Biol Sci 2019, 15(3), 533–543. [Google Scholar] [CrossRef] [PubMed]
- Wu, P.; Dugoua, J. J.; Eyawo, O.; Mills, E. J. Traditional Chinese Medicines in the treatment of hepatocellular cancers: a systematic review and meta-analysis. J Exp Clin Cancer Res 2009, 28(1), 112. [Google Scholar] [CrossRef]
- Corrales-Guerrero, S.; Cui, T.; Castro-Aceituno, V.; Yang, L.; Nair, S.; Feng, H.; Venere, M.; Yoon, S.; DeWees, T.; Shen, C.; et al. Inhibition of RRM2 radiosensitizes glioblastoma and uncovers synthetic lethality in combination with targeting CHK1. Cancer Letters 2023, 570, 216308. [Google Scholar] [CrossRef]
- Li, C.; Zheng, J.; Chen, S.; Huang, B.; Li, G.; Feng, Z.; Wang, J.; Xu, S. RRM2 promotes the progression of human glioblastoma. Journal of Cellular Physiology 2018, 233(10), 6759–6767. [Google Scholar] [CrossRef] [PubMed]
- Hirokawa, N.; Tanaka, Y. Kinesin superfamily proteins (KIFs): Various functions and their relevance for important phenomena in life and diseases. Exp Cell Res 2015, 334(1), 16–25. [Google Scholar] [CrossRef] [PubMed]
- Sebastian, J.; Rathinasamy, K. Benserazide Perturbs Kif15-kinesin Binding Protein Interaction with Prolonged Metaphase and Defects in Chromosomal Congression: A Study Based on in silico Modeling and Cell Culture. Mol Inform 2020, 39(3), e1900035. [Google Scholar] [CrossRef] [PubMed]
- Vanneste, D.; Takagi, M.; Imamoto, N.; Vernos, I. The role of Hklp2 in the stabilization and maintenance of spindle bipolarity. Curr Biol 2009, 19(20), 1712–1717. [Google Scholar] [CrossRef]
- Florian, S.; Mayer, T. U. Modulated microtubule dynamics enable Hklp2/Kif15 to assemble bipolar spindles. Cell Cycle 2011, 10(20), 3533–3544. [Google Scholar] [CrossRef]
- Wang, Q.; Han, B.; Huang, W.; Qi, C.; Liu, F. Identification of KIF15 as a potential therapeutic target and prognostic factor for glioma. Oncol Rep 2020, 43(4), 1035–1044. [Google Scholar] [CrossRef]
- Wang, L.; Zhang, X.; Liu, J.; Liu, Q. Kinesin family member 15 can promote the proliferation of glioblastoma. Math Biosci Eng 2022, 19(8), 8259–8272. [Google Scholar] [CrossRef]
- Jessop, M.; Felix, J.; Gutsche, I. AAA+ ATPases: structural insertions under the magnifying glass. Curr Opin Struct Biol 2021, 66, 119–128. [Google Scholar] [CrossRef]
- Clapier, C. R.; Iwasa, J.; Cairns, B. R.; Peterson, C. L. Mechanisms of action and regulation of ATP-dependent chromatin-remodelling complexes. Nat Rev Mol Cell Biol 2017, 18(7), 407–422. [Google Scholar] [CrossRef]
- Liu, Q.; Liu, H.; Li, L.; Dong, X.; Ru, X.; Fan, X.; Wen, T.; Liu, J. ATAD2 predicts poor outcomes in patients with ovarian cancer and is a marker of proliferation. Int J Oncol 2020, 56(1), 219–231. [Google Scholar] [CrossRef]
- Zhou, L.; Yang, C.; Zhang, N.; Zhang, X.; Zhao, T.; Yu, J. Silencing METTL3 inhibits the proliferation and invasion of osteosarcoma by regulating ATAD2. Biomed Pharmacother 2020, 125, 109964. [Google Scholar] [CrossRef] [PubMed]
- Fu, J.; Zhang, J.; Chen, X.; Liu, Z.; Yang, X.; He, Z.; Hao, Y.; Liu, B.; Yao, D. ATPase family AAA domain-containing protein 2 (ATAD2): From an epigenetic modulator to cancer therapeutic target. Theranostics 2023, 13(2), 787–809. [Google Scholar] [CrossRef] [PubMed]
- Wang, J.; Zuo, J.; Wang, M.; Ma, X.; Gao, K.; Bai, X.; Wang, N.; Xie, W.; Liu, H. Polo-like kinase�4 promotes tumorigenesis and induces resistance to radiotherapy in glioblastoma. Oncology Reports 2019, 41. [Google Scholar] [CrossRef]
- Liu, H.; Wen, Q.; Yan, S.; Zeng, W.; Zou, Y.; Liu, Q.; Zhang, G.; Zou, J.; Zou, X. Tumor-Promoting ATAD2 and Its Preclinical Challenges. Biomolecules. [CrossRef]
- Vidyadharan, S.; Prabhakar Rao, B.; Perumal, Y.; Chandrasekharan, K.; Rajagopalan, V. Deep Learning Classifies Low- and High-Grade Glioma Patients with High Accuracy, Sensitivity, and Specificity Based on Their Brain White Matter Networks Derived from Diffusion Tensor Imaging. Diagnostics (Basel). [CrossRef]
- Duffau, H. White Matter Tracts and Diffuse Lower-Grade Gliomas: The Pivotal Role of Myelin Plasticity in the Tumor Pathogenesis, Infiltration Patterns, Functional Consequences and Therapeutic Management. Front Oncol 2022, 12, 855587. [Google Scholar] [CrossRef]
- Piñeros, M.; Sierra, M. S.; Izarzugaza, M. I.; Forman, D. Descriptive epidemiology of brain and central nervous system cancers in Central and South America. Cancer Epidemiology 2016, 44, S141–S149. [Google Scholar] [CrossRef] [PubMed]
- Claus, E. B.; Walsh, K. M.; Wiencke, J. K.; Molinaro, A. M.; Wiemels, J. L.; Schildkraut, J. M.; Bondy, M. L.; Berger, M.; Jenkins, R.; Wrensch, M. Survival and low-grade glioma: the emergence of genetic information. Neurosurg Focus 2015, 38(1), E6. [Google Scholar] [CrossRef]
- Noiphithak, R.; Veerasarn, K. Clinical predictors for survival and treatment outcome of high-grade glioma in Prasat Neurological Institute. Asian J Neurosurg 2017, 12(1), 28–33. [Google Scholar] [CrossRef]
Disclaimer/Publisher’s Note: The statements, opinions and data contained in all publications are solely those of the individual author(s) and contributor(s) and not of MDPI and/or the editor(s). MDPI and/or the editor(s) disclaim responsibility for any injury to people or property resulting from any ideas, methods, instructions or products referred to in the content. |
© 2024 by the authors. Licensee MDPI, Basel, Switzerland. This article is an open access article distributed under the terms and conditions of the Creative Commons Attribution (CC BY) license (http://creativecommons.org/licenses/by/4.0/).
Copyright: This open access article is published under a Creative Commons CC BY 4.0 license, which permit the free download, distribution, and reuse, provided that the author and preprint are cited in any reuse.


