Submitted:
24 October 2024
Posted:
28 October 2024
You are already at the latest version
Abstract
In this study the transboundary transport of air masses over the water table of Lake Baikal during the raining period of July–August 2010–2019 was investigated. For this purpose, the backward trajectories with an interval of 6 hours were constructed by using the NOAA hysplit method. These trajectories started at the center of Lake Baikal at altitudes of 250 and 2500 m. It was shown that during these years the western air mass transport passed over the marshland of Western Siberia, as well as over the steppe and forest-steppe regions of south of Western Siberia, and the angular sectors of WNW (West - North West) and WSW (West - South West) directions, accordingly, dominated. In July, at altitudes of 2500 m, in average 23.68 % percents of the total amount of trajectories have passed over the arid areas, which are located at WSW direction, and 34.42 % of trajectories passed from the WNW direction. In August, at altitudes of 2500 m, in average arid WSW part in the trajectory ensemble was equal to 24.22 %, and the wet WNW part from the swamps of Western Siberia was equal to 41.05 %. It was also shown that the air masses that passed in July and August 2010–2019 over the polluted industrial agglomerations, that are allocated in the south of Beijing, did not passed over the area of the Lake Baikal, and therefore these air masses can not participate both in the ecological situation change in the area of the Lake Baikal, and in the processes of nuclearization at the cloud formation. For the period of 2010–2019 the average value of the SSE (South-South-East) part in the trajectory ensemble, which is corresponding to the transfer from the Central regions of China, was equal at an altitude of 250 m: in July to 1.00 %, in August to 0.49 %. At an altitude of 2500 m SSE sector in July was equal to 1.77 % and in August – 2.09 % of the total number of studied trajectories.
Keywords:
Lake Baikal
; Selenga
; NOAA hysplit
; Backward trajectory
; Raining season
; GIS system
Introduction
The Lake Baikal is the largest freshwater reservoir on the Earth, holding ~ 20 % of the world’s total fresh water. The largest river, Selenga, running into Lake Baikal, provides up to half of the annual inflow of water, (Ilyicheva et al., 2014). The changes in water inflow into Lake Baikal, runoff and runout fluctuations of river system were studied in (Korytny et al., 2012), (Sinyukovich et al., 2013), (Törnqvist et al., 2014), (Ilyicheva et al., 2014), (Ilyicheva et al., 2015), (Dabaeva et al., 2016), (Frolova et al., 2017a), (Frolova et al., 2017b), (Sinyukovich and Chernyshov, 2017), (Dobrovol’skii, 2017), (Sinyukovich and Chernyshov, 2019).
The details of investigation of environment aspects in the Baikal basin could be found in e.g. (Karthe et al., 2015), (Kasimov et al., 2017). The water regime of the Lake Baikal and river Selenga are characterized by low spring flood, rainfall floods in July–August, and moderate inflow in autumn–winter. Note that the impact of climate change and wildfires on the natural landscape of Lake Baikal for the period 2010–2018 was studied earlier in (Safronov, 2020).
In that way, it is interesting to identify and analyze the sources of anthropogenic air pollution, as well as the main directions of transport of pollutants and moisture in the area of the lake Baikal by using methods of reverse modeling and statistical analysis of ensemble backward trajectories. In this work, we have studied the possibility of reducing the number of condensation nuclei due to the transfer from central China the combustion products of solid fuel and of agricultural rests (stubbles). Respectively such transfer may probably lead to a decrease in precipitation in the Baikal offshore and in the mountainous territory of its basin, and it makes a significant contribution to lowering the lake level.
The central part of the Baikal, over which the air masses passed, is defined in this study as the spatial object, and the raining season in July–August of 2010–2019 is defined as the time studying interval. This work may be of some interest to hydrologists, ecologists and climatologists, who investigated the biological natural complex of Lake Baikal.
Materials and Methods
For estimation of the processes of the pollutants and moisture transport in the area of Lake Baikal, the NOAA hysplit model was used. The details about this model could be found in (HYSPLIT Model Guide), (Rolph and Draxler, 1990), (Draxler, 1996), (Draxler and Hess, 1998), (Draxler, 2006), (Stein et al., 2015). Also we will note the recent publications (Osipova and Osipov, 2019), (Osipov and Osipova, 2020), in which the NOAA hysplit method was used for investigation of atmospheric circulation processes and precipitation regime in the northern part of the Baikal Mountain Region and in the East Sayan Range. In this study the results of calculations were visualized by using a GIS system built into the TrajStat package (Wang et al., 2009), as well as by full geographic information system (GIS) map systems (ESRI ArcInfo, 2024). The analysis of backward trajectories was made for raining season, July–August of 2010–2019. The reverse trajectories of air masses transport were calculated at intervals of 6 hours, that is, they started every day of the month at 00, 06, 12 and 18 UTC. All backward trajectories started from a point located in the middle of the lake Baikal water area with coordinates 53.3ºN, 108.0ºE. The duration of the backward trajectories was 5 days (120 hours). The Global Data Assimilation System (GDAS1) meteorological fields with a spatial resolution of 1ºx1º were used for calculations. The description of these meteorological fields is provided on the NOAA ARL website (ARL); the data itself is available via the (ARL FTP server). In this work were considered two cases of altitude of air masses coming, namely at the small heights, 250 m, and at heights of 2500 m, which is equal to approximately half of Planetary Boundary Layer height (PBL) at none time. During calculating of backward trajectories, the NOAA hysplit model option has been chosen, in which the vertical wind speeds from the initial meteorological data were obtained; please see description in (HYSPLIT Model Guide).
The angular statistical analysis of the air masses incoming in the vicinity of Lake Baikal was performed for 8 angular sectors: NNE, ENE, ESE, SSE, SSW, WSW, WNW and NNW, located clockwise. The symbols in the angular sectors names are standard: N is North, E – East, S – South and W – West. The angular sectors are shown in Fig. 1. Individual backward trajectory could intersect several sectors, so the total number in difference sectors may vary from case to case. Therefore, the contribution to air mass transfer is given as a percentage of the total for all angular sectors. The area of regional transport near Lake Baikal, which was marked with a red circle in Fig. 1, was not taken into account. Backward trajectories were cut on sector parts by using GIS methods built in full-scale GIS system ESRI ArcInfo.
Results and Discussion
The Spatial Distribution of Backward Trajectories
The backward trajectories were calculated and analyzed for all raining seasons during 2010–2019. The examples of calculations of the ensemble of backward trajectories for July and August of 2012, 2015 and 2017 are shown in Fig. 2 (July) and Fig. 3 (August). In these figures the left column (a,b,c) corresponds to the trajectories that came in the center of Lake Baikal at the heights of 250 m above a sea level (a.s.l.). Similarly, the right column (d,e,f) in figures corresponds to heights of 2500 m.
As it can be seen from the calculation results, in July, the western transport dominated, so in these cases the air masses could not passed over the Pacific Ocean and could not be saturated with monsoon moisture. Also we will notice that the significant transfer to the Baikal water area from the polluted air from industrial agglomerations, located to the south of Beijing, was not observed in most of the cases under consideration; exception is made by individual trajectories in July, 2017.
The similar results of calculations of the ensemble of backward trajectories for August of 2012, 2015, and 2017 are presented in Fig. 3. In August of 2012, 2015, 2017, as well as in July, the western transport dominated, so in August also the Pacific monsoon could not significantly affect the moisture content of air masses spreading over the Lake Baikal. The exception was for August 2017, when both the north-western air masses carrying over the wetlands of Western Siberia and the eastern carrying from the Pacific coast were observed.
Angular Sector Statistics of Backward Trajectories
Due to the limited size of the paper, the other results of ensemble trajectory calculating for the remaining years are presented below in Table 1, Table 2, Table 3 and Table 4. The percentage of trajectories that reached altitudes of 250 m and 2500 m in the area of the Lake Baikal center in July of 2010–2019 is shown in Table 1 and Table 2, correspondingly. The dominant values greater than 20 % in Tables are marked in gray. As can be seen from the Table 1 and Table 2, in July the dominant direction of air masses transfer was the direction of WNW, that is, the majority of air flows were carried out from the marshland of Western Siberia. At small altitudes the contribution of northern transport from the NNE and NNW angular sectors is observed, furthermore, the contribution of the NNE sector in 2013, 2016 and 2018 and NNW sector in 2015 and 2018 exceeded 20 % of the total number of trajectories over all sectors. At the same time at altitudes of 2500 m in July in 2010, 2011, 2013, 2016, 2017 and 2019, it should be noted the contribution to the transfer of air masses from the WSW direction, which formed over the arid regions of the Gobi desert and the foothills of Tibet (see Table 2). Like this in July, at altitudes of 2500 m, the average value of WSW sector from arid territories is equal to 23.68 %, and the average value of wet WNW sector from the swamps of Western Siberia is equal to 34.42 %.
The percentage of trajectories, which are coming to the center of Lake Baikal in August 2010–2019 at altitudes of 250 m and 2500 m are presented in Table 3 and Table 4. In August, as well as in July, the dominant direction of air mass transfer is the direction of WNW from the marshy area of Western Siberia. Further, in August, at altitudes of 2500 m, the average value of arid WSW sector is equal to 24.22 %, and the wet WNW sector gives 41.05 % of the total trajectories.
Thus the main goal of this study was to establish the possibility of influence of the Central industrial complex of China on the environmental and precipitation situation on the Lake Baikal; we estimated the participation of the SSE sector (please see Fig. 1). As it can be seen from Table 1, Table 2, Table 3 and Table 4 during the raining season, the transfer of pollutions from the Central industrial areas of China is not significant. In July–August the contribution of SSE did not exceed 5 % during all years, both at altitudes of 250 m and at altitudes of 2500 m. During 2010-2019 the average value of the SSE sector at an altitude of 250 m was equal to 1.00 % in July and in August it was equal to 0.49 %; while at an altitude of 2500 m in July it was equal to 1.77 % and in August it was equal to 2.09 %. Quite often the SSW and SSE contributions at altitudes of 250 m were completely absent. So in July of 2011, 2012, 2014, 2016 and 2017 and in August of 2013, 2014, 2016–2018 the contributions of the SSW and SSE angular sector were equal to zero (see Table 1 and Table 3).
The Northern industrial area of China, including such industrial cities as Harbin, Jilin, Qiqihar and Changchun are located in the ESE sector. In addition, this sector includes both Korea and Japan. The impact of ESE sector on environmental of Baikal was slightly higher, than the impact of SSE sector. For the period of 2010–2019 at an altitude of 250 m the average value of ESE sector in July is equal to 4.30 % and in August it is equal to 3.44 %; similarly at the altitude of 2500 m in July it was equal to 4.60 % and in August – to 3.73 %.
Conclusions
By using the method of constructing backward trajectories and analyzing the landscape of the areas, over which these air masses passed, the next observation has been established. There was no significant impact of the Pacific monsoon during the raining July–August seasons of 2010–2019 on the moisture content of air masses at the area of Lake Baikal. In these years, the western transfer from the marshlands of Western Siberia, as well as from the steppe and forest-steppe regions of Western Siberia dominated. In July at altitudes of 2500 m, the average value of the arid WSW angular sector gave contribution in 23.68 % cases of the total amount of backward trajectories, and the wet WNW sector, in which the air masses passed over swamps of Western Siberia, gave contribution in 34.42 % cases. In August at altitudes of 2500 m the average value of WSW sector was equal to 24.22 %, and of WNW sector was equal to 41.05 %.
Further the air masses that passed in July and August 2010–2019 over polluted industrial agglomerations that are located in south of Beijing did not pass over the area of Lake Baikal, and therefore these masses can not affect both the environmental situation in the area of Lake Baikal, and the processes of nuclearization during cloud formation. Moreover, the average value for the period of 2010–2019 of the SSE sector, which corresponding to the transfer from the central regions of China, at an altitude of 250 m, in July was equal to 1.00 % and in August – to 0.49 %; at an altitude of 2500 m in July it was equal to 1.77 % and in August – to 2.09 %.
Funding
This research was supported by the state assignment of the A.M. Obukhov Institute of Atmospheric Physics RAS (FMWR-2022-0010).
Data availability
Public available datasets were analyzed. The data can be found from the link:ftp://arlftp.arlhq.noaa.gov/pub/archives/gdas1/ (accessed on 25 January 2024).
Declarations
Competing interests
The authors declare no competing interests.
Conflicts of Interest
The authors declare that they have acknowledged all financial and technical support received for the work presented in this article.
References
- ARL FTP server. Available online: ftp://arlftp.arlhq.noaa.gov/pub/archives/gdas1 (accessed on 25 January 2024).
- Dabaeva DB, Tsydypov BZ, Ayurzhanaev AA, Andreev SG, Garmaev YZ (2016) Peculiarities of Lake Baikal water level regime. IOP Conf Series: Earth and Environmental Science 48:012014. [CrossRef]
- Dobrovol’skii SG (2017) Year-to-year and many-year river runoff variations in Baikal Drainage Basin. Water Resources 44:347-358. [CrossRef]
- Draxler RR (1996) Trajectory optimization for balloon flight planning. Weather and Forecasting 11:111-114. [CrossRef]
- Draxler RR (2006) The Use of Global and Mesoscale Meteorological Model Data to Predict the Transport and Dispersion of Tracer Plumes over Washington, D.C.. Weather and Forecasting 21:383-394. [CrossRef]
- Draxler RR, Hess GD (1998) An Overview of the Hysplit_4 Modeling System for Trajectories, Dispersion, and Deposition. Australian Meteorological Magazine 47:295-308.
- ESRI ArcInfo Information. Available online: http://www.esri.com/software/arcgis/arcinfo/index.html (accessed on 25 January 2024).
- Frolova NL, Belyakova PA, Grigor’ev VY, Sazonov AA, Zotov LV (2017a) Many-Year Variations of River Runoff in the Selenga Basin. Water Resources 44:359-371. [CrossRef]
- Frolova NL, Belyakova PA, Grigoriev VY, Sazonov AA, Zotov LV, Jarsjö J (2017b) Runoff fluctuations in the Selenga River Basin. Regional Environmental Change 17:1965-1976. [CrossRef]
- GDAS1 1x1º meteorological fields, NOAA ARL server. Available online: https://www.ready.noaa.gov/gdas1.php (accessed on 25 January 2024).
- HYSPLIT Model Guide (The Hybrid Single Particle Lagrangian Integrated Trajectory model). Available online: http://www.arl.noaa.gov/ready/hysplit4.html (accessed on 25 January 2024).
- Ilyicheva EI, Gagarinova OV, Pavlov MV (2015) Hydrologo-Geomorphological Analysis of Landscape Formation Within the Selenga River Delta. Geography and Natural Resources 36:263-270. [CrossRef]
- Ilyicheva YA, Korytny LM, Pavlov MV (2014) The river network of the Selenga Delta at present. Tomsk State University Journal 380:190-194. [CrossRef]
- Karthe D, Chalov S, Kasimov N, Kappas M (2015) Water and Environment in the Selenga Baikal Basin: International Research Cooperation for an Ecoregion of Global Relevance.
- Kasimov N, Karthe D, Chalov S (2017) Environmental change in the Selenga River - Lake Baikal Basin. Regional Environmental Change 17:1945-1949. [CrossRef]
- Korytny LM, Il’icheva EA, Pavlov MV, Amosova IY (2012) Hydrologo-Morphological Approach to Regionalizationof the Selenga River Basin. Geography and Natural Resources 33:212-217. [CrossRef]
- Osipov EY, Osipova OP (2020) Moisture sources and synoptic conditions of summer precipitation in the glacial zone of the East Sayan Range Advance in Science and Research 17. [CrossRef]
- Osipova OP, Osipov EY (2019) Atmospheric Circulation Processes and Precipitation Regime in the Northern Part of the Baikal Mountain Region. Russian Meteorology and Hydrology 44:695-703. [CrossRef]
- Rolph GD, Draxler RR (1990) Sensitivity of three dimensional trajectories to the spatial and temporal densities of the wind field. J Appl Meteor 29:1043–1054. [CrossRef]
- Safronov AN (2020) Effects of Climatic Warming and Wildfires on Recent Vegetation Changes in the Lake Baikal Basin. MDPI Climate 8:57. [CrossRef]
- Sinyukovich VN, Chernyshov MS (2017) Transformation of estimated characteristics of the annual and maximal runoff in the major tributaries of Lake Baikal Water Resources 44:372-379. [CrossRef]
- Sinyukovich VN, Chernyshov MS (2019) Water regime of lake Baikal under conditions of climate change and anthropogenic influence. Quaternary International 524:93-101. [CrossRef]
- Sinyukovich VN, Sizova LN, Shimaraev MN, Kurbatova NN (2013) Characteristics of Current Changes in Water Inflow Into Lake Baikal. Geography and Natural Resources 34:350-355. [CrossRef]
- Stein AF, Draxler RR, Rolph GD, Stunder BJB, Cohen MD, Ngan F (2015) NOAA’s HYSPLIT atmospheric transport and dispersion modeling system. B Am Meteorol Soc 96:2059-2077. [CrossRef]
- Törnqvist R, Jarsjö J, Pietron J, Bring A, Rogberg P, Asokan SM, Destouni G (2014) Evolution of the hydro-climate system in the Lake Baikal basin. Journal of Hydrology 519:1953-1962. [CrossRef]
- Wang YQ, Zhang XY, Draxler RR (2009) TrajStat: GIS-based software that uses various trajectory statistical analysis methods to identify potential sources from long-term air pollution measurement data. Environmental Modelling & Software 24:938-939. [CrossRef]
Figure 1.
The NNE, ENE, ESE, SSE, SSW, WSW, WNW, NNW transboundary sectors were used during backward trajectory statistical analysis. The local territory, allocated inside of a red circle, was not taking into account during the statistical analysis.
Figure 1.
The NNE, ENE, ESE, SSE, SSW, WSW, WNW, NNW transboundary sectors were used during backward trajectory statistical analysis. The local territory, allocated inside of a red circle, was not taking into account during the statistical analysis.
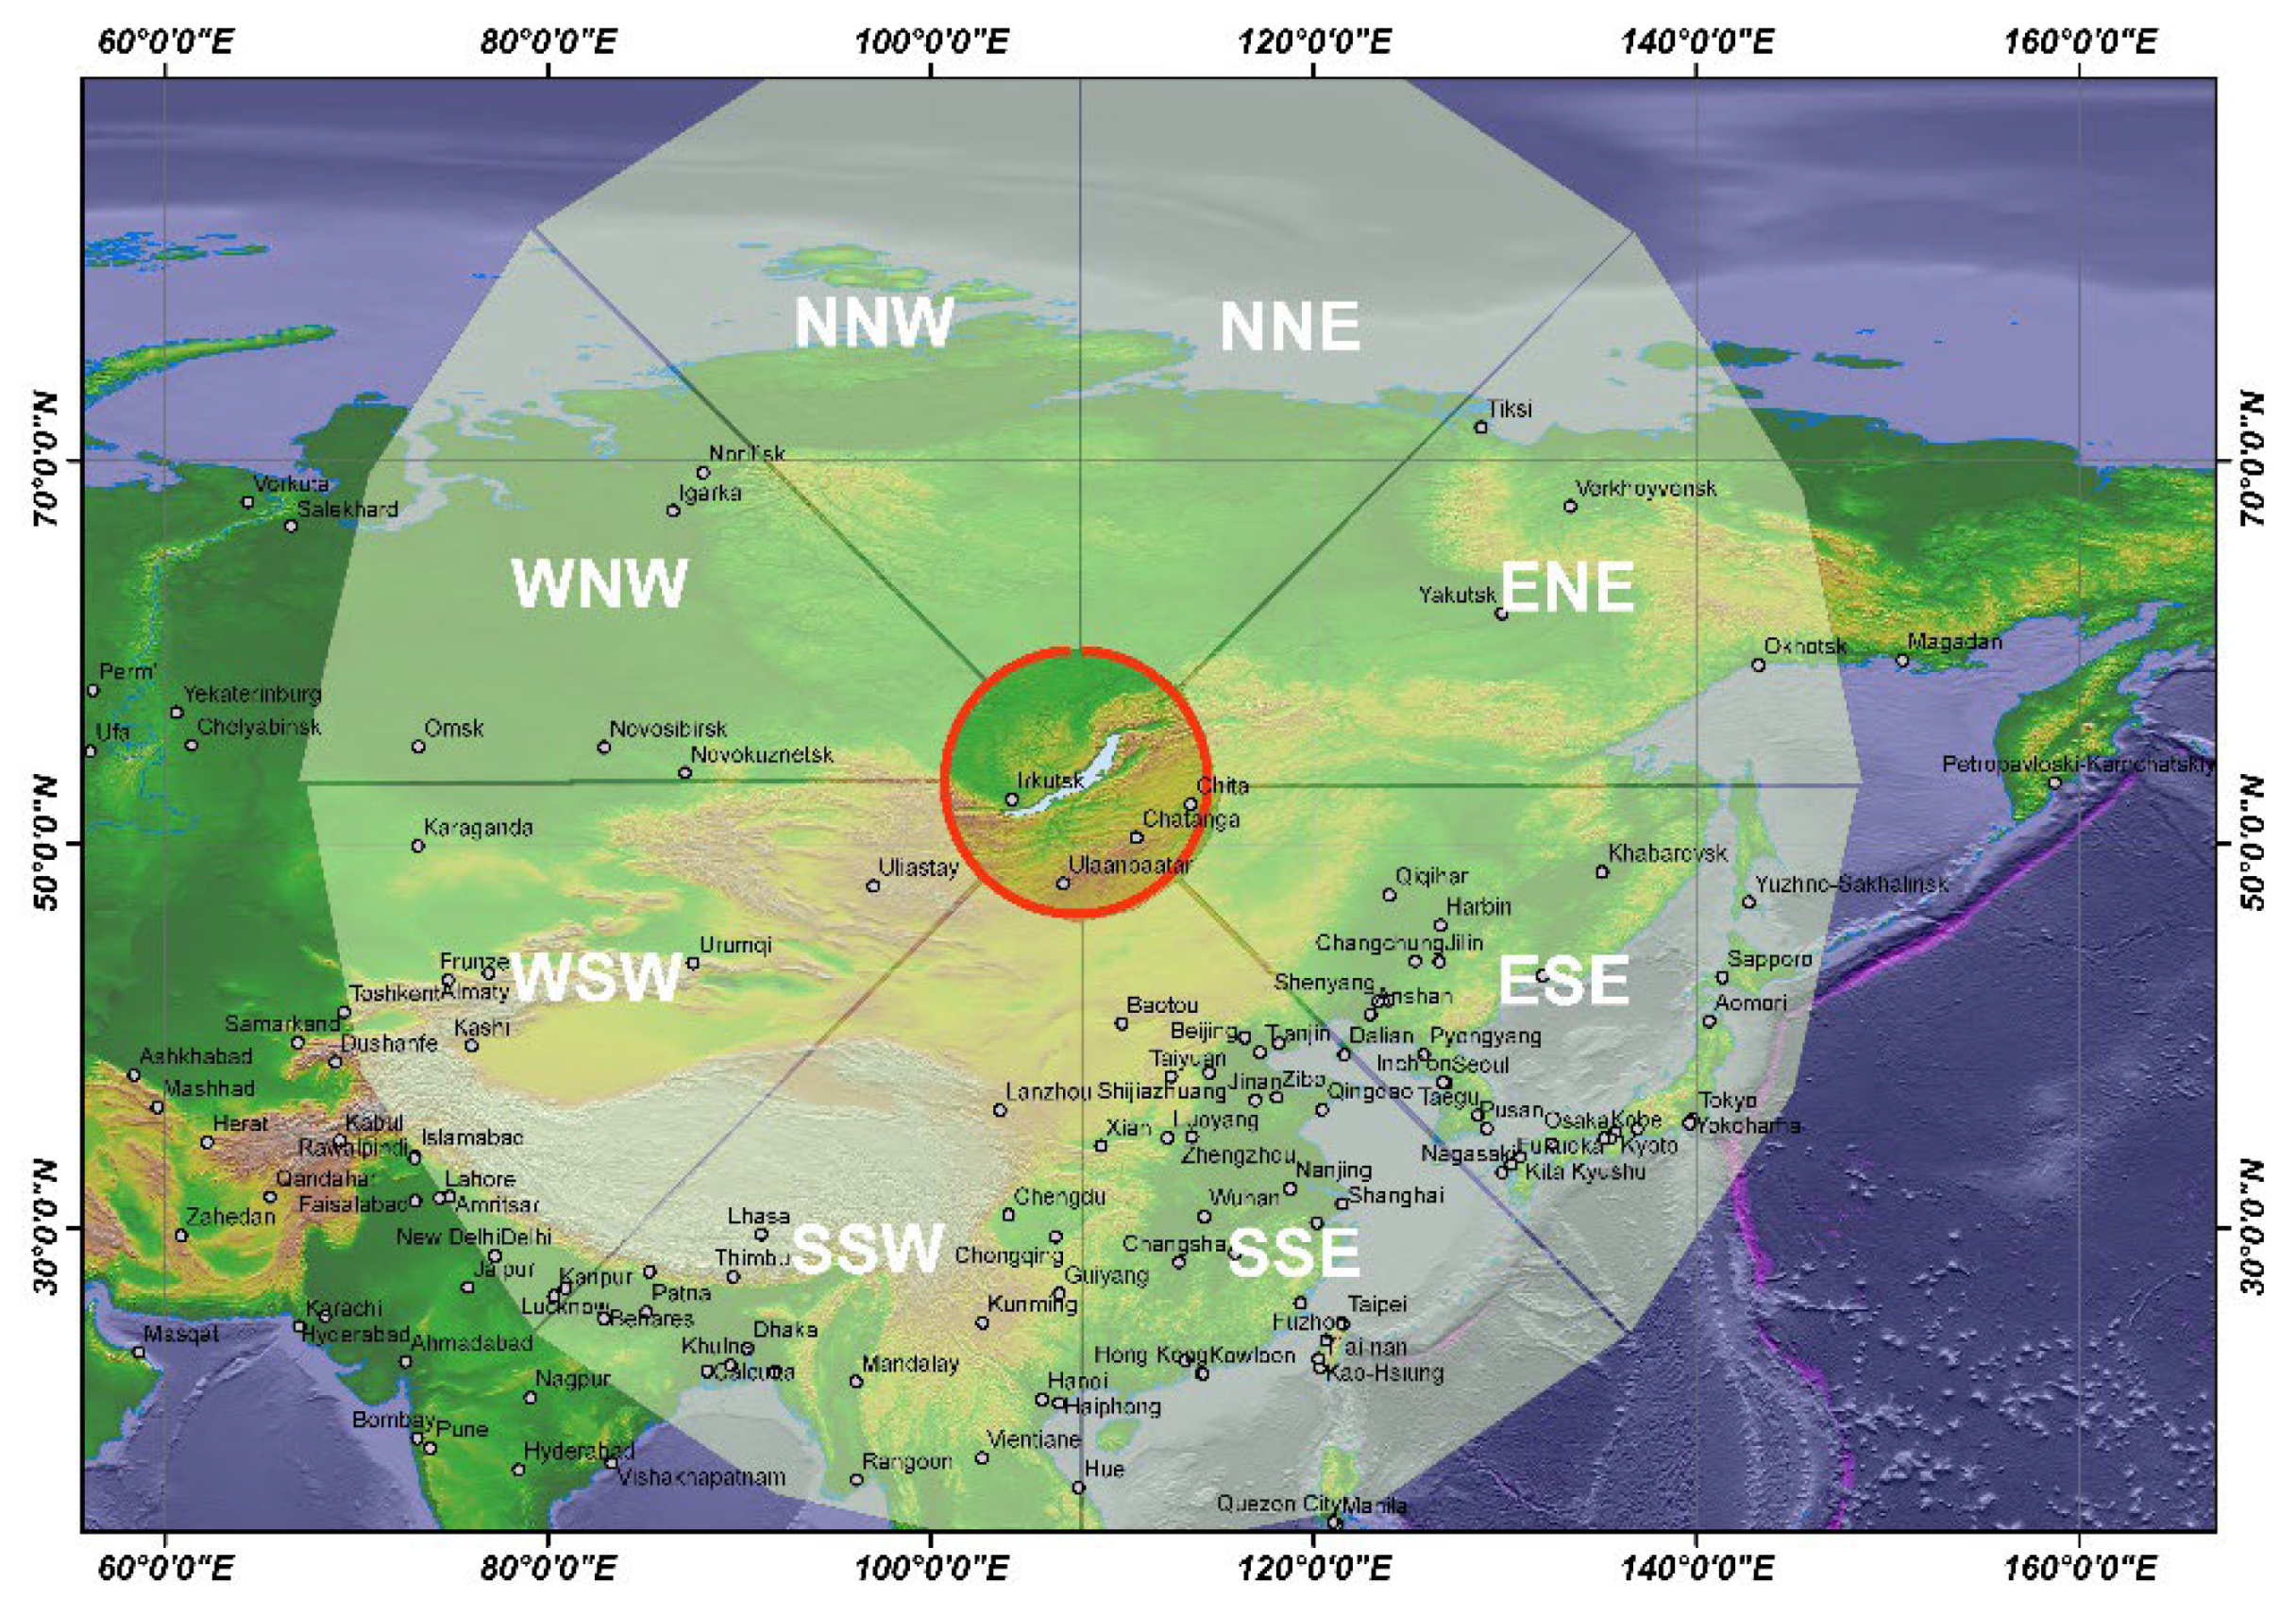
Figure 2.
The backward NOAA hysplit trajectories, beginning at the altitude of 250 m (a, b, c) and at the altitude of 2500 m (b, d, f), were presented for July 2012 (a, d), 2015 (b, e) and 2017 (c, f).
Figure 2.
The backward NOAA hysplit trajectories, beginning at the altitude of 250 m (a, b, c) and at the altitude of 2500 m (b, d, f), were presented for July 2012 (a, d), 2015 (b, e) and 2017 (c, f).
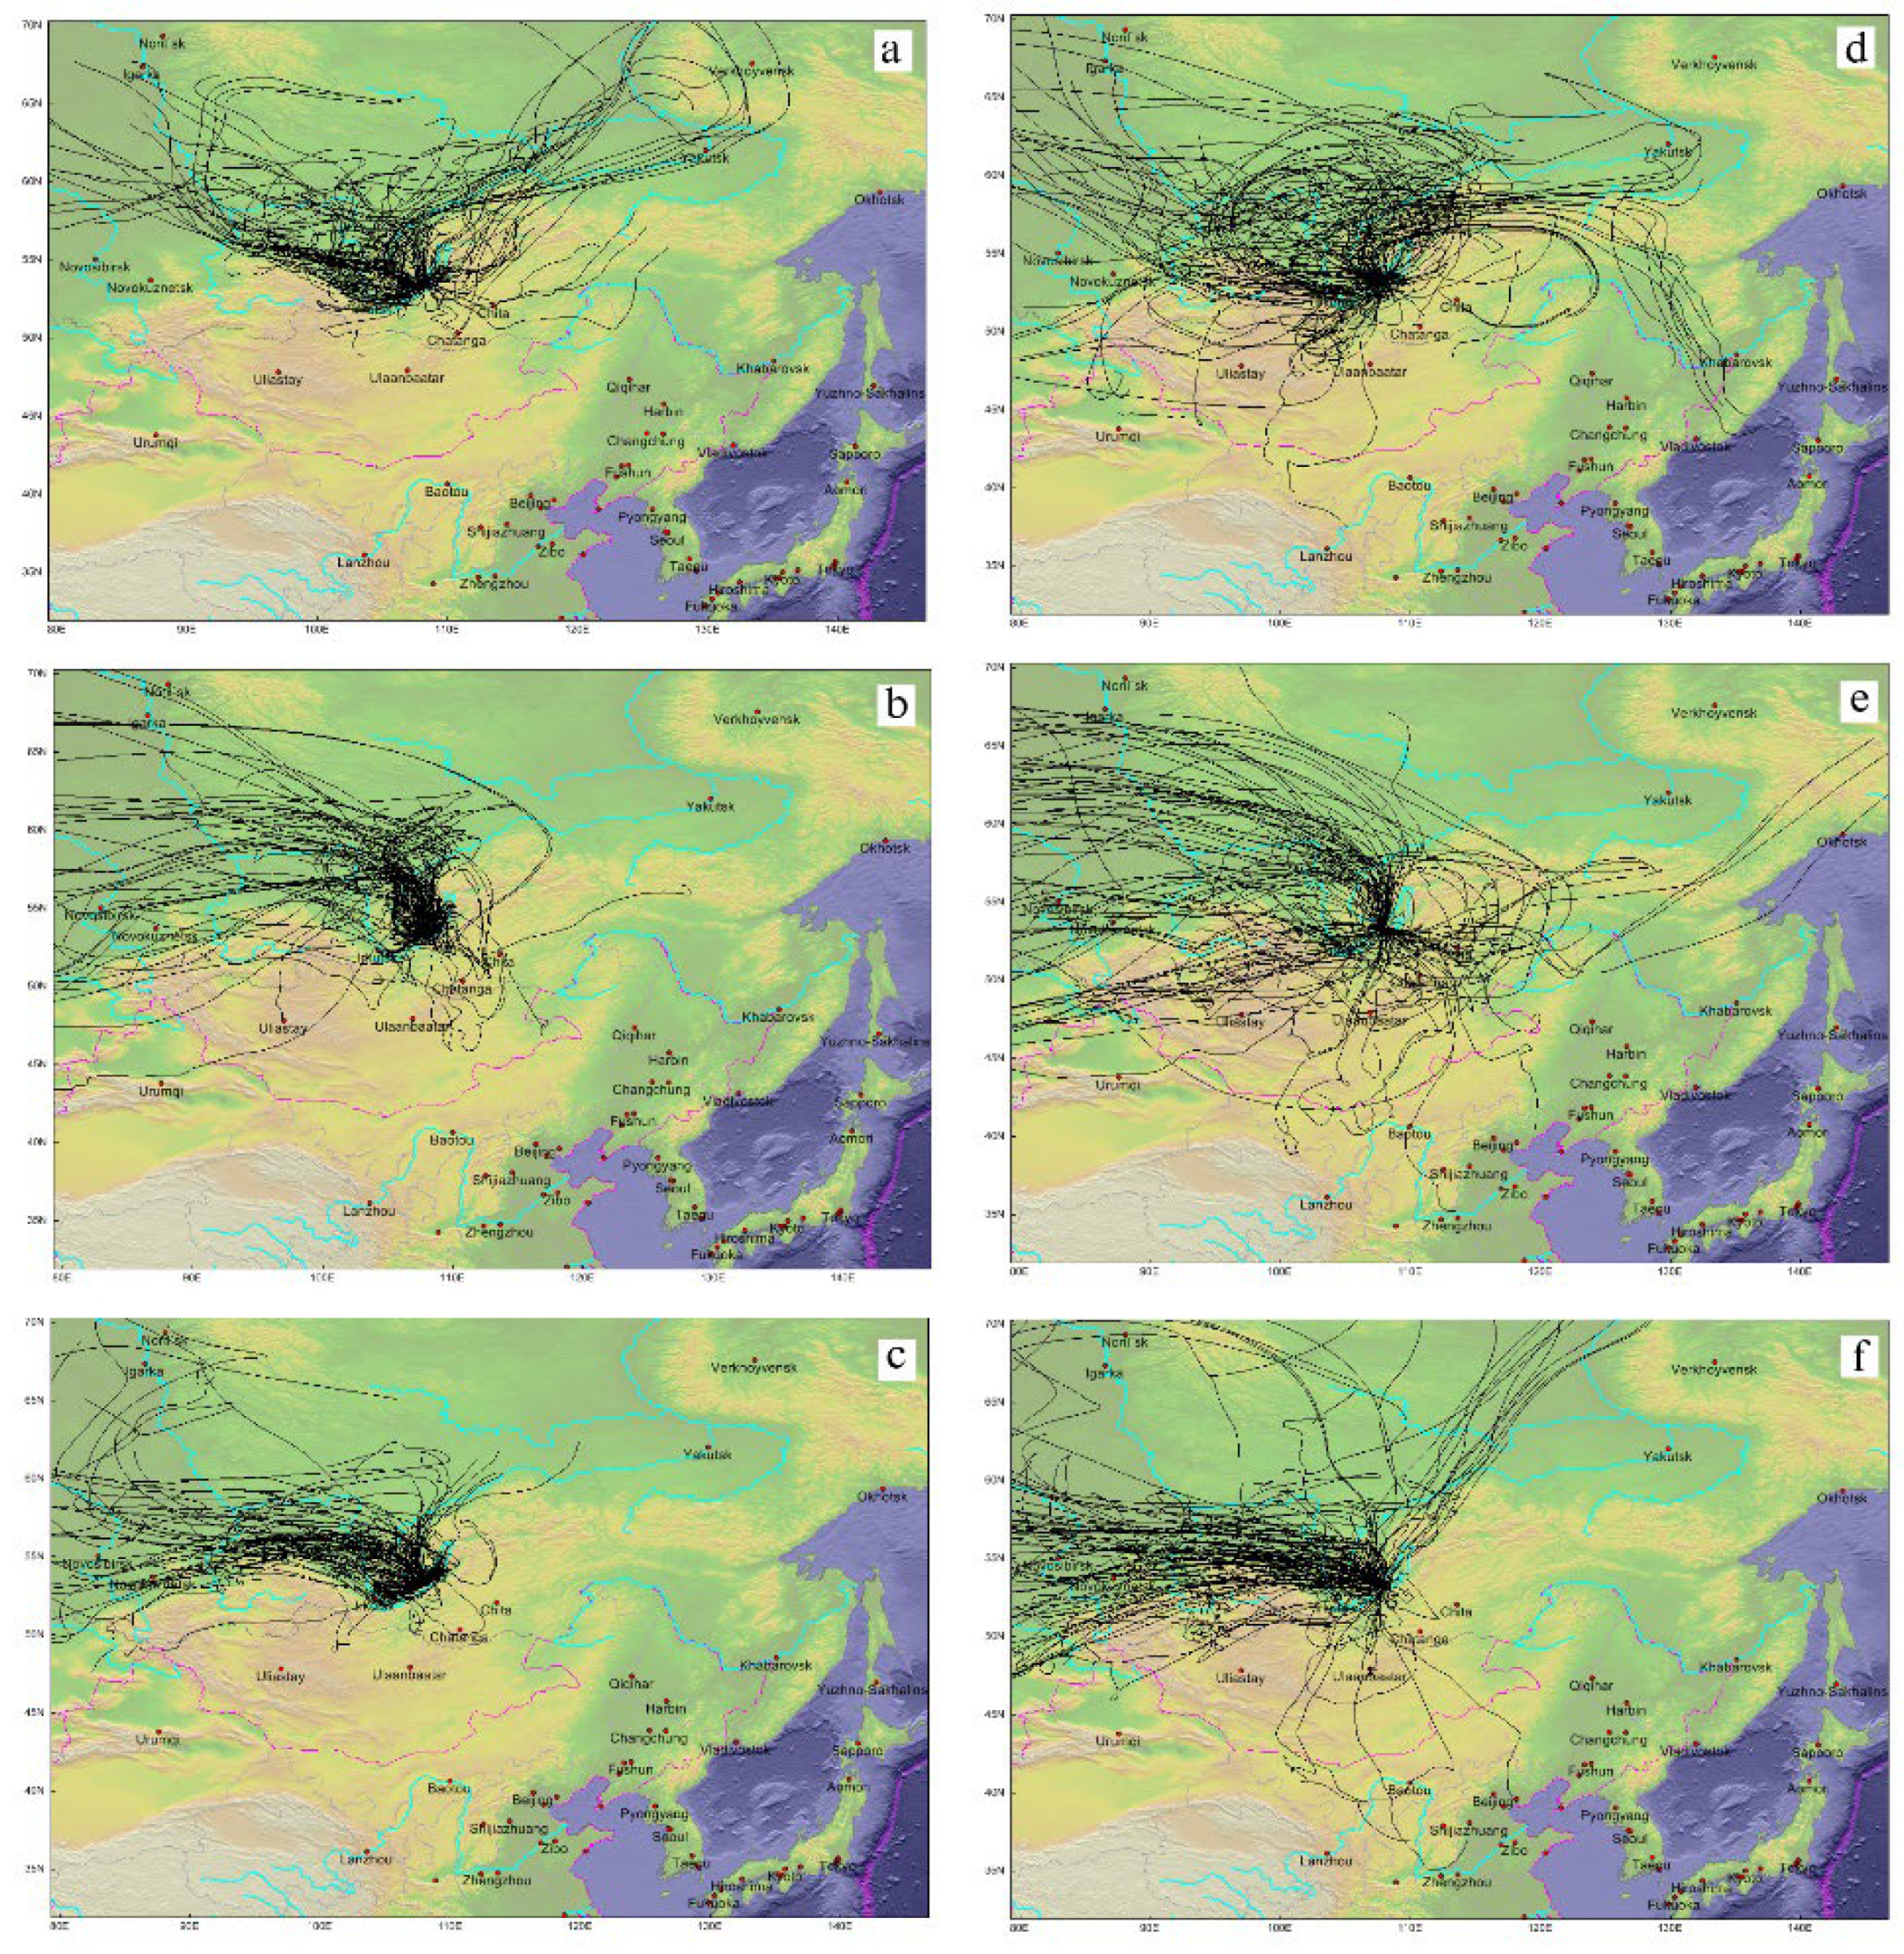
Figure 3.
The similar set of backward NOAA hysplit trajectories, as which are drawn above in Fig. 2, but for August 2012 (a, d), 2015 (b, e) and 2017 (c, f).
Figure 3.
The similar set of backward NOAA hysplit trajectories, as which are drawn above in Fig. 2, but for August 2012 (a, d), 2015 (b, e) and 2017 (c, f).
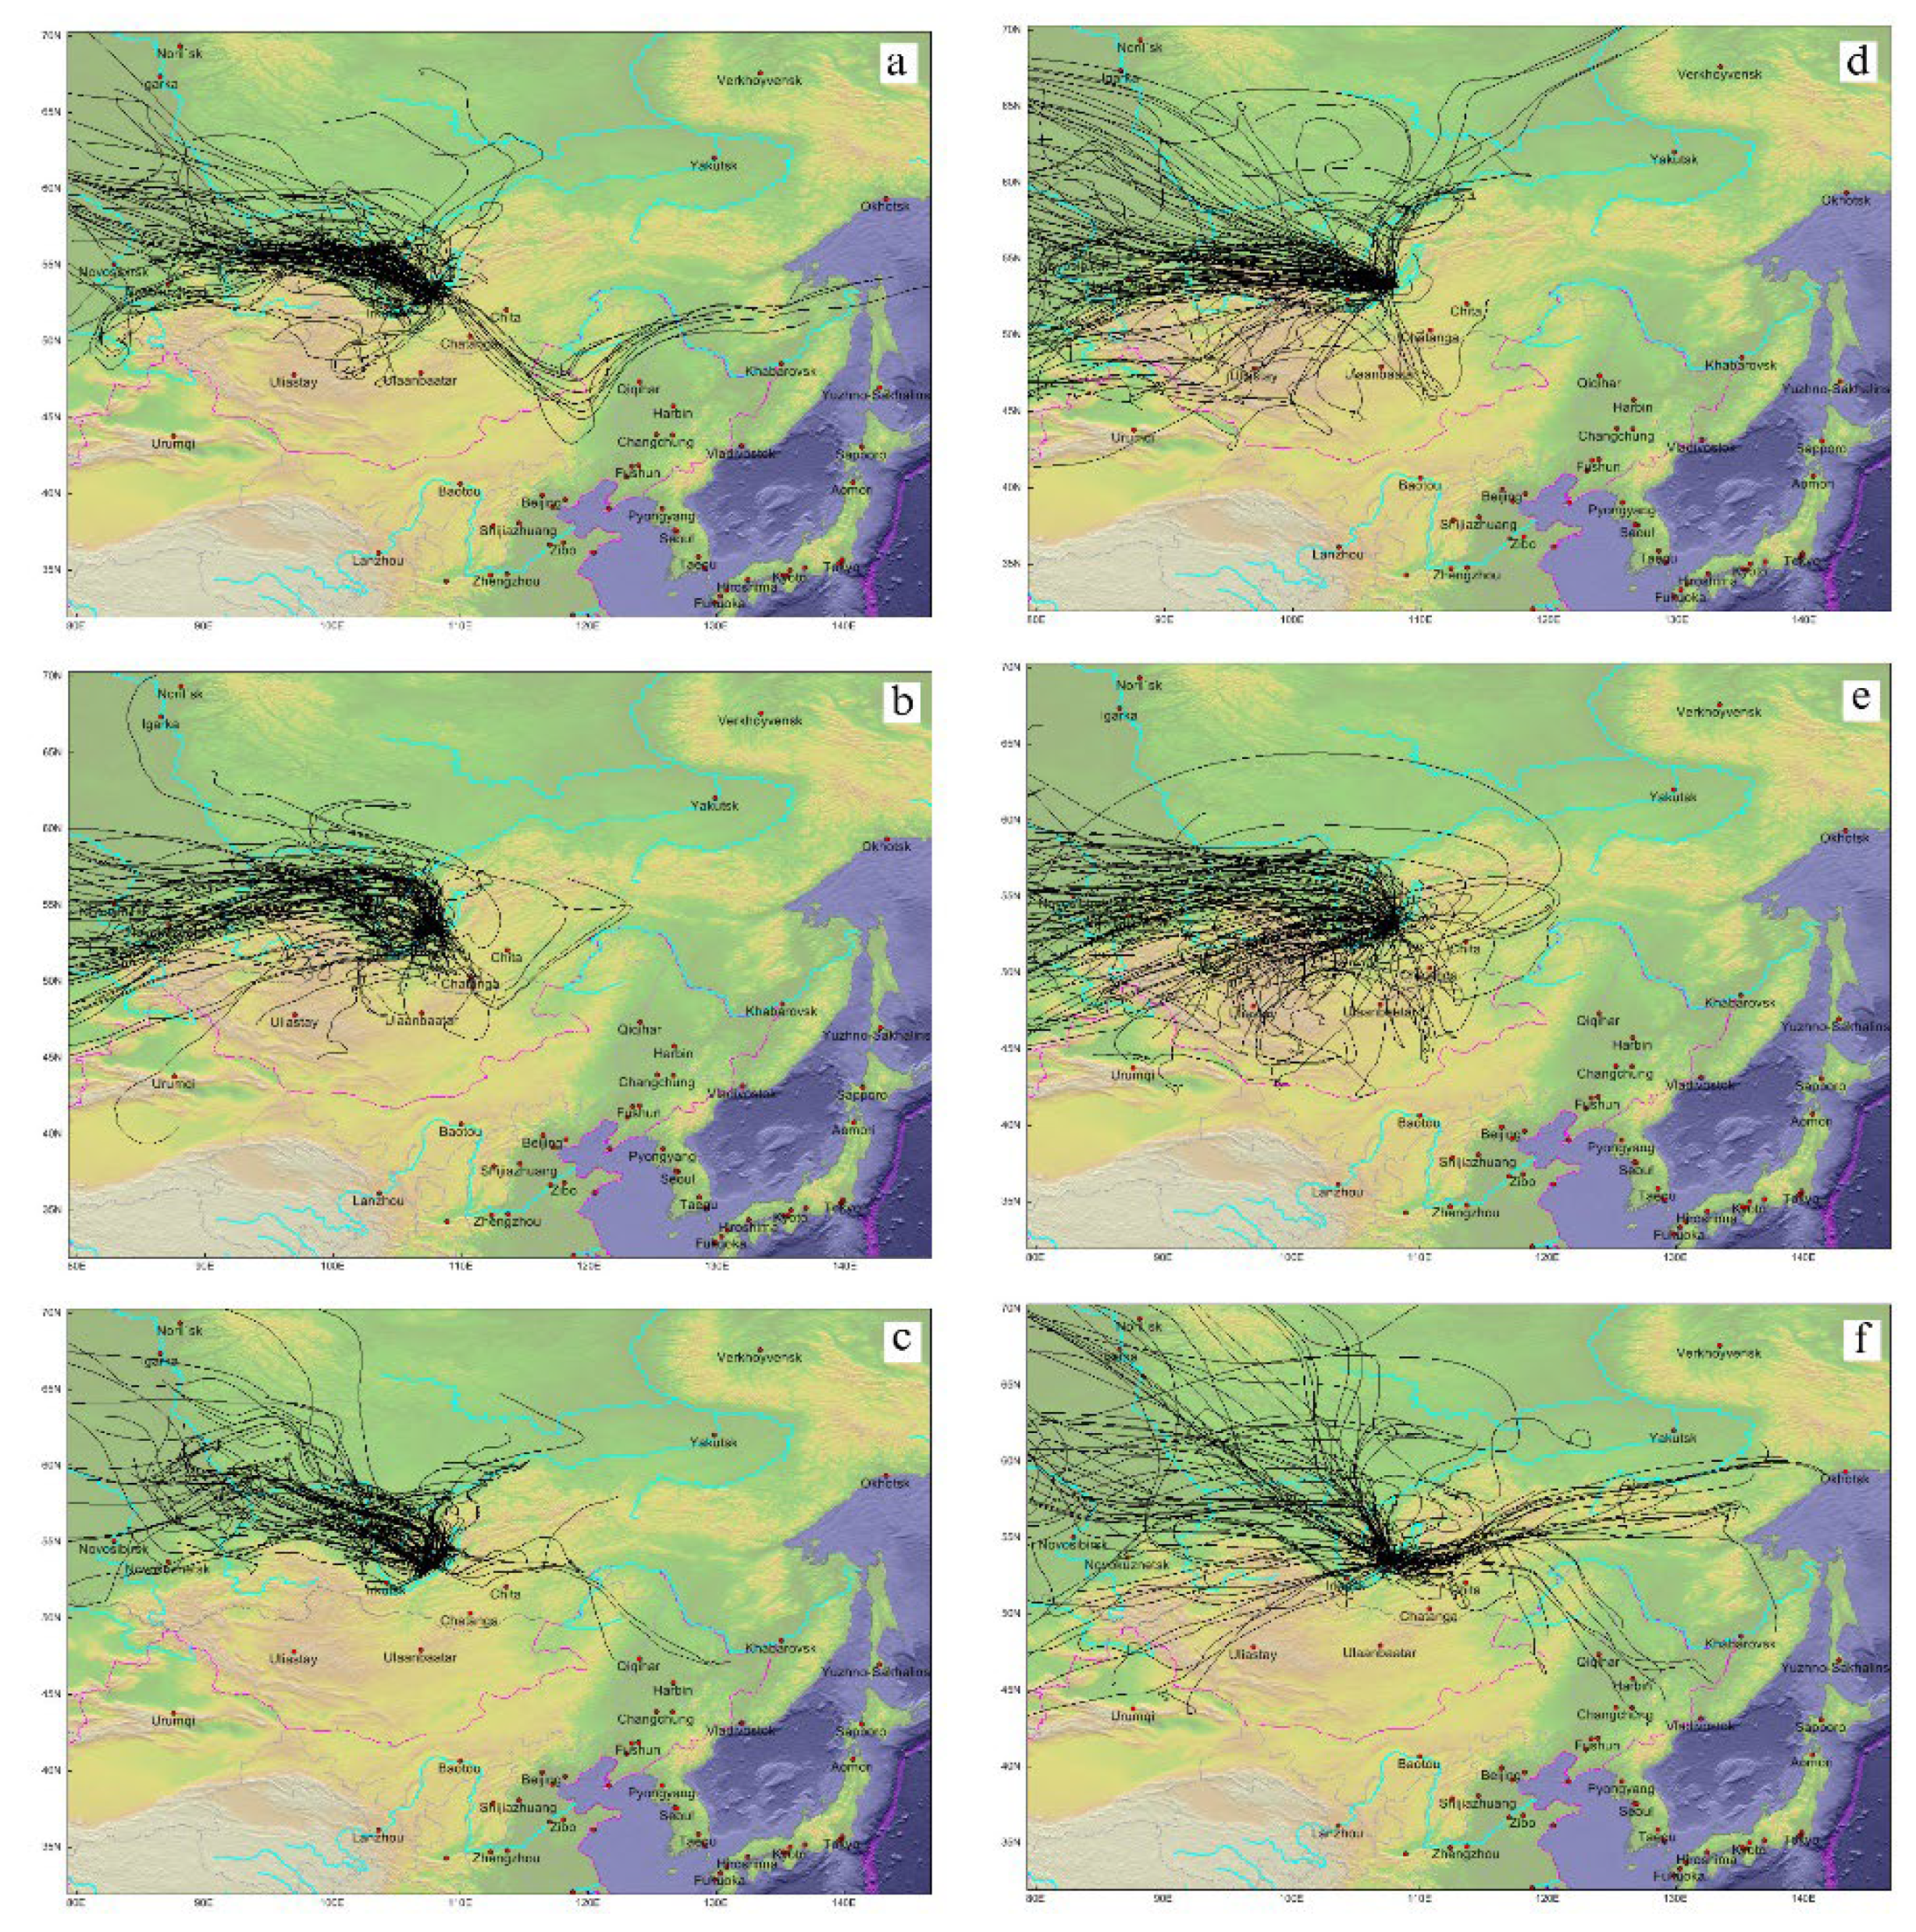

Table 1.
The percent of backward trajectories that were coming in July to Baikal area at altitude of 250 m from difference directions.
Table 1.
The percent of backward trajectories that were coming in July to Baikal area at altitude of 250 m from difference directions.
| Years July |
Angular sector contributions at 250 m asl, in % | |||||||
| NNE | ENE | ESE | SSE | SSW | WSW | WNW | NNW | |
| 2010 | 3.8 | 3.8 | 11.39 | 5.06 | 2.53 | 12.03 | 51.9 | 9.49 |
| 2011 | 4.93 | 5.63 | 4.23 | 0. | 0. | 4.93 | 67.61 | 12.68 |
| 2012 | 17.22 | 23.18 | 2.65 | 0. | 0. | 3.31 | 39.07 | 14.57 |
| 2013 | 26.29 | 15.43 | 1.71 | 1.14 | 0.57 | 2.86 | 38.86 | 13.14 |
| 2014 | 17.28 | 17.28 | 4.94 | 0. | 0. | 15.43 | 37.04 | 8.02 |
| 2015 | 10.14 | 2.03 | 2.03 | 2.03 | 0. | 12.16 | 45.95 | 25.68 |
| 2016 | 39.38 | 23.13 | 0. | 0. | 0. | 3.75 | 15.0 | 18.75 |
| 2017 | 7.77 | 0.97 | 0. | 0. | 0. | 13.59 | 66.99 | 10.68 |
| 2018 | 34.87 | 13.16 | 5.26 | 0.66 | 0.66 | 0. | 23.68 | 21.71 |
| 2019 | 17.05 | 18.75 | 10.8 | 1.14 | 2.27 | 7.95 | 26.14 | 15.91 |
| Average | 17.87 | 12.34 | 4.30 | 1.00 | 0.60 | 7.60 | 41.22 | 15.06 |
Table 2.
The percent of backward trajectories that were coming in July to Baikal area at altitude of 2500 m from difference directions.
Table 2.
The percent of backward trajectories that were coming in July to Baikal area at altitude of 2500 m from difference directions.
| Years July |
Angular sector contributions at 2500 m asl, in % | |||||||
| NNE | ENE | ESE | SSE | SSW | WSW | WNW | NNW | |
| 2010 | 2.63 | 4.74 | 6.84 | 4.21 | 6.84 | 33.16 | 36.32 | 5.26 |
| 2011 | 3.05 | 5.58 | 5.08 | 2.54 | 3.55 | 37.06 | 41.62 | 1.52 |
| 2012 | 15.81 | 17.09 | 5.56 | 0. | 2.14 | 17.09 | 29.91 | 12.39 |
| 2013 | 10.48 | 6.11 | 0.44 | 0.44 | 2.62 | 23.58 | 37.55 | 18.78 |
| 2014 | 12.55 | 17.32 | 3.9 | 0. | 0.87 | 17.75 | 33.33 | 14.29 |
| 2015 | 4.52 | 8.54 | 9.05 | 3.02 | 4.02 | 21.11 | 34.67 | 15.08 |
| 2016 | 21.32 | 16.24 | 3.05 | 2.03 | 1.52 | 17.26 | 22.34 | 16.24 |
| 2017 | 10.33 | 3.80 | 0.54 | 2.17 | 2.72 | 23.37 | 47.28 | 9.78 |
| 2018 | 13.86 | 15.84 | 6.93 | 1.49 | 2.97 | 22.77 | 26.73 | 9.41 |
| 2019 | 13.47 | 17.14 | 8.16 | 3.67 | 4.9 | 14.29 | 22.04 | 16.33 |
| Average | 10.51 | 10.58 | 4.60 | 1.77 | 3.03 | 23.68 | 34.42 | 11.42 |
Table 3.
The percent of backward trajectories that were coming in August to Baikal area at altitude of 250 m from difference directions.
Table 3.
The percent of backward trajectories that were coming in August to Baikal area at altitude of 250 m from difference directions.
| Years August |
Angular sector contributions at 250 m asl, in % | |||||||
| NNE | ENE | ESE | SSE | SSW | WSW | WNW | NNW | |
| 2010 | 9.52 | 4.76 | 0. | 1.79 | 0. | 8.33 | 53.57 | 22.02 |
| 2011 | 7.23 | 3.61 | 1.2 | 2.41 | 2.41 | 20.48 | 57.23 | 5.42 |
| 2012 | 2.8 | 2.8 | 7.69 | 0. | 1.4 | 13.29 | 66.43 | 5.59 |
| 2013 | 33.33 | 21.21 | 0.61 | 0. | 0. | 0.61 | 30.3 | 13.94 |
| 2014 | 0. | 0. | 0. | 0. | 0. | 5.38 | 84.62 | 10.0 |
| 2015 | 0. | 1.97 | 1.97 | 0.66 | 1.97 | 32.24 | 55.26 | 5.92 |
| 2016 | 11.64 | 13.7 | 3.42 | 0. | 0. | 13.7 | 50.0 | 7.53 |
| 2017 | 6.73 | 7.69 | 2.88 | 0. | 0. | 3.85 | 70.19 | 8.65 |
| 2018 | 0.92 | 5.5 | 9.17 | 0. | 0. | 5.5 | 68.81 | 10.09 |
| 2019 | 17.24 | 16.09 | 7.47 | 0. | 0.57 | 9.2 | 37.93 | 11.49 |
| Average | 8.94 | 7.73 | 3.44 | 0.49 | 0.64 | 11.26 | 57.43 | 10.07 |
Table 4.
The percent of backward trajectories that were coming in August to Baikal area at altitude of 2500 m from difference directions.
Table 4.
The percent of backward trajectories that were coming in August to Baikal area at altitude of 2500 m from difference directions.
| Years August |
Angular sector contributions at 2500 m asl, in % | |||||||
| NNE | ENE | ESE | SSE | SSW | WSW | WNW | NNW | |
| 2010 | 1.63 | 2.72 | 3.8 | 3.8 | 4.89 | 23.91 | 48.91 | 10.33 |
| 2011 | 4.93 | 2.96 | 0.49 | 3.45 | 10.84 | 34.98 | 36.95 | 5.42 |
| 2012 | 7.87 | 3.93 | 0.56 | 2.25 | 1.12 | 32.02 | 47.75 | 4.49 |
| 2013 | 15.53 | 13.7 | 3.2 | 3.65 | 2.74 | 11.42 | 35.16 | 14.61 |
| 2014 | 6.08 | 2.76 | 0. | 1.1 | 4.42 | 17.68 | 57.46 | 10.5 |
| 2015 | 1.05 | 3.16 | 3.16 | 3.68 | 4.21 | 43.68 | 40.0 | 1.05 |
| 2016 | 10.2 | 12.76 | 7.14 | 2.55 | 3.57 | 17.86 | 36.73 | 9.18 |
| 2017 | 11.24 | 18.34 | 6.51 | 0. | 0. | 8.28 | 37.28 | 18.34 |
| 2018 | 0.56 | 0.56 | 1.69 | 0. | 6.18 | 34.83 | 43.82 | 11.24 |
| 2019 | 13.9 | 19.73 | 10.76 | 0.45 | 0.45 | 17.49 | 26.46 | 10.76 |
| Average | 7.30 | 8.06 | 3.73 | 2.09 | 3.84 | 24.22 | 41.05 | 9.59 |
Disclaimer/Publisher’s Note: The statements, opinions and data contained in all publications are solely those of the individual author(s) and contributor(s) and not of MDPI and/or the editor(s). MDPI and/or the editor(s) disclaim responsibility for any injury to people or property resulting from any ideas, methods, instructions or products referred to in the content. |
© 2024 by the authors. Licensee MDPI, Basel, Switzerland. This article is an open access article distributed under the terms and conditions of the Creative Commons Attribution (CC BY) license (http://creativecommons.org/licenses/by/4.0/).
Copyright: This open access article is published under a Creative Commons CC BY 4.0 license, which permit the free download, distribution, and reuse, provided that the author and preprint are cited in any reuse.


