
Submitted:
22 October 2024
Posted:
23 October 2024
You are already at the latest version
Abstract
Background: Several studies have questioned the reliability of the interview process in predicting resident success. Objective: Statistical analysis of the resident interview structure might guide process improvements and increase the validity of the selection methodologyMethod: We performed a prospective comparative analysis of our general surgery residency interview process over two consecutive academic years (AY 2022 and 2023). We used descriptive statistics as well as a mixed effects ordered logit model to measure bias and guide process improvement. Results: Eighty total students were interviewed. We found numerous statistical biases including leniency bias exacerbated by the unequal distribution of evaluators; significant differences in the variance from evaluator’s scoring (p<0.0001) and non-normal distribution (p<0.001). Rater reliability was “good” in both years: 0.69 (C.I. 0.51-0.82). Using uncorrected means, on average, each student was statistical different from 11.5±1.1 other students. Using our model, we improved the number of statistically distinct groupings as each student now differed by 30±1.0 others (p<0.0001). In AY23, we restructured the interviews so that all the evaluators scored every student which greatly improved the interview accuracy using the same mixed model; R-squared of 0.95 versus 0.70; and a smaller percent of students had a change in their rank using with the improved structure (57% versus 90%, p<0.05), compared to AY22.Conclusions: Due to numerous statistical biases, there is little differentiation between students and thus little validity in the process for scoring students using raw mean scores. This can be overcome by developing a structured interview and correcting for statistical biases.
Keywords:
interview bias
; Surgery residency
Introduction
General surgical residency is considered among the most competitive residencies in the United States (US). In 2021, 342 programs offered 1622 positions with 3071 applicants (including those from international medical schools). Only 65% of US medical and 53% of all students who applied, matched into a surgery program. Typical programs receive more than a thousand applications for an average of 4.7 positions [1]. With overwhelming student demand and limited available positions, residency programs naturally use the application data to select and recruit the most competitive students.
The residency match process can be divided into two major components: the initial screening of applications and subsequent interviews. The application includes academic achievements and standardized test scores, while interpersonal and communication skills are ostensibly evaluated during each interview. How a program uses the application and interview data is at each’s discretion. There is an expectation by students that this selection process is fair and purposeful, while surgery programs select the students with the greatest potential to thrive in their training environment and reach their career potential.
Biases in the selection process may exclude promising students from a residency program. There are biases inherent to both the evaluator and the structure of the interview process. Statistical bias is a systematic tendency that causes differences between results and facts. Evaluator biases examples include stereotyping, halo effect, leniency, central tendency, and conformity bias [2].
We undertook this study measuring the biases in our interview process and explored statistical and structural methods to overcoming these biases to achieve a reflective and fair interview process.
Methods
We received applications through the Electronic Residency Application Services of the Association of American Medical Colleges. Those candidates were initially screened for an interview based on application competitiveness.
In AY 22, our interview schedule consisted of four interview days, and each student met individually (virtual meetings) with six evaluators for 15 minutes each. There was a pool of 8 evaluators to accommodate scheduling conflicts to ensure each student had six interviews. Each evaluator was instructed to rate (score) each student on a 1 to 10 scale (1 being the worst and 10 being the best). Each evaluator had access to the student’s complete application before the interview, including medical or osteopathic school transcripts, United States Medical Licensing Examination (USMLE) scores (step 1, 2), letters of recommendation, personal statement, and curriculum vitae. The interviews were free form and there were no specific scoring instructions. After the interviews, the evaluators discussed in group all the students before scores were submitted.
USMLE 1 scores and the “prestige” of a medical school was hypothesized to be a potential source of evaluator bias and we incorporated these variables in our initial modelling. School prestige was a continuous variable defined as the ranking by the of U.S New and World report 2021 for medical school. A score of 1 was the highest, and 100 was the lowest possible score. USMLE 1 was a continuous variable (211 to 264 in our sample). Candidates were given anonymous IDs each year of 1-40.
We used a multilevel mixed effects ordered logistic regression with an unstructured covariance matrix and robust error correction with maximal likelihood estimation to analyze the interview score. We used the student as a random effect. The fit of non-nested models was examined by comparing their Akaike information criterion (AIC). Generalized linear latency was used to measure significant differences in variance between the interviews.
To create an adjusted score, we used the coefficient for each of the candidates from our mixed model. We estimated the number of statistically distinct categories by counting the number of non-overlapping 83% confidence intervals.
After reviewing the data from AY22, we attempted to minimize some of the statistical biases we identified. In the second part of our study, we mandated a balanced set of four evaluators (every evaluator interviewed every student) and we developed a set of consistent structured interview questions. The scoring sheet now listed standardized interpretations of each score (i.e., 10 is the best student ever seen. 5 is a typical average student) in attempt to improve distinctions in score and decrease clustering at the high range of scores. The interviewers did not discuss any of the applicants until after scoring was submitted to prevent post-interview biases. We then repeated the above modeling.
The Interrater Reliability (IRR) was calculated in AY22 using a one-way random effects model between average measurements. In AY23, as we had the same raters for all students, we used a two-way mixed effects model. Shapiro Wilk test was used to test normality. IRB exempt status was obtained.
All calculations were performed using Stata 17.0 (College Station, TX).
Results
Table 1 compares the interview structure between AY22 and AY23. Both distributions of scores between AY22 and AY23 were right censored (that is, there was clustering of scores towards the high end) and skewed (median and mean scores differed). Thus, the data is not normally distributed making many statistical tools (ANOVA, t-tests, linear regression) invalid. Our attempts to improve normality were not successful in AY23 as scores still demonstrated clustered in the higher registry to a similar degree.
When examining the mean raw scores, there was minimal differentiation between applicants for either of the academic years due to the wide statistical error (Figure 1). While each student differed from 11±0.1 other students, that difference varied dependent on score. Student’s raw scores were most differentiating at the extremes compared to the large indistinguishable middle group. In fact, there were loosely only three groups of students with most in the middle group. This poor differentiation in raw scores was no different between AY22 and AY23 even with the institution of balanced and structured interviews. Figure 1. The interrater reliability (IRR) was at 0.69 (C.I. 0.50-0.82) suggesting good consistency between the judges.
Correcting using Mixed Effects Model
For AY22, examining our mixed effects logit model, two of the evaluators scored significantly more leniently than the others, one only interviewed ten candidates. Only two evaluators interviewed all candidates (Table 2). All the evaluators had significantly different variances (p<0.0001) in their scoring.
Identifying the leniency and unbalanced interviews as a source of bias we altered our interview structure as described in Methods.
Unlike in AY22, there was no statistical difference in the measurement variance between any of the evaluators and no evaluator was statistically harsher (or more lenient) than the others.
In both years, our mixed model substantially improved the differentiation of student by decreasing error and controlling for interviewer bias. Instead of each student only having an average of 11±1.1 statistically different other students they differed with by score, now, each students had 30±1.0 different students. And while there was still more differentiation at the extremes of score, this was much less pronounced compared to the raw mean scores (Figure 2). When we ranked the scores, our model substantially altered the rank order. Comparing student ranking using the raw and corrected interview score in AY22, corrected scores varied between -8 to +10 positions with 90% (36/40) of candidates having a change in their rank order after adjustment. Interestingly, the difference was less pronounced in AY23 with ranking only varying between -3 to +3 positions with 57% (23/40) of candidates having a change in their rank order after adjustment. Gender, School prestige and USMLE1 score were not significant predictors of interview score.
The R-squared for the AY22 mixed model was 0.70 and the R-squared for the AY23 mixed model was 0.95. This suggests that the process improvement we undertook based on the analysis of AY22 resulted in a substantially more valid scoring for our students.
Discussion
Among a pool of students applying for general surgery residency at a single institution, our study shows that using the uncorrected evaluators impressions results in minimal distinction between any of the candidates except at the extremes of the score range, statistically demonstrating that the interview, in its raw form, cannot be a valuable tool in the resident selection. If the evaluators in a rating system cannot reliably distinguish subjects, there is no value in the process (except, perhaps to attract candidates or eliminate far outliers). Using statistical model, we were able to much better distinguish candidates.
The shortcomings of our initial interview process became obvious to us only after analysis. Substantial sources of scoring error occurred because some evaluators had intrinsically harsher or lenient scoring systems, not all evaluators evaluated all candidates, each evaluator had a different variance in their scoring, the scoring was clustered, and there were differences in the number of interviews per student (Table 3).
Understanding how bias is introduced in an interview is essential to appropriately utilizing this costly, time-intensive, and anxiety-producing process (2). We showed that one substantial factor in our processes’ structure was due to unbalanced measurements. This is where the students have a differing number of interviews, or, more commonly, not every evaluator rates every student. In the former case, differences in measurement variance would result. In the latter case, evaluator biases will not be evenly distributed amongst the entire group of students. This is especially problematic with leniency bias. Leniency (or harshness) bias will unfairly elevate or depress a student’s rating. The use of statistical modeling using mixed effects models is ideal to control for individual evaluator variances and can partially correct for other sources of statistical error (as they account for random effect and missing data.) Mixed models separate the error (variance) between the independent variables (each interviewer) and the random effect (each student). And by controlling for each interviewer (who each has their own tendencies for scoring), we can better measure distinguishing factors from the student. We also observed that the right censoring (or clustering of scores at the high end), which we suspect is common in most interviews. We attempted to improve this clustering in AY23 by defining each score (1-10) with guides although this was only slightly successful.
How a program weighs any part of the student application, including the interview, in the development of a resident rank order list should be commensurate with its accuracy in predicting a successful resident. If a program does not measure the IRR of the evaluators, then the interview might be unduly weighted and generate unreliable results.
Interviews in medical education and other employment interviews have previously been shown to not be predictive of achievement [3]. A striking example occurred at the University of Texas Medical School at Houston. In 1987, Texas state legislators realized that the state was short on physicians. To fix the problem, the legislature required the school to increase the class size from 150 to 200 after the admissions committee had already chosen its preferred 150 students. The 50 students brought into the class were students who had previously received the lowest ranking from the admissions committee. The performance at graduation of initially accepted and initially rejected students was the same (4).
We have learned from this study how to better design the interview process in our institution. We suggest that interviews be independently performed (not in a group), and evaluators should be blinded to others’ impressions. All applicants should have an equal number of interviews and the exact same evaluators. Additionally, evaluators should undergo pre-interview training to self-identify types of bias and standardize the scoring system. Design alone is not enough to overcome the substantial lack of differentiation between any candidate, thoughtful statistical modeling was also needed.
An interview process might be poor at differentiating candidates because the candidates performed equally well in an interview session, or the interviews were poorly designed to measure important differences. Despite the statistical errors that seemingly lead to arbitrary ranking decisions, the current rank system appears, from the standpoint of most programs, to work well. This might be because students that we are selecting from is already highly functioning, educated, motivated and have already overcome substantial barriers in their education. We perceive our current selection process to be excellent because any random group of applicants would likely be excellent. Perhaps there is little additional valuable information that can be obtained from an interview process that is predictive of resident success and the focus should be on truthfully marketing a programs’ attributes to better match the student’s needs.
The most important limitation in this study should be highlighted: We (nor any others to our knowledge) knows what predictive attributes predict who will be an exceptional resident. Those personality characteristics are much more challenging to measure than medical school grades or test scores [5]. This is also a small study from a single institution, but we believe that our interview process is, in essence, like most programs, and thus, the conclusions are generalizable.
Conclusions
A typical residency interview structure is statistically biased and unable to easily differentiate between students. Through process improvement, guided by statistical modeling, we were able to manage many of these biases and substantively improve the validity of the interview process. As the career stakes for each applicant are high and with every program aiming to recruit the best applicant, designing a fair system should be a priority.
References
- NRMP, 2022, Advanced Data Report. https://www.nrmp.org/wp-content/uploads/2022/03/Advance-Data-Tables-2022-FINAL.
- Laszlo Kiraly, Elizabeth Dewey, Karen Brasel,.
- Hawks and Doves: Adjusting for Bias in Residency Interview Scoring, Journal of Surgical Education, Volume 77, Issue 6, 2020, Pages e132-e137,.
- McDaniel, M. A., Whetzel, D. L., Schmidt, F. L., & Maurer, S. D. (1994). The validity of employment interviews: A comprehensive review and meta-analysis. Journal of Applied Psychology, 79(4), 599–616.
- Smith, S R. Medical school and residency performances of students admitted with and without an admission interview. Academic Medicine 66(8):p 474-6, August 1991.
- Stephenson-Famy A, Houmard BS, Oberoi S, Manyak A, Chiang S, Kim S. Use of the Interview in Resident Candidate Selection: A Review of the Literature. J Grad Med Educ. 2015 Dec;7(4):539-48. 5.
Figure 1.
Adjusted and raw interview score shown for each student. Non-overlapping CI are statistically significant. Note smaller CI in mixed model. The X-axis is ordered from lowest adjusted score to highest.
Figure 1.
Adjusted and raw interview score shown for each student. Non-overlapping CI are statistically significant. Note smaller CI in mixed model. The X-axis is ordered from lowest adjusted score to highest.
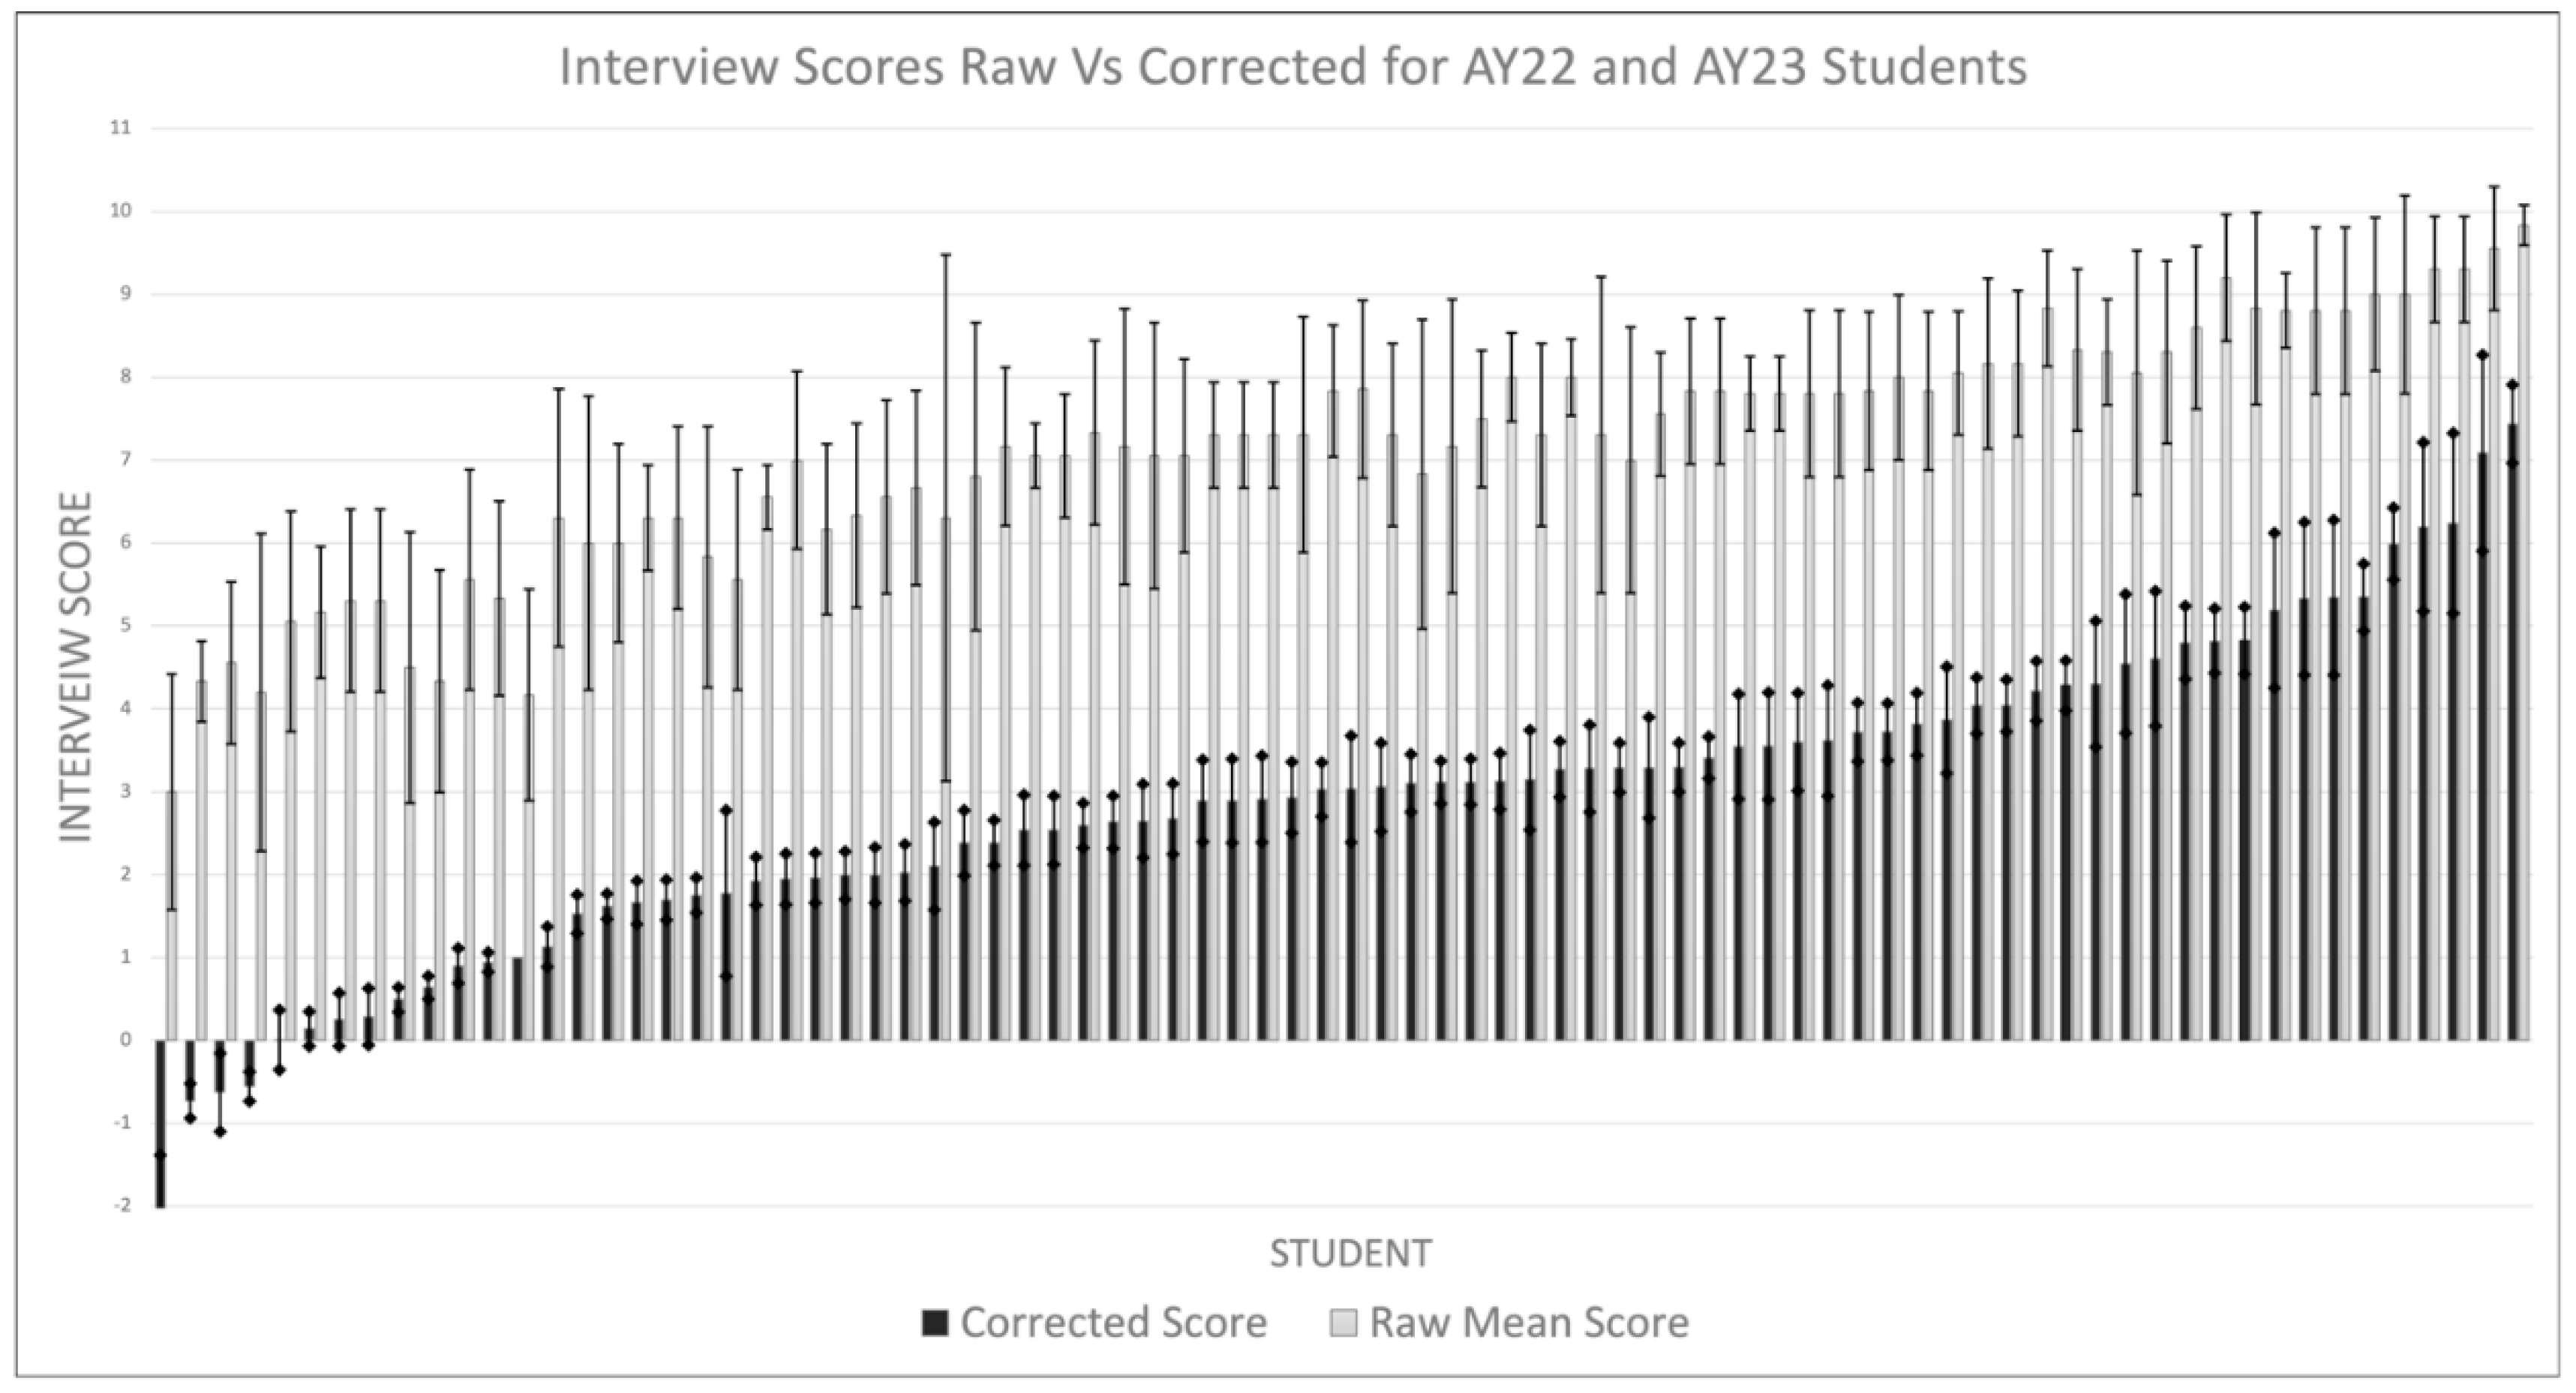
Figure 2.
Raw mean scores resulted in fewer statistically distinct students (average 11.1) from any one student compared to using scores generated from our mixed model (average 30.1). The number of distinct students increases at the extremes of the score range. Using the Mixed Model to generate a score, students are far more distinct from each other compared to using the raw score.
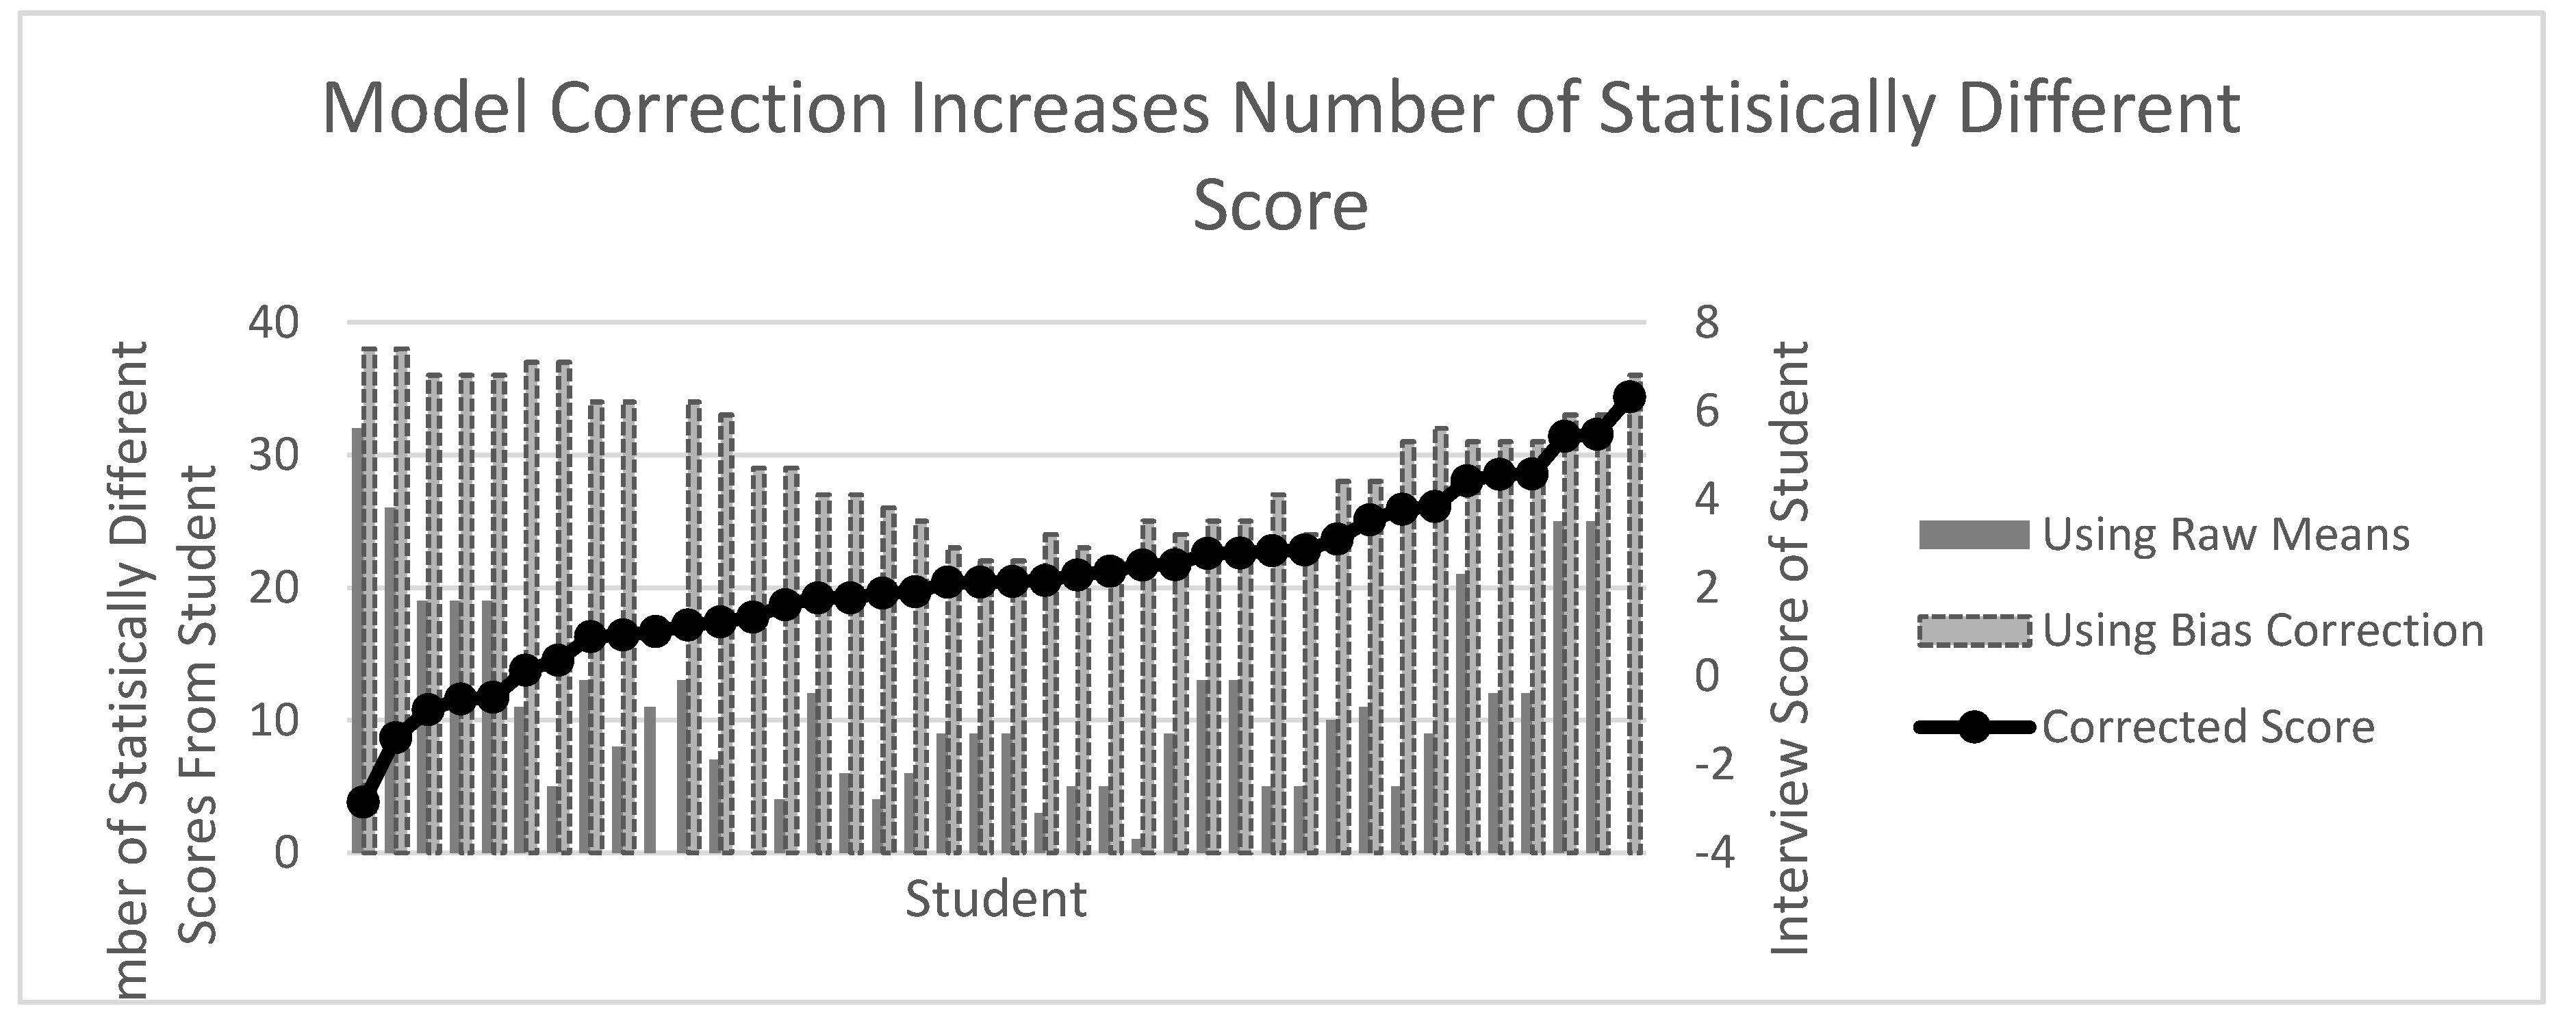

Table 1.
Characteristic of the General Surgery Interview.
| AY22 | AY23 | |
| Applicant Pool | 2300 | 1794 |
| Applicants offered interviews | 43 | 45 |
| Applicants declined interview | 3 | 5 |
| Applicants Interviewed | 40 | 40 |
| Size of Evaluator Pool | 8 | 4 |
| Median # Interviews (range) | 6 [4,5,6] | 4 |
| Structured Interview | No | Yes |
| Scoring Guide | No | Yes |
| Range of interviews performed by each evaluator | 10-40 (mean 30) | 40 |
| Average score | 7.14±2.3(C.I. 6.84-7.43) | 6.84±1.9 (C.I. 6.6-7.1) |
| Median Score | 7.0 | 7.0 |
| Normal Distribution | No (p<0.0001) | No (p=0.01) |
Table 2.
Results from Mixed Ordered Logistic Model.
| Adjusted Parameters | AY22 | AY23 | ||
| Coefficient ± S.E. | P-value | Coefficient ± S.E. | P-value | |
| Gender of Candidate (M v F) | 0.56 ± 0.56 | 0.99 | -0.69 | 0.13 |
| USMLE1 | -0.014 | 0.51 | 0.002 | 0.90 |
| Evaluator as independent predictor of score (#of Interviews AY22,AY23) | ||||
| Evaluator 1 (10,40) | 1 | 1 | ||
| Evaluator 2 (30,40) | 0.51 ± 0.59 | 0.38 | -0.21±0.36 | 0.56 |
| Evaluator 3 (40) | 1.18 ± 0.52 | 0.03 | 0.15±0.38 | 0.69 |
| Evaluator 4 (14,40) | 2.28 ± 0.80 | 0.005 | -0.41±0.47 | 0.38 |
| Evaluator 5 (40,40) | -0.09 ± 0.53 | 0.87 | ||
| Evaluator 6 (30) | -0.66 ± 0.88 | 0.45 | ||
| Evaluator 7 (39) | -0.08 ± 0.56 | 0.89 | ||
| Evaluator 8 (35,40) | -0.49 ± 0.58 | 0.405 | ||
| Lenient vs total evaluators | 2/8 | 0/4 | ||
| Variance Between Evaluators | YES | P<0.0001 | NO | P=0.57 |
Table 3.
.
| SOURCES OF STATISTICAL BIAS ENCOUNTERED |
| -NON-NORMALITY -SKEWED (SIGNIFICANT DEVIATION FROM MEDIAN AND MEAN) -CLUSTERING (GROUPING AT HIGHEST SCORES) -HETEROSKEDASTICITY (LOWER SCORES HAD GREATER DISCORD BETWEEN EVALUATORS) |
| UNBALANCED DATA |
| -UNBALANCED DATA -NOT EVERY EVALUATOR INTERVIEWED EVERY STUDENT -EACH EVALUATOR HAD THEIR OWN VARIANCES IN SCORE -SOME EVALUATORS SCORE SIGNIFICANTLY MORE HARSH OR LENIENT THAN OTHERS -NOT ALL STUDENTS HAD THE SAME NUMBER OF INTERVIEWS |
| REPEATED MEASURES |
| -STANDARD DEVIATION AROUND MEAN -DIFFICULT TO MAINTAIN CONSISTENCY OVER PROLONGED INTERVIEW SEASON -INTERVIEWER FATIGUE RESULTS IN CHANGES IN SCORING OVER THE DAY |
Disclaimer/Publisher’s Note: The statements, opinions and data contained in all publications are solely those of the individual author(s) and contributor(s) and not of MDPI and/or the editor(s). MDPI and/or the editor(s) disclaim responsibility for any injury to people or property resulting from any ideas, methods, instructions or products referred to in the content. |
© 2024 by the authors. Licensee MDPI, Basel, Switzerland. This article is an open access article distributed under the terms and conditions of the Creative Commons Attribution (CC BY) license (http://creativecommons.org/licenses/by/4.0/).
Copyright: This open access article is published under a Creative Commons CC BY 4.0 license, which permit the free download, distribution, and reuse, provided that the author and preprint are cited in any reuse.


