
Submitted:
22 October 2024
Posted:
22 October 2024
You are already at the latest version
Abstract
Background/Objectives: Calculating the radiation dose from CT in 18F-PET/CT examinations poses a significant challenge. The objective of this study is to develop a deep learning-based automated program that standardizes the measurement of radiation doses. Methods: The Torso CT was segmented into six distinct regions using TotalSegmentator. An automated program was employed to extract the necessary information and calculate the effective dose (ED) of PET/CT. The accuracy of our automated program was verified by comparing the EDs calculated by the program with those determined by nuclear medicine physician (n=30). Additionally, we compared the EDs obtained from an older PET/CT scanner with those from a newer PET/CT scanner (n=42). Results: The CT ED calculated by the automated program was not significantly different from that calculated by the nuclear medicine physician (3.67 ± 0.61 mSv and 3.62 ± 0.60 mSv, respectively, p = 0.7623). Similarly, the total ED showed no significant difference between the two calculation methods (8.10 ± 1.40 mSv and 8.05 ± 1.39 mSv, respectively, p = 0.8957). A very strong correlation was observed in both CT ED and total ED between the two measurements (r2 = 0.9981 and 0.9996, respectively). When comparing the older and newer PET/CT scanners, the CT ED was not significantly different. However, the PET ED was significantly lower in the newer scanner than in the older scanner (4.39 ± 0.91 mSv and 6.00 ± 1.17 mSv, respectively, p < 0.0001). Consequently, the total ED was significantly lower in the newer scanner than in the older scanner (8.22 ± 1.53 mSv and 9.65 ± 1.34 mSv, respectively, p < 0.0001). Conclusions: We successfully developed a deep learning-based automated program that calculates the ED of torso 18F-PET/CT, thereby eliminating inter-operator variability.
Keywords:
18F-FDG
; Positron Emission Tomography
; Computed Tomography
; Effective Dose
; Deep Learning
1. Introduction
Medical radiation is the second largest source of radiation exposure, surpassed only by natural background radiation [1]. The repeated use of diagnostic medical imaging procedures that emit ionizing radiation increases the risk of cancers, thereby necessitating proper management [2,3]. In Korea, it has been reported that the estimated population attributable fraction for all cancers due to diagnostic medical procedures is 0.9%, corresponding to 1,915 cancer incidences and 637 cancer-related deaths in 2013 [4].
Positron emission tomography (PET) with 18F-fluorodeoxyglucose (FDG) is a noninvasive diagnostic tool valuable for the staging, management, and prognostication of various malignant tumors [5]. When combined with computed tomography (CT), which provides anatomical localization of lesions, hybrid PET/CT offers superior diagnostic accuracy compared to PET alone. Additionally, 18F-FDG PET/CT has been utilized for cancer screening in healthy volunteers due to its advantage of whole-body coverage and high specificity [6]. PET/CT is one of the sources of medical radiation, with low-dose CT contributing substantially to the overall radiation dose of PET/CT [7,8,9]. The amount of radiopharmaceuticals injected for PET imaging primarily depends on the patient’s weight, resulting in relatively consistent radiation exposure across the institution. In contrast, radiation exposure from CT varies more widely due to multiple factors including tube current, tube voltage, scan range and scan time, ranging from sub-mSv to tens of mSv [10,11,12].
However, calculating the radiation dose from PET/CT is complex, time-consuming and burdensome for nuclear medicine physicians. In particular, calculating the radiation dose from whole-body CT presents a considerable challenge compared to PET, and the results may vary depending on who conducts the calculation and how it is conducted. To the best of our knowledge, no automated PET/CT dose calculation program has yet been developed. Currently, existing methods involve separate CT and PET calculation programs, where radiation doses from these imaging modalities are calculated independently. Moreover, CT dosimetry programs require users to input information manually, demanding significant time and labor [13,14,15,16]. For this reason, hospitals often do not provide information on PET/CT radiation exposure, leaving patients unaware of the amount of radiation they are being exposed to [17,18].
This study aimed to develop an automated program that measures radiation doses from 18F-FDG PET/CT without requiring extensive labor. To address the issue of inter-operator variability during the segmentation of whole-body CT, we incorporated a deep learning model into the automated program.
2. Materials and Methods
2.1. FDG PET/CT Protocol
In this study, 18F-FDG PET/CT imaging was performed using either the Discovery STE PET/CT scanner or the Discovery MI PET/CT scanner, both of which are products of GE Healthcare (Milwaukee, WI, USA). Prior to the PET/CT examination, all participants were required to fast for a minimum of 6 hours. The blood glucose levels of the participants at the time of 18F-FDG injection were maintained below 150 mg/dL.
The imaging protocol began with the acquisition of unenhanced CT images, which spanned from the top of the skull to the upper thigh, encompassing the torso. Immediately after the CT scan, emission torso PET data were acquired. The protocol for the Discovery STE PET/CT scanner was as follows: an 18F-FDG dosage of 5.1 MBq/kg, a frame duration of 180 s in three-dimensional mode, and a matrix size of 128 x 128 for PET. The CT parameters were 120 kV, a rotation of 17.5 mm, a tube rotation time of 0.5 s/rev, an acquisition time of 58.6 s, and a matrix size of 512 x 512. In contrast, the protocol for the Discovery MI PET/CT scanner was slightly different: an 18F-FDG dosage of 4.0 MBq/kg, and a frame duration of 90 s in three-dimensional mode for PET. The CT parameters were 120 kV, a rotation of 39.4 mm, and an acquisition time of 50.0 s. CT images from both scanners were acquired using automated tube current modulation mode. The number of CT slices were 263, 299 or 335 slices for the older scanner, and 341, 395 or 449 slices for the newer scanner. The PET images were reconstructed using an ordered-subset expectation-maximization algorithm with 20 subsets and 2 iterations, and the attenuation correction was based on the CT data.
2.2. Collection and Preprocessing of PET/CT Data
CT and PET images of each patient’s torso were retrieved in the Digital Imaging and Communication in Medicine (DICOM) format from the Picture Archiving and Communication System (PACS, INFINITT Healthcare, Seoul, Republic of Korea). To calculate the CT effective dose (ED) via an automated program, the format of the CT images was converted from DICOM to Neuroimaging Informatics Technology Initiative (NIfTI) format. Subsequently, the NIfTI files were used as input for the TotalSegmentator (ver. 2.2.1, available at https://github.com/wasserth/TotalSegmentator) for segmentation, resulting in 117 anatomical structures as output [19]. In addition, CT dose reports were collected to acquire necessary information for the calculation of CT ED, including the Volume Computed Tomography Dose Index (CTDIvol) and Dose Length Product (DLP) of the torso.
2.3. Effective Dose Calculation
Given that torso CT encompasses several organs, each with distinct tissue conversion factors, we initially segmented it into six body parts: the head (from the top of the skull to C1), the neck (from C1 to T1), the chest (from T1 to the hepatic dome), the abdomen (from the hepatic dome to the iliac crest), the pelvis (from the iliac crest to the bottom of the pelvic bones), and the femur (from the bottom of the pelvic bones to the last slice) (Figure 1). The top of the skull was identified as the fourth slice above from the first slice of the brain, rather than the first slice of the head, because the Totalsegmentator occasionally recognized the radius as the skull when a PET/CT was performed with the arm raised. The iliac crest was defined as the first slice of the iliac bone.
The CT ED was defined as the sum of the EDs of each body part, calculated by multiplying the DLP of each body part by its respective conversion factor. The DLP for each body part was determined by multiplying the irradiated length of the body part by CTDIvol. Irradiated length was calculated by dividing the torso DLP by torso CTDIvol. The CT ED (in mSv) can be calculated using the following formulas:
In this study, we opted to use the irradiated length instead of the scan range length. The radiation dose, when calculated using the scan range length, could be underestimated compared to the actual values. This is because the irradiated length tends to be longer than the scan range length when CT images are acquired in a helical rotation [20]. The conversion factors, as adopted from ICRP 103, are as follows: 0.0021 mSv/mGy/cm for the head, 0.0059 mSv/mGy/cm for the neck, 0.014 mSv/mGy/cm for the chest, 0.015 mSv/mGy/cm for the abdomen, 0.015 mSv/mGy/cm for the pelvis, and 0.015 mSv/mGy/cm for the femur [21].
PET ED was defined as the product of the total radionuclide dose and age-specific weighting factor. The PET ED (in mSv) can be calculated using the following formula:
The weighting factors, as adopted from ICRP 128, are as follows: 0.095 mSv/MBq for ages 0 to 1 year, 0.056 mSv/MBq for ages 2 to 5 years, 0.037 mSv/MBq for ages 6 to 10 years, 0.024 mSv/MBq for ages 11 to 15 years, and 0.019 mSv/MBq for ages 16 and older [22]. The ED of PET/CT was calculated by adding the EDs of CT and PET scans.
2.4. Automated Effective Dose Calculation Program
In this study, we have developed a program that automatically calculates the ED of 18F-FDG torso PET/CT scans using a Python script. The inputs for the ED calculation program include CT images (in NIfTI format), PET images (in DICOM format), a dose report (in DICOM format), and anatomical part information from TotalSegmentator (in NIfTI format) for each patient. These inputs were uploaded into a single folder. The program is designed to locate the path and extract the necessary information for ED calculation.
The program utilized the z-axis information from CT images (in NIfTI format) to calculate the total number of slices. It also identified the maximum and minimum values for the brain, C1, T1, liver, and hip, and subsequently calculated the lengths of each body part. To determine the range of the abdomen and the pelvis, the right and left hips were unified as a single entity, referred to as the hip. Information on DLP, CTDIvol, the total dose of radionuclide, and age were obtained from the DICOM tags of dose reports and PET images (Figure 2).
2.5. Verification of the Automated ED Calculation Program
We prepared two datasets to verify the automated ED calculation program. The first dataset comprises 30 consecutive 18F-FDG PET/CT scans performed in March 2024 for preoperative staging of cancers (Group 1). Using this dataset, we compared the EDs of CT and PET/CT images calculated by the automated program with those calculated by a nuclear medicine physician (J-K.Y.).
The second dataset includes 84 paired 18F-FDG PET/CT scans from 42 patients, conducted from April 2023 to April 2024 for either staging or monitoring the therapeutic response of cancers (Group 2). Each pair of PET/CT scans were acquired using different equipment (either older or newer PET/CT scanners) within a one-year period. With this dataset, we evaluated whether there was a significant difference between the older and newer scanners, and investigated the cause of this difference.
2.6. Statistical Analysis
Data are represented as the mean ± standard deviation. The Student’s t-test was employed to compare the CT ED, PET ED and total ED between the nuclear medicine physician and the automated program, and between the older and newer PET/CT scanners. A p-value of less than 0.05 was considered statistically significant. The correlation coefficient (r2) was also determined. Bland-Altman plots were used to display the differences (with a 95% confidence interval) in EDs as calculated by the nuclear medicine physician and the automated program. Maximum allowed differences were calculated as described [23]. Statistical analyses were performed using Medcalc software (ver 22.030, Medcalc Software Ltd., Ostend, Belgium) or RStudio (AGPL ver 3).
3. Results
3.1. Patient Characteristics
The clinical characteristics of the patients in Group 1 (n=30) and Group 2 (n=42) are shown in Table 1. Group 1 consisted of 12 male and 18 female patients, with an average age of 60 ± 11 years. Group 2 comprised 24 male and 18 female patients, with an average age of 60 ± 12 years. The mean body weight was 60.4 ± 12.5 kg for Group 1 and 59.4 ± 11.3 kg for Group 2. In Group 1, lung cancer was the most common disease, accounting for 8 out of 30 patients (26.7%), followed by endometrial cancer, which affected 7 out of 30 patients (23.3%). In Group 2, lymphoma was the most common disease, accounting for 7 out of 42 patients (16.7%) with lung cancer being the second most common, affecting 6 out of 42 patients (14.3%).
In Group 2, 21 patients underwent 18F-FDG PET/CT scans using an older scanner for the initial imaging, followed by a newer scanner for follow-up imaging. The remaining 21 patients underwent the process in reverse order. The mean interval between the initial imaging and follow-up imaging for group 2 was 165 ± 76 days.
3.1. Comparison of PET/CT EDs: Automated Program vs. Nuclear Medicine Physician
Figure 3A illustrates the EDs of CT and PET/CT, comparing the calculations made by the automated program and a nuclear medicine physician. The CT ED calculated by the automated program (3.67 ± 0.61 mSv) was not significantly different from that calculated by the nuclear medicine physician (3.62 ± 0.60 mSv, p = 0.7623). The PET ED was identical for both the automated program and the nuclear medicine physician (4.43 ± 0.86 mSv), as it depends on the injected dose of 18F-FDG and the patient’s age. Similarly, the total ED showed no significant difference between the program and the physician (8.10 ± 1.40 mSv and 8.05 ± 1.39 mSv, respectively, p = 0.8957).
The EDs calculated by the automated program and the nuclear medicine physician showed a very strong correlation (r2 = 0.9981 for CT and r2 = 0.9996 for PET/CT).
Figure 3B illustrates the differences in EDs between the automated program and the nuclear medicine physician. For CT ED, the difference was 0.05, with a limit of agreement (LoA) ranging from -0.01 to 0.11. Similarly, for total ED, the difference was 0.05, with a LoA ranging from -0.01 to 0.11. The maximum allowed differences, calculated from the coefficients of variation of both methods, were 0.23 for CT ED and 0.25 for total ED. One patient exhibited higher CT ED (0.19) and total ED (0.19) than the upper LoA, but both values were within the range of the maximum allowed difference. The other values were within the LoAs for both CT ED and total ED.
3.2. Comparison of PET/CT EDs: Older Scanner vs. Newer Scanner
The average tube currents of CT scanners were 61.1 ± 9.8 mA (ranging from 35.4 to 77.0 mA) for the newer scanner and 66.3 ± 0.7 mA (ranging from 64.1 to 68.2 mA) for the older scanner. The scan lengths were 1099 ± 35 mm for the newer scanner and 1052 ± 42 mm for the older scanner. The injected doses of 18F-FDG were 228.3 ± 45.1 MBq for the newer scanner and 318.6 ± 59.2 MBq for the older scanner.
Figure 4 shows the EDs of CT, PET and PET/CT calculated from both newer and older scanners. The ED for CT was similar between the newer and older scanners (3.65 ± 0.26 mSv and 3.83 ± 0.75 mSv, respectively, p = 0.1667). Using 1 mSv as a cutoff, the CT ED was higher with the newer scanner in four patients (5.30 vs. 2.93 mSv; 5.63 vs. 3.89 mSv; 4.50 vs. 3.33 mSv; and 5.65 vs. 3.92 mSv). In contrast, the CT ED was higher with the older scanner in three patients (2.14 vs. 3.37 mSv; 2.67 vs. 3.89 mSv; and 2.28 vs. 3.40 mSv).
Meanwhile, the PET ED was significantly lower with the newer scanner (4.39 ± 0.91 mSv) compared to the older scanner (6.00 ± 1.17 mSv, p < 0.0001). Consequently, the total ED for PET/CT was also significantly lower with the newer scanner (8.22 ± 1.53 mSv) than with the older scanner (9.65 ± 1.34 mSv, p < 0.0001).
For the 21 patients who underwent PET/CT examinations using the newer scanner followed by the older scanner, the average weight change was –2.4 ± 4.2 kg. The CT ED did not differ significantly between the two examinations (3.96 ± 0.70 mSv for the newer scanner vs. 3.70 ± 0.27 mSv for the older scanner, p = 0.141). However, the PET ED was significantly lower with the newer scanner (4.61 ± 0.95 mSv) compared to the older scanner (6.26 ± 1.29 mSv, p < 0.001). Consequently, the total ED was significantly reduced with the newer scanner (8.58 ± 1.46 mSv) compared to the older scanner (9.96 ± 1.44 mSv, p < 0.001).
In a separate group of 21 patients who initially underwent PET/CT examinations using the older scanner and subsequently the newer scanners, the average weight change was –0.4 ± 3.1 kg. Consistent with the first group, there was no significant difference in the CT ED between the two scanners (3.60 ± 0.25 mSv for the older scanner vs. 3.69 ± 0.79 mSv for the newer scanner, p = 0.638). Similarly, the PET ED showed a significant reduction with the newer scanner (4.18 ± 0.84 mSv) compared to the older scanner (5.73 ± 0.99 mSv, p < 0.001). Consequently, the total ED was significantly lower with the newer scanner (7.87 ± 1.56 mSv) compared to the older scanner (9.34 ± 1.17 mSv, p < 0.001).
4. Discussion
In this study, we successfully developed a program to automate the calculation of the effective radiation dose for torso 18F-FDG PET/CT. While several studies have addressed the calculation of EDs for PET/CT, to the best of our knowledge, this is the first study to automate calculation of ED by using a deep learning model. Our results showed that the EDs of the PET/CT obtained by the automated program were not significantly different from those calculated by a nuclear medicine physician. Additionally, the CT segmentation in this program was standardized using TotalSegmentator-derived anatomic information, thereby eliminating the inter-operator variability.
PET/CT is a significant source of medical radiation exposure. As a hybrid imaging modality that combines both PET and CT, it involves the emission of ionizing radiation, which may lead clinicians or patients to decline PET/CT examinations when evaluating diseases. The PET component follows a highly standardized imaging protocol, where the injected dose of radiopharmaceuticals is determined based on the patient’s age and weight [24]. This standardization facilitates the accurate estimation and control of radiation exposure. In line with our results, the ED from 18F-FDG PET generally remains below 10 mSv per examination [25,26]. Additionally, advancements in technology have further reduced radiation exposure by enhancing the sensitivity of PET without compromising image quality [27].
In contrast, the CT component of PET/CT lacks such strict standardization, making the calculation of radiation exposure from torso or whole-body CT scans more complex and challenging. Two recommended CT imaging protocols include the ‘low-dose, low-resolution’ approach for attenuation correction and rough anatomic localization (low-dose CT) and the ‘higher-dose, higher-resolution’ protocol for diagnostic purposes (diagnostic CT) [24]. Although the specific parameters can vary, consistent with our results, the ED of low-dose CT typically ranges from 1 to 10 mSv, whereas diagnostic CT generally exceeds 10 mSv [25,26]. Importantly, standardized uptake value of PET does not significantly change regardless of the CT protocol used for attenuation correction [25]. However, when PET is combined with diagnostic torso or whole-body CT, the total ED can surpass 20 mSv, requiring careful dosimetry.
Radiation exposure from PET/CT can be calculated in various ways. As demonstrated in our study, one approach involves segmenting the torso into five to six regions and calculating the ED using CTDIvol and DLP values measured by PET workstation in conjunction with tissue conversion factors. Alternatively, radiation exposure can be estimated by inputting CT parameters into dosimetry programs to calculate organ-specific and total radiation doses [8,14,15,16,28,29]. One popular program for this purpose is ‘CT-Expo’, a Microsoft Excel-based computational application [8,13,14]. By inputting patient characteristics (gender, age group; adult, child or baby) and CT parameters (scanner model, scan range, X-ray tube voltage, tube current, rotation time, collimation width, table feed and slice thickness), the program automatically calculates CTDIvol, DLP, and the organ-specific and total EDs of the CT scans. Using ‘CT-Expo’ and tissue conversion factors (ICRP 103), the calculated CT ED for PET/CT scans in group 1 was 2.53 ± 0.39 mSv, which is 30.3% lower than the CT ED calculated by our method. The corresponding total ED was 7.03 ± 1.20 mSv, which is 13.9% lower (raw data are available in supplementary file S1). Although the latter method provides more detailed information by offering EDs for specific organs, it is challenging to obtain individualized radiation exposure estimates as it relies on the standard patient body shapes (for example, 170 cm/70 kg for a man). Additionally, the selection of scanner models is limited, and the division of body parts is arbitrary. Furthermore, CT ED and PET ED are calculated using different programs. In contrast, the program developed in this study automatically extracts the necessary information from image files and calculates CT ED and PET ED simultaneously within seconds. Users only need to convert the files and place them in a designated folder, thereby reducing the time required for ED calculations without increasing the workload. Moreover, our program can obtain scanner-specific and individualized EDs, which correlated well with the values calculated by physicians. Therefore, our program is more practical, as lifetime cancer risk is known to increase with the total accumulated radiation dose.
The simplest method to estimate the ED of whole-body CT is to multiply the DLP by whole-body tissue conversion factor. When applying a conversion factor of 0.0082 mSv/mGy∙cm to group 1 of this study, the estimated CT ED was 2.53 ± 0.41 mSv, which is 31% smaller than the ED calculated by our program but similar to those calculated using ‘CT-Expo’ [30]. Similarly, the total ED estimated using this simplest method is 7.03 ± 1.22 mSv, which is 13% lower than the ED calculated by our program. Conversely, when using a conversion factor of 0.015 mSv/mGy∙cm, the estimated CT ED is 4.63 ± 0.75 mSv, which is 26% higher than the ED calculated by our program [31]. Accordingly, the total ED is 9.13 ± 1.54 mSv, which is 13% higher than the ED calculated by our program. Therefore, using a whole-body tissue conversion factor to estimate CT ED can lead to either underestimation or overestimation of the ED for 18F-FDG PET/CT.
When comparing older and newer PET/CT scanners, the CT ED was not significantly different. The newer CT scanner had a longer scan length (1099 ± 35 mm vs. 1052 ± 42 mm) and a higher number of the CT slices (395 ± 12 vs. 323 ± 19), while the average tube current was lower than that of the older scanner (61.1 ± 9.8 mA vs. 66.3 ± 0.7 mA). In four patients, the CT ED was more than 1 mSv higher with the newer scanner compared to the older scanner, resulting from the higher tube voltage (140 keV vs. 120 keV) [10]. PET/CT technicians increased the tube voltage to accommodate the body shape of these patients. The tube currents for these CT scans were similar between the two scanners. Conversely, in three patients, the CT ED was lower with the newer scanner compared to the older scanner. In these cases, reduced tube currents (35.4, 38.1 and 44.5 mA) contributed to the lower CT ED, where the device automatically adjusted the tube current settings.
The PET ED was significantly lower in the newer scanner compared to the older scanner. The newer PET scanner has higher sensitivity for gamma photons, leading to a significant reduction in the injected dose of 18F-FDG [27]. Additionally, weight changes due to surgery or anti-cancer chemotherapy between the initial and follow-up imaging influenced the difference in PET ED. For the 21 patients who underwent PET/CT scans in the order of older to newer scanners, the PET ED decreased by 3.8% due to a 2.3 kg reduction in weight. In contrast, for the remaining 21 patients who underwent scans in the reverse order, the PET ED decreased by 0.8% due to a 0.4 kg reduction in weight. However, the influence of weight change on the PET ED was relatively small compared to the change in the injected dose. Consequently, the total ED was significantly lower in the newer scanner compared to the older scanner.
A limitation of this automated program is that when PET/CT is performed with the arms raised, TotalSegmentator may incorrectly identify certain anatomical structures. For example, it may mistakenly recognize the radius as the skull and the carpal bones as the C1 vertebra. Consequently, when dividing the torso into body parts, subtle discrepancies can arise between the actual CT ED and the calculated CT ED due to the incorrect segmentation of the head and neck regions. To address this issue, this study set the top of the skull at four slices above the brain. However, attention must be paid to patients’ arm positions, and the segmentation standards should be adjusted in accordance with the protocols of each institution. This study was conducted at a single center; therefore, future multi-center studies are necessary to improve the accuracy of segmentation.
5. Conclusions
In summary, we developed an automated program to measure radiation doses for 18F-FDG PET/CT. Our program effectively reduced inter-operator variability and eased the physician's workload, demonstrating strong correlation with manually calculated ED.
Supplementary Materials
The following supporting information can be downloaded at the website of this paper posted on Preprints.org. File S1: Comparison of the CT EDs among various methods.
Author Contributions
Conceptualization, J.K.Y.; methodology, J.K.Y, Y,J,P and Y.J.E.; software, Y.J.E.; validation, S.J.L., S.L., B.N.P. and Y.S.A.; formal analysis, Y.J.E.; investigation, J.K.Y. and Y.J.E.; data curation, Y.J.E.; writing—original draft preparation, Y.J.E.; writing—review and editing, J.K.Y.; funding acquisition, J.K.Y.
Funding
This work was supported by the National Research Foundation of Korea (NRF) grant funded by the Korea government (MSIT) (No. NRF-2022R1F1A1076500) and ‘Korea Government Grant Program for Education and Research in Medical AI’ through the Korea Health Industry Development Institute (KHIDI), funded by the Korea government (MOE, MOHW).
Institutional Review Board Statement
This study was approved by the institutional review board of Ajou University Hospital (approval no. AJOUIRB-DB-2024-345; approval date: 17 July 2024) and was conducted in accordance with the ethical standards of the 1964 Declaration of Helsinki and its later amendments.
Informed Consent Statement
The institutional review board waived the requirement for informed consent.
Data Availability Statement
A part of the data is available in a supplementary file (S1.docx). The rest of the data is available upon reasonable request, by contacting the corresponding author.
Conflicts of Interest
The authors declare no conflicts of interest.
References
- UNEP. Radiation Effects and Sources. In:UNED ed. What is radiation? What does radiation do to us? Where does radiation come from?; UNSCEAR: 2016; pp. 1-10, 13-17, 27-37.
- Richardson, D.B.; Leuraud, K.; Laurier, D.; Gillies, M.; Haylock, R.; Kelly-Reif, K.; Bertke, S.; Daniels, R.D.; Thierry-Chef, I.; Moissonnier, M.; et al. Cancer mortality after low dose exposure to ionising radiation in workers in France, the United Kingdom, and the United States (INWORKS): cohort study. BMJ 2023, 382, e074520. [Google Scholar] [CrossRef]
- Martin, C.J.; Barnard, M. How much should we be concerned about cumulative effective doses in medical imaging? J Radiol Prot 2022, 42. [Google Scholar] [CrossRef] [PubMed]
- Lim, H.; Choi, J.; Kim, J.H.; Cheong, H.K.; Ha, M. Estimation of Cancer Incidence and Mortality Risks Attributed to Diagnostic Medical Radiation Exposure in Korea, 2013. J Korean Med Sci 2018, 33, e211. [Google Scholar] [CrossRef] [PubMed]
- Hustinx, R.; Benard, F.; Alavi, A. Whole-body FDG-PET imaging in the management of patients with cancer. Semin Nucl Med 2002, 32, 35–46. [Google Scholar] [CrossRef] [PubMed]
- Kojima, S.; Zhou, B.; Teramukai, S.; Hara, A.; Kosaka, N.; Matsuo, Y.; Suzuki, H.; Torigoe, S.; Suzuki, T.; Uno, K.; et al. Cancer screening of healthy volunteers using whole-body 18F-FDG-PET scans: The Nishidai clinic study. Eur J Cancer 2007, 43, 1842–1848. [Google Scholar] [CrossRef]
- Hosono, M.; Takenaka, M.; Monzen, H.; Tamura, M.; Kudo, M.; Nishimura, Y. Cumulative radiation doses from recurrent PET-CT examinations. Br J Radiol 2021, 94, 20210388. [Google Scholar] [CrossRef]
- Kwon, H.W.; Kim, J.P.; Lee, H.J.; Paeng, J.C.; Lee, J.S.; Cheon, G.J.; Lee, D.S.; Chung, J.K.; Kang, K.W. Radiation Dose from Whole-Body F-18 Fluorodeoxyglucose Positron Emission Tomography/Computed Tomography: Nationwide Survey in Korea. J Korean Med Sci 2016, 31 Suppl 1, S69–74. [Google Scholar] [CrossRef]
- Huang, B.; Law, M.W.; Khong, P.L. Whole-body PET/CT scanning: estimation of radiation dose and cancer risk. Radiology 2009, 251, 166–174. [Google Scholar] [CrossRef]
- Elojeimy, S.; Tipnis, S.; Huda, W. Relationship between radiographic techniques (kilovolt and milliampere-second) and CTDI(VOL). Radiat Prot Dosimetry 2010, 141, 43–49. [Google Scholar] [CrossRef]
- Son, H.K.; Lee, S.H.; Nam, S.; Kim, H.J. Radiation dose during CT scan with PET/CT clinical protocols. Ieee Nucl Sci Conf R 2006, 2210–2214. [Google Scholar]
- Adeleye. B.; Chetty.N. Radiation dose from 18F-FDG PET/CT procedures: influence of specific CT model and protocols. Radioprotection 2018, 53, 107–113. [Google Scholar] [CrossRef]
- Inoue, Y.; Nagahara, K.; Inoki, Y.; Hara, T.; Miyatake, H. Clinical evaluation of CT radiation dose in whole-body (18)F-FDG PET/CT in relation to scout imaging direction and arm position. Ann Nucl Med 2019, 33, 169–176. [Google Scholar] [CrossRef] [PubMed]
- Inoue, Y.; Nagahara, K.; Tanaka, Y.; Miyatake, H.; Hata, H.; Hara, T. Methods of CT Dose Estimation in Whole-Body (1)(8)F-FDG PET/CT. J Nucl Med 2015, 56, 695–700. [Google Scholar] [CrossRef] [PubMed]
- Quinn, B.; Dauer, Z.; Pandit-Taskar, N.; Schoder, H.; Dauer, L.T. Radiation dosimetry of 18F-FDG PET/CT: incorporating exam-specific parameters in dose estimates. BMC Med Imaging 2016, 16, 41. [Google Scholar] [CrossRef] [PubMed]
- Quinn, B.M.; Gao, Y.; Mahmood, U.; Pandit-Taskar, N.; Behr, G.; Zanzonico, P.; Dauer, L.T. Patient-adapted organ absorbed dose and effective dose estimates in pediatric 18F-FDG positron emission tomography/computed tomography studies. BMC Med Imaging 2020, 20, 9. [Google Scholar] [CrossRef]
- Ribeiro, A.S.F.; Husson, O.; Drey, N.; Murray, I.; May, K.; Thurston, J.; Oyen, W.J.G. Radiation exposure awareness from patients undergoing nuclear medicine diagnostic 99mTc-MDP bone scans and 2-deoxy-2-(18F) fluoro-D-glucose PET/computed tomography scans. Nucl Med Commun 2020, 41, 582–588. [Google Scholar] [CrossRef]
- Ukkola, L.; Oikarinen, H.; Henner, A.; Haapea, M.; Tervonen, O. Patient information regarding medical radiation exposure is inadequate: Patients' experience in a university hospital. Radiography (Lond) 2017, 23, e114–e119. [Google Scholar] [CrossRef]
- Wasserthal, J.; Breit, H.C.; Meyer, M.T.; Pradella, M.; Hinck, D.; Sauter, A.W.; Heye, T.; Boll, D.T.; Cyriac, J.; Yang, S.; et al. TotalSegmentator: Robust Segmentation of 104 Anatomic Structures in CT Images. Radiol Artif Intell 2023, 5, e230024. [Google Scholar] [CrossRef]
- Christner, J.A.; Kofler, J.M.; McCollough, C.H. Estimating effective dose for CT using dose-length product compared with using organ doses: consequences of adopting International Commission on Radiological Protection publication 103 or dual-energy scanning. AJR Am J Roentgenol 2010, 194, 881–889. [Google Scholar] [CrossRef]
- Valentin, J.; International Commission on Radiation, P. The 2007 Recommendations of the International Commission on Radiological Protection. ICRP Publication 103. Ann ICRP 2007, 37, 2–4. [Google Scholar] [CrossRef]
- Mattsson, S.; Johansson, L.; Leide Svegborn, S.; Liniecki, J.; Nosske, D.; Riklund, K.A.; Stabin, M.; Taylor, D.; Bolch, W.; Carlsson, S.; et al. Radiation Dose to Patients from Radiopharmaceuticals: a Compendium of Current Information Related to Frequently Used Substances. Ann ICRP 2015, 44, 7–321. [Google Scholar] [CrossRef] [PubMed]
- Jensen, A; M., K.-H. Diagnostic test validation. In Schalm's Veterinary Hematology; Wiley-Blackwell, 2011.
- Vali, R.; Alessio, A.; Balza, R.; Borgwardt, L.; Bar-Sever, Z.; Czachowski, M.; Jehanno, N.; Kurch, L.; Pandit-Taskar, N.; Parisi, M.; et al. SNMMI Procedure Standard/EANM Practice Guideline on Pediatric (18)F-FDG PET/CT for Oncology 1.0. J Nucl Med 2021, 62, 99–110. [Google Scholar] [CrossRef] [PubMed]
- Ferrara D; Shiyam Sundar LK; Chalampalakis Z; Geist BK; Gompelmann D; Gutschmayer S; Hacker M; Kertész H; Kluge K; Idzko M; et al. Low-dose and standard-dose whole-body [18F]FDG-PET/CT imaging: implications for healthy controls and lung cancer patients. Front Phys 2024, 12, 1378521. [Google Scholar] [CrossRef]
- Brix, G.; Lechel, U.; Glatting, G.; Ziegler, S.I.; Munzing, W.; Muller, S.P.; Beyer, T. Radiation exposure of patients undergoing whole-body dual-modality 18F-FDG PET/CT examinations. J Nucl Med 2005, 46, 608–613. [Google Scholar]
- Alberts, I.; Sachpekidis, C.; Prenosil, G.; Viscione, M.; Bohn, K.P.; Mingels, C.; Shi, K.; Ashar-Oromieh, A.; Rominger, A. Digital PET/CT allows for shorter acquisition protocols or reduced radiopharmaceutical dose in [(18)F]-FDG PET/CT. Ann Nucl Med 2021, 35, 485–492. [Google Scholar] [CrossRef]
- Hemke, R.; Yang, K.; Husseini, J.; Bredella, M.A.; Simeone, F.J. Organ dose and total effective dose of whole-body CT in multiple myeloma patients. Skeletal Radiol 2020, 49, 549–554. [Google Scholar] [CrossRef]
- Jallow, N.; Christian, P.; Sunderland, J.; Graham, M.; Hoffman, J.M.; Nye, J.A. Diagnostic Reference Levels of CT Radiation Dose in Whole-Body PET/CT. J Nucl Med 2016, 57, 238–241. [Google Scholar] [CrossRef]
- Baldi, D.; Tramontano, L.; Alfano, V.; Punzo, B.; Cavaliere, C.; Salvatore, M. Whole Body Low Dose Computed Tomography Using Third-Generation Dual-Source Multidetector With Spectral Shaping: Protocol Optimization and Literature Review. Dose Response 2020, 18, 1559325820973131. [Google Scholar] [CrossRef]
- Kopp, M.; Loewe, T.; Wuest, W.; Brand, M.; Wetzl, M.; Nitsch, W.; Schmidt, D.; Beck, M.; Schmidt, B.; Uder, M.; et al. Individual Calculation of Effective Dose and Risk of Malignancy Based on Monte Carlo Simulations after Whole Body Computed Tomography. Sci Rep 2020, 10, 9475. [Google Scholar] [CrossRef]
Figure 1.
Reference images used for segmenting the torso into six body parts. (a) Top of the skull (b) C1 (c) T1 (d) hepatic dome (e) iliac crest (f) bottom of the pelvic bones.
Figure 1.
Reference images used for segmenting the torso into six body parts. (a) Top of the skull (b) C1 (c) T1 (d) hepatic dome (e) iliac crest (f) bottom of the pelvic bones.
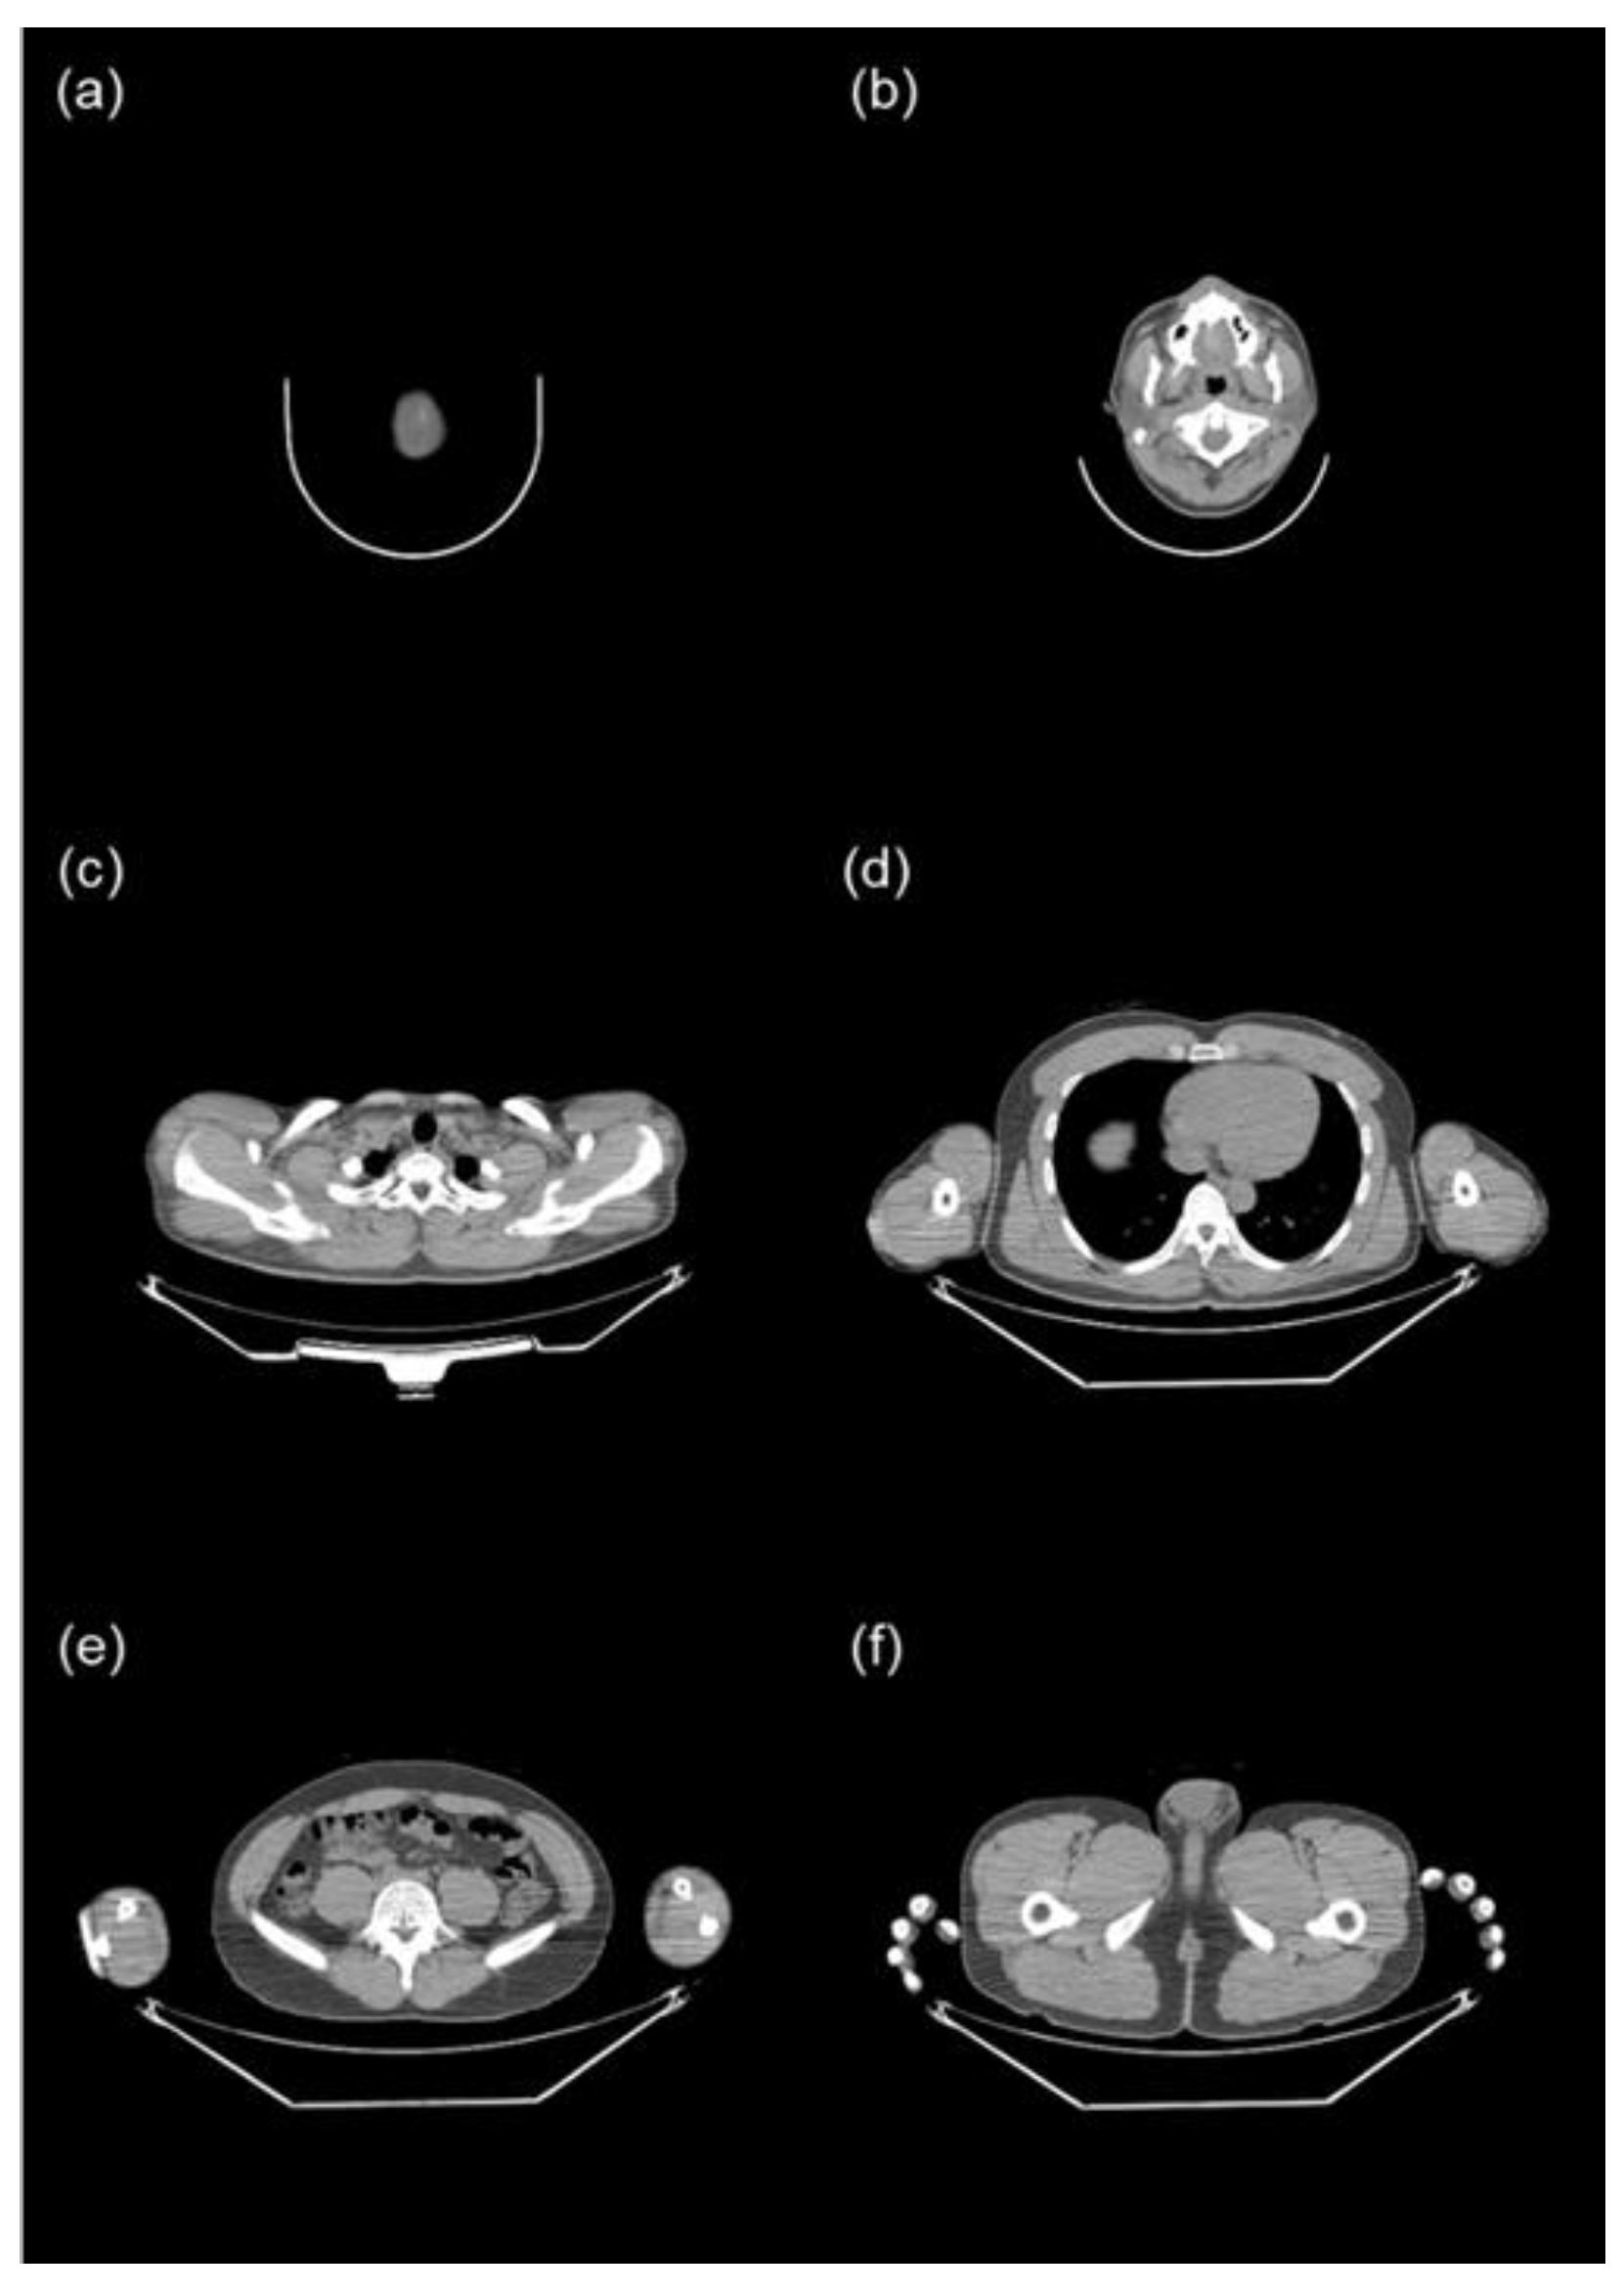
Figure 2.
The diagram of the automated ED calculation program for 18F-FDG PET/CT.
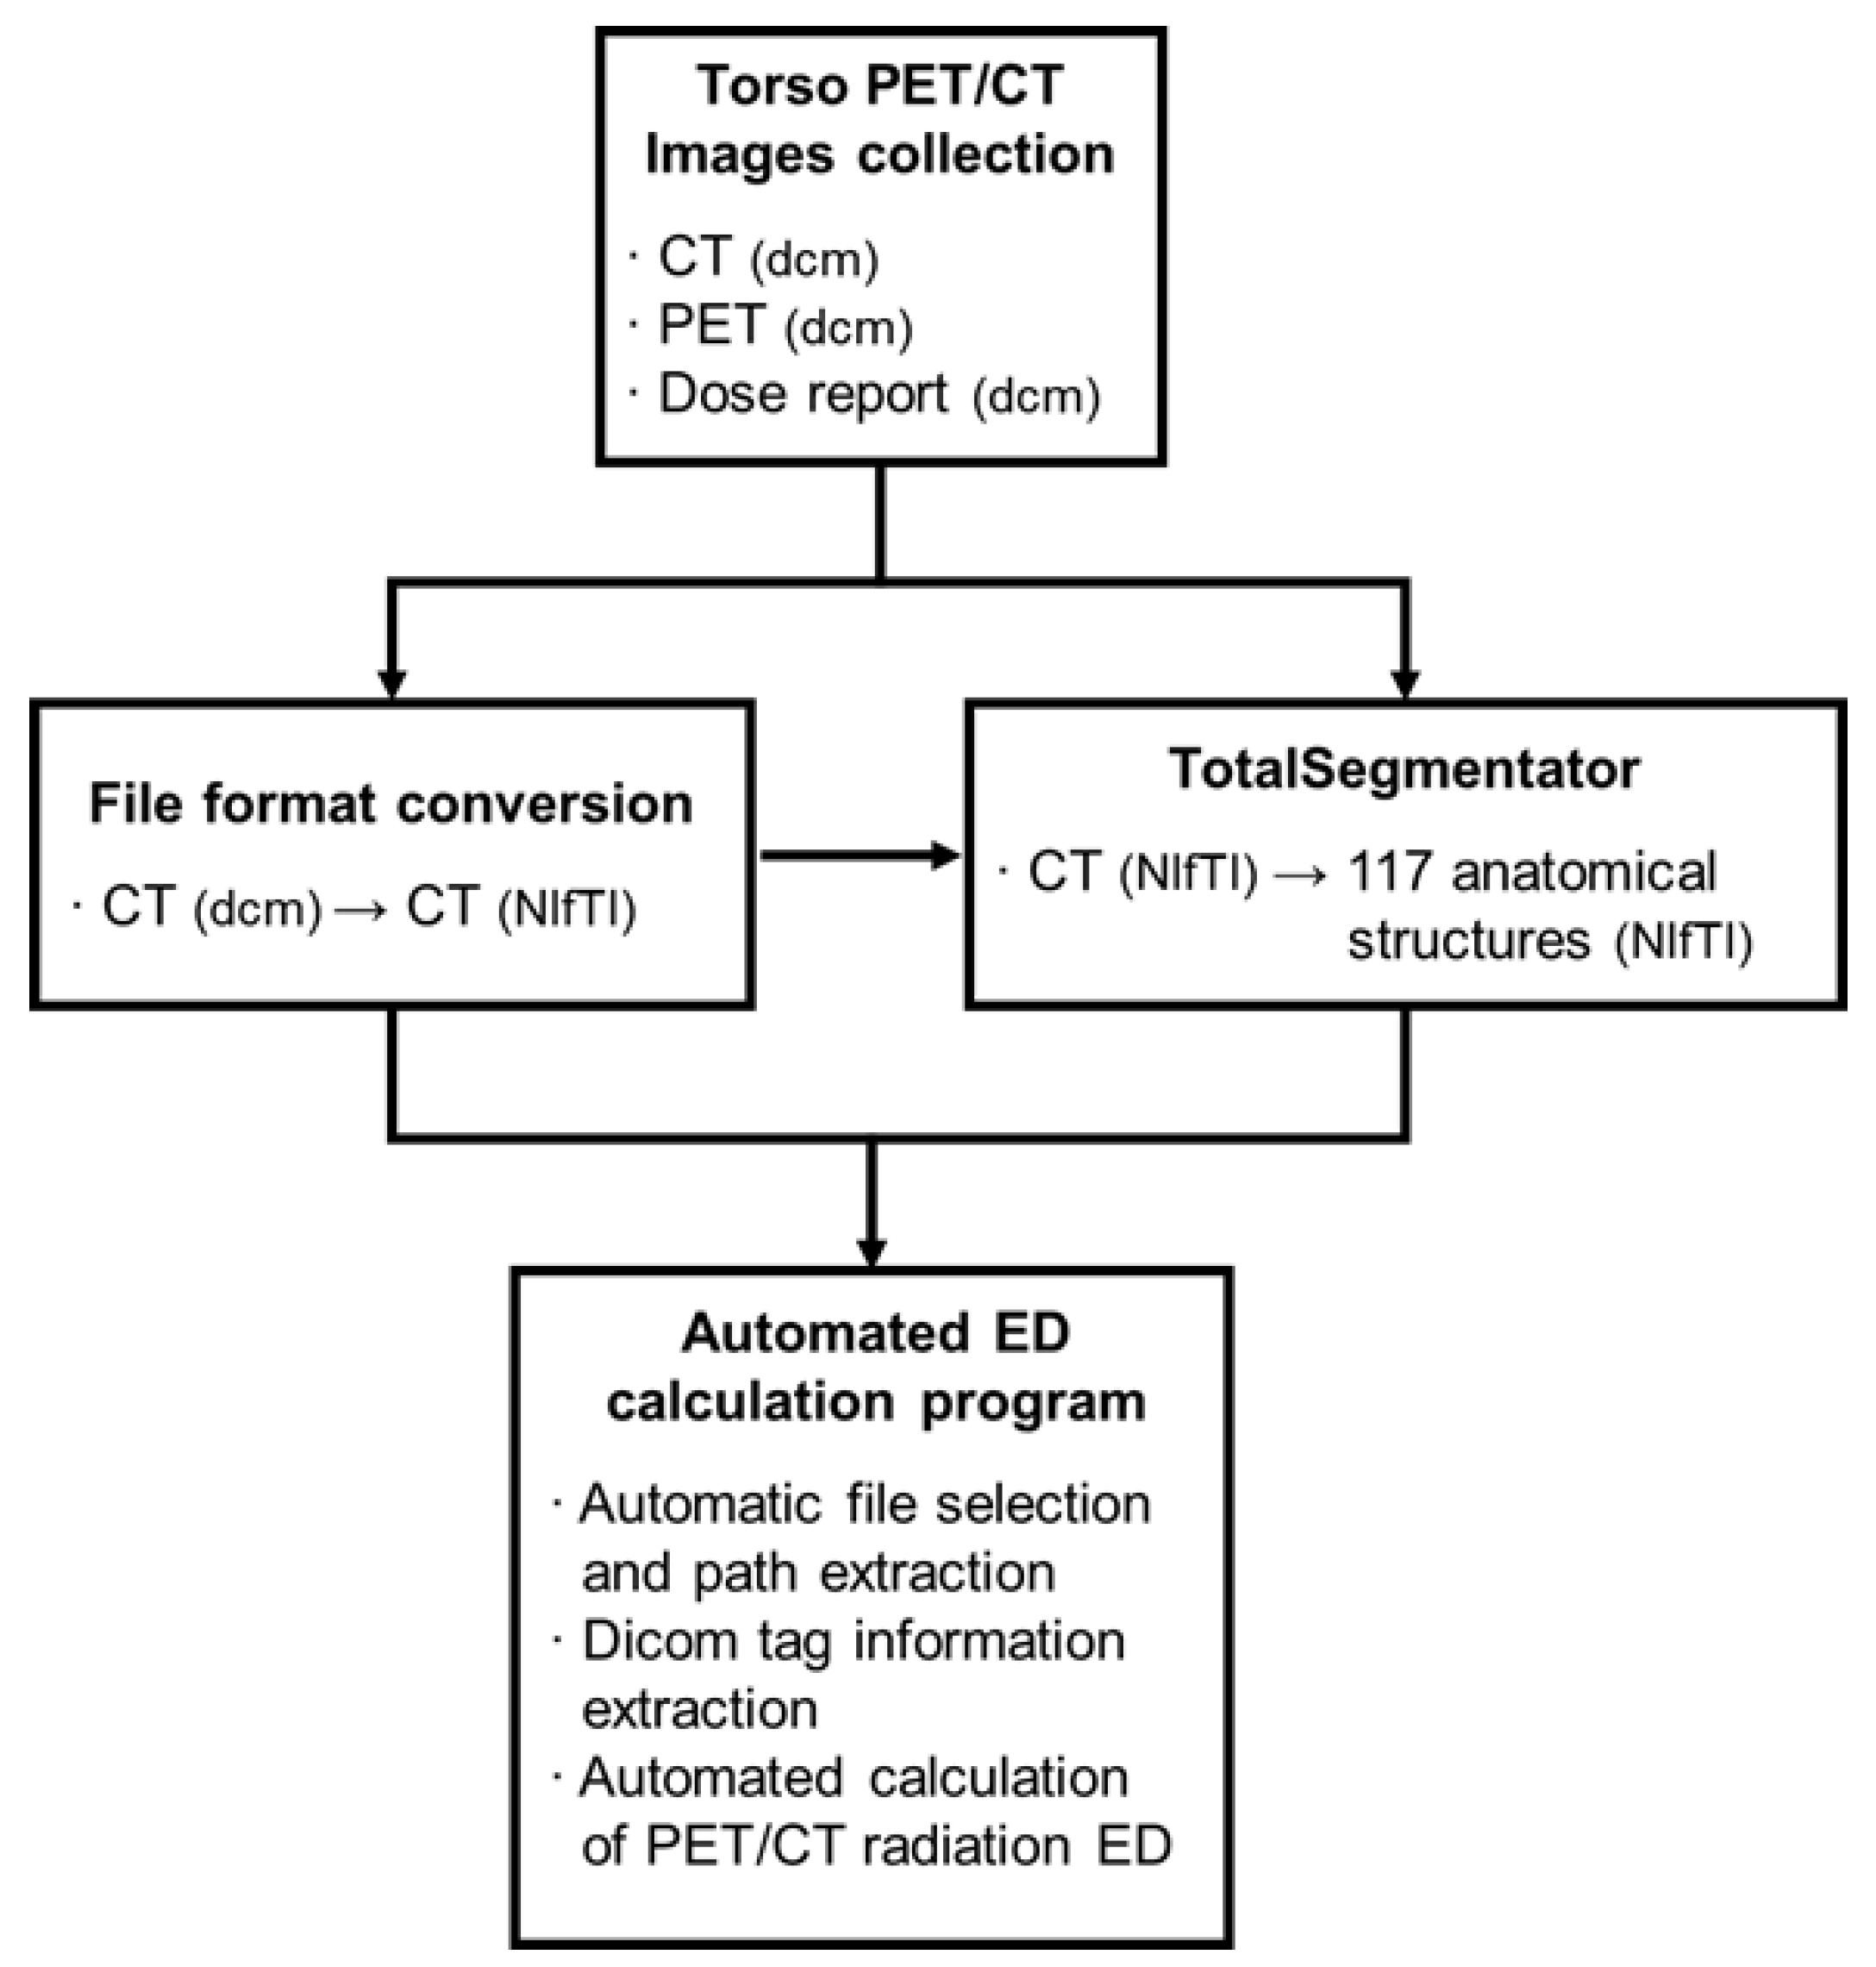
Figure 3.
A. Box and whisker plots of effective doses for CT and PET/CT (total) calculated by the automated program and a nuclear medicine physician.
Figure 3.
A. Box and whisker plots of effective doses for CT and PET/CT (total) calculated by the automated program and a nuclear medicine physician.
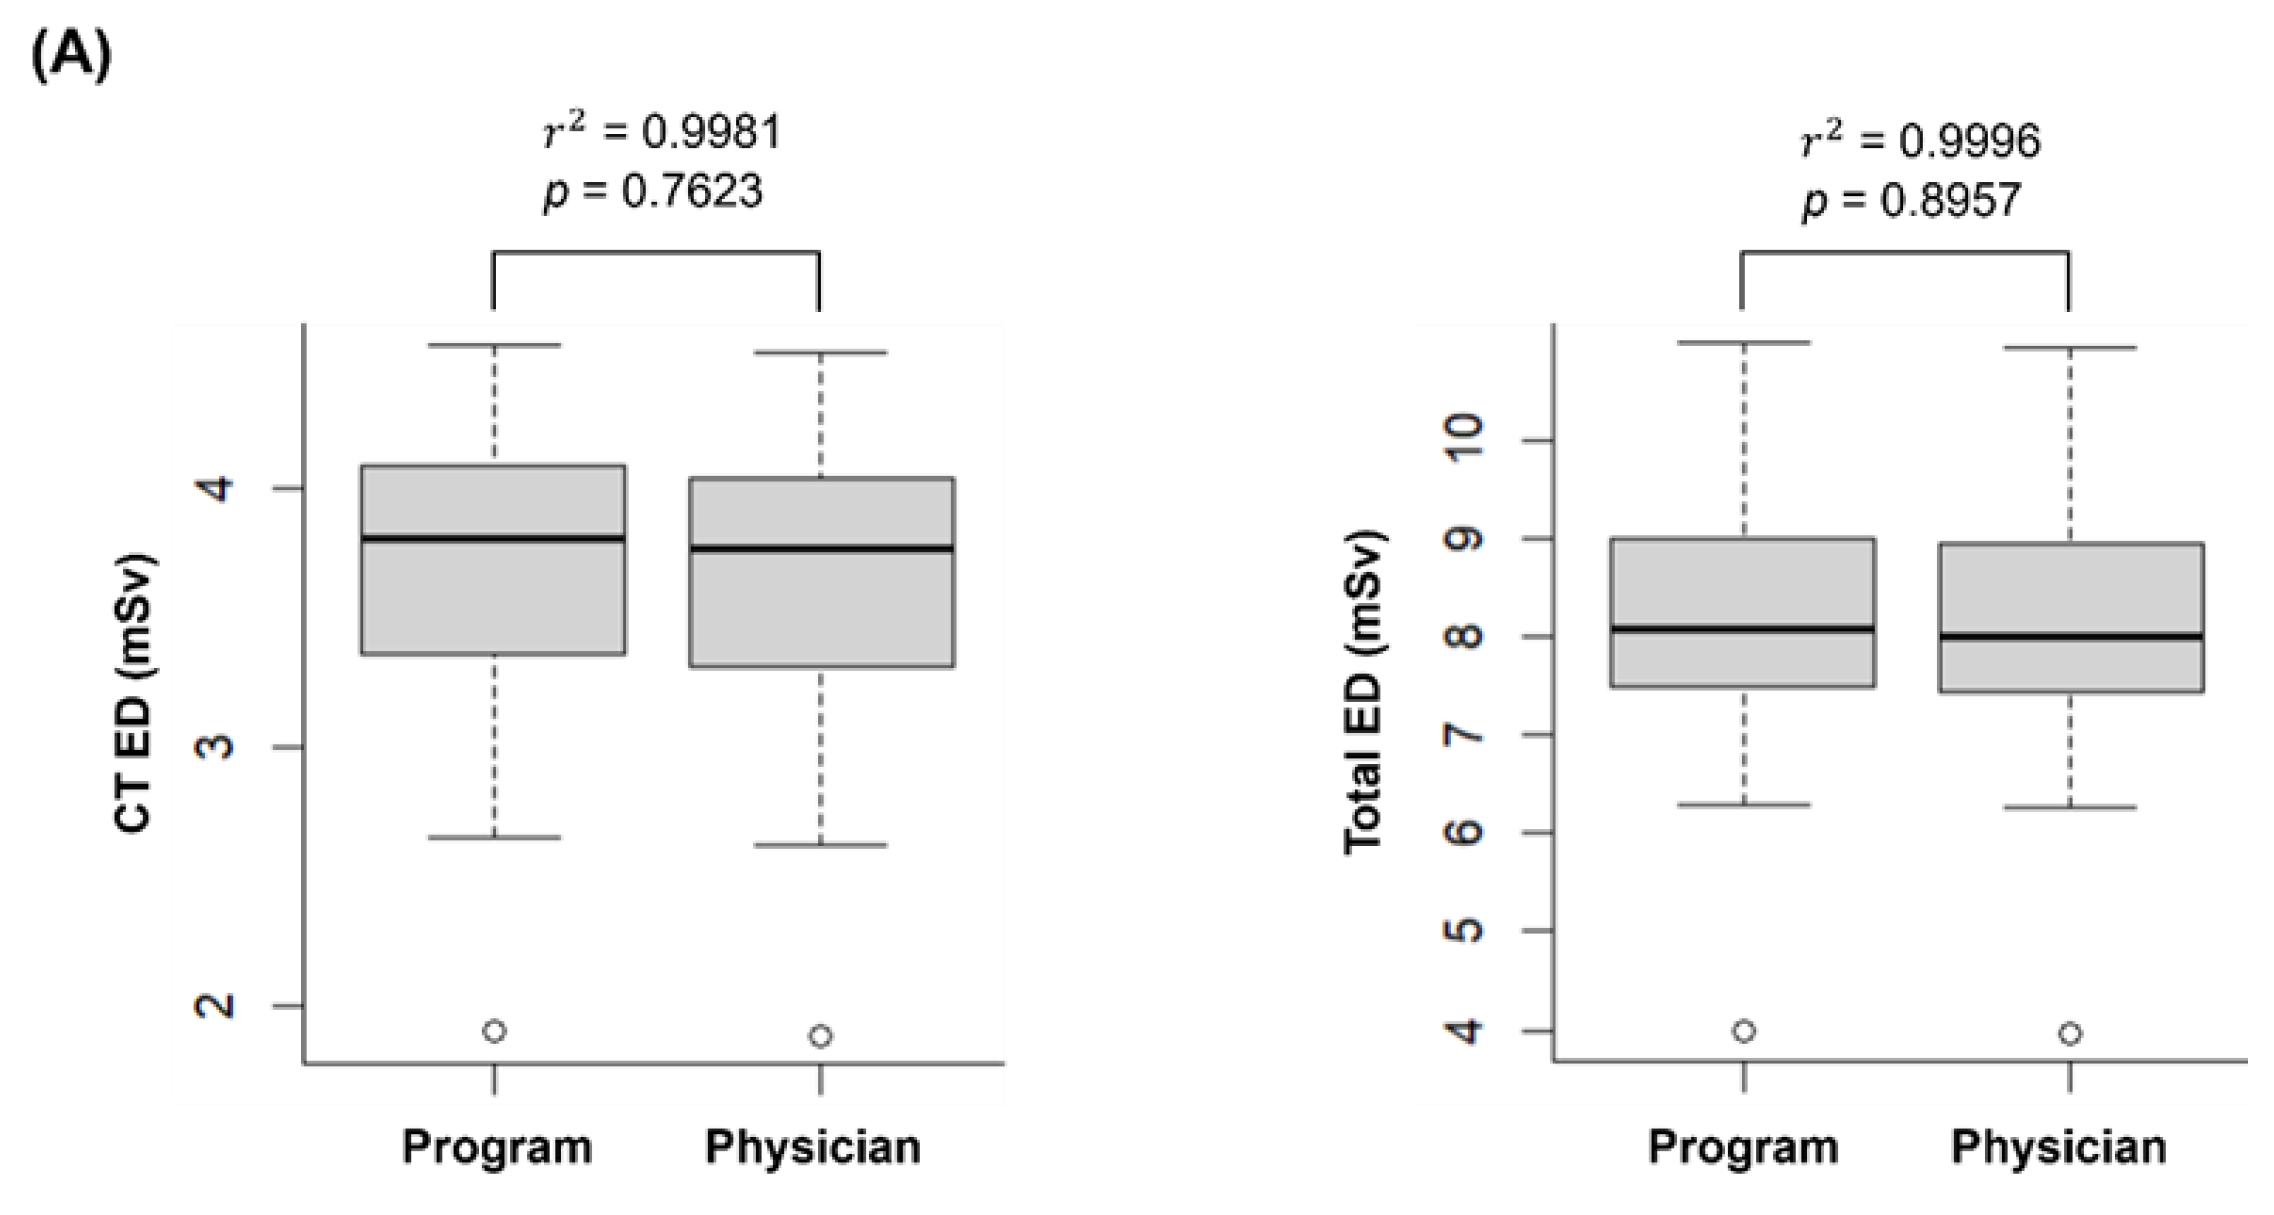
Figure 3.
B. Bland-Altman plots for the differences in effective doses of CT and PET/CT (total) calculated by the automated program and a nuclear medicine physician; MAD, maximum allowed difference.
Figure 3.
B. Bland-Altman plots for the differences in effective doses of CT and PET/CT (total) calculated by the automated program and a nuclear medicine physician; MAD, maximum allowed difference.
Figure 4.
Box and whisker plots of effective doses for CT, PET, and PET/CT (total) from newer and older scanners.
Figure 4.
Box and whisker plots of effective doses for CT, PET, and PET/CT (total) from newer and older scanners.
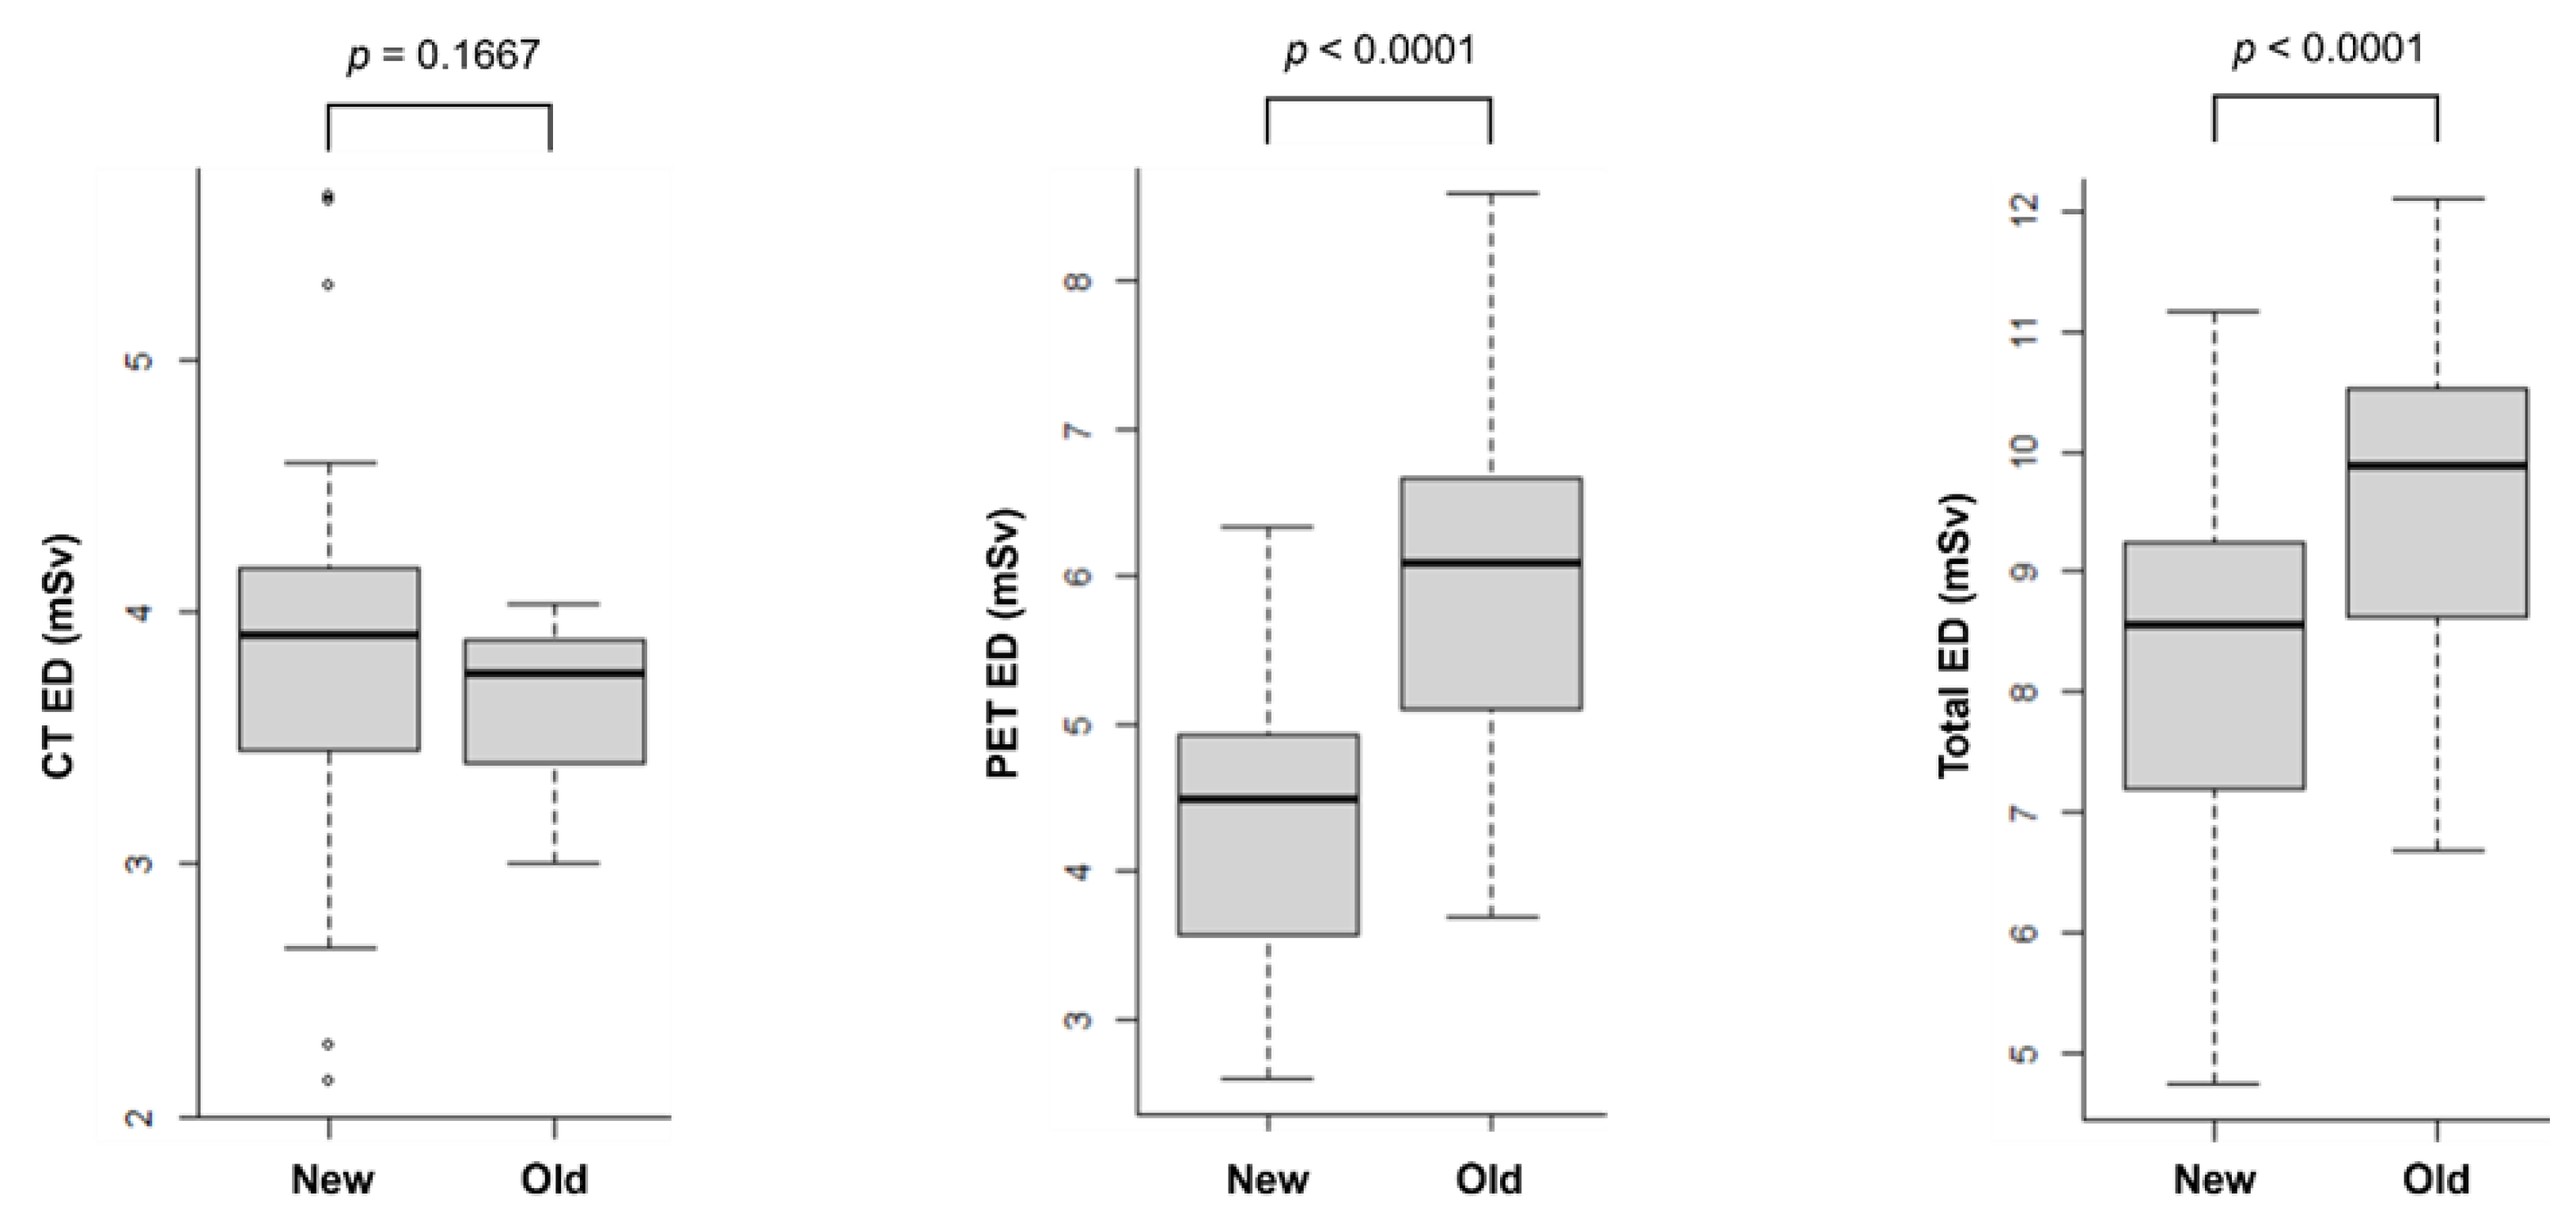

Table 1.
Clinical characteristics of patients.
| Number of patients (%) | Mean ± SD | ||
| Group 1 (n = 30) | |||
| Age (years) | 60 ± 11 | ||
| Sex | Male:female | 12:18 (40.0:60.0) | |
| Weight (kg) | 60.4 ± 12.5 | ||
| Type of Cancers | Lung | 8 (26.7) | |
| Endometrial | 7 (23.3) | ||
| Esophageal | 3 (10.0) | ||
| Ovary | 3 (10.0) | ||
| Renal cell | 2 (6.7) | ||
| Breast | 1 (3.3) | ||
| Cervix | 1 (3.3) | ||
| Colon | 1 (3.3) | ||
| Lymphoma | 1 (3.3) | ||
| Nasal | 1 (3.3) | ||
| Rectal | 1 (3.3) | ||
| Vocal cord | 1 (3.3) | ||
| Group 2 (n = 42) | |||
| Age (years) | 60 ± 12 | ||
| Sex | Male:female | 24:18 (57.1:42.9) | |
| Weight (kg) | 59.4 ± 11.3 | ||
| Type of Cancers | Lymphoma | 7 (16.7) | |
| Lung | 6 (14.3) | ||
| Stomach | 5 (11.9) | ||
| Breast | 4 (9.5) | ||
| Rectal | 3 (7.1) | ||
| Renal cell | 3 (7.1) | ||
| Cervix | 2 (4.8) | ||
| Colon | 2 (4.8) | ||
| Pancreatic | 2 (4.8) | ||
| Prostate | 2 (4.8) | ||
| AoV | 1 (2.4) | ||
| Esophageal | 1 (2.4) | ||
| GB | 1 (2.4) | ||
| Head & Neck | 1 (2.4) | ||
| Klatskin | 1 (2.4) | ||
| Ovary | 1 (2.4) |
Abbreviations: SD, standard deviation; AoV, Ampulla of Vater; GB, Gallbladder.
Disclaimer/Publisher’s Note: The statements, opinions and data contained in all publications are solely those of the individual author(s) and contributor(s) and not of MDPI and/or the editor(s). MDPI and/or the editor(s) disclaim responsibility for any injury to people or property resulting from any ideas, methods, instructions or products referred to in the content. |
© 2024 by the authors. Licensee MDPI, Basel, Switzerland. This article is an open access article distributed under the terms and conditions of the Creative Commons Attribution (CC BY) license (http://creativecommons.org/licenses/by/4.0/).
Copyright: This open access article is published under a Creative Commons CC BY 4.0 license, which permit the free download, distribution, and reuse, provided that the author and preprint are cited in any reuse.


