Submitted:
21 October 2024
Posted:
21 October 2024
You are already at the latest version
Abstract
This study investigates student performance with the aim to forecast students' academic outcomes using data analytics and machine learning techniques. There is a big drop out per cent especially in the technological study programs at the universities, however, focusing on the successful study process there is important to analyze and to predict some risks on students’ to assure low dropout percent. While Student Performance Prediction (SPP) has potential benefits, such as personalized learning and early interventions, several challenges make the task complex in relation to (1) data quality and availability and (2) incomplete and inconsistent data. Predicting performance requires a range of different data types: academic records, attendance, and engagement in class, socio-economic background, and even behavioral factors. Moreover, according to the fourth Sustainable Development Goal (SDG) we focus on the quality in education.This paper presents a case study of data mining method for SPP by using classification, regression, and clustering are generally used in education to predict student’s performance which is important to control drop out of studies percent. The case presented is to predict risks and to assure academic success and quality based on the CRISP-DM data mining.
Keywords:
educational data mining
; prediction
; academic success
; student performance
; SDG
1. Introduction
This study presents data mining in engineering study program as a modern data analysis process that provides the opportunity to extract useful information from the accumulated data, suitable for the management of the analyzed activity, problem analysis, decision-making, prediction, etc. The emergence of data mining was driven by the imperfection of classical statistical methods and advances in artificial intelligence and machine learning. This method resembles statistics as statistics and data mining are data analysis-oriented processes that require the organization of "raw" data, but it should also be noted that data mining should not be equated with statistics. Statistics usually applies to primary data analysis and data research to secondary data analysis [1]. According to [2], data mining can be viewed as a set of methods and procedures designed to analyze large data stored in various databases, such as transfer transactions, scientific research data, personal health data, videos and photos, data recorded by satellites, etc.
Data mining techniques that help to extract and analyze large amounts of data in educational sectors to improve teaching and learning processes are called educational data mining [3]. Educational data mining (EDM) is defined as the extraction of new information from large educational data collected in the educational environment and stored in educational databases [4]. EDM is an area of study focusing on the use of techniques such as data mining, machine learning, and statistical analysis to extract meaningful information from complex datasets [5]. EDM includes processes such as collecting data, applying models to describe those data, or obtaining useful information about students.
This study use educational data mining as useful for understanding student learning behavior to develop teaching strategies that improve student performance and reduce dropout rates [3]. Another area closely related to educational data mining is learning analytics (LA).
Both EDM and LA are interdisciplinary fields including data retrieval, visual data analysis, domain-based data mining, social sciences, psychology and cognitive science, etc. The authors [4] define these two fields as a combination of computer science, education, and statistics (see Figure 1).
Different methods such as classification, regression, and clustering are generally used in educational data mining [6, 7]. The method of association rules, the method of sequencing research, and the method of data visualization can also be applied, which allows displaying the data understandably and clearly (see Figure 2).
Prediction techniques used to predict the probability that learners will pass/fail an exam or complete/fail a module, course, or study. In this case, a classification method can be used [8]. A linear regression method is used to predict the academic performance of learners [9]. Clustering methods determine which learning materials should be improved and which learning materials learners should choose when preparing for exams [10]. J. Chen and J. Zhao [11] use the data of the learners' learning process and apply the association rule method to determine which learning habits help in learning English. Finding sequential patterns can be applied to define patterns of learner behavior that lead to a particular learning outcome [12]. Data visualization can be used to show how quickly certain learning material is learned and to help understand learner learning patterns, outcomes, etc. [13]. It is also possible to use multiple models, such as first applying clustering to group learners and then using classification to predict learner achievement [14].
Student performance can be predicted through interaction with learners, surveys and assessments, and educational data mining [15, 16]. In literature [7, 17], academic success is defined as a multidimensional concept that includes academic achievements, involvement in the learning process, the satisfaction experienced during learning, acquired competencies and skills during learning, overcoming learning difficulties, a continuation of learning, favorable professional career development, and achievement of learning goals. Communication or assessment activities in studies can be organized and implemented in a virtual learning environment, such as Moodle, Google Classroom, or others. It can also be mentioned that students with high academic self-efficacy get better grades and graduate successfully, so academic self-efficacy is considered one of the most important psychological characteristics that predict academic success [18, 19]. In other words, academic self-efficacy and learning achievements in academic activities are closely related [20].
Various learner data are analyzed (learner actions in the virtual learning environment, answers to psychological surveys, demographic characteristics, etc.) and information is sought about the risk of academic failure in predicting the academic success of learners. The authors [21, 22] distinguish two main types of data that are used to predict academic success: 1) administrative data; 2) learning process data. The most valuable information in educational data mining is obtained when the educational datasets under study contain both types of data.
This paper aims to provide a case on predicting learners' academic success by applying educational data mining methods to reduce student dropout in the future.
2. Literature Review
The authors [23, 24] recommend using the data mining model CRISP-DM (Cross Industry Standard Process for Data Mining) [25] when predicting the academic success of learners. According to this model, forecasting is carried out in sequential steps: business understanding, data understanding, data preparation, modelling, evaluation, and implementation. The effective implementation of these steps ensures the quality and integrity of the mining process and minimizes the chance of errors.
Qiu et al. [26] use classification methods for prediction and propose the e-learning performance prediction framework based on behavior classification. This system includes learning behavioral feature selection and incorporating behavioral data through feature fusion using a behavioral classification model. This process generates feature values for each behavior type category, which are then used in a machine learning-based predictor of student performance. The authors state that such a method is better than traditional classification methods.
Shreem et al. [27] present an innovative hybrid selection mechanism to predict student performance. The proposed model is a hybridization between a binary genetic algorithm, an electromagnetic-like mechanism, and k-means algorithms. The results presented demonstrate the ability of the proposed method to improve the performance of the binary genetic algorithm and the performance of all classifiers.
Baashar et al. [28] analyzed the use of artificial neural networks to predict student performance. The findings showed that the use of artificial neural networks in combination with data analysis and data mining techniques is common practice and allows researchers to evaluate the effectiveness of their findings in assessing academic achievement. The authors noted that artificial neural networks demonstrated high accuracy in predicting academic achievement outcomes. However, they acknowledge that comparable results were achieved using other data mining methods. Furthermore, it was observed that the use of different data mining methods did not significantly increase the accuracy of the predictions.
Cruz-Jesus et al. [29] use artificial intelligence to predict academic achievement. The researchers use methods such as artificial neural networks, decision trees, extremely randomized trees, random forests, support vector machines, and k-nearest neighbours. In estimating each model, data from the beginning of each academic year were used as independent variables, and the dependent variable corresponded to the end of the year. The authors conclude that artificial intelligence methods reveal better performance compared to traditional approaches.
Yağcı [30] uses three specific parameters for prediction: mid-term exam grades, department details, and faculty details. The article highlights the importance of data-driven studies in the development of a learning analytics framework within higher education, highlighting their contribution to decision-making processes.
Beckham et al. [31] use Pearson's correlation to determine which factors influence student performance and experimented with several machine learning techniques. The authors found that students are more likely to fail when they have previous failures, and another factor is the age of the student, etc., older students fail more often than younger students.
Göktepe Yıldız and Göktepe Körpeoğlu [32] explore the use of an adaptive neuro-fuzzy inference system, to model students' perceptions of problem-solving skills based on their creative problem-solving characteristics. The findings indicated that this approach can accurately predict students' perceptions of problem-solving skills and reveals a significant relationship between problem-solving talents and creative problem-solving features.
Some authors [33, 20] emphasize that self-efficacy is one of the most important elements that allow for predicting academic achievements. When self-efficacy is included in psychological models that examine student academic achievement, the significance of other variables on academic achievement is reduced.
According to the literature review, this study on predicting academic success is based on the CRISP-DM data-mining model and classification algorithms.
3. Materials and Methods
In our study, we discuss the challenges and quality matters of higher education in relation to educational processes, risks of dropping out by organizing engineering study program in the virtual learning environment. It is appropriate to analyze students’ data using data mining, as data mining allows optimal use of big education data and extraction of useful information from them. An early warning framework based on data mining was designed to predict the risks and the academic success of learners with the aim to reduce dropout percent (see Figure 3).
The prediction of the academic success is based on the CRISP-DM data mining model. The data mining software Weka 3.8 [34] is used.
3.1. SWOT to Predict Risks and the Academic Success
The prediction was carried out according to the phases of the CRISP-DM model: business understanding, data understanding, data preparation, modeling, evaluation, and implementation.
Business understanding phase. In order to analyze the possibilities of applying data mining to predict the academic success of "Distance Learning Information Technology" students, a SWOT analysis was performed (see Table 1).
According to the SDG 4 the university pays great attention to the quality of the studies. Academic achievements of students are an essential indicator of the quality of studies, and the successful completion of the studies positively affects the reputation of the educational institution. In 2020, nine first-year students dropped out of the "Distance Learning Information Technologies" study program in the fall semester. The teachers of the study program can’t identify the reasons of dropping out, because some master's students do not even joined remote lectures, do not report laboratory work, etc.
Totally two cases are presented: The first case (1) is presented "Basics of Virtual Learning" and the second (2) "Research Project 1". The main settlements are provided only at the end of the semester, and the cumulative score can also consist of one task with a high percentage value. In this case, it is difficult to predict the learning outcomes of the student and to provide timely academic support, as the student's academic success/failure is only known at the end of the semester when students submit/fail to submit module assignments. To predict possible student dropouts in time, it was decided to apply the predictive model to these modules.
Data understanding and preparation phases. These steps included identifying relevant data and potential data quality issues, collecting primary data and preparing them for the final dataset. The Moodle database stores various data about the learner's learning progress: the learner's login time, frequency, activities performed, grades received, etc. In the Moodle system, study program curators and teachers have the opportunity to receive various reports, which can be analyzed to evaluate the learning results achieved by learners, track learners' progress, activity, etc. In addition, the university's academic information system collects administrative data about the learner. In the virtual learning environment and academic information system, educational big data is collected but not analyzed by teachers. It is appropriate to analyze these data using data mining because data mining allows optimal use of educational data and extracting useful information from them.
Modelling phase. Five different algorithms were chosen for the initial modelling stage. As a result of the analysis, the most suitable method for the predicting model was identified.
Evaluation and implementation phases. During these stages, the quality of the developed model was formally evaluated, the steps of model development were reviewed, and the results of data mining were used.
3.2. Data Preparation
The presented cases’ data taken from the Moodle system of the first-semester master's study modules "Basics of Virtual Learning", and "Research Project 1". Since in these modules semester settlements are organized at the end of the semester (student's on-time reporting and grading cannot be used as features), only two attributes were selected: 1) student logins; 2) student clicks. SQL queries were used to extract data, which collect data on student logins and student clicks on these modules. SQL queries were first tested on a personal Moodle database running on a MySQL server. When checking the correctness of requests, the data obtained was compared immediately after its execution. Data preparation was performed on the initial data, where the information was filtered, renamed, and merged. This step resulted in a dataset for training the academic success prediction model (see Table 2).
To ensure the protection of the student's data, privacy and confidentiality, first, the data is pseudonymized and a key is created for each student's data (see Figure 4). The key protects the identification of the learners while developing a model to predict academic success, and once the model is developed and implemented, the key allows the study program administration to identify struggling learners.
The prediction was carried out in several stages, taking into account changes in results: with data from 5 weeks, data from 6 weeks, data from 7 weeks and data from 8 weeks. According to Ortiz-Lozano et al. [35], the initial year of studies, particularly the first 6-7 weeks, is considered significant for the prevention of academic failure.
3.3. Modelling the Prediction of Academic Success
Decision tree algorithm, Bayesian classifier, random forest algorithm, support vector classifier and k-nearest neighbors classifier were selected for modelling. An initial model was used to evaluate the quality results of the algorithms and the following parameters were compared: Precision, Recall, F-Measure and ROC (Receiver Operating Characteristic) (see Table 3).
Table 3 shows the classification Precision, Recall, F-Measure and ROC results. Precision is calculated as the number of true positives divided by the total number of positive and negative observations (see Formula 1).
Precision = True Positive / (True Positive + False Positive),
The result is represented by a value ranging from 0.0, indicating no accuracy, to 1.0, indicating complete or perfect accuracy. Recall calculates the proportion of correctly predicted positive instances to all possible positive predictions within the dataset. This metric can range from 0.0, indicating no recall at all, to 1.0, indicating complete or perfect recall. F-Measure provides the ability to combine Precision and Recall into a single metric that captures both properties. F-Measure is calculated as follows:
F-Measure = (2 * Precision * Recall) / (Precision + Recall),
A low F-Measure score is 0.0, indicating poor performance, while a high or perfect F-Measure score is 1.0. The ROC value is useful for determining the ability of a model to discriminate between classes [36].
When examining the results of the correct predictions of the algorithms, it is evident that the random forest algorithm provided high values of the parameters considered in all the data instances considered, compared to other algorithms. The random forest algorithm achieved the highest results using seven weeks of data, correctly predicting 80% of cases. Comparing the precision of the algorithms over the entire period in both classes, the precision of the random forest algorithm was 81%, the support vector classifier was 72%, the decision tree was 63%, the Bayesian classifier was 61%, and the k-nearest neighbors classifier was 59%. The random forest algorithm has also achieved the highest F-measure value (0.873) among all the algorithms evaluated. In the results of this algorithm, the value of the F-Measure was the highest with data for the entire period compared to other algorithms. The support vector classifier also shows high F-Measure results of 0.862 (7-8 weeks), 0.846 (6 weeks) and 0.829 (5 weeks), respectively.
Based on the obtained results, it can be concluded that the quality parameters of the random forest and support vector classifier are better than those of other applied algorithms. Comparing the results of these algorithms with the 7-week data, it can be concluded that the random forest algorithm is superior to the support vector classifier in predicting academic success (by assigning a value to T).
A final model for predicting academic success was created using a random forest algorithm (see Figure 5).
The academic success prediction model consists of the following seven components: 1) “CSVLoader” component - designed to load a data set in CSV (.csv) format; 2) “ClassAssigner” component specifies the index of a class variable (in this case, the variable "success" whose index is "last"); 3) “ClassValuePicker” component specifies the value of a class variable (in this case the value "N", which is "/first"); 4) “CrossValidationFoldMaker” component specifies how many times and into how many parts the dataset is split (in this case, part for training data and part for testing); 5) “RandomForest” component indicates that a random forest algorithm is applied to the model; 6) “ClassifierPerformanceEvaluator” component for generating prediction results; 7) “TextViewer” component is for viewing results in text format.
4 University Case on Prediction Academic Performance
To assess the suitability of the developed model, two tests were conducted: one involved testing SQL queries in the Moodle database, while the other focused on testing the accuracy of the academic success prediction model.
SQL SELECT queries were prepared and used to retrieve data from the Moodle database. These queries were written on a personal database server (server specifications: macOS X, Apache (2.2.23), PHP (7.4.2), MySQL (5.7.26)), and testing was done on the Moodle database (server specifications: (Debian Linux 10, Apache (2.4.38), PHP (7.4.33), MariaDB (10.4.28)). Consideration was given to the accuracy of SQL queries during the testing process, ensuring that they were free of syntax errors and providing correct data from the Moodle database.
The testing was carried out using data from students enrolled in 2021 and 2022. The number of logins to the modules "Basics of Virtual Learning", and "Research Project 1" and clicks on these modules were checked. The academic success prediction model was tested using three different datasets: 1) dataset prepared for model training; 2) dataset with data of 2021 enrolled students (21 students); 3) dataset with data of 2022 enrolled students (74 students). The results of the prediction of the academic success of students in 2021 are presented in Figure 6.
The model predicts that 25% of students are at risk of not completing their studies. For these students, the model assigned a value of F. Based on the confidence values, it can be stated that the model's prediction of the academic failure of the two students is uncertain as the confidence level obtained is less than 0.1. The prediction of the academic success of two more students is also unlikely, with a confidence interval of less than -0.2.
The results of the prediction of student academic success in 2022 are presented in Figure 7.
Table 7 shows that 14% (10 out of 74) of the students are at risk of dropping out. They were assigned a value of F. In this case, the model confidence was weak when setting one student to the value F, and the model evaluated the possibilities of one other student to stop or continue their studies equally (confidence estimate equal to 0). Taking into account the model’s confidence, assigning a value to T can identify five students whose confidence estimates were less than -0.2.
The results were compared with the real data on the learning situation of students in 2021 and 2022. Based on this, the errors made by the model were visualized as incorrect predictions in Figure 6 and Figure 7. Comparing the predictions provided by the model and information about the real situation, it can be concluded that the model correctly assigned the value of F in 73% of cases, i.e. 11 out of 15 students predicted that they would drop out. It is important to note that in cases where the model was uncertain (5 cases) or incorrect (3 cases), students showed signs of academic failure: academic debt, low academic achievement, or absenteeism. The results also showed that in 81% of the cases, it was correctly predicted that students would stay in their studies. Unfortunately, 15 of the 80 students who were predicted to continue their studies (assigned a T value) dropped out or went on academic leave for various personal reasons.
However, in general, the obtained results revealed that by using the data of the student learning process collected by the virtual learning environment and applying data mining to their analysis, it is possible to predict which students are at risk of dropping out.
5 Conclusions
In this study, we suggest applying data mining and classification algorithms to predict academic success. A random forest algorithm was chosen for the model based on the results of the primary analysis of the several algorithms. The CRISP-DM data mining model was used to predict the academic success of the learners, allowing the prediction to be carried out in successive stages.
After conducting a study of the suitability of the academic success prediction model in the study program, it was found that by using the data of the students' learning process with the academic success prediction model and applying data mining to their analysis, it is possible to predict which students are at risk of dropping out. However, it is reasonable to improve the model to reduce the probability of errors and increase the accuracy of the prediction.
The main limitation of the proposed model is as follows: the module returns some incorrect values during prediction. Despite this limitation, the proposed model can help identify potential academic failures in time.
Future work will include supplementing the early warning model with an assessment of students' academic self-efficacy that would be administered during the introductory week of study. The dataset created for model training should be supplemented annually with new data on students who have completed/discontinued their studies. Moreover, it is planned to supplement the prediction model with other study modules and features, for example, to include a module with earlier semester settlements (not just at the end of the semester) and includes evaluations of semester work as a feature. Such module improvements could potentially reduce the number of incorrect prediction values.
Author Contributions
Conceptualization, E.S., D.G. and A.K.; methodology, E.S., D.G., V.P. and A.K.; formal analysis, E.S., D.G., A.K.; writing—original draft preparation, E.S., D.G., V.P., A.K.; writing— review & editing, E.S. and D.G.; visualization, E.S., A.K.; project administration, E.S.; funding acquisition, D.G. All authors have read and agreed to the published version of the manuscript.
Funding
This research does not receive any external funding.
Institutional Review Board Statement
Ethical review and approval were waived for this study, as this study involves no more than minimal risk to subjects.
Informed Consent Statement
Informed consent was obtained from all subjects involved in the study.
Data Availability Statement
The data presented in this study are available on request from the corresponding author. The data are not publicly available due to privacy.
Conflicts of Interest
The authors declare no conflict of interest.
References
- Srivastava, J.; Srivastava, A. K. Understanding linkage between data mining and statistics. International Journal of Engineering Technology, Management and Applied Sciences 2015, 3(10), 4-12.
- Manjarres, A. V.; Sandoval, L. G. M.; Suárez, M. S. Data mining techniques applied in educational environments: Literature review. Digital Education Review 2018, (33), 235-266. [CrossRef]
- Batool, S.; Rashid, J.; Nisar, M. W.; Kim, J.; Kwon, H. Y.; Hussain, A. Educational data mining to predict students' academic performance: A survey study. Education and Information Technologies 2023, 28(1), 905-971. [CrossRef]
- Romero, C.; Ventura, S. Educational data mining and learning analytics: An updated survey. Wiley Interdisciplinary Reviews: Data Mining and Knowledge Discovery 2020, 10(3), e1355. [CrossRef]
- Hernández-Blanco, A.; Herrera-Flores, B.; Tomás, D.; Navarro-Colorado, B. A systematic review of deep learning approaches to educational data mining. Complexity 2019. [CrossRef]
- Behr, A.; Giese, M.; Teguim Kamdjou, H. D.; Theune, K. Dropping out of university: a literature review. Review of Education 2020, 8(2), 614-652. [CrossRef]
- Alyahyan, E.; Düştegör, D. Predicting academic success in higher education: literature review and best practices. International Journal of Educational Technology in Higher Education 2020, 17, 1-21. [CrossRef]
- Trakunphutthirak, R.; Cheung, Y.; Lee, V. C. (2019, July). A study of educational data mining: Evidence from a thai university. In Proceedings of the AAAI Conference on Artificial Intelligence, USA, 33 (01), 734-741, 2019, July. [CrossRef]
- Rajalaxmi, R. R.; Natesan, P.; Krishnamoorthy, N.; Ponni, S. Regression model for predicting engineering students academic performance. International Journal of Recent Technology and Engineering 2019, 7(6S3), 71-75.
- Križanić, S. Educational data mining using cluster analysis and decision tree technique: A case study. International Journal of Engineering Business Management 2020, 12, 1847979020908675. [CrossRef]
- Chen, J.; Zhao, J. An Educational Data Mining Model for Supervision of Network Learning Process. International Journal of Emerging Technologies in Learning 2018, 13(11). [CrossRef]
- Doko, E.; Bexheti, L. A.; Hamiti, M.; Etemi, B. P. Sequential Pattern Mining Model to Identify the Most Important or Difficult Learning Topics via Mobile Technologies. International Journal of Interactive Mobile Technologies 2018, 12(4). [CrossRef]
- Paiva, R.; Bittencourt, I. I.; Lemos, W.; Vinicius, A.; Dermeval, D. Visualizing learning analytics and educational data mining outputs. In Artificial Intelligence in Education: 19th International Conference, AIED 2018, London, UK, June 27–30, 2018, Proceedings, Part II 19 (pp. 251-256). Springer International Publishing. [CrossRef]
- Almasri, A.; Alkhawaldeh, R. S.; Çelebi, E. Clustering-based EMT model for predicting student performance. Arabian Journal for Science and Engineering 2020, 45, 10067-10078. [CrossRef]
- Khasanah, A. U. A comparative study to predict student’s performance using educational data mining techniques. In IOP Conference Series: Materials Science and Engineering, 215(1), 012036, 2017, June. IOP Publishing. [CrossRef]
- Seidel, E.; Kutieleh, S. Using predictive analytics to target and improve first year student attrition. Australian Journal of Education 2017, 61(2), 200-218. [CrossRef]
- Arulkadacham, L.; McKenzie, S.; Aziz, Z.; Chung, J.; Dyer, K.; Holt, C.; Mundy, M. General and unique predictors of student success in online courses: A systematic review and focus group. Journal of University Teaching & Learning Practice 2021, 18(8), 07. [CrossRef]
- Yokoyama, S. Academic self-efficacy and academic performance in online learning: A mini review. Frontiers in psychology 2019, 9, 2794. [CrossRef]
- Doménech-Betoret, F.; Abellán-Roselló, L.; Gómez-Artiga, A. Self-efficacy, satisfaction, and academic achievement: the mediator role of Students' expectancy-value beliefs. Frontiers in psychology 2017, 8, 1193. [CrossRef]
- Nasir, M.; Iqbal, S. Academic Self Efficacy as a Predictor of Academic Achievement of Students in Pre Service Teacher Training Programs. Bulletin of Education and Research 2019, 41(1), 33-42.
- Quinn, R. J.; Gray, G. Prediction of student academic performance using Moodle data from a Further Education setting. Irish Journal of Technology Enhanced Learning 2020, 5(1). [CrossRef]
- Hellas, A.; Ihantola, P.; Petersen, A.; Ajanovski, V. V.; Gutica, M.; Hynninen, T.; Liao, S. N. Predicting academic performance: a systematic literature review. In Proceedings companion of the 23rd annual ACM conference on innovation and technology in computer science education, 175-199, 2018, July. [CrossRef]
- Yildiz, M.; Börekci, C. Predicting Academic Achievement with Machine Learning Algorithms. Journal of Educational Technology and Online Learning 2020, 3(3), 372-392. [CrossRef]
- Phauk, S.; Okazaki, T. Integration of Educational Data Mining Models to a Web-Based Support System for Predicting High School Student Performance. International Journal of Computer and Information Engineering 2021, 15(2), 131-144.
- Chapman, P.; Clinton, J.; Kerber, R.; Khabaza, T.; Reinartz, T.; Shearer, C.; Wirth, R. (2000). CRISP-DM 1.0: Step-by-step data mining guide.
- Qiu, F.; Zhang, G.; Sheng, X.; Jiang, L.; Zhu, L.; Xiang, Q.; Chen, P. K. Predicting students’ performance in e-learning using learning process and behaviour data. Scientific Reports 2022, 12(1), 453. [CrossRef]
- Shreem, S. S.; Turabieh, H.; Al Azwari, S.; Baothman, F. Enhanced binary genetic algorithm as a feature selection to predict student performance. Soft Computing 2022, 26(4), 1811-1823. [CrossRef]
- Baashar, Y.; Alkawsi, G.; Mustafa, A.; Alkahtani, A. A.; Alsariera, Y. A.; Ali, A. Q.; Tiong, S. K. Toward predicting student’s academic performance using artificial neural networks (ANNs). Applied Sciences 2022, 12(3), 1289. [CrossRef]
- Cruz-Jesus, F.; Castelli, M.; Oliveira, T.; Mendes, R.; Nunes, C.; Sa-Velho, M.; Rosa-Louro, A. Using artificial intelligence methods to assess academic achievement in public high schools of a European Union country. Heliyon 2020, 6(6), e04081. [CrossRef]
- Yağcı, M. Educational data mining: prediction of students' academic performance using machine learning algorithms. Smart Learning Environments 2022, 9(1), 11. [CrossRef]
- Beckham, N. R.; Akeh, L. J.; Mitaart, G. N. P.; Moniaga, J. V. Determining factors that affect student performance using various machine learning methods. Procedia Computer Science 2023, 216, 597-603. [CrossRef]
- Göktepe Yıldız, S.; Göktepe Körpeoğlu, S. Prediction of students’ perceptions of problem solving skills with a neuro-fuzzy model and hierarchical regression method: A quantitative study. Education and Information Technologies 2023, 1-39. [CrossRef]
- Honicke, T.; Broadbent, J. The influence of academic self-efficacy on academic performance: A systematic review. Educational research review 2016, 17, 63-84. [CrossRef]
- Weka Wiki Homepage. https://waikato.github.io/weka-wiki/downloading_weka/, last accessed 2023/05/27.
- Ortiz-Lozano, J. M.; Rua-Vieites, A.; Bilbao-Calabuig, P.; Casadesús-Fa, M. University student retention: Best time and data to identify undergraduate students at risk of dropout. Innovations in education and teaching international 2018, 57(1), 74-85. [CrossRef]
- Bouckaert, R. R.; Frank, E.; Hall, M.; Kirkby, R.; Reutemann, P.; Seewald, A.; Scuse, D. WEKA manual for version 3-8-3. The University of Waikato 2018, 1-327.
Figure 1.
Areas related to educational data mining and learning analytics
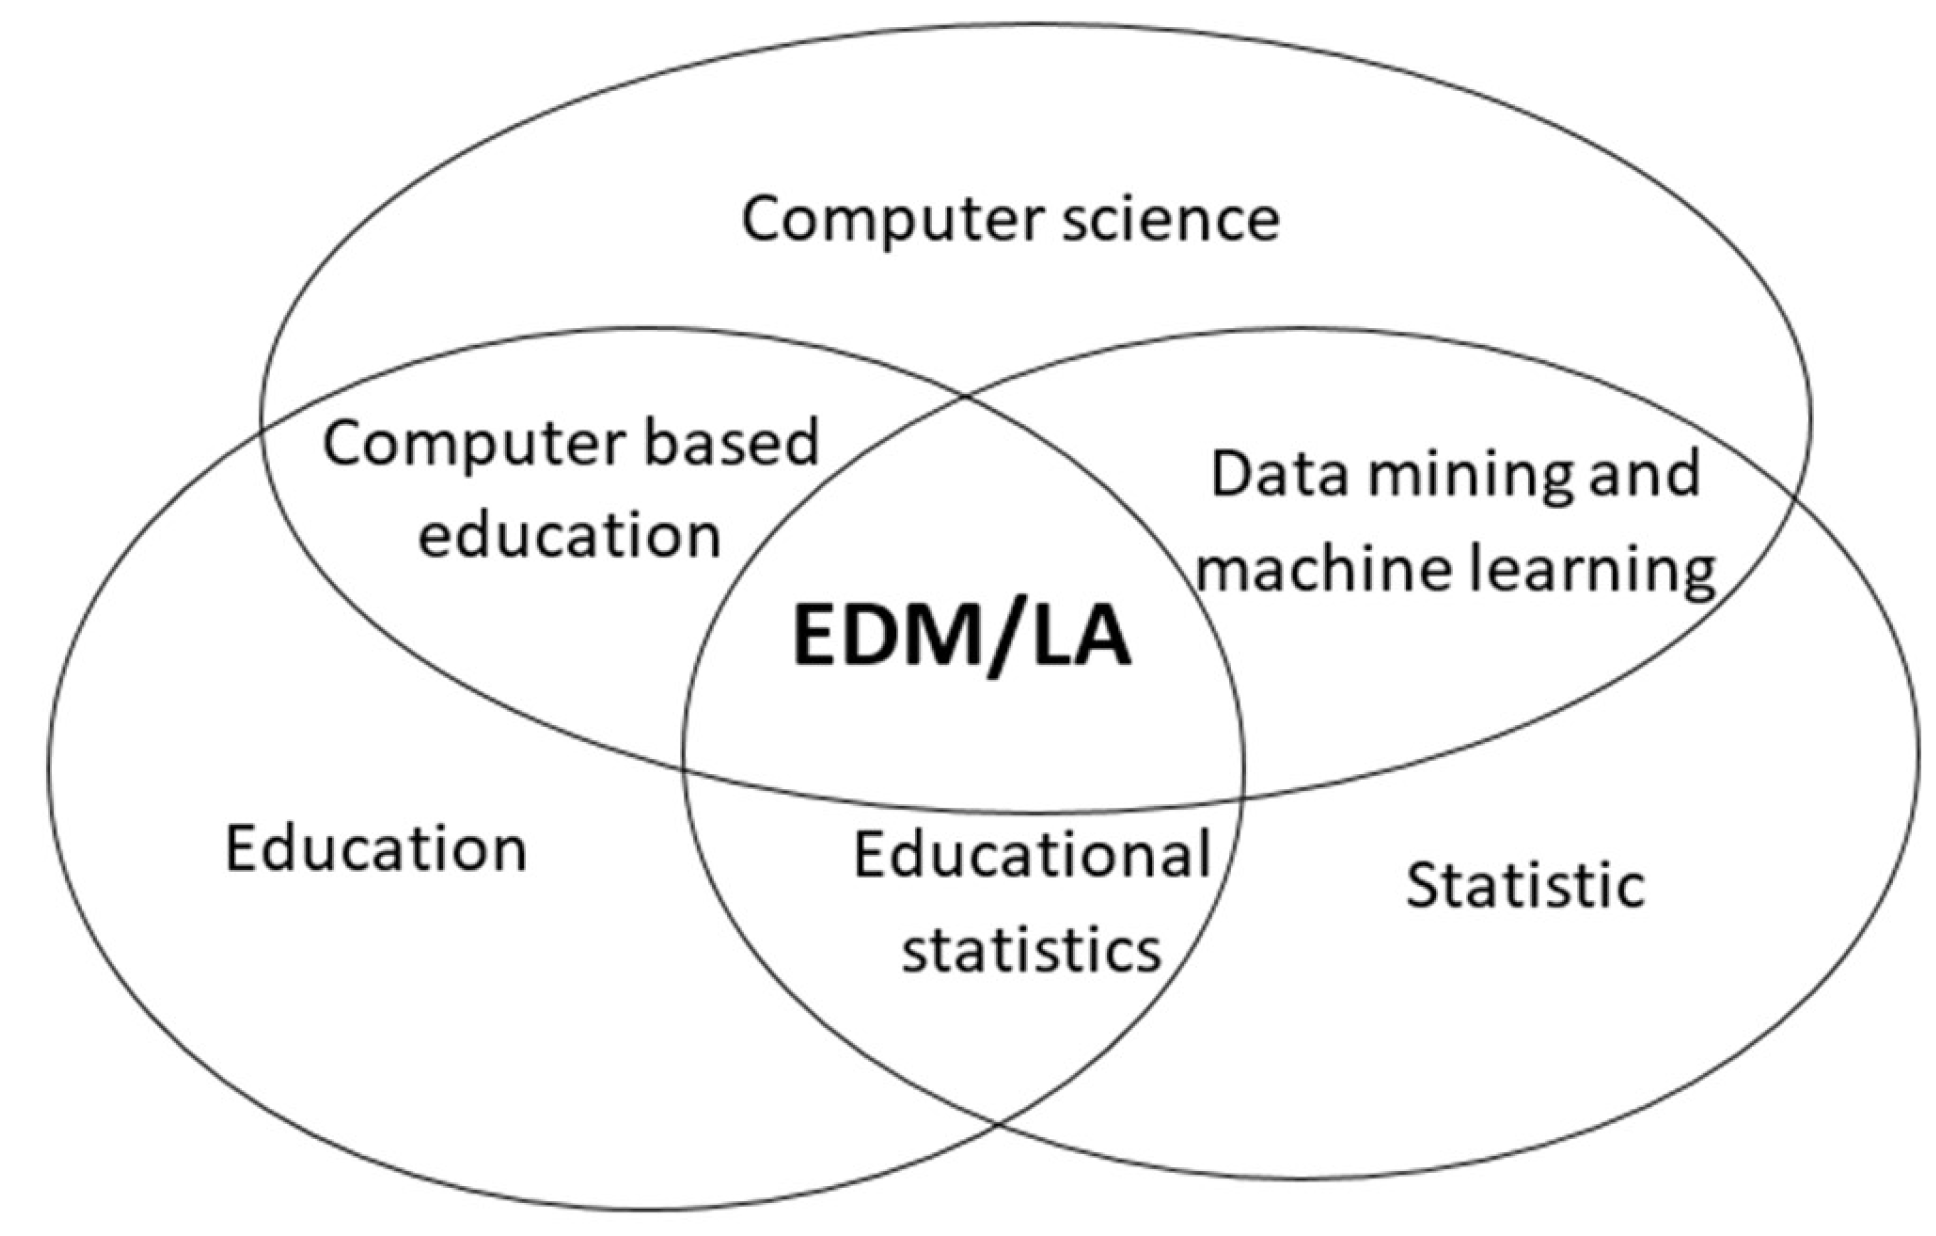
Figure 2.
Educational data mining techniques in the case.
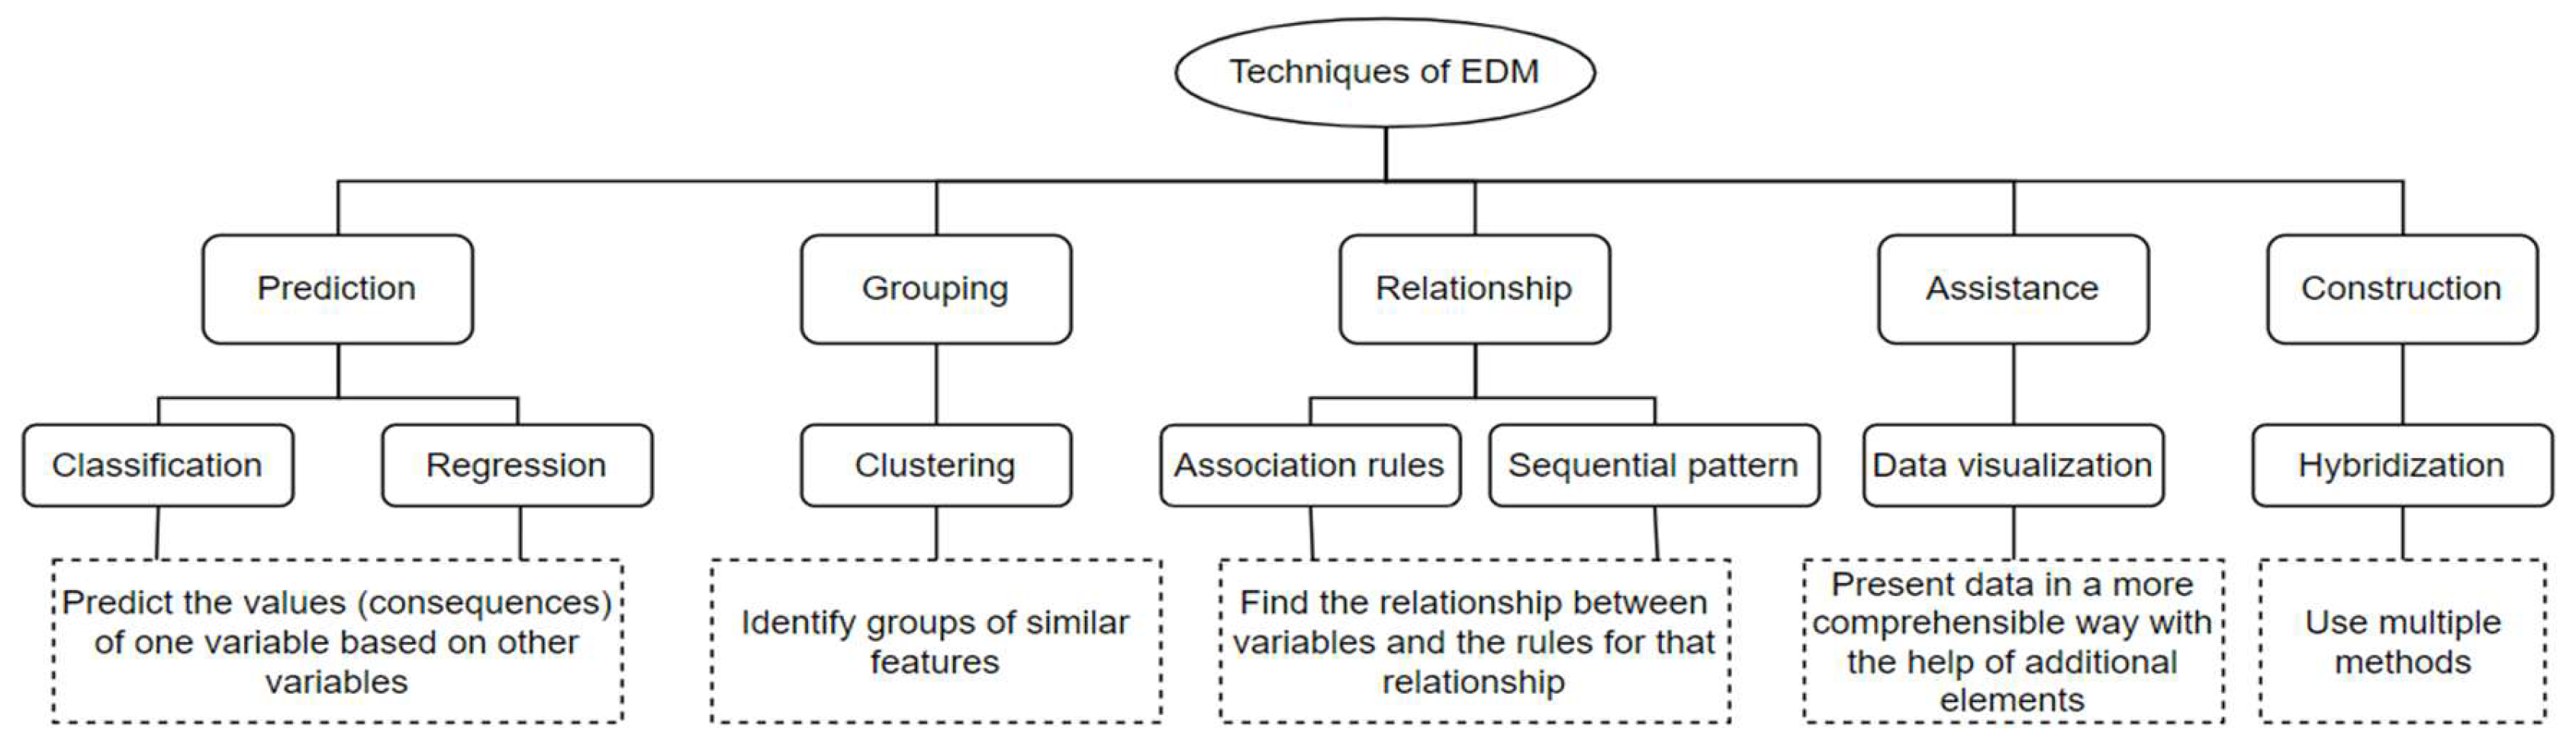
Figure 3.
An early warning framework based on data mining
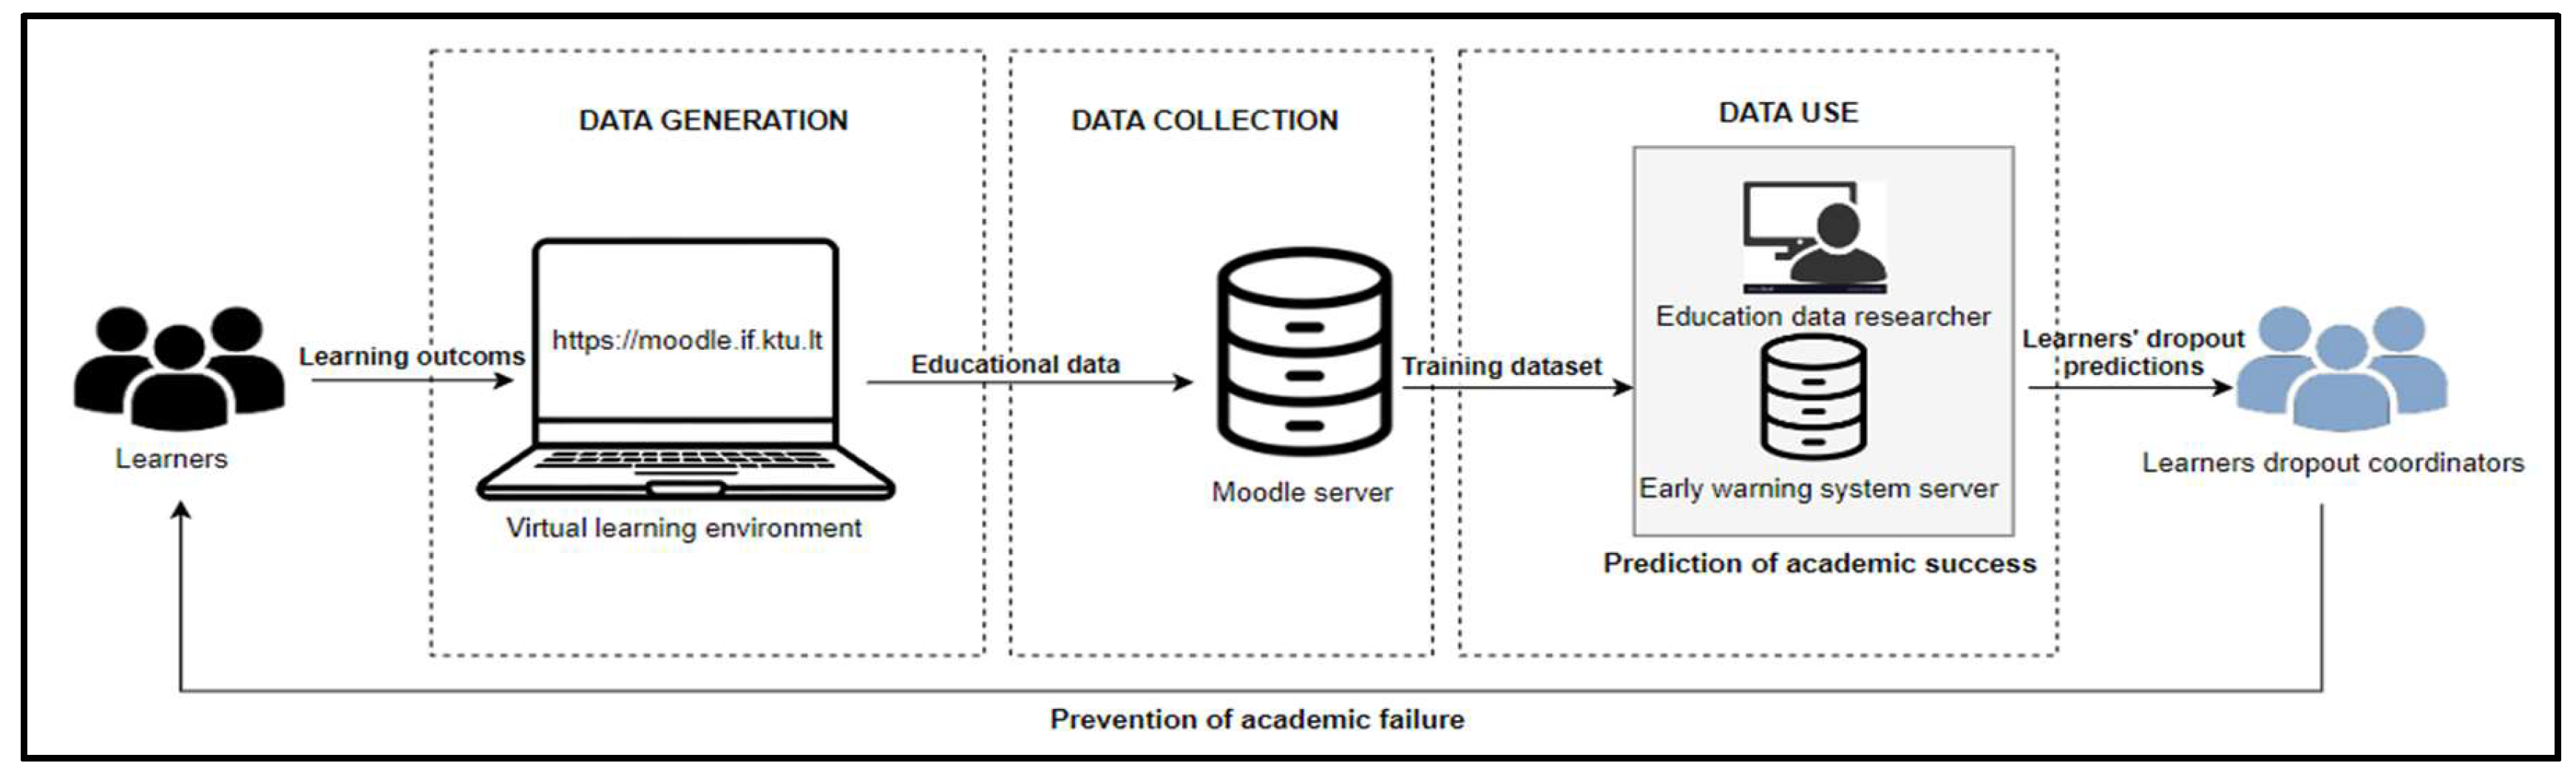
Figure 4.
Pseudonymization of student data
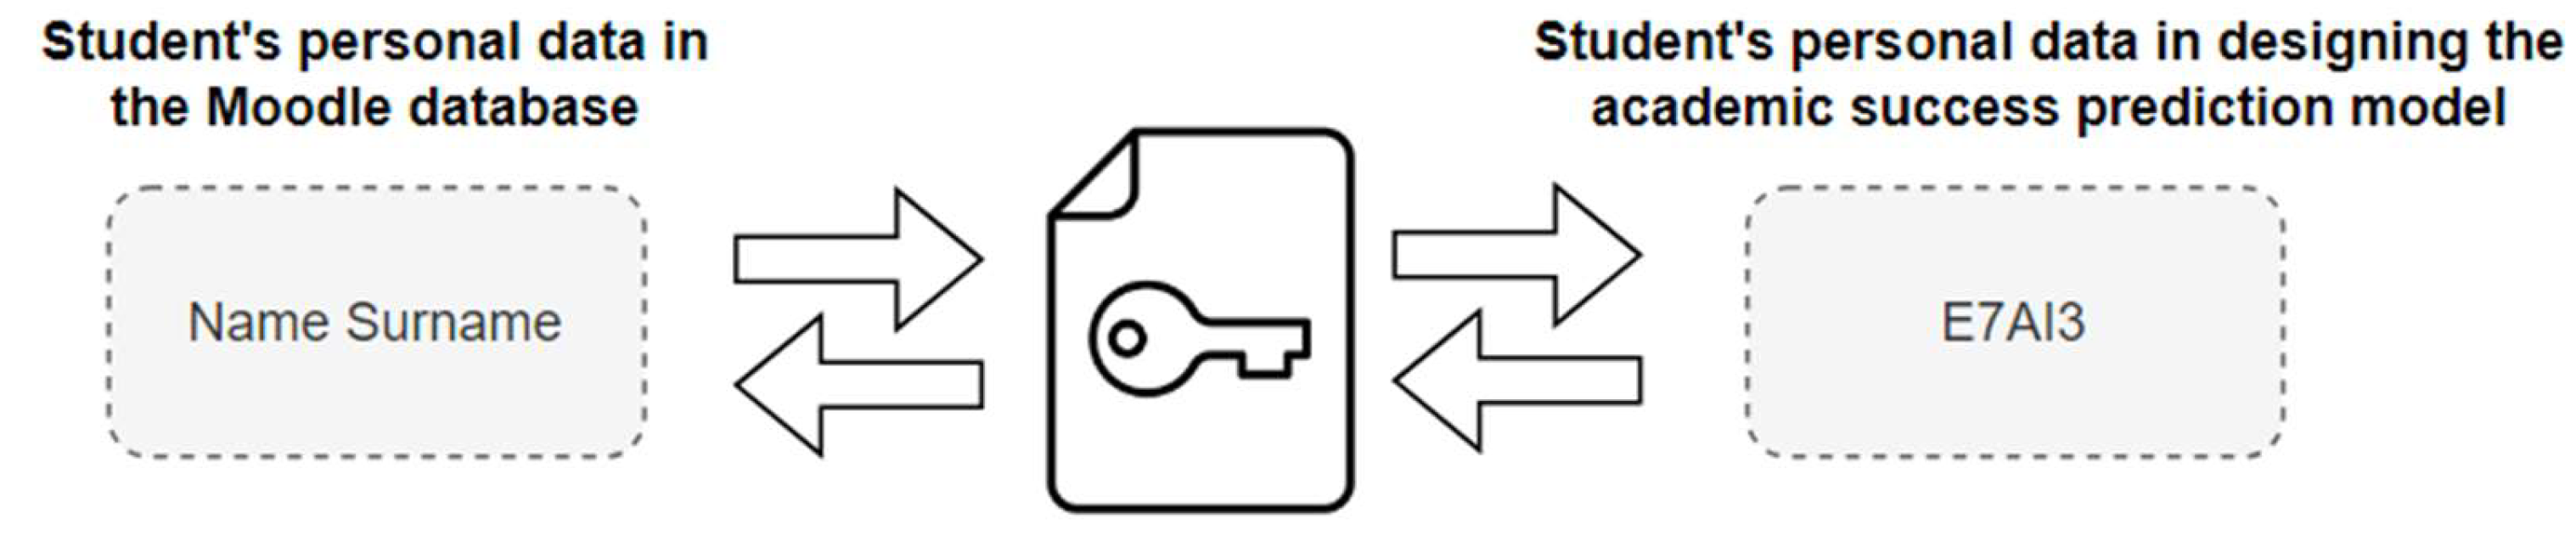
Figure 5.
A model for predicting student academic success
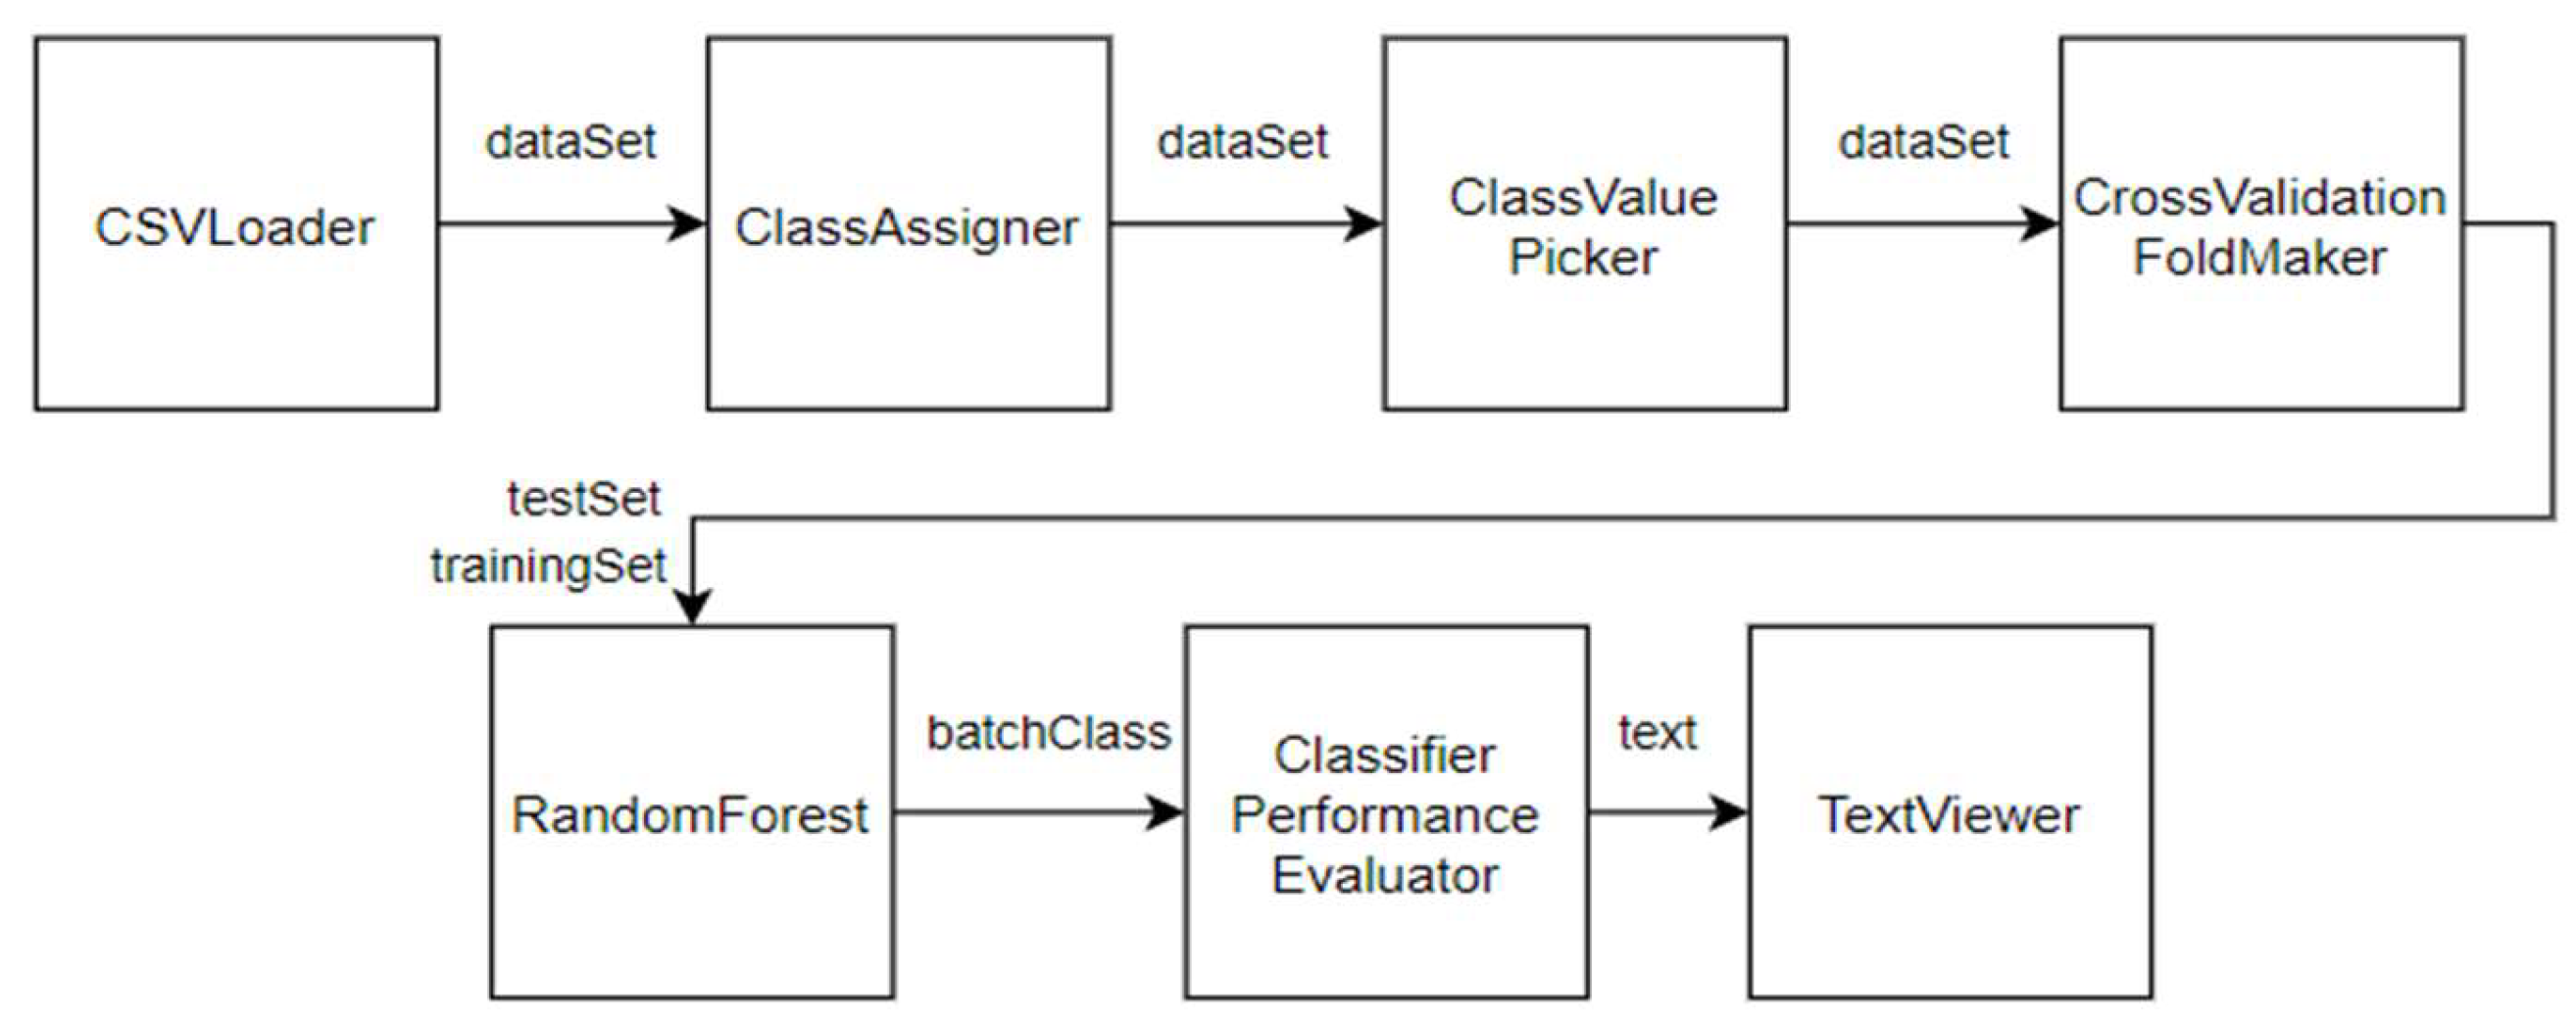
Figure 6.
Academic success prediction for students enrolled in 2021
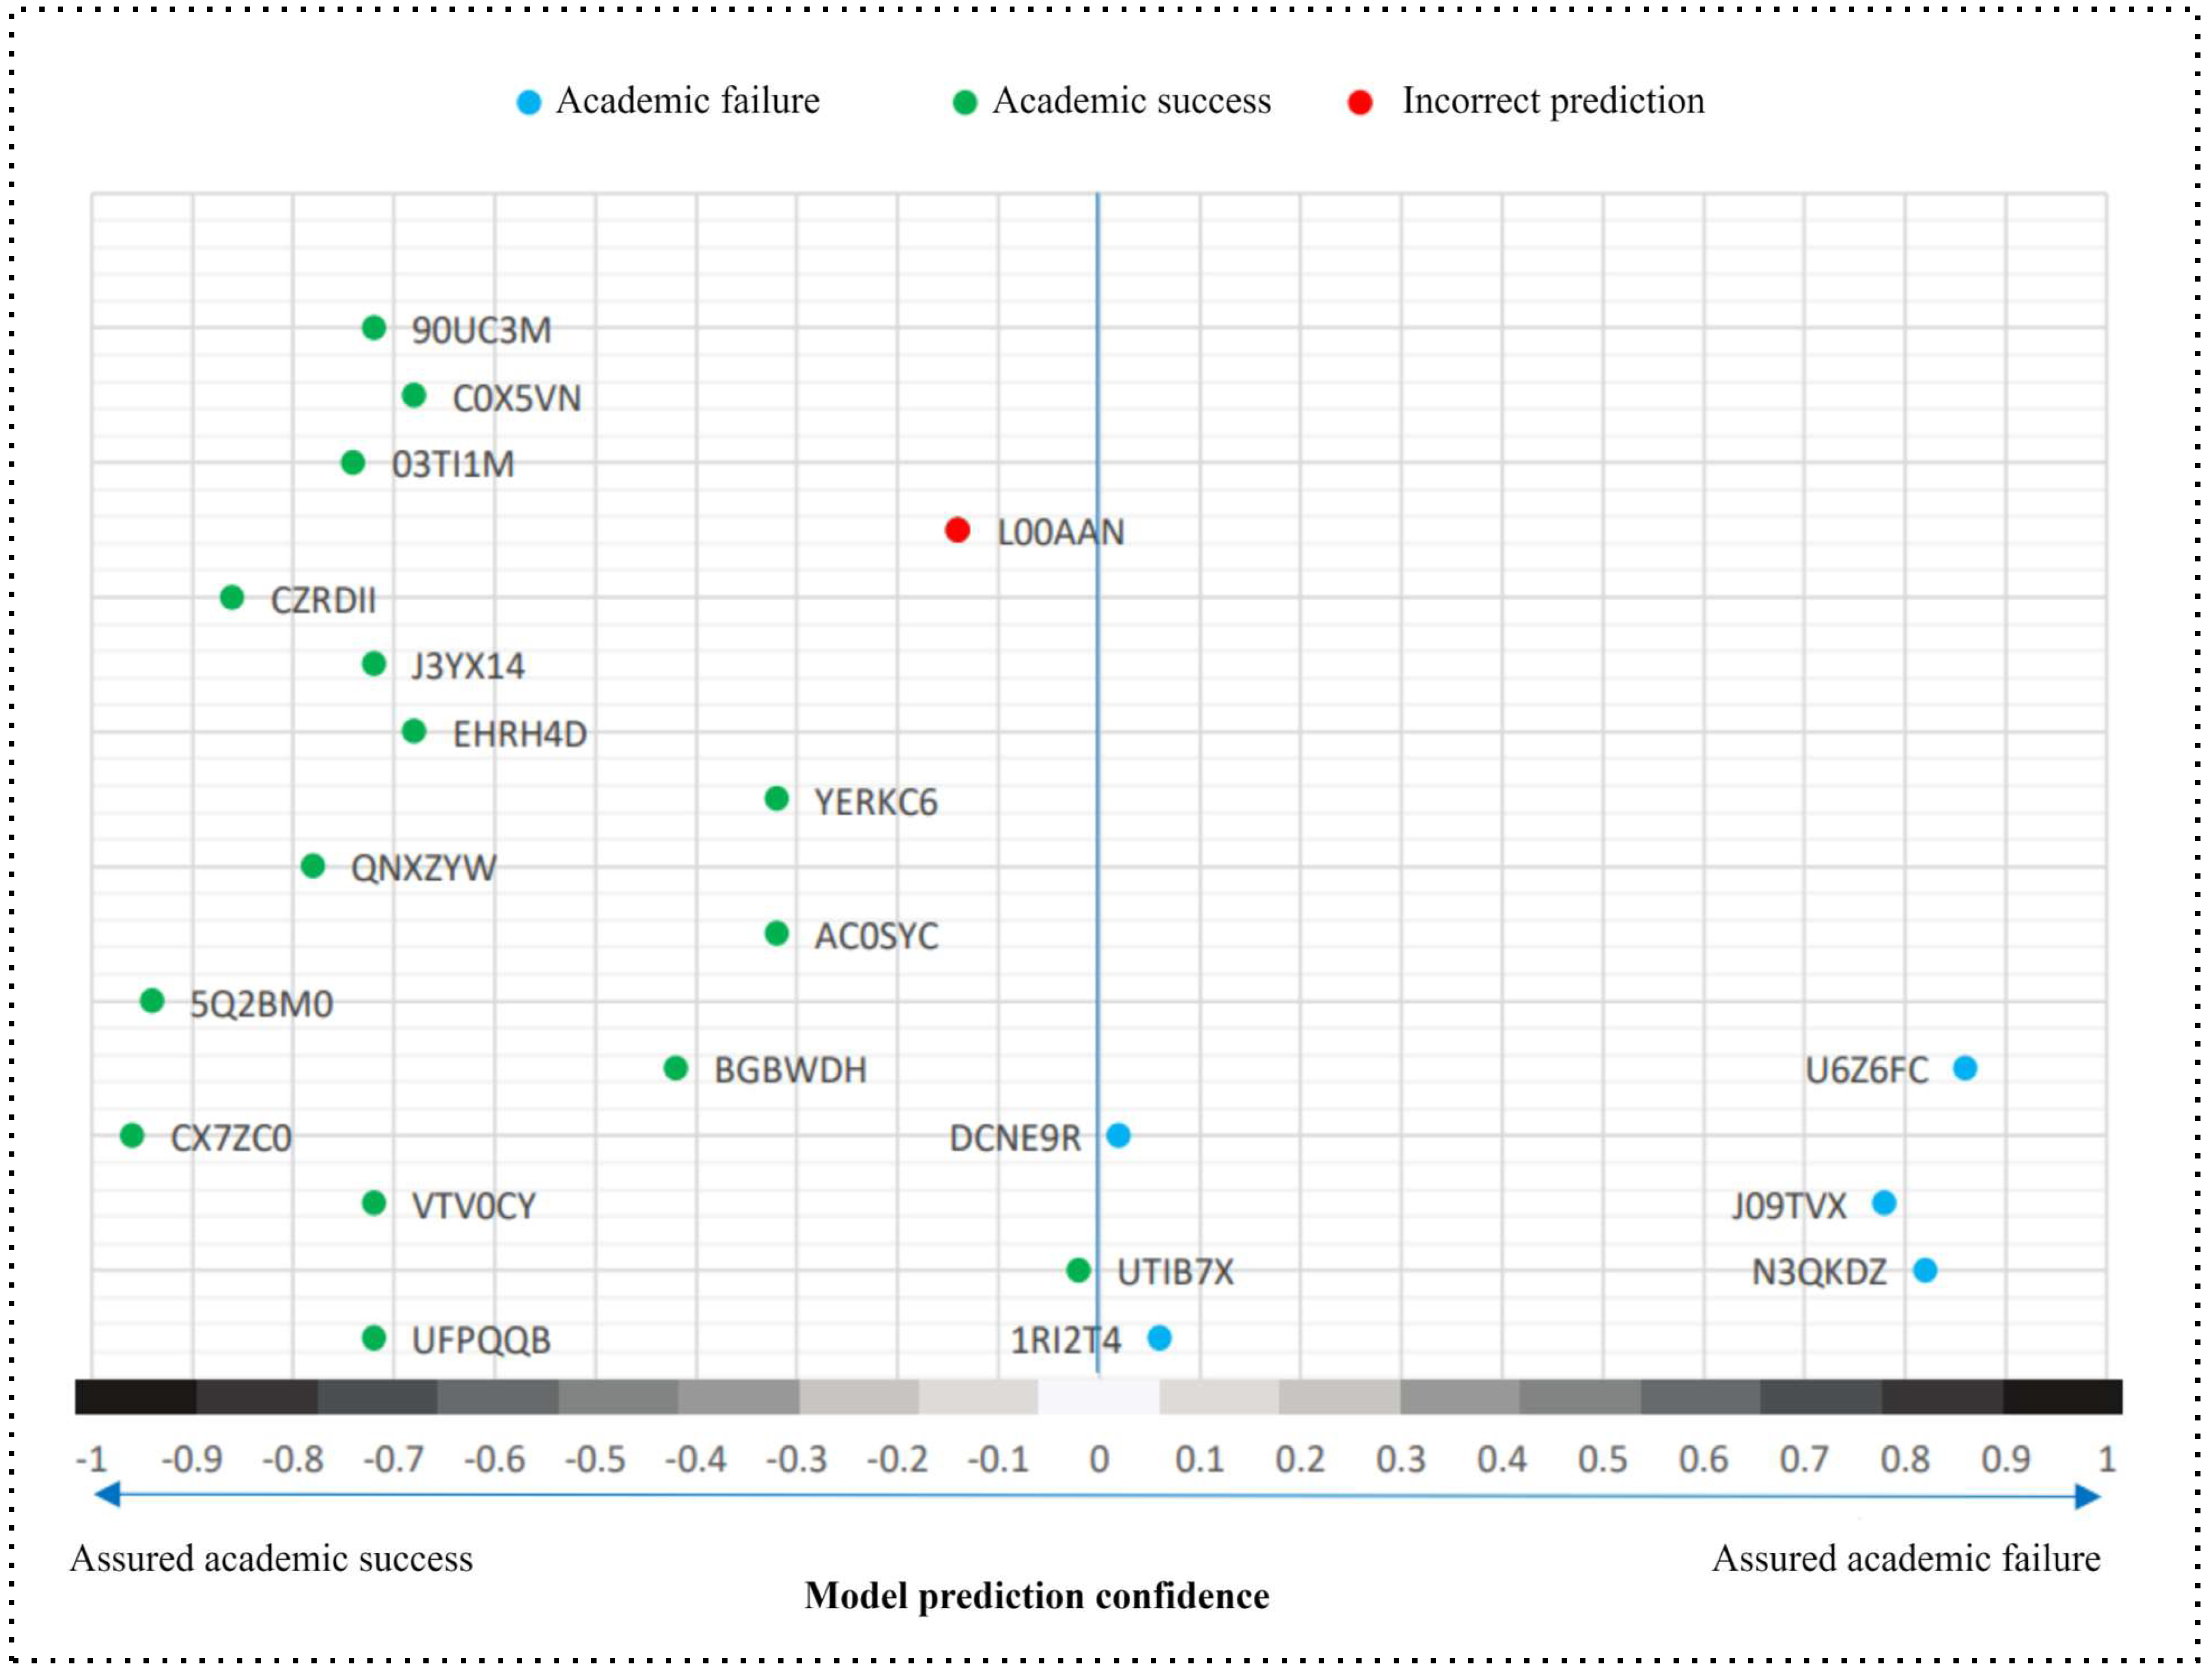
Figure 7.
Academic success predictions for students enrolled in 2022
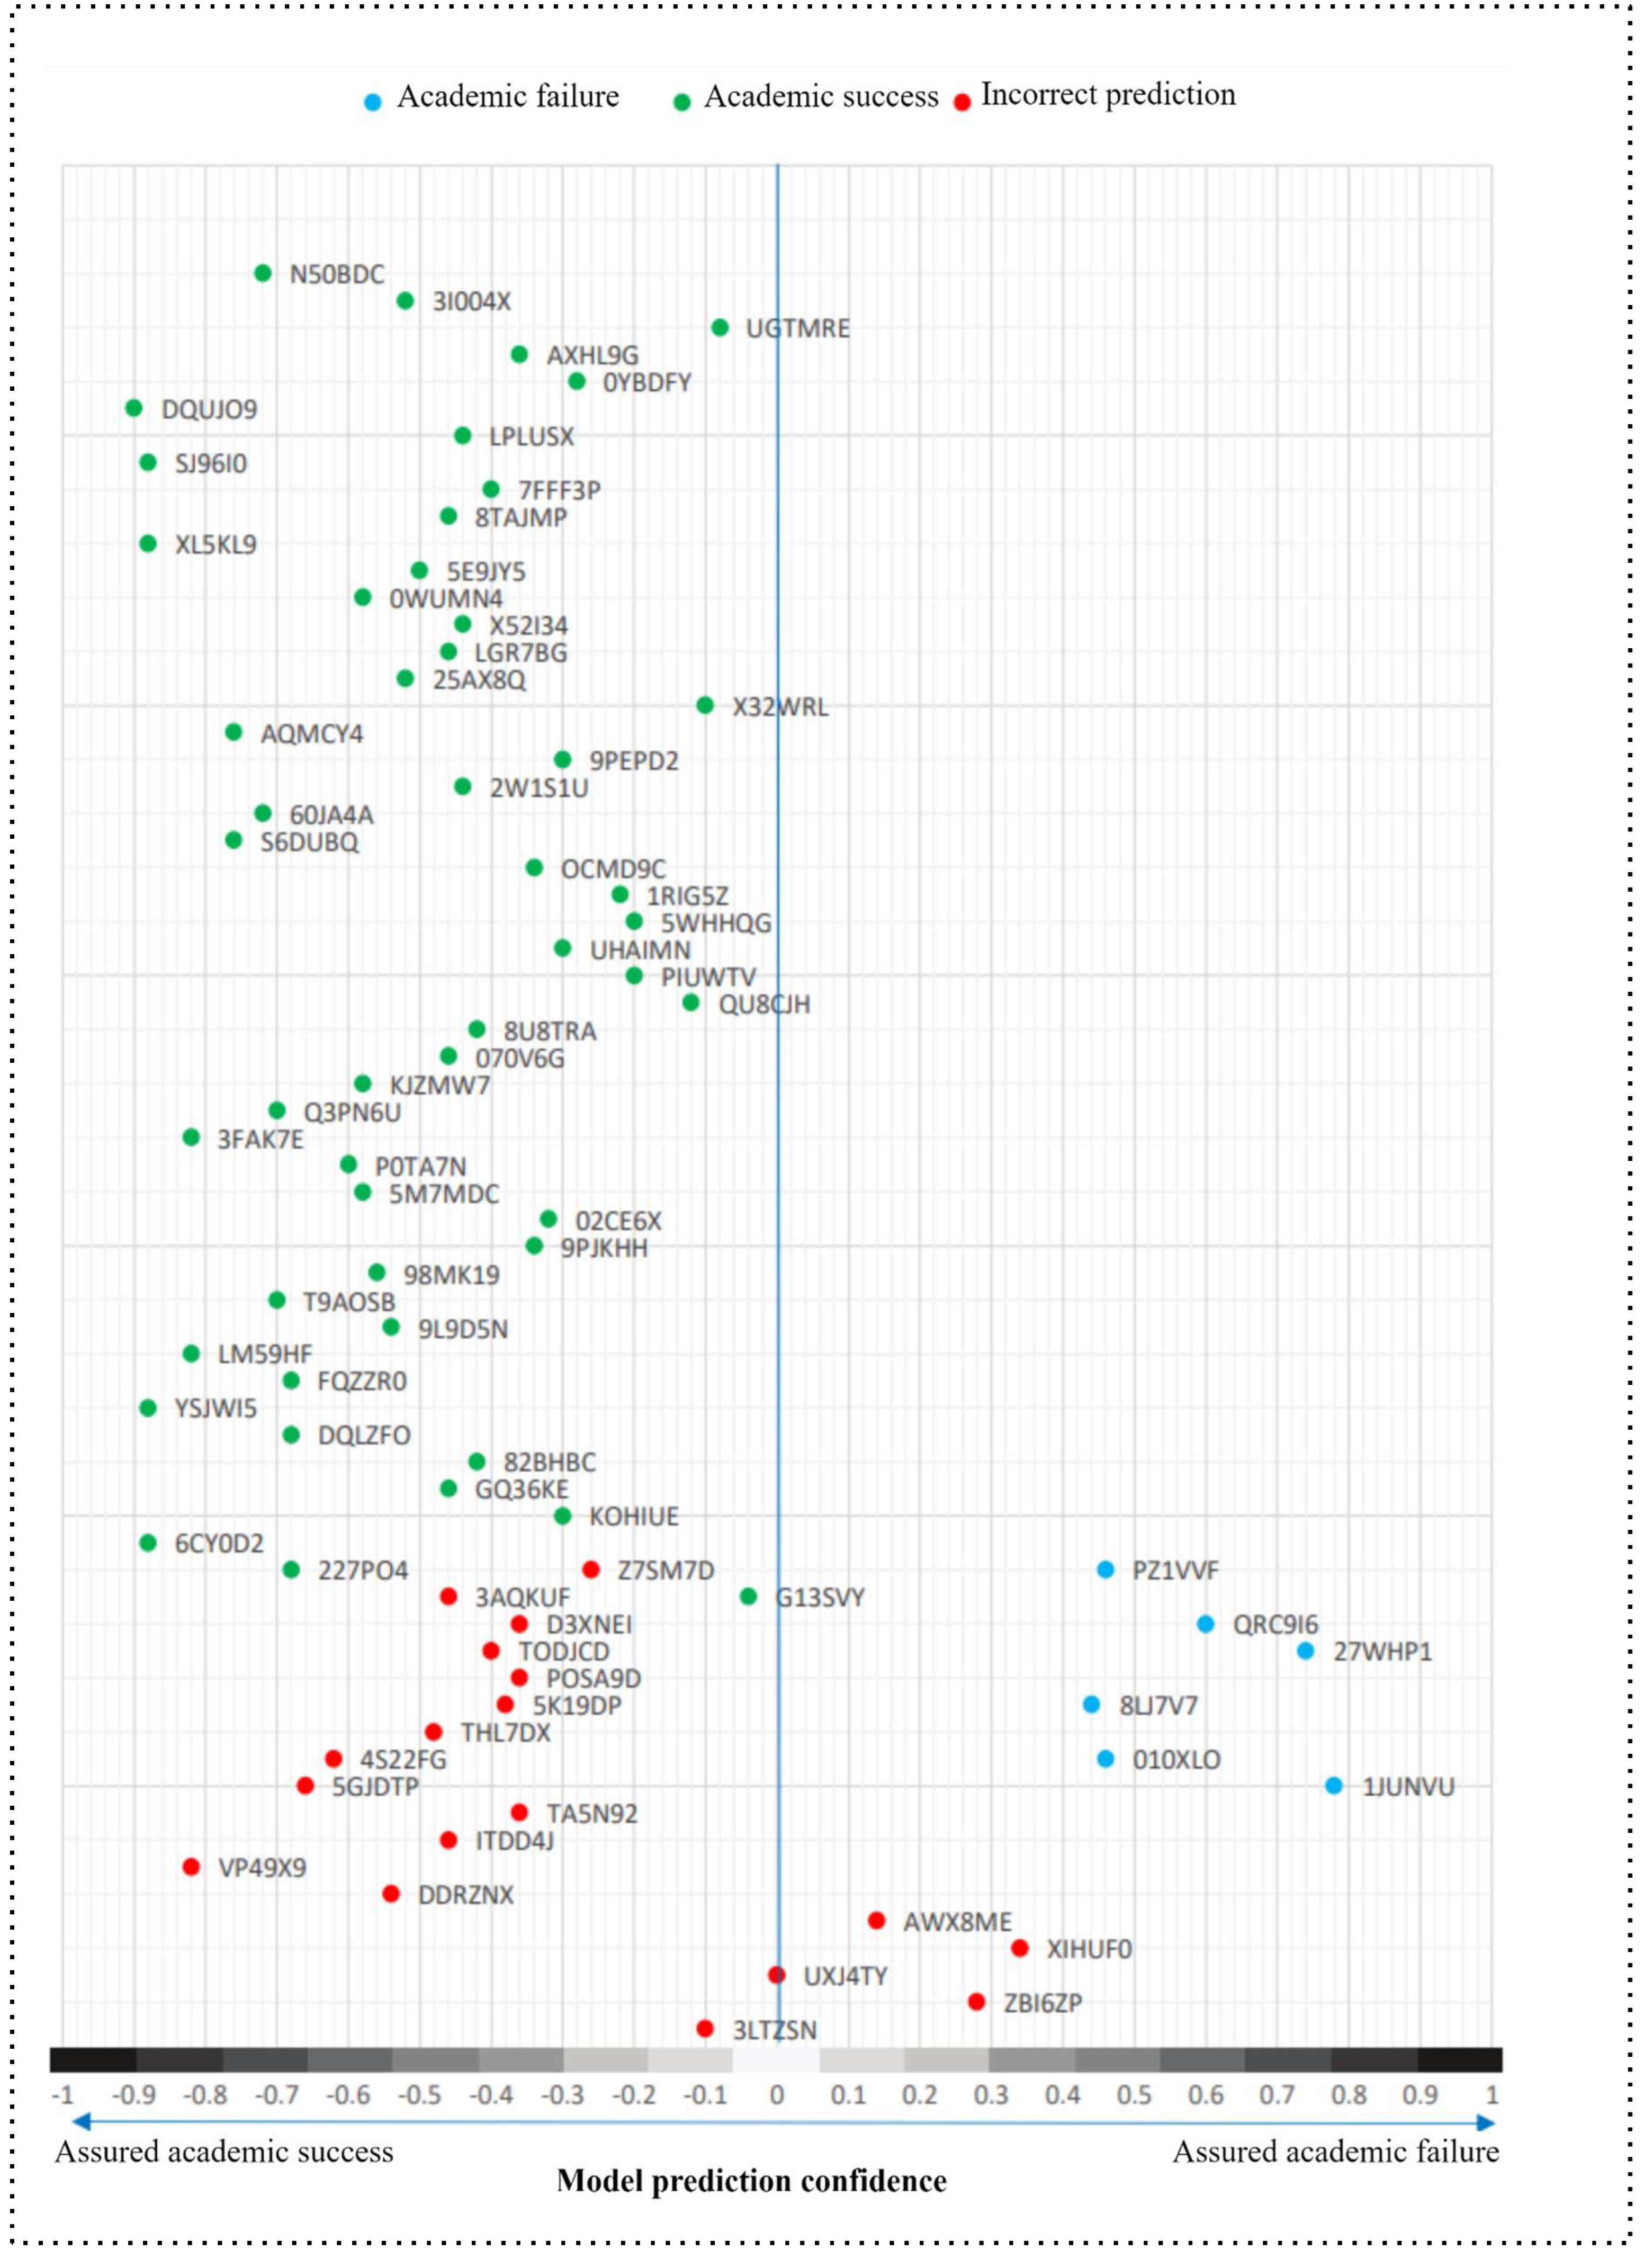

Table 1.
SWOT analysis of data mining application possibilities
| STRENGTHS | WEAKNESS |
|---|---|
| A virtual learning environment Academic information system Experience in implementing an early warning system Highly qualified and competent teachers |
There is a lack of information about the current situation of learners Uneven assessment of learners Inconsistent monitoring of learner progress Student dropout Students are stressed at the end of the semester |
| OPPORTUNITIES | THREATS |
| Use personalized administrative and learning process data Digitize the monitoring of learners' progress Optimize the use of big educational data Improve the system of providing academic support |
Ensuring learner data protection, privacy and confidentiality Risk of wasting information extracted during data mining High load on the Moodle server when retrieving data from the database |
Table 2.
Structure of the training dataset for the academic success prediction model
| Variable | Value |
|---|---|
| TP1_access_week | The number of student logins to the module "Research Project 1" |
| TP1_clicks_week | The number of student clicks in the module "Research Project 1" |
| VMP_access_week | The number of student logins to the module "Basics of Virtual Learning" |
| VMP_clicks_week | The number of student clicks in the module "Basics of Virtual Learning" |
| key | Student identity pseudonymization key (125 students) |
| success | A class variable with F representing academic failure and T representing academic success |
Table 3.
Performance of algorithms in an initial model for predicting academic success
| Algorithm | Data | Precision | Recall | F-Measure | ROC Area | Class |
|---|---|---|---|---|---|---|
| Decision tree | 5 weeks | 0,5 | 0,278 | 0,357 | 0,531 | F |
| 0,752 | 0,888 | 0,814 | 0,531 | T | ||
| 6 weeks | 0,556 | 0,417 | 0,476 | 0,676 | F | |
| 0,786 | 0,865 | 0,824 | 0,676 | T | ||
| 7 weeks | 0,441 | 0,417 | 0,429 | 0,592 | F | |
| 0,769 | 0,787 | 0,778 | 0,592 | T | ||
| 8 weeks | 0,429 | 0,417 | 0,423 | 0,598 | F | |
| 0,767 | 0,775 | 0,771 | 0,598 | T | ||
| Bayesian classifier | 5 weeks | 0,361 | 0,611 | 0,454 | 0,646 | F |
| 0,781 | 0,562 | 0,654 | 0,646 | T | ||
| 6 weeks | 0,418 | 0,778 | 0,544 | 0,716 | F | |
| 0,862 | 0,562 | 0,68 | 0,716 | T | ||
| 7 weeks | 0,41 | 0,694 | 0,515 | 0,737 | F | |
| 0,828 | 0,596 | 0,693 | 0,737 | T | ||
| 8 weeks | 0,414 | 0,667 | 0,511 | 0,735 | F | |
| 0,821 | 0,618 | 0,705 | 0,735 | T | ||
| Random forest | 5 weeks | 0,9 | 0,25 | 0,391 | 0,648 | F |
| 0,765 | 0,989 | 0,863 | 0,648 | T | ||
| 6 weeks | 0,857 | 0,333 | 0,48 | 0,734 | F | |
| 0,784 | 0,978 | 0,87 | 0,734 | T | ||
| 7 weeks | 0,824 | 0,389 | 0,528 | 0,772 | F | |
| 0,796 | 0,966 | 0,873 | 0,772 | T | ||
| 8 weeks | 0,765 | 0,361 | 0,491 | 0,716 | F | |
| 0,787 | 0,955 | 0,863 | 0,716 | T | ||
| Support vector classifier | 5 weeks | 0,556 | 0,139 | 0,222 | 0,547 | F |
| 0,733 | 0,955 | 0,829 | 0,547 | T | ||
| 6 weeks | 0,692 | 0,25 | 0,367 | 0,603 | F | |
| 0,759 | 0,955 | 0,846 | 0,603 | T | ||
| 7 weeks | 0,737 | 0,389 | 0,509 | 0,666 | F | |
| 0,792 | 0,944 | 0,862 | 0,666 | T | ||
| 8 weeks | 0,737 | 0,389 | 0,509 | 0,666 | F | |
| 0,792 | 0,944 | 0,862 | 0,666 | T | ||
| K-nearest neighbors classifier | 5 weeks | 0,381 | 0,444 | 0,41 | 0,561 | F |
| 0,759 | 0,708 | 0,733 | 0,561 | T | ||
| 6 weeks | 0,357 | 0,417 | 0,385 | 0,539 | F | |
| 0,747 | 0,697 | 0,721 | 0,539 | T | ||
| 7 weeks | 0,425 | 0,472 | 0,447 | 0,613 | F | |
| 0,776 | 0,742 | 0,759 | 0,613 | T | ||
| 8 weeks | 0,5 | 0,5 | 0,5 | 0,655 | F | |
| 0,798 | 0,798 | 0,798 | 0,655 | T |
Disclaimer/Publisher’s Note: The statements, opinions and data contained in all publications are solely those of the individual author(s) and contributor(s) and not of MDPI and/or the editor(s). MDPI and/or the editor(s) disclaim responsibility for any injury to people or property resulting from any ideas, methods, instructions or products referred to in the content. |
© 2024 by the authors. Licensee MDPI, Basel, Switzerland. This article is an open access article distributed under the terms and conditions of the Creative Commons Attribution (CC BY) license (http://creativecommons.org/licenses/by/4.0/).
Copyright: This open access article is published under a Creative Commons CC BY 4.0 license, which permit the free download, distribution, and reuse, provided that the author and preprint are cited in any reuse.


