
Submitted:
17 October 2024
Posted:
18 October 2024
You are already at the latest version
Preprints on COVID-19 and SARS-CoV-2
Abstract
Which measure is the most effective for solving health disparities, biological or economic? It is indispensable to delve into the factors of health disparities to answer this question. Our last paper in this journal analyzed the multi-dimensional factors of psychological health disparity under COVID-19 in Japan. This paper extends the analysis to physical health to explore the issue and proposes the concept of psychosomatic health, bridging the physical and psychological dimensions. It was found that the factors of physical health disparities were close to those of psychological health. According to this new analysis concerning psychosomatic health disparity, not only biological factors but also socio-economic-political factors are essential for the psychosomatic health disparities in the static analysis. In addition, the ethico-political factor of justice/fairness plays a critical role in the dynamic analysis concerning the suppression of the damage to well-being by COVID-19.
The result suggests the importance of multi-dimensional communitarian interventions, utilizing the term in political philosophy: it evaluates societal-community intervention as well as biological, political, and economic measures. Therefore, this study implies that, on this empirical basis, public deliberation with the ethical dimension and counting the relative weight of these factors with the temporal dimension in allocating resources is proposed as a theoretically desirable method of the new comprehensive intervention.
Keywords:
well-being
; psychological health
; socio-economic factors
; positive psychology
; fairness
; justice
; psychosomatic
1. Introduction
The present study analyzes the multi-dimensional factors of physical and psychological health disparities under COVID-19 in Japan, while the last study focuses on psychological health disparities. In doing so, it addresses the conjecture that psychological deterioration is closely associated with physical aggravation and that physical and psychological degeneration co-occur. This relationship corresponds to the relatively novel scientific knowledge that physical health is inextricably associated with psychological health, an acknowledgment akin to mind-body unity in various Eastern philosophies. Accordingly, this paper uses “psychosomatic health” to denote close mind-body alignment. It also aims to investigate physical/psychological or psychosomatic health during the COVID-19 pandemic and explore factors and methods to mitigate their deterioration or promote improvement.
This paper investigates physical/psychological health from this perspective and examines its conditions. While psychosomatic health would play a central role in this paper, as is often the case with psychology as usual, the term ‘“‘psychosomatic’ has been mainly used in the context of negative phenomena such as psychosomatic disease, disorder, and medicine in the literature of psychiatry, in particular, Freudian psychoanalysis so far [1,2,3]. Moreover, even the word ‘psychosomatic health’ almost always implies psychosomatic undesirable health problems [4,5,6,7]. In contrast, this study presents the novel usage of ‘psychosomatic health’ by defining it as the liaison between physical and psychological health with both positive and negative aspects.
Kobayashi and others [8] [8] address inequality and justice in political philosophy, featuring citizens’ psychological health disparities in pandemic-stricken Japan from the perspective of positive psychology with a collective/political perspective. This paper uses the same terminology as the last paper (section 2.2) regarding health inequity and disparity. While these papers use health inequality as a health difference in general, they define health disparity as the corresponding ethical concept of avoidable and unjust/unfair health inequality in general. Although its usage, especially in the United States, focuses on ethnicity and gender, this definition implies general ethical and normative issues concerning justice and fairness: it is a sub-issue of the broad problems of justice and fairness in society. Therefore, as this paper explores socio-economic and ethical elements, it will utilize not only health inequality but also health disparity/equity.
2. Materials and Methods
2.1. Population, Questions, and Collection of Data
This study utilizes the same data from the three online surveys as the previous study. So then, this section summarized the corresponding section in the last paper(section 3 in [8][8]).
The three online surveys were designed to comprehensively study the relationship between ‘individuals’ WB and the natural or social conditions surrounding those individuals: May 2020 with a sample size of 5,000; March 2021 with a sample size of 6,885; and October 2021 with a sample size of 2,472. Therefore, it contains many questions to identify the factors that promote WB. The responses were treated anonymously and tabulated. The statistical analyses focus on various WB and their relation to physical or psychological health and their changes due to COVID-19.
The number of questions in Surveys 1 through 3 was 383, 401, and 174, respectively. The respondents were asked to choose one number for each question from 1 (not agree at all) to 10 (agree very much), with a few exceptional questions mentioned below.
The principal indicators used to measure the degree of WB concerning this paper were (Appendix A-1.2.3):
1. SWLS (5 questions)
2. PERMA profiler (23 questions)
3. I COPPE (19 questions)
4. Physical/Mental and Feeling Change under COVID-19
In the items above, SWLS denotes the Satisfaction With Life Scale, developed by Ed-Diener [11] [11], which has been the most popular index of subjective WB. This indicator is the life satisfaction component of subjective WB.
PERMA, proposed by Seligman [12][12] , refers to the following five components of WB: Positive emotion (P), Engagement (E), Relationship (R), Meaning (M), and Accomplishment (A). The PERMA profiler developed by J. Butler and M. Kern also includes health(H) and negative emotion(N) [13][13].
I COPPE in the above list was developed by Prilleltensky and colleagues [14][14] to assess the multi-dimensional WB in various domains in life (as this acronym indicates): Overall, Interpersonal, Community, Occupational, Physical, Psychological, and Economic WB. Original I COPPE asks about past, present, and future, but our surveys are limited to the last two because of the practical limit concerning the number of questions. Moreover, questions about the future ask “a year from now” in the original I COPPE; “five years from now” in our survey. This modification (from one year to five years) is to ensure that respondents consider their situation well after the COVID-19 problem.
Furthermore, Survey 2 and Survey 3 introduced the measurement of Political WB and Cultural WB by asking questions about these life domains in parallel to the other WB (Appendix A-3). Accordingly, this questioner will be termed extended I COPPE or ICCOPPPE. Moreover, original simple questions measured the mental change. For example, survey 1 asked about the physical change and mental changes caused by COVID-19 (5 scales from 1 ‘“‘have become very ’” good’ to 5 ‘“‘have become very ’bad’).
Questions concerning this paper are related to biological, natural, cultural, and socio-economic factors of physical/psychological health. As biological factors such as healthy foods and exercise are regarded as indispensable, this paper analyzed the factors using the first two surveys (after section 4.1) because Survey 3 lacks these factors in the questions.
Survey 1, conducted in May 2020, collected responses from 5000 people living in ” ’ Japan’s 47 prefectures. The breakdown of the respondents was 50% (2,500) male and 50% (2,500) female. Survey 2, conducted in May 2021, also targeted residents of ” ’Japan’s 47 prefectures as in Survey 1 and received responses from 6,885 respondents. Of these, 64.3% (4,427) were male, and the age range varied from teens to those over the 70s. Survey 3, conducted from October 26 to 28, 2021, targeted the same 47 prefecture residents of Japan as Surveys 1 and 2, and responses were collected from 2,658 respondents. The male/female ratio was 66.2% (1,759)/33.8% (899).
An Internet research company conducted the surveys. However, as the original data collected online contained insincere responses, these were removed by a statistical standard. In concrete terms, Those responses with duplicate IDs, attribute mismatch with registered information, duplicate cookies, and, in the case of open-ended responses, responses that were unintelligible were dropped from the dataset. Further, those responses selected from the same option more than 90% of the time, and those responses only from three or fewer types of options in the question items were dropped; periodic responses were also dropped.
After the data cleaning, the number of respondents for Surveys 1, 2, and 3 was 4,698 (the male/female ratio was 48.6% (2,283)/ 51.4% (2415)), 6,855 (the male/female ratio was 64.2% (4,404)/ 35.8% (2,451)), and 2,472 (the male/female ratio was 65.8% (1,626)/ 34.2% (846)), respectively (see Appendix B for details).
2.2. Data Analysis Method
WB is measured in this paper by SWLS, PERMA, and I COPPE. Moreover, PERMA and I COPPE include terms concerning physical health. So, physical/ psychological health can be measured by (subjective) health/general WB in the PERMA indicator and physical WB/psychological WB in the I COPPE indicator. So then, an index of physical health is constituted in this paper by the mean of health(in PERMA)and physical WB(in I COPPE) as Psychological Health was defined as that of general WB(in PERMA) and psychological WB(in I COPPE) in the last paper.
Moreover, this paper introduces the concept of psychosomatic health in order to explore the association between psychological health and physical health. The simple way is to calculate the mean of physical health and psychological health: this will be called psychosomatic health. Nevertheless, this paper tries a few other methods to catch psychosomatic health in section 5 to explore this new concept. Physical Health, Psychological Health, and Psychosomatic Health will be abridged as PHH, PSH, and PSSH in the following.
First, some descriptive statistics were calculated for each survey. In particular, the change concerning WB under COVID-19 was analyzed in 3.1.
Secondly, the relation between objective personal economic situations in income/assets and the three kinds of health was examined about the health gap explained in the last paper in 3.2.
Thirdly, factors influencing the three kinds of health were examined along the health inequity framework described in the last paper. Based on the results of previous studies, this research analyzed biological, natural, cultural, and social-economic factors. Correlation calculations and multiple linear regression analyses (likelihood ratio (stepwise method), use of probability of F: entry 0.05, removal 0.10) were applied to estimate the impact of each factor in 4.1 and 4.2.
Fourthly, the concept and calculations of psychosomatic health were examined. Correlations between psychological health and physical health and correlations between these two kinds of health and the basic factors above were investigated in 5.1. Moreover, the relative importance of Psychosomatic Health for overall WB in I COPPE was estimated in 5.2. Furthermore, another calculation of psychosomatic health was tried, and the results using it were compared with those using Psychosomatic Health defined above in 5.3. This section conducted multiple linear regression analyses mainly using the forced entry method to investigate the relative importance of all variables.
Fifthly, factors concerning physical/mental changes under COVID-19 were analyzed in 6.1. and 6.2. As a result, fairness and justice were focused on as social determinants of health disparity, and their impacts on the level and the change of psychosomatic health were investigated by multiple regression analyses (backward elimination, likelihood ratio (stepwise method), use of probability of F: entry 0.05, removal 0.10).
Statistical analyses were conducted using the statistical package SPSS (version 28).
3. Results 1: Health Inequalities concerning Objective Personal Economic Situations
3.1. Decline in WB during the COVID-19
The last paper briefly described the development of the COVID-19 problem in Japan during the survey period(section 4.1.). Correspondingly, from Survey 1 to Survey 3, a continuous downward trend was detected in almost all of the measures examined, including SWLS, PERMA, and I COPPE. As the last paper demonstrates this by SWLS, this paper shows this by PERMA.
Figure 1 indicates general WB in PERMA profiler: this result is the same as the result in the last paper. Figure 2 indicates PSH, PHH, and PSSH: the results of PHH and PSSH are the same as PSH in the last paper.
3.2.Income and Psychosomatic Health
Survey 2 and Survey 3 asked about the annual income of an individual and his/her household. Figure 3 compares the mean of the two surveys about the mean values of PHP and PSSH as well as PSP in the last paper, divided into five classes according to their degree of household income. The results concerning PHH and PSSH are the same as PSP. It can be clearly seen that the higher the annual income, the higher all health indicators. The analysis of individual income also proves this tendency.
All in all, these figures indicate that psychosomatic health disparity measured by WB indicators (as subjective measures) has a close association with economic inequality (as objective measures) in Japan; this finding is in line with existing studies outside of Japan [15,16,17,18,19,20]. Although the health measured here is the person’s subjective perception of health (self-rated subjective health), this has been proved to be practical as a health indicator [21][21] . Thus, physical/psychosomatic health inequalities are related to economic factors, just as psychological health inequalities.
Moreover, this result extends the finding of the last paper concerning psychological health: psychological, physical, and psychosomatic health inequalities are related not only to poverty but also to the whole range of economic inequality.
4. Results 2: Factors of Psychosomatic inequality
4.1. Correlations with Psychosomatic Inequalities
The correlations between (subjective) Psychological Health and Physical Health are high: 0.809 in Survey 1, 0.784 in Survey 2, and 0.816 in Survey 3. This result aligns with previous studies on subjective health and subjective well-being [22][22]
In other words, subjective physical health is highly associated with WB, confirming that the relationship between body and mind is close. Table 1 summarizes the calculated correlations concerning the averages of the three surveys about PSH, PHH, and PSSH: this average will be called the three survey’s average correlations in the following.
Then, as Survey 1 and Survey 2 have survey items on exercise and foods, the last paper focused on the two surveys; in contrast, this paper analyzed the three surveys in terms of the factors extracted in the previous studies of health inequalities in the same way as the last paper: ascriptive factors, biological factors, natural and cultural factors, and social factors concerning economy, societal community, and politics. Therefore, these papers call the factors enumerated below ‘basic factors’ in contrast to additional factors in the later sections.
The correlations concerning psychological health are generally higher than physical health in the following items except for “exercise.” In other words, psychological health correlates more with the following factors, except for exercise concerning physical health.
1. ascriptive factors: sex, age, occupation, marriage
The correlations with attributes of sex and age in both surveys are less than 0.1 or insignificant. Only age has a weak association with PSH in the lower 0.1 range only in survey2.
The two surveys’ average correlations between marital status and PSH/ PHH/PSSH are lower than 0.2. In addition, the correlations concerning occupation (or no occupation) are below 0.25 (Table 1).
Accordingly, the correlations concerning ascriptive factors are low overall.
2. biological factors: exercise, foods, medical environment
The correlations in Survey1 between “exercise (adequate exercise habits”)” and PSH/ PHH are both in the higher 0.3 range, and the correlations concerning foods (healthy foods life or eating habits) are all in the 0.5 range. In Survey 2, “exercise and foods” are treated together in one item and are 0.6/0.7 range. So then, the two surveys’ average correlations concerning the three kinds of health are below 0.65 (Table 1).
The two surveys’ average correlations concerning the “medical environment” are in the 0.4 range in PHH and the 0.5 range in PSH and PSSH (Table 1).
Then, the biological factors have moderate but substantial associations with the three kinds of health. The correlation of physical health equals or exceeds psychological health in exercise in Survey 1. This exceptional result is understandable. Nevertheless, physical health is less than psychological health in foods in Survey 1 and exercise/ foods in Survey 2 (Appendix D): as a result, the two surveys’ average of exercise/ foods of PHH is less than PSH and PSSH (Table 1).
3. Natural and cultural factors: natural environment, educational environment
The two surveys’ average correlations concerning the “natural environment” range in the 0.4-0.5 range. The two surveys’ average correlations concerning the “educational environment (around oneself and children near them) are in the 0.5-0.6 range (Table 1).
Previous studies have demonstrated that education and the natural environment relate to health inequality, and this study confirms the substantial relation to the three kinds of health inequality.
4. Economic factors: income, assets, employment stability
The two survey’s average correlations concerning “income,” assets,” and employment stability” are in the 0.4-0.5 range in the three kinds of health.
Accordingly, the relations regarding the economic factors are moderate but substantial, as expected. This result confirms the analysis in 3-2 using the objective income.
5. Societal community factors: stratification satisfaction, general trust, disparity recognition, disparity elimination
The two survey’s average correlations with stratification satisfaction (satisfaction with social status and stratification, abridged as stratification in the following) are in the 0.5-0.6 range. The correlations with general trust (trust in people in general) are in the 0.4-0.6 range.
These correlations concerning societal-community factors are moderate, and those regarding stratification satisfaction are generally higher.
Further examining the relationship with disparity, the two survey’s average correlations with disparity recognition (in society) are in the 0.1 range. On the other hand, the total correlation with recognition of eliminating disparity (eliminating disparity and achieving an equal society through social welfare, redistribution through taxes, and so forth) ranges in the 0.3 range.
Accordingly, the correlations regarding the subjective disparity recognition or disparity elimination are significant but small; they are smaller than the two societal community factors above.
6. Political factors: fairness/justice, anti-corruptive fairness, human rights, and civil efficacy
The two survey’s average correlations with fairness/justice (in Japanese politics in terms of decision-making, the disparity between the rich and the poor, and so forth) and anti-corruptive fairness (the ’country’s government is fair and not corrupt) are in the 0.3 range. The correlations are small or moderate but substantial.
The correlations concerning human rights are in the 0.4-0.5 range. As rights are the central conception of justice in contemporary mainstream political philosophy (liberalism and libertarianism), this item is also related to justice. The correlations regarding civil efficacy (possibility or wish to change the society and politics towards desirable directions by ’ ’one’s own engagement) are in the 0.4-0.5 range: this factor is related to citizenship.
Accordingly, the correlations concerning human rights and civil efficacy are moderate, and these political factors, including fairness and justice, are small or moderate yet substantial.
Table 1 indicates the rankings of the factors concerning PSH, PHH, and PSSH. In addition, Table 2 shows the average and rankings of the correlations concerning the categories of factors.
Thus, as was pointed out in the discussion of health inequalities, social factors are pretty significant in the inequalities in these three indicators. According to Table 2, as the two surveys' averages of biological factors are the highest in the PHH, they are prominent factors, as expected.
Next, natural and cultural factors (natural and educational environment) are highest in PSH and PSSH.
Thirdly, although the societal community category is the fourth or fifth in Table 2, concerning each factor, stratification is the highest in PSH and PSSH and the second highest in PHH in Table 1: it even exceeds biological factors and natural/cultural factors in the three indicators.
Fourthly, the other social factors have moderate correlations next to the three categories. In fact, economic factors (income, assets, and employment stability) and political factors (human rights, civil efficacy) are comparable in magnitude to some biological factors (Table 1).
The category of political factors has a 0.3 range correlation in PHH and a 0.4 range correlation in PSH and PSSH (Table 2). The correlations concerning disparity recognition/elimination and fairness/justice are less than those of the biological factors (Table 1). Nevertheless, as human rights are essentially equal to legal justice, some factors in fairness and justice play a substantial role in predicting psychological health.
Consequentially, the results regarding physical health and psychosomatic health are very close to the psychological health reported in the last paper. While the last paper analyzed the first two surveys, this study analyzed the three surveys; accordingly, even correlations concerning PSH include new data, and its results confirms the results of the last paper. Moreover, the similarity between results concerning PSH and PHH in the three surveys indicates the robustness of results regarding psychosomatic health.
4.2. Multiple Regression Analyses on Psychosomatic Health
Then, multiple regression analyses on these factors have been conducted in order to analyze the relative importance of these basic factors in predicting psychosomatic health:As Survey 3 lacks questions on biological factors such as exercise and foods, the following analyses were restricted to Survey1 and Survey2 in the same way to the last paper. Appendix C shows the results, and Table 3 summarizes them. The latter indicates the ranking and relative importance(β)of factors concerning PSP, PHH, and PSSH; The colors of each cell indicate categories.
In the following, R2s are moderate, and PSH and PSSH are higher than PHH; factors will be enumerated mainly from the highest positive factors in the following.
The last paper reports the results concerning PSH. Concerning PHH, those with higher β are stratification, foods, young age (over 0.1), human rights, medical environment, natural environment, educational environment (over 0.07) in Survey1; exercise/foods (over 0.4), natural environment (over0.1), stratification, young age (over 0.07) in Survey2.
Regarding PSSH, factors with higherβare stratification, foods, natural environment, general trust, human rights (over0.1), civil efficiency, medical environment, educational environment, and young age (over0.07) in Survey 1; they are exercise/foods (over0.3), stratification, educational environment, general trust (over0.1), natural environment, medical environment (over0.07).
Therefore, these factors can be classified as the first group of factors: the dividing line in Table 3 roughly indicates this group as above the line. Accordingly, biological, societal community, and natural/cultural factors are the three essential factors in physical health; these three factors and political factors are the four essential factors in psychological health and psychosomatic health.
To a lesser degree than these, concerning PHH, there is occupation, assets (over 0.3 in both surveys), employment stability, and marital status (over 0.2 in either survey); concerning PSH, assets or income, marital status, occupation, sex (over 0.2 in both surveys), employment stability, disparity recognition (over 0.3 in either survey); Concerning PSSH, occupation, assets, marital status, sex (over 0.2 in both surveys).
So then, these factors can be classified as the second group of factors (Appendix E): these are basically below the dividing line. Accordingly, economic factors, some ascriptive factors (marital status, sex), and some social factors (disparity recognition) are related to the three kinds of health next to the first group.
Therefore, biological factors or stratification are the most effective, and the other natural/cultural and social (societal community, economic, and political) factors play a substantive role in the three kinds of health.
Table 4 summarizes these results as the relative ranking of categories. This ranking was the estimation by the two survey’s average total percentages of the standardized partial regression coefficients(β) of the factors within categories: as the number of factors varies between Survey 1 and 2, their values and the mean of the two surveys should be regarded as only a rough approximation of the relative importance of categories. Table 4-1 shows the average of two surveys about the sum concerning all basic variables within each category, while Appendix D is about the sum concerning the top two variables: these tables are shown just for information on trial calculations.
First, while the societal community factor is the highest in PSH, the biological factor is the highest in the two survey averages in PHH and PSSH (Table 4). In addition, it is noteworthy that the economic factor is 6th, less than the other categories not only in Psychological Health but also in the three kinds of health. In other words, natural and cultural, societal community, and political factors are more associated with the three kinds of health than economic factors.
Moreover, while political factors, including justice (human rights) and citizenship (civil efficacy), are the fourth in PSH, they are the fifth in PHH and PSSH.
On the other hand, fairness/justice does not appear to be a positive health factor; in particular, anti-corruptive fairness mainly has a negative partial regression coefficient in the three kinds of health (Appendix C). This negative association is contrary to the original theoretical supposition before calculation. However, this may be because people who realistically acknowledge Japanese society and politics tend to recognize corruptive unfairness but can hold better WB because their understanding is sober or reasonable.
Thus, the three kinds of health have a close connection with biological, natural, cultural, and social factors. While the last paper (Figure 5) exemplified the association by illustrating the result of multiple regression analysis concerning PSH, Figure 4 in this paper exemplifies the association by the result of PSSH. As social factors consist of economic, societal community, and political factors, these can be called socio-economic and political factors or simply socio-economic-political factors.
5. Examination of Psychosomatic Health
5.1. Liaison between Psychological and Physical Health
Analyses described so far demonstrate that results concerning physical health are principally the same as those of psychological health in the last paper.
So then, it is reasonable to conceptualize psychosomatic health, signifying that there is a close association between psychological and physical health. The correlation between PSH and PHH in section 4.1 has already verified this liaison. Moreover, the analyses using I CCOPPPE indicator can confirm this association more clearly.
Table 5A–C indicate the correlations between eight kinds of multi-dimensional WB in I CCOPPPE in three surveys. The results show that setting aside overall WB, the correlations between physical WB (IPh)and psychological WB (IPs) are the highest in all three surveys: 0.807(Survey1), 0.796(Survey2), 0.810(Survey3).
In addition, Table 6 indicates that correlations concerning psychological WB are higher than physical WB in terms of all basic factors (other than ascriptive factors) except exercise and foods in Survey 1. However, Table 6 also demonstrates that the difference between psychological WB and physical WB generally has small correlations with various factors. The table indicates this association by the correlations regarding the difference between Psychosomatic Health and Physical Health (PSSH – PHH) in terms of various basic factors: all correlations are below 0.2.
These results verify that the liaison between Psychological and Physical Health is close, and the concept of psychosomatic health is valid.
5.2. Relative Importance of Psychological/Physical Well-Being for Overall Well-Being
Multi-regression analyses concerning multi-dimensional WB in I CCOPPPE indicate each well-being’s relative importance. Table 7 shows the results when the dependent variable is overall WB: as the purpose is the comparison regarding relationship strength of all items concerned, the forced entry method in multiple linear regression analyses is used in analyses only in this section. Nevertheless, the results were compared to those by likelihood ratio (stepwise method, use of probability of F: entry 0.05, removal 0.10), and there is little difference between the two: non-significant variables in the forced entry method disappeared in the stepwise method. This similarity confirms the robustness of the results.
When independent variables are physical and psychological WB, their standardized partial regression coefficients are in the 0.1~0.2 range and 0.6 range, respectively, in Table 7A; when independent variables are all I CCOPPPE items except overall WB, the standardized partial regression coefficients of physical and psychological WB are in the -0.01~0.04 range and 0.1~0.2 range, respectively, in Table 7B; when independent variables are psychosomatic WB(calculated as the mean of psychological WB and physical WB) and the other I CCOPPPE items than overall, psychological, and physical WB, the coefficients of psychosomatic WB are in the 0.2 range in Table 7C.
The coefficients of psychological WB are larger than the corresponding physical WB more than several times. Therefore, the influence of the former is far more significant than the latter. In addition, the coefficients of psychological WB in Table 7B and that of psychosomatic WB in Table 7C are mostly the second highest. The highest in these two tables is always inter-relation WB(INT), and the third highest is mostly economic WB(IE): exceptional cases are Survey 3 in Table 7B(economic WB is the highest) and Survey 1 and 3 in Table 7C(economic WB is higher than psychosomatic WB). The central significance of inter-relationship confirms the well-known finding concerning human relations is most significant for WB as one of the representative positive psychologists expresses the maxim that others matter (Peterson [23][23]). Therefore, inter-relational WB is most related to overall WB; psychosomatic WB is also significantly associated with overall WB. Psychosomatic WB is often more associated with overall WB than economic WB (although sometimes less than economic WB) and, in all cases, than the other WB: community, occupational, political, and cultural WB.
5.3. Calculation of Psychosomatic Health
The analyses above calculate psychosomatic health(abbreviated as PSSH) simply as the mean of psychological and physical health: PSSH=(PHH +PSH)/2.
Nevertheless, the analysis in the last section (section 5.2) clarified that psychological WB is more significant than physical WB for overall WB. Accordingly, it can be argued that the former should have more weight than the latter in calculating psychosomatic WB.
So then, psychosomatic health can be calculated, considering the relative relationship between physical/psychological health and overall WB (IOv in I CCOPPPE) /SWLS/general WB(PERMA) in the multi-regression analyses. Psychosomatic health calculated in this way can be called ‘Adjusted Psychosomatic Health,’ abridged as APSSH. So then, when standardized partial regression coefficients of physical/psychological WB (Table8A)are abbreviated as physical/psychological SPRC(standardized partial regression coefficients), the adjusted psychosomatic health can be defined as follows:
APSSH=(PHH×physical SPRC +PSSH×psychological SPRC)/physical SPRC +psychological SPRC
Regarding R2 and adjusted R2, overall WB and general WB are in the 0.6 or 0.7 range, while SWLS was in the 0.4 or 0.5 range in the three surveys. Accordingly, overall WB and general WB were adopted as indicators of WB in the following analyses. Then, Table 8B indicates the correlations between APSSH and basic factors in comparison with those between PSSH and the basic factors in the three surveys. This comparison shows that there is little difference between the two in the value of coefficients and the relative order among the factors.
Moreover, Table 8C shows the results of a multi-regression analysis (enforced entry method)of the three surveys when the dependent variables are PSSH/APSSH (concerning overall WB)/ APSSH (concerning general WB). There is also little difference between the results regarding PSSH and the two kinds of APSSH in terms of the relative order of the basic factors.
Therefore, Adjusted Psychosomatic Health can function in the same way as Psychosomatic Health. . So, This paper mainly adopts the latter as a simple way of calculation.
6. Results 3: Psychosomatic Dynamics under COVID-19
6.1. Factors Concerning Physical Changes under COVID-19: Appearance of Disparity Recognition and Fairness/ Justice
Survey 1 includes physical/mental changes under COVID-19, enabling us to analyze the relationship between physical/psychological changes and the factors above. As the last paper focused on mental or psychological change, the following analyses add the physical aspects and the relationship between the two aspects.
First, the correlation between these two changes is moderate (0.457, Table 1).
Secondly, those with correlation coefficients of -0.1 or lower with regard either to physical or mental changes (high value signifies the wrong direction) are exercise, foods, educational environment, income, assets, employment stability, stratification, general trust, fairness/justice, anti-corruptive fairness, and civil efficacy. Perhaps because of correlations about change, the values (in the lower -0.1 range) are small (Table 1), with about the same for biological factors and social factors such as economic, societal-community (stratification, general trust), and political factors: in contrast, natural and cultural factors are relatively small. In particular, it is worth noting that anti-corruptive fairness and fairness/justice, which were smaller in value than the major factors in the above analysis, are about the same here.
Regarding physical change, categories from the highest are economic, biological, political, societal community, natural/cultural, and ascriptive. As economic factors are the highest and political factors are the third, the relative significance of these social factors rises in this analysis of this dynamic change compared with the analyses in section 4.2.
Thirdly, the same multiple regression analysis as above (Table 3, Appendix C) shows that for physical change (adjusted R-squared 0.042), items from the largest absolute value of β to the smallest are young age, foods, employment stability, disparity recognition (opposite sign to the other items), fairness/justice, general trust, and marital status(married). While only disparity recognition worsens the situation, the other factors facilitate the desired change or suppress the undesirable change in the physical change.
In these cases, the R-squared and overall values are small (below 0.1 except for age, 0.116 in the physical change). However, disparity recognition, fairness/justice, and anti-corruptive fairness emerge as significant factors in addition to the factors appearing in the multi-regression analysis in section 4.2. Moreover, the absolute value of disparity recognition and fairness/justice are the fourth and fifth largest concerning physical change. Accordingly, political factors are the fourth in the ranking of categories (Table 4); the societal community is the second (physical change), while economic factors are the fifth.
These results are very close to the results concerning psychological change in the last paper (section 6.1). So then, it can be concluded as follows: in a crisis such as COVID-19, disparity recognition, fairness, and justice play a more significant role than their general contribution to the physical/mental health in usual times in order to deter the decline of the WB of the body and mind.
6.2. Pivotal Factors of Fair/Just Society and Distributive Justice in the COVID-19 Crisis
The same arguments as the last paper are valid regarding fairness and justice. As these are essential factors, Survey2 increased related questions. Therefore, although the analyses above are restricted to items common in both surveys, the final analysis introduces additional new items (Appendix A-1): fair society (“‘Considering all, I think society now is ’fair’), just society (“‘Considering all, I think society now is ’just’), fair/just society (mean of fair society, unfair society (-), just society, and unjust society (-)), and distributive justice (mean of three items concerning the realization of distributive justice).
First, Table 1 also indicates their correlations. Correlation coefficients between fair/just society and three kinds of health are in the 0.3 (PHH) or 0.4 (PSH and PSSH) range, more than fairness/justice and anti-corruptive justice used in the analyses above.
Secondly, multiple regression analyses of the relationship between various factors and the three kinds of health lead to similar results to those in 4.1 about Survey 2.
In addition, It would be reasonable to assume that the level of physical/ psychological health and psychological factors such as optimism, will for contributing to people and society, and hedonic or eudaimonic orientation in WB(measured by Veronika Huta’s Hedonic and Eudaimonic Motives for Activities: Revised HEMA-R [24][24])also influence the three kinds of health. Then, adding these factors (Appendix A-1) into the multi-regression leads to an increase in R2, as Appendix E shows.
As a result of these analyses, the appeared variables are human rights (PHH, PSSH), fair/just society(PSH) other than HED, EUD, Contribution, and Optimism in Appendix E.[1].
In sum, there is little difference between the analyses above and those restricted to psychological health in the last paper. Consequently, it is obvious that fairness and justice, particularly distributive justice, are among the highest biological, natural, cultural, and social factors. Therefore, these results enable us to recognize the pivotal function of political factors regarding well-being in this period.
7. Discussions on Multi-Dimensional Dynamics of Psychosomatic Health Disparities
7.1. Multi-Dimensional Inequalities/Disparities and Policy Implications
The results of the analyses of the three surveys are almost the same as the tables and figures indicate. Survey 2 was conducted one year after Survey 1, and there was a severe life of COVID-19 for people between the two surveys(the second wave). This similarity of the results of multi-regression demonstrates the robustness of the results.
The discussions and conclusions in the last paper are sustained in terms of psychosomatic health, enlarged from psychological health. Therefore, the core arguments in the last paper will be summarized and developed in the following.
Although Japan is often considered one of the better countries in terms of health inequality, this study demonstrates its existence in Japan.
First, this investigation empirically has demonstrated the relative weights of factors classified into biological, natural/cultural, and social factors in psychosomatic health inequality. The results of this paper are in tune with most former studies on physical health inequality. As the last paper found that similar factors are significant in psychological health, this paper clarified that the arguments on health inequality are also valid as psychosomatic health inequality.
Secondly, although poverty is undoubtedly one of the causes of health inequality, as section 3.2 demonstrated, not only poverty but also objective economic gradient as a whole have clear correlations with psychosomatic health.
Thirdly, while some health inequality arguments focus on economic inequality, this study points to the significance of the other dimensions concerning inequality: not only income and assets but also other social factors, such as societal community factors, are associated with psychological health inequality.
Moreover, according to the correlation analysis in section4.1, the category of the economic factor is either the second or third highest in the three kinds of health (Table 2): less than natural/cultural factors, almost as much associated as biological and more than the societal community and political factors; in contrast, multi-regression analysis concerning three kinds of health in section 4.2 demonstrates that biological and societal community factors are the highest or the second highest and the other categories, including political factors, are more significant than the economic factor, which is the lowest or the second lowest (Table 4). This difference indicates that the other categories are even more essential than the economic category, at least in subjective perception. It follows that substantial parts that previous physical health inequality arguments ascribe to economic inequality are more closely related to natural, cultural, and socio-political factors than economic factors per se.
Therefore, not only economic but also natural, cultural, and socio-political gradients are related to psychosomatic health disparity. As far as political factors are concerned, this study illuminated that these are as significant as the other factors.
Fourthly, although the medical environment is one of the substantial factors (from eighth to tenth in the ranking of Table 1), other essential factors are equal to or more than that. As the quantity of resources for improving the latter does not seem to be necessarily more than the former, it would be desirable to execute public policies both for the medical environment and other factors in order to improve psychosomatic health.
These empirical arguments on factors concerning psychosomatic health inequality signify that the causes of their inequality are neither limited to the economic nor the medical gap. They are also associated with natural, cultural, and social inequalities.
Moreover, considerable parts of these may also be disparities defined above because they might be avoidable and ethically unjust/fair. Although it is unclear from the onset whether and to what extent some specific inequalities should be reduced, this is at least a theme of ethical and philosophical sincere debates. Therefore, it would be appropriate to term these factors regarding psychosomatic health inequality as “ ‘multi-dimensional psychosomatic health disparity,’’’ which relates to biological, natural, cultural, and socio-economic-political dimensions.
7.2. Philosophical Implications: Multi-dimensional, Multi-layered, and Ethical Fairness and Justice Against Psychosomatic Health Disparity
Furthermore, the last paper (section 7.2)discussed the philosophical implication in terms of representative political philosophy. As covered in work, the relationship between inequality and justice is one of the most critical subjects in political philosophy, including libertarianism, liberalism, and communitarianism〔section2 in [8], [8,9][9]〕.To sum up, while libertarianism and liberalism are grounded solely on individual rights, communitarians value ethical ‘good life’ and communal moments as well as rights. They often argue that excessive inequality is contrary to justice through people’s deliberative arguments, often including ethical perspectives concerning the good life; it should be somehow reduced for the weak in the fellow citizens because this policy is regarded to contribute to the common good. This argument is based on ethical or moral reasoning rather than rights ( [10,25,26]).
The paper concluded that its empirical analyses are in tune with the communitarian perspective, compared with the other political philosophies, including libertarianism and liberalism. This argument regarding psychological health is sustained with regard to psychosomatic health as well.
First, the multi-regression analyses of factors concerning the psychosomatic health disparity in section 4.2 demonstrate that, although economic factors are undoubtedly important, the other natural, cultural, and social or political factors are equal to or even more than them in their association; moreover, these other factors are not simply the mediating factor between economic factors and the disparity but relatively independent factors along with economic factors. Therefore, tackling the multi-dimensional disparity beyond the simple economic dimension would be indispensable.
Secondly, therefore, equalizing the whole hierarchy to some extent in multi-dimensional disparity would be a philosophically cardinal agenda to be challenged for solving the issue of psychological health disparity.
Thirdly, this study also demonstrates the significance of societal community factors such as stratification and general trust. These communal or relational aspects are, in reality, consistent with communitarianism.
Fourthly, the fairness/justice issue in this analysis includes the ethical dimension. Although anti-corruptive fairness is negatively associated with psychosomatic health (section 4.2), it often mitigates psychosomatic changes for undesirable directions (sections 6.1. and 6.2.) .
This fact implies that the ethical dimension of fairness involved in anti-corruptive fairness is vital in times of crisis. This role is as significant as economic factors, such as employment stability, and social factors, such as disparity recognition; it seems to be more than biological, natural, cultural, and societal community factors, which are prominent in usual times.
Therefore, the ethical factor of fairness plays a crucial role in the dynamic analysis in sections 6.1 and 6.2 rather than the static analysis in sections 4.1 and 4.2: anti-corruptive fairness has a small or moderate correlation with psychosomatic health but a considerable coefficient in multi-regression analysis. The reason for its increase in the dynamic analysis may be that people who believe in anti-corruptive fairness in politics can maintain hope and, therefore, their psychological health.
As communitarian political philosophy evaluates communality and ethicality in arguments for justice, the third and fourth point increases its plausibility [27] [27]. In concomitant with this, it would be better to regard justice and fairness as “‘ethico-political factors.’’’
In sum, the multi-dimensional, multi-layered, and ethico-political conception of justice and fairness would be effective in resolving the psychosomatic health disparity.
7.3. Dynamism in the COVID-19 Crisis: Critical Significance and Causality of Fairness and Justice
Furthermore, this paper clarified the dynamism in the psychosomatic health changes during the COVID-19 crisis, reinforcing the finding of the last paper on psychological health. Although political factors can be discerned in predicting psychosomatic health disparity, they are relatively inconspicuous among the other prominent factors: the fifth(average) in Table 4. However, the analyses in sections 6.1 and 6.2 demonstrate that political factors, including disparity recognition, fairness, and justice, play a salient role in psychosomatic change. Moreover, not only the ethical aspect discussed in the last section but also other items of fairness and justice, such as fairness/justice, distributive justice, and fair/just society, are significant in the dynamic analysis of these kinds of health.
The finding above is itself noteworthy, but it also leads us to the following crucial reasoning discussed in the last paper regarding psychological health (section 7.3). Since fairness and justice are associated with not only the level of psychosomatic health but also its change, it can be presumed that this relationship is not only a correlation but also a mainly unidirectional causality.
8. Towards Communitarian Interventions
8.1. Summary of the Analysis: Multi-Dimensional Factors of the Psychosomatic Health Inequalities/Disparities
This paper, together with the last paper, illuminated the multi-dimensional factors of the psychosomatic health inequalities/disparities under COVID-19 by introducing positive and social aspects of WB into measurement: there are, of course, biological factors, but the importance of natural, cultural, and social elements was verified. This result is clearly similar to previous studies on physical health.
Table 4 summarizes their relative importance, and the rough numbers concerning Psychosomatic Health in units of 5% are 30%,25%, 15%, 10%, and 5%; in short, the ratios are 6 (biological):5 (societal community):3 (natural and cultural):2(ascriptive, political):1 (economic).
Moreover, Figure 5 illustrates the importance of categories both in static analysis and dynamic analyses: regarding the static analysis, Figure 5A is about PSH, PHH, and PSSH, while regarding dynamic analysis, Figure 5B is about mental/physical change. Figure 5A illustrates the ranking: regarding PSSH, ①biological,②societal community, ③natural and cultural, ④ascriptive, ⑤political, ⑥economic. Figure 5B offers the impression. Excluding the ascriptive for comparison, 5B①societal community, ②biological, ③④political and economic.
Therefore, while biological factors are the first in the static analysis and second in the dynamic analysis, societal community factors remain the second or first of these two. While political factors are the first in the dynamic analysis regarding feeling change in the last paper (Figure 5B), these are the fourth or fifth in these analyses. Nevertheless, economic factors are below or near the political ones. Finally, natural and cultural factors are the third in the static analysis but disappear in the dynamic analyses.
Reflecting on these results, the conclusion of the last paper is maintained: the cardinality of the societal community factors and the relative significance of political factors (a little more than economic factors) is consistent with the communitarian political philosophy.
It would be necessary to note that this calculation and ranking is merely an approximate estimation or impression, but the following remarkable conjecture is reasonable: while biological, natural, and cultural factors decrease in the dynamic analysis, social factors increase their significance in the dynamic analysis; political factors particularly increase their influence in feeling change with stably important societal community factor.
8.2. Multi-dimensional Communitarian Interventions: Societal-Community, Political, and Economic Measures
Consequently, substantial health inequalities are associated with economic, cultural, social, and political structures in static and dynamic analyses. Therefore, these are also health disparities because they can be unjust or unfair and are avoidable: although the influence of some ascriptive factors, such as age, is unavoidable to some extent, collective human efforts can change most cultural or social conditions. Accordingly, it would be possible and desirable to amend the avoidable unfair and unjust health disparities through human interventions. The changeable factors exclude the ascriptive factors. In the statistic analysis in Figure 5A, the pivotal factors in the order from top to bottom are biological, societal-community, natural-cultural, political, and economic factors. Furthermore, multiple regression analysis of PSSH and APSSH(Table 8C) may suggest significant points for improving the psychosomatic health disparity: values of variables over 0.05 at least in one survey will be mentioned below.
First, as biological factors, including exercise/foods, diets, and medical environment, naturally are significant for the purpose, it would be essential to facilitate the improvement of these conditions through efforts in the sphere of public health and medicine.
Secondly, community intervention is indispensable as the societal community factor is as significant as the biological one. As stratification satisfaction and general trust are the variables, various policies or interventions for increasing these may improve psychosomatic health disparity. The examples are enhancing stratification satisfaction by reducing the differences concerning stratification and increasing the general trust among citizens in their communities by ameliorating morality, public security, and supportive systems, including social institutions with helpful social workers ( [29][29]).
In addition, while biological factors are most influential to PHH, societal community factors are most influential to PSH(Table 4). It is natural that the most significant factors are biological factors in physical health and societal-community factors in psychological health. Accordingly, while biological interventions are especially important in physical or material aspects, societal community factors are in psychological aspects. In sum, both the biological approach and social approaches are indispensable for reducing psychosomatic health disparities.
Thirdly, natural and cultural factors have considerable influence on the health diparity. Therefore, it may improve the natural environment and educational environment, for example, by enabling every person to access suitable natural or educational environments.
Fourthly, political factors also have some effects: human rights and evil efficiency. As a result of this, public efforts for preserving and realizing human rights and enabling citizens to have the sense that they can change politics and policies.
Fifthly, economic factors, including income and assets, are not as cardinal as the abovementioned factors. So, though it is meaningful to improve these, it is insufficient to implement only economic intervention, such as welfare or income policy.
It goes without saying that biological interventions are effective, but the other ones are the focus of this paper because the significance of these interventions is not self-evident. In addition, the economic differences analyzed in the section 3-2 are demonstrated not to be the most important factor by the multiple regression analysis in Tasble 8C. Accordingly, the most significant among the other factors is the societal community intervention, which can be described as the community intervention.
At the same time, cultural, political, and economic factors cannot be neglected, and interventions concerning all these factors can be termed communitarian interventions, using the terminology of political philosophy. The reason is that communitarianism values the critical importance of community, but cultural, political, and economic spheres are also essential for it.
Furthermore, the relative importance of the factors and the rough numbers concerning Psychosomatic Health suggest the priorities and desirable weight of policies for the factors. As resources, including budget, are limited, it would be reasonable to decide the ratio of money for each policy according to the relative importance of each factor, taking account of their temporal dimensions. It would be possible to prioritize intervention in one sphere, for example, reforms in the societal community at one time, and focus on another kind of intervention later.
Nevertheless, deciding which sphere should be emphasized at a specific time would not be easy. Moreover, it is almost impossible to account for the cost and merit exactly; in other words, it is impossible to estimate accurately the budget and the effects of a policy for reducing health disparities. Accordingly, making such decisions after value deliberation would be best if the approximate estimation of options is taken into account.
This way of decision-making is just the way of decision communitarianism advocates in political philosophy. Some political philosophy insists on the existence of objectively just decisions. For example, Simple utilitarianism argues for maximizing happiness. However, this idea cannot apply at least to this theme because of the impossibility mentioned above. Liberalism believes in universal justice, such as human rights or the principles of justice. However, even if some intervention requirements can be discerned, deciding the priority among them is impossible. The decisions require some value judgements but are impossible to make objectively. Thus, public deliberation associated with value judgments is necessary, as communitarianism argues. People can decide the priority and weight of interventions with a schedule among the biological, societal community, political, and economic ways.
In short, the desirable interventions based on this paper's analysis are multi-dimensional communitarian interventions. First, community interventions for reforming societal communities are regarded as critical. Second, the other interventions regarding biological, natural/cultural, political, and economic factors are also worthwhile. Thus, this intervention method is not exclusive but comprehensive and multi-dimensional. Thirdly, the priority and weight of these interventions should be decided by public deliberation with value judgments, considering the significance of factors for health disparities and the rough estimation of cost and effects for concrete intervention methods.
9. Limits of This Study
As for some limitations of this study, Although only some income/assets questions are subjective and objective, the other survey items here are about subjective perceptions. Accordingly, research on objective facts about psychosomatic health and factors would be desirable, such as the influence of various objective factors on objective health.
Secondly, as the base of this paper is online surveys through an internet survey company, this study contains methodological limitations. For example, the company gathered respondents by offering purchase points; this survey is not randomized.
Thirdly, self-reporting questionnaires like these surveys can contain self-biases. Again, this problem is well-known in psychology, and verifying the results using surveys other than self-reporting surveys would be desirable.
Fourthly, this study analyses the data collected in all prefectures in Japan as a whole because it intends to investigate the general tendency and factors concerning WB, mainly on a scale of the nation-state. Accordingly, this did not scrutinize the influence and differences of areas within Japan. However, as there are differences regarding residence (prefectures with or without big cities(Appendix B) between the three surveys, the robustness of the results seems to demonstrate that this factor does not affect the main results much. Nevertheless, since the influence of COVID-19 differed in various prefectures, as Appendix C indicates, analyzing this factor will be a task in the future.
Fifthly, the data in this paper was collected in Japan during the pandemic, and it is necessary to conduct research in other regions and situations. Accordingly, the results of this analysis, for example, the relative weight of various factors in their influence on psychosomatic health, should not be universalized. Therefore, it would be helpful to compare the results of this study with various studies in other areas and dates. Moreover, the weights perhaps change according to areas, dates, and related conditions. This point is worth pursuing further.
Accordingly, social factors are important to scrutinize by other regions' surveys, considering cultural, social, or political differences. For example, the degree of social influence, including peer-to-peer comparison and screening among its citizens, appears relatively strong in Japan under COVID-19 [28][28] . As the last paper mentioned, such a feature may influence the association of social and political factors with psychological health differences.
Sixthly, the correlation between physical and psychological health may increase because of the PERMA question order and I CCOPPPE. The places of questions regarding physical WB and psychological WB are more or less near because these are situated within each questioner; if there is more distance between physical WB and its corresponding psychological WB, correlations become less. Nevertheless, section 5.1 demonstrates that the correlations between physical WB and psychological WB are the highest among various correlations concerning eight kinds of well-being; these high correlations at least reflect the relative closeness between physical WB and psychological WB.
Seventhly, this paper does not explore the effects of concrete intervention methods in each sphere. Each intervention sphere, such as societal community intervention, includes various concrete methods, and their investigations are beyond the scope of the present paper.
10. Conclusion: Multi-Dimensional Factors and Interventions for Psychosomatic Health
Equity
Thus, the correlation between health disparity's psychological and physical dimensions is striking. Accordingly, this paper extends the conclusion of the last paper on psychological health to psychosomatic health health. The main findings of this paper are as follows: there are multi-dimensional factors, including socio-economic-political factors. Not only economic factors but also societal community, natural/cultural, and political factors in the social realm are significant. Furthermore, they are even vital, especially in analyzing dynamism, as a key factor in deterring the decline of psychological health. Accordingly, the intervention for fairness/justice with their ethical dimension is a protective way for psychosomatic or comprehensive health.
This study endorses the importance of fairness in the sense of equality in reducing the health gap; at the same time, this illuminates the ethical sense of fairness for the purpose. These two senses are quantitative fairness (fairness as equality) and qualitative fairness (fairness as ethicality), and both composites equity[2].
Accordingly, reducing the multi-dimensional disparities into more equal or ethically upright situations would increase physical/psychological health and health equity. This can be termed Psychosomatic Health Equity. To achieve this, the analysis of several factors of health disparities in this paper is worthwhile. It demonstrates the multi-dimensional factors, and this finding leads to the desirability of multi-dimensional interventions: biological, societal community, natural/cultural, political, and economic interventions.
Societal community intervention is one of the most effective ways to reduce health disparities, but other interventions are also helpful. The priority and weight of various interventions can be decided by public deliberation with the ethical dimension, considering each factor's contribution to the psychosomatic health disparities and approximate estimation of cost and merit. In these senses, this paper proposes a multi-dimensional communitarian intervention, inspired by communitarian political philosophy.
The achievement of health equity will be the lofty purpose of human civilization. The collective endeavor for the common good, overcoming the pandemic calamity, should be the global enterprise against the multi-dimensional health disparity in the present real world.
Supplementary Materials
The following supporting information can be downloaded at the website of this paper posted on Preprints.org.
Author Contributions
Conceptualization, MK, and JM; methodology, MK; formal analysis, M.K., H.Ishikawa.; validation, M.K., H.Ishido. and H.Ishikawa.; investigation, JM; resources, MK and H.Ishido.; data curation, H.Ishikawa.; writing—original draft preparation, MK, and H.Ishido; writing—review and editing, JM; visualization, H.Ishikawa.; supervision, MK; project administration, JM; funding acquisition, JM All authors have read and agreed to the published version of the manuscript.
Funding
This research was funded by JSPS(Japan Society For The Promotion Of Study) KAKENHI (Grants-in-aid for Scientific Research), Grant Numbers 20K01469 and 21H04386, and Chiba University Leading Research Promotion Program: Chiba Studies on Global Fair Society New Frontiers of Studies on Fair Society Values and Public Vision in the age after COVID 19.”.
Institutional Review Board Statement
Ethical review and approval were acquired at Survey 3 from the Research Ethics Review Committee in the Graduate School of Social Sciences at Chiba University. There was no such procedure concerning the first two surveys. The reason is as follows. The first survey was conducted by a well-known Japanese research institute (Mitsubishi Research Institute) in collaboration with Masaya Kobayashi. The authors conducted the second and third surveys through JSPS KAKENHI and financial aid from Chiba University (see above), but Survey 2 was conducted before the ethical ’ ’committee’s establishment.
Informed Consent Statement
Informed consent was obtained from all subjects involved in the study.
Data Availability Statement
As for the data used in this study, please contact the corresponding author (Masaya Kobayashi).
Acknowledgments
We wish to thank our research consultant, Ms.Yuki Tashiro, for her dedicated collaborative work in preparing this manuscript.
Conflicts of Interest
The authors declare no conflict of interest. The funders had no role in the design of the study, in the collection, analyses, or interpretation of data, in the writing of the manuscript, or in the decision to publish the results.
Appendix A. Questions in the Three Surveys
Appendix A.1. Factors in Survey 1, Survey2 and Survey 3
| Category | Factor | Survey 1 | Survey 2 | Survey 3 | Answer |
| Ascriptive factors | sex | Please let us know your sex. | Please let us know your sex. | Please let us know your sex. | 1 (Male), 2 (Female) |
| age | Please let us know your age. | Please let us know your age. | Please let us know your age. | ||
| occupation | Please let us know your occupation. | Please let us know your occupation. | Please let us know your occupation. | See Appendix B,“Occupation” | |
| marriage | Are you married? | Are you married? | Are you married? | See Appendix B,“Marital status” | |
| Biological factors | exercise/foods | Do you think you are doing healthy exercise and eating? | 1 = not at all, 10 = very much |
||
| exercise | Do you consider your exercise habits to be adequate? | ||||
| foods | Do you consider yourself to eat healthily? | ||||
| medical environment | Do you think the medical environment in your neighborhood, such as hospitals and pharmacies, is well-developed? | Do you think the medical environment in your neighborhood, such as hospitals and pharmacies, is well-developed? | |||
| Natural and Cultural factors | natural environment | How rich and blessed do you feel about the natural environment surrounding you? | Do you think the natural environment surrounding you is good? | Do you think the natural environment surrounding you is good? | 1 = not at all, 10 = very much |
| educational environment | How well do you feel about your own educational or lifelong learning environment and the learning environment of the children around you? | Do you think your own educational or lifelong learning and the learning environment of children around you are fulfilling? | Do you think your own educational or lifelong learning and the learning environment of children around you are fulfilling? | ||
| Economic factors | income | Do you think your income is sufficient for you to make a living now that COVID-19 has struck? | Do you think your income is sufficient to live your life? | Do you think your income is sufficient to live your life? | 1 = not at all, 10 = very much |
| assets | Do you think you have sufficient assets (financial, house, land, car, etc.) to live your life now that COVID-19 has occurred? | Do you consider your assets (financial, house, land, car, etc.) sufficient for your life? | Do you consider your assets (financial, house, land, car, etc.) sufficient for your life? | ||
| employment stability | Now that COVID-19 has occurred, do you consider your employment to be stable? | Do you feel that you have stability in your employment? | Do you feel that you have stability in your employment? | ||
| Societal community factors | stratification satisfaction | I think I am satisfied with my social status and stratification. | Are you satisfied with your social status and stratification? | Are you satisfied with your social status and stratification? | 1 = not at all, 10 = very much |
| general trust | Do you find people generally trustworthy? | Do you find people generally trustworthy? | Do you find people generally trustworthy? | ||
| disparity recognition | How much disparity do you think exists in the society around you? | Do you think that there is a disparity in the society around you? | Do you think that there is a disparity in the society around you? | ||
| disparity elimination | Do you think that the society around you realizes the elimination of disparities (equal society) through social welfare and redistribution through taxes? | Do you think that the society around you realizes the elimination of disparity (equal society) through social welfare and redistribution through taxes? | Do you think that the society around you realizes the elimination of disparity (equal society) through social welfare and redistribution through taxes? | ||
| Political factors | fairness/justice | I believe that fairness and justice are achieved in our country’s politics in terms of decision-making, the disparity between rich and poor, and so on. | Do you think that Japanese politics achieve fairness and justice in terms of decision-making, the disparity between rich and poor, and so on? | Do you think that Japanese politics achieve fairness and justice in terms of decision-making, the disparity between rich and poor, and so on? | 1 = not at all, 10 = very much |
| Anti-corruptive fairness | I think that my government is corruption-free and fair. | Do you think that the Japanese government is corruption-free and fair? | Do you think that the Japanese government is corruption-free and fair? | ||
| human rights | I believe that fundamental human rights are respected in my country. | Do you think that fundamental human rights are respected in Japan? | Do you think that fundamental human rights are respected in Japan? | ||
| civil efficacy | How much do you think you can change the society and politics around you in a desirable direction through your involvement? | Do you want to change the society and politics around you in a desirable direction through your involvement? | Do you want to change the society and politics around you in a desirable direction through your involvement? |
Additional Factors
| Category | Factor | Survey 2 | Survey 3 | Answer |
| Fair society | fair society | All things to be considered, I think our current society is fair . | All things to be considered, I think our current society is fair . | 0 = not at all, 10 = completely |
| Just society | just society | All things to be considered, I think our current society is just. | All things to be considered, I think our current society is just. | |
| Fair/Just Society * | 1 | All things to be considered, I think our current society is fair . | ||
| 2 | All things to be considered, I think our current society is unfair . | |||
| 3 | All things to be considered, I think our current society is just. | |||
| 4 | All things to be considered, I think our current society is unjust. | |||
| Distributive Justice ** | disparity of justice | Do you think the disparity in Japan is in the right/ just state? | ||
| welfare justice | Do you think that welfare is rightly/ justly correcting the disparity in current society? | |||
| Contribution Optimism | contribution | Do you want to contribute to society? | Do you usually seek to contribute to others or the world around you in your activities? | 0 = not at all, 10 = completely |
| optimism | How optimistic would you say you are about your future? | I am optimistic about my future. |
Source: Made by the authors. Notes: * The score for Fair society/Just society is calculated as the “sum of the scores for the items 1, 2, 3 and 4” divided by 4. The score for item 2 and item 4 is calculated by the subtraction of 11 from the original figure. ** As for Distributive Justice, the score is calculated by “the sum of the scores for the disparity of justice, welfare justice, and disparity elimination” divided by 3.
Appendix A.2.Changes
Mental and Physical Changes (Survey1)
What changes have you seen in your own situation from March (2020), when Covid-19 became more serious in Japan, until now?
| Item | Survey 1 |
| Mental change | Mental changes, such as anxiety and restlessness. |
| Physical Change | Physical Change, such as condition and health situation. |
Method: The scale of responses is as follows.
Response 1: Very much better/very much stronger
Response 2: Slightly better/slightly stronger
Response 3: Not much change
Response 4: Slightly worse/slightly weaker
Response 5: Very much worse/very much weaker
Appendix A.3. PERMA Profiler, SWLS, I COPPE, and Revised HEMA—R
SWLS
Below are five statements that you may agree or disagree with. Indicate your agreement with each item by placing the appropriate number on the line preceding that item. Please be open and honest in your response.
| Question | Answer in this survey | Original answer | |
| 1 | In most ways, my life is close to my ideal. | 1 = Strongly disagree, 10 = Strongly agree |
1 = strongly disagree, 2 = Disagree, 3 = Slightly disagree, 4 = Neither agree nor disagree, 5 = Slightly agree, 6 = Agree, 7 = Strongly agree |
| 2 | The conditions of my life are excellent. | ||
| 3 | I am satisfied with my life. | ||
| 4 | So far, I have gotten the important things I want in life. | ||
| 5 | If I could live my life over, I would change almost nothing. |
Notes: For details, see the site on SWLS (http://labs.psychology.illinois.edu/~ediener/SWLS.html). Accessed on 14th, Oct., 2024.
PERMA Profiler
| # | Label | Question | Answer in This Survey | Original Response Anchors |
| Block 1 | A1 | How much of the time do you feel you are making progress toward accomplishing your goals? | 1 = not at all, 10 = completely |
0 = never, 10 = always |
| E1 | How often do you become absorbed in what you are doing? | |||
| P1 | In general, how often do you feel joyful? | |||
| N1 | In general, how often do you feel anxious? | |||
| A2 | How often do you achieve the important goals you have set for yourself? | |||
| Block 2 | H1 | In general, how would you say your health is? | 1 = not at all, 10 = completely |
0 = terrible, 10 = excellent |
| Block 3 | M1 | In general, to what extent do you lead a purposeful and meaningful life? | 1 = not at all, 10 = completely |
0 = not at all, 10 = completely |
| R1 | To what extent do you receive help and support from others when you need it? | |||
| M2 | In general, to what extent do you feel that what you do in your life is valuable and worthwhile? | |||
| E2 | In general, to what extent do you feel excited and interested in things? | |||
| Lon | How lonely do you feel in your daily life? | |||
| Block 4 | H2 | How satisfied are you with your current physical health? | 1 = not at all, 10 = completely |
0 = not at all, 10 = completely |
| Block 5 | P2 | In general, how often do you feel positive? | 1 = not at all, 10 = completely |
0 = never, 10 = always |
| N2 | In general, how often do you feel angry? | |||
| A3 | How often are you able to handle your responsibilities? | |||
| N3 | In general, how often do you feel sad? | |||
| E3 | How often do you lose track of time while doing something you enjoy? | |||
| Block 6 | H3 | Compared to others of your same age and sex, how is your health? | 1 = not at all, 10 = completely |
0 = terrible, 10 = excellent |
| Block 7 | R2 | To what extent do you feel loved? | 1 = not at all, 10 = completely |
0 = not at all, 10 = completely |
| M3 | To what extent do you generally feel you have a sense of direction in your life? | |||
| R3 | How satisfied are you with your personal relationships? | |||
| P3 | In general, to what extent do you feel contented? | |||
| Block 8 | hap | Taking all things together, how happy would you say you are? | 1 = not at all, 10 = completely |
0 = not at all, 10 = completely |
Notes: For details, see [13]. P = Positive emotions, E = Engagement, R = Relationships, M = Meaning, A = Accomplishment, H = Health, N = Negative emotions, Lon = Lonely, hap = happiness.
I COPPE/ I CCOPPPE
All questions start with the following stem: The top number ten represents the best your life can be. The bottom number zero represents the worst your life can be. When it comes to….
| Label | Question | Answer in This Survey | Original Answer |
| OV_WB_PR | When it comes to the best possible life for you, on which number, do you stand now? | 1 = the worst your life can be 10 = the best your life can be | 0 = the worst your life can be10 = the best your life can be |
| OV_WB_PA | When it comes to the best possible life for you, on which number, did you stand five years ago? | ||
| OV_WB_FU | When it comes to the best possible life for you, on which number, do you think you will stand five years from now? | ||
| IN_WB_PR | When it comes to relationships with important people in your life, on which number, do you stand now? | 1 = the worst your life can be10 = the best your life can be | 0 = the worst your life can be10 = the best your life can be |
| IN_WB_FU | When it comes to relationships with important people in your life, on which number, do you think you will stand five years from now? | ||
| CO_WB_PR | When it comes to the community where you live, on which number, do you stand now? | 1 = the worst your life can be10 = the best your life can be | 0 = the worst your life can be10 = the best your life can be |
| CO_WB_FU | When it comes to the community where you live, on which number, do you think you will stand five years from now? | ||
| OC_WB_PR | When it comes to your main occupation (employed, self-employed, volunteer, stay at home), on which number, do you stand now? | 1 = the worst your life can be10 = the best your life can be | 0 = the worst your life can be 10 = the best your life can be |
| OC_WB_FU | When it comes to your main occupation (employed, self-employed, volunteer, stay at home), on which number, do you think you will stand five years from now? | ||
| PH_WB_PR | When it comes to your physical health, on which number, do you stand now? | 1 = the worst your life can be10 = the best your life can be | 0 = the worst your life can be10 = the best your life can be |
| PH_WB_FU | When it comes to your physical health, on which number, do you think you will stand five years from now? | ||
| PS_WB_PR | When it comes to your emotional and psychological well-being, on which number, do you stand now? | 1 = the worst your life can be10 = the best your life can be | 0 = the worst your life can be10 = the best your life can be |
| PS_WB_FU | When it comes to your emotional and psychological well-being, on which number, do you think you will stand five years from now? | ||
| EC_WB_PR | When it comes to your economic situation, on which number, do you stand now? | 1 = the worst your life can be10 = the best your life can be | 0 = the worst your life can be10 = the best your life can be |
| EC_WB_FU | When it comes to your economic situation, on which number, do you think you will stand five years from now? | ||
| PO_WB_PA | When it comes to your political situation, on which number, do you stand now? | 1 = the worst your life can be10 = the best your life can be | |
| PO_WB_FU | When it comes to your political situation, on which number, do you think you will stand five years from now? | ||
| CU_WB_PA | When it comes to your cultural situation, on which number, do you stand now? | 1 = the worst your life can be10 = the best your life can be | |
| CU_WB_FU | When it comes to your cultural situation, on which number, do you think you will stand five years from now? |
Notes: For details, see [14]. OV_WB = Overall Well-Being, IN_WB = Interpersonal Well-Being, CO_WB = Community Well-Being, OC_WB = Occupational Well-Being, PH_WB = Physical Well-Being, PS_WB = Psychological Well-Being, EC_WB = Economic Well-Being. PO_WB=Political Well-Being, CU_WB=Cultural Well-Being. PR = Present, PA = Past, FU = Future. Original I COPPE in Survey 1 includes the former seven items; I CCOPPPE in Survey 2 and Survey 3 adds the latter two items. In the original I COPPE , the treatment of PA (Past) is applied to variables from IN_WB to EC_WB; in our survey, this was not applied. In addition, there was OV_WB_PA in our survey, but this study did not use the question. In the original survey (above), PA (Past) denotes “a year ago,” and FU(Future) denotes “a year from now”; in our survey, these are modified to “five years ago” and “five years from now,” respectively. The reason for this modification (from one year to five years) is to ensure that respondents consider their situation well before (for the case of PA) or well after (for the case of FU) the outbreak of COVID-19.
Revised HEMA—R
To what degree do you typically approach your activities with each of the follow-ing intentions, whether or not you actually achieve your aim?
| Question | Answer in This Survey | Original answer | |
| 1 | Seeking relaxation? | 1 = not at all, 10 = very much |
1 = not at all, 7 = very much |
| 2 | Seeking to develop a skill, learn, or gain insight into something? | ||
| 3 | Seeking to do what you believe in? | ||
| 4 | Seeking pleasure? | ||
| 5 | Seeking to pursue excellence or a personal ideal? | ||
| 6 | Seeking enjoyment? | ||
| 7 | Seeking to take it easy? | ||
| 8 | Seeking to use the best in yourself? | ||
| 9 | Seeking fun? | ||
| 10 | Seeking to contribute to others or the surrounding world? |
Notes: For details, see [24]. In this survey, the response scale of 1 (not at all) to 10 (very much) is adopted.
Appendix B. Respondents of the Three Surveys (after Data Screening)
| Survey 1 (%) | Survey 2 (%) | Survey 3 (%) | |
| Number of respondents | 4698 | 6855 | 2472 |
| Number of survey questions | 383 | 401 | 174 |
| Residence | |||
| 16 prefectures with big cities | 2783(59.2) | 1520(22.2) | 1207(48.8) |
| 32 prefectures without big cities | 1915(40.8) | 5335(77.8) | 1265(51.2) |
| Sex | |||
| Male | 2283(48.6) | 4404(64.2) | 1626(65.8) |
| Female | 2415(51.4) | 2451(35.8) | 846(34.2) |
| Age | |||
| 10’s | 790(16.8) | 36(0.5) | 7(0.3) |
| 20’s | 759(16.2) | 460(6.7) | 125(5.1) |
| 30’s | 785(16.7) | 1038(15.1) | 346(14.0) |
| 40’s | 783(16.7) | 1726(25.2) | 610(24.7) |
| 50’s | 777(16.5) | 1740(25.4) | 626(25.3) |
| 60’s | 804(17.1) | 1236(18.0) | 480(19.4) |
| 70’s and more | 619(9.0) | 278(11.2) | |
| Marital status | |||
| married | 2172(46.2) | 4074(59.4) | 1418(57.4) |
| unmarried | 2301(49.0) | 2242(32.7) | 846(34.2) |
| separation | 225(4.8) | 539(7.9) * | 208(8.4) ** |
| Occupation | |||
| executive of a company or association | 44(0.9) | 123(1.8) | 53(2.1) |
| office worker, staff of an association | 1386(29.5) | 2085(30.4) | 734(29.7) |
| Part-time employee, contract employee, dispatched labor | 206(4.4) | 1196(17.4) | 433(17.5) |
| Part-time worker, part-time job, home-based workers without an employment contract | 585(12.5) | 17(0.2) | 7(0.3) |
| civil servants | 140(3.0) | 253(3.7) | 68(2.8) |
| Self-employed, family employee, freelance | 286(6.1) | 818(11.9) | 294(11.9) |
| faculty member | 123(1.8) | 39(1.6) | |
| student | 795(16.9) | 95(1.4) | 26(1.1) |
| homemaker | 700(14.9) | 766(11.2) | 292(11.8) |
| pensioner | 147(3.1) | 603(8.8) | 267(10.8) |
| none | 365(7.8) | 690(10.1) | 240(9.7) |
| others | 44(0.9) | 86(1.3) | 19(0.8) |
| Education | |||
| currently attending high school | 351(7.5) | 43(0.6) | 7(0.3) |
| currently attending vocational college, specialized training college | 75(1.6) | 84(1.2) | 26(1.1) |
| currently attending junior college, college | 48(1.0) | 47(0.7) | 8(0.3) |
| university/college preparatory school | 14(0.3) | 4(0.1) | |
| currently attending university | 366(7.8) | 88(1.3) | 35(1.4) |
| currently attending a Master’s or Doctoral course | 22(0.5) | 19(0.3) | 3(0.1) |
| junior high school | 70(1.5) | 175(2.6) | 50(2.0) |
| high school | 997(21.2) | 2153(31.4) | 664(26.9) |
| vocational college, specialized training college | 370(7.9) | 638(9.3) | 240(9.7) |
| junior college, college | 404(8.6) | 598(8.7) | 217(8.8) |
| university | 1778(37.8) | 2657(38.8) | 1081(43.7) |
| more than a Master’s degree | 203(4.3) | 349(5.1) | 141(5.7) |
Notes: * divorce 418 (6.1)/death 121 (1.8). ** divorce 161 (6.5)/death 47 (1.9).
Appendix C. Multiple Regression Analysis of the Basic Factors (Surveys 1 and Survey2)
| PSH | PHH | PSSH | Mental change | Physical change | |||||
| Survey1 | Survey2 | Survey1 | Survey2 | Survey1 | Survey2 | Survey1 | Survey1 | ||
| R | 0.815 | 0.835 | 0.708 | 0.727 | 0.795 | 0.818 | 0.203 | 0.210 | |
| R2 | 0.664 | 0.697 | 0.501 | 0.529 | 0.631 | 0.670 | 0.041 | 0.044 | |
| adjusted R2 | 0.663 | 0.696 | 0.500 | 0.528 | 0.630 | 0.669 | 0.040 | 0.042 | |
| β | β | ||||||||
| Ascriptive factors(4) | Sex | 0.031** | 0.022 | 0.017* | 0.043** | ||||
| [13] | [14] | [5] | |||||||
| Age | -0.033* | 0.023** | -0.109** | -0.087** | -0.075** | -0.048** | 0.029* | 0.116** | |
| [11] | [13] | [3] | [4] | [9] | [8] | [7] | [1] | ||
| Occupation | 0.033** | 0.027** | 0.046** | 0.036** | 0.042** | 0.033** | |||
| [11] | [12] | [11] | [9] | [12] | [11] | ||||
| Marriage | 0.052** | 0.031** | 0.036** | 0.045** | 0.024* | -0.037* | |||
| [10] | [10] | [13] | [11] | [13] | [7] | ||||
| Biological factors(3/2) | Exercise/ Foods | ー | 0.296** | ー | 0.411** | ー | 0.377** | ||
| ー | [1] | ー | [1] | ー | [1] | ||||
| Exercise | ー | 0.064** | ー | 0.040** | ー | -0.060** | |||
| ー | [9] | ー | [13] | ー | [2] | ||||
| Diets | 0.155** | ー | 0.198** | ー | 0.185** | ー | -0.090** | ||
| [2] | ー | [2] | ー | [2] | ー | [2] | |||
| Medical environment | 0.078** | 0.106** | 0.086** | 0.057** | 0.087** | 0.081** | |||
| [8] | [5] | [5] | [7] | [7] | [6] | ||||
| Natural and Cultural factors(2) | Natural environment | 0.114** | 0.088** | 0.083** | 0.108** | 0.103** | 0.097** | ||
| [4] | [6] | [6] | [2] | [3] | [5] | ||||
| Educational environment | 0.090** | 0.149** | 0.071** | 0.064** | 0.084** | 0.111** | |||
| [7] | [2] | [7] | [5] | [8] | [3] | ||||
| Economic factors(3) | Income | 0.029* | |||||||
| [11] | |||||||||
| Assets | 0.061** | 0.046** | 0.044** | 0.057** | 0.055** | 0.064** | |||
| [9] | [7] | [12] | [7] | [10] | [7] | ||||
| Employment stability | 0.036** | 0.027* | 0.037** | -0.039* | -0.060** | ||||
| [9] | [11] | [10] | [6] | [3] | |||||
| Societal community factors(4) | Stratification satisfaction | 0.322** | 0.137** | 0.242** | 0.095** | 0.294** | 0.121** | -0.087** | |
| [1] | [4] | [1] | [3] | [1] | [2] | [1] | |||
| General trust | 0.126** | 0.144** | 0.067** | 0.058** | 0.100** | 0.100** | -0.040* | ||
| [3] | [3] | [8] | [6] | [5] | [4] | [6] | |||
| Disparity recognition | 0.034** | 0.016* | 0.053** | 0.050** | |||||
| [14] | [15] | [4] | [4] | ||||||
| Disparity elimination | |||||||||
| Political factors(4) | Fairness/ Justice | -0.046** | |||||||
| [5] | |||||||||
| Anti-corruptive fairness | -0.076** | -0.048** | -0.045** | -0.063** | -0.042** | -0.058** | |||
| [14] | [15] | [14] | [14] | [16] | [3] | ||||
| Human rights | 0.103** | 0.089** | 0.101** | 0.027* | |||||
| [6] | [4] | [4] | [12] | ||||||
| Civil efficiency | 0.114** | 0.042** | 0.064** | 0.028* | 0.092** | 0.039** | |||
| [4] | [8] | [10] | [10] | [6] | [9] | ||||
Notes: ** :p < 0.01, * :p < 0.05. Independent variables: all basic factors, including Ascriptive factors. PSH and notes of other variables: see Table 1. Blank spaces indicate that the factor does not ap-pear in the analysis. The figure in brackets indicates the order (from the highest) of the magnitude of each variable. “Exercise” and “Foods” are separately asked in Survey 1, while an integrated item, “exercise/Foods,” is asked in Survey 2. - indicates ‘no calculation.’ The italicized figures in parentheses indicate the number of variables in each category; as for biological factors, refer to Table 1.
Appendix D. Multiple Regression Analysis: Total Value of the Standardized Partial Regression Coefficients of Basic Variables for Each Category (Top 2 Items)
| PHH | PSH | PSSH | Mental change | Physical change | |||||||
| Survey1 | Survey2 | Average | Survey1 | Survey2 | Average | Survey1 | Survey2 | Average | Survey1 | ||
| Ascriptive factors(4) | 0.155(14.1%) | 0.123(12.0%) | 0.139(13.1%) | 0.085(6.8%) | 0.058(5.3%) | 0.072(6.1%) | 0.120(9.8%) | 0.081(7.1%) | 0.101(8.5%) | 0.072(19.5%) | 0.153(34.9%) |
| [5] | [4] | [4] | [5] | [5] | [5] | [5] | [4] | [5] | [2] | [1] | |
| Biological factors(3/2) | 0.284(25.8%) | 0.468(45.5%) | 0.376(35.4%) | 0.233(18.7%) | 0.402(36.5%) | 0.318(27.0%) | 0.272(22.3%) | 0.458(40.4%) | 0.365(31.0%) | 0.060(16.3%) | 0.090(20.5%) |
| [1] | [1] | [1] | [2] | [1] | [2] | [2] | [1] | [1] | [3]1 | [2]1 | |
| Natural and Cultural factors(2) | 0.154(14.0%) | 0.172(16.7%) | 0.163(15.3%) | 0.204(16.3%) | 0.237(21.5%) | 0.221(18.8%) | 0.187(15.3%) | 0.208(18.3%) | 0.198(16.8%) | ||
| [3] | [2] | [3] | [3] | [3] | [3] | [4] | [3] | [3] | |||
| Economic factors(3) | 0.044(4.0%) | 0.084(8.2%) | 0.064(6.0%) | 0.061(4.9%) | 0.082(7.4%) | 0.072(6.1%) | 0.055(4.5%) | 0.101(8.9%) | 0.078(6.6%) | 0.039(10.6%) | 0.060(13.7%) |
| [6]1 | [5] | [6] | [6]1 | [4] | [5] | [6]1 | [5] | [6] | [5]1 | [4]1 | |
| Societal community factors(4) | 0.309(28.1%) | 0.153(14.9%) | 0.231(21.7%) | 0.448(35.9%) | 0.281(25.5%) | 0.365(31.0%) | 0.394(32.3%) | 0.221(19.5%) | 0.308(26.1%) | 0.140(37.9%) | 0.090(20.5%) |
| [2] | [3] | [2] | [1] | [2] | [1] | [1] | [2] | [2] | [1] | [2] | |
| Political factors(4) | 0.153(13.9%) | 0.028(2.7%) | 0.091(8.5%) | 0.217(17.4%) | 0.042(3.8%) | 0.130(11.0%) | 0.193(15.8%) | 0.066(5.8%) | 0.130(11.0%) | 0.058(15.7%) | 0.046(10.5%) |
| [4] | [6]1 | [5] | [4] | [6]1 | [4] | [3] | [6] | [4] | [4]1 | [5]1 | |
Note: Table 3.
Appendix E. Multiple Regression Analysis of All Factors, Including Additional Items
| PSH | PHH | PSSH | ||
| R | 0.882 | 0.747 | 0.851 | |
| R2 | 0.778 | 0.558 | 0.725 | |
| adjusted R2 | 0.778 | 0.557 | 0.724 | |
| β | ||||
| Ascriptive factors(4) | Sex | 0.021** | 0.016* | |
| [12] | [17] | |||
| Age | -0.090** | -0.049** | ||
| [3] | [9] | |||
| Occupation | 0.021** | 0.037** | 0.029** | |
| [12] | [8] | [11] | ||
| Marriage | 0.031** | 0.022** | ||
| [10] | [15] | |||
| Biological factors(3/2) | Exercise/ Foods | 0.181** | 0.355** | 0.287** |
| [2] | [1] | [1] | ||
| Medical environment | 0.070** | 0.036** | 0.052** | |
| [7] | [9] | [8] | ||
| Natural and Cultural factors(2) | Natural environment | 0.036** | 0.078** | 0.056** |
| [9] | [4] | [6] | ||
| Educational environment | 0.063** | 0.045** | ||
| [8] | [10] | |||
| Economic factors(3) | Income | 0.025** | ||
| [11] | ||||
| Assets | 0.033** | 0.025* | ||
| [11] | [13] | |||
| Employment stability | 0.018* | |||
| [16] | ||||
| Societal community factors(4) | Stratification satisfaction | 0.095** | 0.068** | 0.081** |
| [5] | [6] | [5] | ||
| General trust | 0.082** | 0.029* | 0.055** | |
| [6] | [12] | [7] | ||
| Disparity recognition | ||||
| Disparity elimination | ||||
| Political factors(4) | Fairness/ Justice | |||
| Anti-corruptive fairness | -0.041** | -0.034** | ||
| [15] | [18] | |||
| Human rights | 0.022* | 0.025** | ||
| [13] | [13] | |||
| Civil efficiency | ||||
| HED | 0.120** | 0.074** | 0.097** | |
| [4] | [5] | [4] | ||
| EUD | 0.177** | 0.052** | 0.118** | |
| [3] | [7] | [3] | ||
| Fair/Just Society | 0.016** | |||
| [14] | ||||
| Contribution | -0.035** | -0.027** | ||
| [10] | [12] | |||
| Optimism | 0.268** | 0.210** | 0.251** | |
| [1] | [2] | [2] | ||
References
- Aisenstein, M. and Rappoport de Aisemberg, E. (eds.), Psychosomatics Today. (The International Psychoanalytical Association Psychoanalytic Ideas and Applications Series), New York: Routledge, 2010.
- Wolman, B.B., Psychosomatic Disorders, New York: Plenum Pub Corp, 1988.
- Ackerman, D.K. and DiMartini, A. F. (eds.), Psychosomatic Medicine (Pittsburgh Pocket Psychiatry), New York: Oxford University Press, 2015.
- Turp, M., Psychosomatic Health: The Body and the Word, London: Red Globe Press, 2001.
- Spillane, A., Larkin, C., Cocroan, P., Matvienko-Sikar, K. and Riordan, F. , "Physical and Psychosomatic Health Outcomes in People Bereaved by Suicide Compared to People Bereaved by Other Modes of Death: A Systematic Review," BMC Public Health, vol. 17, no. 939, 2017. [CrossRef]
- Friberg, P., Hagquist, C. and Osika, W., "Self-perceived Psychosomatic Health in Swedish Children, Adolescents, and Young Adults: An Internet-Based Survey over Time," 2012. [Online].
- Paschouna, D. A., Damigosa, D., Skapinakisa, P. and Siamopoulosa,, "The Psychosomatic Health of the Spouses of Chronic Kidney Disease Patients," European Psychiatry, no. 30, 2015. [CrossRef]
- M. Kobayashi, H. Ishido, J. Mizushima and H. Ishikawa, "Multi-Dimensional Dynamics of Psychological Health Disparities under the COVID-19 in Japan: Fairness/Justice in Socio-Economic and Ethico-Political Factors," International Journal of Environmental Research and Public Health, vol. 19, no. 24, 2022. [CrossRef]
- M. Kobayashi, "Chapter 7 Well-being and Fairness in the COVID-19 Crisis in Japan: Insights from Positive Political Psychology," in Social Fairness in a Post-Pandemic World: Interdisciplinary Perspectives, New York, Palgrave, forthcoming.
- Kobayashi, M, "Political Philosophies and Positive Political Psychology: Inter-Disciplinary Framework for the Common Good," Front. Psychol., no. 12, 2021. [CrossRef]
- Diener, Ed., The Science of Well-Being: The Collected Works of Ed Diener, Springer Science + Business Media, 2009.
- Seligman, M.E.P., Flourish: A Visionary New Understanding of Happiness and Well-being, New York: Atria, 2012.
- Butler, J. and Kern, M.L., "The PERMA-Profiler: A brief multidimensional measure of flourishing," International Journal of Wellbeing, vol. 6, pp. 1-48. https://doi.org/10.5502/ijw.v6i3.526, 2016. [CrossRef]
- Prilleltensky, I., Foodsz, S., Prilleltensky, O., Myers, N., Rubenstein, C., Jin, Y. and McMahon, A., "Assessing multi-dimensional well-being: development and validation of the I COPPE scale," Journal of Community Psychology, no. 43, p. 199–226, 2015.
- Wilkinson, R.G., The Impact of Inequality: How to Make Sick Societies Healthier, New York: The New Press, 2005.
- Wilkinson, R. and Pickett, S., The inner level: How more equal societies reduce stress, restore sanity and improve everyone’s well-being, London: Penguin Books, 2019.
- Wilkinson, R. and Pickett, S., The spirit level: Why greater equality makes societies stronger, London: Bloomsbury, 2011.
- Marmot, M.G., The Health Gap: the Challenge of an Unequal World, New York: Bloomsbury Pub Plc, 2015. [CrossRef]
- Marmot, M. and Wilkinson, R.G. (eds), Social Determinants of Health, New York: Oxford University Press, 2006.
- Kawachi, I., Kennedy, B.P. and Wilkinson, R.G., The Society and Population Health Reader: Income Inequality and Health, New York: New Press, 1999.
- Hunt, S.M., "Subjective Health Indicators and Health Promotion," Health Promotion International, vol. 3, no. 1, pp. 23-34, 1988. [CrossRef]
- C. Monden, "Subjective Health and Subjective Well-Being," in Encyclopedia of Quality of Life and Well-Being Research, vol. 20, Dordrecht, Springer, 2014.
- Peterson, C., A Primer in Positive Psychology, New York: Oxford University Press, 2006.
- Huta, V., "Eudaimonic and Hedonic Orientations: Theoretical Considerations and Research Findings," in Handbook of Eudaimonic Well-being, New York, Springer, 2016.
- M. J. Sandel, Justice: What's the Right Thing to Do?, Farrar, Straus and Giroux-Macmillan, 2009.
- M. J. Sandel, Liberalism and the Limits of Justice, Cambridge University Press, 1982.
- Kobayashi, M., "Psychological Examination of Political Philosophies: Interrelationship Among Citizenship, Justice, and Well-Being in Japan. " Front. Psychol. , no. 12, 2022.
- Mizushima, J., "Yoroppa Shokoku no Koronaka eno Taiou to Shakaiteki Kousei (Response to the Corona Disaster and Social Justice in European Countries)," in Afuta Korona no Kousei Shakai (in Japanese) (Fair Society after the COVID-19), Tokyo: Akashi Shoten, 2022.
- P. and. O. Prilleltensky, Promoting Well-Being: Linking Personal, Organizational, and Community Change, John Wiley and Sons, Inc., 2006.
- Kobayashi, M., "“Tajigenteki na Tougouteki Kouseishakai Riron” (in Japanese) (Multidimensional Integrative Fair Society Theory)," in Kouseishakai no Bijon (The Vision for a Fair Society), Tokyo, Akashi Shoten, 2021.
Figure 1.
Comparison of WB in the Three Surveys (general WB Index).
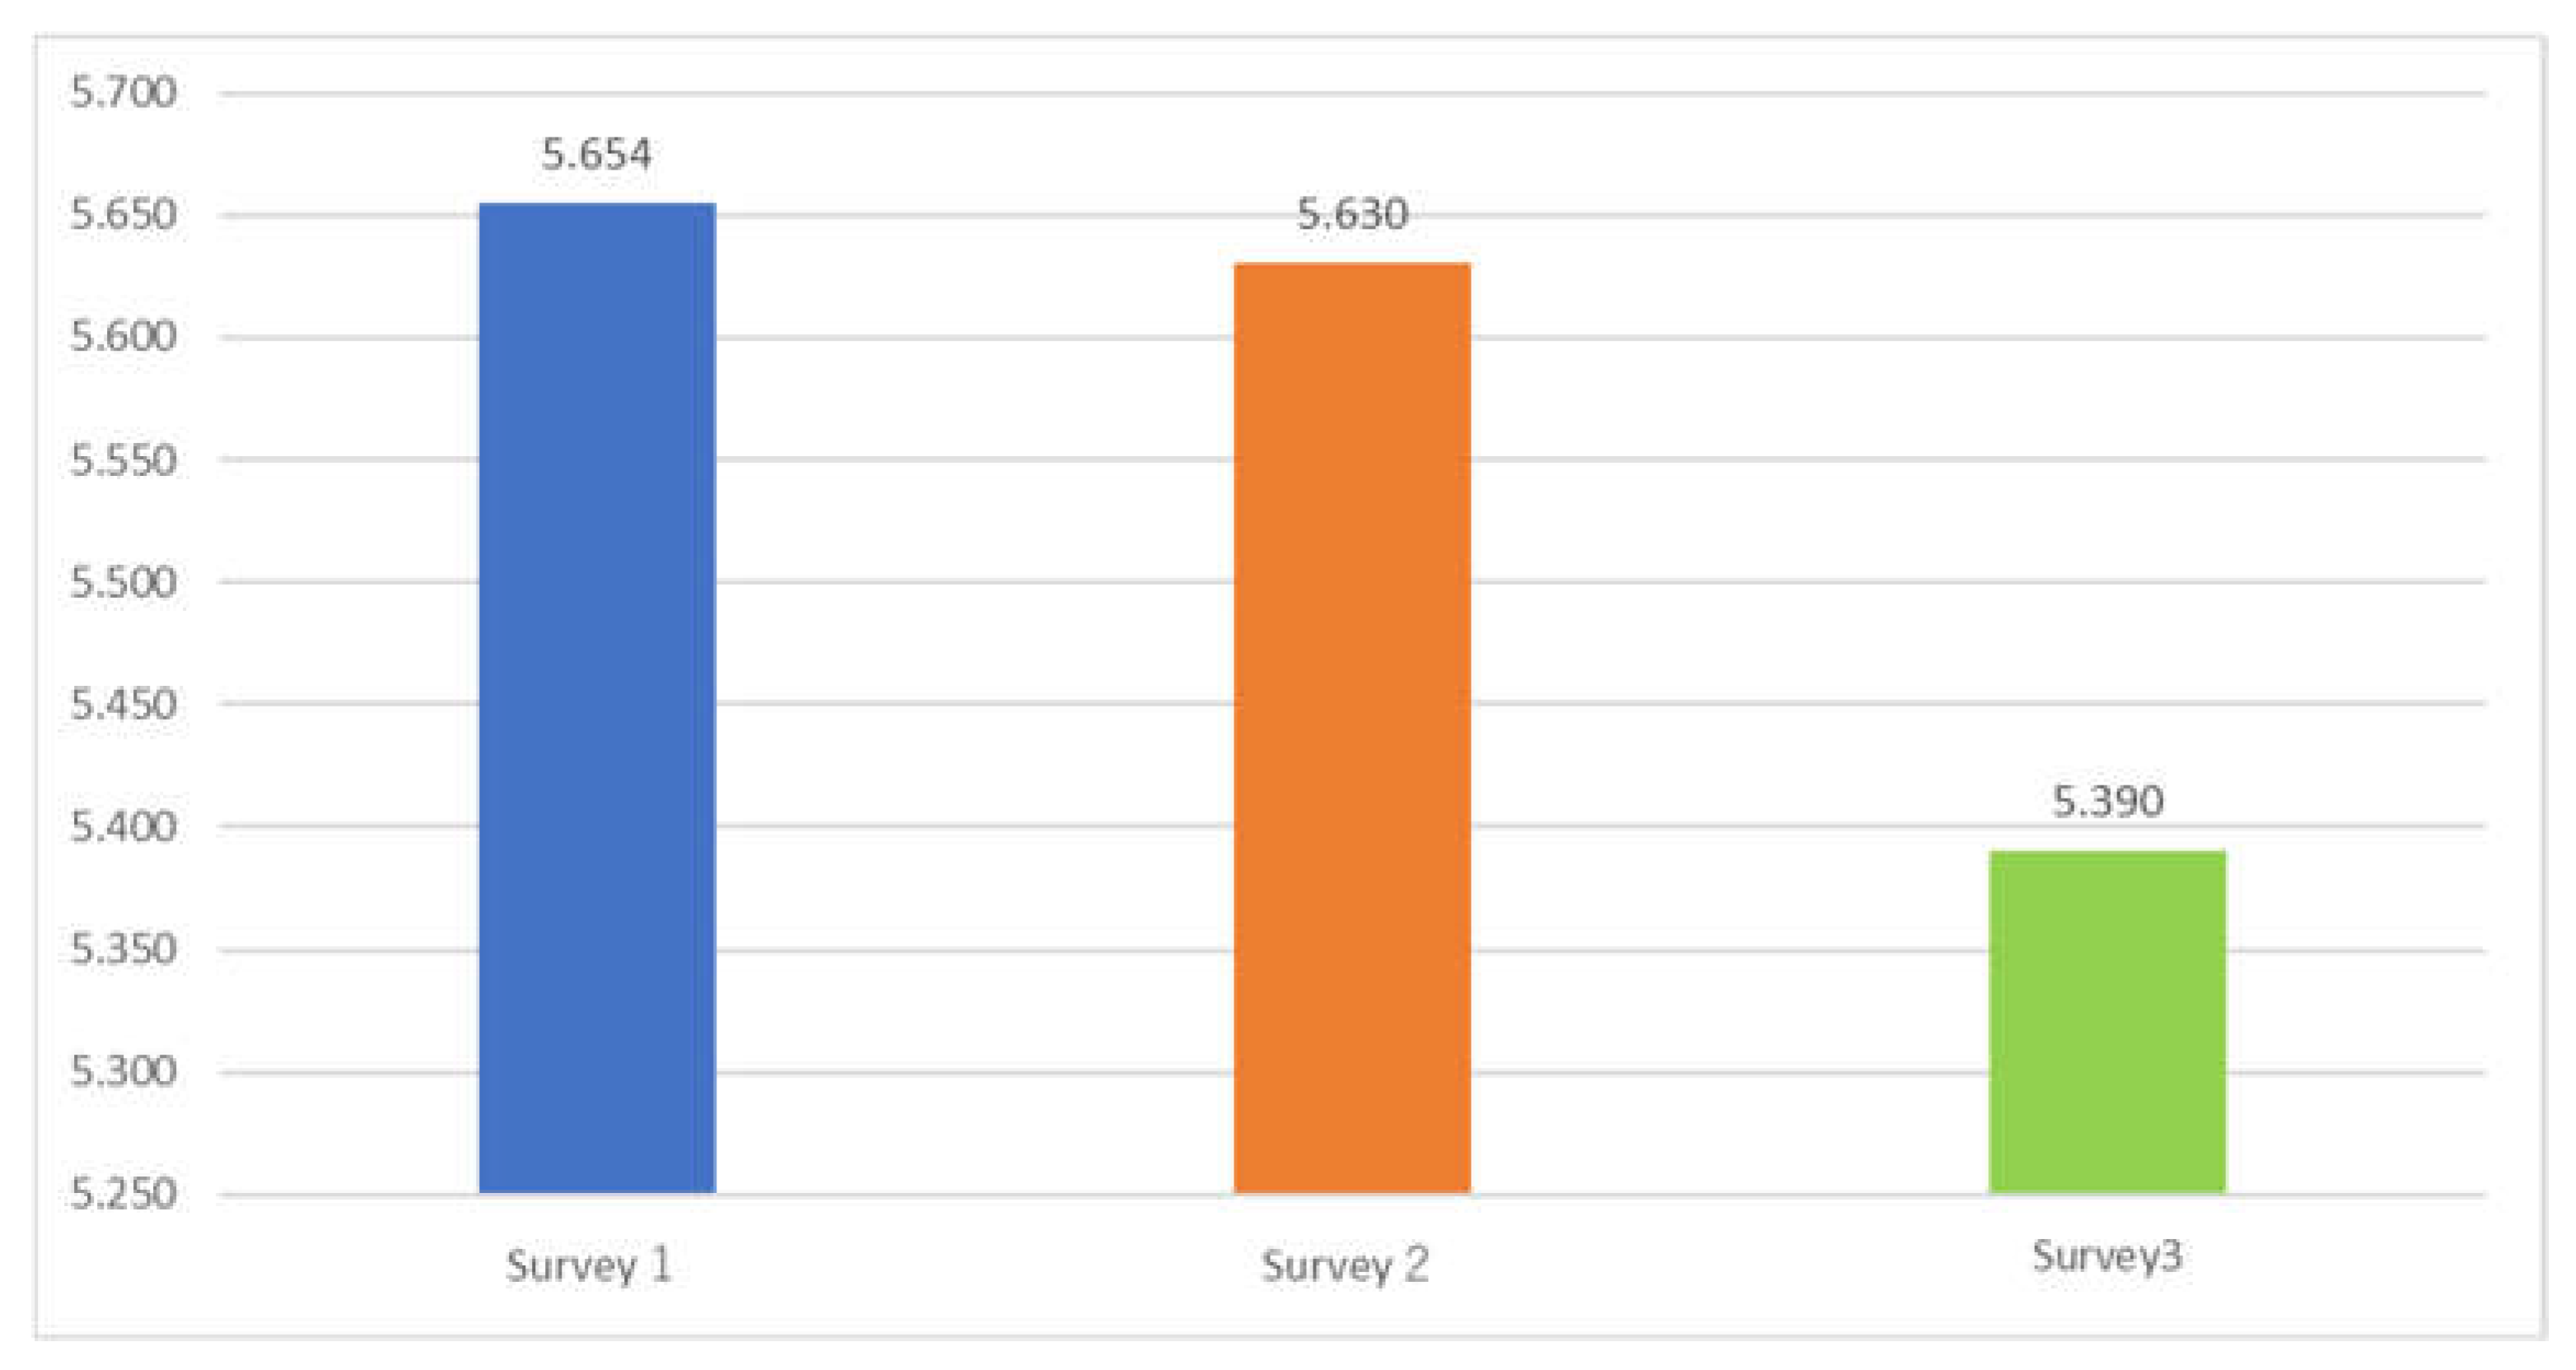
Figure 2.
Comparison of Health-related Indices in the Three Surveys (Psychological/ Physical/Psychosomatic Health Index) (PSH/ PHH/PSSH).
Figure 2.
Comparison of Health-related Indices in the Three Surveys (Psychological/ Physical/Psychosomatic Health Index) (PSH/ PHH/PSSH).
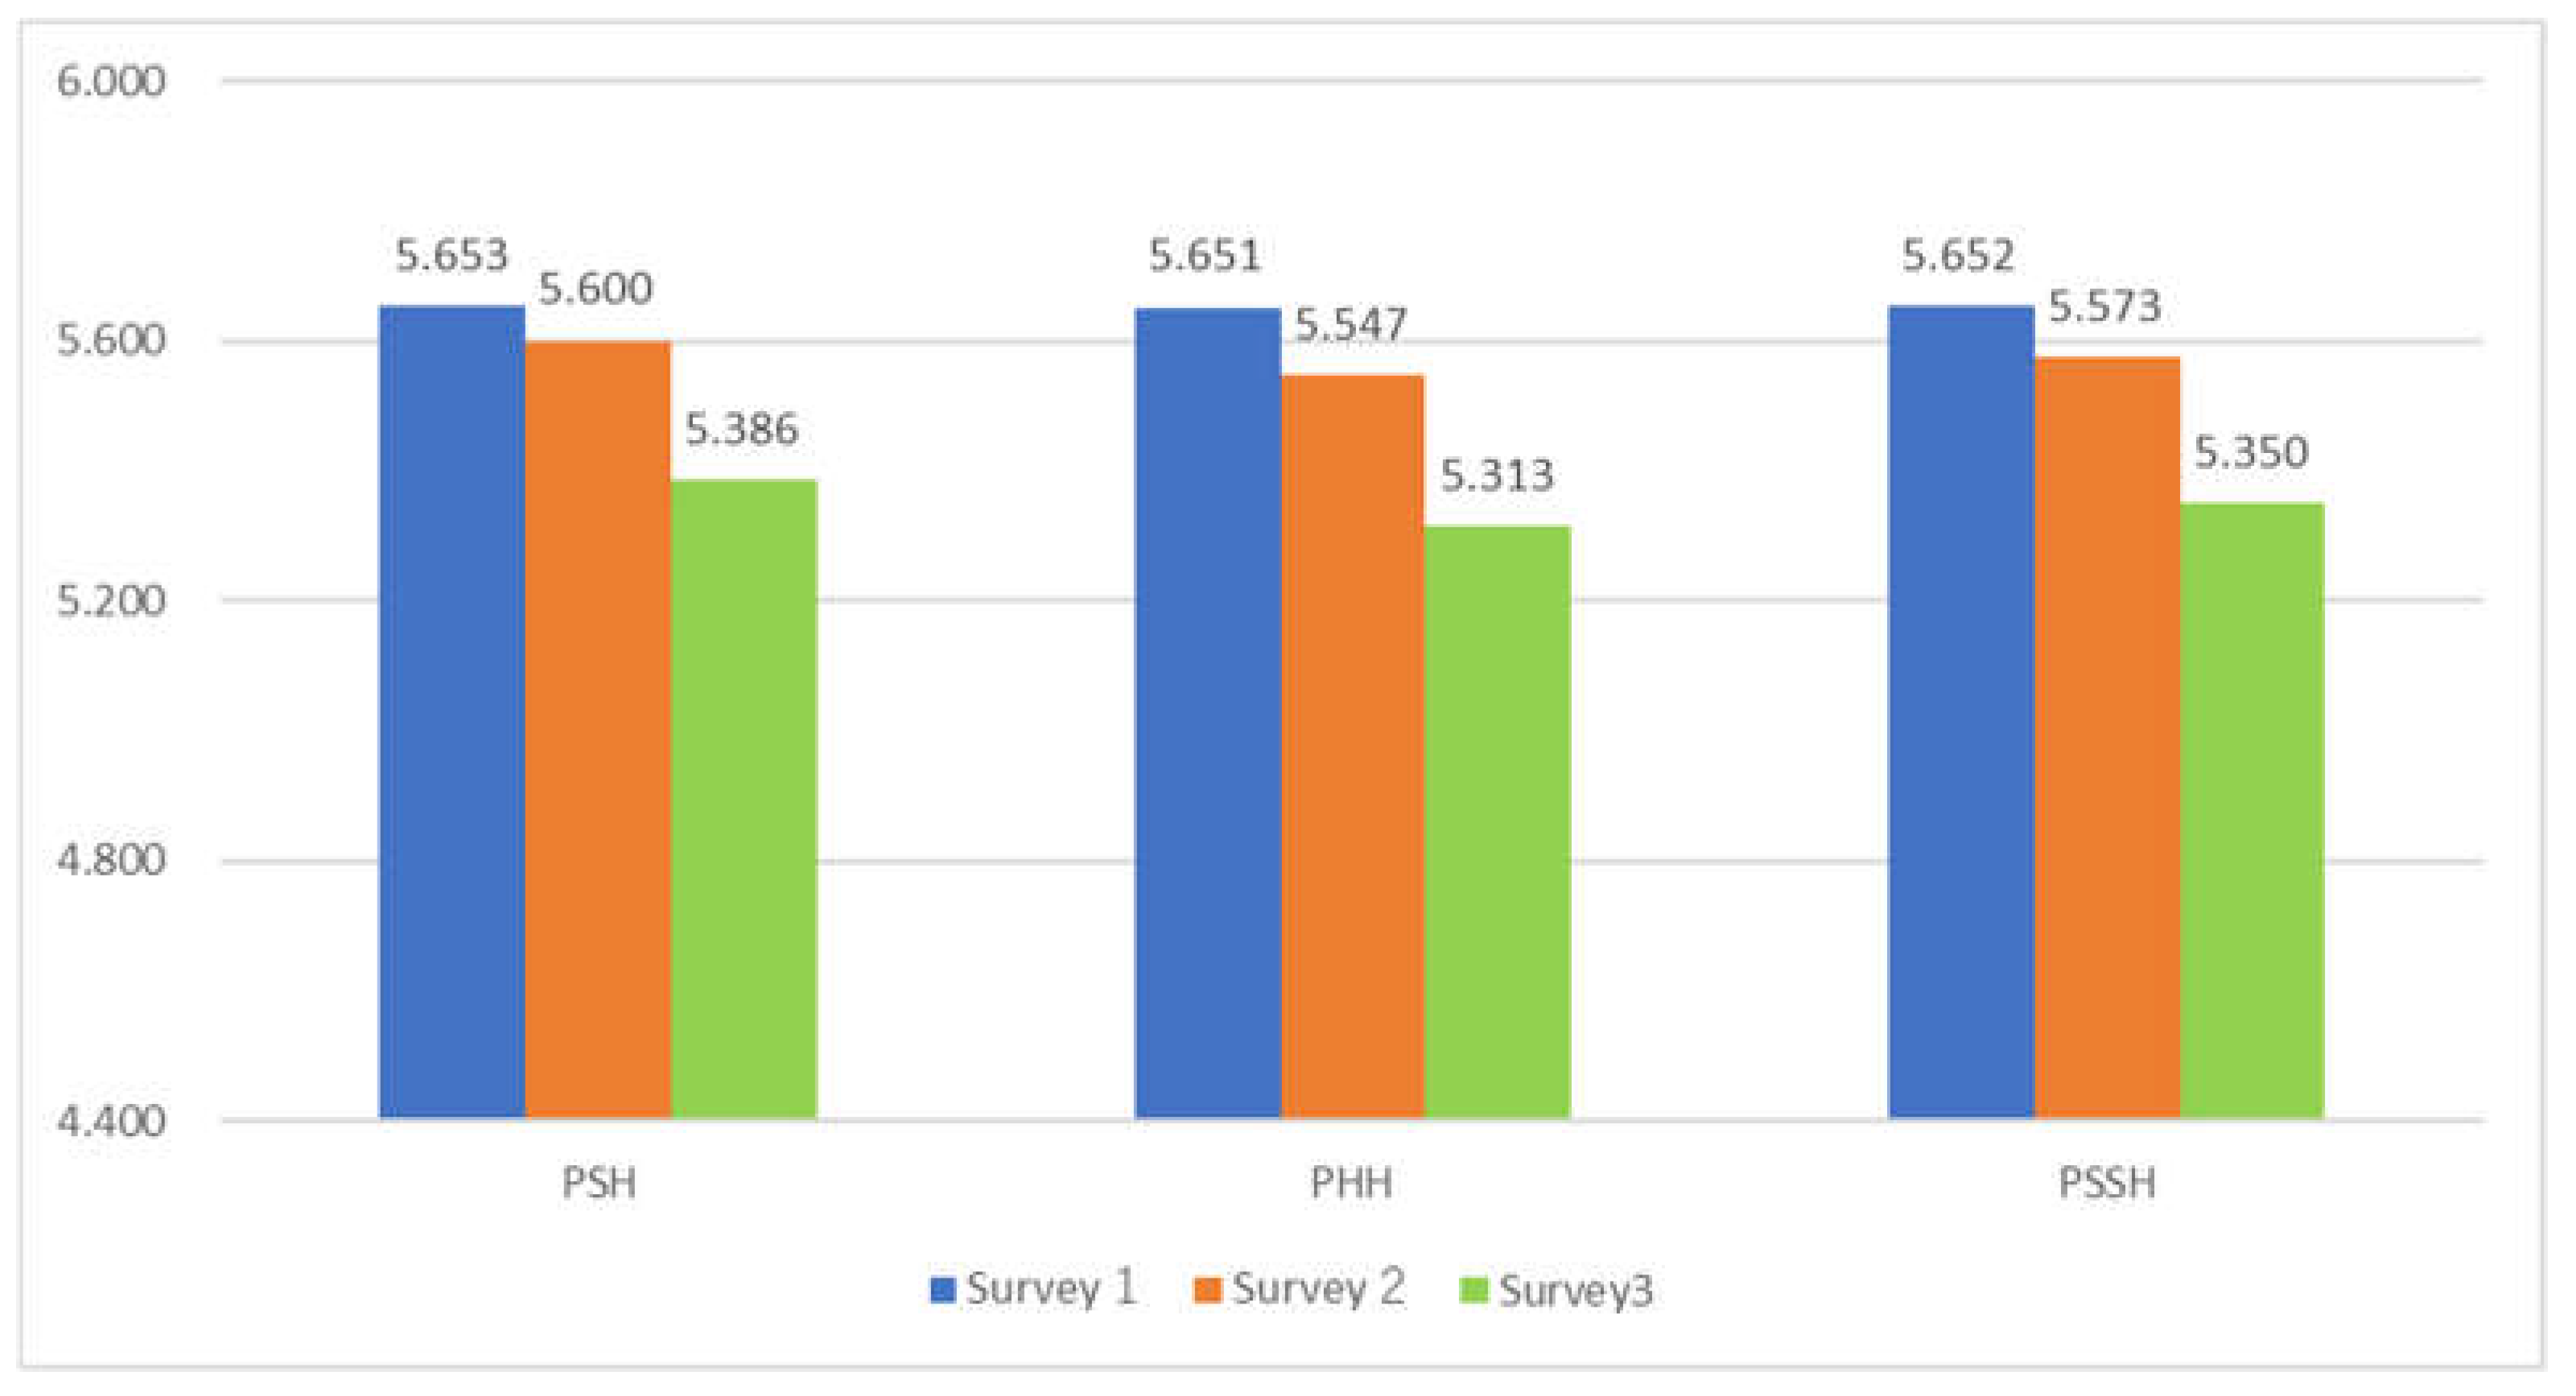
Figure 3.
Comparison of Average Values of Indicators by Household Income (Survey2, 3) Note: Survey 2: Income Class 1: N = 1363, Income Class 2: N = 2731, Income Class 3: N = 1075, Income Class 4: N = 399, Income Class 5: N = 194, The responses “No idea” in item 22 have been removed. Survey 3: Income Class 1: N = 484, Income Class 2: N = 1015, Income Class 3: N = 385, Income Class 4: N = 164, Income Class 5: N = 101, The responses “No idea” in item 22 have been removed.
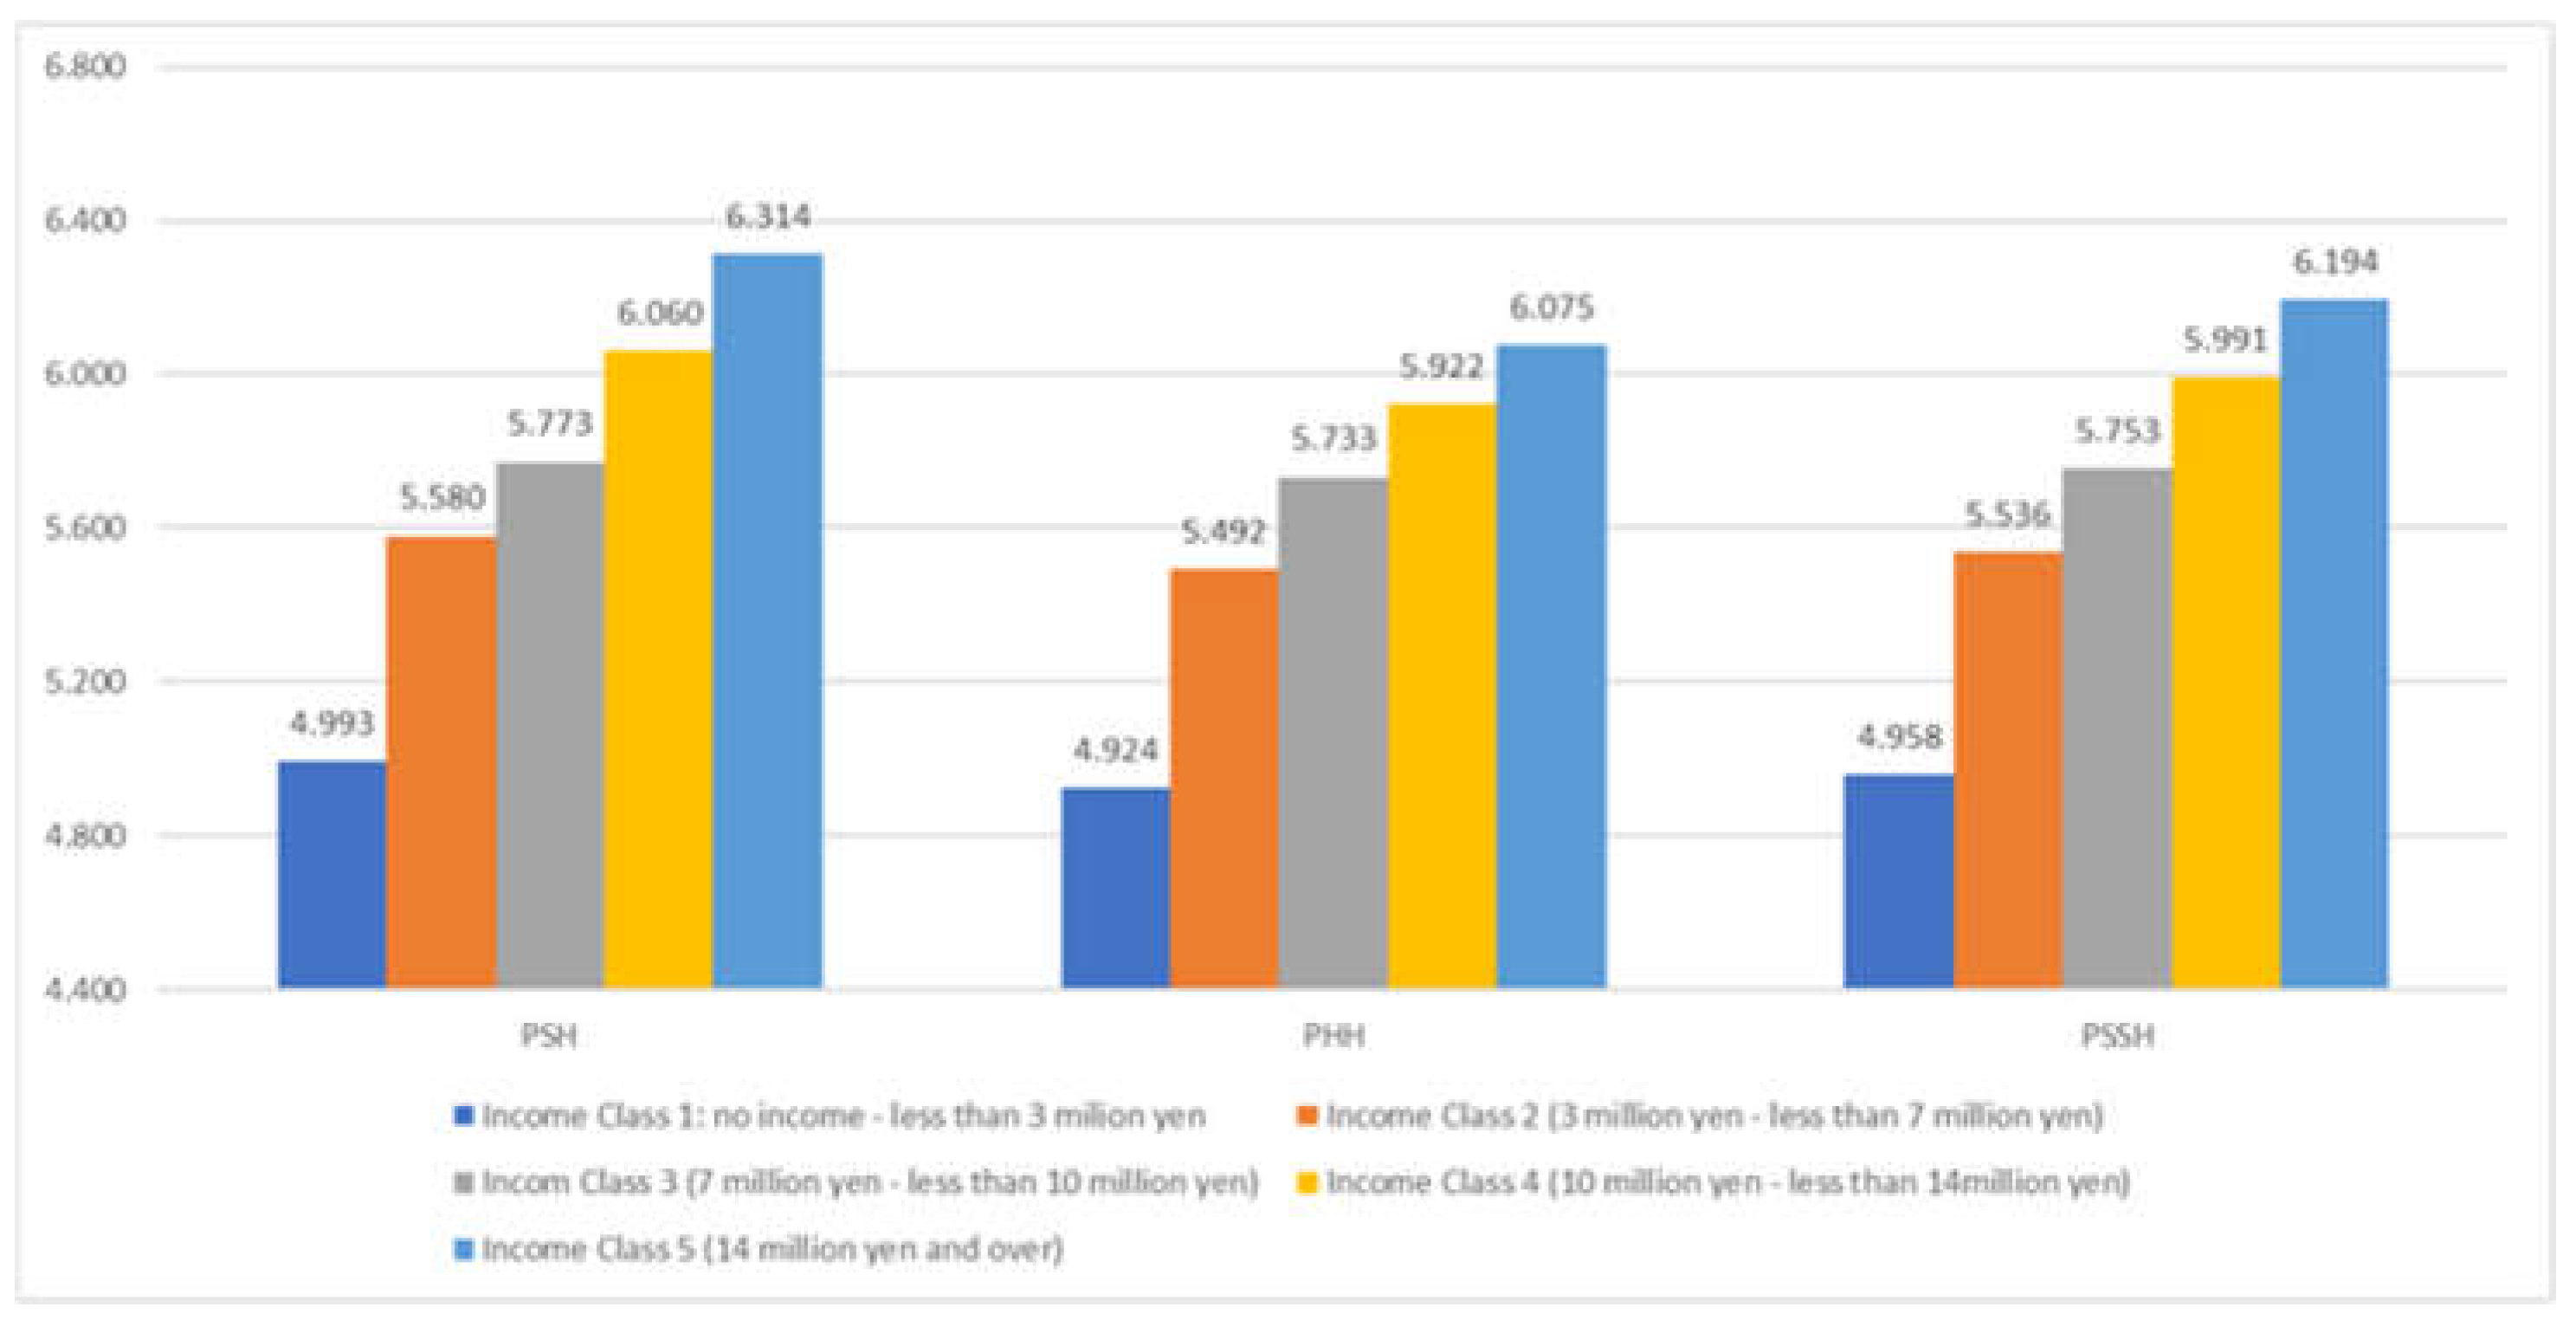
Figure 4.
Psychosomatic Health Disparity: Multiple Regression Analysis. Notes: This figure is a conceptual framework of the multi-regression analysis, exemplifying Psychosomatic Health concerning ratios. This indicates all factors within each category, apart from the result of Psychosomatic Health.
Figure 4.
Psychosomatic Health Disparity: Multiple Regression Analysis. Notes: This figure is a conceptual framework of the multi-regression analysis, exemplifying Psychosomatic Health concerning ratios. This indicates all factors within each category, apart from the result of Psychosomatic Health.
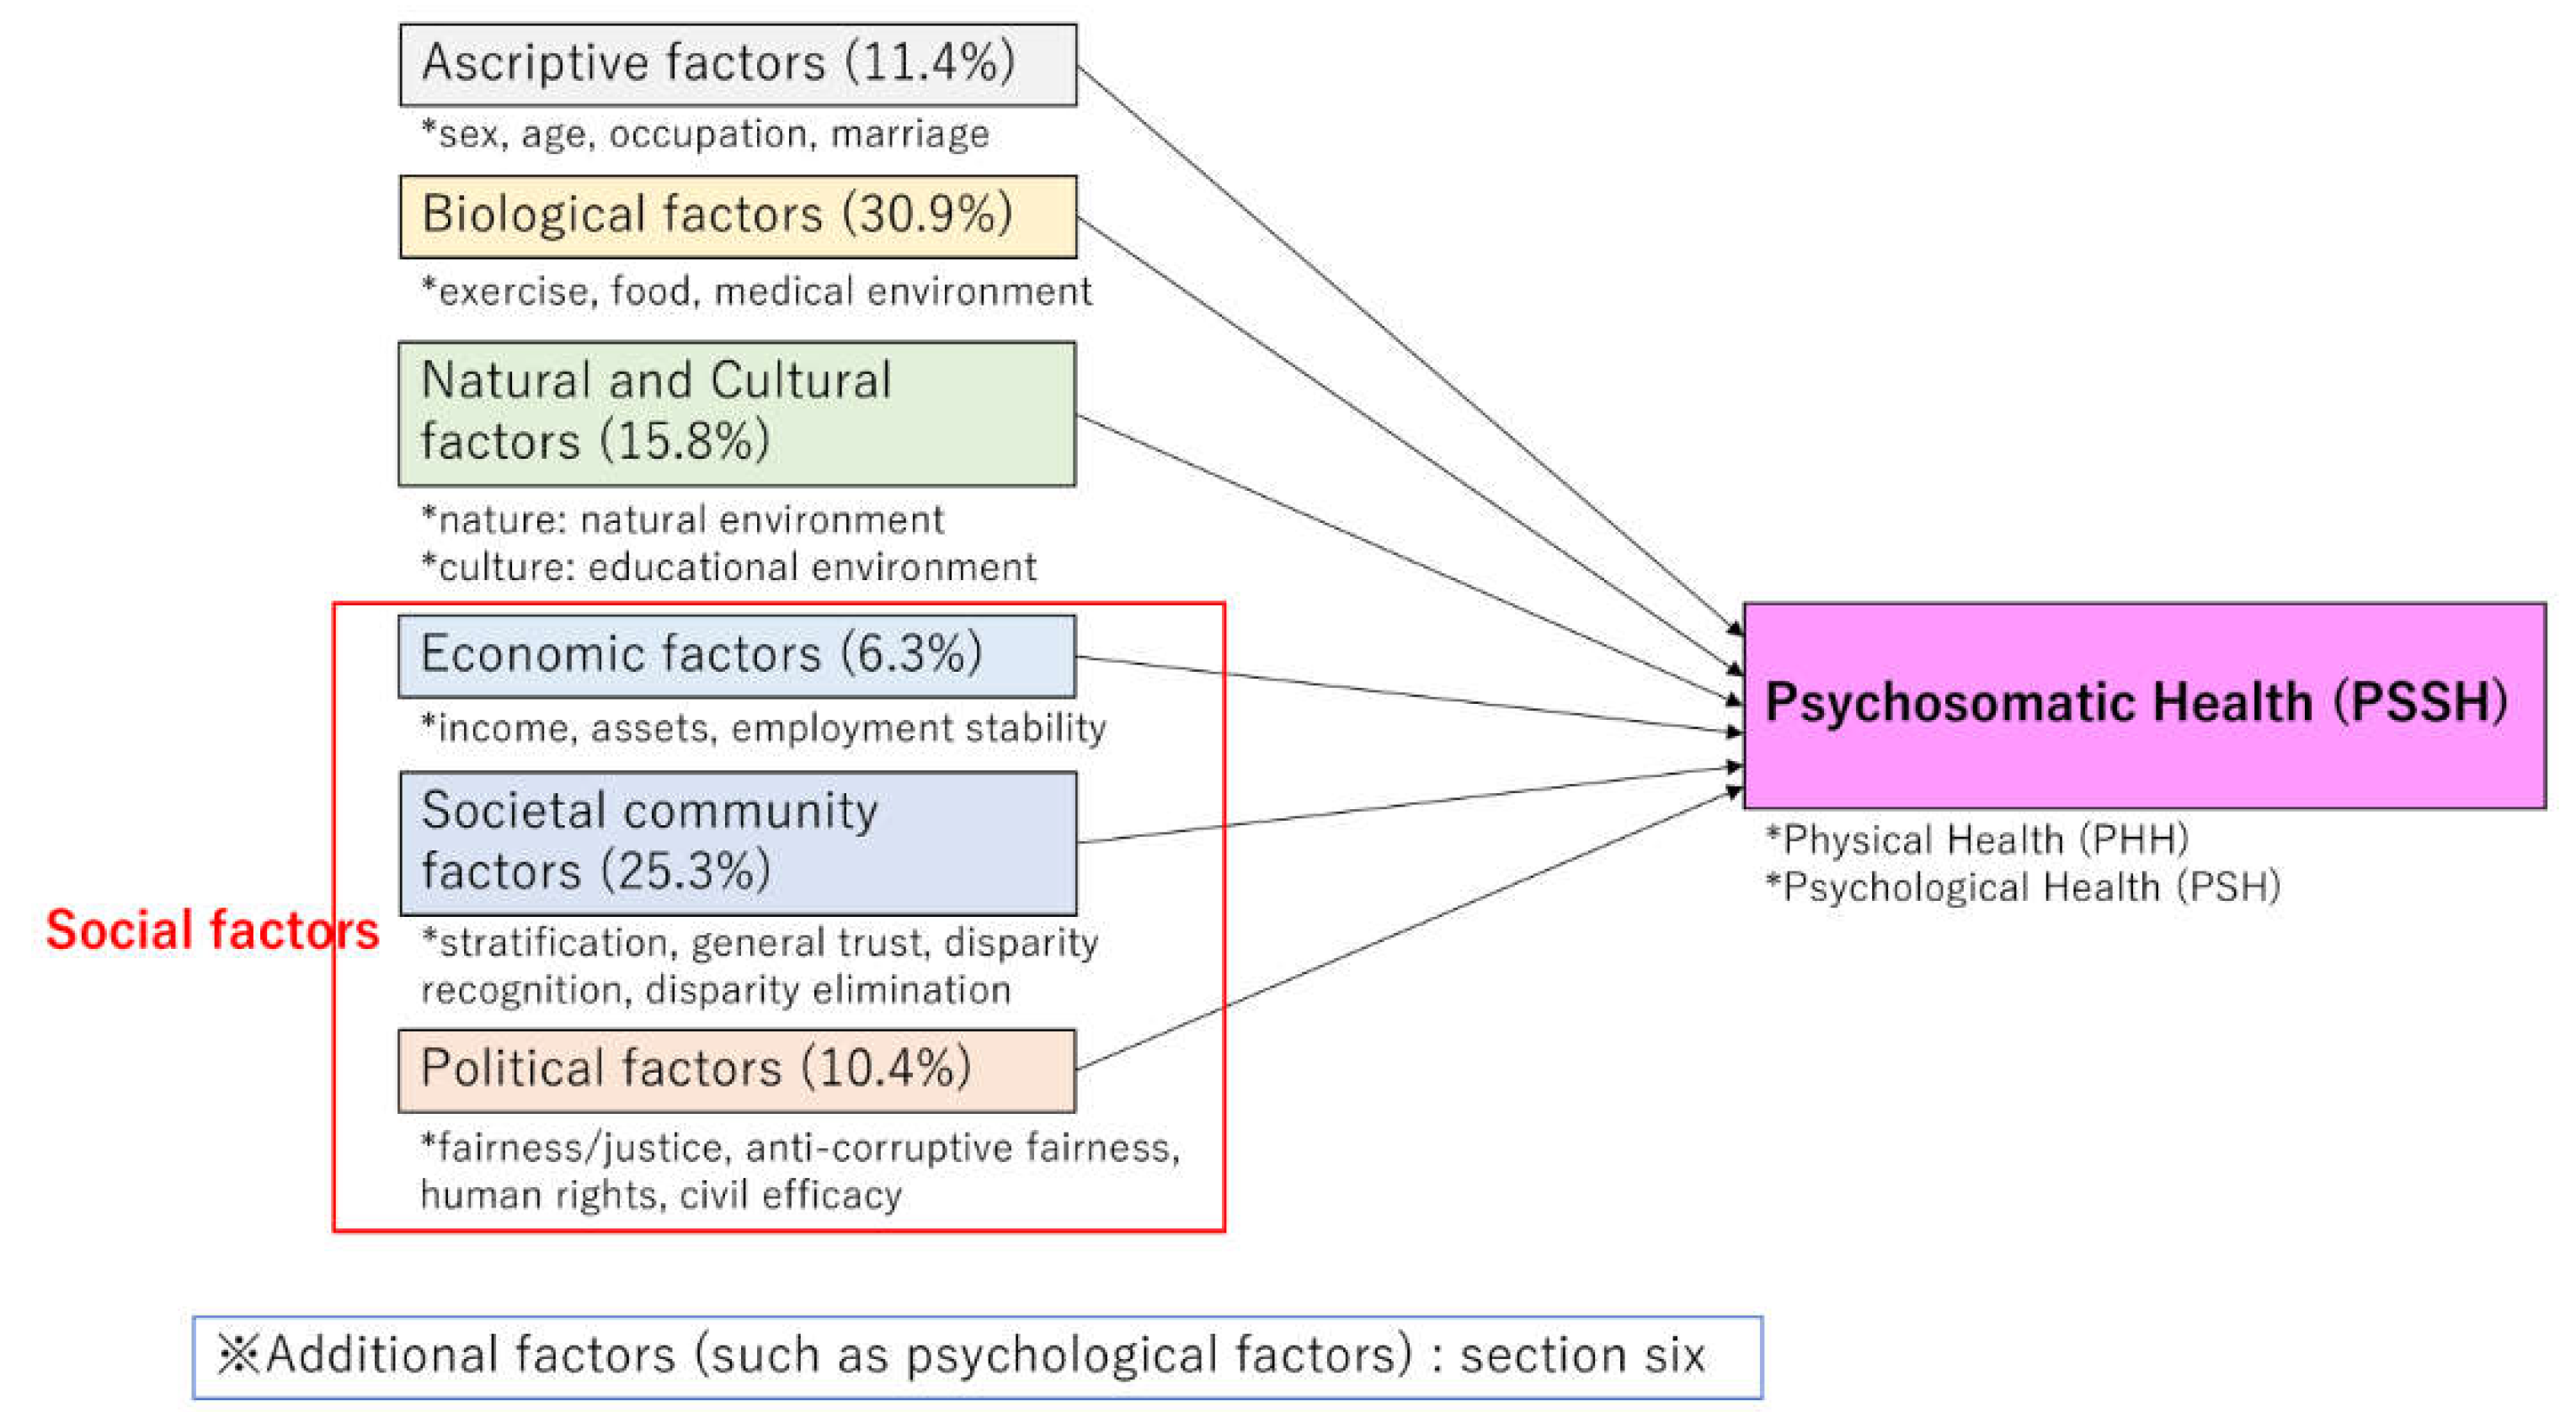
Figure 5.
A. Multiple Regression Analysis: Comparison of the Total Values (average) of Standardized Partial Regression Coefficients in Each Category. Notes: Figures in the graph denote each ’ ’factor’s rank (from the highest).Figures in parentheses denote the number of variables in each category. As for derived (calculated) variables, refer to Appendix E.
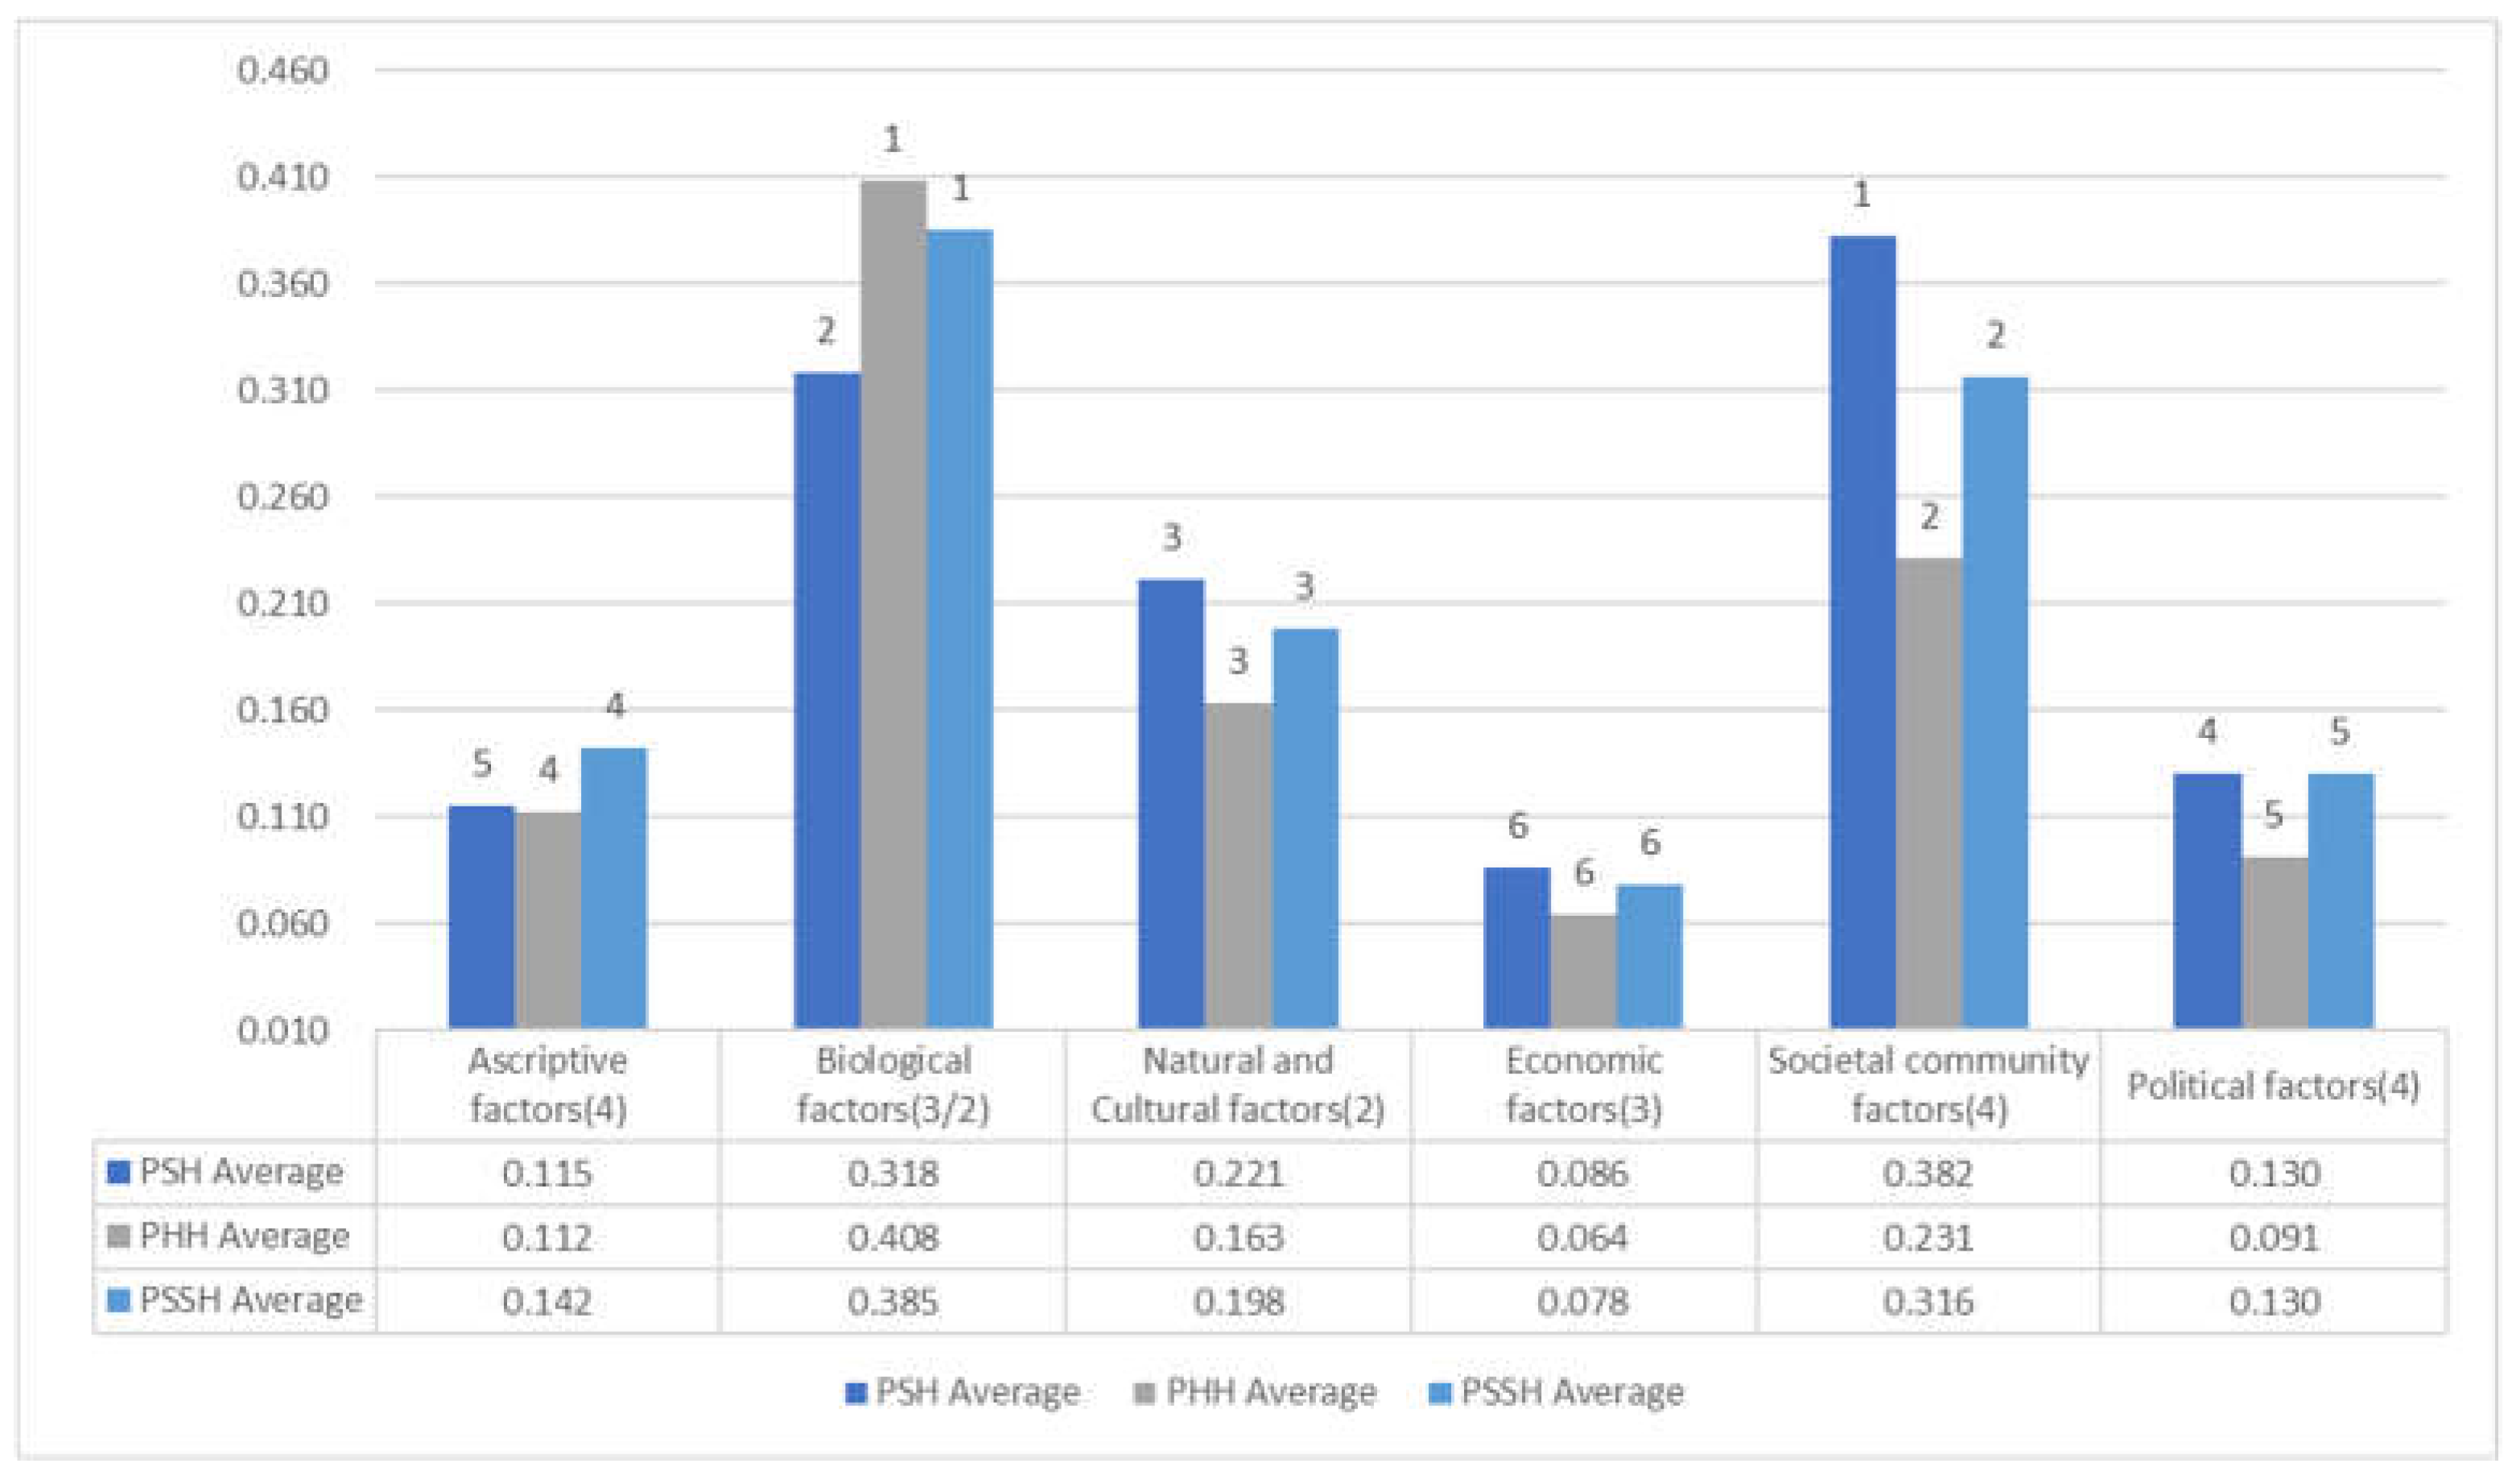
Figure 5.
B. Multiple Regression Analysis: Comparison of Standardized Partial Regression Coefficients Concerning Physical Change and Mental Change” in Each Category. Notes: Figures in the graph denote each ’ ’factor’s rank (from the highest). Natural and Cultural factors are not indicated since they do not appear as variables in the calculation result. Figures in parentheses denote the number of variables in each category. As for derived (calculated) variables, refer to Appendix E.
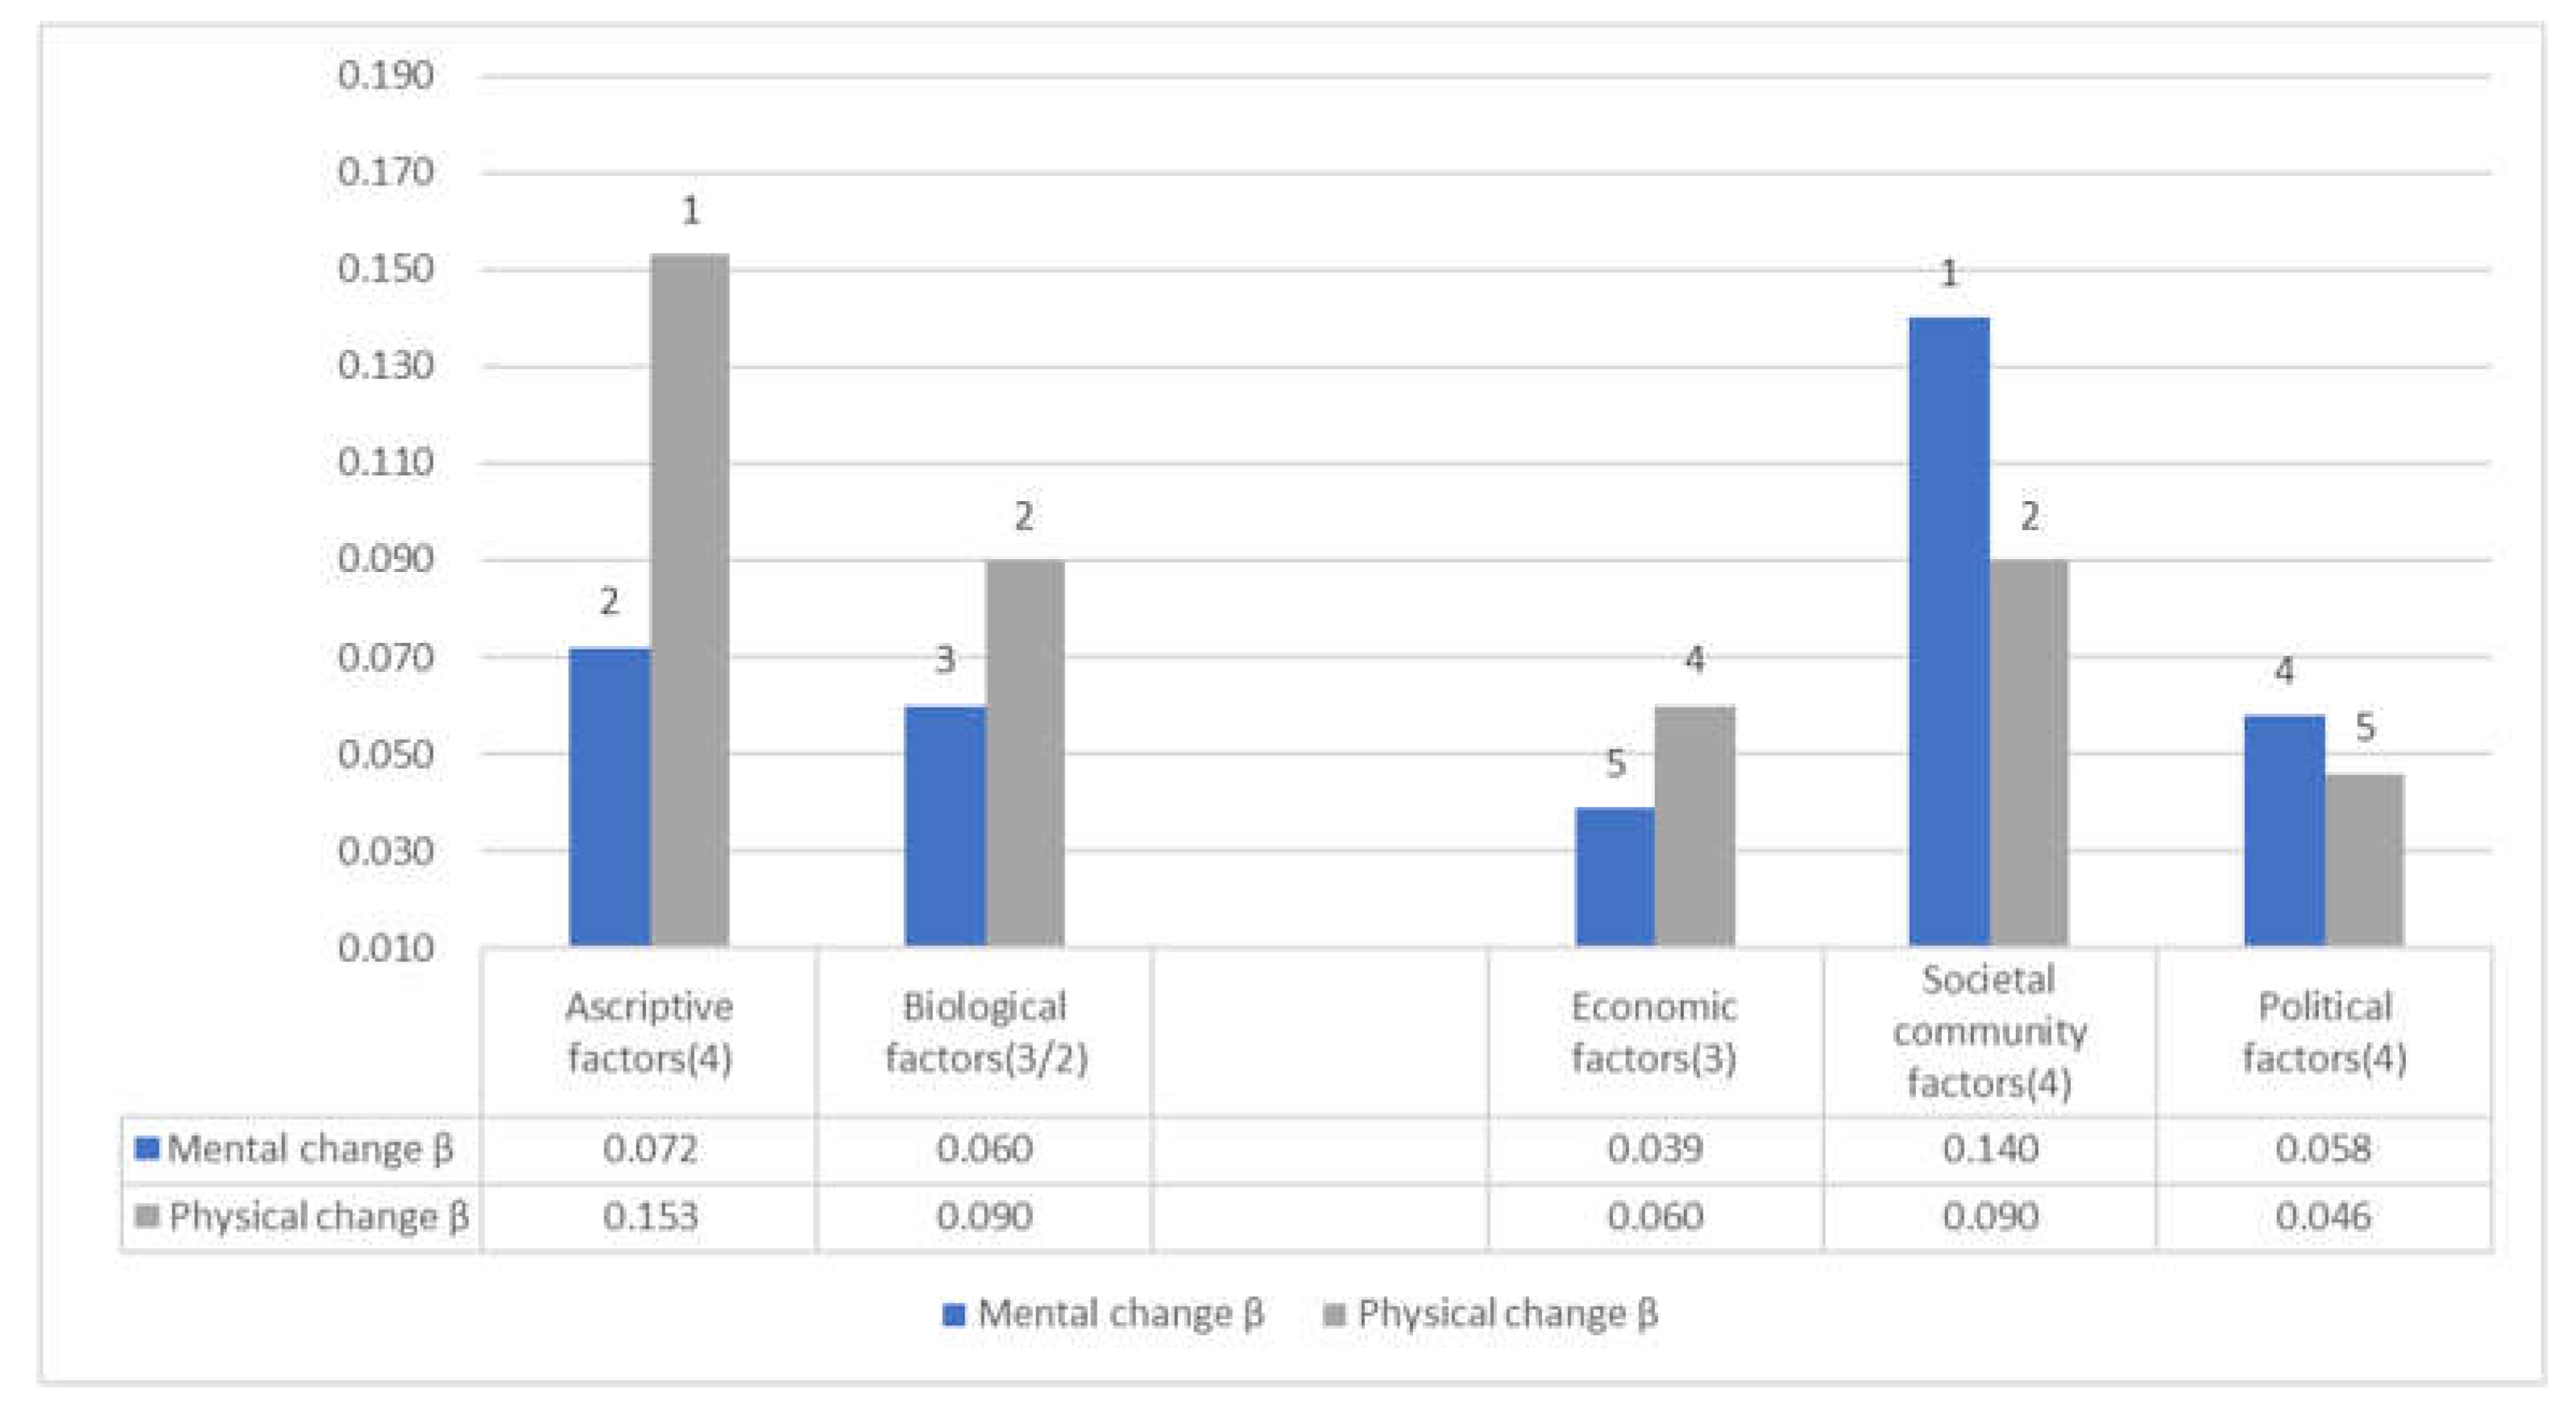

Table 1.
Correlations between Psychological Health (PSH)/ Physical Health (PHH)/Psy cho somatic Health (PSSH) and Factors(Survey1,2,3).
Table 1.
Correlations between Psychological Health (PSH)/ Physical Health (PHH)/Psy cho somatic Health (PSSH) and Factors(Survey1,2,3).
| PSH | PHH | PSSH | Mental change | Physical change | |||||||||||
|---|---|---|---|---|---|---|---|---|---|---|---|---|---|---|---|
| Survey1(N=4698) | Survey2(N=6855) | Survey3(N=2472) | Average | Survey1(N=4698) | Survey2(N=6855) | Survey3(N=2472) | Average | Survey1(N=4698) | Survey2(N=6855) | Survey3(N=2472) | Average | Survey1(N=4698) | Survey1(N=4698) | ||
| r | |||||||||||||||
| Ascriptive factors(4) | Sex | 0.053** | 0.006 | 0.007 | △ | 0.021 | 0.023† | 0.039* | △ | 0.038** | 0.016 | 0.024 | △ | 0.059** | 0.026† |
| [19] | [18] | [17] | [19] | [16] | [19] | ||||||||||
| Age | 0.033* | 0.124** | 0.175** | 0.111 | -0.062** | 0.005 | 0.064** | △ | -0.018 | 0.065** | 0.124** | △ | 0.048** | 0.099** | |
| [20] | [18] | [14] | [18] | [19] | [16] | [18] | [16] | [19] | [10] | ||||||
| Occupation | 0.239** | 0.194** | 0.153** | 0.195 | 0.213** | 0.169** | 0.163** | 0.182 | 0.237** | 0.191** | 0.166** | 0.198 | -0.050** | -0.059** | |
| [16] | [17] | [15] | [16] | [16] | [15] | [14] | [15] | [16] | [17] | [14] | [15] | [18] | [17] | ||
| Marriage | 0.161** | 0.231** | 0.257** | 0.216 | 0.081** | 0.160** | 0.189** | 0.143 | 0.125** | 0.205** | 0.233** | 0.188 | -0.005 | 0.000 | |
| [17] | [16] | [13] | [15] | [17] | [17] | [13] | [16] | [17] | [16] | [13] | [16] | ||||
| Biological factors(3/2) | Exercise/ Foods | (0.466**) | 0.705** | (0.585) | (0.458**) | 0.663** | (0.561) | (0.485**) | 0.723** | (0.604) | (-0.115**) | (-0.126**) | |||
| [1] | [4] | [1] | [1] | [1] | [2] | ||||||||||
| Exercise | 0.375** | 0.392** | 0.403** | -0.135** | -0.123** | ||||||||||
| [13] | [12] | [13] | [3] | [6] | |||||||||||
| Diets | 0.556** | 0.524** | 0.566** | -0.096** | -0.129** | ||||||||||
| [4] | [2] | [2] | [11] | [2] | |||||||||||
| Medical environment | 0.480** | 0.565** | 0.523 | 0.427** | 0.451** | 0.439 | 0.475** | 0.534** | 0.505 | -0.075** | -0.087** | ||||
| [10] | [8] | [8] | [9] | [10] | [9] | [9] | [9] | [8] | [13] | [12] | |||||
| Natural and Cultural factors(2) | Natural environment | 0.536** | 0.610** | 0.579** | 0.575 | 0.443** | 0.512** | 0.481** | 0.479 | 0.512** | 0.591** | 0.555** | 0.553 | -0.061** | -0.076** |
| [8] | [5] | [5] | [6] | [8] | [4] | [6] | [7] | [8] | [5] | [6] | [7] | [15] | [14] | ||
| Educational environment | 0.549** | 0.684** | 0.629** | 0.621 | 0.472** | 0.555** | 0.540** | 0.522 | 0.535** | 0.652** | 0.612** | 0.600 | -0.112** | -0.097** | |
| [5] | [2] | [2] | [2] | [5] | [2] | [1] | [3] | [5] | [2] | [2] | [3] | [9] | [11] | ||
| Economic factors(3) | Income | 0.539** | 0.591** | 0.577** | 0.569 | 0.472** | 0.494** | 0.487** | 0.484 | 0.530** | 0.572** | 0.557** | 0.553 | -0.128** | -0.129** |
| [7] | [7] | [6] | [7] | [5] | [7] | [5] | [6] | [7] | [7] | [5] | [6] | [6] | [2] | ||
| Assets | 0.541** | 0.598** | 0.599** | 0.579 | 0.478** | 0.511** | 0.518** | 0.502 | 0.534** | 0.584** | 0.585** | 0.568 | -0.135** | -0.128** | |
| [6] | [6] | [4] | [5] | [3] | [5] | [3] | [4] | [6] | [6] | [3] | [5] | [3] | [5] | ||
| Employment stability | 0.462** | 0.553** | 0.538** | 0.518 | 0.399** | 0.469** | 0.465** | 0.444 | 0.451** | 0.538** | 0.525** | 0.505 | -0.126** | -0.133** | |
| [11] | [9] | [7] | [9] | [11] | [8] | [7] | [8] | [11] | [8] | [7] | [8] | [7] | [1] | ||
| Societal community factors(4) | Stratification satisfaction | 0.692** | 0.638** | 0.647** | 0.659 | 0.580** | 0.525** | 0.529** | 0.545 | 0.666** | 0.612** | 0.616** | 0.631 | -0.151** | -0.120** |
| [1] | [4] | [1] | [1] | [1] | [3] | [2] | [2] | [1] | [3] | [1] | [1] | [1] | [7] | ||
| General trust | 0.564** | 0.640** | 0.602** | 0.602 | 0.464** | 0.506** | 0.495** | 0.488 | 0.538** | 0.602** | 0.574** | 0.571 | -0.103** | -0.116** | |
| [2] | [3] | [3] | [3] | [7] | [6] | [4] | [5] | [4] | [4] | [4] | [4] | [10] | [8] | ||
| Disparity recognition | 0.086** | 0.239** | 0.143** | 0.156 | 0.066** | 0.166** | 0.116** | 0.116 | 0.080** | 0.212** | 0.136** | 0.413 | 0.053** | 0.045** | |
| [18] | [15] | [16] | [17] | [18] | [16] | [15] | [17] | [18] | [15] | [15] | [17] | [17] | [18] | ||
| Disparity elimination | 0.310** | 0.429** | 0.440** | 0.393 | 0.275** | 0.380** | 0.400** | 0.352 | 0.307** | 0.427** | 0.441** | 0.392 | -0.095** | -0.065** | |
| [15] | [12] | [10] | [13] | [15] | [12] | [10] | [13] | [15] | [12] | [10] | [13] | [12] | [16] | ||
| Political factors(4) | Fairness/ Justice | 0.419** | 0.365** | 0.407** | 0.397 | 0.380** | 0.330** | 0.367** | 0.359 | 0.419** | 0.367** | 0.406** | 0.397 | -0.134** | -0.129** |
| [12] | [13] | [11] | [12] | [13] | [13] | [11] | [12] | [12] | [13] | [11] | [12] | [5] | [2] | ||
| Anti-corruptive fairness | 0.338** | 0.314** | 0.346** | 0.333 | 0.315** | 0.296** | 0.330** | 0.314 | 0.343** | 0.322** | 0.355** | 0.340 | -0.141** | -0.115** | |
| [14] | [14] | [12] | [14] | [14] | [14] | [12] | [14] | [14] | [14] | [12] | [14] | [2] | [9] | ||
| Human rights | 0.560** | 0.483** | 0.502** | 0.515 | 0.473** | 0.417** | 0.422** | 0.437 | 0.541** | 0.475** | 0.484** | 0.500 | -0.074** | -0.070** | |
| [3] | [11] | [8] | [10] | [4] | [11] | [8] | [10] | [3] | [11] | [8] | [10] | [14] | [15] | ||
| Civil efficiency | 0.493** | 0.551** | 0.481** | 0.508 | 0.413** | 0.458** | 0.401** | 0.424 | 0.475** | 0.531** | 0.462** | 0.489 | -0.122** | -0.082** | |
| [9] | [10] | [9] | [11] | [10] | [9] | [9] | [11] | [10] | [10] | [9] | [11] | [8] | [13] | ||
| PSH | 1.000 | 1.000 | 1.000 | 0.809** | 0.784** | 0.816** | 0.803 | 0.947** | 0.937** | 0.950** | 0.945 | -0.157** | -0.145** | ||
| PHH | 0.809** | 0.784** | 0.816** | 0.803 | 1.000 | 1.000 | 1.000 | 0.955** | 0.951** | 0.955** | 0.954 | -0.154** | -0.189** | ||
| PSSH | 0.947** | 0.937** | 0.950** | 0.945 | 0.955** | 0.951** | 0.955** | 0.954 | 1.000 | 1.000 | 1.000 | -0.164** | -0.177** | ||
| Mental change | -0.157** | -0.154** | -0.164** | 1.000 | 0.457** | ||||||||||
| Physical change | -0.145** | -0.189** | -0.177** | 0.457** | 1.000 | ||||||||||
| Fair society | 0.428** | 0.463** | 0.446 | 0.384** | 0.404** | 0.394 | 0.428** | 0.455** | 0.442 | ||||||
| Just society | 0.426** | 0.481** | 0.454 | 0.370** | 0.421** | 0.396 | 0.419** | 0.472** | 0.446 | ||||||
| Fair/Just society | 0.243** | 0.221** | 0.245** | ||||||||||||
| Distributive justice | 0.472** | 0.420** | 0.471** | ||||||||||||
| Contribution | 0.505** | 0.588** | 0.576** | 0.556 | 0.419** | 0.452** | 0.476** | 0.449 | 0.484** | 0.546** | 0.551** | 0.527 | -0.046* | -0.073** | |
| Optimism | 0.624** | 0.752** | 0.716** | 0.697 | 0.514** | 0.611** | 0.605** | 0.577 | 0.595** | 0.718** | 0.692** | 0.668 | -0.145** | -0.132** | |
Notes: ** :p < 0.01, *: p < 0.05, † :p < 0.1. Sex (male = 0, female = 1). The figure for age is the actual age (non-logarithm). Occupation: no job = 0, otherwise = 1. Marital status: unmarried, divorced, or bereaved = 0, married = 1. The figures in parentheses concerning exercise/foods are based on the calculated values of correlation coefficients. The figure in brackets indicates the order (from the highest) of the magnitude concerning the estimated coefficient for each variable. The italicized figures in parentheses indicate the number of variables in each category; for biological factors, refer to the information below. △ shows no calculation is conducted because of the statistical non-significance (at 10% level) in Surveys 1,2 or 3. The blank space indicates that the relevant variable is not asked in Survey 1 or Survey 2. “Exercise” and “Foods” are separately asked in Survey 1, while an integrated item, “Exercise/Foods,” is asked in Survey 2.
Table 2.
Comparison of the Three Survey’s Average of the Total Correlation Coefficients in Each Category.
Table 2.
Comparison of the Three Survey’s Average of the Total Correlation Coefficients in Each Category.
| PSH | PHH | PSSH | Mental change | Physical change | ||||||||||
|---|---|---|---|---|---|---|---|---|---|---|---|---|---|---|
| Survey1 | Survey2 | Survey3 | Average | Survey1 | Survey2 | Survey3 | Average | Survey1 | Survey2 | Survey3 | Average | Survey1 | ||
| Ascriptive factors(4) | 0.122(4.8%) | 0.183(6.2%) | 0.195(8.6%) | 0.167(6.0%) | 0.119(5.4%) | 0.176(7.0%) | 0.228(11.4%) | 0.174(7.2%) | 0.133(5.4%) | 0.154(5.4%) | 0.174(8.0%) | 0.154(5.7%) | 0.052(8.5%) | 0.061(10.6%) |
| [6] | [6] | [5] | [6] | [6] | [6] | [5] | [6] | [6] | [6] | [5] | [6] | [6] | [6] | |
| Biological factors(3/2) | 0.469(18.7%) | 0.635(21.4%) | 0.552(20.0%) | 0.450(20.3%) | 0.557(22.0%) | 0.504(20.9%) | 0.482(19.4%) | 0.629(22.0%) | 0.555(20.6%) | 0.102(16.5%) | 0.113(19.6%) | |||
| [3] | [2] | [3] | [3] | [1] | [1] | [3] | [1] | [2] | [4] | [2] | ||||
| Natural and Cultural factors(2) | 0.543(21.6%) | 0.647(21.9%) | 0.604(26.7%) | 0.598(21.6%) | 0.458(20.6%) | 0.534(21.1%) | 0.511(25.6%) | 0.501(20.7%) | 0.524(21.1%) | 0.622(21.8%) | 0.584(26.7%) | 0.576(21.4%) | 0.117(18.9%) | 0.087(15.0%) |
| [1] | [1] | [1] | [1] | [1] | [2] | [1] | [2] | [1] | [2] | [1] | [1] | [3] | [4] | |
| Economic factors(3) | 0.514(20.5%) | 0.581(19.6%) | 0.571(25.3%) | 0.555(20.1%) | 0.450(20.3%) | 0.491(19.4%) | 0.490(24.6%) | 0.477(19.8%) | 0.505(20.3%) | 0.565(19.8%) | 0.556(25.5%) | 0.542(20.1%) | 0.130(20.9%) | 0.130(22.6%) |
| [2] | [3] | [2] | [2] | [2] | [3] | [2] | [3] | [2] | [3] | [2] | [3] | [1] | [1] | |
| Societal community factors(4) | 0.413(16.4%) | 0.487(16.4%) | 0.458(16.4%) | 0.453(16.4%) | 0.346(15.6%) | 0.394(15.6%) | 0.385(19.3%) | 0.375(15.5%) | 0.398(16.0%) | 0.463(16.2%) | 0.442(20.2%) | 0.434(16.1%) | 0.101(16.2%) | 0.087(15.0%) |
| [5] | [4] | [3] | [4] | [5] | [4] | [3] | [5] | [5] | [4] | [3] | [4] | [5] | [4] | |
| Political factors(4) | 0.453(18.0%) | 0.428(14.5%) | 0.434(19.2%) | 0.438(15.9%) | 0.395(17.8%) | 0.375(14.8%) | 0.380(19.1%) | 0.384(15.9%) | 0.445(17.9%) | 0.424(14.8%) | 0.427(19.6%) | 0.432(16.0%) | 0.118(19.0%) | 0.099(17.2%) |
| [4] | [5] | [4] | [5] | [4] | [5] | [4] | [4] | [4] | [5] | [4] | [5] | [2] | [3] | |
Notes: Mean figures of two surveys concerning total correlation coefficients within each category are listed. The figures in parentheses indicate the share in the total correlation coefficients for categories. PSH, PHH, PSSH: see Table 1. The italicized figures in parentheses indicate the number of variables in each category. The figure in brackets indicates the order (from the highest) concerning the magnitude of the estimated coefficient for each category. .
Table 3.
Multiple Regression Analysis of the Basic Factors for Surveys 1 and 2 (ranking of the top 10 items).
Table 3.
Multiple Regression Analysis of the Basic Factors for Surveys 1 and 2 (ranking of the top 10 items).
| PSH | PHH | PSSH | Mental change | Physical change | ||||
|---|---|---|---|---|---|---|---|---|
| Survey1 | Survey2 | Survey1 | Survey2 | Survey1 | Survey2 | Survey1 | ||
| R | 0.815 | 0.835 | 0.708 | 0.727 | 0.795 | 0.818 | 0.203 | 0.210 |
| R2 | 0.664 | 0.697 | 0.501 | 0.529 | 0.631 | 0.670 | 0.041 | 0.044 |
| adjusted R2 | 0.663 | 0.696 | 0.500 | 0.528 | 0.630 | 0.669 | 0.040 | 0.042 |
| 1 | Stratification | Exercise/Foods | Stratification | Exercise/Foods | Stratification | Exercise/Foods | Stratification | Age |
| (0.322**) | (0.296**) | (0.242**) | (0.411**) | (0.294**) | (0.377**) | (-0.087**) | (0.116**) | |
| 2 | Foods | Educational environment | Foods | Natural environment | Foods | Stratification | Exercise | Foods |
| (0.155**) | (0.149**) | (0.198**) | (0.108**) | (0.185**) | (0.121**) | (-0.060**) | (-0.090**) | |
| 3 | General trust | General trust | Age | Stratification | Natural environment | Educational environment | Anti-corruptive fairness | Employment stability |
| (0.126**) | (0.144**) | (-0.109**) | (0.095**) | (0.103**) | (0.111**) | (-0.058**) | (-0.060**) | |
| 4 | Natural environment | Stratification | Human rights | Age | Human rights | General trust | Disparity recognition | Disparity recognition |
| (0.114**) | (0.137**) | (0.089**) | (-0.087**) | (0.101**) | (0.100**) | (0.053**) | (0.050**) | |
| 5 | Civil efficacy | Medical environment | Medical environment | Educational environment | General trust | Natural environment | Sex | Fairness/Justice |
| (0.114**) | (0.106**) | (0.086**) | (0.064**) | (0.100**) | (0.097**) | (0.043*) | (-0.046**) | |
| 6 | Human rights | Natural environment | Natural environment | General trust | Civil efficacy | Medical environment | Employment stability | General trust |
| (0.103**) | (0.088**) | (0.083**) | (0.058**) | (0.092**) | (0.081**) | (-0.039*) | (-0.040*) | |
| 7 | Educational environment | Assets | Educational environment | Medical environment | Medical environment | Assets | Age | Marital status |
| (0.090**) | (0.046**) | (0.071**) | (0.057**) | (0.087**) | (0.064**) | (0.029*) | (-0.037*) | |
| 8 | Medical environment | Civil efficacy | General trust | Assets | Educational environment | Age | ||
| (0.078**) | (0.042**) | (0.067**) | (0.057**) | (0.084**) | (-0.048**) | |||
| 9 | Assets | Employment stability | Exercise | Occupation | Age | Civil efficacy | ||
| (0.061**) | (0.036**) | (0.064**) | (0.036**) | (-0.075**) | (0.039**) | |||
| 10 | Marital status | Marital status | Civil efficacy | Civil efficacy | Assets | Employment stability | ||
| (0.052**) | (0.031**) | (0.064**) | (0.028*) | (0.055**) | (0.037**) | |||
Notes: **:p<0.01, *:p<0.05. Independent variables: all basic factors, including ascriptive factors. Sex (male = 0, female = 1). The figure for age is the actual age (non-logarithm). Occupation: no job = 0, otherwise = 1. Marital status: unmarried, divorced, or bereaved = 0, married = 1. PSH and notes of other variables: see Table 1. Figures in parentheses denote standardized partial regression coefficients for each variable.
Table 4.
Multiple Regression Analysis: Sum of Standardized Partial Regression Coefficients of the Basic Factors in Each Category (Average of Two Surveys).
Table 4.
Multiple Regression Analysis: Sum of Standardized Partial Regression Coefficients of the Basic Factors in Each Category (Average of Two Surveys).
| PSH | PHH | PSSH | Mental change | Physical change | |||||||
|---|---|---|---|---|---|---|---|---|---|---|---|
| Survey1 | Survey2 | Average | Survey1 | Survey2 | Average | Survey1 | Survey2 | Average | Survey1 | ||
| Ascriptive factors(4) | 0.149(11.4%) | 0.081(6.8%) | 0.115(9.2%) | 0.101(9.1%) | 0.123(12.0%) | 0.112(10.5%) | 0.162(12.4%) | 0.122(10.2%) | 0.142(11.4%) | 0.072(19.5%) | 0.153(34.9%) |
| [5]4 | [5]3 | [5] | [5]3 | [4]2 | [4] | [5]3 | [4]4 | [4] | [2]2 | [1]2 | |
| Biological factors(3/2) | 0.233(17.8%) | 0.402(33.8%) | 0.318(25.4%) | 0.348(31.4%) | 0.468(45.5%) | 0.408(38.2%) | 0.312(23.9%) | 0.458(38.4%) | 0.385(30.9%) | 0.060(16.3%) | 0.090(20.5%) |
| [2]2 | [1]2 | [2] | [1]3 | [1]2 | [1] | [2]3 | [1]2 | [1] | [3]1 | [2]1 | |
| Natural and Cultural factors(2) | 0.204(15.5%) | 0.237(19.9%) | 0.221(17.6%) | 0.154(13.9%) | 0.172(16.7%) | 0.163(15.3%) | 0.187(14.4%) | 0.208(17.4%) | 0.198(15.8%) | ||
| [3]2 | [3]2 | [3] | [3]2 | [2]2 | [3] | [4]2 | [3]2 | [3] | |||
| Economic factors(3) | 0.061(4.6%) | 0.111(9.3%) | 0.086(6.9%) | 0.044(4.0%) | 0.084(8.2%) | 0.064(6.0%) | 0.055(4.2%) | 0.101(8.5%) | 0.078(6.3%) | 0.039(10.6%) | 0.060(13.7%) |
| [6]1 | [4]3 | [6] | [6]1 | [5]2 | [6] | [6]1 | [5]2 | [6] | [5]1 | [4]1 | |
| Societal community factors(4) | 0.448(34.1%) | 0.315(26.5%) | 0.382(30.5%) | 0.309(27.9%) | 0.153(14.9%) | 0.231(21.6%) | 0.394(30.2%) | 0.237(19.9%) | 0.316(25.3%) | 0.140(37.9%) | 0.090(20.5%) |
| [1]2 | [2]3 | [1] | [2]2 | [3]2 | [2] | [1]2 | [2]3 | [2] | [1]2 | [2]2 | |
| Political factors(4) | 0.217(16.5%) | 0.042(3.5%) | 0.130(10.4%) | 0.153(13.8%) | 0.028(2.7%) | 0.091(8.5%) | 0.193(14.8%) | 0.066(5.5%) | 0.130(10.4%) | 0.058(15.7%) | 0.046(10.5%) |
| [4]2 | [6]1 | [4] | [4]2 | [6]1 | [5] | [3]2 | [6]2 | [5] | [4]1 | [5]1 | |
Notes: Total values of the partial regression coefficients(β) of all the variables within each category are listed (blank space for the value of 0). Figures in brackets indicate the order (from the highest) of the magnitude of the coefficient for each variable; as for ascriptive factors, coefficients alone are listed. PSH, PHH, PSSH, and notes of other variables: see Table 1. The italicized figures in parentheses indicate the number of variables in each category. Figures in parentheses indicate the share in the total of standardized partial correlation coefficients for all categories. Anti-corruptive fairness is not included in the calculation since the total of the category can become negative (due to the estimation results showing the reverse sign against the original theoretical conjecture).
Table 5.
A. Correlations between I CCOPPPE (Survey1). B. Correlations between I CCOPPPE (Survey2). C. Correlations between I CCOPPPE (Survey3)
Table 5.
A. Correlations between I CCOPPPE (Survey1). B. Correlations between I CCOPPPE (Survey2). C. Correlations between I CCOPPPE (Survey3)
| IOv | IPs | IPh | IN | IC | IO | IE | IPo | |||||||||
|---|---|---|---|---|---|---|---|---|---|---|---|---|---|---|---|---|
| IOv | 1.000 | 0.817** | 0.717** | 0.814** | 0.709** | 0.790** | 0.796** | 0.664** | ||||||||
| IPs | 0.817** | 1.000 | 0.807** | 0.776** | 0.701** | 0.771** | 0.777** | 0.676** | ||||||||
| IPh | 0.717** | 0.807** | 1.000 | 0.693** | 0.660** | 0.716** | 0.723** | 0.638** | ||||||||
| INT | 0.814** | 0.776** | 0.693** | 1.000 | 0.749** | 0.765** | 0.732** | 0.636** | ||||||||
| IC | 0.709** | 0.701** | 0.660** | 0.749** | 1.000 | 0.752** | 0.702** | 0.687** | ||||||||
| IO | 0.790** | 0.771** | 0.716** | 0.765** | 0.752** | 1.000 | 0.774** | 0.706** | ||||||||
| IE | 0.796** | 0.777** | 0.723** | 0.732** | 0.702** | 0.774** | 1.000 | 0.735** | ||||||||
| IPo | 0.664** | 0.676** | 0.638** | 0.636** | 0.687** | 0.706** | 0.735** | 1.000 | ||||||||
| IOv | IPs | IPh | IN | IC | IO | IE | IPo | ICul | ||||||||
| IOv | 1.000 | 0.828** | 0.723** | 0.824** | 0.720** | 0.778** | 0.794** | 0.645** | 0.694** | |||||||
| IPs | 0.828** | 1.000 | 0.796** | 0.778** | 0.708** | 0.768** | 0.770** | 0.657** | 0.725** | |||||||
| IPh | 0.723** | 0.796** | 1.000 | 0.680** | 0.657** | 0.709** | 0.694** | 0.632** | 0.672** | |||||||
| INT | 0.824** | 0.778** | 0.680** | 1.000 | 0.752** | 0.749** | 0.718** | 0.634** | 0.697** | |||||||
| IC | 0.720** | 0.708** | 0.657** | 0.752** | 1.000 | 0.752** | 0.689** | 0.672** | 0.718** | |||||||
| IO | 0.778** | 0.768** | 0.709** | 0.749** | 0.752** | 1.000 | 0.765** | 0.661** | 0.700** | |||||||
| IE | 0.794** | 0.770** | 0.694** | 0.718** | 0.689** | 0.765** | 1.000 | 0.718** | 0.738** | |||||||
| IPo | 0.645** | 0.657** | 0.632** | 0.634** | 0.672** | 0.661** | 0.718** | 1.000 | 0.808** | |||||||
| ICul | 0.694** | 0.725** | 0.672** | 0.697** | 0.718** | 0.700** | 0.738** | 0.808** | 1.000 | |||||||
| IOv | IPs | IPh | IN | IC | IO | IE | IPo | ICul | ||||||||
| IOv | 1.000 | 0.815** | 0.738** | 0.831** | 0.712** | 0.803** | 0.829** | 0.688** | 0.704** | |||||||
| IPs | 0.815** | 1.000 | 0.810** | 0.785** | 0.708** | 0.773** | 0.767** | 0.697** | 0.738** | |||||||
| IPh | 0.738** | 0.810** | 1.000 | 0.698** | 0.672** | 0.740** | 0.719** | 0.664** | 0.700** | |||||||
| INT | 0.831** | 0.785** | 0.698** | 1.000 | 0.735** | 0.763** | 0.738** | 0.669** | 0.709** | |||||||
| IC | 0.712** | 0.708** | 0.672** | 0.735** | 1.000 | 0.758** | 0.670** | 0.697** | 0.736** | |||||||
| IO | 0.803** | 0.773** | 0.740** | 0.763** | 0.758** | 1.000 | 0.788** | 0.705** | 0.727** | |||||||
| IE | 0.829** | 0.767** | 0.719** | 0.738** | 0.670** | 0.788** | 1.000 | 0.730** | 0.728** | |||||||
| IPo | 0.688** | 0.697** | 0.664** | 0.669** | 0.697** | 0.705** | 0.730** | 1.000 | 0.820** | |||||||
| ICul | 0.704** | 0.738** | 0.700** | 0.709** | 0.736** | 0.727** | 0.728** | 0.820** | 1.000 | |||||||
Notes: **:p<0.01.
Table 6.
Correlations between IPh/Ips/(PSSH−PHH) and Factors(Survey1,2,3).
| IPs | IPh | PSSH−PHH | ||||||||
|---|---|---|---|---|---|---|---|---|---|---|
| Survey1 | Survey2 | Survey3 | Survey1 | Survey2 | Survey3 | Survey1 | Survey2 | Survey3 | ||
| Ascriptive factors(4) | Sex | 0.047** | 0.010 | 0.005 | 0.029* | 0.029* | 0.047* | 0.046** | -0.027* | -0.054** |
| [19] | [20] | [18] | [16] | [10] | [14] | [12] | ||||
| Age | 0.022 | 0.111** | 0.150** | -0.084** | -0.002 | 0.042* | 0.155** | 0.167** | 0.171** | |
| [18] | [14] | [17] | [17] | [1] | [1] | [1] | ||||
| Occupation | 0.210** | 0.170** | 0.130** | 0.207** | 0.160** | 0.160** | 0.011 | 0.006 | -0.028 | |
| [16] | [17] | [15] | [16] | [17] | [14] | |||||
| Marriage | 0.138** | 0.212** | 0.225** | 0.073** | 0.161** | 0.185** | 0.112** | 0.073** | 0.095** | |
| [17] | [15] | [13] | [18] | [16] | [13] | [2] | [6] | [9] | ||
| Biological factors(3/2) | Exercise/ Foods | 0.660** | 0.656** | -0.059** | ||||||
| [1] | [1] | [8] | ||||||||
| Exercise | 0.339** | 0.378** | -0.080** | |||||||
| [13] | [12] | [6] | ||||||||
| Diets | 0.519** | 0.507** | -0.022 | |||||||
| [4] | [2] | |||||||||
| Medical environment | 0.458** | 0.529** | 0.431** | 0.456** | 0.023 | 0.082** | ||||
| [9] | [8] | [9] | [10] | [4] | ||||||
| Natural and Cultural factors(2) | Natural environment | 0.506** | 0.568** | 0.533** | 0.457** | 0.514** | 0.472** | 0.094** | 0.048** | 0.118** |
| [5] | [5] | [5] | [8] | [5] | [6] | [3] | [11] | [4] | ||
| Educational environment | 0.496** | 0.628** | 0.552** | 0.479** | 0.565** | 0.533** | 0.054** | 0.084** | 0.100** | |
| [7] | [2] | [2] | [4] | [2] | [1] | [9] | [3] | [6] | ||
| Economic factors(3) | Income | 0.493** | 0.551** | 0.511** | 0.468** | 0.498** | 0.476** | 0.039** | 0.049** | 0.106** |
| [8] | [7] | [6] | [6] | [7] | [5] | [12] | [10] | [5] | ||
| Assets | 0.499** | 0.559** | 0.534** | 0.473** | 0.515** | 0.507** | 0.033* | 0.032** | 0.088** | |
| [6] | [6] | [4] | [5] | [4] | [3] | [13] | [13] | [10] | ||
| Employment stability | 0.427** | 0.508** | 0.474** | 0.398** | 0.479** | 0.446** | 0.042** | 0.034** | 0.080** | |
| [11] | [9] | [7] | [11] | [8] | [7] | [11] | [12] | [11] | ||
| Societal community factors(4) | Stratification satisfaction | 0.628** | 0.590** | 0.578** | 0.577** | 0.530** | 0.514** | 0.093** | 0.065** | 0.147** |
| [1] | [4] | [1] | [1] | [3] | [2] | [4] | [7] | [2] | ||
| General trust | 0.521** | 0.596** | 0.542** | 0.463** | 0.512** | 0.482** | 0.091** | 0.099** | 0.132** | |
| [3] | [3] | [3] | [7] | [6] | [4] | [5] | [2] | [3] | ||
| Disparity recognition | 0.069** | 0.205** | 0.128** | 0.073** | 0.164** | 0.109** | 0.021 | 0.073** | 0.034† | |
| [18] | [16] | [16] | [19] | [15] | [15] | [5] | [14] | |||
| Disparity elimination | 0.282** | 0.394** | 0.386** | 0.277** | 0.385** | 0.384** | 0.017 | 0.002 | 0.033† | |
| [15] | [12] | [10] | [15] | [12] | [10] | [15] | ||||
| Political factors(4) | Fairness/ Justice | 0.380** | 0.345** | 0.362** | 0.377** | 0.344** | 0.358** | 0.007 | -0.008 | 0.035† |
| [12] | [13] | [11] | [13] | [13] | [11] | [13] | ||||
| Anti-corruptive fairness | 0.310** | 0.293** | 0.310** | 0.315** | 0.310** | 0.323** | -0.006 | -0.027* | -0.001 | |
| [14] | [14] | [12] | [14] | [14] | [12] | [14] | ||||
| Human rights | 0.524** | 0.452** | 0.460** | 0.481** | 0.427** | 0.417** | 0.070** | 0.019 | 0.095** | |
| [2] | [11] | [8] | [3] | [11] | [8] | [7] | [8] | |||
| Civil efficiency | 0.443** | 0.498** | 0.414** | 0.418** | 0.468** | 0.391** | 0.066** | 0.049** | 0.096** | |
| [10] | [10] | [9] | [10] | [9] | [9] | [8] | [9] | [7] | ||
| EUD | 0.524** | 0.656** | 0.580** | 0.501** | 0.582** | 0.528** | 0.092** | 0.145** | 0.168** | |
| HED | 0.321** | 0.647** | 0.588** | 0.305** | 0.570** | 0.516** | 0.064** | 0.122** | 0.173** | |
| Fair/Just society | 0.242** | 0.228** | -0.009 | |||||||
| Distributive justice | 0.436** | 0.428** | -0.001 | |||||||
| Contribution | 0.444** | 0.573** | 0.497** | 0.419** | 0.507** | 0.461** | 0.075** | 0.124** | 0.122** | |
| Optimism | 0.572** | 0.720** | 0.671** | 0.499** | 0.621** | 0.606** | 0.100** | 0.090** | 0.129** | |
Notes: ** :p < 0.01, *: p < 0.05 , †: p < 0.1. Sex (male = 0, female = 1). The figure for age is the actual age (non-logarithm). Occupation: no job = 0, otherwise = 1. Marital status: unmarried, divorced, or bereaved = 0, married = 1. The figures in parentheses concerning exercise/foods are based on the calculated values of correlation coefficients. The figure in brackets indicates the order (from the highest) of the magnitude concerning the estimated coefficient for each variable. The italicized figures in parentheses indicate the number of variables in each category; for biological factors, refer to the information below. The blank space indicates that the relevant variable is not asked in Survey 1 or Survey 2. “Exercise” and “Foods” are separately asked in Survey 1, while an integrated item, “Exercise/Foods,” is asked in Survey 2.
Table 7.
A. Multiple Regression Analysis between IOv and IPh,IPs(Surveys 1,2,3). B. Multiple Regression Analysis between IOv and I CCOPPPE indicate (Surveys 1,2,3). C. Multiple Regression Analysis between IOv and PSSH/I CCOPPPE items (Surveys 1,2,3).
Table 7.
A. Multiple Regression Analysis between IOv and IPh,IPs(Surveys 1,2,3). B. Multiple Regression Analysis between IOv and I CCOPPPE indicate (Surveys 1,2,3). C. Multiple Regression Analysis between IOv and PSSH/I CCOPPPE items (Surveys 1,2,3).
| IOv | |||
| Survey1 | Survey2 | Survey3 | |
| R | 0.822 | 0.835 | 0.825 |
| R2 | 0.676 | 0.697 | 0.681 |
| adjusted R2 | 0.676 | 0.697 | 0.681 |
| β(standardized partial regression coefficient) | |||
| IPs | 0.682** | 0.689** | 0.632** |
| [1] | [1] | [1] | |
| IPh | 0.167** | 0.174** | 0.225** |
| [2] | [2] | [2] | |
| IOv | |||
| Survey1 | Survey2 | Survey3 | |
| R | 0.887 | 0.895 | 0.904 |
| R2 | 0.787 | 0.802 | 0.818 |
| adjusted R2 | 0.787 | 0.801 | 0.817 |
| β (standardized partial regression coefficient) | |||
| IPs | 0.269** | 0.275** | 0.193** |
| [2] | [2] | [3] | |
| IPh | -0.001 | 0.041** | 0.023* |
| [5] | [7] | ||
| IN | 0.307** | 0.335** | 0.323** |
| [1] | [1] | [2] | |
| IC | 0.003 | 0.026** | 0.026† |
| [7] | [6] | ||
| IO | 0.168** | 0.113** | 0.144** |
| [4] | [4] | [4] | |
| IE | 0.235** | 0.243** | 0.324** |
| [3] | [3] | [1] | |
| IPo | -0.004 | -0.017† | 0.001 |
| [8] | |||
| ICul | -0.029** | -0.050** | |
| [6] | [5] | ||
| IOv | |||
| Survey1 | Survey2 | Survey3 | |
| R | 0.883 | 0.892 | 0.903 |
| R2 | 0.780 | 0.796 | 0.816 |
| adjusted R2 | 0.780 | 0.796 | 0.815 |
| β (standardized partial regression coefficient) | |||
| (IPs+IPh)/2 | 0.226** | 0.268** | 0.202** |
| [3] | [2] | [3] | |
| IN | 0.331** | 0.358** | 0.339** |
| [1] | [1] | [1] | |
| IC | -0.001 | 0.024** | 0.024 |
| [6] | |||
| IO | 0.174** | 0.117** | 0.142** |
| [4] | [7] | [4] | |
| IE | 0.244** | 0.259** | 0.328** |
| [2] | [3] | [2] | |
| IPo | -0.003 | -0.027** | 0.000 |
| [5] | |||
| ICul | -0.022* | -0.048** | |
| [7] | [5] | ||
Notes: ** :p < 0.01 ,*: p < 0.05 ,† p < 0.1.
Table 8.
A. Multiple Regression Analysis between IOv/general WB/SWLS, and IPs/IPh (Surveys 1,2,3).
| IOv | general WB | SWLS | |||||||
| Survey1 | Survey2 | Survey3 | Survey1 | Survey2 | Survey3 | Survey1 | Survey2 | Survey3 | |
| R | 0.887 | 0.895 | 0.904 | 0.833 | 0.799 | 0.847 | 0.738 | 0.686 | 0.746 |
| R2 | 0.787 | 0.802 | 0.818 | 0.693 | 0.639 | 0.717 | 0.545 | 0.470 | 0.557 |
| adjusted R2 | 0.787 | 0.801 | 0.817 | 0.693 | 0.639 | 0.717 | 0.545 | 0.470 | 0.557 |
| β (standardized partial regression coefficient) | |||||||||
| IPs | 0.682** | 0.689** | 0.632** | 0.663** | 0.674** | 0.681** | 0.576** | 0.570** | 0.608** |
| [1] | [1] | [1] | [1] | [1] | [1] | [1] | [1] | [1] | |
| IPh | 0.167** | 0.174** | 0.225** | 0.200** | 0.151** | 0.195** | 0.190** | 0.139** | 0.163** |
| [2] | [2] | [2] | [2] | [2] | [2] | [2] | [2] | [2] | |
Note:**:p≦0.01.
Table 8.
B. Correlations between PSSH/APSSH and basic factors (studies 1-3).
| PSSH | APSSH(IOv: overall WB) | APSSH(general WB) | ||||||||
| Survey1 | Survey2 | Survey3 | Survey1 | Survey2 | Survey3 | Survey1 | Survey2 | Survey3 | ||
| Ascriptive factors(4) | Sex | 0.038** | 0.016 | 0.024 | 0.047** | 0.01 | 0.016 | 0.046** | 0.01 | 0.015 |
| [19] | [19] | [19] | ||||||||
| Age | -0.018 | 0.065** | 0.124** | 0.013 | 0.102** | 0.150** | 0.010 | 0.104** | 0.154** | |
| [18] | [16] | [18] | [15] | [18] | [15] | |||||
| Occupation | 0.237** | 0.191** | 0.166** | 0.241** | 0.196** | 0.162** | 0.241** | 0.196** | 0.161** | |
| [16] | [17] | [14] | [16] | [17] | [14] | [16] | [17] | [14] | ||
| Marriage | 0.125** | 0.205** | 0.233** | 0.149** | 0.224** | 0.248** | 0.146** | 0.225** | 0.250** | |
| [17] | [16] | [13] | [17] | [16] | [13] | [17] | [16] | [13] | ||
| Biological factors(3/2) | Exercise/ Foods | 0.723** | 0.723** | 0.722** | ||||||
| [1] | [1] | [1] | ||||||||
| Exercise | 0.403** | 0.391** | 0.393** | |||||||
| [13] | [13] | [13] | ||||||||
| Diets | 0.566** | 0.567** | 0.568** | |||||||
| [2] | [2] | [2] | ||||||||
| Medical environment | 0.475** | 0.534** | 0.484** | 0.561** | 0.484** | 0.562** | ||||
| [9] | [9] | [10] | [8] | [10] | [8] | |||||
| Natural and Cultural factors(2) | Natural environment | 0.520** | 0.591** | 0.555** | 0.544** | 0.612** | 0.573** | 0.542** | 0.612** | 0.575** |
| [8] | [5] | [6] | [7] | [5] | [6] | [7] | [5] | [5] | ||
| Educational environment | 0.535** | 0.652** | 0.612** | 0.550** | 0.682** | 0.628** | 0.550** | 0.682** | 0.629** | |
| [5] | [2] | [2] | [5] | [2] | [2] | [5] | [2] | [2] | ||
| Economic factors(3) | Income | 0.530** | 0.572** | 0.557** | 0.542** | 0.592** | 0.574** | 0.542** | 0.593** | 0.575** |
| [7] | [7] | [5] | [8] | [7] | [5] | [7] | [7] | [5] | ||
| Assets | 0.534** | 0.584** | 0.585** | 0.545** | 0.601** | 0.599** | 0.545** | 0.601** | 0.600** | |
| [6] | [6] | [3] | [6] | [6] | [3] | [6] | [6] | [3] | ||
| Employment stability | 0.451** | 0.538** | 0.525** | 0.464** | 0.555** | 0.538** | 0.463** | 0.556** | 0.539** | |
| [11] | [8] | [7] | [11] | [9] | [7] | [11] | [9] | [7] | ||
| Societal community factors(4) | Stratification satisfaction | 0.666** | 0.612** | 0.616** | 0.691** | 0.637** | 0.639** | 0.689** | 0.638** | 0.641** |
| [1] | [3] | [1] | [1] | [3] | [1] | [1] | [3] | [1] | ||
| General trust | 0.538** | 0.602** | 0.574** | 0.561** | 0.635** | 0.595** | 0.559** | 0.636** | 0.597** | |
| [4] | [4] | [4] | [3] | [4] | [4] | [3] | [4] | [4] | ||
| Disparity recognition | 0.080** | 0.212** | 0.136** | 0.085** | 0.232** | 0.141** | 0.084** | 0.232** | 0.142** | |
| [18] | [15] | [15] | [18] | [15] | [16] | [18] | [15] | [16] | ||
| Disparity elimination | 0.307** | 0.427** | 0.441** | 0.313** | 0.435** | 0.446** | 0.313** | 0.435** | 0.446** | |
| [15] | [12] | [10] | [15] | [12] | [10] | [15] | [12] | [10] | ||
| Political factors(4) | Fairness/ Justice | 0.419** | 0.367** | 0.406** | 0.424** | 0.372** | 0.411** | 0.425** | 0.371** | 0.411** |
| [12] | [13] | [11] | [12] | [13] | [11] | [12] | [13] | [11] | ||
| Anti-corruptive fairness | 0.343** | 0.322** | 0.355** | 0.345** | 0.322** | 0.355** | 0.345** | 0.322** | 0.354** | |
| [14] | [14] | [12] | [14] | [14] | [12] | [14] | [14] | [12] | ||
| Human rights | 0.541** | 0.475** | 0.484** | 0.560** | 0.487** | 0.499** | 0.559** | 0.487** | 0.500** | |
| [3] | [1]] | [8] | [4] | [11] | [8] | [4] | [11] | [8] | ||
| Civil efficiency | 0.475** | 0.531** | 0.462** | 0.492** | 0.551** | 0.477** | 0.491** | 0.552** | 0.479** | |
| [10] | [10] | [9] | [9] | [10] | [9] | [9] | [10] | [9] | ||
Notes: **:p < 0.01, *:p < 0.05. Sex (male = 0, female = 1). The figure for age is the actual age (non-logarithm). Occupation: no job = 0, otherwise = 1. Marital status: unmarried, divorced, or bereaved = 0, married = 1. The figures in parentheses concerning exercise/foods are based on the calculated values of correlation coefficients. The figure in brackets indicates the order (from the highest) of the magnitude concerning the estimated coefficient for each variable. The italicized figures in parentheses indicate the number of variables in each category; for biological factors, refer to the information below. “Exercise” and “Foods” are separately asked in Survey 1, while an integrated item, “Exercise/Foods,” is asked in Survey 2.
Table 8.
C. Multiple regression analysis of PSSH/ APSSH (Iov)/ APSSH (general WB) and basic factors (enforced entry method).
Table 8.
C. Multiple regression analysis of PSSH/ APSSH (Iov)/ APSSH (general WB) and basic factors (enforced entry method).
| PSSH | APSSH(IOv: overall WB) | APSSH(general WB) | ||||||||
| Survey1 | Survey2 | Survey3 | Survey1 | Survey2 | Survey3 | Survey1 | Survey2 | Survey3 | ||
| R | 0.794 | 0.818 | 0.739 | 0.816 | 0.840 | 0.762 | 0.815 | 0.840 | 0.765 | |
| R2 | 0.630 | 0.670 | 0.546 | 0.666 | 0.705 | 0.581 | 0.664 | 0.705 | 0.585 | |
| adjusted R2 | 0.628 | 0.669 | 0.542 | 0.664 | 0.704 | 0.578 | 0.663 | 0.705 | 0.582 | |
| β(standardized partial regression coefficient) | ||||||||||
| Ascriptive factors(4) | Sex | 0.026** | 0.016* | 0.076** | 0.033** | 0.022** | 0.074** | 0.032** | 0.022** | 0.073** |
| [15] | [16] | [7] | [13] | [16] | [7] | [13] | [16] | [7] | ||
| Age | -0.061** | -0.049** | 0.003 | -0.036** | -0.016* | 0.021 | -0.039** | -0.014† | 0.024 | |
| [10] | [8] | [12] | [17] | [12] | [17] | |||||
| Occupation | 0.045** | 0.032** | 0.026† | 0.040** | 0.029** | 0.017 | 0.041** | 0.029** | 0.016 | |
| [11] | [12] | [13] | [11] | [11] | [11] | [11] | ||||
| Marriage | 0.026* | 0.023** | 0.051** | 0.031* | 0.027** | 0.056** | 0.031** | 0.027** | 0.057** | |
| [16] | [14] | [10] | [14] | [12] | [9] | [14] | [12] | [9] | ||
| Biological factors(3/2) | Exercise/ Foods | 0.376** | 0.333** | 0.330** | ||||||
| [1] | [1] | [1] | ||||||||
| Exercise | 0.039** | 0.019† | 0.021* | |||||||
| [13] | [15] | [15] | ||||||||
| Diets | 0.183** | 0.165** | 0.167** | |||||||
| [2] | [2] | [2] | ||||||||
| Medical environment | 0.088** | 0.080** | 0.084** | 0.095** | 0.084** | 0.096** | ||||
| [6] | [6] | [7] | [5] | [8] | [5] | |||||
| Natural and Cultural factors(2) | Natural environment | 0.097** | 0.098** | 0.136** | 0.110** | 0.091** | 0.141** | 0.108** | 0.091** | 0.142** |
| [5] | [5] | [4] | [5] | [6] | [4] | [5] | [6] | [4] | ||
| Educational environment | 0.069** | 0.109** | 0.169** | 0.071** | 0.135** | 0.168** | 0.071** | 0.136** | 0.168** | |
| [8] | [3] | [2] | [8] | [2] | [2] | [8] | [2] | [2] | ||
| Economic factors(3) | Income | 0.017 | 0.021† | 0.048* | 0.021 | 0.026* | 0.055* | 0.021 | 0.027* | 0.056* |
| [15] | [11] | [13] | [10] | [12] | [10] | |||||
| Assets | 0.043* | 0.055** | 0.121** | 0.043** | 0.050** | 0.114** | 0.043** | 0.050** | 0.113** | |
| [12] | [7] | [5] | [10] | [7] | [5] | [10] | [7] | [5] | ||
| Employment stability | 0.001 | 0.033** | 0.003 | 0.003 | 0.036** | -0.005 | 0.003 | 0.036** | -0.007 | |
| [11] | [10] | [10] | ||||||||
| Societal community factors(4) | Stratification satisfaction | 0.298** | 0.118** | 0.173** | 0.318** | 0.130** | 0.195** | 0.316** | 0.130** | 0.199** |
| [1] | [2] | [1] | [1] | [3] | [1] | [1] | [3] | [1] | ||
| General trust | 0.105** | 0.101** | 0.145** | 0.121** | 0.126** | 0.154** | 0.120** | 0.128** | 0.155** | |
| [4] | [4] | [3] | [3] | [4] | [3] | [3] | [4] | [3] | ||
| Disparity recognition | -0.008 | 0.016* | 0.046** | -0.006 | 0.026** | 0.041** | -0.007 | 0.026** | 0.040** | |
| [16] | [12] | [13] | [12] | [14] | [12] | |||||
| Disparity elimination | -0.020† | 0.009 | 0.031 | -0.018† | 0.006 | 0.027 | -0.018† | 0.006 | 0.026 | |
| [17] | [16] | [16] | ||||||||
| Political factors(4) | Fairness/ Justice | 0.028† | -0.009 | -0.058* | 0.024 | -0.009 | -0.055* | 0.024 | -0.009 | -0.054* |
| [14] | [9] | [10] | [11] | |||||||
| Anti-corruptive fairness | -0.064** | -0.042** | -0.006 | -0.070** | -0.048** | -0.019 | -0.069** | -0.049** | -0.021 | |
| [9] | [9] | [9] | [8] | [9] | [8] | |||||
| Human rights | 0.107** | 0.029** | 0.078** | 0.111** | 0.024* | 0.082** | 0.111** | 0.023* | 0.083** | |
| [3] | [13] | [6] | [4] | [15] | [6] | [4] | [15] | [6] | ||
| Civil efficiency | 0.077** | 0.038** | 0.060** | 0.090** | 0.041** | 0.064** | 0.088** | 0.041** | 0.065** | |
| [7] | [10] | [8] | [6] | [9] | [8] | [6] | [9] | [8] | ||
Notes: **:p < 0.01, *:p < 0.05, †: p < 0.1.
| 1 | [1] Cells are counted only when the sign(+ or -) of correlations is the presumed direction. |
| 2 | [2] Equality and equity here correspond to arithmetic and geometrical equality/jusitce in Aristotle’s political philofsophy. The concept of fairness are, in our view, four-dimensional, and there are are two other kinds of fairness: compliance(fairness as law-abidingness) and reciprocity(firness as reciproccity) [30] [9] |
Disclaimer/Publisher’s Note: The statements, opinions and data contained in all publications are solely those of the individual author(s) and contributor(s) and not of MDPI and/or the editor(s). MDPI and/or the editor(s) disclaim responsibility for any injury to people or property resulting from any ideas, methods, instructions or products referred to in the content. |
© 2024 by the authors. Licensee MDPI, Basel, Switzerland. This article is an open access article distributed under the terms and conditions of the Creative Commons Attribution (CC BY) license (http://creativecommons.org/licenses/by/4.0/).
Copyright: This open access article is published under a Creative Commons CC BY 4.0 license, which permit the free download, distribution, and reuse, provided that the author and preprint are cited in any reuse.


