Submitted:
16 October 2024
Posted:
17 October 2024
You are already at the latest version
Abstract
This research work is an extension of a previous work in which the authors created an innovative family of fuzzy implication using as t-conorm probor, as fuzzy negation the 1-x and the type of Newton's binomial. The purpose of this paper is to compare the type of fuzzy implication probor with three other constructed fuzzy implications produced by max, Einstein and Lukasiewicz t-conorms maintaining in each case the same negation. T-conorms perform the fuzzy logical operation "or" of the corresponding fuzzy sets. The main methods used for the comparisons are the basic axioms of fuzzy logic. The authors performed six combinations of t-conorm comparisons, in order to find the rank order of the five fuzzy implications. Although the general type of fuzzy implication probor came out smaller than Hamacher, Einstein and Lukasiewicz and the type of Einstein smaller than Lukasiewicz authors make extensive tests using four different membership functions and different values to the parameter m so as to examine which out of the four fuzzy implications receive the best results. The application of isosceles trapezium to the fuzzy implications probor and Einstein give the best values (most values greater than or equal to 0.9 and equal to 1).
Keywords:
t-conorm
; fuzzy implication
; probor
; max
; Einstein
; Lukasiewicz
; Hamacher
; negation
; triangular membership functions
; trapezium membership functions
1. Introduction
Fuzzy logic is a modelling attempt close to the human way of thinking and inference. It provides approximate reasoning mechanisms and inference/decision-making, since the human brain tends to make the approximate reasoning based on qualitative perception criteria despite precise reasoning based on a multitude of data. The degree of truth of a proposition is expressed by fuzzy logic. Classical logic theory (Aristotelian logic) has dealt with values 0 (false) or 1 (true) for 2500 years. Fuzzy logic was proposed by Zadeh to overcome the opinion that the world we live in is binary and everything said about something is absolutely true (value 1) or false (value 0) [1]. The two-valued classical logic was followed by the new theory of fuzzy logic which brought a revolution stating that apart from the values 0 and 1 there is an infinite number of values in the interval [0,1] that express the value of a proposal. Fuzzy logic seeks the degree of truth or the membership degree in the closed interval [0,1] using a membership degree function [2]. Fuzzy logic patterns can approximate any multivariate function whatever is to desired degree of accuracy [1]. Fuzzy set theory is built to compute with appropriate verbiage. In fuzzy sets, membership degree functions are used to estimate the membership degrees of crisp values. These functions are depicted in the closed interval [0,1] and each case under consideration belongs to each fuzzy set with a different degree of membership [1]. A fuzzy set is also interpreted with linguistics such as low, medium, high, very high. It is obvious that fuzziness contains special knowledge that is required in the assessment of a situation. In most cases the real-world concepts involved can be better described using "Linguistics" than in a strict crisp mathematical manner. People perceive the world better using shades of gray as contrast to black (1) – white (0). Fuzzy logic operates in an environment of ambiguity and uncertainty to produce results that make sense to humans. Fuzzy logic can be used to model real-world concepts and is a tool for incorporating human knowledge through operational algorithms [3]. Today the theory of fuzziness finds huge applications in the sectors of computing and artificial intelligence. Fuzzy relations are categorized into t-norms fuzzy conjugations that perform the "and" operation for the integration (intersection) of fuzzy sets and t-conorms or s-norms fuzzy disjunctions that perform the "or" operation for integration (union) of fuzzy sets.
In the case of sets the union and the intersection are related through the complement. In the case of fuzzy sets, we have many complements which means that any negation can be considered a complement. In classical theory sets conjugation and disjunction are binary in relation to negation, namely they satisfy De Morgan's laws. In a similar way in fuzzy set theory a t-norm and a t-conorm are binary in association with a fuzzy negation if certain conditions are met. In fuzzy logic the set of truth values extends to [0,1] and implication is a binary operation on [0,1]. Fuzzy implications are satisfied by 9 axioms without it being necessary to satisfy all 9 axioms at the same time and which are not independent of each other.
In this paper, authors compare a new and novel type of fuzzy implication created in previous work using probor [4] as t-conorm with 4 well-known t-conorms (max, Einstein, Lukasiewicz and Hamacher). In these comparisons the same negation is maintained in each case.
The purpose of this research was to investigate the ranking order of five fuzzy implications from six pairs combinations of comparisons of five t-conorms as we cannot know without testing which t-conorm is appropriate and which gives either the best or the worst results. In this way we can verify that the new constructed types of fuzzy implications are applicable and flexible after all comparisons between t-conorms have been successfully performed.
The theoretical contribution of this work is that authors used many axioms and theorems of fuzzy logic (fuzzy negations, t-conorm) so that the combinations of t-conorm comparisons are performed. This effort and approach to make various comparisons between five t-conorms (probor, max, Einstein, Lukasiewicz and Hamacher) using each time the same negation in the new type of fuzzy implication constructed using probor as t-conorm so as to find the rank order of five new constructed fuzzy implications (probor, max, Einstein, Lukasiewicz and Hamacher) as well as whether the fuzzy implication produced by probor was a correct and reliable choice is presented for the first time in the international literature as part of fuzzy logic, fuzzy relations and fuzzy implications. Also, the authors make extensive tests so as to find which out of the four membership functions and which out of the four fuzzy implications receives the best and worst results inserted in the types of fuzzy implications the membership degrees of two variables temperature (x) and humidity (y) and the value (defined each time by authors) of parameter m and the important results extracted are presented for the first time in the international literature.
1.1. Literature Review-Related Work
Fuzzy implications are useful in a wide range of applications. In literature, there are many families and classes of fuzzy implications obtained from binary operations on the unit interval [0, 1], i.e., from basic fuzzy logic connectives, such as t-norms, t-conorms and negations. Moreover, investigations into complex fuzzy logic operators have focused on conjunction, disjunction and negation operators.
Makariadis et al., [5] presented the form of an implication using fuzzy negations constructed with the help of conic sections. The relation was applied to real temperature and humidity data of E.M.Y having full application. Pagouropoulos et al., [6] presented a method for detecting the most suitable fuzzy implication among others under consideration, which incorporates an algorithm for the separation of two extreme cases. According to the truth values of the corresponding fuzzy propositions, the optimal implication is one of these two extremes. Pagouropoulos et al., [7] constructed a method for detecting the most suitable fuzzy implication among others under consideration by evaluating the metric distance between each implication and the ideal implication for a given data application. The ideal implication I is defined and used as a reference in order to measure the suitability of fuzzy implications. The method incorporates an algorithm which results in two extreme cases of fuzzy implications regarding their suitability for inference making. Botzoris et al., [8] proposed a method of evaluation of the different fuzzy implications using available statistical data. The choice of the appropriate implication is based on the deviation of the truth value of the fuzzy implication from the real values, as described by the statistical data. Rapti and Papadopoulos, [9] introduced a new construction method of a fuzzy implication from n increasing functions gi: [0, 1] → [0, ∞), (g(0) = 0) (i = 1, 2,:::, n, n ∈ N) and n+1 fuzzy negations Ni (i = 1, 2,:::, n + 1, n ∈ N). This method allows authors to use at least two fuzzy negations Ni and one increasing function g in order to generate a new fuzzy implication. Shi et al., [10] showed that a fuzzy implication defined as a two-position function on the interval [0,1] authors obtain an extension of the classical binary implication. This paper aimed to highlight the interaction of the eight fuzzy axioms. Fernandez-Peralta et al., [11] present the family of fuzzy implications in which the central idea is the existence of completion of a binary function defined on a certain subregion of [0,1]. Fernandez-Sanchez et al., [12] complement and generalize some fuzzy implication constructions based on two arbitrary pairs, obtaining new fuzzy implication. Thus, they give a general method for constructing fuzzy implications. Zhao and Lu [13] presented a new fuzzy implications construction method which compared to others has many advantages. Souliotis and Papadopoulos [14] constructed a new method of generating fuzzy implications based on a given fuzzy negation. So, they made rules aimed at regulation and decision-making adjusting mathematics to common human logic. Karbassi Yazdi et al., [15] refer that the purpose of this research was to design a credit rating model in an uncertain environment using the fuzzy inference system (FIS). In this research, authors used suitable variables of agency ratings from previous studies and then screened them via the Delphi method. Finally, they created a credit rating model using these variables and FIS including related IF-THEN rules which can be applied in a practical setting. Sahin et al., [16] used fuzzy goal programming with triangular fuzzy numbers, membership functions, constraints, assumptions as well as the variables and parameters for optimizing the solution of the model problem. The proposed model presented the mathematical algorithm, and reveals the optimal solution according to satisfaction rank from 0 to 1. Shiau et al., [17] investigated the design of fuzzy-logic-based solar power using Maximum power point tracking (MPPT) algorithms using different fuzzy input variables. MPPT is one of the key functions of the solar power management system in solar energy deployment. Six fuzzy MPPT algorithms, based on different input variables, were considered in this study. Four algorithms had two input variables each while two algorithms having a single input variable.
Daniilidou et al., [4] constructed a generator of fuzzy methods based on theorems and axioms of fuzzy logic. More specific, authors present a new family of fuzzy implications, and also an algorithm is shown that produces fuzzy implications so as to be able to select the optimal method of the generator according to the value of a free parameter. Liu and You [18] define some new operational rules of the Linguistic intuitionistic fuzzy number (LIFNs) based on Einstein operations, then the Heronian mean (HM) operator is extended to the LIFNs and some linguistic intuitionistic fuzzy Heronian mean operators based on Einstein operations are proposed, such as linguistic intuitionistic fuzzy Einstein Heronian mean (LIFEHM) operator, weighted linguistic intuitionistic fuzzy Einstein Heronian mean (WLIFEHM) operator. Rahman et al., [19] introduce some generalized operators, such as the generalized interval-valued Pythagorean fuzzy Einstein weighted averaging (abbreviated as GIVPFEWA) operator, the generalized interval-valued Pythagorean fuzzy Einstein ordered weighted averaging (abbreviated as GIVPFEOWA) operator, and the generalized interval-valued Pythagorean fuzzy Einstein hybrid averaging (abbreviated as GIVPFEHA) operator along with their some general properties, such as idempotency, commutativity, monotonicity and boundedness. Furthermore, the method for multiple attribute group decision making problems based on these operators was developed, and the operational processes were illustrated in detail. These methods play a vital role in real world problems. Garg, [20] present some series of geometric-aggregated operators under Pythagorean fuzzy environment by relaxing the condition that the sum of the degree of membership functions is less than one with the square sum of the degree of membership functions being less than one. Under these environments, aggregator operators, namely, Pythagorean fuzzy Einstein weighted geometric, Pythagorean fuzzy Einstein ordered weighted geometric, generalized Pythagorean fuzzy Einstein weighted geometric, and generalized Pythagorean fuzzy Einstein ordered weighted geometric operators, are proposed. Boixader and Recasens [21] refer that the unit interval with a t-norm “and” or a t-conorm “or” is a special monoid and some submonoids like discrete t-norms and t-conorms have been proved useful in many cases. Moreover, in the first part of this article these submonoids will be fuzzified to fuzzy t-subnorms and fuzzy t-subconorms in order to deal with imprecision. As particular examples authors will provide fuzzifications of the classical and the Lukasiewicz three-valued conjunctions. The second part of the article will define and study vague t-norms and t-conorms as fuzzy operations. Grigorenko et al., [22] present an alternative approach to the concept of a fuzzy (pseudo)metric using t-conorms instead of t-norms and call them t-conorm based fuzzy (pseudo)metrics or just CB-fuzzy (pseudo)metrics. Authors develop the basics of the theory of CB-fuzzy (pseudo)metrics and compare them with “classic” fuzzy (pseudo)metrics. A method for construction CB-fuzzy (pseudo)metrics from ordinary metrics is elaborated and topology induced by CB-fuzzy (pseudo)metrics is studied. Researchers establish interrelations between CB-fuzzy metrics and modulars, and in the process of this study, a particular role of Hamacher t-(co)norm in the theory of (CB)-fuzzy metrics is revealed. Von Schmidt and Klawonn, [23] discuss the question of how complex fuzzy classification rules have to be in order to distinguish classes that are separated by a number of (hyper-) planes. Authors restrict their investigations to the case of two classes. Nevertheless, their results can also be applied, when authors are interested in a larger number of classes, since researchers can simply consider the separation of one class with respect to the union of all other classes. Authors concentrate on the two- and three-dimensional case. Zhu and Li, [24] presented some hesitant fuzzy linguistic (HFL) aggregation operators to handle HFL information based on Hamacher triangle norms. Authors first define new operational laws on the HFL element according to Hamacher triangle norms. Then authors present a family of HFL Hamacher aggregation operators, including the HFL Hamacher weighted averaging, HFL Hamacher weighted geometric, HFL Hamacher power weighted averaging and HFL Hamacher power weighted geometric operators and their generalized forms. Furthermore, researchers develop two approaches based on the proposed operators to deal with the multi-criteria decision-making problem with HFL information. Dong et al., [25] present the Hamacher operational laws for complex Atanassov intuitionistic fuzzy (CA-IF) values. Furthermore, authors derive the power aggregation operators (PAOs) for CA-IF values, called CA-IF power Hamacher averaging (CA-IFPHA), CA-IF power Hamacher ordered averaging (CA-IFPHOA), CA-IF power Hamacher geometric (CA-IFPHG), and CA-IF power Hamacher ordered geometric (CA-IFPHOG) operators. Ahmad and Mesiarová-Zemánková [26] used a zero-order Takagi-Sugeno controller in the regions where the choice of a t-norm is important. Authors then simulated the behaviour of a Cartpole as a Mamdani-controller and computed the controller's output for different choices of t-norms and t-conorms. Gaxiola et al., [27] proposed a comparison of different T-norms and S-norms for interval type-2 fuzzy number weights and presented comparative research between traditional neural networks and the neural network with interval type-2 fuzzy number weights with different T-norms and S-norms. Olej and Hajek [28] presented IF-inference systems of Takagi-Sugeno type. It is based on intuitionistic fuzzy sets (IF-sets), fuzzy t-norm and t-conorm, intuitionistic fuzzy t-norm and t-conorm. So, an IF-inference system was developed for ozone time series prediction comparing the results of the IF-inference systems across various operators. Pan et al., [29] characterize the migrativity of continuous t-conorms over fuzzy implications, which also provides an answer to Fodor's question on how to define the migrativity of t-conorms. Authors characterize the migrativity of t-conorms over several specific well-known fuzzy implications, of which some are no longer dual to the migrativity of t-norms, and show some interesting results. Finally, researchers define α-migrativity of continuous t-conorms over general fuzzy implications and obtain the characterizations of solutions to migrativity equations by the ordinal sum of t-conorms. Fang, [30] is dedicated to the study of α-cross-migrativity involving t-conorms and fuzzy implications. The investigation was presented in two separate parts: the first part focuses on the case that fuzzy implication satisfies some property, especially, the order property. The second one deals with the situation where fuzzy implication belongs to some special classes, i.e., (S,N)-implications, R-implications, and Yager's implications (i.e., f- and g-generated implications).
The motivation of this work was to fill the gap that exists in the literature regarding the reliability testing of a new family of fuzzy implication created by t-conorm probor which was constructed from our research team in a previous work [4] by comparing it with four other t-conorms so that through mathematical operations, theorems and axioms of fuzzy logic to draw a clear conclusion about the rank order of the 5 fuzzy implications which resulted from six combinations pairs of t-conorm comparisons (max-probor, Einstein-probor, Lukasiewicz-probor, Hamacher-probor, Einstein-Lukasiewicz, Einstein-Hamacher). Moreover, the reliability and applicability of the fuzzy implications was examined by extensive tests on different membership functions and for different values of parameter of m indicating the number of iterations.
1.2. Paper Outline
This work is structured as follows: In section 1, a brief description of the theory of fuzzy logic, fuzzy implications, fuzzy relations t-norms and t-conorms is presented and the basic points of this methodology are mentioned (the aim, the purpose and the significance of this paper). In addition, in the same section 1, an extensive and thorough reference is made to works related to the application of t-norms and t-conorms at fuzzy logic and fuzzy implications by exploring the international literature. A general description of the theoretical background and framework of fuzzy implications is included in section 2. Moreover, in section 2 axioms of fuzzy implications are shown in detail. Also in the same section 2, the test of six pairs combinations of comparisons of five t-conorm (max-probor, Einstein-probor, Lukasiewicz-probor, Hamacher-probor, Einstein-Lukasiewicz, Einstein-Hamacher) takes place, using the same negation in order to the rank order of the 5 fuzzy implications (probor, max, Einstein, Lukasiewicz, Hamacher) be calculated. In the same section 2, the construction of the four new types of fuzzy implications from the four fuzzy t-conorms (probor, max, Einstein, Lukasiewicz) and the extensive description and application of the seventh steps of methodology are presented. In Section 3, the authors analyzed the results, which are generated by the application of all steps of the proposed methodology and by conducting extensive tests in four membership functions and in four fuzzy implications for different values of parameter of m so as to find in each case the best model which receives the most values greater or equal to 0.9 and the most optimal values equal to 1. In section 4, the authors mention the most important points of the methodology. Also, they discuss and summarize the most important results and the findings concerning the best and worst membership functions and fuzzy implications. Finally, the conclusions of the overall work and the future research directions are summarized in the section 5.
2. Comparisons and Constructions of Fuzzy Implications. Materials, Methods and Data.
2.1. Theoretical Framework of Fuzzy Implication
Generalizing classical logic [31], in order to determine whether the fuzzy propositions are strongly true, authors are led to evaluate the implication of fuzzy propositions [32,33,34,35].
Definition 1: Researchers define fuzzy implication as a function:
For the definition of a fuzzy logic implication, a set of axioms has been proposed in the literature, that every function has to fulfill, in order to be considered as a fuzzy implication function [36,37,38,39]. So, it must satisfy the maximum of the following axioms, these are [40,41,42]:
- If then (decreasing as to the first variable)
- If then(increasing as to the second variable)
- This means that falsehood implies anything (dominion of false)
- Τhis means that truth does not implies anything (neutrality of truth)
- identity
- (property of change)
- If then (border condition). It means that the fuzzy implications are true if and only if the following condition is at least as true as much as the preceding term.
- That is, two fuzzy implications are identical if o abbot and the following term are interchanged, having previously taken their denial. Essentially, this postulate is a generalization of its method of indiscriminately abducting classical logic,
- The function is continuous
A fuzzy implication must satisfy as many as possible of the above axioms ideally.
A fuzzy negation n [2] is a generalization of the classical supplement.
- and
- The n is a genuinely decreasing function.
Such a function is , which satisfies the above properties. The negation is a strong negation. For a negation to be strong, it must meet all three conditions above, while if it satisfies the first and third condition, it is simply a negation. The inconsistency of the proposal appears by its degree of truth. The lower the degree of truth, the more inconsistent the proposal. Thus, an expression is inconsistent if and only if its negation is strong.
Definition 3: The “or” or t-conorm (denoted by ∨) in fuzzy logic is a depiction [0,1]×[0,1]→[0,1], this will be denoted by . To be or should meet the following properties:
- (commutativity property)
- (associative property)
- (border condition)
- if (monotonicity)
Such or satisfying all the above properties is the probor .
Definition 4:
From our previous work [4], result fuzzy implication
where , with and for t-conorm we use probor .
Definition 5:
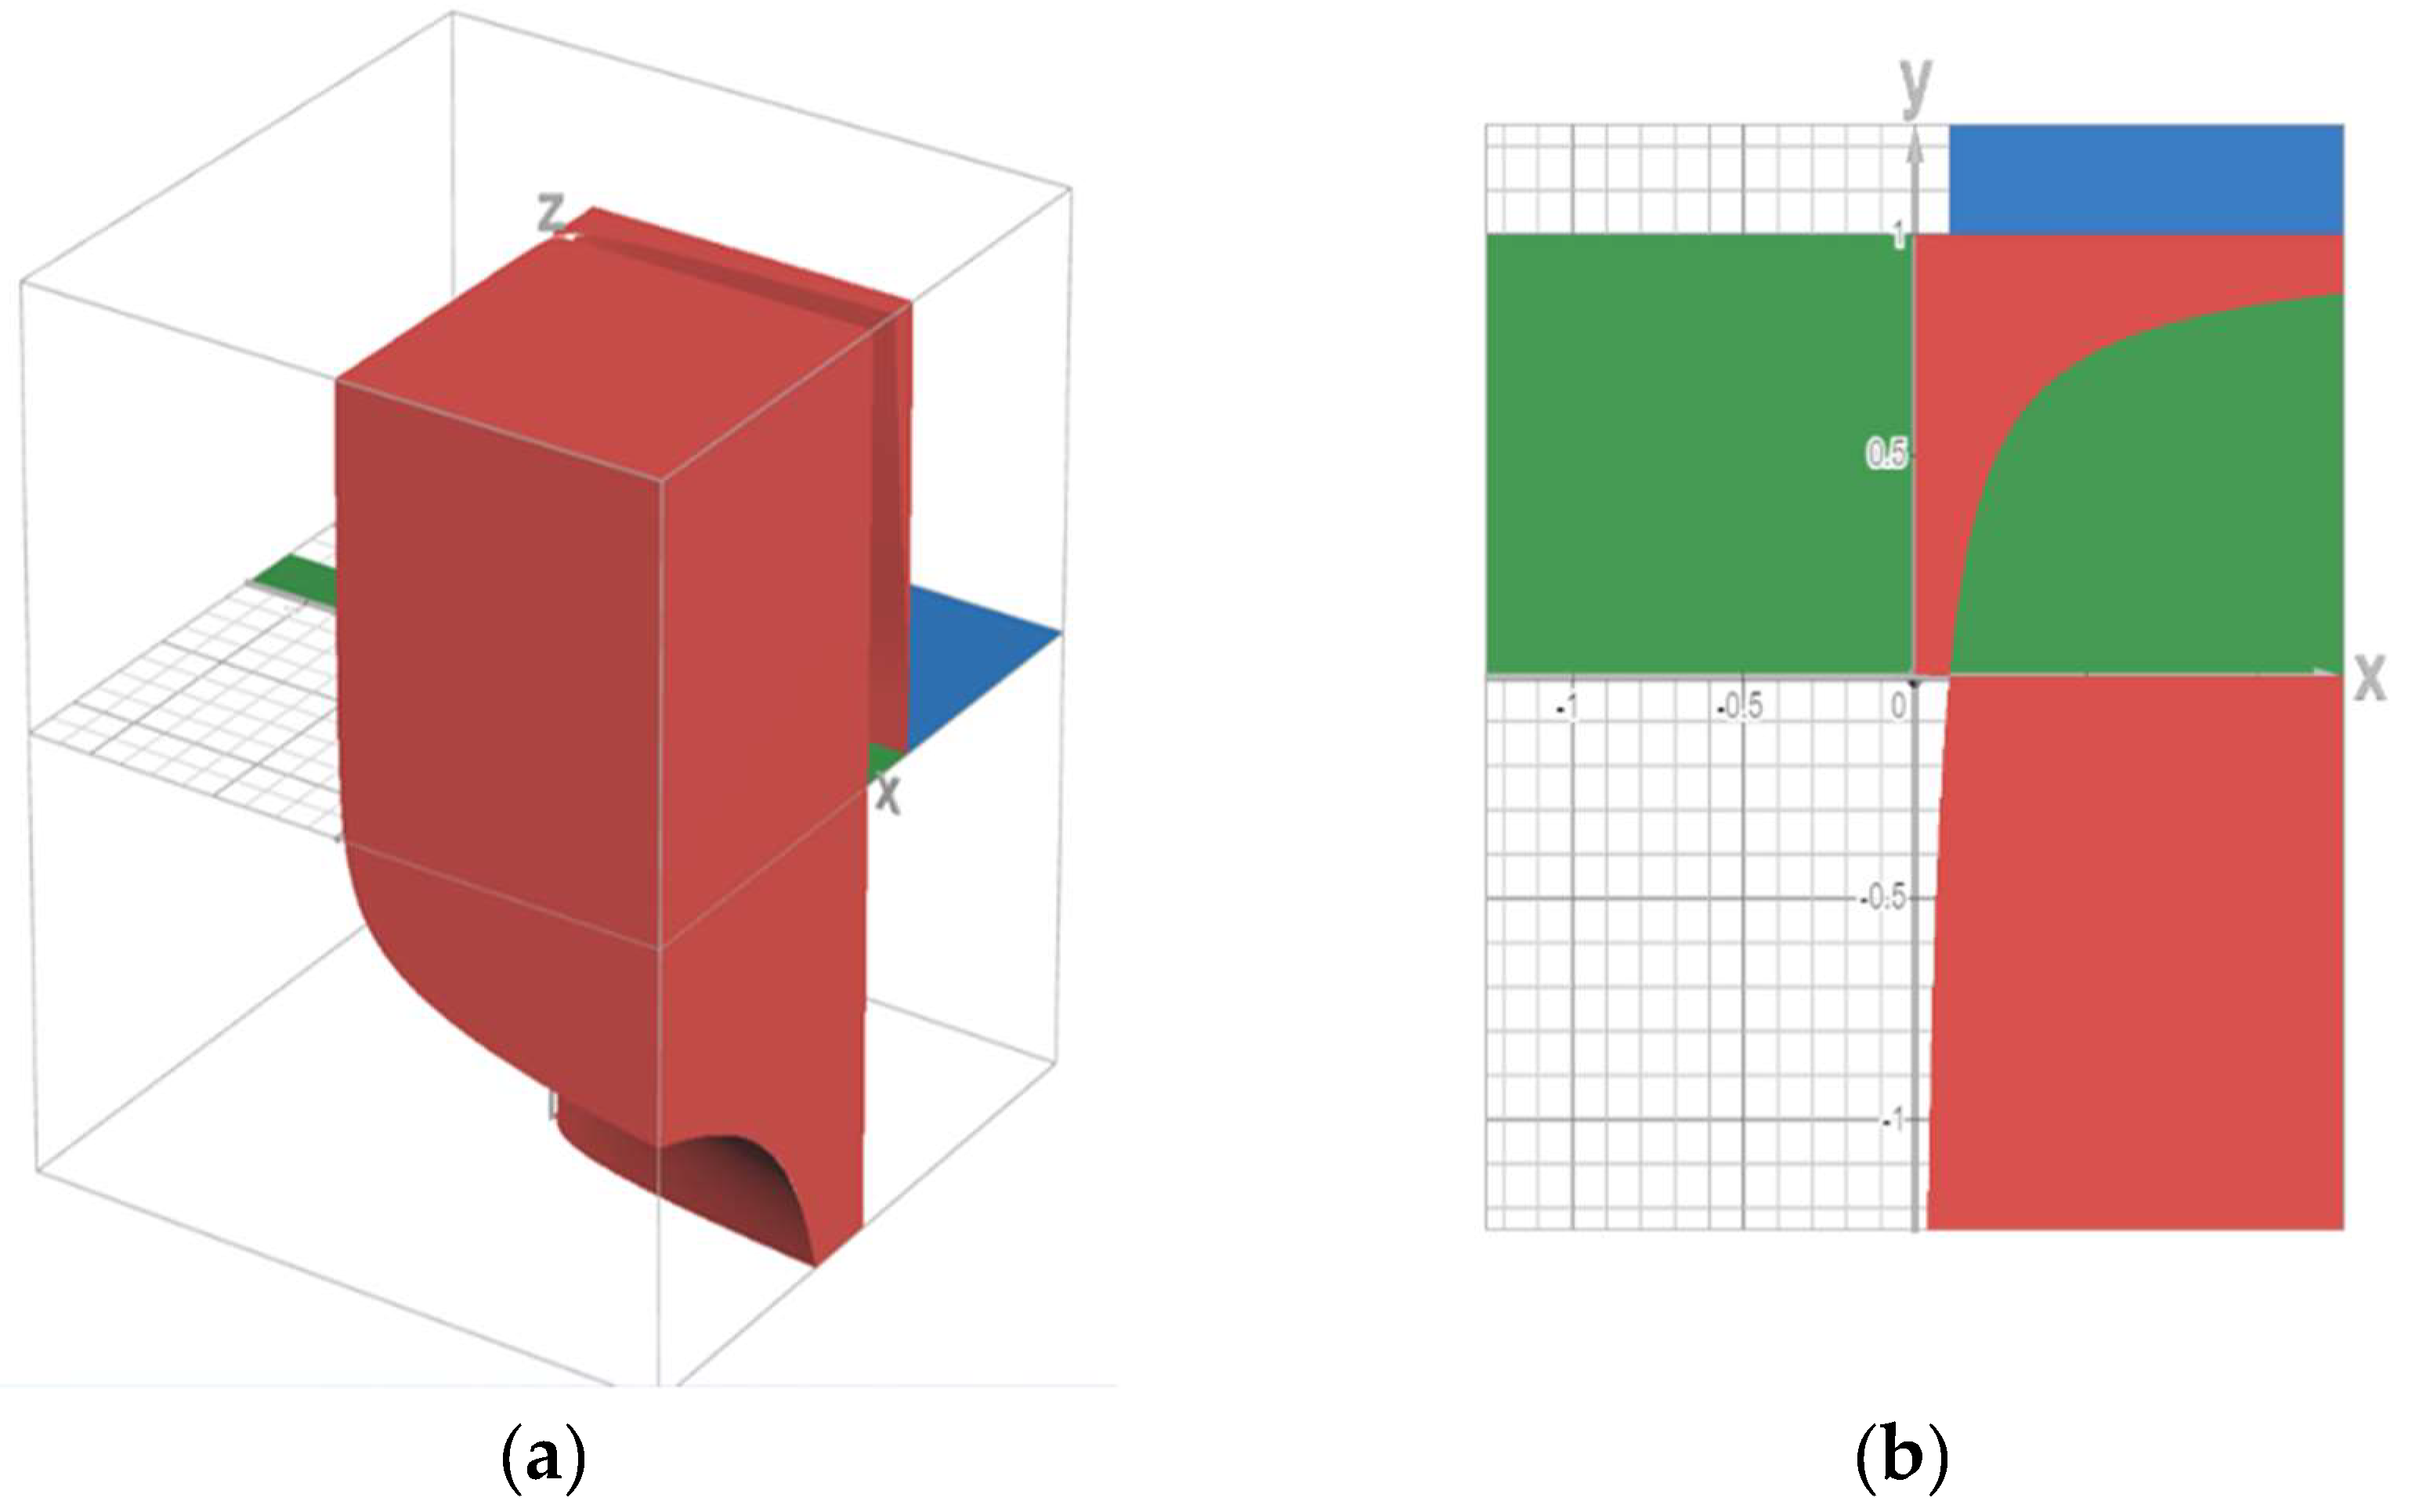
If is a function of the form
when and
From his type definition 5 when and
the following two 3D graphs result.
Figure 1.
(a) Figure a show the three-dimensional form of define 5 of the three variables m, x, y; Figure 1. (b) shows the projection of the three-dimensional form onto the rectangular system xx΄ yy'.
Figure 1.
(a) Figure a show the three-dimensional form of define 5 of the three variables m, x, y; Figure 1. (b) shows the projection of the three-dimensional form onto the rectangular system xx΄ yy'.
2.2. Comparison of Fuzzy Implications Using Different t-Conorm
In this subsection authors make six comparisons between five different t-conorms (probor, max, Einstein, Lukasiewicz and Hamacher) using in each case the same negation. From the five t-conorms, six different pairs of combinations performed so that the ranking order of the fuzzy implications was calculated. The general type of fuzzy implication with t-conorm probor was calculated in a previous work of our research team [4].
Subsequently calculations were performed of fuzzy implications with different t-conorms but with the same negation.
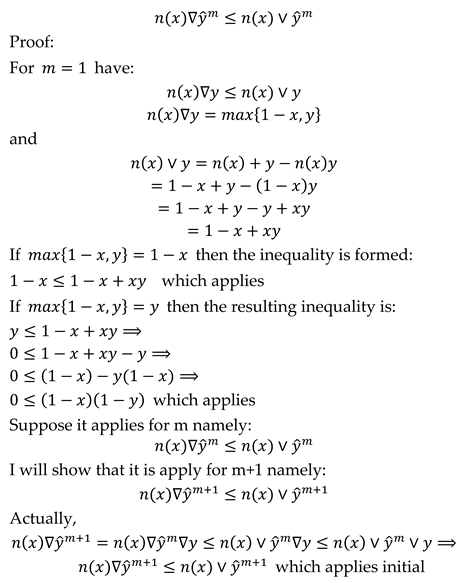
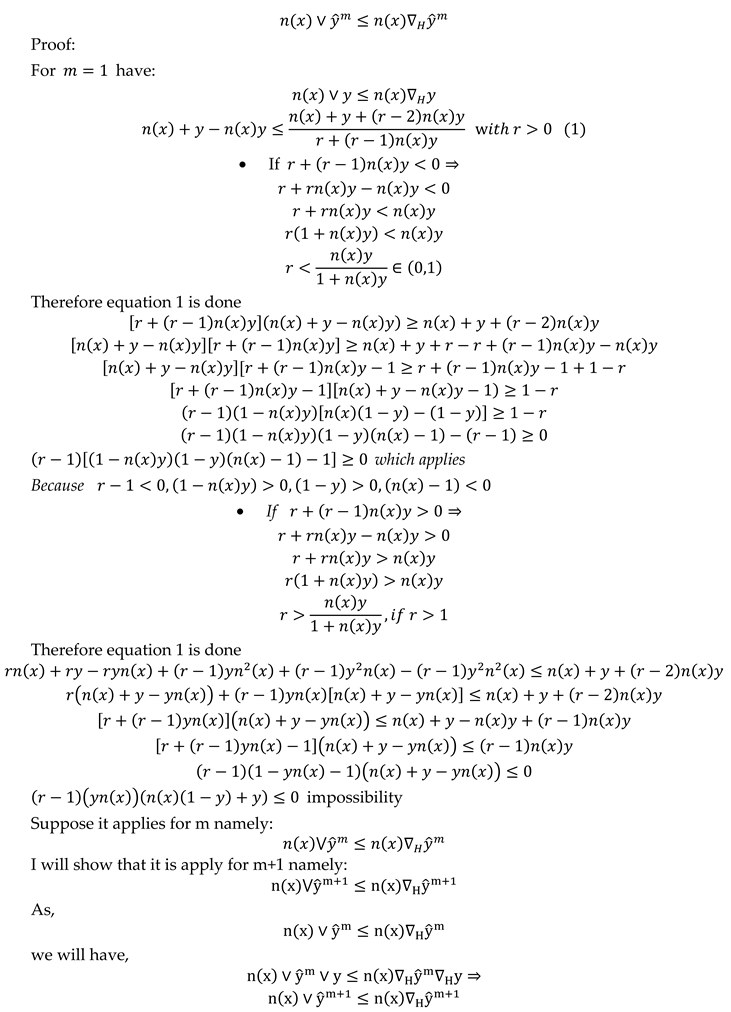
Proposal 1: We compare for or max with symbolism () and probor with symbolism ( ) and we observe that the implication that has for or max is the lower bound of the implication we had constructed in a previous paper, that is:
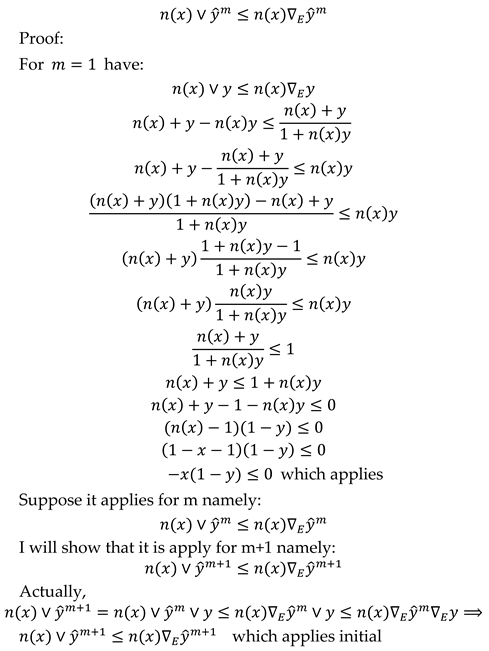
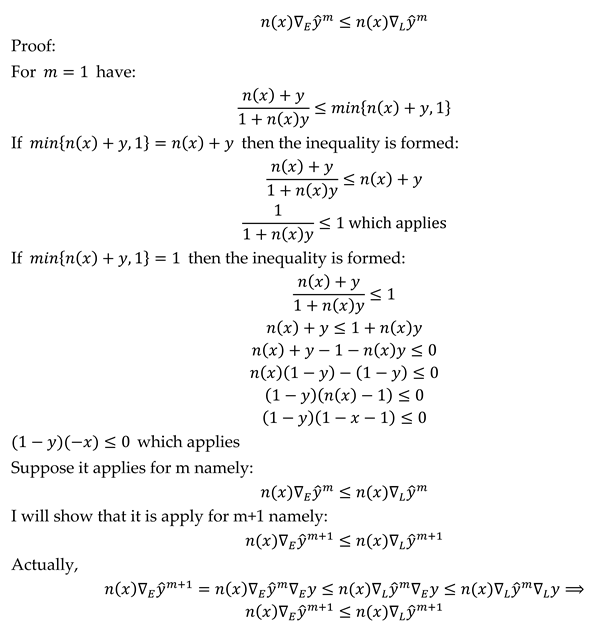
Proposal 2: Compare t-conorm of Einstein with symbolism () and probor with symbolism ( ) and it follows that:
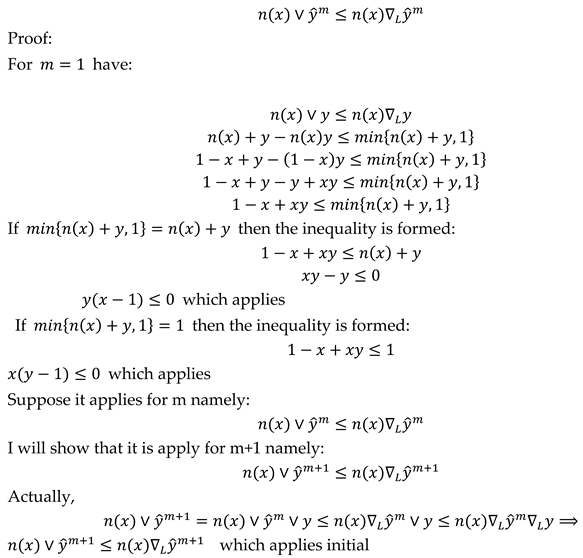
Proposal 3: Compare t-conorm of Lukasiewicz with symbolism () and probor with symbolism ( ) and it follows that:
Proposal 4: Compare t-conorm of Hamacher with symbolism () and probor with symbolism ( ) and it follows that:
Proposal 5: Compare t-conorm of Einstein with symbolism () and Lukasiewicz with symbolism () and it follows that:
Proposal 6: Compare t-conorm of Einstein with symbolism () and Hamacher with symbolism () and it follows that:
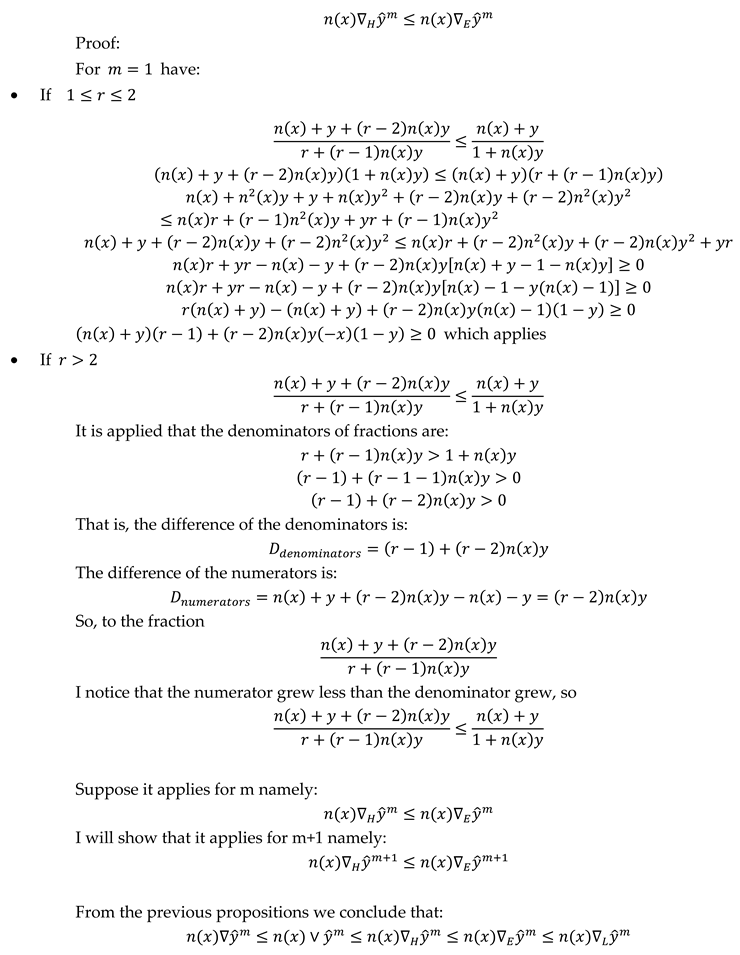

Table 1.
Five fuzzy t-conorms from the international literature review, the symbology of them, and the ranking order from the six combinations of comparisons of the five t-conorms.
Table 1.
Five fuzzy t-conorms from the international literature review, the symbology of them, and the ranking order from the six combinations of comparisons of the five t-conorms.
| T-CONORMS | GENERAL FORMULA | SYMBOL |
|---|---|---|
| Probor | x+y-xy | |
| Max | ||
| Einstein | ||
| Lukasiewicz | ||
| Hamacher | ||
| RANKING |
2.3. Construction of Fuzzy Implications Using Different t-Conorm
Proof of Theorem 1.
I will show inductively that the type holds
I prove that it is true for m=1
I assume it applies to m
I will show that it is apply for m+1 namely
Actually
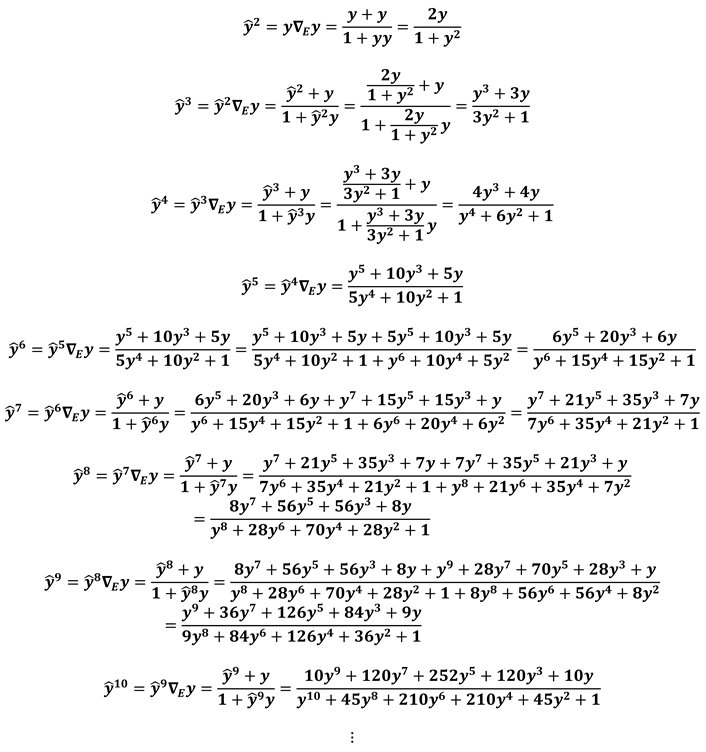
Theorem 2. Ifis a function of the form
where , the function einstein has been selected for the application of t-conorm and m is representing the number of einstein repetitions, then
Proof of Theorem 2.
- If m is odd number, then:
- If m is even number then:
Theorem 3. Ifis a function of the form
where , the function Lukasiewicz has been selected for the application of t-conorm and m is representing the number of Lukasiewicz repetitions, then
Proof of Theorem 3.
First, I'll find out how much it does
- ➢
- If
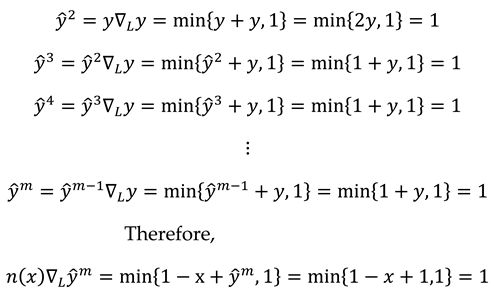
Firstly, prove that it is true for m=1
I assume it applies to m
I will show that it is apply for m+1 namely
Actually
- ➢
- If
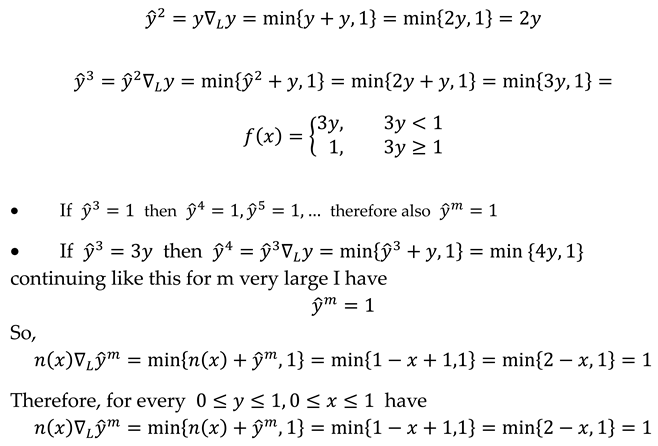
□
Table 2.
Four fuzzy t-conorms from the international literature review, the symbology of them, and the calculated types of fuzzy implications from the four fuzzy t-conorms.
Table 2.
Four fuzzy t-conorms from the international literature review, the symbology of them, and the calculated types of fuzzy implications from the four fuzzy t-conorms.
| T-CONORMS | GENERAL FORMULA | SYMBOL | IMPLICATION |
|---|---|---|---|
| probor | x+y-xy | ||
| max | |||
| Einstein | |||
| Lukasiewicz |
2.4. A General Framework of Seven Steps of Methodology
The steps of the methodology are described in detail:
1st Step:
Comparison of fuzzy implications using different t-conorm (Subsection: 2.2.)
Firstly, in a previous work of our research team [4] authors found the general type of fuzzy implication and secondly used for t-conorm the probor and for negation n(x)=1-x and a new type of fuzzy implication with probor was calculated.
In this step, the comparison of the new type - family of fuzzy implication takes place which was constructed by the t-conorm probor (in our previous work) [4] with four others fuzzy implications which constructed by t-conorms max, Einstein, Lukasiewicz and Hamacher (in the present work) using in each case (fuzzy implication) the same negation. The comparisons were made using six combinations of t-conorms, (max-probor, Einstein-probor, Lukasiewicz-probor, Hamacher-probor, Einstein-Lukasiewicz, Einstein-Hamacher) in order to find the rank order of the five fuzzy implications (probor, max, Einstein, Lukasiewicz and Hamacher).
2nd Step:
Construction and calculation of general type of fuzzy implications (Subsection: 2.3.)
Authors calucated the general types of fuzzy implications of three t-conorms max, Einstein, Lukasiewicz. The general type of fuzzy implication with t-conorm probor had been calculated by authors in a previous work [4]. For the formulas of max, Einstein, Lukasiewicz, used the formula of implication which was found in our previous work [4] by introducing as t-conorm the formulas of max, Einstein, Lukasiewicz and as negation n(x)=1-x. Then performing mathematical operations the formulas of the different t-conorms were calculated and using the induction method authors verified that they are valid and that they can be applied.
3rd Step:
Fuzzification of the crisp values of two variables temperature and humidity (x, y) to fuzzy values in a single fuzzy set in the closed interval [0,1] using four different and varied membership degree functions (two triangular and two trapezoidal). Implementation of 3rd step of methodology using Matlab program: The fuzzification of real variables using four membership degree functions (four cases)
Authors have a time series of data for the two variables. We found the minimum and maximum value of the crisp values for each variable. These values are the limits in the data set. All-time series data range between the minimum and maximum value. For each variable, the authors enter all data into MATLAB and define the boundaries and the range of values in a single fuzzy set so as to be fuzzified using membership degree functions. The minimum and maximum value are the two vertices in each membership degree function. The other vertices are defined by the authors or based on the range of the data.
Authors calculate the degree of membership of temperature and humidity crisp values using four membership degree functions (isosceles and scalene triangular and isosceles and random trapezoidal), which applied in the four types of fuzzy implications (probor, max, Einstein and Lukasiewicz ) for various values of m. Four different models are created, which are presented in the pictures-graphs below:
First of all, the authors in the Matlab program used the following commands that read from excel the 62 temperature and humidity values for two months August and January respectively.
Temperature_August= xlsread ('dedomena.xls',1,'A1:A31') (Command 1)
Humidity_August = xlsread ('dedomena.xls',1,'B1:B31') (Command 2)
Temperature_January= xlsread ('dedomena.xls',2,'A1:A31') (Command 3)
Humidity_January = xlsread ('dedomena.xls',2,'B1:B31') (Command 4)
First Case - Isosceles trapezium (trapezoidal membership function)-Month August
In the first case, the authors use graphs in the form of an isosceles trapezium in a rectangular system of axes with abscissa temperatures or humidities and ordinates the corresponding fuzzy numbers [0,1]. The vertices of the isosceles trapezium for temperatures of August are [26, 30, 33, 37] with graph ordinates [0,1]. While for humidities of August they have abscissas [0.28, 0.35, 0.52, 0.59] with graph ordinates [0,1]. The data taken refer to the city of Kavala in Greece and for a period of one month; August of the year 2023 and at the same time, 14:50 daily [48] with a total of 31 observations. The value equal to 26 is the lowest temperature value and value equal to 37 is the highest temperature value of all 31 temperature values of month August (all values come from 31 observations of temperature). The values 30 and 33 are defined by default from Matlab as they form the vertices of trapezium (value 30 equidistant from 26 and value 33 equidistant from 37, the sum of 26 and 37 is 63 and the sum of 30 and 33 is 63).
Specifically, the authors type the fuzzy command to open the membership function environment. The following command 5 outputs the degrees of membership by fuzzing the temperature values ranging from [26,37] based on the vertices of the isosceles trapezium [26, 30, 33, 37].
IsoscelesTrapeziumTemperatureAugust=trapmf(Temperature_August,[26,30,33,37) (Command 5)
Therefore, temperature values greater than 26 and close to this value will have a membership degree of approximately 0.2-0.5, temperature values of 29 and 34 a membership degree of approximately 0.75, temperature values from 30 to 33 a membership degree of 1, and finally temperature values less than value 37 and close to this value will have a membership degree of about 0.2-0.5. Temperature values 26 and 37 have a membership degree of 0.
The command 6 below outputs the membership degrees by fuzzing the humidity values ranging from [0.28, 0.59] based on the vertices of the isosceles trapezium [0.28, 0.35, 0.52, 0.59].
IsoscelesTrapeziumHumidityAugust=trapmf(Humidity_August,[0.28,0.35,0.52,0.59) (Command 6)
Therefore, humidity values greater than 0.28 (28%) and close to this value will have a membership degree of about 0.1, 0.2, humidity values of 0.34 and 0.53 a membership degree of about 0.85, humidity values from 0.35 to 0.52 a membership degree of 1, and finally humidity values smaller than the value 0.59 and close to this value will have a degree of membership of approximately 0.1, 0.2. Humidity values of 0.28 and 0.59 have a membership degree of 0. The value equal to 0.28 (is the percentage of humidity value equal to 28%) is the lowest humidity value and value equal to 0.59 is the highest humidity value of all 31 humidity values of month August (all values come from 31 observations of humidity). The values 0.35 and 0.52 are defined default from Matlab as they form the vertices of trapezium (value 0.35 equidistant from 0.28 and value 0.59 equidistant from 0.52, the sum of 0.28 and 0.59 is 0.87 and the sum of 0.35 and 0.52 is 0.87).
First Case - Isosceles trapezium (trapezoidal membership function)-Month January
In the first case, the authors use graphs in the form of an isosceles trapezium in a rectangular system of axes with abscissa temperatures or humidities and ordinates the corresponding fuzzy numbers [0,1]. The vertices of the isosceles trapezium for temperatures of January are [3, 8, 14, 19] with graph ordinates [0,1]. While for humidities of January they have abscissas [0.27, 0.47, 0.61, 0.81] with graph ordinates [0,1]. The data taken refer to the city of Kavala in Greece and for a period of one month; January of the year 2024 and at the same time, 14:50 daily [49] with a total of 31 observations. The value equal to 3 is the lowest temperature value and value equal to 19 is the highest temperature value of all 31 temperature values of month January (all values come from 31 observations of temperature). The values 8 and 14 are defined by default from Matlab as they form the vertices of trapezium (value 8 equidistant from 3 and value 19 equidistant from 14, the sum of 3 and 19 is 22 and the sum of 8 and 14 is 22).
Specifically, the authors type the fuzzy command to open the membership function environment. The following command 7 outputs the degrees of membership by fuzzing the temperature values ranging from [3,19] based on the vertices of the isosceles trapezium [3, 8, 14, 19].
Therefore, temperature values greater than 3 and close to this value will have a membership degree of approximately 0.2, temperature values of 7 and 15 a membership degree of approximately 0.8, temperature values from 8 to 14 a membership degree of 1, and finally temperature values less than value 19 and close to this value will have a membership degree of about 0.2. Temperature values 3 and 19 have a membership degree of 0.
The command 8 below outputs the membership degrees by fuzzing the humidity values ranging from [0.27, 0.81] based on the vertices of the isosceles trapezium [0.27 0.47 0.61 0.81].
IsoscelesTrapeziumHumidityJanuary=trapmf(Humidity_January,[0.27,0.47,0.61,0.8) (Command 8)
Therefore, humidity values greater than 0.27 (27%) and close to this value will have a membership degree of about 0.1, 0.2, humidity values of 0.46 and 0.62 a membership degree of about 0.95, humidity values from 0.47 to 0.61 a membership degree of 1, and finally humidity values smaller than the value 0.81 and close to this value will have a degree of membership of approximately 0.1, 0.2. Humidity values of 0.27 and 0.81 have a membership degree of 0. The value equal to 0.27 (is the percentage of humidity value equal to 27%) is the lowest humidity value and value equal to 0.81 is the highest humidity value of all 31 humidity values of month January (all values come from 31 observations of humidity). The values 0.47 and 0.61 are defined default from Matlab as they form the vertices of trapezium (value 0.47 equidistant from 0.27 and value 0.81 equidistant from 0.61, the sum of 0.27 and 0.81 is 1.08 and the sum of 0.47 and 0.61 is 1.08).
Second Case - Random trapezium (trapezoidal membership function)-Month August
In the 2nd case authors construct a random trapezium graph in a rectangular system of axes with abscissas of temperature peaks [26, 31, 33, 37] while ordinates the fuzzy corresponding numbers [0,1] and for humidity [0.28, 0.43, 0.49, 0.59] by placing the large base on the abscissa axis.
The value equal to 26 is the lowest temperature value and value equal to 37 is the highest temperature value of all 31 temperature values of August (all values come from 31 observations of temperature). The values 31 and 33 are defined by authors as vertices of trapezium because the values 31 and 33 appear only 4 times and the degree membership equal to 1 was observed nine (9) times in the total of 31 observations (29% percentage) and secondly authors selected the value 31 because temperature values which are fewer than the value 31 are fewer (12 values) than the total of 31 observations (39% percentage).
The value equal to 0.28 (is the percentage of humidity value equal to 28%) is the lowest humidity value and value equal to 0.59 is the highest humidity value of all 31 humidity values of August (all values come from 31 observations of humidity). The values 0.43 and 0.49 are defined by authors as vertices of trapezium because the values 0.43 and 0.49 appear only 6 times and the degree membership equal to 1 observed 13 times in the total of 31 observations (42% percentage) and secondly authors selected the value 0.43 because humidity values which are fewer than the value 0.43 are fewer (14 values) than the total of 31 observations (45% percentage).
Command 9 outputs the membership degrees by fuzzing the temperature values based on the vertices of the random trapezium [26, 31, 33, 37].
Command 10 outputs the membership degrees by fuzzing the humidity values based on the vertices of the random trapezium [0.28, 0.43, 0.49, 0.59].
RandomTrapeziumHumidityAugust=trapmf(Humidity_August,[0.28,0.43,0.49,0.59) (Command 10)
II. Second Case - Random trapezium (trapezoidal membership function)-Month January
In the 2nd case authors construct a random trapezium graph in a rectangular system of axes with abscissas of temperature peaks [3 12 16 19] while ordinates the fuzzy cor-responding numbers [0,1] and for humidity [0.27 0.53 0.60 0.81] by placing the large base on the abscissa axis.
The value equal to 3 is the lowest temperature value and value equal to 19 is the highest temperature value of all 31 temperature values of January (all values come from 31 observations of temperature). The values 12 and 16 are defined by authors as vertices of trapezium because the values 12 and 16 appear only 6 times and the degree membership equal to 1 was observed 10 times in the total of 31 observations (32% percentage) and secondly authors selected the value 12 because temperature values which are fewer than the value 12 are more (17 values) than the total of 31 observations (55% percentage). The value 12 is not equidistant from 3 and the value 19 is not equidistant from 16, so the value 12 as the second peak is shifted far to the right relative to the dataset values (minimum and maximum value).
The value equal to 0.27 (is the percentage of humidity value equal to 27%) is the lowest humidity value and value equal to 0.81 is the highest humidity value of all 31 humidi-ty values of January (all values come from 31 observations of humidity). The values 0.53 and 0.60 are defined by authors as vertices of trapezium because the values 0.53 and 0.60 appear only 2 times and the degree membership equal to 1 observed 8 times in the total of 31 observations (26% percentage) and secondly authors selected the value 0.53 because humidity values which are fewer than the value 0.53 are more (19 values) than the total of 31 observations (61% percentage). The value 0.53 is not equidistant from 0.27 and the value 0.81 is not equidistant from 0.60, so the value 0.53 as the second peak is slightly shifted far to the right relative to the dataset values (minimum and maximum value).
Command 11 outputs the membership degrees by fuzzing the temperature values based on the vertices of the random trapezium [3 12 16 19].
Command 12 outputs the membership degrees by fuzzing the humidity values based on the vertices of the random trapezium [0.27 0.53 0.60 0.81].
(Command 11)
RandomTrapeziumHumidityJanuary=trapmf(Humidity_January,[0.27,0.53,0.60,0.8)(Command 12)
Third Case - Isosceles triangle (triangular membership function)-Month August
In the 3rd case we construct an isosceles triangle graph with abscissas of vertices [26 31.5 37] having the base on the axis of the abscissas and ordinate of the vertex of the isosceles equal to 1. Similar for isosceles triangle humidities with vertices having abscissa [0.28 0.435 0.59] with maximum ordinate 1 and base on abscissa axis.
The value equal to 26 is the lowest temperature value and value equal to 37 is the highest temperature value of all 31 temperature values of August (all values come from 31 observations of temperature). The value 31.5 is defined default from Matlab as it forms the vertex of a triangle (value 31.5 equidistant from 26 and value 31.5 equidistant from 37, the sum of 26 and 37 is 63 and it is double from 31.5). Moreover, the value 31.5 does not appear in all 31 temperature values and the degree membership equal to 1 is not observed and secondly temperature values which are fewer than the value 31.5 are more (17 values) than the total of 31 observations (55% percentage).
The value equal to 0.28 (is the percentage of humidity value equal to 28%) is the lowest humidity value and value equal to 0.59 is the highest humidity value of all 31 humidity values of August (all values come from 31 observations of humidity). The value 0.435 is defined default from Matlab as it forms the vertex of a triangle (value 0.435 equidistant from 0.28 and value 0.435 equidistant from 0.59, the sum of 0.28 and 0.59 is 0.87 and it is double from 0.435). Moreover, the value 0.435 does not appear in all 31 temperature values and the degree membership equal to 1 is not observed and secondly humidity values which are fewer than the value 0.435 are more (16 values) than the total of 31 observations (52% percentage).
Command 13 outputs the membership degrees by fuzzing the temperature values based on the vertices of the isosceles triangle [26 31.5 37].
Command 14 outputs the membership degrees by fuzzing the humidity values based on the vertices of the isosceles triangle [0.28 0.435 0.59].
IsoscelesTriangleTemperatureAugust=trimf(Temperature_August,[26,31.5,37])
(Command 13)
IsoscelesTriangleHumidityAugust=trimf(Humidity_August, [0.28,0.435,0.59])
(Command 14)
Third Case - Isosceles triangle (triangular membership function)-Month January
In the 3rd case we construct an isosceles triangle graph with abscissas of vertices [3 11 19] having the base on the axis of the abscissas and ordinate of the vertex of the isosceles equal to 1. Similar for isosceles triangle humidities with vertices having abscissa [0.27 0.54 0.81] with maximum ordinate 1 and base on abscissa axis.
The value equal to 3 is the lowest temperature value and value equal to 19 is the highest temperature value of all 31 temperature values of January (all values come from 31 observations of temperature). The value 11 is defined as default by Matlab as it forms the vertex of a triangle (value 11 equidistant from 3 and value 11 equidistant from 19, the sum of 3 and 19 is 22 and it is double from 11).
The value equal to 0.27 (is the percentage of humidity value equal to 27%) is the lowest humidity value and value equal to 0.81 is the highest humidity value of all 31 humidity values of January (all values come from 31 observations of humidity). The value 0.54 is defined as default by Matlab as it forms the vertex of a triangle (value 0.54 equidistant from 0.27 and value 0.54 equidistant from 0.81, the sum of 0.27 and 0.81 is 1.08 and it is double from 0.54).
Command 15 outputs the membership degrees by fuzzing the temperature values based on the vertices of the isosceles triangle [3 11 19].
Command 16 outputs the membership degrees by fuzzing the humidity values based on the vertices of the isosceles triangle [0.27 0.54 0.81].
(Command 15)
IsoscelesTriangleHumidityJanuary=trimf(Humidity_January, [0.27,0.54,0.81])
(Command 16)
Fourth Case - Scalene triangle (triangular membership function)-Month August
Finally in the 4th case authors construct a scalene triangle graph with vertex abscissas [26 30.5 37] temperature graph and [0.28 0.345 0.59] for the humidity graph having ordinate values from [0,1].
The value equal to 26 is the lowest temperature value and value equal to 37 is the highest temperature value of all 31 temperature values of August (all values come from 31 observations of temperature). The value 30.5 is defined by authors as it is forming the vertex of the triangle for two reasons: the value 30.5 does not appear in all 31 temperature values and the degree membership equal to 1 is not observed and secondly authors selected the value 30.5 because temperature values which are fewer than the value 30.5 are fewer (13 values) than the total of 31 observations (42% percentage).
The value equal to 0.28 (is the percentage of humidity value equal to 28%) is the lowest humidity value and the value equal to 0.59 is the highest humidity value of all 31 humidity values of August (all values come from 31 observations of humidity). The value 0.345 is defined by authors as it is forming the vertex of the triangle for two reasons: the value 0.345 does not appear in all 31 temperature values and the degree membership equal to 1 is not observed and secondly authors selected the value 0.345 because humidity values which are fewer than the value 0.345 are fewer (9 values) than the total of 31 observations (29% percentage).
Command 17 outputs membership degrees by fuzzing the temperature values based on the vertices of the scalene triangle [26 30.5 37].
Command 18 outputs membership degrees by fuzzing humidity values based on the vertices of the scalene triangle [0.28 0.345 0.59].
ScaleneTriangleTemperatureAugust=trimf(Temperature_August,[26,30.5,37])
(Command 17)
ScaleneTriangleHumidityAugust=trimf(Humidity_August,[ 0.28,0.345,0.59])
(Command 18)
Fourth Case - Scalene triangle (triangular membership function)-Month January
Finally in the 4th case authors construct a scalene triangle graph with vertex abscissas [3 15.5 19] temperature graph and [0.27 0.465 0.81] for the humidity graph having ordinate values from [0,1].
The value equal to 3 is the lowest temperature value and value equal to 19 is the highest temperature value of all 31 temperature values of January (all values come from 31 observations of temperature). The value 15.5 is defined by authors as it is form the vertex of the triangle for two reasons: the value 15.5 does not appear in all 31 temperature values and the degree membership equal to 1 is not observed and secondly authors selected the value 15.5 because temperature values which are fewer than the value 15.5 are more (22 values) than the total of 31 observations (71% percentage). The value 15.5 is not equidistant from 3 and the value 19 is not equidistant from 15.5, so the value 15.5 as the second peak is shifted too far to the right relative to the dataset values (minimum and maximum value).
The value equal to 0.27 (is the percentage of humidity value equal to 27%) is the lowest humidity value and the value equal to 0.81 is the highest humidity value of all 31 humidity values of January (all values come from 31 observations of humidity). The value 0.465 is defined by authors as it is forming the vertex of the triangle for two reasons: the value 0.465 does not appear in all 31 temperature values and the degree membership equal to 1 is not observed and secondly authors selected the value 0.465 because humidity values which are fewer than the value 0.465 are fewer (10 values) than the total of 31 observations (32% percentage). The value 0.465 is not equidistant from 0.27 and the value 0.81 is not equidistant from 0.465, so the value 0.465 as the second peak is shifted too far to the left relative to the dataset values (minimum and maximum value).
Command 19 outputs membership degrees by fuzzing the temperature values based on the vertices of the scalene triangle [3 15.5 19].
Command 20 outputs membership degrees by fuzzing humidity values based on the vertices of the scalene triangle [0.27 0.465 0.81].
ScaleneTriangleTemperatureJanuary=trimf(Temperature_January,[3,15.5,19])
(Command 19)
ScaleneTriangleHumidityJanuary=trimf(Humidity_January,[0.27,0.465,0.81])
(Command 20)
4rth Step:
Τhe extraction of membership degrees (truth value) from the implementation of the four membership degree functions and the application of these to the two variables temperature and humidity (x, y) of the four types of fuzzy implications.For each variable, the outcome of fuzzification is a single fuzzy set in the closed interval [0,1]. In each membership degree function the minimum and maximum crisp value takes a membership degree (truth value) equal to 0. All other values of our data in each variable take degrees of membership greater than 0 and less than or equal to 1. Values near to minimum and maximum value will have a membership degree equal to 0.1 or 0.2. The average values of time series data will receive membership degrees close or equal to 1 depending on the membership degree’s function.
5th Step:
Extensive tests were performed separately for two months August and January, so as to compare which membership function (isosceles triangular, scalene triangular, isosceles trapezoidal and random trapezoidal) and which family of fuzzy implication (probor, max, Einstein, Lukasiewicz, except from Hamacher) will get the most values greater or equal to 0.9 and the most optimal values equal to 1 when the value of m is equal to 1. The purpose of the implementation of this step is to find which membership function and which family of fuzzy implication (except from Hamacher) will take a) the most values greater or equal to 0.9, b) the most optimal values equal to 1, c) the most values greater or equal to 0.9 and less than 1 and d) the least values less than 0.9.
Examples:
Probor:
For example, in August 2023 in isosceles trapezium, for m=1, the membership degrees of the two variables x and y inserted into the type of fuzzy implication with t-conorm probor so as to calculate when the type will take the more values either a) greater or equal to 0,9 and b) the more optimal values equal to 1.
If a crisp value of the variable x has a membership degree of 0.5 and a crisp value of the variable y has a membership degree of then the new type of fuzzy implication is equal to = . If the value of m is equal to 1 the new type is equal to = = = 0.92855.
If a crisp value of the variable x has a membership degree of 1 and a crisp value of the variable y has a membership degree of then the new type of fuzzy implication is equal to = . If the value of m is equal to 1 the new type is equal to = = 1.
If a crisp value of the variable x has a membership degree of 0 and a crisp value of the variable y has a membership degree of then the new type of fuzzy implication is equal to = . If the value of m is equal to 1 the new type is equal to = = 1.
If a crisp value of the variable x has a membership degree of 0.5 and a crisp value of the variable y has a membership degree of then the new type of fuzzy implication is equal to = . If the value of m is equal to 1 the new type is equal to = = 1.
Max:
For example, in August 2023 in isosceles trapezium, for m=1, either the membership degree of the variable x or the membership degree of the variable y inserted into the type of fuzzy implication with t-conorm max so as to calculate when the type will take the more values either a) greater or equal to 0.9 and b) the more optimal values equal to 1.
If a crisp value of the variable x has a membership degree of 1 and a crisp value of the variable y has a membership degree of then x+y=2 so the new type of fuzzy implication is equal to .
If a crisp value of variable x has a membership degree equal to 0 and the other variable y has a membership degree of 1 then x+y=1 so the new type of fuzzy implication is equal to . Otherwise, if a crisp value of variable x has a membership degree equal to 1 and the other variable y has a membership degree of 0 then x+y=1 so the new type of fuzzy implication is equal to .
If a crisp value of the variable x has a membership degree of 0.25 and a crisp value of the variable y has a membership degree of then so the new type of fuzzy implication is equal to .
Einstein:
For example, in August 2023 in isosceles trapezium, for m=1, the membership degrees of the two variables x and y inserted into the type of fuzzy implication with t-conorm Einstein so as to calculate when the type will take the more values either a) greater or equal to 0,9 and b) the most optimal values equal to 1.
If a crisp value of the variable x has a membership degree of 1 and a crisp value of the variable y has a membership degree of , then the new type of fuzzy implication = = = is equal to .
If a crisp value of the variable x has a membership degree of 0.5 and a crisp value of the variable y has a membership degree of , then the new type of fuzzy implication = = = is equal to 0.9047.
Lukasiewicz:
For example, in August 2023 in isosceles trapezium, for m=1, the membership degrees of the two variables x and y do not insert into the type of fuzzy implication with t-conorm Lukasiewicz so as to calculate when the type will take the more values either a) greater or equal to 0,9 and b) the more optimal values equal to 1. Authors calculate the minus between the value 2 with the membership degree of the variable x, which if the membership degree of variable x is 1 gives result 1 and if the membership degree of variable x is 0 gives result 2. Always the result is between in the closed interval [1,2]. So, the result of the formula is the min between the above calculation in the closed interval [1,2] which always gives the value 1.
These procedures above were being performed for two months, in each membership degree function and for four types of fuzzy implications (probor, max, Einstein, Lukasiewicz).
6th Step:
After the implemention of step 5 authors concluded that the type of fuzzy implication constructed by the t-conorm probor when m was defined with value equal to 1 gave the best results. So, researchers for months August and January, made extensive tests in each membership degree function, so as to find that value of m, in which fuzzy implication constructed by probor, can receive the most values greater or equal to 0.9 and the most optimal values equal to 1. The purpose of the implementation of this step is to find in how many repetitions or differently the precise number of repetitions needed so that the type of fuzzy implication constructed by the t-conorm probor will take a) the most values greater or equal to 0.9, b) the most optimal values equal to 1, c) the most values greater or equal to 0.9 and less than 1 and d) the least values less than 0.9.
Probor:
For example, in August 2023 in isosceles trapezium, the membership degrees of the two variables x and y inserted into the type of fuzzy implication with t-conorm probor so as to calculate that value of m so as that the will take the most values a) greater or equal to 0.9 and b) the most optimal values equal to 1.
If a crisp value of the variable x has a membership degree of 1 and a crisp value of the variable y has a membership degree of 0.1429 then the new type of fuzzy implication is equal to = . If the value of m is equal to 1 the new type is equal to = = = 0.1429. After extensive tests we found that if the value of m is equal to 15, the new type is equal to = = = 0.9010. So, when the value of m is equal to 15 it is the first time that the new type of fuzzy implication gets a value greater than 0,9. Moreover, when the value of m is equal to 139 the new type is equal to = = 1. So, when the value of m is equal to 139 it is the first time the new type of fuzzy implication get a value equal to 1. This procedure was being performed for two months August and January, in each membership degree function (isosceles triangular, scalene triangular, isosceles trapezium and random trapezium).
Example:
In August 2023 in isosceles trapezium, for m=1, in the first iteration, 23 observations in the total of 31 observations (i.e. the membership degrees of 23 from 31 temperature and the membership degrees of 23 from 31 humidity values) give a result equal or greater than 0.9 in the formula of fuzzy implication with probor and 22 observations in the total of 31 observations give a result equal to 1 in the same formula.
In August 2023 in isosceles trapezium, for m=15, in the fifteenth iteration, 29 observations in the total of 31 observations (i.e. the membership degrees of 29 from 31 temperature and the membership degrees of 29 from 31 humidity values) give a result equal or greater than 0.9 in the formula of fuzzy implication with probor and 23 observations in the total of 31 observations give a result equal to 1 in the same formula.
In August 2023 in isosceles trapezium, for m=139, after 139 iterations, 29 observations in the total of 31 observations give a result equal or greater than 0.9 in the formula of fuzzy implication with probor and the same 29 observations in the total of 31 observations give a result equal to 1 in the same formula.
7th Step:
Only the general types of fuzzy implications probor and Einstein depend on the variables x and y as well as on the value of the parameter m and change their result according to the value of the repetition, i.e. the parameter m, which improves continuously as the value of the repetitions, i.e. the parameter m increases. In this step, authors for months August and January, made extensive tests in each membership degree function, so as to find that value of m, in which the fuzzy implications constructed by probor and Einstein, can receive the most values greater or equal to 0.9 and the most optimal values equal to 1. The purpose of the implementation of this step is to find in how many repetitions or differently the precise number of repetitions needed so that the types of fuzzy implications constructed by the t-conorms probor and Einstein will take a) the most values greater or equal to 0.9, b) the most optimal values equal to 1, c) the most values greater or equal to 0.9 and less than 1 and d) the least values less than 0.9.
Extensive tests performed separately for two months August and January, so as to compare which membership function (isosceles triangular, scalene triangular, isosceles trapezoidal and random trapezoidal), and which family of fuzzy implication constructed by probor and Einstein, can receive the most values a) greater or equal to 0,9 and b) the most optimal values equal to 1 when the value of m=1, 2, 3 and 10.
For example, in August 2023 in isosceles trapezium, for m=1, for m=2, for m=3 and for m=10 the membership degrees of the two variables x and y inserted into the type of fuzzy implication with t-conorm probor so as to calculate when the type will get the most values a) greater or equal to 0.9 and b) the most optimal values equal to 1.
For example, in August 2023 in isosceles trapezium, for m=1, for m=2, for m=3 and for m=10 the membership degrees of the two variables x and y inserted into the type of fuzzy implication with t-conorm Einstein so as to calculate when the types or will take the more values either a) greater or equal to 0,9 and b) the more optimal values equal to 1. For m=1 and for m=3 authors used the first type so as to calculate the result of fuzzy implication with t-conorm Einstein. For m=2 and m=10 (even numbers of repetitions), authors used the second more complex type so as to calculate the result of fuzzy implication with t-conorm Einstein.
2.4.1. Real Data and Area of Study
In order to apply the fuzzy implications created, we considered temperature measurements with the corresponding humidity values [50]. The data taken refer to the city of Kavala in Greece and for a period of two months; August (a hot and a warm month) and January (a cold and a rainy month) of the years 2023-2024 and at the same time, 14:50 a.m. daily [48,49] with a total of 62 observations. Variable x represents the humidity values and variable y represents the temperature values. For August the values of humidity are between 28% and 59%, while the values of temperature are between 26°C and 37°C. For January the values of humidity are between 27% and 81%, while the values of temperature are between 3°C and 19°C. For the fuzzification of all temperature and humidity values of August and January, a conversion has been made of all crisp values to the fuzzy values- membership degrees [0,1] by constructing different membership functions.
3. Results
Step 1:
Firstly, authors find the rank order of 5 fuzzy implications (probor, max, Einstein, Hamacher and Lukasiewicz) using six combinations of t-conorms, (max-probor, Einstein-probor, Lukasiewicz-probor, Hamacher-probor, Einstein-Lukasiewicz, Einstein-Hamacher).
Step 2:
Secondly, authors constructed and calculated the general type of four fuzzy implications using as t-conorms probor, max, Einstein, Lukasiewicz.
Step 3:
Thirdly, authors fuzzified the crisp values of temperature and humidity of month August and January separately to fuzzy values in a single fuzzy set in the closed interval [0,1] using four different membership degree functions (isosceles triangular, scalene triangular, isosceles trapezoidal and random trapezoidal).
Step 4:
Fourthly, the extraction of membership degrees (truth value) of temperature (variable x) and humidity (variable y) from the implementation of the four membership degree functions and the application of these to variables x and y of the four types of fuzzy implications (probor, max, Einstein, Lukasiewicz).
Step 5:
Fifth, extensive tests were performed separately for two months August and January, so as to compare which out of the four membership functions (isosceles triangular, scalene triangular, isosceles trapezoidal and random trapezoidal) and which out of the four families of fuzzy implications (probor, max, Einstein, Lukasiewicz, except from Hamacher) will get the most values greater or equal to 0.9, the most optimal values equal to 1, the most values greater or equal to 0.9 and less than 1 and finally the least values less than 0.9 when the value m (which indicate the number of iterations) is equal to 1.
Step 6:
Sixth, extensive tests were performed separately for two months August and January, in each of four membership degree functions, so as to find that value of m, so that fuzzy implication constructed by probor, can get the most values greater or equal to 0.9, the most optimal values equal to 1, the most values greater or equal to 0,9 and less than 1 and finally the least values less than 0,9.
Step 7:
Seventh, extensive tests were performed separately for two months August and January,in each of four membership degree functions in order to find which fuzzy implications (probor, Einstein), can receive the most values greater or equal to 0,9, the most optimal values equal to 1, the most values greater or equal to 0,9 and less than 1 and finally the least values less than 0,9 when the value of m=1, 2, 3 and 10.
The most important results from the implementation of seven steps of the methodology are described in detail.
3.1. General Outcomes of Comparisons of Fuzzy Implications Using Different t-conorm-The Results from the 1st Step of the Methodology
In the first stage authors made comparisons between a new type of fuzzy implications constructed by t-conorm (probor) with four other fuzzy implications constructed by four other t-conorm (max, Einstein, Lukasiewicz and Hamacher) maintaining in each case the same negation. Since it is not possible without tests and comparisons to know which t-conorm is suitable to give the best results and produce the best fuzzy implication, the authors performed six combinations of t-conorm comparisons (max-probor, Einstein-probor, Lukasiewicz-probor, Hamacher-probor, Einstein-Lukasiewicz, Einstein-Hamacher) to find the rank order of the 5 fuzzy implications (probor, max, Einstein, Hamacher and Lukasiewicz).
The first comparison between t-conorms was between max with symbolism ( ∇ ) and probor with symbolism from which it was found that namely the fuzzy implication generated by t-conorm max is less than or equal to the fuzzy implication originally generated by our group with t-conorm probor [4].
The second comparison between t-conorms was between Einstein with symbolism () and probor with symbolism from which it was found that i.e. the fuzzy implication originally generated by t-conorm probor is less than or equal to the fuzzy implication generated by t-conorm Einstein.
The third comparison between t-conorms was between Lukasiewicz with symbolism () and probor with symbolism from which it was found that that is, the fuzzy implication originally generated by t-conorm probor is less than or equal to the fuzzy implication generated by t-conorm Lukasiewicz.
The fourth comparison between t-conorms was between Hamacher with symbolism () and probor with symbolism from which it was found that that is, the fuzzy implication originally generated by t-conorm probor is less than or equal to the fuzzy implication generated by t-conorm Hamacher.
From these four comparisons it follows that the fuzzy implication constructed with t-conorm probor is greater than or equal to the fuzzy implication constructed with t-conorm max and less than or equal to the three other fuzzy implications constructed by t- conorm Einstein, Lukasiewicz and Hamacher. From the above, it follows that t-conorm max is less than or equal to t-conorm probor, but no result can be derived through these four comparisons for the order of ranking of the remaining fuzzy implications (probor, Einstein, Lukasiewicz, Hamacher), so it had to make further comparisons between the fuzzy implications.
The fifth comparison that was deemed appropriate and necessary to make (because the fuzzy implication with probor was calculated to be less than Einstein, Lukasiewicz, Hamacher) was between Einstein with symbolism () and Lukasiewicz with symbolism () from which it was found that i.e. the fuzzy implication generated by the Einstein t-conorm is less than or equal to the fuzzy implication generated by the Lukasiewicz t-conorm.
Finally, the sixth comparison that was deemed appropriate and necessary to make (because the fuzzy implication with probor was calculated to be less than Einstein, Lukasiewicz, Hamacher and Einstein less than or equal to Lukasiewicz,) was between Einstein with symbolism () and Hamacher with symbolism () from which it is found that namely the fuzzy implication created by the t-conorm Einstein is greater than or equal to the fuzzy implication created with t-conorm Hamacher.
From the fifth and sixth comparison, it follows that the fuzzy implication generated by t-conorm Einstein is greater than or equal to the fuzzy implication generated by t-conorm Hamacher and less than or equal to the fuzzy implication generated by t-conorm Lukasiewicz.
Therefore, the following ranking order is derived in terms of the comparisons made and it is the following without this meaning that the ranking order indicates at the same time how good and effective the corresponding t-conorm is when applying and the reliability of the corresponding fuzzy implication:
- Fuzzy implication with t-conorm max which is less than or equal to probor.
- Fuzzy implication with t-conorm probor which is less than or equal to all other three t-conorms Einstein, Lukasiewicz, Hamacher
- Fuzzy implication with t-conorm Hamacher which is less than or equal to Einstein and fuzzy implication with t-conorm Einstein less than or equal to Lukasiewicz
- The fuzzy implication with t-conorm Einstein which is greater than or equal to Hamacher and less than or equal to Lukasiewicz.
- Fuzzy implication with t-conorm Lukasiewicz which is greater than or equal to Einstein and Einstein is greater than or equal to Hamacher than probor and max.
- The fuzzy implication with t-conorm Lukasiewicz is greater than or equal to the other four fuzzy implications created with Einstein, Hamacher, probor and max.
Therefore, the following ranking order is derived:
3.2. General Outcomes from the Construction and Calculation of General Types of Fuzzy Implications - The Results from the 2nd Step of the Methodology
The general calculated type of fuzzy implication max consists of either the variable x or the variable y so the result of the fuzzy implication always remains the same regardless of the parameter m and the iterations since the formula does not contain the parameter m (see Table 2).
The general calculated type of fuzzy implication of Lukasiewicz always gives result 1 since it does not depend on the variables x and y and the parameter m that indicates the repetitions while the other three fuzzy implications (probor, max, Einstein) depend either on the variable x or on the variable y or on both variables simultaneously (see Table 2).
The general types of fuzzy implications probor and Einstein (see Table 2) depend on the variables x and y as well as on the value of the parameter μ and change the result of fuzzy implication according to the value of the repetition, i.e. the parameter m, which improves continuously as the value of the repetitions, i.e. the parameter m increases.
The fuzzy implication constructed with t-conorm Hamacher (general formula see Table 1) was calculated into the ranking order but the Hamacher type (see Table 2) was not calculated due to its complexity as this type has expect for the variables x and y an additional parameter r compared to the other four fuzzy implications probor, max, Einstein, Lukasiewicz (see Table 1).
3.3. General Outcomes of Fuzzy Model-The Results from the 3rd Step of the Methodology
The outcome of our fuzzy model is the fuzzification of 62 temperature and 62 humidity crisp values for two months (31 temperature and 31 humidity crisp values for August and 31 temperature and 31 humidity crisp values for January) to fuzzy values using Mamdani Inference System. Using four different membership degree functions (four cases), authors fuzzified 62 temperature values and 62 humidity values in total and calculated the corresponding membership degrees in a single fuzzy set, without creating fuzzy rules.
The constructed single fuzzy set is not representing an optimal or mean or lowest value. In each membership degree function, the single fuzzy set of temperature contains all 31-temperature daily midday crisp values (from 26 to 37) of the city of Kavala for the month August as input and is defined with degrees of membership from 0 to 1 as output. Also, in each membership degree function the single fuzzy set of humidity contains all 31-humidity daily midday crisp values (from 0.28 to 0.59) of the city of Kavala for the month August as input and is defined with degrees of membership from 0 to 1 as output.
In each membership degree function, the single fuzzy set of temperature contains all 31-temperature daily midday crisp values (from 3 to 19) of the city of Kavala for the month January as input and is defined with degrees of membership from 0 to 1 as output. Also, in each membership degree function the single fuzzy set of humidity contains all 31-humidity daily midday crisp values (from 0.27 to 0.81) of the city of Kavala for the month January as input and is defined with degrees of membership from 0 to 1 as output.
This happened with the fuzzy logic designer of Matlab environment in order for the fuzzy values of temperature and humidity to be used on the four types or families of fuzzy implications, as variable x represents the degree of membership of humidity values and variable y represents the degree of membership of temperature values.
The purpose of this methodology was not to categorize the values into three linguistics-classes οr three fuzzy sets such as low, medium and high temperature or humidity and calculate in each of these linguistics the degrees of membership. Although this procedure is usually used, in our case the new types calculation of fuzzy implications can be tested and evaluated with a single fuzzy set.
For example in a trapezoidal membership function the value 26 (in the value set from 26 to 37 is the lowest temperature value): if we construct a fuzzy set which will contain all 31 temperature values of month August the value 26 will have a membership degree equal to 0 (one trapezoidal membership function) in contrast to three linguistics and three fuzzy sets (one semi-trapezoidal, one trapezoidal and one semi-trapezoidal membership function) where the value 26 will belong to first linguistic (low temperature) with membership degree equal to 1. Moreover, with three linguistics, low, medium and high values of temperature and humidity will have more membership degrees equal to 1. Also, the value 37 (in the value set from 26 to 37 is the highest temperature value) if we construct a fuzzy set which will contain all 31 temperature values of month August the value 37 will have a membership degree equal to 0 in contrast to three linguistics and three fuzzy sets where the value 37 will belong to third linguistic (high temperature) with membership degree equal to 1.
Month August
In isosceles trapezium the temperature values greater than 26°C and close to this value will have a membership degree of approximately 0.25, temperature values of 28°C, 34°C and 29°C, 35°C a membership degree of 0.5 and 0.75 respectively, temperature values from 30°C to 32°C a membership degree of 1 and finally temperature values less than value 37°C and close to this value will have a membership degree of about 0.25. Temperature values 26°C and 37°C have a membership degree of 0. Humidity values greater than 0.28 (28%) and close to this value will have a membership degree of about 0.2, humidity values of 0.31 and 0.32 a membership degree of 0.4 and 0.6 respectively, humidity values of 0.34 a membership degree of about 0.9, humidity values from 0.35 to 0.52 a membership degree of 1 and finally humidity values smaller than the value 0.59 and close to this value will have a degree of membership of approximately 0.2. Humidity values of 0.28 and 0.59 have a membership degree of 0.
In random trapezium the temperature values greater than 26°C and close to this value will have a membership degree of approximately 0.25, temperature values of 28°C and 29°C a membership degree of 0.4 and 0.6 respectively, temperature values of 30°C a membership degree of approximately 0.8, temperature values from 31°C to 32°C a membership degree of 1, temperature values of 34°C and 35°C a membership degree of 0.75 and 0.5 respectively and finally temperature values less than value 37°C and close to this value will have a membership degree of about 0.25. Temperature values 26°C and 37°C have a membership degree of 0. Humidity values greater than 0.28 (28%) and close to this value will have a membership degree of about 0.1, humidity values of 0.31 and 0.32 a membership degree of 0.2 and 0.27 respectively, humidity values of 0.34 a membership degree of about 0.4, humidity values of 0.4 a membership degree of about 0.8, humidity values from 0.43 to 0.49 a membership degree of 1 and finally humidity values smaller than the value 0.59 and close to this value will have a degree of membership of approximately 0.1. Humidity values of 0.28 and 0.59 have a membership degree of 0.
In isosceles triangle the temperature values greater than 26°C and close to this value will have a membership degree of approximately 0.2, temperature values of 28°C and 29°C a membership degree of 0.36 and 0.55 respectively, temperature values of 30°C a membership degree of 0.73, temperature values of 31°C and 32°C a membership degree of 0.9, temperature values of 34°C and 35°C a membership degree of 0.55 and 0.36 respectively and finally temperature values less than value 37°C and close to this value will have a membership degree of about 0.2. Temperature values 26°C and 37°C have a membership degree of 0. Humidity values greater than 0.28 (28%) and close to this value will have a membership degree of about 0.1, humidity values of 0.31 and 0.32 a membership degree of 0.19 and 0.26 respectively, humidity values of 0.34 a membership degree of about 0.39, humidity values of 0.4 a membership degree of about 0.77, humidity values of 0.43 a membership degree approximately to 0.97, humidity values of 0.45 a membership degree of about 0.9 and finally humidity values smaller than the value 0.59 and close to this value will have a degree of membership of approximately 0.1. Humidity values of 0.28 and 0.59 have a membership degree of 0.
In scalene triangle the temperature values greater than 26°C and close to this value will have a membership degree of approximately 0.1, 0.2, temperature values of 28°C and 29°C a membership degree of 0.44 and 0.67 respectively, temperature values of 30°C a membership degree of approximately 0.89, temperature values of 31°C and 32°C a membership degree of 0.92 and 0.77 respectively, temperature values of 34°C and 35°C a membership degree of 0.46 and 0.31 respectively and finally temperature values less than value 37°C and close to this value will have a membership degree of about 0.1, 0.2. Temperature values 26°C and 37°C have a membership degree of 0. Humidity values greater than 0.28 (28%) and close to this value will have a membership degree of about 0.2, 0.3, humidity values of 0.31 and 0.32 a membership degree of 0.46 and 0.62 respectively, humidity values of 0.34 a membership degree of about 0.92, humidity values of 0.35 a membership degree of about 0.98, humidity values of 0.4 a membership degree of about 0.78, humidity values of 0.43 a membership degree approximately to 0.65, humidity values of 0.45 a membership degree of about 0.57 and finally humidity values smaller than the value 0.59 and close to this value will have a degree of membership of approximately 0.1, 0.2. Humidity values of 0.28 and 0.59 have a membership degree of 0.
Month January
In isosceles trapezium the temperature values greater than 3°C and close to this value will have a membership degree of approximately 0.2, temperature values of 6°C, 16°C and 7°C, 15°C a membership degree of 0.6 and 0.8 respectively, temperature values from 8°C to 14°C a membership degree of 1, temperature values of 17°C and 18°C a membership degree of 0.4 and 0.2 respectively and finally temperature values less than value 19°C and close to this value will have a membership degree of about 0.1, 0.2. Temperature values 3°C and 19°C have a membership degree of 0. Humidity values greater than 0.27 (27%) and close to this value will have a membership degree of about 0.1, humidity values of 0.32 a membership degree of 0.25, humidity values of 0.36 and 0.41 a membership degree of 0.45 and 0.7 respectively, humidity values of 0.46 a membership degree of 0.95, humidity values from 0.47 to 0.6 a membership degree of 1, humidity values of 0.63 a membership degree of about 0.9 and finally humidity values smaller than the value 0.81 and close to this value will have a degree of membership of 0.1. Humidity values of 0.27 and 0.81 have a membership degree of 0.
In random trapezium the temperature values greater than 3°C and close to this value will have a membership degree of approximately 0.1, 0.2, temperature values of 6°C and 7°C a membership degree of 0.33 and 0.44 respectively, temperature values of 8°C and 9°C a membership degree of 0.55 and 0.67 respectively, temperature values of 11°C a membership degree approximately 0.9, temperature values from 12°C to 16°C a membership degree of 1, temperature values of 17°C and 18°C a membership degree of 0.67 and 0.33 respectively and finally temperature values less than value 19°C and close to this value will have a membership degree of about 0.3. Temperature values 3°C and 19°C have a membership degree of 0. Humidity values greater than 0.27 (27%) and close to this value will have a membership degree of about 0.1, humidity values of 0.32 a membership degree of 0.19, humidity values of 0.36 and 0.41 a membership degree of 0.35 and 0.54 respectively, humidity values of 0.46 a membership degree of 0.73, humidity values of 0.5 and 0.51 a membership degree of 0.88 and 0.92 respectively, humidity values from 0.53 to 0.6 a membership degree of 1, humidity values of 0.63 a membership degree of about 0.86 and finally humidity values smaller than the value 0.81 and close to this value will have a degree of membership of approximately 0.1. Humidity values of 0.27 and 0.81 have a membership degree of 0.
In isosceles triangle the temperature values greater than 3°C and close to this value will have a membership degree of approximately 0.2, temperature values of 6°C, 16°C and 7°C, 15°C a membership degree of 0.375 and 0.5 respectively, temperature values of 8°C, 14°C and 9°C, 13°C a membership degree of 0.625 and 0.750 respectively, temperature values of 11°C a membership degree of 1, temperature values of 17°C and 18°C a membership degree of 0.25 and 0.125 respectively, and finally temperature values less than value 19°C and close to this value will have a membership degree of about 0.1. Temperature values 3°C and 19°C have a membership degree of 0. Humidity values greater than 0.27 (27%) and close to this value will have a membership degree of about 0.1, humidity values of 0.32 a membership degree of 0.19, humidity values of 0.36 and 0.41 a membership degree of 0.33 and 0.52 respectively, humidity values of 0.46 a membership degree of 0.7, humidity values of 0.5 and 0.51 a membership degree of 0.85 and 0.89 respectively, humidity values of 0.54 a membership degree of 1, humidity values of 0.63 a membership degree of about 0.67 and finally humidity values smaller than the value 0.81 and close to this value will have a degree of membership of approximately 0.1. Humidity values of 0.27 and 0.81 have a membership degree of 0.
In scalene triangle the temperature values greater than 3°C and close to this value will have a membership degree of approximately 0.1, temperature values of 6°C and 7°C a membership degree of 0.24 and 0.32 respectively, temperature values of 8°C and 9°C a membership degree of 0.4 and 0.48 respectively, temperature values of 15°C a membership degree of 0.96, temperature values of 11°C, 13°C, 14°C a membership degree of 0.64, 0.8, 0.88 respectively, temperature values of 17°C and 18°C a membership degree of 0.57 and 0.29 respectively and finally temperature values less than value 19°C and close to this value will have a membership degree of about 0.25. Temperature values 3°C and 19°C have a membership degree of 0. Humidity values greater than 0.27 (27%) and close to this value will have a membership degree of about 0.1, humidity values of 0.32 a membership degree of 0.26, humidity values of 0.36 and 0.41 a membership degree of 0.46 and 0.72 respectively, humidity values of 0.46 and 0.47 a membership degree of 0.97 and 0.99, humidity values of 0.5 and 0.51 a membership degree of 0.9 and 0.87 respectively, humidity values of 0.54 a membership degree of 0.78, humidity values of 0.63 a membership degree of about 0.52 and finally humidity values smaller than the value 0.81 and close to this value will have a degree of membership of approximately 0.1. Humidity values of 0.27 and 0.81 have a membership degree of 0.
Moreover, the outcome of fuzzy model (the fuzzification of 31 temperature and 31 humidity crisp values to fuzzy values) help to find for months August and January a) which out of the four membership degree functions and which out of the four families-types of fuzzy implications (step 5) will give the most values greater or equal to 0.9, the most optimal values equal to 1, the most values greater or equal to 0.9 and less than 1 and the least values less than 0.9 when the number of repetitions i.e. the value of m is equal to 1), b) that value of m, in each of four membership degree functions, so as to the fuzzy implication constructed by probor (step 6) can get the most values greater or equal to 0.9, the most optimal values equal to 1, the most values greater or equal to 0.9 and less than 1 and the least values less than 0.9 and c) which out of the four membership degree functions and which out of the two families-types of fuzzy implications constructed by probor and Einstein (step 7) can receive the most values greater or equal to 0.9, the most optimal values equal to 1, the most values greater or equal to 0.9 and less than 1 and the least values less than 0.9 when the number of repetitions i.e. the value of m is equal to 1 or 2, or 3, or 10).
3.4. General Outcomes of Fuzzy model-The Results from the 4rth Step of the Methodology
Based on the step 3 in the previous subsection, we can make the following observations.
Month August
Ιn the isosceles trapezium 20 crisp values of humidity (variable x) received a membership degree equal to 1 and 18 crisp values of temperature (variable y) received a membership degree equal to 1. Also, 2 crisp values of humidity received a membership degree equal to 0 and 4 crisp values of temperature received a membership degree equal to 0. When variable y has a membership degree equal to 1 the three types of fuzzy implications (probor, max, Einstein) takes the value 1 from the first repetition, when the value of m is equal to 1 and regardless of the membership degree of the variable x. When variable x has a membership degree equal to 0 only two types of fuzzy implications (probor, max) take the value 1 from the first repetition, when the value of m is equal to 1, regardless of the membership degree of the variable y. When variable x has a membership degree equal to 0 the three types of fuzzy implication (probor, max, Einstein) takes the value 1 from the first repetition, when the value of m and the membership degree of the variable y is equal to 1. Also, when variable y and x have a membership degree equal to 1 the three types of fuzzy implication (probor, max, Einstein) takes the value 1 from the first repetition, when the value of m is equal to 1.
In the random trapezium 12 crisp values of humidity received a membership degree equal to 1 and 9 crisp values of temperature received a membership degree equal to 1. Also, 2 crisp values of humidity received a membership degree equal to 0 and 4 crisp values of temperature received a membership degree equal to 0. When variable y has a membership degree equal to 1 the three types of fuzzy implications (probor, max, Einstein) takes the value 1 from the first repetition, when the value of m is equal to 1 and regardless of the membership degree of the variable x. When variable x has a membership degree equal to 0 only two types of fuzzy implications (probor, max) take the value 1 from the first repetition, when the value of m is equal to 1, regardless of the membership degree of the variable y. When variable x has a membership degree equal to 0 the three types of fuzzy implication (probor, max, Einstein) takes the value 1 from the first repetition, when the value of m and the membership degree of the variable y is equal to 1. Also, when variable y and x have a membership degree equal to 1 the three types of fuzzy implication (probor, max, Einstein) takes the value 1 from the first repetition, when the value of m is equal to 1.
Ιn the isosceles and scalene triangle 0 crisp values of humidity received a membership degree equal to 1 and 0 crisp values of temperature received a membership degree equal to 1. Also, in the isosceles and scalene triangle 2 crisp values of humidity received a membership degree equal to 0 and 4 crisp values of temperature received a membership degree equal to 0. When variable x has a membership degree equal to 0 only two types of fuzzy implications (probor, max) take the value 1 from the first repetition, when the value of m is equal to 1, regardless of the membership degree of the variable y.
In all four cases, the same crisp values of humidity and temperature (minimum and maximum values) received a membership degree equal to 0.
Month January
Ιn the isosceles trapezium 17 crisp values of humidity (variable x) received a membership degree equal to 1 and 16 crisp values of temperature (variable y) received a membership degree equal to 1. Also, 2 crisp values of humidity received a membership degree equal to 0 and 2 crisp values of temperature received a membership degree equal to 0. When variable y has a membership degree equal to 1 the three types of fuzzy implications (probor, max, Einstein) take the value 1 from the first repetition, when the value of m is equal to 1 and regardless of the membership degree of the variable x. When variable x has a membership degree equal to 0 only two types of fuzzy implications (probor, max) take the value 1 from the first repetition, when the value of m is equal to 1, regardless of the membership degree of the variable y. When variable x has a membership degree equal to 0 the three types of fuzzy implication (probor, max, Einstein) take the value 1 from the first repetition, when the value of m and the membership degree of the variable y is equal to 1. Also, when variable y and x have a membership degree equal to 1 the three types of fuzzy implication (probor, max, Einstein) takes the value 1 from the first repetition, when the value of m is equal to 1.
In the random trapezium 8 crisp values of humidity received a membership degree equal to 1 and 10 crisp values of temperature received a membership degree equal to 1. Also, 2 crisp values of humidity received a membership degree equal to 0 and 2 crisp values of temperature received a membership degree equal to 0. When variable y has a membership degree equal to 1 the three types of fuzzy implications (probor, max, Einstein) take the value 1 from the first repetition, when the value of m is equal to 1 and regardless of the membership degree of the variable x. When variable x has a membership degree equal to 0 only two types of fuzzy implications (probor, max) take the value 1 from the first repetition, when the value of m is equal to 1, regardless of the membership degree of the variable y. When variable x has a membership degree equal to 0 the three types of fuzzy implication (probor, max, Einstein) take the value 1 from the first repetition, when the value of m and the membership degree of the variable y is equal to 1. Also, when variable y and x have a membership degree equal to 1 the three types of fuzzy implication (probor, max, Einstein) take the value 1 from the first repetition, when the value of m is equal to 1.
Ιn the isosceles triangle 0 crisp values of humidity received a membership degree equal to 1 and 3 crisp values of temperature received a membership degree equal to 1. Also, in the isosceles triangle 2 crisp values of humidity received a membership degree equal to 0 and 2 crisp values of temperature received a membership degree equal to 0. When variable x has a membership degree equal to 0 only two types of fuzzy implications (probor, max) take the value 1 from the first repetition, when the value of m is equal to 1, regardless of the membership degree of the variable y.
Ιn the scalene triangle 0 crisp values of humidity received a membership degree equal to 1 and 0 crisp values of temperature received a membership degree equal to 1. Also, in the scalene triangle 2 crisp values of humidity received a membership degree equal to 0 and 2 crisp values of temperature received a membership degree equal to 0. When variable x has a membership degree equal to 0 only two types of fuzzy implications (probor, max) take the value 1 from the first repetition, when the value of m is equal to 1, regardless of the membership degree of the variable y.
In all four cases, the same crisp values of humidity and temperature (minimum and maximum values) received a membership degree equal to 0.
3.5. General and Optimal Outcomes after Extensive Tests at Four Membership Functions and Four Types of Fuzzy Implications When the Value of m Is Equal to 1-The Results from the 5th Step of the Methodology
I. Isosceles trapezium-Probor, Max, Einstein, Lukasiewicz -August:
Firstly, the authors observe that the month August at isosceles trapezium, for m=1, the fuzzy implication constructed by probor, gives the best results. August has 31 midday values of temperature and humidity. For the calculation of fuzzy implication with probor the 31 pairs of membership degrees of temperature and humidity values insert in the type of fuzzy implication. Moreover, authors define the value 1 to the parameter m. Especially at the isosceles trapezium in the 1th repetition (value of m=1) 23 results (from 23 crisp temperature and humidity values or from 23 membership degrees of temperature and 23 membership degrees of humidity values) of type of fuzzy implication with probor from the 31 total results received a value greater than or equal to 0.9. Also, 22 results of the two types of fuzzy implications with probor and max from the 31 total results received a value equal to 1. On the contrary, only 8 results (fewer than max and Einstein) of type of fuzzy implication with probor from the 31 total results received a value less than 0.9. At the isosceles trapezium in the 1th repetition (value of m=1) 22 results of type of fuzzy implication with max from the 31 total results received a value greater than or equal to 0.9. The type of fuzzy implication of Lukasiewicz always gives result 1 since it does not depend on the variables x and y and the parameter m that indicates the repetitions. So, all the (31) results of this type of fuzzy implication with Lukasiewicz gives a value equal to 1 (See Table 3).
II. Random Trapezium-Probor, Max, Einstein, Lukasiewicz -August:
At the random trapezium in the 1th repetition (value of m=1) 15 results of the two types of fuzzy implications with probor and max from the 31 total results received a value greater than or equal to 0.9. Also, 15 results of the two types of fuzzy implications with probor and max from the 31 total results received a value equal to 1. On the contrary, 16 results of the two types of fuzzy implications with probor and max from the 31 total results received a value less than 0.9. All the (31) results of this type of fuzzy implication with Lukasiewicz always gives a value equal to 1 (See Table 4).
III. Isosceles Triangle-Probor, Max, Einstein, Lukasiewicz -August:
At the isosceles triangle in the 1th repetition (value of m=1) 9 results of the two types of fuzzy implications with probor and max from the 31 total results received a value greater than or equal to 0.9. Also, 4 results of the two types of fuzzy implications with probor and max from the 31 total results received a value equal to 1. On the contrary, 22 results of the two types of fuzzy implications with probor and max from the 31 total results received a value less than 0.9. All the (31) results of this type of fuzzy implication with Lukasiewicz always give a value equal to 1 (See Table 5).
IV. Scalene Triangle-Probor, Max, Einstein, Lukasiewicz -August:
At the scalene triangle in the 1th repetition (value of m=1) 7 results of type of fuzzy implication with probor from the 31 total results received a value greater than or equal to 0.9. Also, only 4 results of the two types of fuzzy implications with probor and max from the 31 total results received a value equal to 1. On the contrary, 24 results (fewer than max and Einstein) of type of fuzzy implication with probor from the 31 total results received a value less than 0.9. All the (31) results of this type of fuzzy implication with Lukasiewicz always gives a value equal to 1 (See Table 6).
Because the fuzzy implication of Lukasiewicz always receives values equal to 1 from the first iteration independent from the membership degrees of variables x and y authors do not consider this type of fuzzy implication reliable. So, for month August, authors believe that isosceles trapezium and the fuzzy implication with probor is the best model [23 results from 31 receive a value greater than or equal to 0.9 (74%) and 22 results from 31 receive a value equal to 1 (71%)]. The second-best model is the random trapezium and the fuzzy implication with probor or with max where [15 results from 31 receive a value greater than or equal to 0.9 or equal to 1 (48%)]. The third best model is the isosceles triangle and the fuzzy implications with probor or max where 9 results from 31 receive a value greater than or equal to 0.9 and only 4 results from 31 receive a value equal to 1. The fourth best model is the scalene triangle and the fuzzy implications with probor where 7 results from 31 receive a value greater than or equal to 0.9 and only 4 results from 31 receive a value equal to 1. The worst fuzzy implication is constructed by Einstein at scalene triangle in which only 3 results from 31 receive a value greater than or equal to 0.9 and none of the 31 results received a value equal to 1. At four membership functions the Einstein received worse results compared to probor and max. At isosceles trapezium and scalene triangle, the probor receive better results in comparison with max.
I. Isosceles trapezium-Probor, Max, Einstein, Lukasiewicz -January:
Firstly, the authors observe that the month January at isosceles trapezium, for m=1, the fuzzy implications constructed by probor, max and Einstein give the best results. Especially at the isosceles trapezium in the 1th repetition (value of m=1) 20 results of types of fuzzy implications with probor, max and Einstein from the 31 total results received a value greater than or equal to 0.9 (65%). Also, 17 results of types of fuzzy implications with probor, max and Einstein from the 31 total results received a value equal to 1 (55%). On the contrary, only 11 results of types of fuzzy implications with probor, max and Einstein from the 31 total results received a value less than 0.9. All the (31) results of type of fuzzy implication with Lukasiewicz receive a value equal to 1 (See Table 7).
II. Random Trapezium-Probor, Max, Einstein, Lukasiewicz - January:
At the random trapezium in the 1th repetition (value of m=1) 14 results of the two types of fuzzy implications with probor and Einstein from the 31 total results received a value greater than or equal to 0.9. Also, 9 results of the two types of fuzzy implications with probor and max from the 31 total results received a value equal to 1. On the contrary, 17 results of the two types of fuzzy implications with probor and Einstein from the 31 total results received a value less than 0.9. All the (31) results of this type of fuzzy implication with Lukasiewicz always gives a value equal to 1 (See Table 8).
III. Isosceles Triangle-Probor, Max, Einstein, Lukasiewicz -January:
At the isosceles triangle in the 1th repetition (value of m=1) 12 results of the type of fuzzy implication with probor from the 31 total results received a value greater than or equal to 0.9. Also, 2 results of the two types of fuzzy implications with probor and max from the 31 total results received a value equal to 1. On the contrary, 19 results (fewer than max and Einstein) of the type of fuzzy implication with probor from the 31 total results received a value less than 0.9. All the (31) results of this type of fuzzy implication with Lukasiewicz always gives a value equal to 1 (See Table 9).
IV. Scalene Triangle-Probor, Max, Einstein, Lukasiewicz -January:
At the scalene triangle in the 1th repetition (value of m=1) 14 results of type of fuzzy implication with probor from the 31 total results received a value greater than or equal to 0.9. Also, only 2 results of types of fuzzy implications with probor and max from the 31 total results received a value equal to 1. On the contrary, 17 results (fewer than max and Einstein) of type of fuzzy implication with probor from the 31 total results received a value less than 0.9. All the (31) results of this type of fuzzy implication with Lukasiewicz always give a value equal to 1 (See Table 10).
Because the fuzzy implication of Lukasiewicz always receives values equal to 1 from the first iteration independent from the membership degrees of variables x and y authors do not consider this type of fuzzy implication reliable. So, for the month January authors believe that isosceles trapezium and the fuzzy implication with probor or max or Einstein is the best model [20 results from 31 receive a value greater than or equal to 0.9 (65%) and 17 results from 31 receive a value equal to 1 (55%)]. The second-best model is the random trapezium and the fuzzy implication with probor where [14 results from 31 receive a value greater than or equal to 0.9 (45%) and 9 results from 31 receive a value equal to 1 (29%)]. The third best model is the scalene triangle and the fuzzy implication with probor where 14 results from 31 receive a value greater than or equal to 0.9 (45%) and 2 results from 31 receive a value equal to 1 (6%). The fourth best model is the isosceles triangle and the fuzzy implication with probor where 12 results from 31 receive a value greater than or equal to 0.9 (39%) and 2 results from 31 receive a value equal to 1 (6%). The worst fuzzy implication is constructed by Einstein at isosceles triangle in which only 6 results from 31 receive a value greater than or equal to 0.9 and none of the 31 results received a value equal to 1. At two membership functions isosceles and scalene triangle the Einstein received the worst results and at three membership functions (isosceles and scalene triangle, random trapezium) apart from isosceles trapezium the probor received better results from the max and Einstein. The best results received only at isosceles trapezium from the three fuzzy implications, probor, max and Einstein.
3.6. General and Optimal Outcomes after Extensive Tests to the Value of Parameter m at Four Membership Functions from the Results of the Type of Fuzzy Implication Probor -The Results from the 6th Step of the Methodology
I. Isosceles trapezium-Probor -August:
Firstly, during the month August the authors make extensive tests at isosceles trapezium so as to find that value of parameter m which gives the best results i.e. the most values greater or equal to 0.9, the most values equal to 1 and the least values less than 0.9 to the fuzzy implication constructed by probor. For the calculation of fuzzy implication with probor the 31 pairs of membership degrees of temperature and humidity values insert in the type of fuzzy implication. Especially at the isosceles trapezium in the 15th repetition (value of m=15) the more (29) results of type of fuzzy implication with probor from the 31 total results (94%) received a value greater than or equal to 0.9. It is the first (time) repetition by which the formula of the fuzzy implication takes the most values greater than or equal to 0.9. The remaining 2 results out of a total of 31 results will not be able to obtain values greater than or equal to 0.9 whatever value authors give the parameter m, that is, no matter how many iterations are performed. So, the maximum number of results of the fuzzy implication by probor that will receive values greater than or equal to 0.9 is 29. In the 15th repetition (value of m=15) twenty-three (23) results of type of fuzzy implication with probor from the 31 total results (74%) received a value equal to 1. At the isosceles trapezium in the 139th repetition (value of m=139) the same 29 results of type of fuzzy implication with probor from the 31 total results (94%) received both a value greater than or equal to 0.9 and equal to 1.
Table 11.
The values of parameter m (the number of iterations) for August so as to the type of fuzzy implication by probor receive a) the most values, b) the most optimal values, c) the most values and d) the least values in isosceles trapezium.
Table 11.
The values of parameter m (the number of iterations) for August so as to the type of fuzzy implication by probor receive a) the most values, b) the most optimal values, c) the most values and d) the least values in isosceles trapezium.
| Probor | ||||
|---|---|---|---|---|
| m=1 | 23 | 22 | 1 | 8 |
| m=11-14 | 27 | 23 | 4 | 4 |
| m=15 | 29 | 23 | 6 | 2 |
| m=62 | 29 | 24 | 5 | 2 |
| m=127,128 | 29 | 26 | 3 | 2 |
| m=135-138 | 29 | 27 | 2 | 2 |
| m=139 | 29 | 29 | 0 | 2 |
II. Random Trapezium-Probor-August:
Secondly, during the month August the authors make extensive tests at random trapezium so as to find that value of parameter m which gives the best results i.e. the more values greater or equal to 0.9, the more values equal to 1 and the least values less than 0.9 to the fuzzy implication constructed by probor. For the calculation of fuzzy implication with probor the 31 pairs of membership degrees of temperature and humidity values insert in the type of fuzzy implication. Especially at the random trapezium in the 34th repetition (value of m=34) the more (29) results of type of fuzzy implication with probor from the 31 total results (94%) received a value greater than or equal to 0.9. It is the first (time) repetition by which the formula of the fuzzy implication takes the more values greater than or equal to 0.9. The remaining 2 results out of a total of 31 results will not be able to obtain values greater than or equal to 0.9 whatever value authors give the parameter m, that is, no matter how many iterations are performed. So, the maximum number of results of the fuzzy implication by probor that will receive values greater than or equal to 0.9 is 29. In the 34th repetition (value of m=34) twenty-two (22) results of type of fuzzy implication with probor from the 31 total results (71%) received a value equal to 1. At the random trapezium in the 311th repetition (value of m=311) the same 29 results of type of fuzzy implication with probor from the 31 total results (94%) received both a value greater than or equal to 0.9 and equal to 1.
Table 12.
The values of parameter m (the number of iterations) for August so as to the type of fuzzy implication by probor receive a) the most values, b) the most optimal values, c) the most values and d) the least values in random trapezium.
Table 12.
The values of parameter m (the number of iterations) for August so as to the type of fuzzy implication by probor receive a) the most values, b) the most optimal values, c) the most values and d) the least values in random trapezium.
| Probor | ||||
|---|---|---|---|---|
| m=1 | 15 | 15 | 0 | 16 |
| m=31 | 28 | 22 | 6 | 3 |
| m=34 | 29 | 22 | 7 | 2 |
| m=195 | 29 | 27 | 2 | 2 |
| m=308 | 29 | 28 | 1 | 2 |
| m=311 | 29 | 29 | 0 | 2 |
III. Isosceles Triangle -Probor-August:
Thirdly, during the month August the authors make extensive tests at isosceles triangle so as to find that value of parameter m which gives the best results i.e. the most values greater or equal to 0.9, the most values equal to 1 and the least values less than 0.9 to the fuzzy implication constructed by probor. Especially at the isosceles triangle in the 34th repetition (value of m=34) most of the results (29) of this type of fuzzy implication with probor from the 31 total results (94%) received a value greater than or equal to 0.9. It is the first (time) repetition by which the formula of the fuzzy implication takes the most values greater than or equal to 0.9. The remaining 2 results out of a total of 31 results will not be able to obtain values greater than or equal to 0.9 whatever value authors give the parameter m, that is, no matter how many iterations are performed. So, the maximum number of results of the fuzzy implication by probor that will receive values greater than or equal to 0.9 is 29. In the 34th repetition (value of m=34) nineteen (19) results of this type of fuzzy implication with probor from the 31 total results (61%) received a value equal to 1. At the isosceles triangle in the 320th repetition (value of m=320) the same 29 results of type of fuzzy implication with probor from the 31 total results (94%) received both a value greater than or equal to 0.9 and equal to 1.
Table 13.
The values of parameter m (the number of iterations) for August so as to the type of fuzzy implication by probor receive a) the most values, b) the most optimal values, c) the most values and d) the least values in isosceles triangle.
Table 13.
The values of parameter m (the number of iterations) for August so as to the type of fuzzy implication by probor receive a) the most values, b) the most optimal values, c) the most values and d) the least values in isosceles triangle.
| Probor | ||||
|---|---|---|---|---|
| m=1 | 9 | 4 | 5 | 22 |
| m=30 | 28 | 19 | 9 | 3 |
| m=34 | 29 | 19 | 10 | 2 |
| m=310 | 29 | 27 | 2 | 2 |
| m=317 | 29 | 28 | 1 | 2 |
| m=320 | 29 | 29 | 0 | 2 |
IV. Scalene Triangle-Probor-August
Finally, during the month of August the authors make extensive tests at scalene triangle so as to find that value of parameter m which gives the best results i.e. the most values greater or equal to 0.9, the most values equal to 1 and the least values less than 0.9 to the fuzzy implication constructed by probor. Especially at the scalene triangle in the 36th repetition (value of m=36) the more (29) results of type of fuzzy implication with probor from the 31 total results (94%) received a value greater than or equal to 0.9. It is the first (time) repetition by which the formula of the fuzzy implication takes the more values greater than or equal to 0.9. The remaining 2 results out of a total of 31 results will not be able to obtain values greater than or equal to 0.9 whatever value authors give the parameter m, that is, no matter how many iterations are performed. So, the maximum number of results of the fuzzy implication by probor that will receive values greater than or equal to 0.9 is 29. In the 36th repetition (value of m=36) twenty (20) results of this type of fuzzy implication with probor from the 31 total results (65%) received a value equal to 1. At the scalene triangle in the 495th repetition (value of m=495) the same 29 results of type of fuzzy implication with probor from the 31 total results (94%) received both a value greater than or equal to 0.9 and equal to 1.
Table 14.
The values of parameter m (the number of iterations) for August so as to the type of fuzzy implication by probor receive a) the most values, b) the most optimal values, c) the most values and d) the least values in scalene triangle.
Table 14.
The values of parameter m (the number of iterations) for August so as to the type of fuzzy implication by probor receive a) the most values, b) the most optimal values, c) the most values and d) the least values in scalene triangle.
| Probor | ||||
|---|---|---|---|---|
| m=1 | 7 | 4 | 3 | 24 |
| m=20 | 28 | 12 | 16 | 3 |
| m=36 | 29 | 20 | 9 | 2 |
| m=127 | 29 | 27 | 2 | 2 |
| m=128 | 29 | 28 | 1 | 2 |
| m=495 | 29 | 29 | 0 | 2 |
In August, in the isosceles trapezium the value of m needs the fewest- 15 repetitions so as that the fuzzy implication takes the most values greater or equal to and the fewer-139 repetitions so that the fuzzy implication takes the most optimal values equal to in contrast with the three other membership functions. Isosceles trapezium is the best solution because fuzzy implication receives values greater than or equal to 0.9 after a small number of repetitions. The second-best membership function is random trapezium as the fuzzy implication takes the most values equal to 1 in the 311th repetition in relation to isosceles triangle in which the fuzzy implication takes the most values equal to 1 in the 320th repetition. Finally, the worst option is scalene triangle as it needs the most (36) repetitions so that the fuzzy implication with probor receives the most values greater than or equal to 0.9 and the most (495) repetitions so that the fuzzy implication with probor receives the most values equal to 1. Only 2 results (from the total 31 results) failed to receive value greater or equal to 0.9 at all four membership degree functions.
I. Isosceles trapezium-Probor -January:
Firstly, during the month of January the authors make extensive tests at isosceles trapezium so as to find that value of parameter m which gives the best results i.e. the most values greater or equal to 0.9, the most values equal to 1 and the least values less than 0.9 to the fuzzy implication constructed by probor. For the calculation of fuzzy implication with probor the 31 pairs of membership degrees of temperature and humidity values insert in the type of fuzzy implication. Especially at the isosceles trapezium in the 22th repetition (value of m=22) the most (29) results of type of fuzzy implication with probor out of the 31 total results (94%) received a value greater than or equal to 0.9. It is the first (time) repetition by which the formula of the fuzzy implication takes the most values greater than or equal to 0.9. The remaining 2 results out of a total of 31 results will not be able to obtain values greater than or equal to 0.9 whatever value the authors give the parameter m, that is, no matter how many iterations are performed. So, the maximum number of results of the fuzzy implication by probor that will receive values greater than or equal to 0.9 is 29. In the 22th repetition (value of m=22) twenty-six (26) results of type of fuzzy implication with probor from the 31 total results (84%) received a value equal to 1. At the isosceles trapezium in the 204th repetition (value of m=204) the same 29 results of type of fuzzy implication with probor from the 31 total results (94%) received both a value greater than or equal to 0.9 and equal to 1.
Table 15.
The values of parameter m (the number of iterations) for January so as to the type of fuzzy implication by probor receive a) the most values, b) the most optimal values, c) the most values and d) the least values in isosceles trapezium.
Table 15.
The values of parameter m (the number of iterations) for January so as to the type of fuzzy implication by probor receive a) the most values, b) the most optimal values, c) the most values and d) the least values in isosceles trapezium.
| Probor | ||||
|---|---|---|---|---|
| m=1 | 20 | 17 | 3 | 11 |
| m=15 | 28 | 21 | 7 | 3 |
| m=16 | 28 | 23 | 5 | 3 |
| m=22 | 29 | 26 | 3 | 2 |
| m=36 | 29 | 27 | 2 | 2 |
| m=75 | 29 | 28 | 1 | 2 |
| m=204 | 29 | 29 | 0 | 2 |
II. Random Trapezium-Probor-January:
Secondly, during the month of January the authors make extensive tests at random trapezium so as to find that value of parameter m which gives the best results i.e. the most values greater or equal to 0.9, the most values equal to 1 and the least values less than 0.9 to the fuzzy implication constructed by probor. For the calculation of fuzzy implication with probor the 31 pairs of membership degrees of temperature and humidity values insert in the type of fuzzy implication. Especially at the random trapezium in the 24th repetition (value of m=24) the most (29) results of type of fuzzy implication with probor from the 31 total results (94%) received a value greater than or equal to 0.9. It is the first (time) repetition by which the formula of the fuzzy implication takes the most values greater than or equal to 0.9. The remaining 2 results out of a total of 31 results will not be able to obtain values greater than or equal to 0.9 whatever value authors give the parameter m, that is, no matter how many iterations are performed. So, the maximum number of results of the fuzzy implication by probor that will receive values greater than or equal to 0.9 is 29. In the 24th repetition (value of m=24) twenty-four (24) results of type of fuzzy implication with probor from the 31 total results (77%) received a value equal to 1. At the random trapezium in the 263th repetition (value of m=263) the same 29 results of type of fuzzy implication with probor from the 31 total results (94%) received both a value greater than or equal to 0.9 and equal to 1.
Table 16.
The values of parameter m (the number of iterations) for January so as to the type of fuzzy implication by probor receive a) the most values, b) the most optimal values, c) the most values and d) the least values in random trapezium.
Table 16.
The values of parameter m (the number of iterations) for January so as to the type of fuzzy implication by probor receive a) the most values, b) the most optimal values, c) the most values and d) the least values in random trapezium.
| Probor | ||||
|---|---|---|---|---|
| m=1 | 14 | 9 | 5 | 17 |
| m=16 | 28 | 20 | 8 | 3 |
| m=24 | 29 | 24 | 5 | 2 |
| m=51 | 29 | 27 | 2 | 2 |
| m=100 | 29 | 28 | 1 | 2 |
| m=263 | 29 | 29 | 0 | 2 |
III. Isosceles Triangle -Probor-January:
Thirdly, during the month of January the authors make extensive tests at isosceles triangle so as to find that value of parameter m which gives the best results i.e. the most values greater or equal to 0.9, the most values equal to 1 and the least values less than 0.9 to the fuzzy implication constructed by probor. Especially at the isosceles triangle in the 27th repetition (value of m=27) the most (29) results of type of fuzzy implication with probor from the 31 total results (94%) received a value greater than or equal to 0.9. It is the first (time) repetition by which the formula of the fuzzy implication takes the more values greater than or equal to 0.9. The remaining 2 results out of a total of 31 results will not be able to obtain values greater than or equal to 0.9 whatever value the authors give the parameter m, that is, no matter how many iterations are performed. So, the maximum number of results of the fuzzy implication by probor that will receive values greater than or equal to 0.9 is 29. In the 27th repetition (value of m=27) twenty-three (23) results of type of fuzzy implication with probor from the 31 total results (74%) received a value equal to 1. At the isosceles triangle in the 275th repetition (value of m=275) the same 29 results of type of fuzzy implication with probor from the 31 total results (94%) received both a value greater than or equal to 0.9 and equal to 1.
Table 17.
The values of parameter m (the number of iterations) for January so as to the type of fuzzy implication by probor receive a) the most values, b) the most optimal values, c) the most values and d) the least values in isosceles triangle.
Table 17.
The values of parameter m (the number of iterations) for January so as to the type of fuzzy implication by probor receive a) the most values, b) the most optimal values, c) the most values and d) the least values in isosceles triangle.
| Probor | ||||
|---|---|---|---|---|
| m=1 | 12 | 2 | 10 | 19 |
| m=18 | 28 | 18 | 10 | 3 |
| m=27 | 29 | 23 | 6 | 2 |
| m=52 | 29 | 27 | 2 | 2 |
| m=104 | 29 | 28 | 1 | 2 |
| m=275 | 29 | 29 | 0 | 2 |
IV. Scalene Triangle-Probor January
Finally, during the month of January the authors make extensive tests at scalene triangle so as to find that value of parameter m which gives the best results i.e. the most values greater or equal to 0.9, the most values equal to 1 and the least values less than 0.9 to the fuzzy implication constructed by probor. Especially at the scalene triangle in the 15th repetition (value of m=15) the most (29) results of this type of fuzzy implication with probor from the 31 total results (94%) received a value greater than or equal to 0.9. It is the first (time) repetition by which the formula of the fuzzy implication takes the most values greater than or equal to 0.9. The remaining 2 results out of a total of 31 results will not be able to obtain values greater than or equal to 0.9 whatever value authors give the parameter m, that is, no matter how many iterations are performed. So, the maximum number of results of the fuzzy implication by probor that will receive values greater than or equal to 0.9 is 29. In the 15th repetition (value of m=15) fifteen (15) results of type of fuzzy implication with probor from the 31 total results (48%) received a value equal to 1. At the scalene triangle in the 192th repetition (value of m=192) the same 29 results of type of fuzzy implication with probor from the 31 total results (94%) received both a value greater than or equal to 0.9 and equal to 1.
Table 18.
The values of parameter m (the number of iterations) for January so as to the type of fuzzy implication by probor receive a) the most values, b) the most optimal values, c) the most values and d) the least values in scalene triangle.
Table 18.
The values of parameter m (the number of iterations) for January so as to the type of fuzzy implication by probor receive a) the most values, b) the most optimal values, c) the most values and d) the least values in scalene triangle.
| Probor | ||||
|---|---|---|---|---|
| m=1 | 14 | 2 | 12 | 17 |
| m=9 | 28 | 8 | 20 | 3 |
| m=15 | 29 | 15 | 14 | 2 |
| m=45 | 29 | 27 | 2 | 2 |
| m=71 | 29 | 28 | 1 | 2 |
| m=192 | 29 | 29 | 0 | 2 |
In January, in the scalene triangle the value of m needs the fewest - 15 repetitions so as that the fuzzy implication takes the most values greater or equal to and the fewest-192 repetitions so as that the fuzzy implication takes the most optimal values equal to in contrast with the other three membership functions. Scalene triangle is the best solution because fuzzy implication receives values greater than or equal to 0.9 after a small number of repetitions. The second-best membership function is isosceles trapezium as the fuzzy implication takes the most values equal to 1 in the 204th repetition in relation to random trapezium in which the fuzzy implication takes the most values equal to 1 in the 263th repetition. Finally, the worst option is isosceles triangle as it needs the most (27) repetitions so that the fuzzy implication with probor receives the most values greater than or equal to 0.9 and the most (275) repetitions so that the fuzzy implication with probor receives the most values equal to 1. Only 2 results (from the total 31 results) failed to receive value greater or equal to 0.9 at all four membership degree functions.
3.6. General and Optimal Outcomes after Extensive Tests at Four Membership Functions and at Two Types of Fuzzy Implications (Probor and Einstein) when the Value of m Is Equal to 1, 2, 3 and 10 - The Results from the 7th Step of the Methodology
In this step, for the months of August and January, the authors made extensive tests in each membership degree function, so as to find that value of m, in which the fuzzy implications constructed by probor and Einstein, can receive the most values greater or equal to 0.9, the most optimal values equal to 1, the most values greater or equal to 0.9 and less than 1 and the least values less than 0.9.
I. Isosceles trapezium-Probor and Einstein-August:
Firstly, during the month August the authors make extensive tests at isosceles trapezium so as to find that value of parameter m (between 1-10) which gives the best results i.e. the most values greater or equal to 0.9, the most values equal to 1 and the least values less than 0.9 to the fuzzy implication constructed by probor and Einstein. For the calculation of fuzzy implication with probor and Einstein the 31 pairs of membership degrees of temperature and humidity values insert in the type of fuzzy implication. Especially at the isosceles trapezium in the 1th repetition (value of m=1) the fuzzy implication by probor gives better results from Einstein, especially 23 results of this type of fuzzy implication with probor in relation to 21 results of this type of fuzzy implication with Einstein from the total of 31 results received a value greater than or equal to 0.9. Moreover 22 results of this type of fuzzy implication with probor in relation to 20 results of this type of fuzzy implication with Einstein from the total of 31 results received a value equal to 1. In the next repetitions (m=2 and m=3) the type of fuzzy implication with Einstein gives exactly the same results with probor, twenty-five (25) results of types of fuzzy implications with probor and Einstein out of the total of 31 results received a value greater than or equal to 0.9 and twenty-two (22) results of types of fuzzy implications with probor and Einstein out of the total of 31 results received a value equal to 1. In the 10th repetition (value of m=10) twenty-seven (27) results of types of fuzzy implications with Einstein out of the 31 total results (87%) received a value greater than or equal to 0.9. Also, in the 10th repetition (value of m=10) twenty-three (23) results of type of fuzzy implications with Einstein and probor from the 31 total results (74%) received a value equal to 1. Only in the 10th iteration, fuzzy implication with Einstein receives more results (27) than probor (26) for values greater than or equal to 0.9.
Table 19.
The values of parameter m (the number of iterations) for August so as to the two types of fuzzy implication by probor and Einstein receive a) the most values, b) the most optimal values, c) the most values and d) the least values in isosceles trapezium.
Table 19.
The values of parameter m (the number of iterations) for August so as to the two types of fuzzy implication by probor and Einstein receive a) the most values, b) the most optimal values, c) the most values and d) the least values in isosceles trapezium.
| Fuzzy implication / value of m | ||||
|---|---|---|---|---|
| Probor m=1 | 23 | 22 | 1 | 8 |
| Einstein m=1 | 21 | 20 | 1 | 10 |
| Probor m=2 | 25 | 22 | 3 | 6 |
| Einstein m=2 | 25 | 22 | 3 | 6 |
| Probor m=3 | 25 | 22 | 3 | 6 |
| Einstein m=3 | 25 | 22 | 3 | 6 |
| Probor m=10 | 26 | 23 | 3 | 5 |
| Einstein m=10 | 27 | 23 | 4 | 4 |
II. Random trapezium-Probor and Einstein-August:
Secondly, during the month August the authors make extensive tests at random trapezium so as to find that value of parameter m (between 1-10) which gives the best results i.e. the most values greater or equal to 0.9, the most values equal to 1 and the least values less than 0.9 to the fuzzy implication constructed by probor and Einstein. Especially at the random trapezium in the 1th repetition (value of m=1) the fuzzy implication by probor gives better results from Einstein, especially 15 results of this type of fuzzy implication with probor in relation to 12 results of this type of fuzzy implication with Einstein out of the total of 31 results received both a value greater than or equal to 0.9 and a value equal to 1. In the next repetitions, (m=2 and m=3) the type of fuzzy implication with Einstein gives better results than probor, especially when value of m=2, twenty-two (22) results of types of fuzzy implications with Einstein out of the total of 31 results received a value greater than or equal to 0.9 and when value of m=3, twenty-four (24) results of types of fuzzy implications with Einstein from the total of 31 results received a value greater than or equal to 0.9. In the 10th repetition (value of m=10) twenty-seven (27) results of types of fuzzy implications with Einstein out of the 31 total results (87%) received a value greater than or equal to 0.9. Also, in the 10th repetition (value of m=10) seventeen (17) results of this type of fuzzy implications with Einstein from the 31 total results (55%) received a value equal to 1. After the first iteration, for m=2 and for m=3, fuzzy implication with Einstein receive more values greater than or equal to 0.9 in relation to probor, and exactly the same results with probor for values equal to 1. Additional, for m=10, fuzzy implication with Einstein receive more values greater than or equal to 0.9 and equal to 1 in relation to probor.
Table 20.
The values of parameter m (the number of iterations) for August so as to the two types of fuzzy implication by probor and Einstein receive a) the most values ≥0.9, b) the most optimal values =1, c) the most values ≥0.9 and<1 and d) the least values <0.9 in random trapezium.
Table 20.
The values of parameter m (the number of iterations) for August so as to the two types of fuzzy implication by probor and Einstein receive a) the most values ≥0.9, b) the most optimal values =1, c) the most values ≥0.9 and<1 and d) the least values <0.9 in random trapezium.
| Fuzzy implication / value of m | ||||
|---|---|---|---|---|
| Probor m=1 | 15 | 15 | 0 | 16 |
| Einstein m=1 | 12 | 12 | 0 | 19 |
| Probor m=2 | 20 | 15 | 5 | 11 |
| Einstein m=2 | 22 | 15 | 7 | 9 |
| Probor m=3 | 23 | 15 | 8 | 8 |
| Einstein m=3 | 24 | 15 | 9 | 7 |
| Probor m=10 | 25 | 15 | 10 | 6 |
| Einstein m=10 | 27 | 17 | 10 | 4 |
III. Isosceles triangle-Probor and Einstein-August:
Firstly, during the month of August the authors make extensive tests at isosceles triangle so as to find that value of parameter m (between 1-10) which gives the best results i.e. the most values greater or equal to 0.9, the most values equal to 1 and the least values less than 0.9 to the fuzzy implication constructed by probor and Einstein. Especially at the isosceles triangle in the 1th repetition (value of m=1) the fuzzy implication by probor gives better results from Einstein, especially 9 results of this type of fuzzy implication with probor in relation to 5 results of this type of fuzzy implication with Einstein out of the total of 31 results received a value greater than or equal to 0.9. Moreover 4 results of this type of fuzzy implication with probor in relation to 0 results of type of fuzzy implication with Einstein out of the total of 31 results received a value equal to 1. In the next repetitions (m=2 and m=3) the type of fuzzy implication with Einstein gives better results than probor, especially when value of m=2, twenty-one (21) results of this type of fuzzy implication with Einstein from the total of 31 results received a value greater than or equal to 0.9 and when value of m=3 twenty-five (25) results of this type of fuzzy implication with Einstein out of the total of 31 results received a value greater than or equal to 0.9. In the 10th repetition (value of m=10) twenty-six (26) results of types of fuzzy implications with probor and Einstein out of the 31 total results (84%) received a value greater than or equal to 0.9. Also, in the 10th repetition (value of m=10) thirteen (13) results of type of fuzzy implication with Einstein out of the 31 total results (42%) received a value equal to 1. After the first iteration, fuzzy implications with Einstein receive better results. After the first iteration, for m=2 and for m=3, fuzzy implication with Einstein receive more values greater than or equal to 0.9 in relation to probor, and exactly the same results with probor for values equal to 1. Additional, for m=10, fuzzy implication with Einstein receive more values equal to 1 in relation to probor and exactly the same results with probor for values greater than or equal to 0.9.
Table 21.
The values of parameter m (the number of iterations) for August so as to the two types of fuzzy implication by probor and Einstein receive a) the most values, b) the most optimal values, c) the most values and d) the least values in isosceles triangle.
Table 21.
The values of parameter m (the number of iterations) for August so as to the two types of fuzzy implication by probor and Einstein receive a) the most values, b) the most optimal values, c) the most values and d) the least values in isosceles triangle.
| Fuzzy implication / value of m | ||||
|---|---|---|---|---|
| Probor m=1 | 9 | 4 | 5 | 22 |
| Einstein m=1 | 5 | 0 | 5 | 26 |
| Probor m=2 | 16 | 4 | 12 | 15 |
| Einstein m=2 | 21 | 4 | 17 | 10 |
| Probor m=3 | 21 | 4 | 17 | 10 |
| Einstein m=3 | 25 | 4 | 21 | 6 |
| Probor m=10 | 26 | 9 | 17 | 5 |
| Einstein m=10 | 26 | 13 | 13 | 5 |
IV. Scalene triangle-Probor and Einstein-August:
Fourthly, during the month of August the authors make extensive tests at scalene triangle so as to find that value of parameter m (between 1-10) which gives the best results i.e. the more values greater or equal to 0.9, the most values equal to 1 and the least values less than 0.9 to the fuzzy implication constructed by probor and Einstein. Especially at the scalene triangle in the 1th repetition (value of m=1) the fuzzy implication by probor gives better results from Einstein, especially 7 results of type of fuzzy implication with probor in relation to 3 results of type of fuzzy implication with Einstein out of the total of 31 results received a value greater than or equal to 0.9. Moreover, 4 results of this type of fuzzy implication with probor in relation to 0 results of type of fuzzy implication with Einstein out of the total of 31 results received a value equal to 1. In the next repetitions (m=2 and m=3) the type of fuzzy implication with Einstein gives better results than probor, especially when value of m=2, seventeen (17) results of this type of fuzzy implication with Einstein out of the total of 31 results received a value greater than or equal to 0.9 and when value of m=3 twenty-one (21) results of type of fuzzy implication with Einstein out of the total of 31 results received a value greater than or equal to 0.9. In the 10th repetition (value of m=10) twenty-eight (28) results of types of fuzzy implications with probor and Einstein from the 31 total results (90%) received a value greater than or equal to 0.9. Also, in the 10th repetition (value of m=10) seven (7) results of type of fuzzy implication with Einstein out of the 31 total results (23%) received a value equal to 1. After the first iteration, for m=2 and for m=3, fuzzy implication with Einstein receive more values greater than or equal to 0.9 in relation to probor, and exactly the same results with probor for values equal to 1. Additional, for m=10, fuzzy implication with Einstein receive more values greater than or equal to 0.9 and equal to 1 in relation to probor.
Table 22.
The values of parameter m (the number of iterations) for August so as to the two types of fuzzy implication by probor and Einstein receive a) the most values, b) the most optimal values, c) the most values and d) the least values in scalene triangle.
Table 22.
The values of parameter m (the number of iterations) for August so as to the two types of fuzzy implication by probor and Einstein receive a) the most values, b) the most optimal values, c) the most values and d) the least values in scalene triangle.
| Fuzzy implication / value of m | ||||
|---|---|---|---|---|
| Probor m=1 | 7 | 4 | 3 | 24 |
| Einstein m=1 | 3 | 0 | 3 | 28 |
| Probor m=2 | 15 | 4 | 11 | 16 |
| Einstein m=2 | 17 | 4 | 13 | 14 |
| Probor m=3 | 20 | 4 | 16 | 11 |
| Einstein m=3 | 21 | 4 | 17 | 10 |
| Probor m=10 | 26 | 6 | 20 | 5 |
| Einstein m=10 | 28 | 7 | 21 | 3 |
So for the month of August, the authors proved that isosceles trapezium and the fuzzy implication with Einstein in the 10th iteration (i.e. for m=10) is the best model [27 results out of 31 receive a value greater than or equal to 0.9 (87%) and 23 results out of 31 receive a value equal to 1 (74%)]. This model has the most results (23) which receive a value equal to 1 in relation to the other three membership functions in the same (10th) iteration using fuzzy implication with Einstein and the second best results (27) which receive a value greater than or equal to 0.9 in relation to the other three membership functions in the same (10th) iteration using fuzzy implication with Einstein.
The second-best model is the random trapezium and the fuzzy implication with Einstein in the 10th iteration (i.e. for m=10) which yielded [27 results out of 31 receive a value greater than or equal to 0.9 (87%) and 17 results from 31 receive a value equal to 1 (55%)]. This model has the second best results (17) which receive a value equal to 1 in relation to the other three membership functions in the same (10th) iteration using fuzzy implication with Einstein. Moreover, it has the second best results (27) which receive a value greater than or equal to 0.9 in relation to the other three membership functions in the same (10th) iteration using fuzzy implication with Einstein.
The third-best model is the isosceles triangle and the fuzzy implication with Einstein in the 10th iteration (i.e. for m=10) which yielded [26 results out of 31 receive a value greater than or equal to 0.9 (84%) and 13 results out of 31 receive a value equal to 1 (42%)]. This model has the third best results (13) which receive a value equal to 1 in relation to the other three membership functions in the same (10th) iteration using fuzzy implication with Einstein. Moreover, it has the fewer best results (26) which receive a value greater than or equal to 0.9 in relation to the other three membership functions in the same (10th) iteration using fuzzy implication with Einstein.
The worst model is the scalene triangle and the fuzzy implication with Einstein in the 10th iteration (i.e. for m=10) which yielded [28 results out of 31 receive a value greater than or equal to 0.9 (90%) and only 7 results out of 31 receive a value equal to 1 (23%)]. This model has the least (fourth) best results (7) which receive a value equal to 1 in relation to the other three membership functions in the same (10th) iteration using fuzzy implication with Einstein. On the contrary, it has the first best results (28) which receive a value greater than or equal to 0.9 in relation to the other three membership functions in the same (10th) iteration using fuzzy implication with Einstein. Because scalene triangle has the fewer cases-results which receive a value equal to 1 is classified in the 4th and worst option.
After the first iteration, for m=2 and for m=3, at three membership functions (isosceles and scalene triangle and random trapezium), fuzzy implication with Einstein receive more values greater than or equal to 0.9 in relation to probor, and exactly the same results with probor for values equal to 1.
Additional, for m=10, at two membership functions (scalene triangle and random trapezium), fuzzy implication with Einstein receive more values greater than or equal to 0.9 and equal to 1 in relation to probor. For m=10, at isosceles triangle fuzzy implication with Einstein receive more values equal to 1 in relation to probor and exactly the same results with probor for values greater than or equal to 0.9.
I. Isosceles trapezium-Probor and Einstein-January:
Firstly, during the month of January the authors make extensive tests at isosceles trapezium so as to find that value of parameter m (between 1-10) which gives the best results i.e. the most values greater or equal to 0.9, the most values equal to 1 and the least values less than 0.9 to the fuzzy implication constructed by probor and Einstein. For the calculation of fuzzy implication with probor and Einstein the 31 pairs of membership degrees of temperature and humidity values insert in the type of fuzzy implication. Especially at the isosceles trapezium in the 1th repetition (value of m=1) the type of fuzzy implication with Einstein gives exactly the same results with probor, twenty (20) results of types of fuzzy implications with probor and Einstein out of the total of 31 results received a value greater than or equal to 0.9 and seventeen (17) results of types of fuzzy implications with probor and Einstein out of the total of 31 results received a value equal to 1. In the third repetition (m=3) the type of fuzzy implication with Einstein gives exactly the same results with probor, twenty-six (26) results of types of fuzzy implications with probor and Einstein out of the total of 31 results received a value greater than or equal to 0.9 and seventeen (17) results of types of fuzzy implications with probor and Einstein out of the total of 31 results received a value equal to 1. In the 10th repetition (value of m=10) twenty-eight (28) results of types of fuzzy implications with Einstein and probor out of the 31 total results (90%) received a value greater than or equal to 0.9. Also, in the 10th repetition (value of m=10) twenty (20) results of type of fuzzy implications with Einstein and probor out of the 31 total results (74%) received a value equal to 1. Only in the 2th iteration, fuzzy implication with Einstein receives more results (26) than probor (25) for values greater than or equal to 0.9.
Table 23.
The values of parameter m (the number of iterations) for January so as to the two types of fuzzy implication by probor and Einstein receive a) the most values, b) the most optimal values, c) the most values and d) the least values in isosceles trapezium.
Table 23.
The values of parameter m (the number of iterations) for January so as to the two types of fuzzy implication by probor and Einstein receive a) the most values, b) the most optimal values, c) the most values and d) the least values in isosceles trapezium.
| Fuzzy implication / value of m | ||||
|---|---|---|---|---|
| Probor m=1 | 20 | 17 | 3 | 11 |
| Einstein m=1 | 20 | 17 | 3 | 11 |
| Probor m=2 | 25 | 17 | 8 | 6 |
| Einstein m=2 | 26 | 17 | 9 | 5 |
| Probor m=3 | 26 | 17 | 9 | 5 |
| Einstein m=3 | 26 | 17 | 9 | 5 |
| Probor m=10 | 28 | 20 | 8 | 3 |
| Einstein m=10 | 28 | 20 | 8 | 3 |
II. Random trapezium-Probor and Einstein-January:
Secondly, during the month of January the authors make extensive tests at random trapezium so as to find that value of parameter m (between 1-10) which gives the best results i.e. the more values greater or equal to 0.9, the most values equal to 1 and the least values less than 0.9 to the fuzzy implication constructed by probor and Einstein. Especially at the random trapezium in the 1th repetition (value of m=1) the fuzzy implication by probor gives better results from Einstein, especially 9 results of this type of fuzzy implication with probor in relation to 8 results of the type of fuzzy implication with Einstein out of the total of 31 results received a value equal to 1. In the next repetition (m=2) the type of fuzzy implication with Einstein gives exactly the same results with probor, twenty-four (24) results of types of fuzzy implications with probor and Einstein out of the total of 31 results received a value greater than or equal to 0.9 and nine (9) results of types of fuzzy implications with probor and Einstein out of the total of 31 results received a value equal to 1. In the next repetition (m=3) the type of fuzzy implication with Einstein gives exactly the same results with probor, twenty-six (26) results of types of fuzzy implications with probor and Einstein out of the total of 31 results received a value greater than or equal to 0.9 and nine (9) results of types of fuzzy implications with probor and Einstein out of the total of 31 results received a value equal to 1. In the 10th repetition (value of m=10) twenty-eight (28) results of types of fuzzy implications with Einstein and probor out of the 31 total results (90%) received a value greater than or equal to 0.9. Also, in the 10th repetition (value of m=10) eighteen (18) results of the type of fuzzy implications with Einstein out of the 31 total results (55%) received a value equal to 1. Only in the 10th iteration, fuzzy implication with Einstein receives the best results, especially more results (18) than probor (13) for values equal to 1.
Table 24.
The values of parameter m (the number of iterations) for January so as to the two types of fuzzy implication by probor and Einstein receive a) the most values ≥0.9, b) the most optimal values =1, c) the most values ≥0.9 and<1 and d) the least values <0.9 in random trapezium.
Table 24.
The values of parameter m (the number of iterations) for January so as to the two types of fuzzy implication by probor and Einstein receive a) the most values ≥0.9, b) the most optimal values =1, c) the most values ≥0.9 and<1 and d) the least values <0.9 in random trapezium.
| Fuzzy implication / value of m | ||||
|---|---|---|---|---|
| Probor m=1 | 14 | 9 | 5 | 17 |
| Einstein m=1 | 14 | 8 | 6 | 17 |
| Probor m=2 | 24 | 9 | 15 | 7 |
| Einstein m=2 | 24 | 9 | 15 | 7 |
| Probor m=3 | 26 | 9 | 17 | 5 |
| Einstein m=3 | 26 | 9 | 17 | 5 |
| Probor m=10 | 28 | 13 | 15 | 3 |
| Einstein m=10 | 28 | 18 | 10 | 3 |
III. Isosceles triangle-Probor and Einstein-January:
Firstly, during the month of January, the authors make extensive tests at isosceles triangle so as to find that value of parameter m (between 1-10) which gives the best results i.e. the most values greater or equal to 0.9, the most values equal to 1 and the least values less than 0.9 to the fuzzy implication constructed by probor and Einstein. Especially at the isosceles triangle in the 1th repetition (value of m=1) the fuzzy implication by probor gives better results from Einstein, especially 12 results of type of fuzzy implication with probor in relation to 6 results of type of fuzzy implication with Einstein out of the total of 31 results received a value greater than or equal to 0.9. Moreover, 2 results of this type of fuzzy implication with probor in relation to 0 results of the type of fuzzy implication with Einstein out of the total of 31 results received a value equal to 1. In the next repetitions (m=2 and m=3) the type of fuzzy implication with Einstein gives better results than probor, especially when value of m=2, twenty-four (24) results of the type of fuzzy implication with Einstein out of the total of 31 results received a value greater than or equal to 0.9 and when value of m=3 twenty-six (26) results of type of fuzzy implication with Einstein out of the total of 31 results received a value greater than or equal to 0.9. In the 10th repetition (value of m=10) twenty-eight (28) results of types of fuzzy implications with Einstein out of the 31 total results (90%) received a value greater than or equal to 0.9. Also, in the 10th repetition (value of m=10) sixteen (16) results of type of fuzzy implication with Einstein out of the 31 total results (52%) received a value equal to 1. After the first iteration, for m=2 and for m=3, fuzzy implication with Einstein receive more values greater than or equal to 0.9 in relation to probor, and exactly the same results with probor for values equal to 1. Additional, for m=10, fuzzy implication with Einstein receive more values greater than or equal to 0.9 and equal to 1 in relation to probor.
Table 25.
The values of parameter m (the number of iterations) for January so as to the two types of fuzzy implication by probor and Einstein receive a) the most values, b) the most optimal values, c) the most values and d) the least values in isosceles triangle.
Table 25.
The values of parameter m (the number of iterations) for January so as to the two types of fuzzy implication by probor and Einstein receive a) the most values, b) the most optimal values, c) the most values and d) the least values in isosceles triangle.
| Fuzzy implication / value of m | ||||
|---|---|---|---|---|
| Probor m=1 | 12 | 2 | 10 | 19 |
| Einstein m=1 | 6 | 0 | 6 | 25 |
| Probor m=2 | 23 | 2 | 21 | 8 |
| Einstein m=2 | 24 | 2 | 22 | 7 |
| Probor m=3 | 24 | 2 | 22 | 7 |
| Einstein m=3 | 26 | 2 | 24 | 5 |
| Probor m=10 | 27 | 7 | 20 | 4 |
| Einstein m=10 | 28 | 16 | 12 | 3 |
IV. Scalene triangle-Probor and Einstein-January:
Fourthly, during the month of January, the authors make extensive tests at scalene triangle so as to find that value of parameter m (between 1-10) which gives the best results i.e. the most values greater or equal to 0.9, the most values equal to 1 and the least values less than 0.9 to the fuzzy implication constructed by probor and Einstein. Especially at the scalene triangle in the 1th repetition (value of m=1) the fuzzy implication by probor gives better results from Einstein, especially 14 results of type of fuzzy implication with probor in relation to 7 results of type of fuzzy implication with Einstein out of the total of 31 results received a value greater than or equal to 0.9. Moreover, 2 results of this type of fuzzy implication with probor in relation to 0 results of type of fuzzy implication with Einstein out of the total of 31 results received a value equal to 1. In the next repetitions (m=2 and m=3) the type of fuzzy implication with Einstein gives better results than probor, especially when value of m=2, seventeen (23) results of this type of fuzzy implication with Einstein out of the total of 31 results received a value greater than or equal to 0.9 and when value of m=3 twenty-one (27) results of this type of fuzzy implication with Einstein out of the total of 31 results received a value greater than or equal to 0.9. In the 10th repetition (value of m=10) twenty-nine (29) results of types of fuzzy implications with Einstein out of the 31 total results (94%) received a value greater than or equal to 0.9. Also, in the 10th repetition (value of m=10) fourteen (14) results of this type of fuzzy implication with Einstein out of the 31 total results (45%) received a value equal to 1. After the first iteration, for m=2 and for m=3, fuzzy implication with Einstein receive more values greater than or equal to 0.9 in relation to probor, and exactly the same results with probor for values equal to 1. Additional, for m=10, fuzzy implication with Einstein receive more values greater than or equal to 0.9 and equal to 1 in relation to probor.
Table 26.
The values of parameter m (the number of iterations) for January so as to the two types of fuzzy implication by probor and Einstein receive a) the most values, b) the most optimal values, c) the most values and d) the least values in scalene triangle.
Table 26.
The values of parameter m (the number of iterations) for January so as to the two types of fuzzy implication by probor and Einstein receive a) the most values, b) the most optimal values, c) the most values and d) the least values in scalene triangle.
| Fuzzy implication / value of m | ||||
|---|---|---|---|---|
| Probor m=1 | 14 | 2 | 12 | 17 |
| Einstein m=1 | 7 | 0 | 7 | 24 |
| Probor m=2 | 21 | 2 | 19 | 10 |
| Einstein m=2 | 23 | 2 | 21 | 8 |
| Probor m=3 | 24 | 2 | 22 | 7 |
| Einstein m=3 | 27 | 2 | 25 | 4 |
| Probor m=10 | 28 | 8 | 20 | 3 |
| Einstein m=10 | 29 | 14 | 15 | 2 |
So for the month of January, the authors proved that isosceles trapezium and the fuzzy implications with Einstein or probor in the 10th iteration (i.e. for m=10) is the best model [28 results out of 31 receive a value greater than or equal to 0.9 (90%) and 20 results from 31 receive a value equal to 1 (65%)]. This model has the most results (20) which receive a value equal to 1 in relation to the other three membership functions in the same (10th) iteration using fuzzy implication with Einstein or with probor and the second best results (28) which receive a value greater than or equal to 0.9 in relation to the other three membership functions in the same (10th) iteration using fuzzy implication with Einstein or probor.
The second-best model is the random trapezium and the fuzzy implication with Einstein in the 10th iteration (i.e. for m=10) which yielded [28 results out of 31 receive a value greater than or equal to 0.9 (90%) and 18 results out of 31 receive a value equal to 1 (58%)]. This model has the second best results (18) which receive a value equal to 1 in relation to the other three membership functions in the same (10th) iteration using fuzzy implication with Einstein. Moreover, it has the second best results (28) which receive a value greater than or equal to 0.9 in relation to the other three membership functions in the same (10th) iteration using fuzzy implication with Einstein.
The third-best model is the isosceles triangle and the fuzzy implication with Einstein in the 10th iteration (i.e. for m=10) which yielded [28 results out of 31 receive a value greater than or equal to 0.9 (90%) and 16 results out of 31 receive a value equal to 1 (52%)]. This model has the third best results (16) which receive a value equal to 1 in relation to the other three membership functions in the same (10th) iteration using fuzzy implication with Einstein. Moreover, it has the second best results (28) which receive a value greater than or equal to 0.9 in relation to the other three membership functions in the same (10th) iteration using fuzzy implication with Einstein.
The worst model is the scalene triangle and the fuzzy implication with Einstein in the 10th iteration (i.e. for m=10) which yielded [29 results out of 31 receive a value greater than or equal to 0.9 (94%) and only 14 results out of 31 receive a value equal to 1 (45%)]. This model has the least (fourth) best results (14) which receive a value equal to 1 in relation to the other three membership functions in the same (10th) iteration using fuzzy implication with Einstein. On the contrary, it has the first best results (29) which receive a value greater than or equal to 0.9 in relation to the other three membership functions in the same (10th) iteration using fuzzy implication with Einstein. Because scalene triangle has the fewer cases-results which receive a value equal to 1 is classified in the 4th and worst option.
After the first iteration, for m=2 and for m=3, at two membership functions (isosceles and scalene triangle), fuzzy implication with Einstein receive more values greater than or equal to 0.9 in relation to probor, and exactly the same results with probor for values equal to 1. Additional, for m=10, fuzzy implication with Einstein receive more values greater than or equal to 0.9 and equal to 1 in relation to proborfuzzy implications with Einstein receive better results than probor.
Only the types of fuzzy implications probor and Einstein (not max and Lukasiewicz) depend on the variables x and y as well as on the value of the parameter m and change their result according to the value of the repetition, i.e. the parameter m, which improves continuously as the value of the repetitions, i.e. the parameter m increases.
4. Discussion
In this paper, the authors proposed to make a comparison between a new type of fuzzy implication generated by t-conorm probor in previous work [4] and four other new types of fuzzy implication respectively constructed by t-conorm (max, Einstein, Lukasiewicz and Hamacher) always maintaining the same negation. Authors constructed four fuzzy implications and make extensive tests so as to find which out of four membership functions and which out of four fuzzy implications give the best or the worst results for different values of parameter m i.e. the precise number of iterations.
The innovation of this procedure was to make the aforementioned comparisons between the five types of fuzzy implication (probor, max, Einstein, Lukasiewicz and Hamacher) to prove a) if the original type of fuzzy implications with probor was the best possible choice or whether this choice must eventually be replaced by another formula with a different t-conorm, b) if all fuzzy implications with different t-conorms give satisfactory results when applied or interpreted in real-world problems, c) if some fuzzy implications give incorrect results and must be rejected, d) if useful and safe conclusions can be drawn from the ranking order of the 5 fuzzy implications e) if trapezoidal or triangular membership functions give better results in each fuzzy implication and f) if the value of parameter m (the number of iterations) influence the results of all fuzzy implications.
Moreover, the significance, evaluation and usefulness of this methodology was to construct four additional types of fuzzy implications using four fuzzy relations with the or (t-conorms) apart from the type of fuzzy implication we had constructed with the t-conorm probor [4] as well as to compare all possible combinations pairs of t-conorm in order to find the ranking order of a total of five fuzzy implications.
The motivation of the proposed work was to draw some useful conclusions regarding the diversity and contribution of each t-conorm to the new type of fuzzy implication. For example, the authors find which t-conorm, when applied to the new type of fuzzy implications, can give the best or worst results, which t-conorm is considered reliable and which unreliable, as well as which fuzzy implication after extensive tests in different membership functions (namely giving values of membership degrees in the closed interval [0,1] in the x, y variables of each fuzzy implication that has been derived from the corresponding t-conorm, giving values at parameter m) can be used with confidence, safety and reliability in real-world applications and problems.
Some of the most important concluded results from all the steps of this paper that have value are the following:
Step 1:
Six pairs combinations (max-probor, Einstein-probor, Lukasiewicz-probor, Hamacher-probor, Einstein-Lukasiewicz, Einstein-Hamacher) of five t-conorm comparisons (max, probor, Hamacher, Einstein, Lukasiewicz) were performed so as to find the ranking order of five types of fuzzy implications as well as to explore what is the meaning and interpretation of this ranking in fuzzy logic, in problems of real world, and when applying the fuzzy implications.
To sum up, fuzzy implication with t-conorm max is less than or equal to probor, probor is greater than or equal to max, probor is less than or equal to Hamacher, Hamacher is less than or equal to Einstein and Einstein is less than or equal to Lukasiewicz.
The ranking order does not indicate at the same time how good and efficient is the t-conorm and the fuzzy implication since it was found that the Lukasiewicz t-conorm which has the best (first) rank rejected as always gives a result equal to 1 i.e. incorrect results.
General formula of fuzzy implication with Lukasiewicz always gives the truth-value membership degree 1 which is always equivalent to something extremely good or excellent but this happens by giving any crisp value to the variables x and y. This means that combinations of zero, small, and medium degrees of membership in the variables x and y always give a value of 1 in the fuzzy implication resulting from the Lukasiewicz t-conorm. Similarly, classifing the membership degrees of the variables x and y to «Low» and «Medium» linguistics and any combination of the «Low» linguistic and the «Medium» linguistic will always be equivalent to the «Excellent» linguistic in fuzzy implication arising from the Lukasiewicz t-conorm. This result is wrong and can lead to significant errors and disastrous consequences in any application. For example, in the science of civil engineering, the construction of a bridge involves the combination of various building materials. If these materials are of poor and moderate quality and strength and are used as an application in the fuzzy implication with t-conorm Lukasiewicz to find some indices, such as the strength index of the bridge structure, the bending strength indices of the piers, the shear strength indices of the piers, the seismic vulnerability index, in order to ensure the reliability of the long-term strength of the bridge or the time calculation of the required maintenance on it, these indices will always ensure that the bridge is in excellent condition without that being true.
So, authors understand that this fuzzy implication with t-conorm Lukasiewicz must be rejected and not used in any application because it will always give wrong results in all areas of its application, such as socio-economic, environmental, humanitarian, medical theory, mathematics, fuzzy logic and artificial intelligence.
Step 2:
After the implementation of step 1 authors constructed and calculated four types of fuzzy implications from four t-conorms (probor, max, Einstein, Lukasiewicz).
Already it is given that for the months of August and January, after a small number of iterations the two fuzzy implications probor and Einstein are the best options and give very good results as the most of the overall results give values greater than or equal to 0.9. The type of fuzzy implication max is independent from the value of parameter m, so the results of fuzzy implication remain the same regardless of the values of the parameter m, with no possibility of improvement. The type of fuzzy implication Lukasiewicz always gives results equal to 1 as it is not affected by the membership degrees of variables x and y and by the value of parameter m. So the type of Lukasiewicz is unreliable, and authors reject it. The other three fuzzy implications created by t-conorms probor, max and Einstein give values less than 1 but greater than or equal to 0.9 and more safe and reliable results in relation to Lukasiewicz. These three implications can be used by researchers in applications of fuzzy logic and in real world problems.
Step 3:
A. Isosceles trapezium
In this step, the construction of the isosceles trapezium, after the fuzzification of the crisp values of 62 temperature and humidity values of August and January, gave the most membership degrees equal to 1.
More specifically, August, 20 humidity values and 18 temperature values take membership degrees equal to 1. Moreover, 2 humidity values and 4 temperature values take membership degrees equal to 0.
More specifically, January, 17 humidity values and 16 temperature values take membership degrees equal to 1. Also, 3 additional humidity values take membership degrees greater than or equal to 0.9 but not equal to 1. Totally, 20 humidity values and 16 temperature values take membership degrees greater than or equal to 0.9. Moreover, 2 humidity values and 2 temperature values take membership degrees equal to 0.
For the two months, August and January, the construction of the isosceles trapezium, after the fuzzification of the crisp values of 62 temperature and humidity values, (the more) 37 humidity values (60%) and 34 temperature values (55%) take membership degrees equal to 1 and 40 humidity values (65%) and 34 temperature values (55%) take membership degrees greater than or equal to 0.9.
B. Random trapezium
In this step, the construction of the random trapezium, after the fuzzification of the crisp values of 62 temperature and humidity values of August and January, gave fewer membership degrees equal to 1 than isosceles trapezium.
More specifically, August, 12 humidity values and 9 temperature values take membership degrees equal to 1. Moreover, 2 humidity values and 4 temperature values take membership degrees equal to 0.
More specifically, January, 8 humidity values and 10 temperature values take membership degrees equal to 1. Also, 4 additional humidity values take membership degrees greater than or equal to 0.9 but not equal to 1. Totally, 12 humidity values and 10 temperature values take membership degrees greater than or equal to 0.9. Moreover, 2 humidity values and 2 temperature values take membership degrees equal to 0.
For the two months, August and January, the construction of the random trapezium, after the fuzzification of the crisp values of 62 temperature and humidity values, 20 humidity values (32%) and 19 temperature values (31%) take membership degrees equal to 1 and 24 humidity values (39%) and 19 temperature values (31%) take membership degrees greater than or equal to 0.9.
C. Isosceles triangle
In this step, the construction of the isosceles triangle, after the fuzzification of the crisp values of 31 temperature and humidity values of August, did not give any value with membership degrees equal to 1. More specifically, 0 humidity values and 0 temperature values take membership degrees equal to 1. Moreover, 2 humidity values and 4 temperature values take membership degrees equal to 0. Also, 5 additional humidity values and 9 temperature values take membership degrees greater than or equal to 0.9 but not equal to 1. Totally, 5 humidity values and 9 temperature values take membership degrees greater than or equal to 0.9.
In this step, the construction of the isosceles triangle, after the fuzzification of the crisp values of 31 temperature and humidity values of January, gave only three membership degrees equal to 1. More specifically, 0 humidity values and 3 temperature values take membership degrees equal to 1. Moreover, 2 humidity values and 2 temperature values take membership degrees equal to 0. Also, 5 additional humidity values and 0 temperature values take membership degrees greater than or equal to 0.9 but not equal to 1. Totally, 5 humidity values and 3 temperature values take membership degrees greater than or equal to 0.9.
For the two months the construction of the isosceles triangle, after the fuzzification of the crisp values of 62 temperature and humidity values, 0 humidity values (0%) and 3 temperature values (5%) take membership degrees equal to 1 and 10 humidity values (16%) and 12 temperature values (19%) take membership degrees greater than or equal to 0.9.
D. Scalene triangle
In this step, the construction of the scalene triangle, after the fuzzification of the crisp values of 62 temperature and humidity values of August and January, did not give any value with membership degrees equal to 1.
More specifically, 0 humidity values and 0 temperature values take membership degrees equal to 1. Moreover, 2 humidity values and 4 temperature values take membership degrees equal to 0. Also, 3 additional humidity values and 4 temperature values take membership degrees greater than or equal to 0.9 but not equal to 1. Totally, 3 humidity values and 4 temperature values take membership degrees greater than or equal to 0.9.
More specifically, 0 humidity values and 0 temperature values take membership degrees equal to 1. Moreover, 2 humidity values and 2 temperature values take membership degrees equal to 0. Also, 5 additional humidity values and 1 temperature values take membership degrees greater than or equal to 0.9 but not equal to 1. Totally, 5 humidity values and 1 temperature values take membership degrees greater than or equal to 0.9.
For the two months the construction of the scalene triangle, after the fuzzification of the crisp values of 62 temperature and humidity values, 0 humidity values (0%) and 0 temperature values (0%) take membership degrees equal to 1 and 8 humidity values (13%) and 5 temperature values (8%) take membership degrees greater than or equal to 0.9.
Table 27.
The calculation of membership degrees of 62 temperature and humidity values greater than or equal to 0.9 and equal to 1 for months August and January at four membership functions.
Table 27.
The calculation of membership degrees of 62 temperature and humidity values greater than or equal to 0.9 and equal to 1 for months August and January at four membership functions.
| Isosceles trapezium | Random trapezium | Isosceles Triangle | Scalene Triangle | |
|---|---|---|---|---|
| Humidity ≥0.9 | 37 from 62 | 24 from 62 | 10 from 62 | 8 from 62 |
| Temperature ≥0.9 | 34 from 62 | 19 from 62 | 12 from 62 | 5 from 62 |
| Humidity = 1 | 40 from 62 | 20 from 62 | 0 from 62 | 0 from 62 |
| Temperature = 1 | 34 from 62 | 19 from 62 | 3 from 62 | 0 from 62 |
From the above table it is understood that the isosceles trapezium gives the best results and the scalene triangle the worst results. Moreover, the two trapeziums give (more), better results than the two triangles.
Step 4:
Isosceles and random trapezium
The results of step 3 also influenced the results of step 4.
In this step, for m=1 (first iteration), August and January at isosceles and random trapezium, fuzzy implications probor max and Einstein, receive as a result the value equal to 1 when a) the membership degree of variable y is equal to 1 and the membership degree of variable x belong to the closed interval x= [0,1], b) the membership degree of variable y=1 and the membership degree of variable x=1 and c) the membership degree of variable y=1 and the membership degree of variable x=0. Also, for m=1, August and January at isosceles trapezium, only the fuzzy implications probor and max receive as result the value equal to 1 when the membership degree of variable y belong to the closed interval y= [0,1] and the membership degree of variable x is equal to 0.
Isosceles and scalene triangle
In this step, for m=1, August and January at isosceles and scalene triangle, only the fuzzy implications probor and max, receive as a result the value equal to 1 when the membership degree of variable y belong to the closed interval y= [0, 1] and the membership degree of variable x is equal to 0.
Table 28.
All the possible combinations of membership degrees of variables x and y for August and January which give a result with value equal to 1 to the fuzzy implications probor, max and Einstein at four membership functions.
Table 28.
All the possible combinations of membership degrees of variables x and y for August and January which give a result with value equal to 1 to the fuzzy implications probor, max and Einstein at four membership functions.
| Isosceles trapezium August and January |
Random trapezium August and January |
Isosceles Triangle August and January |
Scalene Triangle August and January |
|
|---|---|---|---|---|
| Fuzzy Implication Probor receive value=1 |
y=1 and x=1, y=1 and x=0, y=1 and x=[0,1], y=[0,1] and x=0 |
y=1 and x=1, y=1 and x=0, y=1 and x=[0,1], y=[0,1] and x=0 |
y=[0,1] and x=0 | y=[0,1] and x=0 |
| Fuzzy Implication Max receive value=1 |
y=1 and x=1, y=1 and x=0, y=1 and x=[0,1], y=[0,1] and x=0 |
y=1 and x=1, y=1 and x=0, y=1 and x=[0,1], y=[0,1] and x=0 |
y=[0,1] and x=0 | y=[0,1] and x=0 |
| Fuzzy Implication Einstein receive value=1 |
y=1 and x=1, y=1 and x=0, y=1 and x=[0,1] |
y=1 and x=1, y=1 and x=0, y=1 and x=[0,1] |
Ιsosceles and random trapezium have the most combinations of membership degrees of variables x and y which give a result with value equal to 1 to the fuzzy implications probor, max and Einstein in contrast to isosceles and scalene triangle where only one combination of membership degrees of variables x and y gives a result with value equal to 1 to the fuzzy implications probor and max. Τhis happens because isosceles and random trapezium have more values at variables x and y with a membership degree equal to 1 and 0. And in this step the two trapeziums give much better results than the two triangles. Moreover, fuzzy implications probor and max have better results than Einstein since in all membership functions have more combinations of membership degrees of variables x and y which give a result with a value equal to 1. At isosceles and scalene triangle there is no combination of membership degrees of variables x and y which give a result with value equal to 1 to the fuzzy implication of Eistein.
Step 5:
All the above combinations of the four membership functions, give the value 1 to the types of fuzzy implications probor max and Einstein.
A. Isosceles trapezium
The results of step 4 also influenced the results of step 5.
So, for the months of August and January the type of fuzzy implication with probor when the value of m is 1, from the first iteration, 43 results from this type take membership degrees equal or greater than 0.9 and furthermore 39results take membership degrees equal to 1. This means that the type of fuzzy implication with probor gets very fast in a very short time and that from the first iteration it takes membership degrees equal or greater than 0.9 (43 cases from the 62). Also, in August and January the type of fuzzy implication with max when the value of m is 1, from the first iteration, 42 results from this type take membership degrees equal or greater than 0.9 and furthermore 39 results take membership degrees equal to 1. Moreover, in August and January the type of fuzzy implication with Einstein when the value of m is 1, from the first iteration, 41 results from this type take membership degrees equal or greater than 0.9 and furthermore 37 results take membership degrees equal to 1. The type of fuzzy implication with probor when m=1 is the best option as it receives the most values (43) greater than or equal to 0.9 in relation to max and Einstein.
B. Random trapezium
So, for the months of August and January the type of fuzzy implication with probor when the value of m is 1, from the first iteration, 29 results from this type take membership degrees equal or greater than 0.9 and furthermore 23 results take membership degrees equal to 1. Also, in August and January the type of fuzzy implication with max when the value of m is 1, from the first iteration, 27 results from this type take membership degrees equal or greater than 0.9 and furthermore 24 results take membership degrees equal to 1. Moreover, in August and January the type of fuzzy implication with Einstein when the value of m is 1, from the first iteration, 26 results from this type take membership degrees equal or greater than 0.9 and furthermore 20 results take membership degrees equal to 1. The type of fuzzy implication with probor when m=1 receives the most values (29) greater than or equal to 0.9 in relation to max and Einstein.
C. Isosceles triangle
So, in August and January the type of fuzzy implication with probor when the value of m is 1, from the first iteration, 21 results from this type take membership degrees equal or greater than 0.9 and furthermore 6 results take membership degrees equal to 1. Also, in August and January the type of fuzzy implication with max when the value of m is 1, from the first iteration, 15 results from this type take membership degrees equal or greater than 0.9 and furthermore 6 results take membership degrees equal to 1. Moreover, in August and January the type of fuzzy implication with Einstein when the value of m is 1, from the first iteration, 11 results from this type take membership degrees equal or greater than 0.9 and furthermore 0 results take membership degrees equal to 1. The type of fuzzy implication with probor when m=1 receives the most values (21) greater than or equal to 0.9 in relation to max and Einstein.
D. Scalene triangle
So, in August and January the type of fuzzy implication with probor when the value of m is 1, from the first iteration, 21 results from this type take membership degrees equal or greater than 0.9 and furthermore 6 results take membership degrees equal to 1. Also, in August and January the type of fuzzy implication with max when the value of m is 1, from the first iteration, 13 results from this type take membership degrees equal or greater than 0.9 and furthermore 6 results take membership degrees equal to 1. Moreover, in August and January the type of fuzzy implication with Einstein when the value of m is 1, from the first iteration, 10 results from this type take membership degrees equal or greater than 0.9 and furthermore 0 results take membership degrees equal to 1. The type of fuzzy implication with probor when m=1 receives the most values (21) greater than or equal to 0.9 in relation to max and Einstein.
Table 29.
Results of four fuzzy implications at four membership functions for August and January when the value of m is equal to 1.
Table 29.
Results of four fuzzy implications at four membership functions for August and January when the value of m is equal to 1.
| Fuzzy Implications | ||
|---|---|---|
| Probor Isosceles trapezium | 43 | 39 |
| Max Isosceles trapezium | 42 | 39 |
| Einstein Isosceles trapezium | 41 | 37 |
| Probor Random trapezium | 29 | 23 |
| Max Random trapezium | 27 | 24 |
| Einstein Random trapezium | 26 | 20 |
| Probor Isosceles triangle | 21 | 6 |
| Max Isosceles triangle | 15 | 6 |
| Einstein Isosceles triangle | 11 | 0 |
| Probor Scalene triangle | 21 | 6 |
| Max Scalene triangle | 13 | 6 |
| Einstein Scalene triangle | 10 | 0 |
Fuzzy implication by probor at isosceles trapezium is the best model [43 results out of 62 receive a value greater than or equal to 0.9 (69%) and 39 results out of 62 receive a value equal to 1 (63%)]. Fuzzy implication by Eistein at scalene triangle is the worst model [10 results out of 62 receive a value greater than or equal to 0.9 (16%) and 0 results out of 62 receive a value equal to 1 (0%)].
At all membership functions, the fuzzy implications by probor receive better results in comparison with fuzzy implications by max. At four membership functions the fuzzy implications by Einstein received the worst results compared to probor and max. In each membership function, the best option is fuzzy implication by probor, the second-best option is fuzzy implication by max and the worst option is fuzzy implication by Einstein. Isosceles trapezium is the best membership function as it gives the most values greater than or equal to 0.9 and equal to 1 to the three fuzzy implications max, probor and Einstein. The second-best membership function is random trapezium while the worst membership function is the scalene triangle. The two trapezoidal membership functions give better results than the two triangular membership functions.
Step 6:
In all membership degree functions (Isosceles trapezium, Random trapezium, Isosceles triangle, and Scalene triangle) in August and January, after a small number of repetitions, the type of fuzzy implication probor takes values greater than. In August, in the isosceles trapezium (the optimum model) the new fuzzy implication exceeds the value with 15 repetitions, in contrast to random trapezium, which needs 34 repetitions (second best model). Moreover, in the isosceles triangle (third best model after the isosceles and random trapezium because it receives fewer values equal to 1 than random trapezium at 34th iteration) the new fuzzy implication reaches values greater or equal to with 34 repetitions in relation to the scalene triangle, which needs 36 repetitions (the worst model). In January, in the scalene triangle (the optimum model) the new fuzzy implication exceeds the value with 15 repetitions, in contrast to isosceles trapezium, which needs 22 repetitions (second best model). Moreover, in the isosceles triangle (the worst model) the new fuzzy implication reaches values greater or equal to with 27 repetitions in relation to the random trapezium, which needs 24 repetitions (the third best model).
On the contrary, in August and January in all membership degree functions after a large number of repetitions the types of fuzzy implication take the value equal to.
In August in the isosceles trapezium (the best model) the fuzzy implication takes the optimal value with fewer repetitions m (139) while in the scalene triangle (the worst model) needs more repetitions m (495). In the random trapezium (the second-best model) the fuzzy implication arrives to the optimal value with more repetitions m (311) than the isosceles trapezium, while in the isosceles triangle (the third best model) needs more repetitions m (320) than the random trapezium. Moreover, both trapezoidal membership functions gave better results than the two triangular membership functions. The isosceles trapezium gave the best results after a small number of iterations (small values of parameter m) while the scalene triangle gave the worst results after a big number of iterations (big values of parameter m).
In January in the scalene triangle (the best model) the fuzzy implication takes the optimal value with fewer repetitions m (192) while in the isosceles triangle (the worst model) needs more repetitions m (275). In the isosceles trapezium (the second-best model) the fuzzy implication arrives to the optimal value with more repetitions m (204) than the scalene triangle, while in the random trapezium (the third best model) needs more repetitions m (263) than the isosceles trapezium. Moreover, one trapezoidal (isosceles trapezium) and one triangular membership functions (scalene triangle) gave better results than the other two membership functions (random trapezium and isosceles triangle). The scalene triangle gave the best results after a small number of iterations (small values of parameter m) while the isosceles triangle gave the worst results after a big number of iterations (big values of parameter m).
In August and January only two results (from the total 31) of fuzzy implication with probor failed to receive value greater or equal than 0.9 at all four membership degree functions.
Table 30.
The values of parameter m (the number of iterations) for August and January so as to the type of fuzzy implication by probor receive a) the most values, b) the most optimal values, at all membership functions.
Table 30.
The values of parameter m (the number of iterations) for August and January so as to the type of fuzzy implication by probor receive a) the most values, b) the most optimal values, at all membership functions.
| Probor August | 1 | |
| Isosceles Trapezium m=15 | 29 | 23 |
| Isosceles Trapezium m=139 | 29 | 29 |
| Random Trapezium m=34 | 29 | 22 |
| Random Trapezium m=311 | 29 | 29 |
| Isosceles Triangle m=34 | 29 | 19 |
| Isosceles Triangle m=320 | 29 | 29 |
| Scalene Triangle m=36 | 29 | 20 |
| Scalene Triangle m=495 | 29 | 29 |
| Probor January | 1 | |
| Isosceles Trapezium m=22 | 29 | 26 |
| Isosceles Trapezium m=204 | 29 | 29 |
| Random Trapezium m=24 | 29 | 24 |
| Random Trapezium m=263 | 29 | 29 |
| Isosceles Triangle m=27 | 29 | 23 |
| Isosceles Triangle m=275 | 29 | 29 |
| Scalene Triangle m=15 | 29 | 15 |
| Scalene Triangle m=192 | 29 | 29 |
Step 7
In August, at isosceles trapezium (best model because it receives the most values equal to 1), the type of fuzzy implication with Einstein in the 10th iteration (when the value of m=10) receive a) 27 values greater than or equal to (the second-best results in relation to the other three membership functions) and b) the most values (23) equal to in relation to the other three membership functions. In January, at isosceles trapezium (best model because it receives the most values equal to 1), the type of fuzzy implication with Einstein in the 10th iteration (when the value of m=10) receive a) 28 values greater than or equal to (the second-best results in relation to the other three membership functions) and b) the most values (20) values equal to in relation to the other three membership functions.
In August, at scalene triangle (worst model because it receives the least values equal to 1 in relation to the other three membership functions), the type of fuzzy implication with Einstein in the 10th iteration (when the value of m=10) receive a) the most values (28) greater than or equal to (the best results in relation to the other three membership functions) and b) the least values (7) equal to in relation to the other three membership functions. In January, at scalene triangle (worst model because it receives the least values equal to 1 in relation to the other three membership functions), the type of fuzzy implication with Einstein in the 10th iteration (when the value of m=10) receive a) the most values (29) greater than or equal to in relation to other three membership functions and b) the least values (14) equal to in relation to the other three membership functions.
In August and January, trapezoidal membership functions give better results (more values equal to 1) than triangular membership functions. In August and January, scalene triangle gives the best results (more values greater than or equal to 0.9).
In August after the first iteration, at isosceles and scalene triangle and random trapezium, fuzzy implications with Einstein receive better results than probor. In January, after the first iteration, at isosceles and scalene triangle, fuzzy implications with Einstein receive better results than probor.
Table 31.
The value of parameter m equal to 10 (the number of iterations) for August and January so as the two types of fuzzy implication by probor and Einstein receive a) the most values, b) the most optimal values, at all membership functions.
Table 31.
The value of parameter m equal to 10 (the number of iterations) for August and January so as the two types of fuzzy implication by probor and Einstein receive a) the most values, b) the most optimal values, at all membership functions.
| Einstein August | 1 | |
| Isosceles Trapezium m=10 | 27 | 23 |
| Random Trapezium m=10 | 27 | 17 |
| Isosceles Triangle m=10 | 26 | 13 |
| Scalene Triangle m=10 | 28 | 7 |
| Einstein January | 1 | |
| Isosceles Trapezium m=10 | 28 | 20 |
| Random Trapezium m=10 | 28 | 18 |
| Isosceles Triangle m=10 | 28 | 16 |
| Scalene Triangle m=10 | 29 | 14 |
The most important conclusions from the implementation of all methodology steps are the following:
To sum up, although the types of fuzzy implications (produced by t-conorms probor, max and Einstein) came out smaller than Lukasiewicz in order rank, this does not mean that these implications are not reliable and inapplicable as a large percentage of their results is greater than or equal to 0.9 or equal to 1 even when the value of parameter m is equal to 1. The values of these implications (probor, max, Einstein) are more reliable and safe than Lukasiewicz as they give values in the closed interval [0,1] and not always 1.
Fuzzy implication Lukasiewicz always gives results equal to 1 as it is not affected by the membership degrees of variables x and y and by the value of parameter m. Moreover, the types of fuzzy implications probor and Einstein depend on the variables x and y as well as on the value of parameter m, so the values of the fuzzy implications probor and Einstein can be optimized as the value of the parameter m (or the number of iteration) increases.
At isosceles and random trapezium, the membership degrees of 62 temperature and humidity values which give a result with value equal to 1 are more than the two triangular membership functions. Moreover, isosceles and random trapezium, have the more combinations of membership degrees of 62 temperature and humidity values which give a result with value equal to 1 to the fuzzy implications probor, max and Einstein in contrast to isosceles and scalene triangle. Also, the isosceles trapezium is the best and the most reliable choice for the application of the three types of fuzzy implication using as variables x and y the membership degrees of crisp values of temperature and humidity values of months August 2023 and January 2024. The isosceles triangle or scalene triangle are the worst options for the application of the three types of fuzzy implication.
After the implementation of all (4) membership functions to the fuzzy implication constructed by probor, after a specific number of iterations (value of m), only four results (from the total 62) of fuzzy implication with probor failed to receive a value greater than or equal than 0.9. This means that all membership functions were applied successfully for the calculated results of the type of fuzzy implication with probor but the most reliable choices are the trapezoidal membership functions which perform better than the triangular membership functions.
Only the types of fuzzy implications probor and Einstein (not max and Lukasiewicz) depend on the variables x and y as well as on the value of the parameter m, for this reason these types give the best results as they change and improve their results after a small number of iterations.
At fuzzy implication with probor, the isosceles trapezium is the most suitable model and the optimum choice as it gives the most values (best results) equal to 1 after a small number of iterations (after the 15th repetition for the month of August the fuzzy implication gives 23 results equal to 1 and after the 22th repetition for the month of January the fuzzy implication gives 26 results equal to 1). The type of fuzzy implication with probor leads to satisfactory results after its implementation in each membership function after a small number of repetitions (i.e. small values of m from the 15 to 36), so that the type of fuzzy implication achieves values greater than or equal to 0.9.The type of fuzzy implication with probor leads to optimal results after its implementation in each membership function after a big number of repetitions (i.e. big values of m from the 139 to 495), so that the type of fuzzy implication achieves values equal to 1.
The type of fuzzy implication with Einstein after a small number of iterations (value of m equal to 10), gives better results, in relation to probor. The type of fuzzy implication with probor when the value of m is equal to 1, receives the best results, while the type of fuzzy implication with Einstein receives the worst results. Isosceles trapezium when the value of m is equal to 1, gives the best results i.e. the more values greater than or equal to 0.9 and equal to 1 to all three types of fuzzy implications (probor, max, Einstein). The triangular membership functions give the least best results i.e. the least values greater than or equal to 0.9 and equal to 1 to all fuzzy implications (probor,max,Einstein) in relation to trapezoidal membership functions. Isosceles trapezium when the value of m is equal to 10, it gives the best results to the fuzzy implication Einstein i.e. the most values equal to 1.
The type of fuzzy implication max is dependent either on variable x or variable y and independent of the value of the parameter m, so the results remain the same regardless of the number of iterations.
The type of fuzzy implication Lukasiewicz always gives results is equal to 1 as variables x and y and the parameter m do not influence the result of this type.
To sum up, the application of isosceles trapezium to the fuzzy implication with probor and Einstein give the most values greater than or equal to 0.9 and equal to 1 and constitute the best fuzzy implications in relation to max and Lukasiewicz.
5. Conclusions
In this paper, the authors have constructed four types of fuzzy implications based on the operation of t-conorms probor, max, Einstein and Lukasiewicz. The new types are generated by some basic criteria (axioms and theorems of fuzzy logic, fuzzy negation, t-conorms) which have been detailed in this paper. During the application process of the methodology, the crisp values of temperature with the corresponding humidity values of August and January were fuzzified, using empirically and experimentally four different membership degree functions (isosceles trapezium, random trapezium, scalene triangle, isosceles triangle). The membership degrees of temperature and humidity are entered into the relevant formulas of fuzzy implications. Extensive tests take place for different values of parameter m.
The type of fuzzy implication with probor when the value of m is equal to 1, receives the best results, while the type of fuzzy implication with Einstein receives the worst results. Τhe isosceles trapezium is the best and the most reliable choice while the isosceles triangle or scalene triangle is the worst options for the application of the three types of fuzzy implications probor, max and Einstein, when the value of parameter m is equal to 1. The type of fuzzy implication with Einstein after a small number of iterations (value of m equal to 10), gives better results, in relation to probor and the application of isosceles trapezium gives the best results. The application of isosceles trapezium to the fuzzy implication with probor and Einstein give the most values greater than or equal to 0.9 or equal to 1 and constitute the best fuzzy implications in relation to max and Lukasiewicz. The triangular membership functions are the worst options for the application of the three types of fuzzy implications max, probor and Einstein.
As future work, authors propose others types of fuzzy implication using other axioms and theorems of fuzzy logic, other membership degree functions, other parametric t-conorms and negations, or fuzzy logic combined with other methods and techniques of Soft Computing (ANFIS) or neural networks. Also, authors can expand the application of the proposed fuzzy implications to other problems, for example a) geological problems or using useful data from earthquakes such as the intensity and focal depth or the distance or time interval from one earthquake to another b) civil engineering problems such as parameters of building and bridge construction and maintenance and c) as parameters in hydrological models. Finally, the new fuzzy implications can find applications in engineering, architecture, environment, hydrology, mathematics, computing and any science that uses variables to solve real problems and deals with decision-making problems.
Author Contributions
Conceptualization, A.K. and B.P.; methodology, B.P., A.D. and A.K.; software, A.D.; validation, A.K. and B.P.; formal analysis, A.D. and A.K, ; investigation, A.D. and A.K.; resources, A.D.; data curation, A.D.; writing—original draft preparation, A.D.; writing—review and editing, A.D. and A.K.; visualization, A.D.; supervision, A.K.; project administration, A.K. and B.P.; All authors have read and agreed to the published version of the manuscript.
Funding
This research work was funded by Special Account for Research Funds of Democritus University of Thrace (D.U.T.H) with project code 83136.
Data Availability Statement
Data supporting reported results are available in a publicly accessible repository that does not issue DOIs and they can be found to the following links: (a) https://freemeteo.gr/mobile/kairos/kavala/istoriko/imerisio-istoriko/?gid=735861&station=5222&date=2023-08-01&language=greek&country=greece&fbclid=IwAR3Ph3AbGLWjGn39AWnLMqarYsgjypBRAtAG9gtcEITSWAVkDwEz4Hffn7M. (b) https://freemeteo.gr/mobile/kairos/kavala/istoriko/imerisio-istoriko/?gid=735861&station=5222&date=2024-01-01&language=greek&country=greece&fbclid=IwAR3Ph3AbGLWjGn39AWnLMqarYsgjypBRAtAG9gtcEITSWAVkDwEz4Hffn7M
Conflicts of Interest
The authors declare no conflict of interest.
Appendix A
Table A1.
Temperature and humidity values with corresponding membership degrees of August using Isosceles trapezium as trapezoidal membership function.
Table A1.
Temperature and humidity values with corresponding membership degrees of August using Isosceles trapezium as trapezoidal membership function.
| Kavala 14:50 o' clock measurement |
Temperature / membership degrees |
Humidity / membership degrees |
Kavala 14:50 o' clock measurement |
Temperature / membership degrees |
Humidity / membership degrees |
|---|---|---|---|---|---|
| 1/8/2021 | 30/1.0000 | 0.46/1.0000 | 17/8/2021 | 36/0.2500 | 0.32/0.5714 |
| 2/8/2021 | 31/1.0000 | 0.49/1.0000 | 18/8/2021 | 35/0.5000 | 0.3/0.2857 |
| 3/8/2021 | 32/1.0000 | 0.46/1.0000 | 19/8/2021 | 35/0.5000 | 0.32/0.5714 |
| 4/8/2021 | 37/0.0000 | 0.35/1.0000 | 20/8/2021 | 35/0.5000 | 0.34/0.8571 |
| 5/8/2021 | 31/1.0000 | 0.46/1.0000 | 21/8/2021 | 37/0.0000 | 0.31/0.4286 |
| 6/8/2021 | 32/1.0000 | 0.38/1.0000 | 22/8/2021 | 37/0.0000 | 0.29/0.1429 |
| 7/8/2021 | 30/1.0000 | 0.4/1.0000 | 23/8/2021 | 35/0.5000 | 0.28/0.0000 |
| 8/8/2021 | 28/0.5000 | 0.58/0.1429 | 24/8/2021 | 32/1.0000 | 0.43/1.0000 |
| 9/8/2021 | 30/1.0000 | 0.29/0.1429 | 25/8/2021 | 32/1.0000 | 0.43/1.0000 |
| 10/8/2021 | 26/0.0000 | 0.48/1.0000 | 26/8/2021 | 34/0.7500 | 0.36/1.0000 |
| 11/8/2021 | 28/0.5000 | 0.45/1.0000 | 27/8/2021 | 30/1.0000 | 0.49/1.0000 |
| 12/8/2021 | 32/1.0000 | 0.29/0.1429 | 28/8/2021 | 30/1.0000 | 0.52/1.0000 |
| 13/8/2021 | 29/0.7500 | 0.43/1.0000 | 29/8/2021 | 31/1.0000 | 0.46/1.0000 |
| 14/8/2021 | 30/1.0000 | 0.4/1.0000 | 30/8/2021 | 30/1.0000 | 0.52/1.0000 |
| 15/8/2021 | 30/1.0000 | 0.59/0.0000 | 31/8/2021 | 30/1.0000 | 0.52/1.0000 |
| 16/8/2021 | 31/1.0000 | 0.43/1.0000 |
Table A2.
Temperature and humidity values with corresponding membership degrees of January using Isosceles trapezium as trapezoidal membership function.
Table A2.
Temperature and humidity values with corresponding membership degrees of January using Isosceles trapezium as trapezoidal membership function.
| Kavala 14:50 o' clock measurement |
Temperature / membership degrees |
Humidity / membership degrees |
Kavala 14:50 o' clock measurement |
Temperature / membership degrees |
Humidity / membership degrees |
|---|---|---|---|---|---|
| 1/1/2024 | 15/0.8000 | 0.63/0.9000 | 17/1/2024 | 14/1.0000 | 0.59/1.0000 |
| 2/1/2024 | 16/0.6000 | 0.55/1.0000 | 18/1/2024 | 17/0.4000 | 0.68/0.6500 |
| 3/1/2024 | 13/1.0000 | 0.59/1.0000 | 19/1/2024 | 18/0.2000 | 0.6/1.0000 |
| 4/1/2024 | 16/0.6000 | 0.48/1.0000 | 20/1/2024 | 6/0.6000 | 0.81/0.0000 |
| 5/1/2024 | 16/0.6000 | 0.48/1.0000 | 21/1/2024 | 9/1.0000 | 0.27/0.0000 |
| 6/1/2024 | 19/0.0000 | 0.52/1.0000 | 22/1/2024 | 7/0.8000 | 0.42/0.7500 |
| 7/1/2024 | 16/0.6000 | 0.63/0.9000 | 23/1/2024 | 8/1.0000 | 0.5/1.0000 |
| 8/1/2024 | 16/0.6000 | 0.52/1.0000 | 24/1/2024 | 11/1.0000 | 0.47/1.0000 |
| 9/1/2024 | 3/0.0000 | 0.6/1.0000 | 25/1/2024 | 10/1.0000 | 0.58/1.0000 |
| 10/1/2024 | 6/0.6000 | 0.42/0.7500 | 26/1/2024 | 14/1.0000 | 0.36/0.4500 |
| 11/1/2024 | 8/1.0000 | 0.46/0.9500 | 27/1/2024 | 12/1.0000 | 0.51/1.0000 |
| 12/1/2024 | 9/1.0000 | 0.29/0.1000 | 28/1/2024 | 11/1.0000 | 0.41/0.7000 |
| 13/1/2024 | 7/0.8000 | 0.49/1.0000 | 29/1/2024 | 10/1.0000 | 0.32/0.2500 |
| 14/1/2024 | 8/1.0000 | 0.53/1.0000 | 30/1/2024 | 8/1.0000 | 0.43/0.8000 |
| 15/1/2024 | 11/1.0000 | 0.58/1.0000 | 31/1/2024 | 10/1.0000 | 0.4/0.6500 |
| 16/1/2024 | 17/0.4000 | 0.52/1.0000 |
Table A3.
Temperature and humidity values with corresponding membership degrees of August using random trapezium as trapezoidal membership function.
Table A3.
Temperature and humidity values with corresponding membership degrees of August using random trapezium as trapezoidal membership function.
| Kavala 14:50 o' clock measurement |
Temperature / membership degrees |
Humidity / membership degrees |
Kavala 14:50 o' clock measurement |
Temperature / membership degrees |
Humidity / membership degrees |
|---|---|---|---|---|---|
| 1/8/2021 | 30/0.8000 | 0.46/1.0000 | 17/8/2021 | 36/0.2500 | 0.32/0.2667 |
| 2/8/2021 | 31/1.0000 | 0.49/1.0000 | 18/8/2021 | 35/0.5000 | 0.3/0.1333 |
| 3/8/2021 | 32/1.0000 | 0.46/1.0000 | 19/8/2021 | 35/0.5000 | 0.32/0.2667 |
| 4/8/2021 | 37/0.0000 | 0.35/0.5667 | 20/8/2021 | 35/0.5000 | 0.34/0.4000 |
| 5/8/2021 | 31/1.0000 | 0.46/1.0000 | 21/8/2021 | 37/0.0000 | 0.31/0.2000 |
| 6/8/2021 | 32/1.0000 | 0.38/0.6667 | 22/8/2021 | 37/0.0000 | 0.29/0.0667 |
| 7/8/2021 | 30/0.8000 | 0.4/0.8000 | 23/8/2021 | 35/0.5000 | 0.28/0.0000 |
| 8/8/2021 | 28/0.4000 | 0.58/0.1000 | 24/8/2021 | 32/1.0000 | 0.43/1.0000 |
| 9/8/2021 | 30/0.8000 | 0.29/0.0667 | 25/8/2021 | 32/1.0000 | 0.43/1.0000 |
| 10/8/2021 | 26/0.0000 | 0.48/1.0000 | 26/8/2021 | 34/0.7500 | 0.36/0.5333 |
| 11/8/2021 | 28/0.4000 | 0.45/1.0000 | 27/8/2021 | 30/0.8000 | 0.49/1.0000 |
| 12/8/2021 | 32/1.0000 | 0.29/0.0667 | 28/8/2021 | 30/0.8000 | 0.52/0.7000 |
| 13/8/2021 | 29/0.6000 | 0.43/1.0000 | 29/8/2021 | 31/1.0000 | 0.46/1.0000 |
| 14/8/2021 | 30/0.8000 | 0.4/0.8000 | 30/8/2021 | 30/0.8000 | 0.52/0.7000 |
| 15/8/2021 | 30/0.8000 | 0.59/0.0000 | 31/8/2021 | 30/0.8000 | 0.52/0.7000 |
| 16/8/2021 | 31/1.0000 | 0.43/1.0000 |
Table A4.
Temperature and humidity values with corresponding membership degrees of January using random trapezium as trapezoidal membership function.
Table A4.
Temperature and humidity values with corresponding membership degrees of January using random trapezium as trapezoidal membership function.
| Kavala 14:50 o' clock measurement |
Temperature / membership degrees |
Humidity / membership degrees |
Kavala 14:50 o' clock measurement |
Temperature / membership degrees |
Humidity / membership degrees |
|---|---|---|---|---|---|
| 1/1/2024 | 15/1.0000 | 0.63/0.8571 | 17/1/2024 | 14/1.0000 | 0.59/1.0000 |
| 2/1/2024 | 16/1.0000 | 0.55/1.0000 | 18/1/2024 | 17/0.6670 | 0.68/0.6190 |
| 3/1/2024 | 13/1.0000 | 0.59/1.0000 | 19/1/2024 | 18/0.3330 | 0.6/1.0000 |
| 4/1/2024 | 16/1.0000 | 0.48/0.8077 | 20/1/2024 | 6/0.3330 | 0.81/0.0000 |
| 5/1/2024 | 16/1.0000 | 0.48/0.8077 | 21/1/2024 | 9/0.6670 | 0.27/0.0000 |
| 6/1/2024 | 19/0.0000 | 0.52/0.9615 | 22/1/2024 | 7/0.4440 | 0.42/0.5769 |
| 7/1/2024 | 16/1.0000 | 0.63/0.8571 | 23/1/2024 | 8/0.5560 | 0.5/0.8846 |
| 8/1/2024 | 16/1.0000 | 0.52/0.9615 | 24/1/2024 | 11/0.8890 | 0.47/0.7692 |
| 9/1/2024 | 3/0.0000 | 0.6/1.0000 | 25/1/2024 | 10/0.7780 | 0.58/1.0000 |
| 10/1/2024 | 6/0.3330 | 0.42/0.5769 | 26/1/2024 | 14/1.0000 | 0.36/0.3462 |
| 11/1/2024 | 8/0.5560 | 0.46/0.7308 | 27/1/2024 | 12/1.0000 | 0.51/0.9231 |
| 12/1/2024 | 9/0.6670 | 0.29/0.0769 | 28/1/2024 | 11/0.8890 | 0.41/0.5385 |
| 13/1/2024 | 7/0.4440 | 0.49/0.8462 | 29/1/2024 | 10/0.7780 | 0.32/0.1923 |
| 14/1/2024 | 8/0.5560 | 0.53/1.0000 | 30/1/2024 | 8/0.5560 | 0.43/0.6154 |
| 15/1/2024 | 11/0.8890 | 0.58/1.0000 | 31/1/2024 | 10/0.7780 | 0.4/0.5000 |
| 16/1/2024 | 17/0.6670 | 0.52/0.9615 |
Table A5.
Temperature and humidity values with corresponding membership degrees of August using isosceles triangle as triangular membership function.
Table A5.
Temperature and humidity values with corresponding membership degrees of August using isosceles triangle as triangular membership function.
| Kavala 14:50 o' clock measurement |
Temperature / membership degrees |
Humidity / membership degrees |
Kavala 14:50 o' clock measurement |
Temperature / membership degrees |
Humidity / membership degrees |
|---|---|---|---|---|---|
| 1/8/2021 | 30/0.7273 | 0.46/0.8387 | 17/8/2021 | 36/0.1818 | 0.32/0.2581 |
| 2/8/2021 | 31/0.9091 | 0.49/0.6452 | 18/8/2021 | 35/0.3636 | 0.3/0.1290 |
| 3/8/2021 | 32/0.9091 | 0.46/0.8387 | 19/8/2021 | 35/0.3636 | 0.32/0.2581 |
| 4/8/2021 | 37/0.0000 | 0.35/0.4516 | 20/8/2021 | 35/0.3636 | 0.34/0.3871 |
| 5/8/2021 | 31/0.9091 | 0.46/0.8387 | 21/8/2021 | 37/0.0000 | 0.31/0.1935 |
| 6/8/2021 | 32/0.9091 | 0.38/0.6452 | 22/8/2021 | 37/0.0000 | 0.29/0.0645 |
| 7/8/2021 | 30/0.7273 | 0.4/0.7742 | 23/8/2021 | 35/0.3636 | 0.28/0.0000 |
| 8/8/2021 | 28/0.3636 | 0.58/0.0645 | 24/8/2021 | 32/0.9091 | 0.43/0.9677 |
| 9/8/2021 | 30/0.7273 | 0.29/0.0645 | 25/8/2021 | 32/0.9091 | 0.43/0.9677 |
| 10/8/2021 | 26/0.0000 | 0.48/0.7097 | 26/8/2021 | 34/0.5455 | 0.36/0.5161 |
| 11/8/2021 | 28/0.3636 | 0.45/0.9032 | 27/8/2021 | 30/0.7273 | 0.49/0.6452 |
| 12/8/2021 | 32/0.9091 | 0.29/0.0645 | 28/8/2021 | 30/0.7273 | 0.52/0.4516 |
| 13/8/2021 | 29/0.5455 | 0.43/0.9677 | 29/8/2021 | 31/0.9091 | 0.46/0.8387 |
| 14/8/2021 | 30/0.7273 | 0.4/0.7742 | 30/8/2021 | 30/0.7273 | 0.52/0.4516 |
| 15/8/2021 | 30/0.7273 | 0.59/0.0000 | 31/8/2021 | 30/0.7273 | 0.52/0.4516 |
| 16/8/2021 | 31/0.9091 | 0.43/0.9677 |
Table A6.
Temperature and humidity values with corresponding membership degrees of January using isosceles triangle as triangular membership function.
Table A6.
Temperature and humidity values with corresponding membership degrees of January using isosceles triangle as triangular membership function.
| Kavala 14:50 o' clock measurement |
Temperature / membership degrees |
Humidity / membership degrees |
Kavala 14:50 o' clock measurement |
Temperature / membership degrees |
Humidity / membership degrees |
|---|---|---|---|---|---|
| 1/1/2024 | 15/0.5000 | 0.63/0.6667 | 17/1/2024 | 14/0.6250 | 0.59/0.8148 |
| 2/1/2024 | 16/0.3750 | 0.55/0.9630 | 18/1/2024 | 17/0.2500 | 0.68/0.4815 |
| 3/1/2024 | 13/0.7500 | 0.59/0.8148 | 19/1/2024 | 18/0.1250 | 0.6/0.7778 |
| 4/1/2024 | 16/0.3750 | 0.48/0.7778 | 20/1/2024 | 6/0.3750 | 0.81/0.0000 |
| 5/1/2024 | 16/0.3750 | 0.48/0.7778 | 21/1/2024 | 9/0.7500 | 0.27/0.0000 |
| 6/1/2024 | 19/0.0000 | 0.52/0.9259 | 22/1/2024 | 7/0.5000 | 0.42/0.5556 |
| 7/1/2024 | 16/0.3750 | 0.63/0.6667 | 23/1/2024 | 8/0.6250 | 0.5/0.8519 |
| 8/1/2024 | 16/0.3750 | 0.52/0.9259 | 24/1/2024 | 11/1.0000 | 0.47/0.7407 |
| 9/1/2024 | 3/0.0000 | 0.6/0.7778 | 25/1/2024 | 10/0.8750 | 0.58/0.8519 |
| 10/1/2024 | 6/0.3750 | 0.42/0.5556 | 26/1/2024 | 14/0.6250 | 0.36/0.3333 |
| 11/1/2024 | 8/0.6250 | 0.46/0.7037 | 27/1/2024 | 12/0.8750 | 0.51/0.8889 |
| 12/1/2024 | 9/0.7500 | 0.29/0.0741 | 28/1/2024 | 11/1.0000 | 0.41/0.5185 |
| 13/1/2024 | 7/0.5000 | 0.49/0.8148 | 29/1/2024 | 10/0.8750 | 0.32/0.1852 |
| 14/1/2024 | 8/0.6250 | 0.53/0.9630 | 30/1/2024 | 8/0.6250 | 0.43/0.5926 |
| 15/1/2024 | 11/1.0000 | 0.58/0.8519 | 31/1/2024 | 10/0.8750 | 0.4/0.4815 |
| 16/1/2024 | 17/0.2500 | 0.52/0.9259 |
Table A7.
Temperature and humidity values with corresponding membership degrees of August using scalene triangle as triangular membership function.
Table A7.
Temperature and humidity values with corresponding membership degrees of August using scalene triangle as triangular membership function.
| Kavala 14:50 o' clock measurement |
Temperature / membership degrees |
Humidity / membership degrees |
Kavala 14:50 o' clock measurement |
Temperature / membership degrees |
Humidity / membership degrees |
|---|---|---|---|---|---|
| 1/8/2021 | 30/0.8889 | 0.46/0.5306 | 17/8/2021 | 36/0.1538 | 0.32/0.6154 |
| 2/8/2021 | 31/0.9231 | 0.49/0.4082 | 18/8/2021 | 35/0.3077 | 0.3/0.3077 |
| 3/8/2021 | 32/0.7692 | 0.46/0.5306 | 19/8/2021 | 35/0.3077 | 0.32/0.6154 |
| 4/8/2021 | 37/0.0000 | 0.35/0.9796 | 20/8/2021 | 35/0.3077 | 0.34/0.9231 |
| 5/8/2021 | 31/0.9231 | 0.46/0.5306 | 21/8/2021 | 37/0.0000 | 0.31/0.4615 |
| 6/8/2021 | 32/0.7692 | 0.38/0.8571 | 22/8/2021 | 37/0.0000 | 0.29/0.1538 |
| 7/8/2021 | 30/0.8889 | 0.4/0.7755 | 23/8/2021 | 35/0.3077 | 0.28/0.0000 |
| 8/8/2021 | 28/0.4444 | 0.58/0.0408 | 24/8/2021 | 32/0.7692 | 0.43/0.6531 |
| 9/8/2021 | 30/0.8889 | 0.29/0.1538 | 25/8/2021 | 32/0.7692 | 0.43/0.6531 |
| 10/8/2021 | 26/0.0000 | 0.48/0.4490 | 26/8/2021 | 34/0.4615 | 0.36/0.9388 |
| 11/8/2021 | 28/0.4444 | 0.45/0.5714 | 27/8/2021 | 30/0.8889 | 0.49/0.4082 |
| 12/8/2021 | 32/0.7692 | 0.29/0.1538 | 28/8/2021 | 30/0.8889 | 0.52/0.2857 |
| 13/8/2021 | 29/0.6667 | 0.43/0.6531 | 29/8/2021 | 31/0.9231 | 0.46/0.5306 |
| 14/8/2021 | 30/0.8889 | 0.4/0.7755 | 30/8/2021 | 30/0.8889 | 0.52/0.2857 |
| 15/8/2021 | 30/0.8889 | 0.59/0.0000 | 31/8/2021 | 30/0.8889 | 0.52/0.2857 |
| 16/8/2021 | 31/0.9231 | 0.43/0.6531 |
Table A8.
Temperature and humidity values with corresponding membership degrees of January using scalene triangle as triangular membership function.
Table A8.
Temperature and humidity values with corresponding membership degrees of January using scalene triangle as triangular membership function.
| Kavala 14:50 o' clock measurement |
Temperature / membership degrees |
Humidity / membership degrees |
Kavala 14:50 o' clock measurement |
Temperature / membership degrees |
Humidity / membership degrees |
|---|---|---|---|---|---|
| 1/1/2024 | 15/0.9600 | 0.63/0.5217 | 17/1/2024 | 14/0.8800 | 0.59/0.6377 |
| 2/1/2024 | 16/0.8570 | 0.55/0.7536 | 18/1/2024 | 17/0.5710 | 0.68/0.3768 |
| 3/1/2024 | 13/0.8000 | 0.59/0.6377 | 19/1/2024 | 18/0.2860 | 0.6/0.6087 |
| 4/1/2024 | 16/0.8570 | 0.48/0.9565 | 20/1/2024 | 6/0.2400 | 0.81/0.0000 |
| 5/1/2024 | 16/0.8570 | 0.48/0.9565 | 21/1/2024 | 9/0.4800 | 0.27/0.0000 |
| 6/1/2024 | 19/0.0000 | 0.52/0.8406 | 22/1/2024 | 7/0.3200 | 0.42/0.7692 |
| 7/1/2024 | 16/0.8570 | 0.63/0.5217 | 23/1/2024 | 8/0.4000 | 0.5/0.8986 |
| 8/1/2024 | 16/0.8570 | 0.52/0.8406 | 24/1/2024 | 11/0.6400 | 0.47/0.9855 |
| 9/1/2024 | 3/0.0000 | 0.6/0.6087 | 25/1/2024 | 10/0.5600 | 0.58/0.6667 |
| 10/1/2024 | 6/0.2400 | 0.42/0.7692 | 26/1/2024 | 14/0.8800 | 0.36/0.4615 |
| 11/1/2024 | 8/0.4000 | 0.46/0.9744 | 27/1/2024 | 12/0.7200 | 0.51/0.8696 |
| 12/1/2024 | 9/0.4800 | 0.29/0.1026 | 28/1/2024 | 11/0.6400 | 0.41/0.7179 |
| 13/1/2024 | 7/0.3200 | 0.49/0.9275 | 29/1/2024 | 10/0.5600 | 0.32/0.2564 |
| 14/1/2024 | 8/0.4000 | 0.53/0.8116 | 30/1/2024 | 8/0.4000 | 0.43/0.8205 |
| 15/1/2024 | 11/0.6400 | 0.58/0.6667 | 31/1/2024 | 10/0.5600 | 0.4/0.6667 |
| 16/1/2024 | 17/0.5710 | 0.52/0.8406 |
References
- Kandel, A. Fuzzy Expert Systems, 1st ed.; CRC Press: Florida, USA, 1992; pp.336, ISBN-10: 084934297X, ISBN-13: 978-0849342974.
- Ruan, D.; Kerre, E.E. Fuzzy implication operators and generalized fuzzy method of cases. Fuzzy Sets and Systems 1993, 54, 1, 23–37. ISSN: 01650114. [CrossRef]
- Kecman, V. Learning and Soft Computing, 1st ed.; MIT Press: London, England, 2001; pp.576, ISBN 10: 0262527901 ISBN-13: 9780262527903.
- Daniilidou, A.; Konguetsof, A.; Souliotis, G.; Papadopoulos, B. Generator of Fuzzy Implications. Algorithms 2023, 16, 569. [CrossRef]
- Makariadis, S.; Souliotis, G.; Papadopoulos, B. Parametric fuzzy implications produced via fuzzy negations with a case study in environmental variables. Symmetry 2021, 13, 509–529. [CrossRef]
- Pagouropoulos, P.; Tzimopoulos, C.D.; Papadopoulos, B.K. A method for the detection of the most suitable fuzzy implication for data applications. In Communications in Computer and Information Science, Proceedings of the 18th International Conference on Engineering Applications of Neural Networks (EANN), Athens, Greece, 25-27 August 2017; Iliadis L., Likas A., Jayne C., Boracchi G. Eds.; Springer Verlag: Volume 744, pp. 242-255. ISSN: 18650929, ISBN: 978-331965171-2. [CrossRef]
- Pagouropoulos, P.; Tzimopoulos, C.D.; Papadopoulos, B.K. A method for the detection of the most suitable fuzzy implication for data applications. Evolving Systems 2020, 11, 467-477. [CrossRef]
- Botzoris, G.N.; Papadopoulos, K. Papadopoulos, B.K. A method for the evaluation and selection of an appropriate fuzzy implication by using statistical data. Fuzzy Economic Review 2015, 20, 19-29. [CrossRef]
- Rapti, M.N.; Papadopoulos, B.K. A method of generating fuzzy implications from n increasing functions and n + 1 negations. Mathematics 2020, 8, 886. [CrossRef]
- Shi, Y.; Van Gasse, B.; Ruan, D.; and Kerre, E.E. On Dependencies and Independencies of Fuzzy Implication Axioms. Fuzzy Sets and Systems 2010, 161, 1388-1405. [CrossRef]
- Fernandez-Peralta, R.; Massanet, S.; Mesiarová-Zemánková, A.; Mir, A. A general framework for the characterization of (S, N)-implications with a non-continuous negation based on completions of t-conorms. Fuzzy Sets and Systems 2022, 441, 1–32. [CrossRef]
- Fernández-Sánchez, J.; Kolesárová, A.; Mesiar, R., Quesada-Molina, J.J.; Úbeda-Flores, M. A generalization of a copula-based construction of fuzzy implications. Fuzzy Sets and Systems 2023, 456, 197-207. [CrossRef]
- Zhao, B.; Lu, J. On the distributivity for the ordinal sums of implications over t-norms and t-conorms. International Journal of Approximate Reasoning 2023, 152, 284-296. [CrossRef]
- Souliotis, G.; Papadopoulos, B. Fuzzy Implications Generating from Fuzzy Negations. In Lecture Notes in Computer Science (including subseries Lecture Notes in Artificial Intelligence and Lecture Notes in Bioinformatics), Proceedings of 27th International Conference on Artificial Neural Networks (ICANN 2018), Part 1, Artificial Neural Networks and Machine Learning, Rhodes, Greece, 4–7 October 2018; Kurkova V., Hammer B., Manolopoulos Y., Iliadis L., Maglogiannis I. Eds.; Springer-Verlag: Volume 11139 LNCS, p.p. 736-744, ISSN: 03029743, ISBN: 978-303001417-9. [CrossRef]
- Karbassi Yazdi, A.; Hanne, T.; Wang, Y.J.; Wee, H.M.A. Credit Rating Model in a Fuzzy Inference System Environment. Algorithms 2019, 12, 139. [CrossRef]
- Sahin, B.; Yazir, D.; Hamid, A.A.; Abdul Rahman, N.S.F. Maritime Supply Chain Optimization by Using Fuzzy Goal Programming. Algorithms 2021, 14, 234. [CrossRef]
- Shiau, J.K.; Wei, Y.C.; Chen, B.C. A Study on the Fuzzy-Logic-Based Solar Power MPPT Algorithms Using Different Fuzzy Input Variables. Algorithms 2015, 8, 100-127. [CrossRef]
- Liu, P.; You, X. Some linguistic intuitionistic fuzzy Heronian mean operators based on Einstein T-norm and T-conorm and their application to decision-making, Journal of Intelligent and Fuzzy Systems 2018, 35, 2433-2445. [CrossRef]
- Rahman, K.; Abdullah, S.; Ghani, F. Some new generalized interval-valued Pythagorean fuzzy aggregation operators using Einstein t-norm and t-conorm, Journal of Intelligent and Fuzzy Systems 2019, 37, 3721-3742. [CrossRef]
- Garg, H. Generalized Pythagorean Fuzzy Geometric Aggregation Operators Using Einstein t-Norm and t-Conorm for Multicriteria Decision-Making Process. International Journal of Intelligent Systems 2017, 32, 597-630. [CrossRef]
- Boixader, D.; Recasens, J. Vague and fuzzy t-norms and t-conorms, Fuzzy Sets and Systems 2022, 433, 156-175. [CrossRef]
- Grigorenko, O.; Miñana, J.J.; Šostak, A.; Valero, O. On t-Conorm Based Fuzzy (Pseudo)metrics. Axioms 2020, 9, 78. [CrossRef]
- Von Schmidt, B.; Klawonn, F. Construction of fuzzy classification systems with the Lukasiewicz-t-norm. In Proceedings of the 19th International Conference of the North American Fuzzy Information Processing Society-NAFIPS (PEACH FUZZ 2000), Atlanta, GA, USA, 13-15 July 2000. pp. 109-113. ISSN: 10987789. Print ISBN: 0-7803-6274-8. IEEE. [CrossRef]
- Zhu, J.; Li, Y. Hesitant Fuzzy Linguistic Aggregation Operators Based on the Hamacher t-norm and t-conorm. Symmetry 2018, 10, 189. [CrossRef]
- Dong, H.; Ali, Z.; Mahmood, T.; Liu, P. Power aggregation operators based on hamacher t-norm and t-conorm for complex intuitionistic fuzzy information and their application in decision-making problems. Journal of Intelligent and Fuzzy Systems 2023, 45, pp. 8383-8403. [CrossRef]
- Ahmad, K.; Mesiarova-Zemankova, A. Choosing t-norms and t-conorms for fuzzy controllers (2007) In Proceedings of 4th International Conference on Fuzzy Systems and Knowledge Discovery, FSKD 2007, Haikou, Hainan, China, 24-27 August 2007. ISBN: 0-7695-2874-0. [CrossRef]
- Gaxiola, F.; Melin, P.; Valdez, F.; Castillo, O.; Castro, Juan, R. Comparison of T-Norms and S-Norms for interval type-2 fuzzy numbers in weight adjustment for neural networks. Information 2017, 8, pp. 1-21. [CrossRef]
- Olej, V.; Hajek, P. Comparison of fuzzy operators for IF-inference systems of Takagi-Sugeno type in ozone prediction. Artificial Intelligence Applications and Innovations - 12th INNS EANN-SIG International Conference, EANN 2011 and 7th IFIP WG 12.5 International Conference, AIAI 2011, Corfu, Greece, September 15-18, 2011, Proceedings, Part II. In IFIP Advances in Information and Communication Technology, Part 2.; Lazaros, S. Iliadis, Ilias, Maglogiannis, Harris, Papadopoulos Eds.; Springer, New York LLC, 2011; Volume 364 AICT, Issue PART 2, pp. 92 – 97 ISBN: 978-364223959-5, ISSN:18684238. [CrossRef]
- Pan, D.; Zhou, H.; Yan, X. Characterizations for the migrativity of continuous t-conorms over fuzzy implications. Fuzzy Sets and Systems 2023, 456, pp. 173 – 196. [CrossRef]
- Fang, B.W. On alpha-cross-migrativity of t-conorms over fuzzy implications. Fuzzy Sets and Systems 2023, 466. Art.no. 108463. [CrossRef]
- Yang, E. Fixpointed Idempotent Uninorm (Based) Logics. Mathematics 2019, 7, 107. [CrossRef]
- Massanet, S.; Torrens, J.; Shi, Y.; Van Gasse, B.; Kerre, E.E.; Qin, F.; Baczyński, M.; Deschrijver, G.; Bedregal, B.; Beliakov, G.; Bustince, H.; Fernández, J.; Pradera, A.; Reiser, R.; Hliněná, D.; Kalina, M.; Král’, P.; Drewniak, J.; Sobera, J.; Baczyński, M.; Jayaram, B. Advances in Fuzzy Implication Functions, 1st ed.; (Book Series: Studies in Fuzziness and soft Computing STUDFUZZ, volume 300 Series editor Kacprzyk J); Baczynski, M.; Beliakov, G.; Sola, H.B.; Pradera, A. Eds.; Springer Berlin, Heidelberg Germany, 2013; Volume VII, p. 209, ISBN: 978-3-642-35676-6, e-book ISBN: 978-3-642-35677-3, ISSN: 1434-9922, E-ISSN: 1860-0808. [CrossRef]
- Baczynski, M.; Jayaram, B. Fuzzy Implications, 1st ed.; (Book Series: Studies in Fuzziness and Soft Computing STUDFUZZ volume 231, Series editor Kacprzyk J); Springer-Verlag Berlin Heidelberg, Germany, 2008; Volume XVIII, p. 310; ISBN: 978-3-540-69080-1, e-book ISBN: 978-3-540-69082-5, ISSN: 1434-9922, E-ISSN: 1860-0808. [CrossRef]
- Metcalfe, G.; Montagna, F. Substructural Fuzzy Logics. Journal of Symbolic Logic 2007, 72, 834–864. [CrossRef]
- Ruiz-Aguilera, D., Torrens, J. Residual implications and co-implications from idempotent uninorms. Kybernetika, 2004, 40, 21–38. ISSN: 0023-5954.
- Grammatikopoulos, D.S.; Papadopoulos, B.K. A Method of Generating Fuzzy Implications with Specific Properties. Symmetry 2020, 12, 155. [CrossRef]
- Massanet, S.; Torrens, J. The law of importation versus the exchange principle on fuzzy implications. Fuzzy Sets and Systems 2011, 168, 47-69. [CrossRef]
- Mayor, G. “Sugeno’s negations and t-norms”. Mathware and Soft Computing 1994, 1, 93–98.
- Smets, P.; and Magrez, P. Implications in fuzzy logic. International Journal of Approximate Reasoning 1987 1, 327-347. [CrossRef]
- Cintula, P. Weakly Implicative (Fuzzy) Logics I: Basic properties. Archive for Mathematical Logic 2006, 45, 673-704. [CrossRef]
- Klir, G.J.; and Yuan, Bo. Fuzzy Sets and Fuzzy Logic: Theory and Applications, 1st Ed.; Prentice Hall Press, UpperSaddle River, New Jersey, United States, 1995; pp. 574. ISBN-10 0131011715, ISBN-13 978-0131011717.
- Trillas, E.; Mas, M.; Monserrat, M.; Torrens, J. On the representation of fuzzy rules. International Journal of Approximate Reasoning 2008, 48, 583–597. [CrossRef]
- Botzoris, G.; Papadopoulos, B. Fuzzy Sets: Applications in Design-Management of Engineer Projects, 1st ed.; Sofia : Greece, Xanthi, 2015; p. 424, ISBN-13: 9789606706868 (In Greek).
- Dombi, J.; Jónás, T. On a strong negation-based representation of modalities. Fuzzy Sets and Systems 2021. 407, 142–160. [CrossRef]
- Asiain, M.J.; Bustince, H.R.; Mesiar, R.; Kolesárová, A.; Takác, Z. Negations with respect to admissible orders in the interval-valued fuzzy set theory. IEEE Transactions on Fuzzy Systems 2018, 26, 2, 556-568, ISSN:10636706. [CrossRef]
- Bustince, H.; Burillo, P.; Soria, F. Automorphisms, negations and implication operators. Fuzzy Sets and Systems 2003, 134, 2, 209-229, ISSN: 01650114. [CrossRef]
- Drygas, P. Some remarks about idempotent uninorms on complete lattice. In Advances in Intelligent Systems and Computing, Proceedings of the 10th Conference of the European Society for Fuzzy Logic and Technology, Warsaw, Poland 11-15 September 2017; In Advances in Fuzzy Logic and Technology 2017, Proceedings of the EUSFLAT 2017 and 16th International Workshop on Intuitionistic Fuzzy Sets and Generalized Nets (IWIFSGN 2017), Warsaw, Poland 13-15 September 2017; Kacprzyk, J., Szmidt, E., Zadrozny, S., Atanassov, K.T, Krawczak, M., Eds.; Springer: Cham, Switzerland, volume 641, p.p. 648-657, ISSN 21945357, ISBN 978-331966829-1. [CrossRef]
- Available online: https://freemeteo.gr/mobile/kairos/kavala/istoriko/imerisio-istoriko/?gid=735861&station=5222&date=2023-08-01&language=greek&country=greece&fbclid=IwAR3Ph3AbGLWjGn39AWnLMqarYsgjypBRAtAG9gtcEITSWAVkDwEz4Hffn7M (accessed on 26 September 2024).
- Available online: https://freemeteo.gr/mobile/kairos/kavala/istoriko/imerisio-istoriko/?gid=735861&station=5222&date=2024-01-01&language=greek&country=greece&fbclid=IwAR3Ph3AbGLWjGn39AWnLMqarYsgjypBRAtAG9gtcEITSWAVkDwEz4Hffn7M (accessed on 26 September 2024).
- Baczynski, M.; Jayaram, B.; Massanet S.; Torrens, J. Fuzzy Implications: Past, Present, and Future. In Springer Handbook of Computational Intelligence Part of the Springer Handbooks book series (SHB), 1st ed.; Kacprzyk, J., Pedrycz, W., Eds.; Springer: Berlin/Heidelberg, Germany, 2015; pp.183-202. ISBNonline: 978-366243505-2, ISBNprint:978-366243504-5. [CrossRef]
Table 3.
Results of four fuzzy implications at isosceles trapezium for August when the value of m is equal to 1.
Table 3.
Results of four fuzzy implications at isosceles trapezium for August when the value of m is equal to 1.
| Fuzzy Implications | and < 1 | < 0.9 | ||
|---|---|---|---|---|
| Probor | 23 | 22 | 1 | 8 |
| Max | 22 | 22 | 0 | 9 |
| Einstein | 21 | 20 | 1 | 10 |
| Lukasiewicz | 31 | 31 | 0 | 0 |
Table 4.
Results of four fuzzy implications at random trapezium for August when the value of m is equal to 1.
Table 4.
Results of four fuzzy implications at random trapezium for August when the value of m is equal to 1.
| Fuzzy Implications | and < 1 | < 0.9 | ||
|---|---|---|---|---|
| Probor | 15 | 15 | 0 | 16 |
| Max | 15 | 15 | 0 | 16 |
| Einstein | 12 | 12 | 0 | 19 |
| Lukasiewicz | 31 | 31 | 0 | 0 |
Table 5.
Results of four fuzzy implications at isosceles triangle for August when the value of m is equal to 1.
Table 5.
Results of four fuzzy implications at isosceles triangle for August when the value of m is equal to 1.
| Fuzzy Implications | and < 1 | < 0.9 | ||
|---|---|---|---|---|
| Probor | 9 | 4 | 5 | 22 |
| Max | 9 | 4 | 5 | 22 |
| Einstein | 5 | 0 | 5 | 26 |
| Lukasiewicz | 31 | 31 | 0 | 0 |
Table 6.
Results of four fuzzy implications at scalene triangle for August when the value of m is equal to 1.
Table 6.
Results of four fuzzy implications at scalene triangle for August when the value of m is equal to 1.
| Fuzzy Implications | and < 1 | < 0.9 | ||
|---|---|---|---|---|
| Probor | 7 | 4 | 3 | 24 |
| Max | 6 | 4 | 2 | 25 |
| Einstein | 3 | 0 | 3 | 28 |
| Lukasiewicz | 31 | 31 | 0 | 0 |
Table 7.
Results of four fuzzy implications at isosceles trapezium for January when the value of m is equal to 1.
Table 7.
Results of four fuzzy implications at isosceles trapezium for January when the value of m is equal to 1.
| Fuzzy Implications | and < 1 | < 0.9 | ||
|---|---|---|---|---|
| Probor | 20 | 17 | 3 | 11 |
| Max | 20 | 17 | 3 | 11 |
| Einstein | 20 | 17 | 3 | 11 |
| Lukasiewicz | 31 | 31 | 0 | 0 |
Table 8.
Results of four fuzzy implications at random trapezium for January when the value of m is equal to 1.
Table 8.
Results of four fuzzy implications at random trapezium for January when the value of m is equal to 1.
| Fuzzy Implications | and < 1 | < 0.9 | ||
|---|---|---|---|---|
| Probor | 14 | 9 | 5 | 17 |
| Max | 12 | 9 | 3 | 19 |
| Einstein | 14 | 8 | 6 | 17 |
| Lukasiewicz | 31 | 31 | 0 | 0 |
Table 9.
Results of four fuzzy implications at isosceles triangle for January when the value of m is equal to 1.
Table 9.
Results of four fuzzy implications at isosceles triangle for January when the value of m is equal to 1.
| Fuzzy Implications | and < 1 | < 0.9 | ||
|---|---|---|---|---|
| Probor | 12 | 2 | 10 | 19 |
| Max | 6 | 2 | 4 | 25 |
| Einstein | 6 | 0 | 6 | 25 |
| Lukasiewicz | 31 | 31 | 0 | 0 |
Table 10.
Results of four fuzzy implications at scalene triangle for January when the value of m is equal to 1.
Table 10.
Results of four fuzzy implications at scalene triangle for January when the value of m is equal to 1.
| Fuzzy Implications | and < 1 | < 0.9 | ||
|---|---|---|---|---|
| Probor | 14 | 2 | 12 | 17 |
| Max | 7 | 2 | 5 | 24 |
| Einstein | 7 | 0 | 7 | 24 |
| Lukasiewicz | 31 | 31 | 0 | 0 |
Disclaimer/Publisher’s Note: The statements, opinions and data contained in all publications are solely those of the individual author(s) and contributor(s) and not of MDPI and/or the editor(s). MDPI and/or the editor(s) disclaim responsibility for any injury to people or property resulting from any ideas, methods, instructions or products referred to in the content. |
© 2024 by the authors. Licensee MDPI, Basel, Switzerland. This article is an open access article distributed under the terms and conditions of the Creative Commons Attribution (CC BY) license (http://creativecommons.org/licenses/by/4.0/).
Copyright: This open access article is published under a Creative Commons CC BY 4.0 license, which permit the free download, distribution, and reuse, provided that the author and preprint are cited in any reuse.


