Submitted:
16 October 2024
Posted:
17 October 2024
Read the latest preprint version here
Abstract
Background: Chronic heart failure (CHF) often necessitates the use of high doses of diuretics, which can lead to side effects such as worsening renal function and electrolyte imbalances. Methods: A total of 102 patients (median age 75 years) were included in the study and divided into two groups based on the level of diuretic therapy. The diuretic group received the following average doses: furosemide — 39.1 ± 22.1 mg, torasemide — 7.4 ± 3 mg, and spironolactone — 42 ± 12.4 mg. Biochemical analyses were performed on days 1 and 7 of hospitalization, with measure-ments of sodium, potassium, glucose, urea, and plasma osmolality (eOSM). Results: By day 7, the plasma osmolality in the diuretic group increased from 300 [297; 304] to 302.2 [298.3; 305.8] mOsm/L (p = 0.039). Urea levels in the diuretic group rose to 7.95 [5.65; 9.90] mmol/L by day 7, while remaining stable in the non-diuretic group at 5.90 [5.05; 7.50] mmol/L (p = 0.012). The proportion of urea to plasma osmolality (PropUrea/eOSM) in the diuretic group in-creased to 2.63% [1.89; 3.28] compared to 2.00% [1.70; 2.50] in the non-diuretic group (p = 0.011). The proportion of sodium to plasma osmolality (PropNa/eOSM) in the diuretic group decreased to 46.46% [46.02; 46.74], compared to 46.68% [46.33; 46.89] in the non-diuretic group (p = 0.050). Analysis of PropNa/eOSM and PropUrea/eOSM on day 7 without considering salt intake yielded statistically significant results, though they were less robust compared to models including salt intake. For example, in the PropUrea/eOSM model, the odds ratio (OR) was 3.01 (95% CI 1.74, 5.89; p < 0.001), and in the PropNa/eOSM model, the OR was 0.19 (95% CI 0.07, 0.43; p < 0.001). Conclusion: The study confirmed that high salt intake and active diuretic therapy significantly influence the biochemical parameters of patients with chronic heart failure (CHF), contributing to the develop-ment of the aestivation phenomenon. This is characterized by an increase in nonionic osmolytes such as urea, which may represent a physiological adaptation to stress. Patients receiving diuret-ics and following a high-salt diet exhibited significant changes in plasma osmolality and urea levels, indicating a physiological adaptation that may worsen prognosis by increasing the risk of sarcopenia and cachexia. Further research is needed to better understand these mechanisms and develop strategies to mitigate the negative effects.
Keywords:
chronic heart failure
; diuretics
; sodium intake
; aestivation
; osmolytes
; urea
; plasma osmolality
1. Introduction
Decompensated heart failure often requires the use of high doses of diuretics. However, research indicates that the administration of large doses of diuretics can lead to several side effects, including worsening renal function and electrolyte disturbances. The ADHERE study showed that patients receiving lower doses of furosemide (<160 mg) had a reduced risk of hospital mortality, shorter stays in the ICU, and fewer prolonged hospitalisations or renal side effects compared to patients receiving more than 160 mg of furosemide [1]. The use of higher doses of diuretics was associated with increased diuresis and more favourable outcomes at some secondary endpoints, but also posed a higher risk of deterioration of renal function [2]. Obese patients who received high-intensity diuretic therapy had an increased risk of deterioration of renal function within 72 hours of treatment compared to a control group. Furthermore, high-intensity diuretic treatment was associated with a higher frequency of decline in renal function, which was similar in both obese and non-obese patients [3].
A recently described novel pathophysiological mechanism of muscle mass loss related to sodium metabolism in patients with chronic heart failure (CHF) involves active conservation of total body water during acute changes in sodium balance. This mechanism resembles the state of aestivation observed in animals for water conservation, resulting in metabolic regulation aimed at increasing the contribution of nonionic osmolytes, such as urea and glucose [4]. In a study by Nihlén S. et al. [5], it was found that during treatment in the intensive care unit (ICU), diuretic-induced iatrogenic dehydration is associated with a shift towards the intensive production of organic osmolytes, mainly urea. This adaptation is part of a universal response to water deficiency, observed in a wide range of organisms, from aestivating worms to higher animals, including mammals [6]. This aligns with scientific data indicating that fluid loss can trigger protein breakdown in various cell types [7]. Manifestations of aestivation in mammals include the synthesis of amino acid osmolytes, which contribute to increased plasma urea concentration, reduced urine output (oliguria), peripheral hypoperfusion, and muscle mass loss. The interplay of these mechanisms with varying levels of sodium intake in patients is intriguing [8], considering that individuals on a high-salt diet typically have significant depots of osmotically neutral sodium, including in muscle tissue [9,10]. These mechanisms may explain the high prevalence of sarcopenia in patients with CHF [11].
Objective of the Study: To evaluate the impact of varying levels of sodium intake and diuretic therapy on biochemical changes and the activation of aestivation mechanisms in patients with chronic heart failure (CHF).
2. Materials and Methods
Study Design
The study was carried out in the Cardiology Department of GBUZ GVV No3 DZM, with patient recruitment taking place from January 2023 to July 2023. This was a prospective single-centre open-label cohort study that aimed to investigate the impact of intensive diuretic therapy on the development of aestivation in patients with CHF on diets with varying sodium content. The study adhered to the principles of the Helsinki Declaration. The study design is presented in Figure 1.
Upon admission, patients were divided into two groups according to the required level of diuretic therapy with loop diuretics. Biochemical analyses were performed on the first day of hospitalisation before the initiation of diuretic therapy and after 7 days of therapy. The concentrations of sodium, potassium, glucose, urea, albumin, total protein, AST, ALT, CK, HDL, LDL, triglycerides, cholesterol, creatinine, and CRP were measured.
Inclusion and Exclusion Criteria
Participants: Patients with a confirmed diagnosis of chronic heart failure (CHF), who had been on stable therapy (ACE inhibitors/ARBs, beta-blockers at more than 50% of the maximum dose) for more than 3 weeks, were included in the study. The main inclusion and exclusion criteria are presented in Table 1. The study was conducted in accordance with the Helsinki Declaration and approved by the ethics committee.
Calculation of Plasma Osmolarity
In Equation 1, where is plasma urea, is plasma glucose, and eOSM is the estimated plasma osmolality.
Plasma osmolality was assessed according to Equation 1. We then calculated the proportions of each osmolyte relative to the estimated plasma osmolality, obtaining the following ratios: Prop Na/eOSM, Prop K/eOSM, Prop Urea/eOSM, and Prop Glucose/eOSM , respectively.
Methods for Determining Salt Intake
Salt intake was evaluated using a diet questionnaire in which patients recorded their dietary information for any two weekdays and one weekend day during the week prior to hospitalisation. The electronic questionnaire was published on the website http://www.saltquest.ru/Sodium_project/. The electronic questionnaire contained a preformed database of foods produced in Russia with known sodium content per 100 grams of product or dish. All individual products and recipes were grouped into similar types of food (e.g., popcorn, potato chips, crackers) and then combined into broader categories (e.g., snacks), which formed the foundation of the food diary.
When filling out the food diary, the type of meal (breakfast, lunch, dinner), its volume, and the fact that the dish was additional salted were taken into account. The volume of additional salting was calculated based on 0.1 grams of salt per additional salting.
Patients with a consistent level of sodium intake were included in the study. Weekly intake fluctuations were allowed within ±2 grams per day, provided that they did not exceed the salt intake categories: 1) less than 6 grams, 2) 6 to 10 grams, 3) more than 10 grams per day.
Definition of Heart Failure
The presence of heart failure in patients was determined based on the National Clinical Guidelines for the Diagnosis and Treatment of Chronic Heart Failure (CHF) [12]. The stage and functional class of CHF for each patient included in the final analysis were determined by two independent experienced cardiologists. If their assessments differed, the final decision was made after joint discussion.
Ejection fraction (EF) for all patients was determined using the Simpson’s method in the apical four-chamber and two-chamber views, and the average EF was calculated.
Determination of Kidney Function and Verification of Chronic Kidney Disease (CKD)
The glomerular filtration rate (GFR) was calculated using the 2011 formula of CKD-EPI (Chronic Kidney Disease Epidemiology Collaboration) 2011 formula [13], according to the National Guidelines for Chronic Kidney Disease (CKD). Albuminuria was determined using test strips and the albumin/creatinine ratio was measured in a morning urine sample. The diagnosis of CKD was verified according to the guidelines [14], based on the following criteria:
- The presence of any clinical markers of kidney damage was confirmed twice, with a time interval of at least 3 months between tests.
- Detected decrease in GFR (>60 ml/min/1.73 m²), albuminuria, or any other clinical markers of kidney damage confirmed over a period of 3 months.
- Persistent GFR <60 ml/min/1.73 m² regardless of the dynamics of other markers.
- Diagnosis of irreversible markers (signs) of structural kidney changes confirmed by biopsy or imaging studies.
Sample Size Calculation
The sample size for the study was calculated based on the results of the study by Nihlen et al. [5]. We assumed that the expected mean difference between the diuretic groups receiving and those not receiving them would be around 4% in the proportion of urea, with a standard deviation not exceeding 5%. Given the limited number of studies that have investigated changes in urea levels during diuretic therapy, a coefficient of variation level of 10% was adopted. This provided sufficient confidence that the calculated confidence limits would be reliable enough to confirm the study results at a power of 90 %. This corresponded to a minimum sample size of 34 patients to assess the possible change in urea levels during diuretic therapy.
Taking into account the potential exclusion of respondents due to incomplete adherence to the study protocol and the possible reduction in the representative sample after the analysis of propensity matching, the sample size was increased by 50-70% from the calculated size. Therefore, the required sample size was determined to be at least 51 individuals. This number was sufficient to obtain statistically significant results. Therefore, an adequate sample size was formed to carry out the study.
Statistical Analysis
Statistical analysis of the data obtained was performed using R, version 4.3.2, in the RStudio development environment (packages: ggplot2, ggpubr, dplyr, tidyverse, gtsummary, rstatix). The normality of the distribution was determined using the Shapiro-Wilk test, as well as the Kolmogorov-Smirnov test. We also examined the values of skewness and kurtosis and constructed QQ plots and distribution histograms.
Quantitative data were presented as mean (M) ± standard deviation (SD) or median with the 25th and 75th percentiles. Both parametric and nonparametric statistical methods were used to describe the results. The Kruskal-Wallis test or analysis of variance (ANOVA) was used to compare multiple groups. To compare two groups, Student’s t-test was applied for normally distributed data and the Wilcoxon rank sum test was used for non-normally distributed data.
For categorical variables, frequency tables were constructed and checked using the Chi-square test with Yates correction. Fisher’s exact test was used when the group size was less than 5, followed by post hoc analysis with Holm’s correction for multiple comparisons. The Spearman correlation coefficient was used to study the relationship between variables. Logistic regression (both univariate and multivariate) was applied to examine the association between categorical dependent variables with multiple categories.
To adjust for predefined confounding factors in our analysis, we used the matching of propensity score [15]. The cohort of interest was matched using the MatchIt library [16] with the ‘full’ matching method, which provided the best match based on standardised mean differences.
Statistical hypotheses were tested with the null hypothesis rejected at a significance level of less than 0.05.
3. Results
Clinical Characteristics of the Group
A total of 102 individuals were included in the study, with a median age of 75 years (minimum age 43, maximum age 93 years). The number of women was slightly higher than that of men: 59 (57,8%). The clinical characteristics of each group, based on whether they received diuretic therapy, are presented in Table 2. For most parameters, the patients did not differ significantly. However, significant differences were observed in some parameters; for example, the patients in the diuretic therapy group were older than those in the non-diuretic therapy group. Patients requiring diuretics generally had higher stages and functional classes of CHF. Consequently, this group had more patients with lower ejection fractions, and due to the interrelationship between CHF and chronic kidney disease (CKD), patients in the diuretic group often had higher stages of CKD.
The average doses of diuretics during the 7-day observation period were as follows: furosemide - 39,1 ± 22,1 mg, torasemide - 7,4 ± 3 mg, and spironolactone - 42 ± 12,4 mg. Patients receiving thiazide or thiazide-like diuretics were not included in the study.
On the first day of observation, the mean estimated osmolality in the group of patients receiving treatment (n = 59) was 300 [297; 304] mOsm/L, which was comparable to the group of patients not receiving treatment (n = 43), where the value was 299 [296; 302] mOsm/L with a p-value > 0.5, indicating that there was no statistically significant difference. However, on the seventh day, a statistically significant increase in osmolality was observed in the treatment group, reaching 302.2 [298.3; 305.8] mOsm/L compared to the nontreatment group, which had a value of 300.2 [295.9; 303.5] mOsm/L, with a p-value of 0.039. These data highlight the potential impact of therapeutic interventions on plasma osmolality as part of the treatment approach for chronic heart failure.
Changes in Plasma Osmolyte Ratios on Day 7 of Diuretic Therapy
In Figure 2, a comparison of the changes in the proportions of key plasma osmolytes is shown after 7 days of loop diuretic treatment. Changes in potassium and glucose levels did not show statistically significant differences, while an increase in the proportion of urea and a decrease in the proportion of sodium in plasma osmolality were observed in the group receiving diuretic therapy.
On the first day of observation, for patients who did not receive diuretics, no statistically significant differences were identified in the proportions of osmolytes relative to plasma osmolality between the groups planned for diuretic treatment and those who did not receive such treatment (glucose 2[1,8; 2,3] vs 2[1,8; 2,4] p = 0,66, potassium 1,3[1,3; 1,4] vs 1,3[1,3; 1,4] p = 0,35, sodium 46,3[45,9; 46,7] vs 46,4[46,1; 46,8] p = 0,14, urea 2,5[1,9; 3,4] vs 2,2[1,8; 2,6] p = 0,15).
Therefore, after 7 days of diuretic treatment, a statistically significant increase in the proportion of urea and a decrease in the proportion of sodium were observed.
Relationship between Plasma Osmolytes and Sodium Intake Levels
In Figure 3 E, the level of salt intake among groups of patients receiving diuretic therapy and those not receiving it is shown. The largest number of patients were observed in the groups with a diet that included a salt intake of 10 grams and less than 6 grams per day, and to a lesser extent in the 6-10 grams per day group. There were no statistically significant differences between the groups (p = 0.6).
In Figure 3 A, it is shown that during diuretic therapy, patients who consumed 10 grams of salt per day experienced a statistically significant increase in the proportion of urea compared to other osmolytes. A similar effect was observed with a diet of 6 to 10 grams of salt per day. Meanwhile, on a low-salt diet, no statistically significant relationship was observed. PropNa/eOSM (figure Figure 3 B) statistically significantly only with a diet of 10 grams of salt per day; with a salt intake of 6 to 10 grams per day, a similar trend was observed, but it did not reach statistical significance, and no changes were observed with a diet of less than 6 grams of salt per day.
Figure 3 C shows a negative linear relationship between the proportions of urea and sodium relative to other osmolytes, with the most pronounced correlation seen with diets consuming 10 grams and 6 to 10 grams of salt per day during diuretic therapy. Furthermore, there was a shift in the proportion of urea to values above 3% and a decrease in the proportion of sodium below 45.5%, while without diuretics, this observation was not present in diets of 10 grams and 6-10 grams of salt per day, and the correlation level remained almost the same. With a salt intake of less than 6 grams per day, the linear relationship was less pronounced and almost all observations were concentrated in the range with a proportion of urea less than 3% and a proportion of sodium more than 45.5%.
Figure 3 D demonstrates a negative linear relationship between the proportions of urea and sodium relative to other osmolytes before the start of diuretic therapy, with a more pronounced negative linear trend with diets of 10 grams and 6 to 10 grams of salt per day, and a less pronounced trend with a diet of less than 6 grams of salt per day.
Thus, an increase in the proportion of urea in plasma osmolality is associated with excessive sodium intake, and during diuretic therapy, these changes may occur due to prolonged excessive sodium intake, leading to the filling of sodium depots in glycosaminoglycans of muscle tissue. With loss of sodium during diuretic therapy, its proportion in plasma decreases; To maintain sodium balance, it is necessary to release ‘osmotically neutral’ sodium from muscle tissue, as well as urea to compensate for excessive osmolality in urine due to high sodium concentration, to prevent excessive fluid loss. Meanwhile, without diuretic therapy, the change in the proportion of urea is likely due to the processes of ‘releasing’ sodium depots, as the proportion of urea does not increase on a low-salt diet.
Propensity Score Matching
Taking into account the presence of statistically significant differences between the compared groups (with and without diuretics) in terms of age, CHF stage, ejection fraction, glomerular filtration rate (GFR) and chronic kidney disease (CKD), pseudorandomisation was performed using the propensity score matching (PSM) method to eliminate the potential influence of CHF severity or significant contributions from renal disease and function in patients. After the pseudorandomisation procedure, the total number of patients was reduced to 71. However, biases in the aforementioned parameters were eliminated and the results are presented in Table 3.
In Table 4, the results of the impact of various osmolytes on osmolality after diuretics application, performed following the propensity score matching procedure, are presented. The table indicates that despite the balance of the sample for renal function, there are still statistically significant differences in the levels of urea, PropUrea/eOSM, and PropNa/eOSM on the seventh day of diuretic therapy. These changes suggest that the alterations in the contribution of urea to osmolality are not related to changes in renal function or a higher degree of CHF in patients, but are directly caused by the impact of diuretic therapy on muscle tissue, leading to increased urea synthesis and a reduction in the sodium proportion.
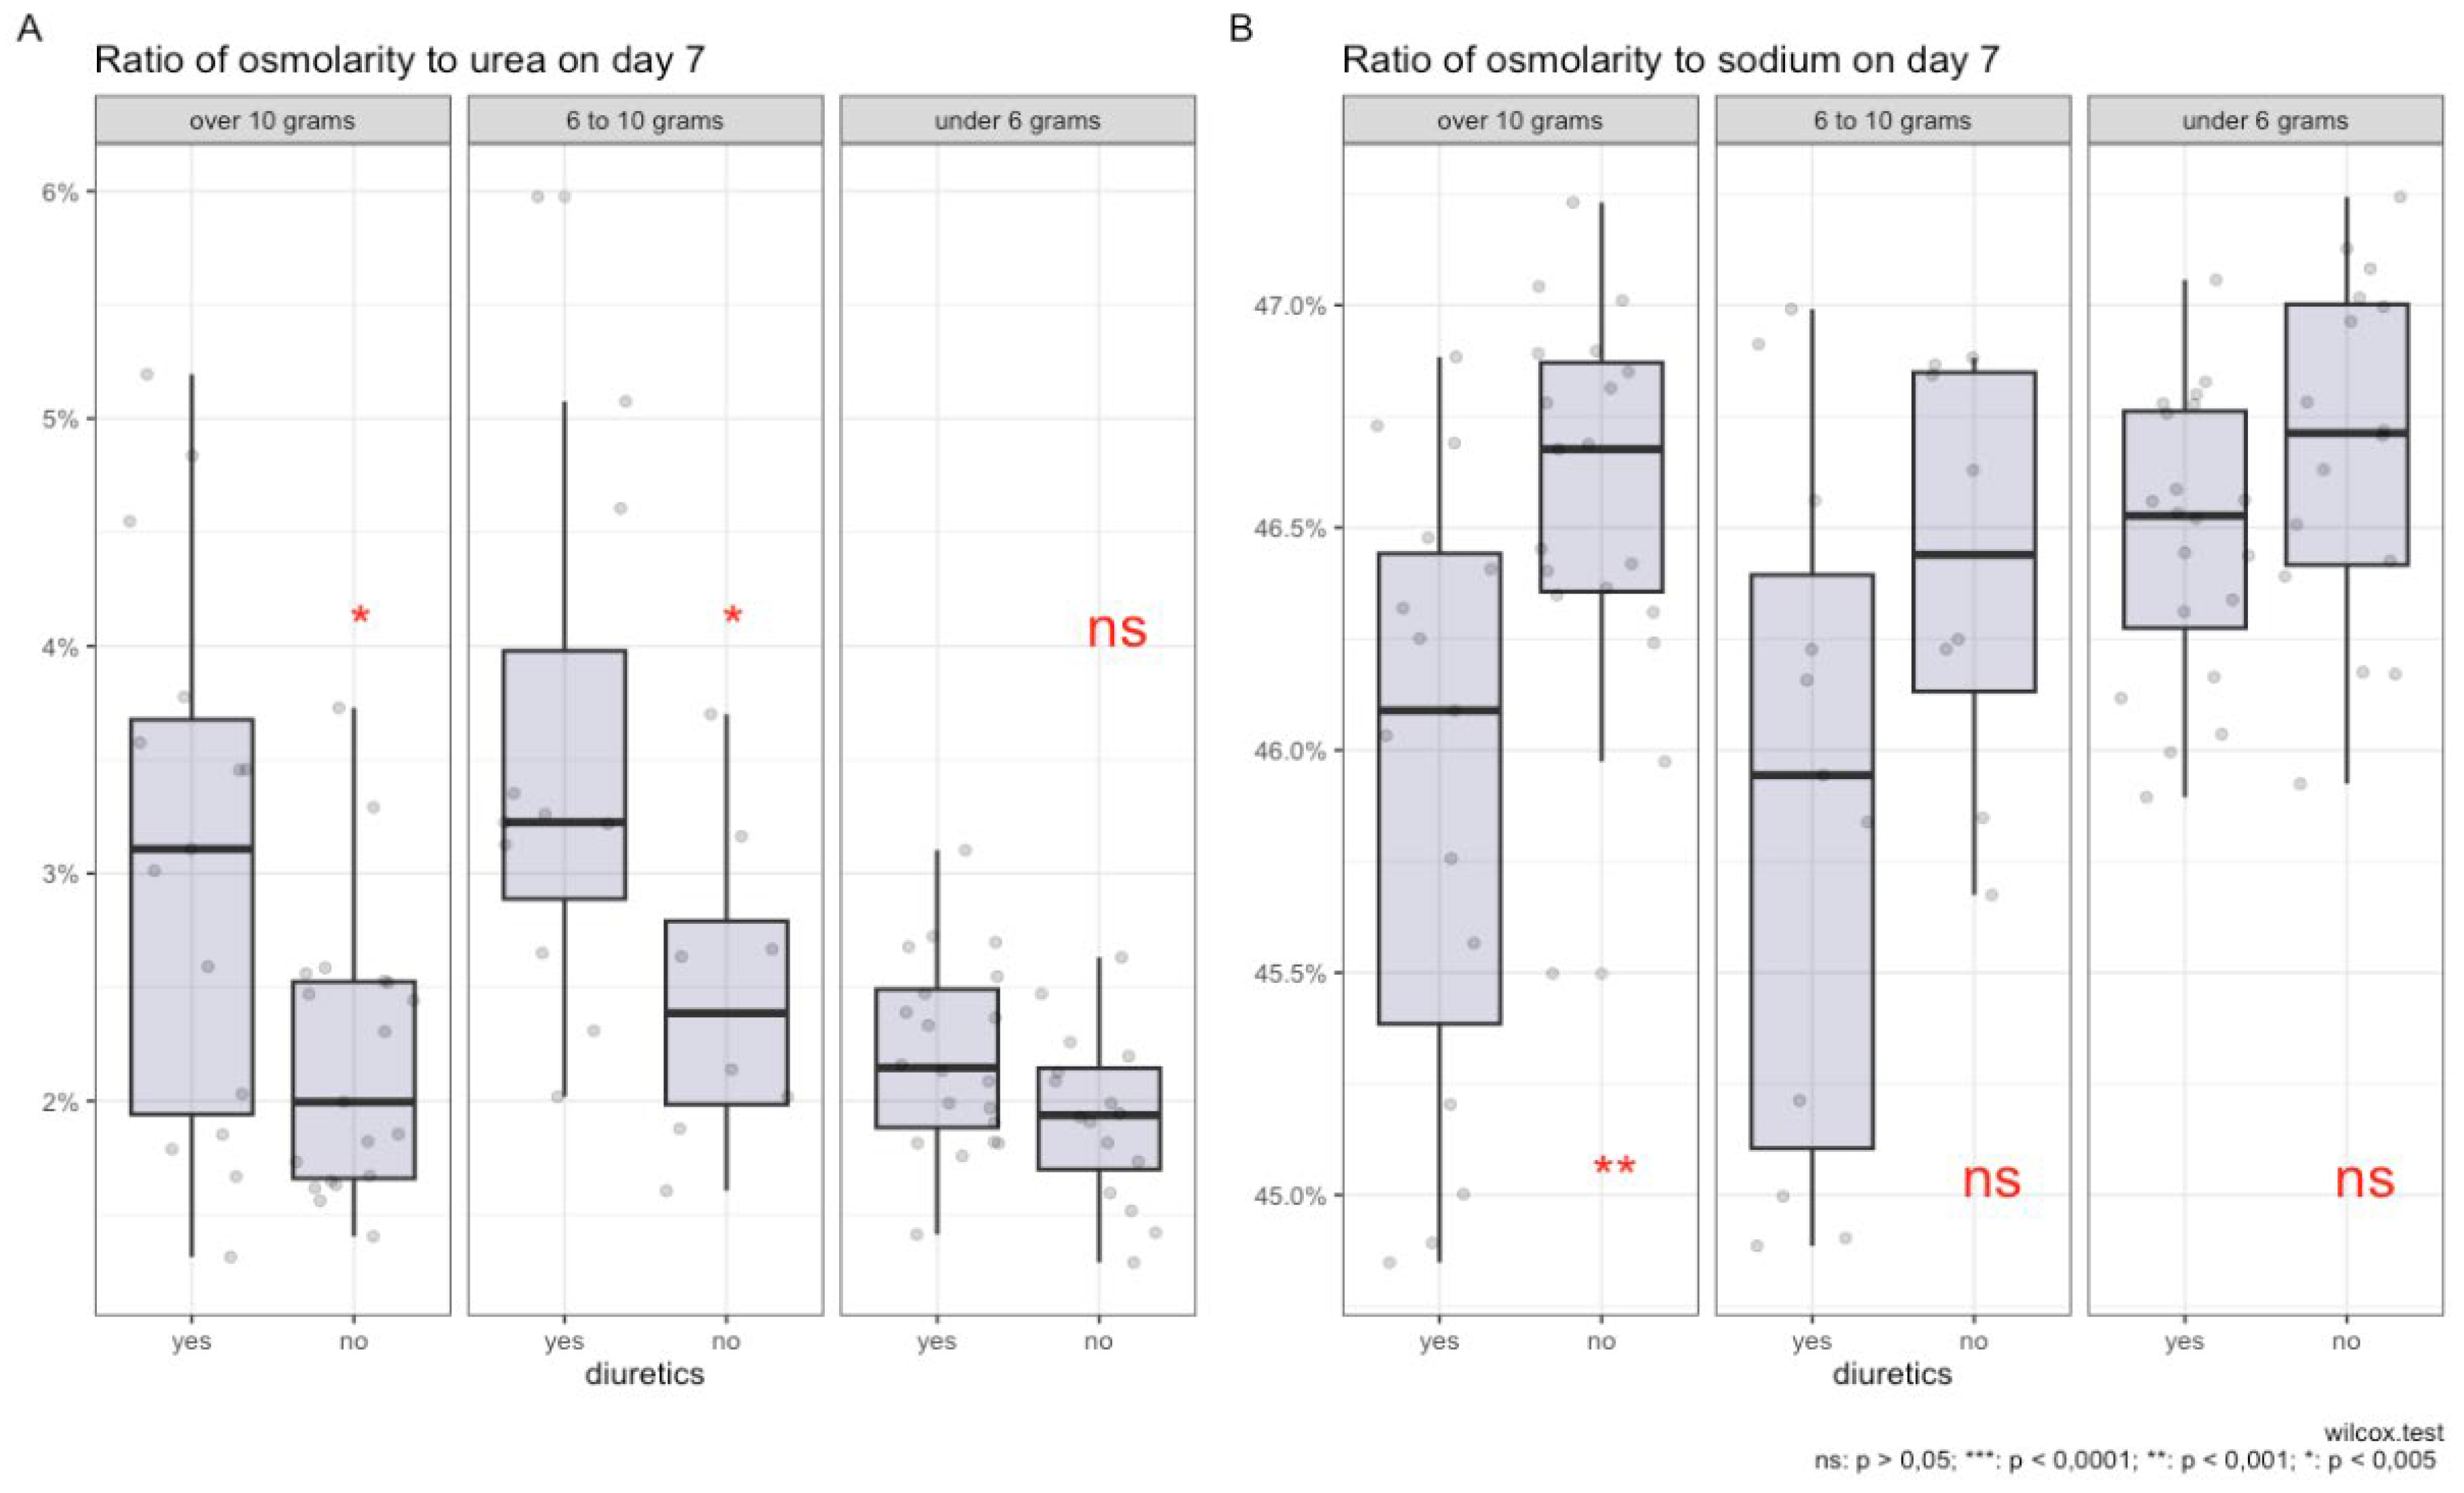
In Figures 4 A and B, the impact of salt intake and diuretic therapy on the contribution of key electrolytes to plasma osmolality is illustrated.
In graph A, it is shown that with high salt intake (more than 10 grams and from 6 to 10 grams per day), the use of diuretics is associated with a higher percentage contribution of urea to the total plasma osmolality. For salt intake of less than 6 grams per day, there is no statistically significant increase in the contribution of urea.
In graph B, a significant reduction in the sodium proportion in plasma osmolality is observed with a salt intake of more than 10 grammemes per day during diuretic therapy. Although statistical significance is not reached for the 6-10 gramme range and less than 6 gramme of salt per day, a trend toward a reduction in the proportion of sodium is still observed for the 6-10 gramme group. The contribution of potassium and glucose to osmolality remains statistically insignificant regardless of the level of salt intake and diuretic use.
The box plots demonstrate the distribution of median values, interquartile ranges, and individual measurements, providing a visual representation of changes in plasma electrolyte composition under the influence of these factors.
Figure 4.
Comparison of the ratio of plasma osmolality to urea (A) and sodium (B) on day 7 of diuretic therapy across groups with varying levels of salt intake.
Figure 4.
Comparison of the ratio of plasma osmolality to urea (A) and sodium (B) on day 7 of diuretic therapy across groups with varying levels of salt intake.
Modelling Results
In Table 5, the results of the modelling of the use of diuretics against the background of a diet with varying levels of sodium intake and the changes in the contributions of various osmolytes to plasma osmolality, such as urea, glucose, sodium, and potassium, and their impact on the likelihood of diuretic use in patients are presented.
Model 1: Analysis of PropK/eOSM on the seventh day and various levels of salt intake yielded an odds ratio (OR) of 6.45 with a 95% confidence interval (CI) of [0.62; 78.3] and a p-value of 0.12. This indicates that there is no statistically significant effect of osmolality relative to potassium on the likelihood of diuretic use.
Model 2: Evaluation of PropGlucose/eOSM on day 7 and various levels of salt intake showed an OR of 1.32 with a 95% CI of [0.60; 3.13] and a p-value of < 0.5. Here, too, no statistically significant results were obtained, indicating that there was no dependence between diuretic use and changes in PropGlucose/eOSM.
Models 3 and 4: These models provide estimates for PropUrea/eOSM and PropNa/eOSM on the seventh day. In Model 4, the OR estimate for PropUrea/eOSM on day 7 is 3.52 with a 95% CI of [1.94; 7.26] and a p-value of < 0.001. This indicates a significant association between diuretic use and changes in PropUrea/eOSM. In contrast, an increase in osmolality compared to sodium on day 7 is associated with a significant reduction in the likelihood of diuretic use (OR = 0.16, 95% CI: 0.06–0.39, p < 0.001).
Thus, the results confirm that the use of diuretics in combination with a diet containing varying amounts of salt induces different changes in PropUrea/eOSM and PropNa/eOSM.
When constructing univariate models that evaluate the use of diuretics, PropNa/eOSM on day 7 and PropUrea/eOSM on day 7 without considering salt intake, statistically significant results are obtained. However, they are less robust compared to models that include the level of salt intake. For example, in the PropUrea / eOSM model, the odds ratio (OR) is 3.01 (95% CI 1.74, 5.89; p<0.001), and for the PropNa / eOSM model, the OR is 0.19 (95% CI 0.07, 0.43; p<0.001).
4. Discussion
Aestivation can be characterised as a series of physiological adaptations aimed at preventing dehydration and death. The key goal of aestivation is the conservation of water in the body. The need to conserve water under conditions of high salt intake induces a state similar to aestivation in experimental mice [17].
Homer Smith was the first to study changes in osmolytes and body hydration in aestivating ‘lungfish’ [18]. These fish, living in underground mud cocoons, enter a state of aestivation when in water that is hyperosmotic relative to their body fluids, which promotes water loss. To prevent dehydration, aestivating lungfish increase the level of urea in their plasma and tissues.
Urea and its transporters play a crucial role in the urine concentration processes in the kidneys. Studies show that in cases of protein deficiency, the ability to concentrate urine decreases, which can be restored by adding urea. Genetically modified mice lacking specific urea transporters demonstrate similar reductions in urine concentration capacity [17].
There is a hypothesis that a high concentration of urea in the interstitial space of the renal medulla is necessary for effective concentrated urine production. This is achieved by reabsorption of urea through specific protein transporters, such as UT-A1 and UT-A3. The UT-B1 transporter, present in erythrocytes, also plays an important role in this process, facilitating efficient countercurrent exchange and urine concentration. The absence of this transporter in humans and mice leads to a reduced urine concentration capacity [17].
The principle of water conservation in urine concentration through accumulation of urea has been previously established and confirmed in mice with impaired renal urea transporter function [19]. According to previous data that indicate opposing effects of urea and NaCl osmolytes on urea transport managed by the UT-A1 transporter under conditions of acute osmotic diuresis, it is demonstrated that this principle of water conservation, dependent on urea, is used to maintain kidney concentration processes, possibly compensating for the osmotic diuretic effect of salt excretion. As a result, endogenous water accumulation ensures consistent urine volume despite intense natriuresis [19].
Intense natriuresis can occur for various reasons and can be related to external factors that affect patients or the use of medications that increase natriuresis. Bankir et al. [20] previously noted that during the study ‘Dietary approaches to stop hypertension (DASH)’, increased salt excretion led to higher concentrations in patient urine without increasing urine volume. These results underscore the importance of controlling kidney concentrating function and water conservation regulation as key factors in urine formation and extracellular volume homeostasis in humans with high salt intake.
Water conservation in the body through modification of urea osmolyte synthesis mechanisms in response to increased salt intake involves not only the kidney urea recirculation process but also activation of urea osmolyte synthesis in the liver and muscle tissue, as shown in a study in mice subjected to a high-salt diet [6]. The study demonstrated that the urea content in the kidneys, liver, and muscles explains 87% of the variability in plasma urea levels in mice, with the liver contributing the most and the muscles the least. This indicates that the transport of urea osmolyte by the kidneys and the production of urea osmolyte in the liver and skeletal muscles are integrated physiological components. Considering the energy-intensive nature of urea synthesis, it has significant implications for energy metabolism with high salt intake, which can be observed under conditions of intensive diuretic therapy. Ishikawa et al. [21] showed that prolonged use of loop diuretics is associated with muscle wasting in patients with renal insufficiency.
In the work of S. Nihlen et al. [5], the hypothesis of a similarity was presented between the human body’s response to fluid loss and the aestivation response in animals. The study included 241 post-intensive care patients and showed that the increase in total osmolality during the period of reducing body hyperhydration is due to loss of free water and changes in osmolyte balance: a decrease in the sodium contribution and an increase in the urea contribution. These results suggest an aestivation mechanism similar to the body’s response to prolonged dehydration, influencing patient survival. In an intensive care unit study from the third to the seventh day, 177 patients (73%) received furosemide. The analysis showed that the correlation between the proportion of urea and effective osmolality on the seventh day after the adjusted cumulative dose of furosemide was r = 0.55. Among patients with and without renal replacement therapy, this figure was r = 0.54 and r = 0.55, respectively. In the subgroup without furosemide and renal replacement therapy (n = 17), the correlation reached r = 0.92. For patients treated with furosemide but without renal replacement therapy, the figure was r = 0.61. There was a shift in the osmolytes from sodium (Na+) and potassium (K+) to urea, i.e., from inorganic to organic osmolytes. This phenomenon was also present in patients with normal estimated glomerular filtration rate (eGFR), even after adjusting the model for eGFR. Finally, although the level and dynamics of osmolality during the 3-7 days of ICU stay were similar between survivors and nonsurvivors, the urea-to-effective osmolality ratio was higher in patients who did not survive 90 days after ICU admission.
In 2022, Hultström et al. [22] conducted a study analysing the effects of dehydration in patients with COVID-19, particularly examining the response to aestivation in the body and its impact on long-term disease outcomes. The results showed that metabolic aestivation in response to dehydration in patients with COVID-19 is associated with the severity of the disease. Metabolomic analysis identified amino acids with an aestivation profile, indicating muscle protein breakdown and the use of released amino acids for urea synthesis in the liver.
A study by C. Baumgartner et al. [23] examined the relationship between glycerophosphocholine (GPC), an organic osmolyte, and surrogate parameters of hydration status and osmolality in healthy individuals using non-invasive 31P-magnetic resonance spectroscopy of the calf and thigh muscles. In a sample of 30 volunteers, significant correlations were found between GPC levels and markers of fluid and electrolyte balance, such as uric acid (r = 0.437, P = 0.018) and urea (r = 0.387, P = 0.035). Multiple regression analysis revealed that GPC concentrations could predict changes in uric acid levels (R² = 0.462, adjusted R² = 0.421, P < 0.001), suggesting that the GPC content in skeletal muscles adapts in response to changes in fluid status.
A study by G. Rossitto et al. [24] demonstrated that in patients with hypertension, a high sodium intake (>5 g/day) is associated with an increased glomerular filtration rate (127.5 ml/min/1.73 m² versus 94.1 ml/min/1.73 m² with low sodium intake, P = 0.001) and increased renal energy expenditure for sodium reabsorption (difference of 18 kcal/day, P < 0.001), despite high fractional sodium excretion (0.81% versus 0.39%, P < 0.001) and low water excretion (0.89% versus 1.13%, P = 0.015). This leads to a catabolic shift and an increase in protein metabolism byproducts, which may elevate cardiovascular risk independently of blood pressure.
We hypothesised that the degree of aestivation might differ in patients on a diet with varying salt content undergoing intensive diuretic therapy. This is because patients on a long-term high-salt diet may have osmotically inactive sodium in muscle tissue [25]. In our previous work [26], we found a relationship between Na+ and negatively charged glycosaminoglycan (GAG) structures in rats on a high-salt diet. Therefore, we decided to investigate how excessive salt intake and intensive diuretic therapy in patients with CHF without ICU would affect the development of aestivation. In intensive diuretic therapy with sodium loss, partial replenishment can occur due to osmotically neutral sodium, so in our study, under a high-salt diet, the transition from inorganic (high sodium proportion) to organic osmolytes (high urea proportion) is more pronounced with a high-salt diet, whereas the effect is statistically insignificant with a diet containing less than 6 grams of salt per day. In our study, after 7 days of diuretic therapy, a statistically significant increase in the proportion of urea was observed (from 2.2% [1.8; 2.6] to 2.5% [1.9; 3.4], p = 0.15) and a decrease in the sodium proportion in plasma (from 46.4% [46.1; 46.8] to 46.3% [45.9; 46.7], p = 0.14) were observed. At the initial observation stage (first day), no statistically significant differences in plasma osmolality were found between the diuretics-receiving and nonduretics-recipient groups.
To our knowledge, this is the first study to show that in patients who consume more than 10 grams of salt per day and undergo intensive diuretic therapy, urea increases significantly (p < 0.05) compared to other groups. However, with diets consuming 6 to 10 grams of salt per day and less than 6 grams, changes in the proportion of urea and sodium did not reach statistical significance (p > 0.05).
5. Conclusions
The study confirmed the hypothesis that high salt intake and active diuretic therapy significantly influence the biochemical parameters of patients with chronic heart failure (CHF), contributing to the development of the aestivation phenomenon. This phenomenon is characterized by an increase in the proportion of nonionic osmolytes, such as urea, in blood plasma, potentially representing a physiological response to stress.
During the study, it was revealed that patients receiving diuretic therapy and consuming a high-salt diet exhibited notable changes in plasma osmolality and urea concentration, indicating an adaptation of their bodies to conditions akin to aestivation. These alterations may directly impact the overall condition of CHF patients and their prognosis, including an increased risk of sarcopenia and cachexia.
It is important to note that, despite statistically significant changes in biochemical parameters, further research is necessary to gain a deeper understanding of the mechanisms of aestivation in humans and to develop potential therapeutic strategies aimed at minimizing the negative effects of high salt intake and diuretic therapy in CHF patients.
Thus, the results of this study open new perspectives for understanding the relationships between diet, pharmacotherapy, and metabolic adaptations in CHF patients, underscoring the need for an individualized approach to treatment and lifestyle modification for these patients.
Author Contributions
Dmitrii Dragunov and Vadim Mitrokhin; methodology, Sokolova Anna; validation, Dmitrii Dragunov, Vadim Mitrokhin, and Arutyunov Grigory; formal analysis, Dmitrii Dragunov; investigation, Dmitrii Dragunov; resources, Arutyunov Grigory; data curation, Sokolova Anna; writing—original draft preparation, Dmitrii Dragunov; writing—review and editing, Sokolova Anna; supervision, Arutyunov Grigory; project administration, Dmitrii Dragunov;
Funding
This research received no external funding.
Institutional Review Board Statement
The study was conducted in accordance with the Declaration of Helsinki, and approved by the Ethics Committee of the Cardiology Department of GBUZ GVV No. 3 DZM (protocol code 4, 04.07. 2022]).
Informed Consent Statement
Informed consent was obtained from all subjects involved in the study.
Data Availability Statement
The data presented in this study are not publicly available due to privacy and confidentiality restrictions.
Acknowledgments
We would like to thank Cardiology Department of GBUZ GVV No. 3 DZM for their support and assistance in conducting this study.
Conflicts of Interest
Declare conflicts of interest or state “The authors declare no conflicts of interest.”
References
- Peacock, W.F.; et al. Impact of Intravenous Loop Diuretics on Outcomes of Patients Hospitalized with Acute Decompensated Heart Failure: Insights from the ADHERE Registry. Cardiology 2008, 113(1), 12–19. [Google Scholar] [CrossRef] [PubMed]
- Felker, G.M.; et al. Diuretic Strategies in Patients with Acute Decompensated Heart Failure. New England Journal of Medicine 2011, 364(9), 797–805. [Google Scholar] [CrossRef] [PubMed]
- Gupta, A.; et al. Obesity and the Response to Intensified Diuretic Treatment in Decompensated Heart Failure: A DOSE Trial Substudy. Journal of Cardiac Failure 2012, 18(11), 837–844. [Google Scholar] [CrossRef] [PubMed]
- Storey, K.B.; Storey, J.M. Aestivation: Signaling and Hypometabolism. Journal of Experimental Biology 2012, 215(9), 1425–1433. [Google Scholar] [CrossRef]
- Nihlén, S.; et al. The Contribution of Plasma Urea to Total Osmolality during Iatrogenic Fluid Reduction in Critically Ill Patients. Function 2021, 3(1), zqab055. [Google Scholar] [CrossRef]
- Delles, C.; Rossitto, G. Of Snails, Earthworms, and Men: Insights into Strategies to Preserve Water. Function 2021, 3(1), zqab071. [Google Scholar] [CrossRef]
- Haussinger, D.; Lang, F.; Gerok, W. Regulation of Cell Function by the Cellular Hydration State. American Journal of Physiology-Endocrinology and Metabolism 1994, 267(3), E343–E355. [Google Scholar] [CrossRef]
- Lerchl, K.; et al. Agreement Between 24-Hour Salt Ingestion and Sodium Excretion in a Controlled Environment. Hypertension 2015, 66(4), 850–857. [Google Scholar] [CrossRef]
- Titze, J.; et al. Reduced Osmotically Inactive Na Storage Capacity and Hypertension in the Dahl Model. American Journal of Physiology-Renal Physiology 2002, 283(1), F134–F141. [Google Scholar] [CrossRef]
- Titze, J.; et al. Osmotically Inactive Skin Na+ Storage in Rats. American Journal of Physiology-Renal Physiology 2003, 285(6), F1108–F1117. [Google Scholar] [CrossRef]
- Zuo, X.; et al. Sarcopenia and Cardiovascular Diseases: A Systematic Review and Meta-Analysis. Journal of Cachexia, Sarcopenia and Muscle 2023, 14(3), 1183–1198. [Google Scholar] [CrossRef] [PubMed]
- Russian Society of Cardiology (RSC). 2020 Clinical Practice Guidelines for Chronic Heart Failure. Russian Journal of Cardiology 2020, 25(11), 4083. [Google Scholar]
- Levey, A.S.; et al. A New Equation to Estimate Glomerular Filtration Rate. Annals of Internal Medicine 2009, 150(9), 604. [Google Scholar] [CrossRef]
- Clinical recommendations. Chronic kidney disease (CKD). Nephrology (Saint-Petersburg) 2021, 25(5), 10–82, (In Russ.).
- Austin, P.C. An Introduction to Propensity Score Methods for Reducing the Effects of Confounding in Observational Studies. Multivariate Behavioral Research 2011, 46(3), 399–424. [Google Scholar] [CrossRef]
- Ho, D.E.; et al. MatchIt: Nonparametric Preprocessing for Parametric Causal Inference. Journal of Statistical Software 2011, 42(8). [Google Scholar] [CrossRef]
- Kovarik, J.J.; et al. Adaptive Physiological Water Conservation Explains Hypertension and Muscle Catabolism in Experimental Chronic Renal Failure. Acta Physiologica (Oxford, England) 2021, 232(1), e13629. [Google Scholar] [CrossRef]
- Wilkie, M.P.; et al. The African Lungfish (Protopterus dolloi): Ionoregulation and Osmoregulation in a Fish out of Water. Physiological and Biochemical Zoology 2007, 80(1), 99–112. [Google Scholar] [CrossRef]
- Kitada, K.; et al. High Salt Intake Reprioritizes Osmolyte and Energy Metabolism for Body Fluid Conservation. The Journal of Clinical Investigation 2017, 127(5), 1944–1959. [Google Scholar] [CrossRef]
- Perucca, J.; et al. Sex Difference in Urine Concentration Across Differing Ages, Sodium Intake, and Level of Kidney Disease. American Journal of Physiology-Regulatory, Integrative and Comparative Physiology 2007, 292(2), R700–705. [Google Scholar] [CrossRef]
- Ishikawa, S.; et al. Loop Diuretics Are Associated with Greater Risk of Sarcopenia in Patients with Non-Dialysis-Dependent Chronic Kidney Disease. PLOS ONE 2018, 13(2), e0192990. [Google Scholar] [CrossRef] [PubMed]
- Hultström, M.; et al. Dehydration Is Associated with Production of Organic Osmolytes and Predicts Physical Long-Term Symptoms After COVID-19: A Multicenter Cohort Study. Journal 2021.
- Baumgartner, C., Wolf, P., Beiglböck, H., Pfleger, L., Fellinger, P., Heitzinger, G., Metz, M., Leutner, M., Kautzky-Willer, A., Krššák, M., et al. (2023). Potential role of skeletal muscle glycerophosphocholine in response to altered fluid balance in humans: an in vivo nuclear magnetic resonance study. American Journal of Physiology-Endocrinology and Metabolism 324, E339–E346. [CrossRef]
- Rossitto, G., Maiolino, G., Lerco, S., Ceolotto, G., Blackburn, G., Mary, S., Antonelli, G., Berton, C., Bisogni, V., Cesari, M., et al. (2020). High sodium intake, glomerular hyperfiltration, and protein catabolism in patients with essential hypertension. Cardiovasc Res 117, 1372–1381. [CrossRef]
- Wiig, H.; Luft, F.C.; Titze, J.M. The Interstitium Conducts Extrarenal Storage of Sodium and Represents a Third Compartment Essential for Extracellular Volume and Blood Pressure Homeostasis. Acta Physiologica 2018, 222(3), e13006. [Google Scholar] [CrossRef]
- Artyukov, I.; et al. The First Observation of Osmotically Neutral Sodium Accumulation in the Myocardial Interstitium. Scientific Reports 2021, 11(1), 22025. [Google Scholar] [CrossRef] [PubMed]
Figure 1.
Research design.
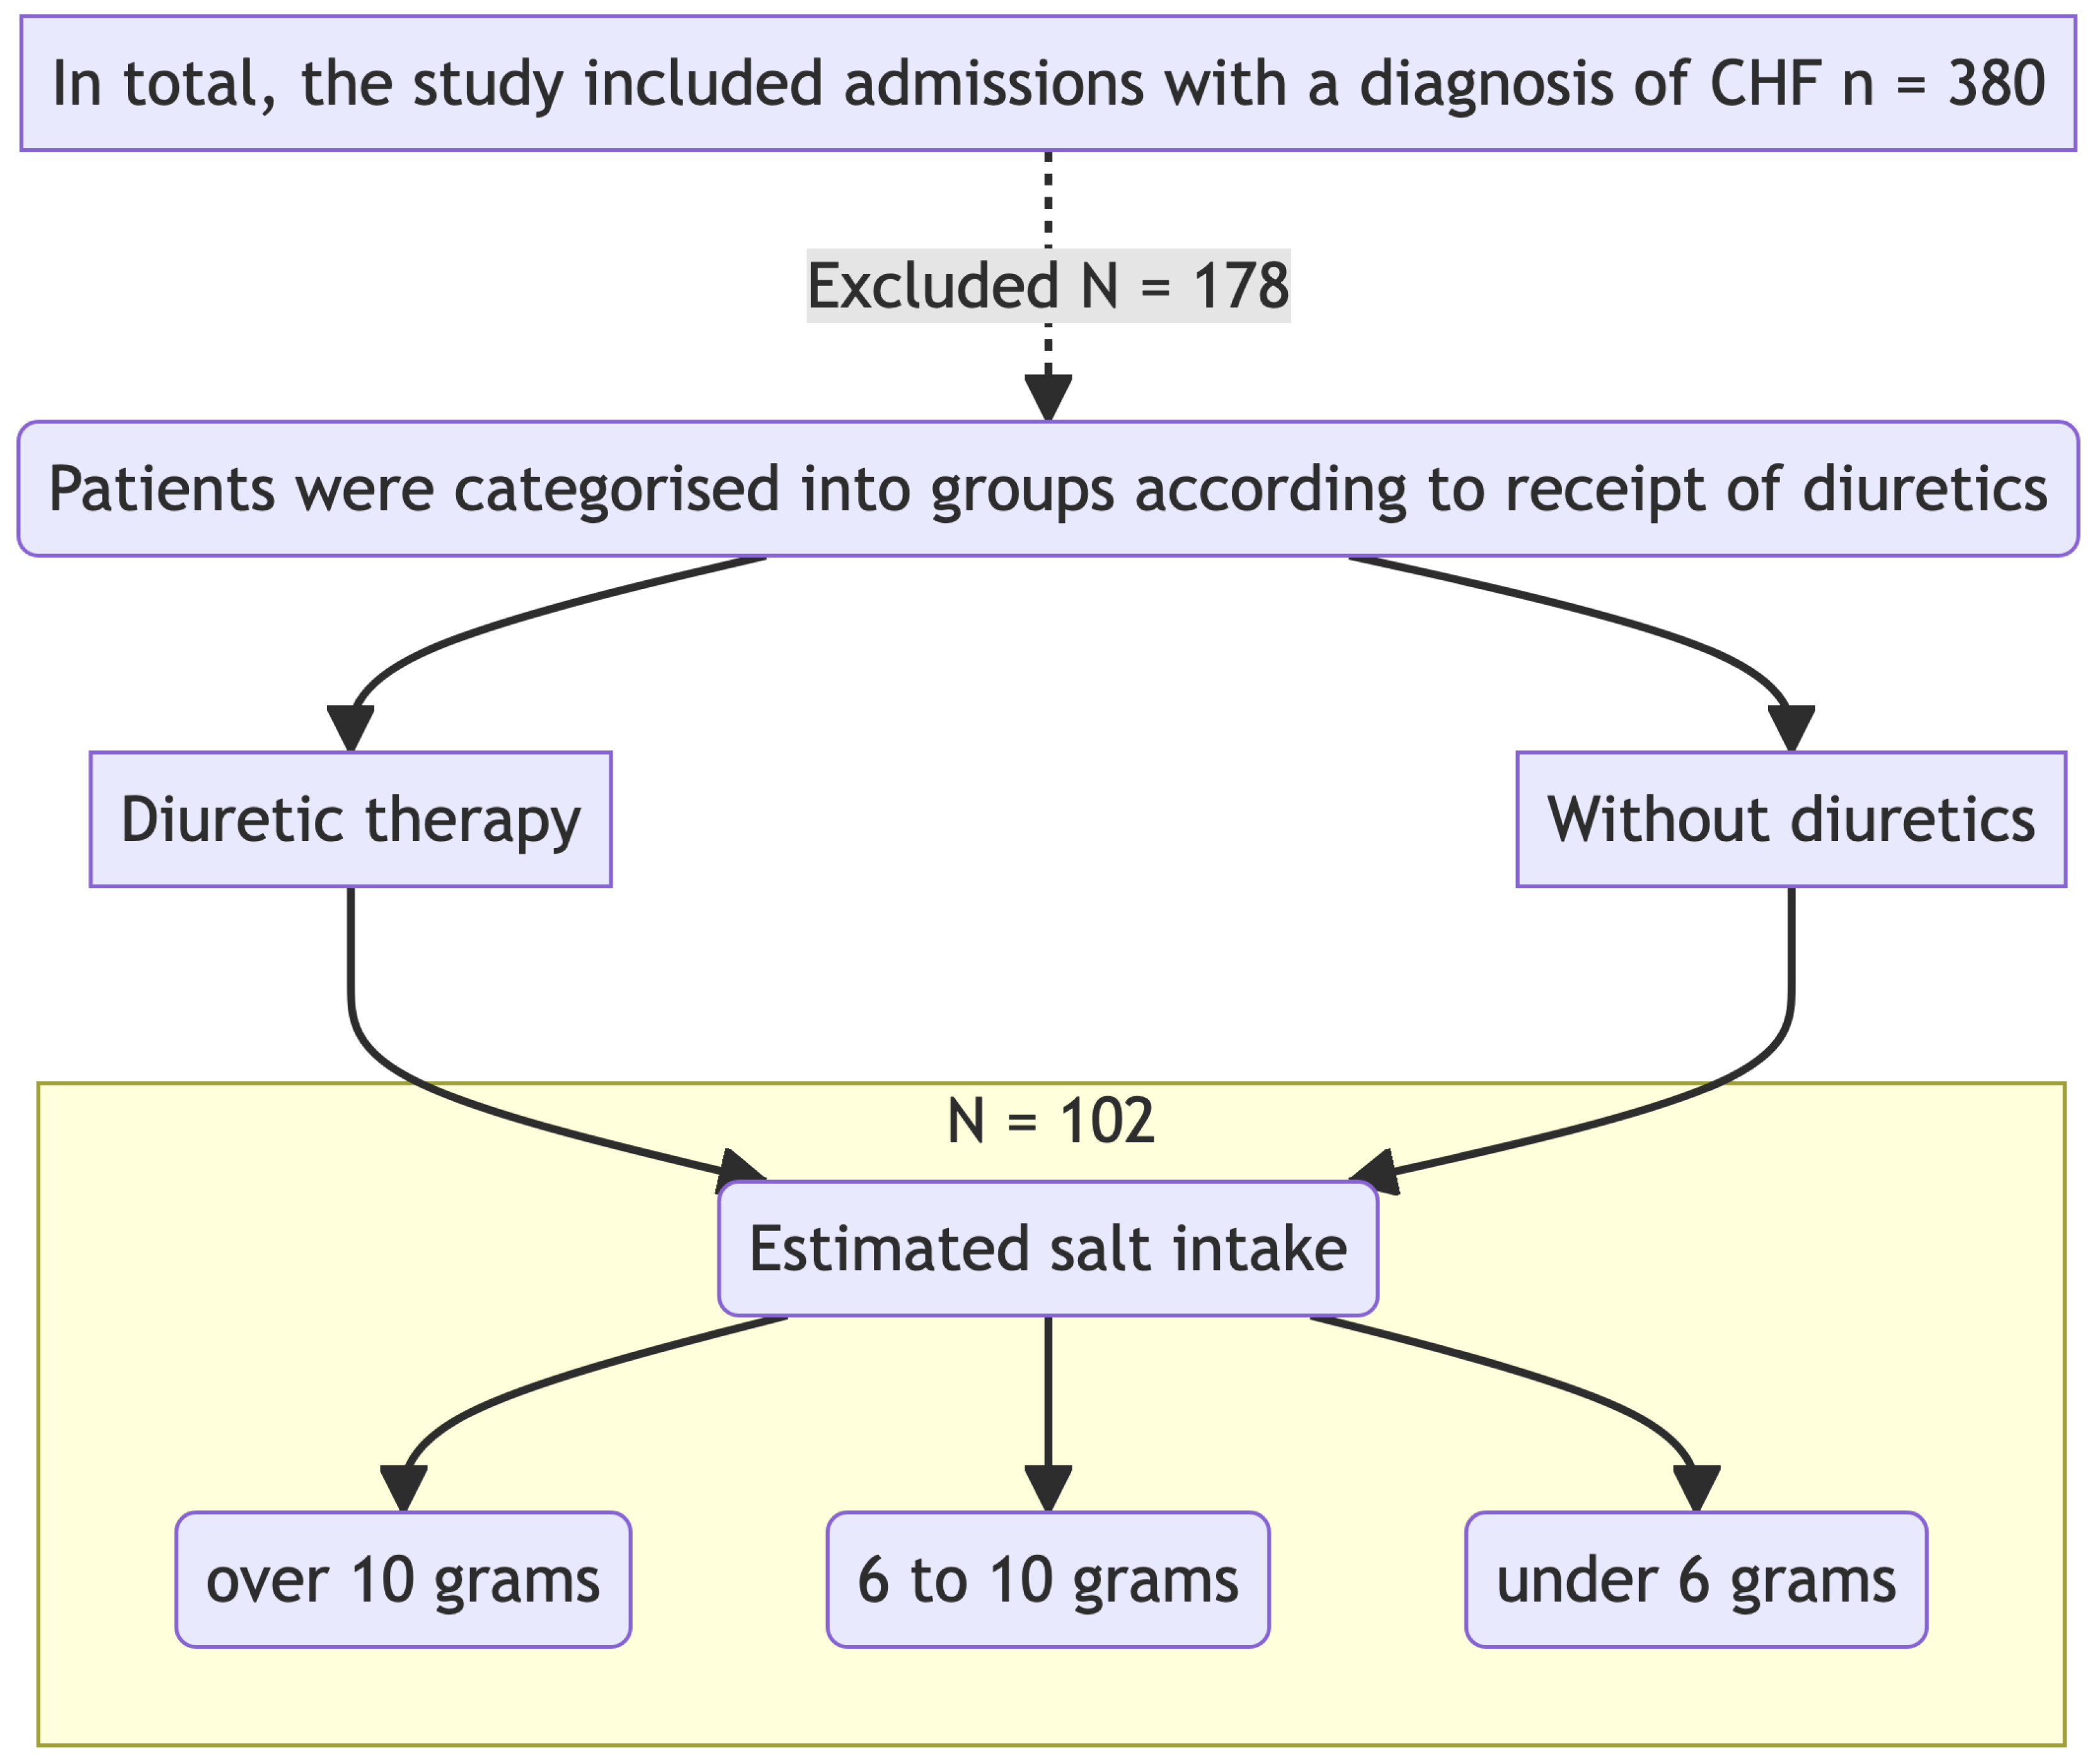
Figure 2.
Changes in the ratio of osmolytes in plasma on the 7th day of diuretic therapy are detailed as follows: А - Osmolarity to urea ratio B - Osmolarity to sodium ratio С - Osmolarity to potassium ratio D - Osmolarity to glucose ratio.
Figure 2.
Changes in the ratio of osmolytes in plasma on the 7th day of diuretic therapy are detailed as follows: А - Osmolarity to urea ratio B - Osmolarity to sodium ratio С - Osmolarity to potassium ratio D - Osmolarity to glucose ratio.
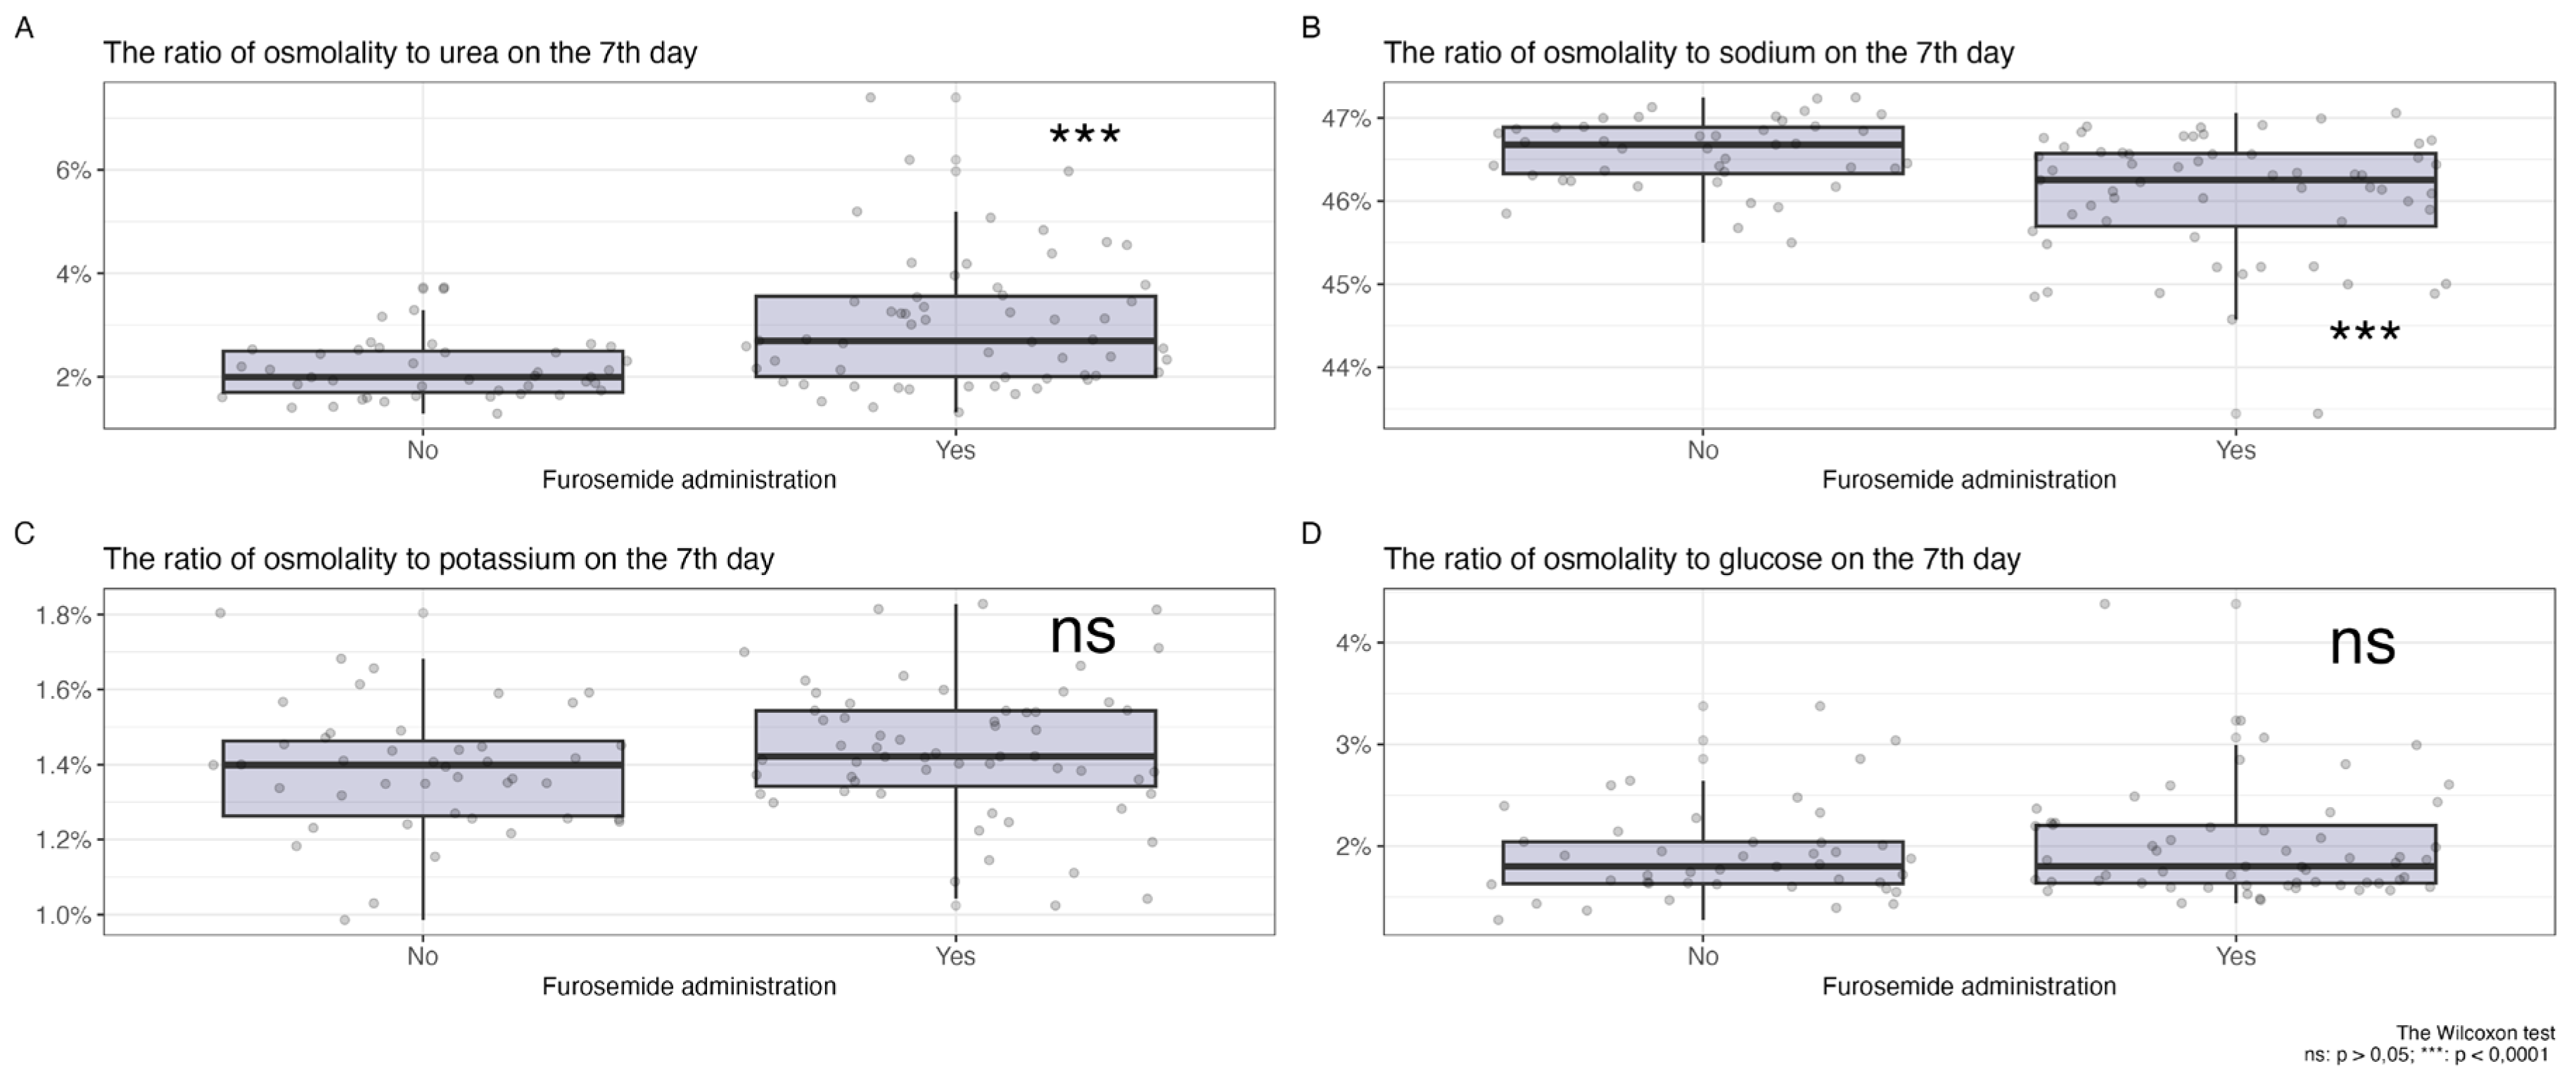
Figure 3.
Relationship of osmolytes with the level of salt intake, A - Ratio of urea to plasma osmolarity among patients with varying levels of salt intake, B - Ratio of sodium to plasma osmolarity among patients with varying levels of salt intake, C - Correlation of the ratios of urea and sodium to plasma osmolarity among patients with different levels of salt intake undergoing diuretic therapy over 7 days, D - Correlation of the ratios of urea and sodium to plasma osmolarity among patients with different levels of salt intake on the first day of the study without diuretics, E - Salt intake in the diuretic therapy group (red column) and without diuretics (green column).
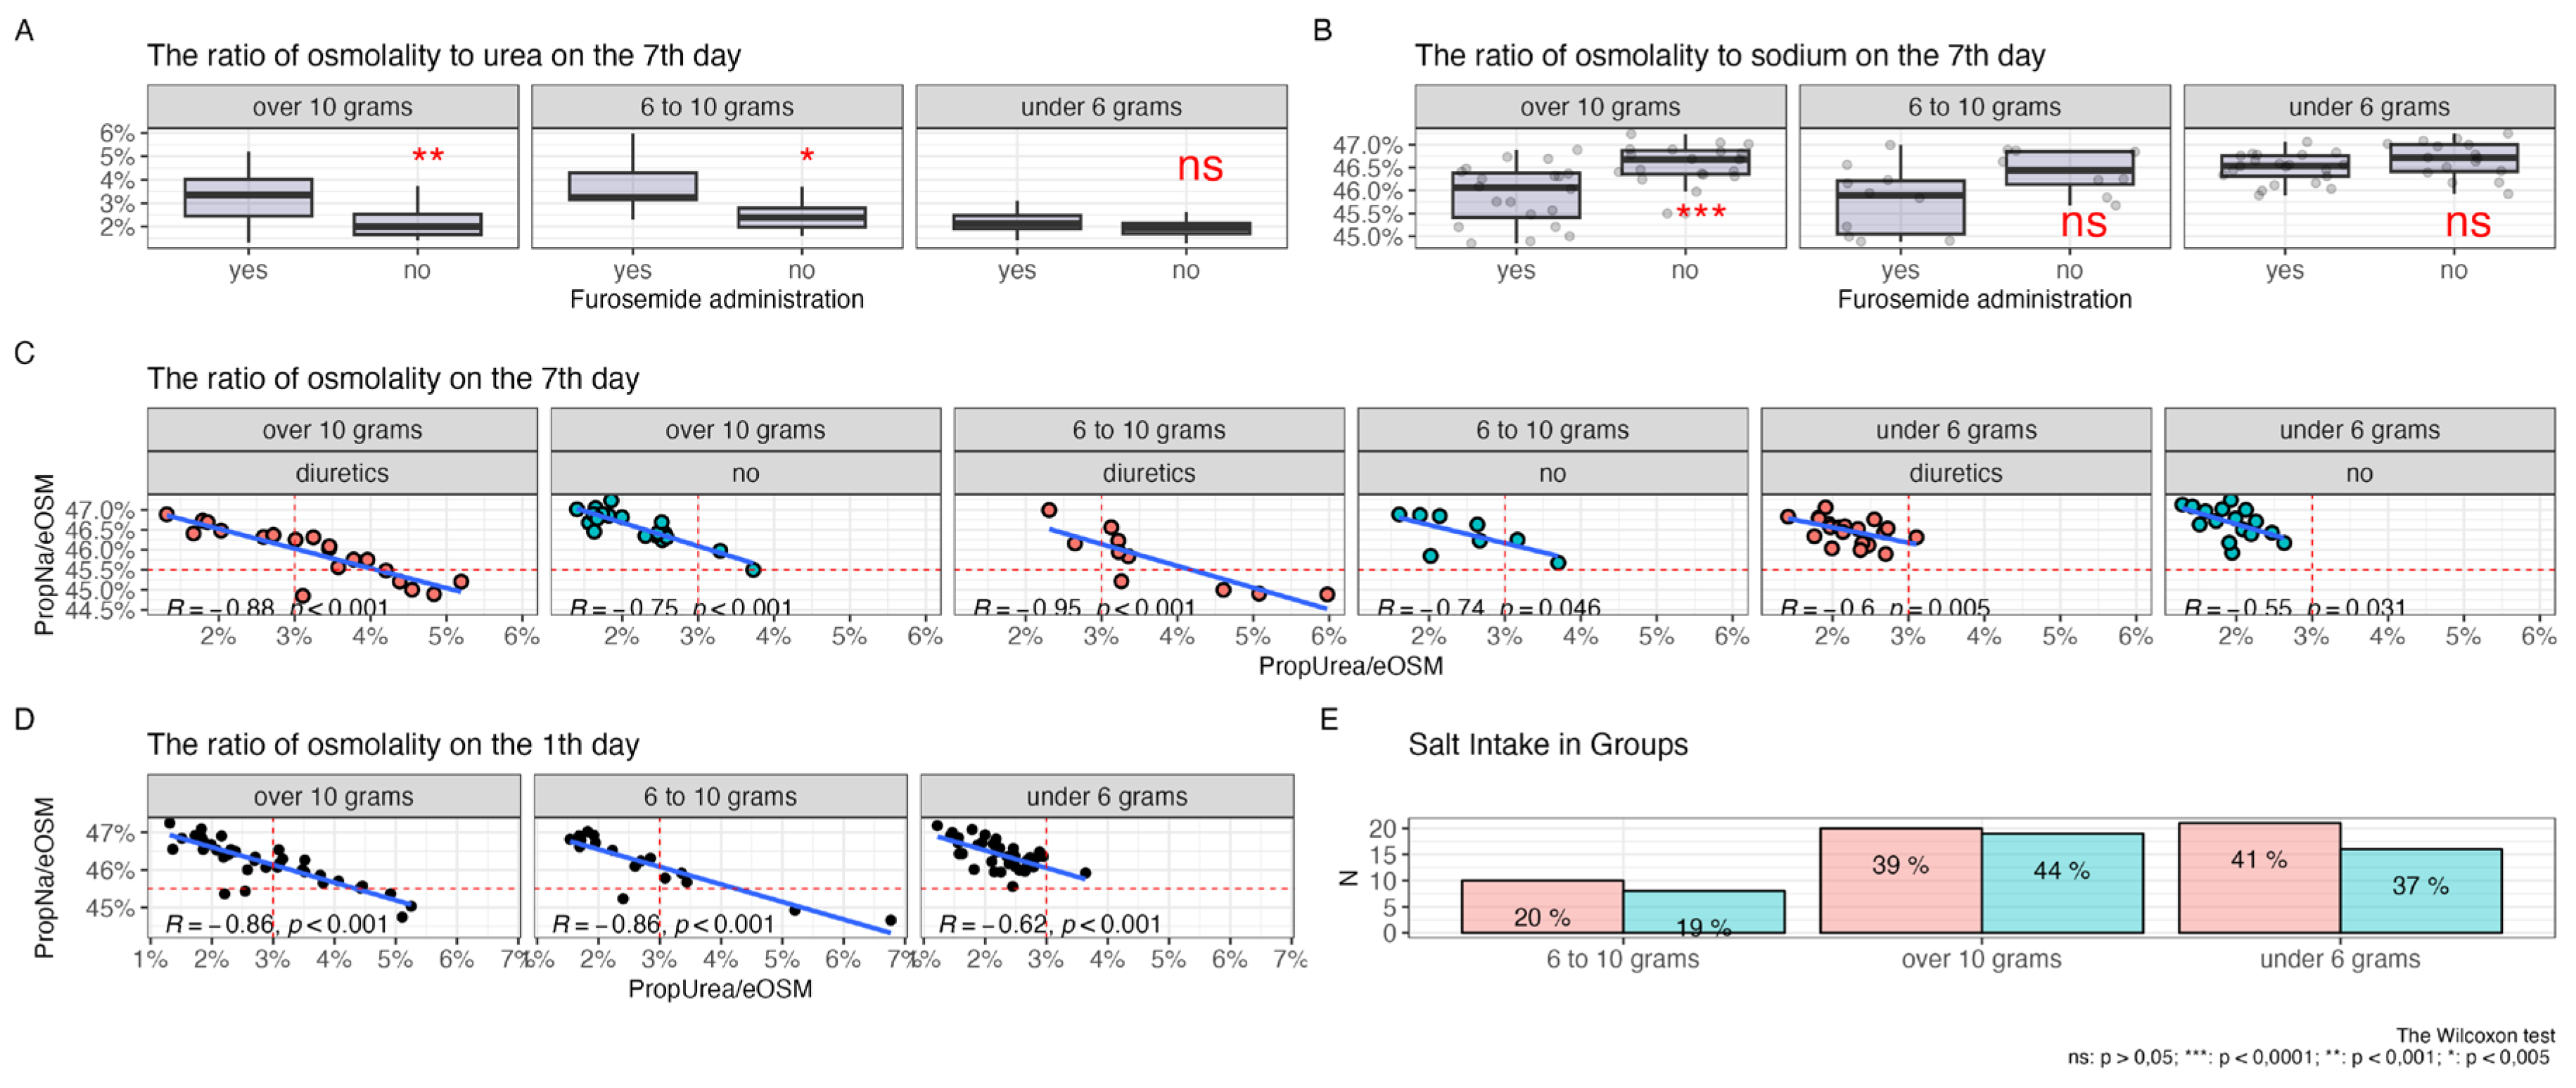

Table 1.
Inclusion and Exclusion Criteria.
| Inclusion Criteria | Exclusion Criteria |
|---|---|
| Presence of an established diagnosis of CHF | Unlikely cooperation with the patient during the trial, low adherence to therapy for social, psychological, economic, and other reasons, incapacity |
| Stable therapy for 3 months prior to inclusion in the study | Patients with cancer who are on radiation therapy or chemotherapy |
| Stable therapy with ACE inhibitors/ARBs, beta-blockers for 3 weeks prior to hospitalization | Need to be in the intensive care unit at the time of admission |
| Signing voluntary informed consent | Any severe, decompensated, or unstable somatic disease or condition that, in the opinion of the investigator, threatens the life of the patient or worsens the prognosis (including anemia, autoimmune, endocrinological, etc.) |
| Constant salt intake according to the food diary during the week before hospitalization | Abuse of alcohol, drugs, or medicines |
| No loop diuretic therapy prior to inclusion in the study for 2 weeks | Taking thiazide or thiazide-like diuretics |
Table 2.
Clinical characteristics of patients in the group who received diuretics and those who did not received diuretics.
Table 2.
Clinical characteristics of patients in the group who received diuretics and those who did not received diuretics.
| Characteristic | Patients Receiving Diuretics, N = 591 | Patients Not Receiving Diuretics, N = 431 | p-value2 |
|---|---|---|---|
| Age in years, median [Q25;Q75] | 81 (72, 84) | 73 (67, 79) | 0.011 |
| Gender | >0.9 | ||
| Female (%) | 34 (58%) | 25 (58%) | |
| Male (%) | 25 (42%) | 18 (42%) | |
| Sodium 1 day (mMol/L) | 139.0 (137.2, 140.6) | 138.8 (137.2, 140.7) | >0.9 |
| Potassium 1 day (mMol/L) | 4.01 (3.90, 4.32) | 3.97 (3.71, 4.29) | 0.3 |
| Urea 1 day (mMol/L) | 7.4 (5.6, 10.0) | 6.6 (5.5, 8.0) | 0.15 |
| Glucose 1 day (mMol/L) | 5.81 (5.39, 6.99) | 5.91 (5.39, 7.09) | 0.7 |
| Sodium day 7 (mMol/L) | 139.50 (138.50, 141.25) | 139.80 (138.45, 141.20) | 0.9 |
| Potassium day 7 (mMol/L) | 4.36 (4.08, 4.70) | 4.12 (3.77, 4.42) | 0.042 |
| Urea day 7 (mMol/L) | 8.2 (6.1, 10.8) | 5.9 (5.1, 7.5) | <0.001 |
| Glucose day 7 (mMol/L) | 5.47 (4.94, 6.60) | 5.33 (4.87, 6.25) | 0.5 |
| Functional class of CHF (NYHA) | <0.001 | ||
| NYHA I | 5 (8.5%) | 18 (42%) | |
| NYHA II | 27 (46%) | 25 (58%) | |
| NYHA III | 26 (44%) | 0 (0%) | |
| NYHA IV | 1 (1.7%) | 0 (0%) | |
| Ejection fraction (%) | 51 (47, 52) | 52 (50, 52) | 0.049 |
| Estimated osmolarity on day 1 (mOsm/L) | 300 (297, 304) | 299 (296, 302) | 0.5 |
| Estimated osmolarity on day 7 (mOsm/L) | 302.2 (298.3, 305.8) | 300.2 (295.9, 303.5) | 0.039 |
| Estimated glomerular filtration rate (ml/min/1.73 m2) | 50 (40, 59) | 56 (48, 65) | 0.021 |
| Albumin (g/l) | 39.2 (37.1, 40.8) | 39.2 (37.0, 41.4) | 0.8 |
| Total protein (g/l) | 67.8 (65.1, 71.0) | 68.5 (64.8, 71.5) | >0.9 |
| ALT (U/L) | 18 (12, 29) | 17 (13, 23) | 0.5 |
| AST (U/L) | 20 (16, 29) | 20 (18, 25) | 0.8 |
| HDL (mMol/L) | 1.31 (1.17, 1.45) | 1.26 (1.06, 1.34) | 0.2 |
| LDL (mMol/L) | 2.80 (2.18, 3.29) | 2.63 (2.20, 3.27) | >0.9 |
| Triglycerides (mMol/L) | 1.30 (0.91, 1.71) | 1.27 (0.85, 1.84) | 0.9 |
| Cholesterol (mMol/L) | 4.50 (3.64, 5.40) | 4.60 (3.50, 5.45) | >0.9 |
| CRP (mg/L) | 5 (3, 10) | 5 (2, 8) | 0.3 |
| Diabetes mellitus | 0.7 | ||
| No (%) | 39 (66%) | 30 (70%) | |
| Yes (%) | 20 (34%) | 13 (30%) | |
| CKD (stage) | 0.025 | ||
| C1 | 0 (0%) | 1 (2.3%) | |
| C2 | 1 (1.7%) | 5 (12%) | |
| C3a | 24 (41%) | 23 (53%) | |
| C3b | 16 (27%) | 4 (9.3%) | |
| C4 | 5 (8.5%) | 1 (2.3%) | |
| no | 13 (22%) | 9 (21%) | |
| 1Median (IQR); n (%) | |||
| 2Wilcoxon rank sum test; Pearson’s Chi-squared test; Fisher’s exact test | |||
Table 3.
Group differences after Propensity Score Matchin.
| Characteristic | Patients Receiving Diuretics, N = 311 | Patients Not Receiving Diuretics, N = 431 | p-value2 |
|---|---|---|---|
| Age (years) | 73 (65, 77) | 73 (67, 79) | 0.6 |
| Ejection fraction (%) | 52.0 (50.0, 53.0) | 52.0 (50.0, 52.0) | 0.8 |
| Estimated glomerular filtration rate (ml/min/1.73 m2) | 55 (49, 66) | 56 (48, 65) | 0.7 |
| CKD (stage) | 0.2 | ||
| C1 | 0 (0%) | 1 (2.3%) | |
| C2 | 1 (3.2%) | 5 (12%) | |
| C3a | 13 (42%) | 23 (53%) | |
| C3b | 4 (13%) | 4 (9.3%) | |
| C4 | 0 (0%) | 1 (2.3%) | |
| нет | 13 (42%) | 9 (21%) | |
| 1Median (IQR); n (%) | |||
| 2Wilcoxon rank sum test; Wilcoxon rank sum exact test; Fisher’s exact test | |||
Table 4.
Relationship of osmolytes with salt intake after pseudorandomization by the PSM method.
| Characteristic | Patients Receiving Diuretics, N = 281 | Patients Not Receiving Diuretics, N = 431 | p-value2 |
|---|---|---|---|
| Sodium day 1 (mMol/L) | 138.90 (137.33, 140.53) | 138.80 (137.20, 140.70) | >0.9 |
| Potassium day 1 (mMol/L) | 3.97 (3.90, 4.07) | 3.97 (3.71, 4.29) | >0.9 |
| Glucose day 1 (mMol/L) | 5.81 (5.40, 6.67) | 5.91 (5.39, 7.09) | 0.6 |
| Urea day 1 (mMol/L) | 6.45 (5.15, 8.10) | 6.60 (5.50, 7.95) | 0.6 |
| Sodium day 7 (mMol/L) | 139.40 (138.58, 140.93) | 139.80 (138.45, 141.20) | 0.8 |
| Potassium day 7 (mMol/L) | 4.23 (4.02, 4.46) | 4.12 (3.77, 4.42) | 0.7 |
| Glucose day 7 (mMol/L) | 5.26 (4.78, 6.52) | 5.33 (4.87, 6.25) | 0.9 |
| Urea day 7 (mMol/L) | 7.95 (5.65, 9.90) | 5.90 (5.05, 7.50) | 0.012 |
| Urea to osmolarity ratio (%) | 2.63 (1.89, 3.28) | 2.00 (1.70, 2.50) | 0.011 |
| Sodium to osmolarity ratio (%) | 46.46 (46.02, 46.74) | 46.68 (46.33, 46.89) | 0.050 |
| Potassium to osmolarity ratio (%) | 1.40 (1.32, 1.49) | 1.40 (1.26, 1.46) | 0.8 |
| Glucose to osmolarity ratio (%) | 1.74 (1.59, 2.19) | 1.80 (1.63, 2.04) | 0.9 |
| 1Median (IQR) | |||
| 2Wilcoxon rank sum test; Wilcoxon rank sum exact test | |||
Table 5.
The Relationship Between Diuretic Use and Osmolarity.
| Model 1 | Model 2 | Model 3 | Model 4 | |||||||||
|---|---|---|---|---|---|---|---|---|---|---|---|---|
| Переменные | OR1 | 95% CI1 | p-value | OR1 | 95% CI1 | p-value | OR1 | 95% CI1 | p-value | OR1 | 95% CI1 | p-value |
| PropK/eOSM | 6.45 | 0.62, 78.3 | 0.12 | |||||||||
| Salt intake | 0.5 | 0.6 | 0.2 | 0.3 | ||||||||
| over 10 grams | — | — | — | — | — | — | — | — | ||||
| 6 to 10 grams | 1.68 | 0.68, 4.20 | 1.51 | 0.62, 3.71 | 2.65 | 0.97, 7.71 | 2.29 | 0.86, 6.39 | ||||
| under 6 grams | 1.70 | 0.57, 5.30 | 1.54 | 0.53, 4.69 | 1.39 | 0.40, 4.88 | 1.54 | 0.46, 5.38 | ||||
| PropGlucose/eOSM. | 1.32 | 0.60, 3.13 | 0.5 | |||||||||
| PropUrea/eOSM | 3.52 | 1.94, 7.26 | <0.001 | |||||||||
| PropNa/eOSM | 0.16 | 0.06, 0.39 | <0.001 | |||||||||
| AIC | 143 | 145 | 124 | 126 | ||||||||
| 1OR = Odds Ratio, CI = Confidence Interval | ||||||||||||
Disclaimer/Publisher’s Note: The statements, opinions and data contained in all publications are solely those of the individual author(s) and contributor(s) and not of MDPI and/or the editor(s). MDPI and/or the editor(s) disclaim responsibility for any injury to people or property resulting from any ideas, methods, instructions or products referred to in the content. |
© 2024 by the authors. Licensee MDPI, Basel, Switzerland. This article is an open access article distributed under the terms and conditions of the Creative Commons Attribution (CC BY) license (https://creativecommons.org/licenses/by/4.0/).
Copyright: This open access article is published under a Creative Commons CC BY 4.0 license, which permit the free download, distribution, and reuse, provided that the author and preprint are cited in any reuse.


