Submitted:
15 October 2024
Posted:
16 October 2024
You are already at the latest version
Abstract
This study explores the application of the BPM lifecycle to optimize the Market Analysis process within the Market Intelligence department of a major energy company. The semi-structured, virtual nature of the process necessitated careful adaptation of BPM methodology, starting with process discovery through data collection, modeling, and validation. Qualitative analysis, including value-added and root-cause analysis, revealed inefficiencies. The redesign strategy focused on selective automation using Python scripts and Power BI dashboards, incorporating techniques such as linear programming and forecasting to improve process efficiency and quality while maintaining flexibility. Post-implementation, monitoring through a questionnaire showed positive results, though ongoing interviews were recommended for sustained performance evaluation. This study highlights the value of BPM methodology in enhancing decision-critical processes and offers a model for adaptable, value-driven process improvements in complex organizational environments.
Keywords:
BPM
; BPMN
; Process Automation
; Process Standardization
; Power BI
; Data Extraction
1. Introduction
Business Process Management (BPM) methodologies are crucial in both scientific disciplines and business applications. The increasing complexity of modern, virtual processes has amplified the importance of BPM. This study focuses on a leading company in the energy sector, engaged in the fuel market and renewable energies, this case study delves into the analysis of the Market Intelligence department's processes, which provides decision-making support to other departments and primarily to the executive committee (strategic level), where significant challenges in market analysis processes have been identified. These issues, if unresolved, could severely impact the efficiency of the supply chain network. Applying BPM to these unstructured and virtual processes aims to enhance decision-making and operational performance. This research is both timely and necessary, addressing critical issues that could affect strategic objectives.
Digital transformation is reshaping operations, business models, services, and IT structures across various sectors [1]. Industry 4.0 technologies are pivotal in improving supply chain efficiency and adaptability [2]. BPM, particularly through tools like BPMN, is essential for formalizing procedural knowledge and enhancing knowledge management [3]. However, evolving business processes present challenges in modeling responses to unforeseen deviations [4]. Integrating knowledge management with digitalization, facilitated by BPMN, can enhance decision-making and economic sustainability, improving operational efficiency and achieving organizational goals through repeatable processes involving human resources, machinery, and information systems, with a strong emphasis on transparency [5,6]. It integrates discovery, modeling, analysis, and automation, enabling data-driven decision-making aligned with evolving technologies and strategies [7].
While BPM offers many benefits, it faces challenges in dynamic, knowledge-intensive environments [8]. Research underscores the importance of supportive cultures and strategic alignment for success [9,10]. Technologies like IoT, AI, and blockchain enhance BPM, driving innovation and competitive advantages in Industry 4.0 [11,12].
UML, like BPMN, serves as a crucial tool for modeling complex systems, initially designed for software engineering, has evolved to model business processes and organizational structures. Key diagrams such as class, sequence, and activity diagrams provide various perspectives for system analysis and design, helping bridge the gap between business requirements and technical implementation [13,14]. Its standardized notation and adaptability make UML a valuable tool across industries, supporting collaboration and iterative development in both software and business process modeling [15].
This research addresses the gap in applying BPM to highly variable and semi-unstructured virtual processes, especially in Portugal. Additionally, the topic of biofuels and the targets set by the Portuguese government is underrepresented in academic literature. The author's interest in BPM and the Portuguese energy sector, combined with prior engagement with this company, provides a strong foundation for this study, which aims to address practical challenges and opportunities.
This study aims to apply BPM methodologies to virtual and unstructured Market Analysis process, identifying and addressing specific challenges using modern technological tools. The key research questions include: How can BPM methodologies be effectively applied to virtual and unstructured processes? What specific challenges exist within PRIO's current Market Analysis process? How can these challenges be mitigated or resolved using modern technological solutions? What measurable improvements can be achieved in process efficiency and effectiveness after implementing BPM-driven changes? This research bridges the gap between theory and practice, demonstrating BPM's applicability in virtual contexts and offering insights into its implementation in the Portuguese energy sector, particularly regarding biofuels.
The fuel sector plays a critical role in global economies by supplying energy essential for transportation, industry, and residential needs. As this sector evolves, aligning with the United Nations' Sustainable Development Goals (SDGs) becomes increasingly important. Goals such as Affordable and Clean Energy (SDG 7), Climate Action (SDG 13), and Responsible Consumption and Production (SDG 12) are pivotal in mitigating environmental impacts and promoting sustainable practices [16].
In Portugal, the biofuels market is heavily influenced by national and EU legislation aimed at integrating sustainable fuels into the road transport sector. Regulations mandate significant biofuel incorporation into gasoline and diesel, promoting energy security and reducing greenhouse gas emissions [17]. Producers, importers, and regulatory bodies like the National Laboratory of Energy and Geology (LNEG) ensure biofuels meet stringent sustainability criteria before issuance of Biofuel Titles (TdB), certifying their environmental performance [18].
2. Materials and Methods
The chosen methodology to improve the process was the BPM (Business Process Management) life cycle. This systematic framework enables thorough analysis, strategic improvement identification, and ongoing refinement of business processes. Its adaptability ensures optimized workflows and a culture of continuous enhancement. The BPM lifecycle includes stages such as process identification, analysis, redesign, implementation, monitoring, and optimization. This methodology helps organizations identify inefficiencies, streamline operations, and enhance overall performance. It fosters collaboration and communication among stakeholders, ensuring a shared understanding of process goals and objectives. By continuously monitoring and optimizing processes, organizations can adapt to changing market conditions, customer needs, and technological advancements. This iterative approach ensures that processes remain aligned with organizational objectives and responsive to evolving business requirements. Additionally, documenting processes and performance metrics promotes transparency and accountability, fostering a culture where individuals take ownership of their roles and responsibilities in achieving process excellence.
2.1. Process Identification
This chapter is dedicated to process identification, which has been divided into two main parts: Process Architecture and Process Selection. Firstly, Process Architecture was explored, aiming to uncover the interconnected web of processes within an organization. This provided insights into the workflows and dependencies. Following that, Process Selection was delved into, where strategic discernment was used to prioritize processes for management and improvement efforts.
To define the architecture of the processes, a Process Landscape Model was developed using three phases, Process Registration, Process Categorization and Process Relationships, as proposed by [19].
In the initial phase a theoretical analysis was conducted through structured and semi-structured interviews with department employees and other related departments, providing a comprehensive view of the department's operations. This was complemented by a documentary analysis of procedure manuals, organizational policies, and existing flowcharts, which helped identify gaps or inconsistencies in the documented processes.
Following this, a practical analysis was performed involving direct observation in the workplace. This validated the previously identified processes and uncovered any overlooked ones. Interviews were conducted weekly, while practical observations were continuous throughout the company's presence, resulting in a detailed compilation of the process list.
In a second phase, the identified processes were categorized according to a variation of Porter's Value Chain model [20], adding the two proposed base categories, Support Processes and Core Processes and all relationships among the processes were identified, thus enabling the creation of the process landscape model presented in Figure 1.
The process selection aimed to establish criteria for evaluating business process effectiveness, focusing on performance metrics like Time, Quality, Flexibility, and Strategic Importance. Initially, categories such as Cost were considered but later excluded due to complexity.
In the first stage, a QuickSort algorithm was used to compare processes, but it was replaced due to limitations in handling qualitative data. The second stage adopted the Analytic Hierarchy Process (AHP) for prioritizing processes. AHP uses a hierarchical structure and comparison matrices for decision-making, providing precise and reliable results. Based on AHP outcomes, the top three prioritized subprocesses, plus one additional due to resource availability, were selected for improvement, Table 1.
2.2. Process Discovery
The process discovery was broken down into four distinct tasks:
- Defining the Setting - Building a team within the company that includes Process Analysts responsible for analyzing and modeling processes using BPMN. Domain Experts, who have practical knowledge but may lack modeling skills, also play a crucial role;
- Gathering Information - Employing three main methods: Evidence-Based Discovery, Interview-Based Discovery, and Workshop-Based Discovery. Document analysis and observation provide initial insights, complemented by interviews with various stakeholders to capture different perspectives and scenarios;
- Conducting the Modeling Task - Creating the initial As-Is BPMN model to capture process boundaries, activities, control flow, and additional elements like business objects and exceptions. This prototype serves as a foundational structure for further refinement;
- Assuring Process Model Quality - Ensuring compliance with BPMN syntactic rules and behavioral rules to prevent anomalies like deadlocks. Validating the model against real-world processes for semantic accuracy and ensuring it is pragmatic for end-users. Continuous improvement cycles refine the model based on feedback and new information.
This systematic approach to process discovery ensures that the resulting process model accurately reflects real-world operations, supporting informed decision-making and process improvements within the organization. After several iterations of the cycle, the AS-IS model depicted in Figure 2 was obtained.
2.3. Process Analysis
This stage identifies and documents process issues, prioritizing them based on impact and effort needed for resolution. Due to the non-operational nature of the process, the focus was on qualitative analysis using methodologies like Value-Added Analysis and Waste Analysis.
Value-Added Analysis classified steps as Value-Adding (VA), Business Value-Adding (BVA), or Non-Value-Adding (NVA), highlighting areas for improvement, Table 2.
Waste Analysis focused on identifying inefficiencies throughout the process using principles from Ohno Muda, categorizing waste into:
- Move wastes (e.g., unnecessary document exchanges);
- Hold wastes (e.g., work-in-process delays);
- Overdo wastes (e.g., defects and overprocessing).
2.4. Process Redesign
Process redesign plays a pivotal role in enhancing business operations by introducing changes, whether incremental or radical, to existing processes. It encompasses adjustments across operational and behavioral dimensions, as well as interactions with organizational, external environmental, information, technological, and customer product factors.
In business process redesign, the Devil’s Quadrangle framework helps outline improvement goals across four key dimensions: time, cost, quality, and flexibility. While the ideal scenario involves enhancing all dimensions simultaneously, improvements in one dimension often come at the expense of others. For instance, improving quality might increase time, and enhancing flexibility could raise costs. Achieving effective redesign necessitates balancing these dimensions to align with strategic objectives, ensuring sustainable improvements in overall performance, Figure 3.
The BPMN TO-BE model illustrates the future state of a business process after redesign, acting as a blueprint for improvements in efficiency, cost-effectiveness, quality, and flexibility. By comparing the TO-BE model with the current AS-IS process, organizations can pinpoint required changes and measure the benefits of optimization. The new model reflects the implemented process improvements, as shown in Figure 4.
2.5. Process Implementation
The Process Implementation phase is key to turning strategic plans into actionable steps. It involves detailed planning and coordination to ensure smooth execution. After process improvements, data is collected from various internal and external sources in different formats (e.g., websites, Excel, images, PDFs). Data is stored manually or automatically using Python scripts, then standardized into CSV files linked to descriptions. Power BI integrates these CSV files for visualization, and reports can be converted to static PDFs if needed.
Unified Modeling Language was used for structured visual representation, helping to describe system behavior and identify improvement opportunities. The Use Case Diagram., Figure 5, helped to outline actors, goals, and interactions, guiding the development of focused tools. The Sequence Diagram, Figure 5, helped to visualize interactions between users and the system, allowing for analysis of system behavior in a specific scenario.
Although Power BI was initially used for visualization, specific needs led to external interfaces in Excel due to Python's complexity and user familiarity issues. The Package Diagram, Figure 6, shows the organization of system components, while the Component Diagram, Figure 6, details interactions between software elements like Power BI, CSV data, and Python scripts.
2.6. Process Monitoring
Post redesign, data collection and analysis assess the process's alignment with set objectives. Identifying issues prompts corrective action. As the system evolves, a continuous cycle of analysis and improvement ensures ongoing optimization across interconnected processes [19].
Quarterly evaluation meetings have been proposed for the tool, allowing process collaborators to discuss its results and determine future steps for improvement to better align with reality.
An additional dashboard, Figure 7, was created to display the tool's average assessments, considering the qualitative questionnaire used for evaluation, as shown subsequently in the 3.3. Validation section. It is suggested that this questionnaire be periodically filled out during analyses to track the tool's capacity evolution.
3. Results
The tool was developed with key components such as database structure, Power BI dashboards, automated data collection, data transformation techniques, and user interfaces. The development was divided in the major steps:
- Data Storage: Focuses on designing and implementing an efficient database to support reliable data processing and analysis, ensuring accuracy and accessibility;
- Data Transformation and Display: Covers methods for transforming raw data into insights and creating interactive Power BI dashboards for data exploration and manipulation.
3.1. Data Storage
- 3.
- The initial phase focused on identifying key data sources for the Market Analysis process. These sources were categorized into two types: those suitable for automated collection and those requiring manual extraction due to formatting inconsistencies or lack of automation. For automated sources, Python scripts were developed using libraries like PyPDF2, Pandas, Requests, Pillow, and Pytesseract to handle various data formats. Figure 8 shows an example using an image as the initial source format.
The final database architecture consists of multiple CSV files stored in a centralized directory. This approach contrasts with previous methods that relied on a single Excel file, significantly enhancing data accessibility and processing efficiency. Dimensional modeling was crucial for establishing connections between CSV files, ensuring data integrity and supporting temporal window functionalities.
3.2. Data Transformation and Display of Information
After having demonstrated the data storage implementation, this section focuses on showcasing the results and the means of achieving them, utilizing Power BI in combination with Python programs and Excel interfaces in the data transformation and Display of Information sub process.
Thus, a total of 16 dashboards were developed containing various pertinent business analyses identified in previous steps. The dashboard underwent several updates through interactions with various stakeholders to ensure it had the best possible design and information content. This process involved multiple iterations, as evidenced by Figure 9, which shows an earlier version as the final version of one of the dashboards (some information is not visible in the figures for security reasons of the case study company).
3.3. Validation
The validation of the developed Power BI tool is essential to ensure its reliability, effectiveness, and alignment with intended objectives. This chapter details the rigorous process undertaken to assess various aspects of the tool, including functionality, performance, usability, and user satisfaction. Due to the significant time losses experienced by collaborators during the quantitative analysis, a decision was made to conduct only a qualitative analysis.
Qualitative evaluation was pivotal in understanding user perceptions and experiences with the Power BI tool. A comprehensive questionnaire comprising 22 items was administered to department employees, Table 3. This qualitative approach allowed for a deeper exploration of dimensions such as system quality, information quality, data quality, perceived benefit, and user satisfaction. Overall, the findings revealed high levels of satisfaction among users, highlighting Power BI's perceived flexibility, reliability, ease of use, and its ability to integrate new data seamlessly. Despite minor concerns about response times and meeting expectations, users expressed confidence in the tool's accuracy and comprehensiveness of data, contributing significantly to decision-making processes.
4. Discussion
The application of the BPM Lifecycle methodology provided a comprehensive understanding of the processes within the organization, particularly focusing on the Market Analysis process. This process was identified as strategically significant, distinct from standard transactional operations.
Through a meticulous discovery and analysis phase, critical areas for enhancement were pinpointed, combining qualitative and quantitative analyses for a holistic assessment. The redesign strategy prioritized selective automation and efficiency improvements while preserving flexibility. Initial findings from the prototype implementation demonstrated significant enhancements in both process efficiency and output quality.
This study underscores the role of BPM in driving effective, adaptable, and value-centric transformations within organizational processes.
Despite achieving its objectives, several limitations were encountered during the study. Time constraints posed challenges in conducting a thorough analysis and complete implementation of the BPM Lifecycle methodology. The complexity of virtual and semi-structured operations, coupled with voluminous data, presented additional hurdles.
Understanding the organization comprehensively proved challenging due to interdepartmental dynamics and organizational culture complexities. Adapting BPM methodologies to virtual and semi-structured processes required further customization and refinement.
Quantitative analysis faced limitations in data availability and quality, impacting the depth and reliability of insights obtained.
Future research can explore advancements in BPM methodologies, integrating agile principles to enhance responsiveness in process management. Agile methodologies offer iterative development and continuous improvement, complementing the structured approach of the BPM Lifecycle.
Technological advancements like low-code development platforms and process mining tools present opportunities to streamline BPM implementation. Low-code platforms empower rapid deployment of process improvements, while process mining tools extract insights from process execution data to optimize efficiencies.
The integration of AI and machine learning holds promise for enhancing market analysis processes. Neural networks can improve predictive capabilities, enabling organizations to anticipate market trends and make proactive decisions. This shift towards predictive analytics empowers organizations to respond swiftly to market dynamics and capitalize on emerging opportunities.
Supplementary Materials
The following supporting information can be downloaded at the website of this paper posted on Preprints.org.
Author Contributions
Conceptualization, A.R.T., J.V.F. and A.L.R.; methodology, A.R.T., J.V.F. and A.L.R.; software, A.R.T.; validation, J.V.F. and A.L.R.; formal analysis, A.R.T.; investigation, A.R.T., J.V.F. and A.L.R.; resources, A.R.T., J.V.F. and A.L.R.; data curation, A.R.T.; writing—original draft preparation, A.R.T., J.V.F. and A.L.R.; writing—review and editing, A.R.T., J.V.F. and A.L.R.; visualization, A.R.T.; supervision, J.V.F. and A.L.R. All authors have read and agreed to the published version of the manuscript.
Data Availability Statement
Due to privacy concerns, the data used, as well as the developed code and the created tool, could not be published as they were directly linked to the anonymous organization on which the case study was based.
Acknowledgments
The authors would like to thank the company for its willingness to carry out this study.
Conflicts of Interest
The authors declare no conflicts of interest.
References
- Azizan, S., Ismail, R., Baharum, A., & Hidayah Mat Zain, N. (2022, February 14). Exploring the Factors That Influence the Success of Digitalization in An Organization’s IT Department. 2021 6th IEEE International Conference on Recent Advances and Innovations in Engineering, ICRAIE 2021. [CrossRef]
- Kumar, P., Sharma, D., & Pandey, P. (2022). Industry 4.0 (I4.0) Based Virtual Organization Model for the Coordination of Sustainable Textile Supply Chain. American Business Review, 25(1), 186–208. [CrossRef]
- Salvadorinho, J., & Teixeira, L. (2021). Organizational knowledge in the I4.0 using BPMN: a case study. Procedia Computer Science, 181, 981–988. [CrossRef]
- Kady, C., Jalloul, K., Trousset, F., Yaacoub, C., Akl, A., Daclin, N., & Zacharewicz, G. (2023). Addressing Business Process Deviations through the Evaluation of Alternative Pattern-Based Models. Applied Sciences (Switzerland), 13(13). [CrossRef]
- Novak, C., Pfahlsberger, L., Bala, S., Revoredo, K., & Mendling, J. (2023). Enhancing decision-making of IT demand management with process mining. Business Process Management Journal, 29(8), 230–259. [CrossRef]
- Mendling, J., Baesens, B., Bernstein, A., & Fellmann, M. (2017). Challenges of smart business process management: An introduction to the special issue. Decision Support Systems, 100, 1–5. [CrossRef]
- Prys, M., & Różewski, P. (2022). How to benefit more from business process documentation? Framework for calculation personality - process role fit. Procedia Computer Science, 207, 3208–3216. [CrossRef]
- Szelągowski, M., & Berniak-Woźny, J. (2024). BPM challenges, limitations and future development directions – a systematic literature review. Business Process Management Journal, 30(2), 505–557. [CrossRef]
- Benraad, M., Ozkan, B., Turetken, O., & Vanderfeesten, I. (2022). The influence of BPM-supportive culture and individual process orientation on process conformance. Business Process Management Journal, 28(8), 1–22. [CrossRef]
- Christiansson, M. T., & Rentzhog, O. (2020). Lessons from the “BPO journey” in a public housing company: toward a strategy for BPO. Business Process Management Journal, 26(2), 373–404. [CrossRef]
- Corradini, F., Marcelletti, A., Morichetta, A., Polini, A., Re, B., & Tiezzi, F. (2023). A Flexible Approach to Multi-party Business Process Execution on Blockchain. Future Generation Computer Systems, 147, 219–234. [CrossRef]
- Ferrigno, G., Del Sarto, N., Piccaluga, A., & Baroncelli, A. (2023). Industry 4.0 base technologies and business models: a bibliometric analysis. European Journal of Innovation Management, 26(7), 502–526. [CrossRef]
- Fowler, M. (2004). UML distilled: a brief guide to the standard object modeling language (3rd ed.). Pearson Education.
- Larman, C. (2001). Applying UML and patterns: An introduction to object-oriented analysis and design and the unified process (2nd ed.).
- Erickson, J., & Siau, K. (2004, August 6). Theoretical and Practical Complexity of UML [Paper Presentation]. Tenth Americas Conference on Information Systems, New York, USA.
- BCSD Portugal. (2024, May). Agenda 2030 - Objetivos de Desenvolvimento Sustentável. https://ods.pt/.
- ERSE. (2021). Análise do mercado de biocombustíveis 2018-2020. https://www.erse.pt/media/eknhoezr/relat%C3%B3rio-biocombust%C3%ADveis.pdf.
- ERSE. (2022). Metodologia de supervisão do sistema petrolífero nacional. https://www.erse.pt/ebooks/regulamentosmanuaisguias/combustiveis-e-gpl/regulamento-de-supervisao-do-sistema-petrolifero-nacional/.
- Dumas, M., La Rosa, M., Mendling, J., & Reijers, H. A. (2018). Fundamentals of Business Process Management (2nd ed.). Springer. [CrossRef]
- Porter, M. (1985). Competitive Advantage: Creating and sustaining superior performance (1st ed.). The Free Press.
Figure 1.
Process Landscape Model.
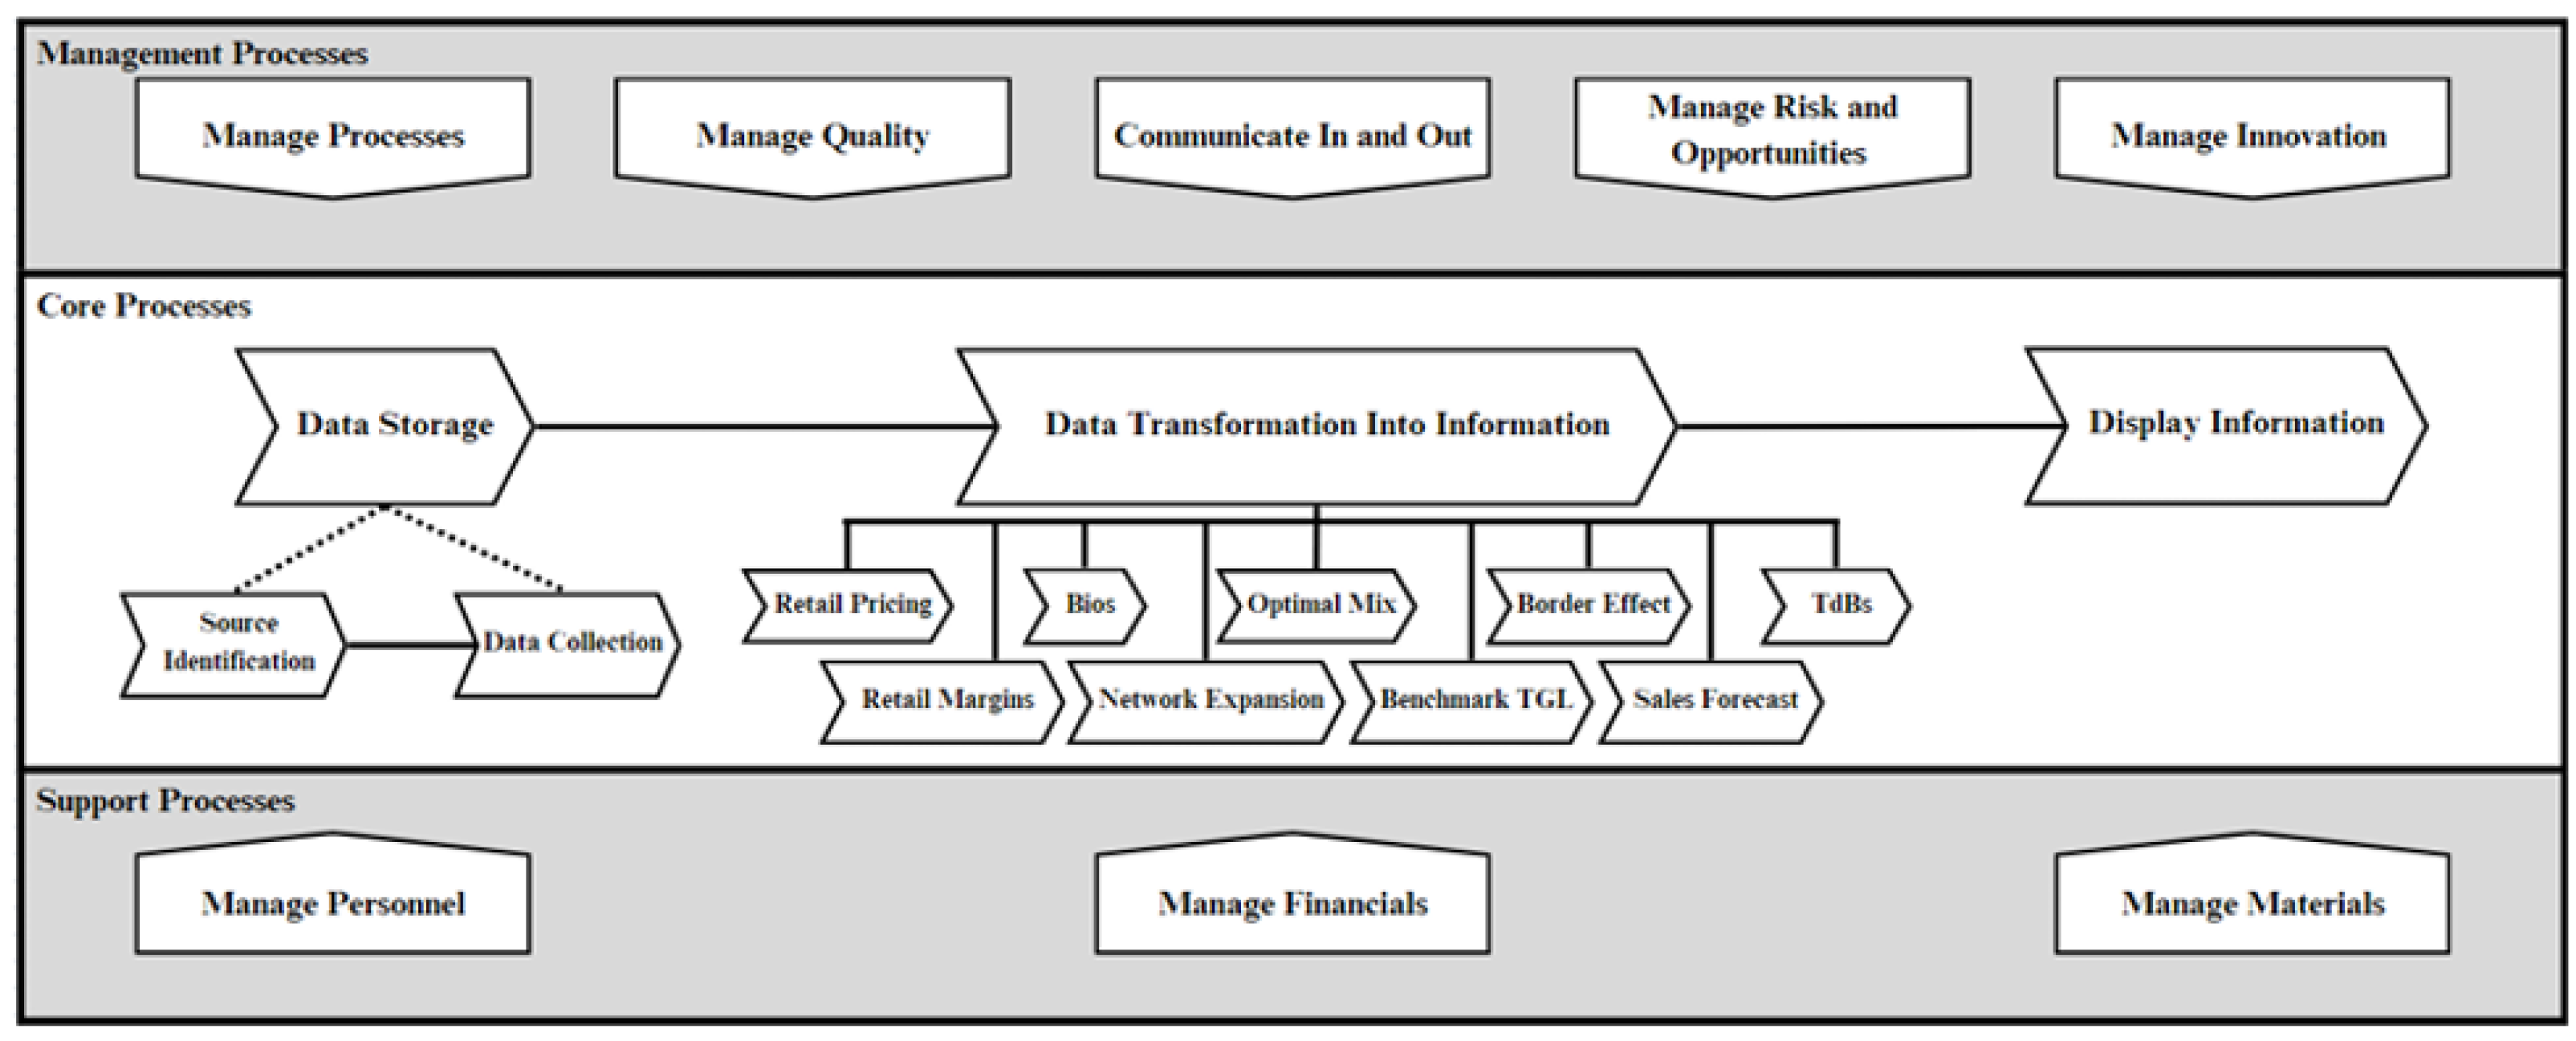
Figure 2.
BPMN AS-IS.
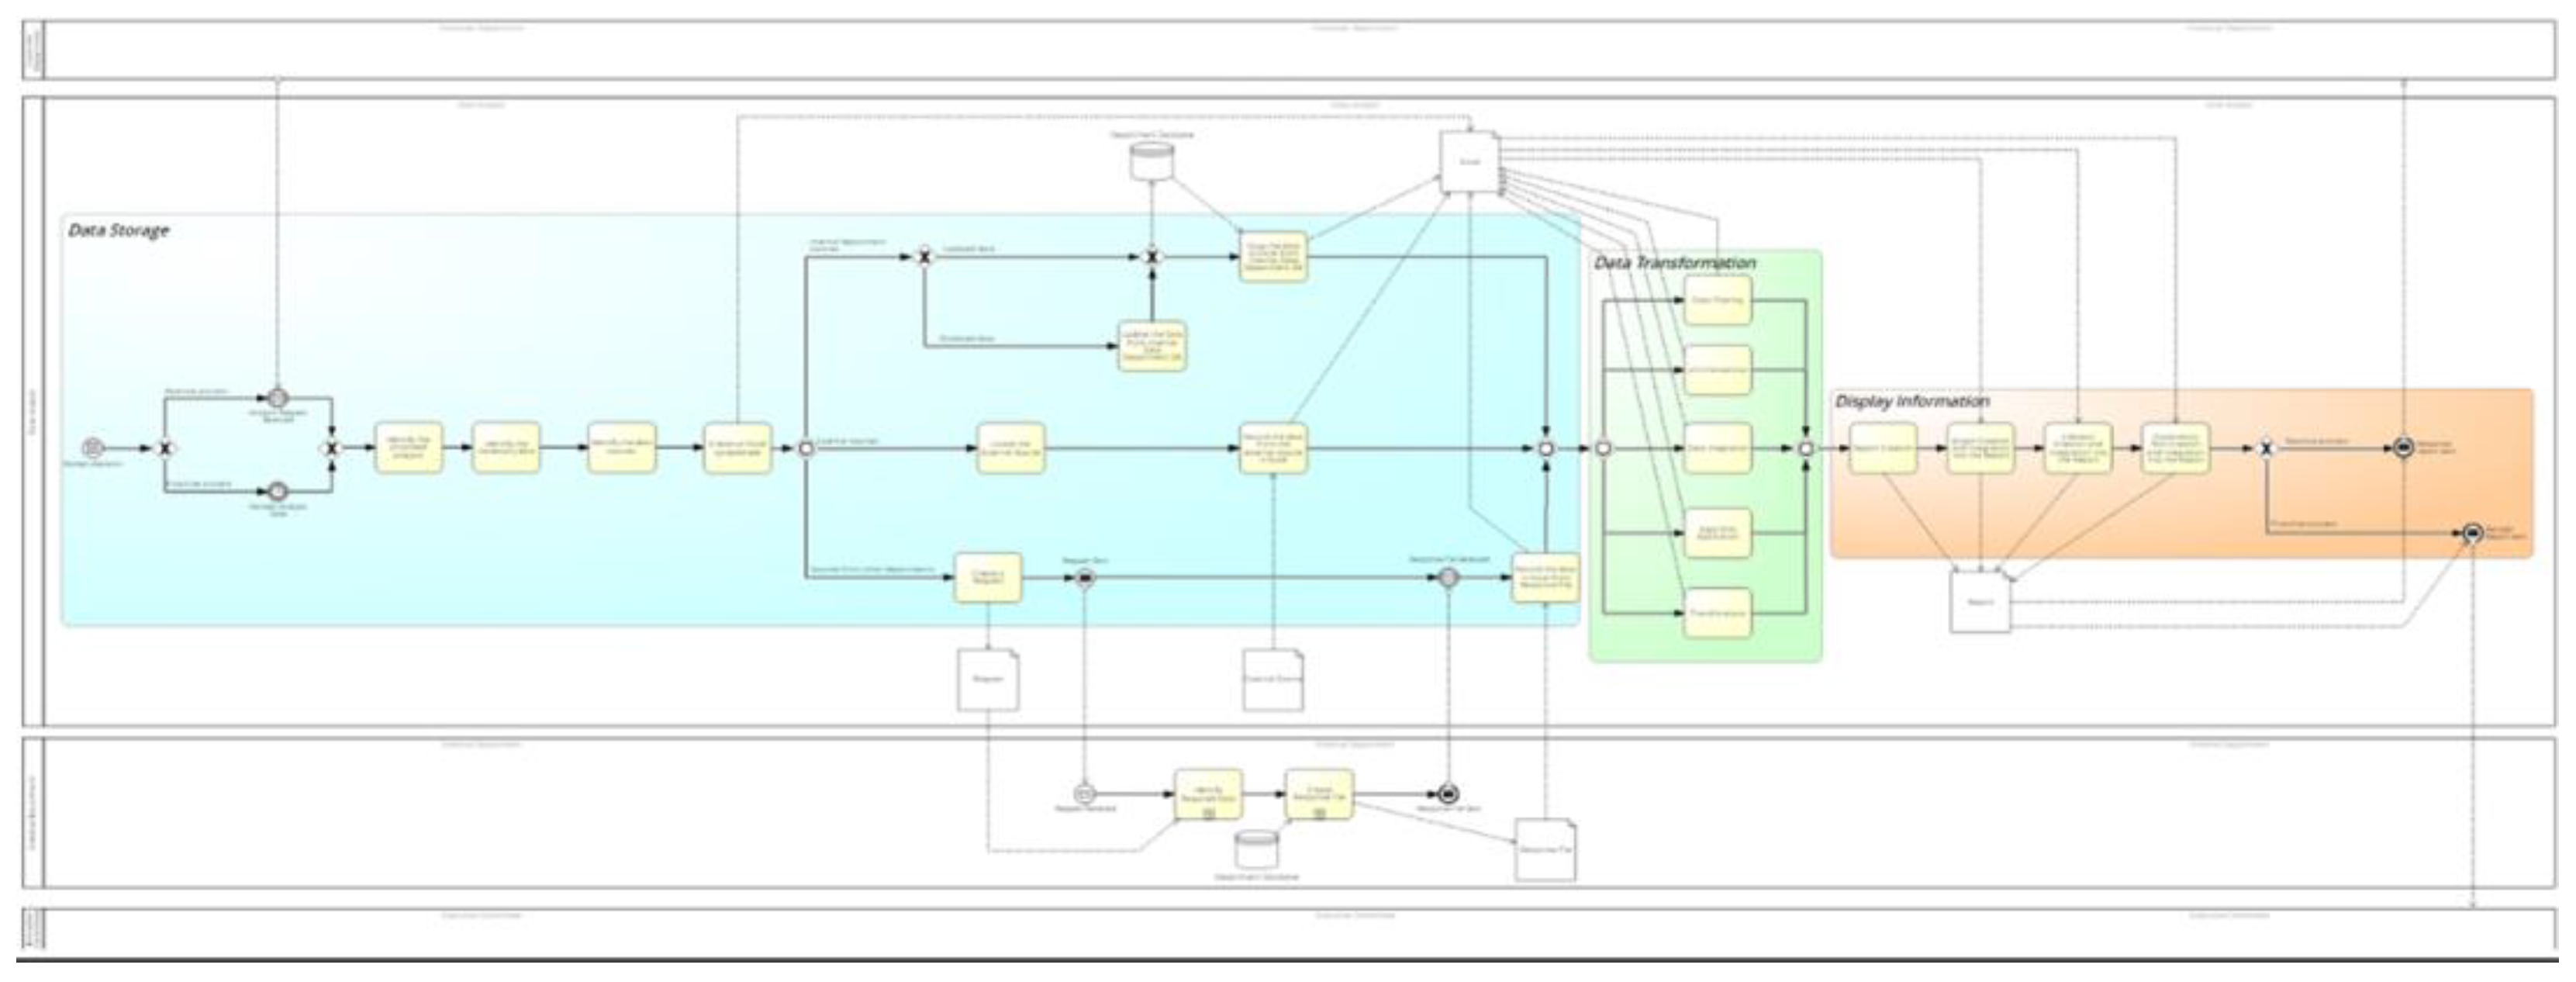
Figure 3.
Devil's Triangle of the selected specialized processes.
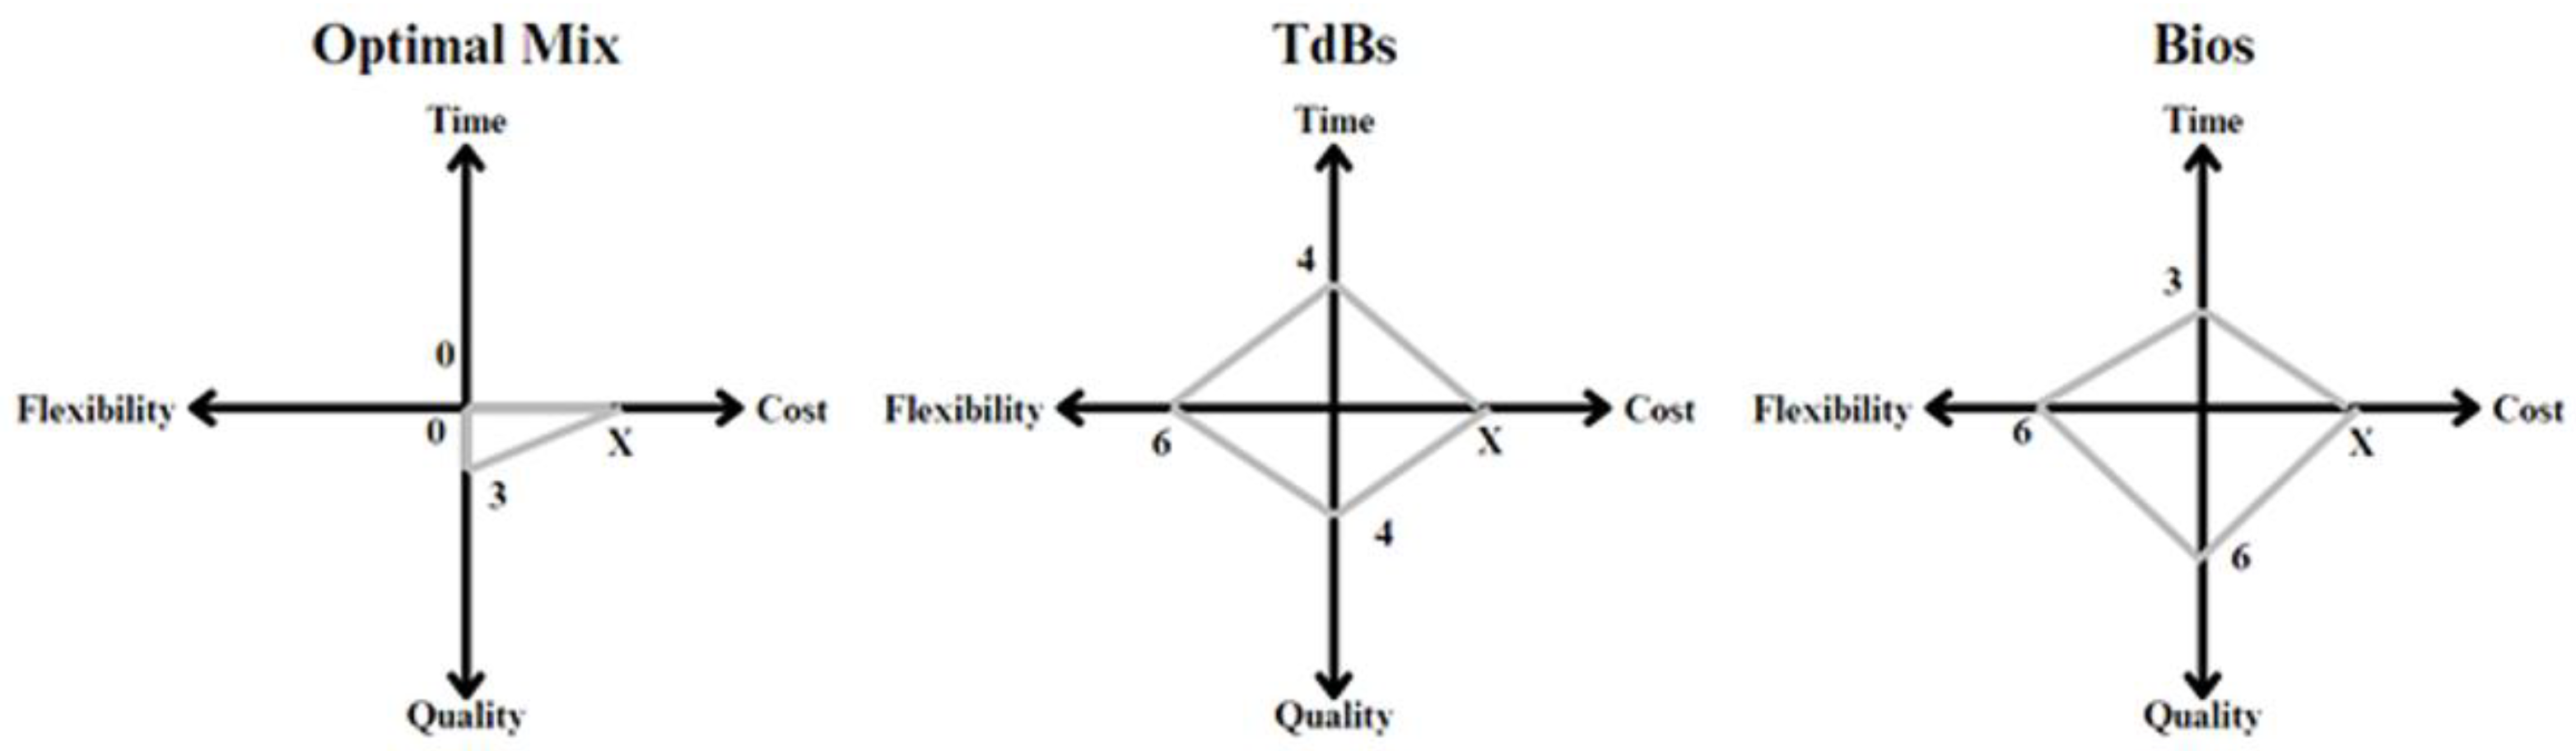
Figure 4.
BPMN TO-BE.
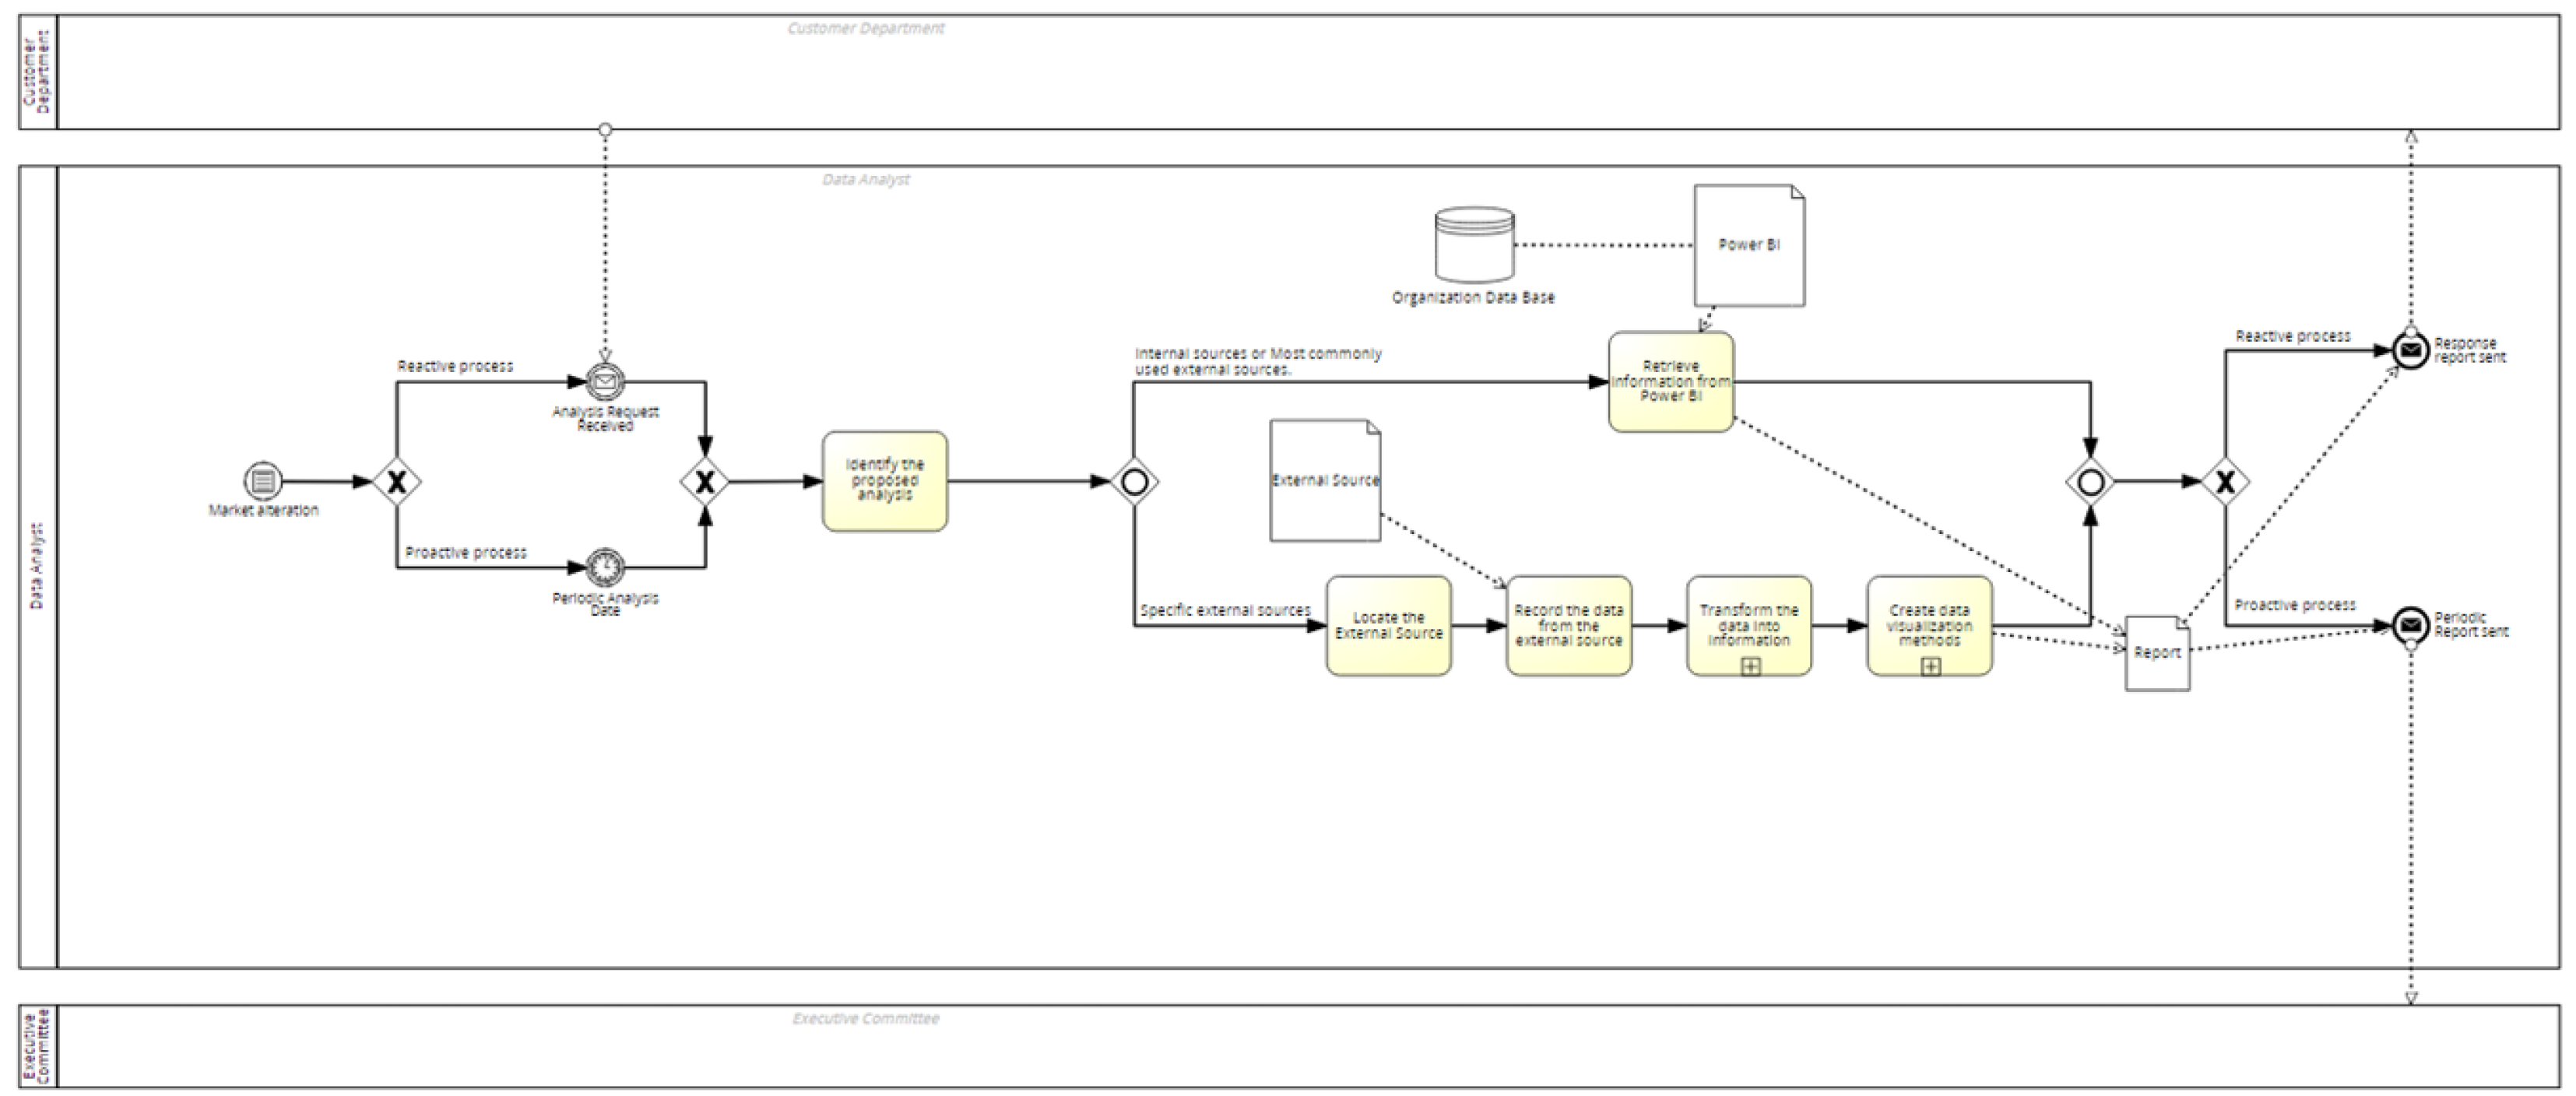
Figure 5.
(a) Use Case Diagram; (b) Sequence Diagram.
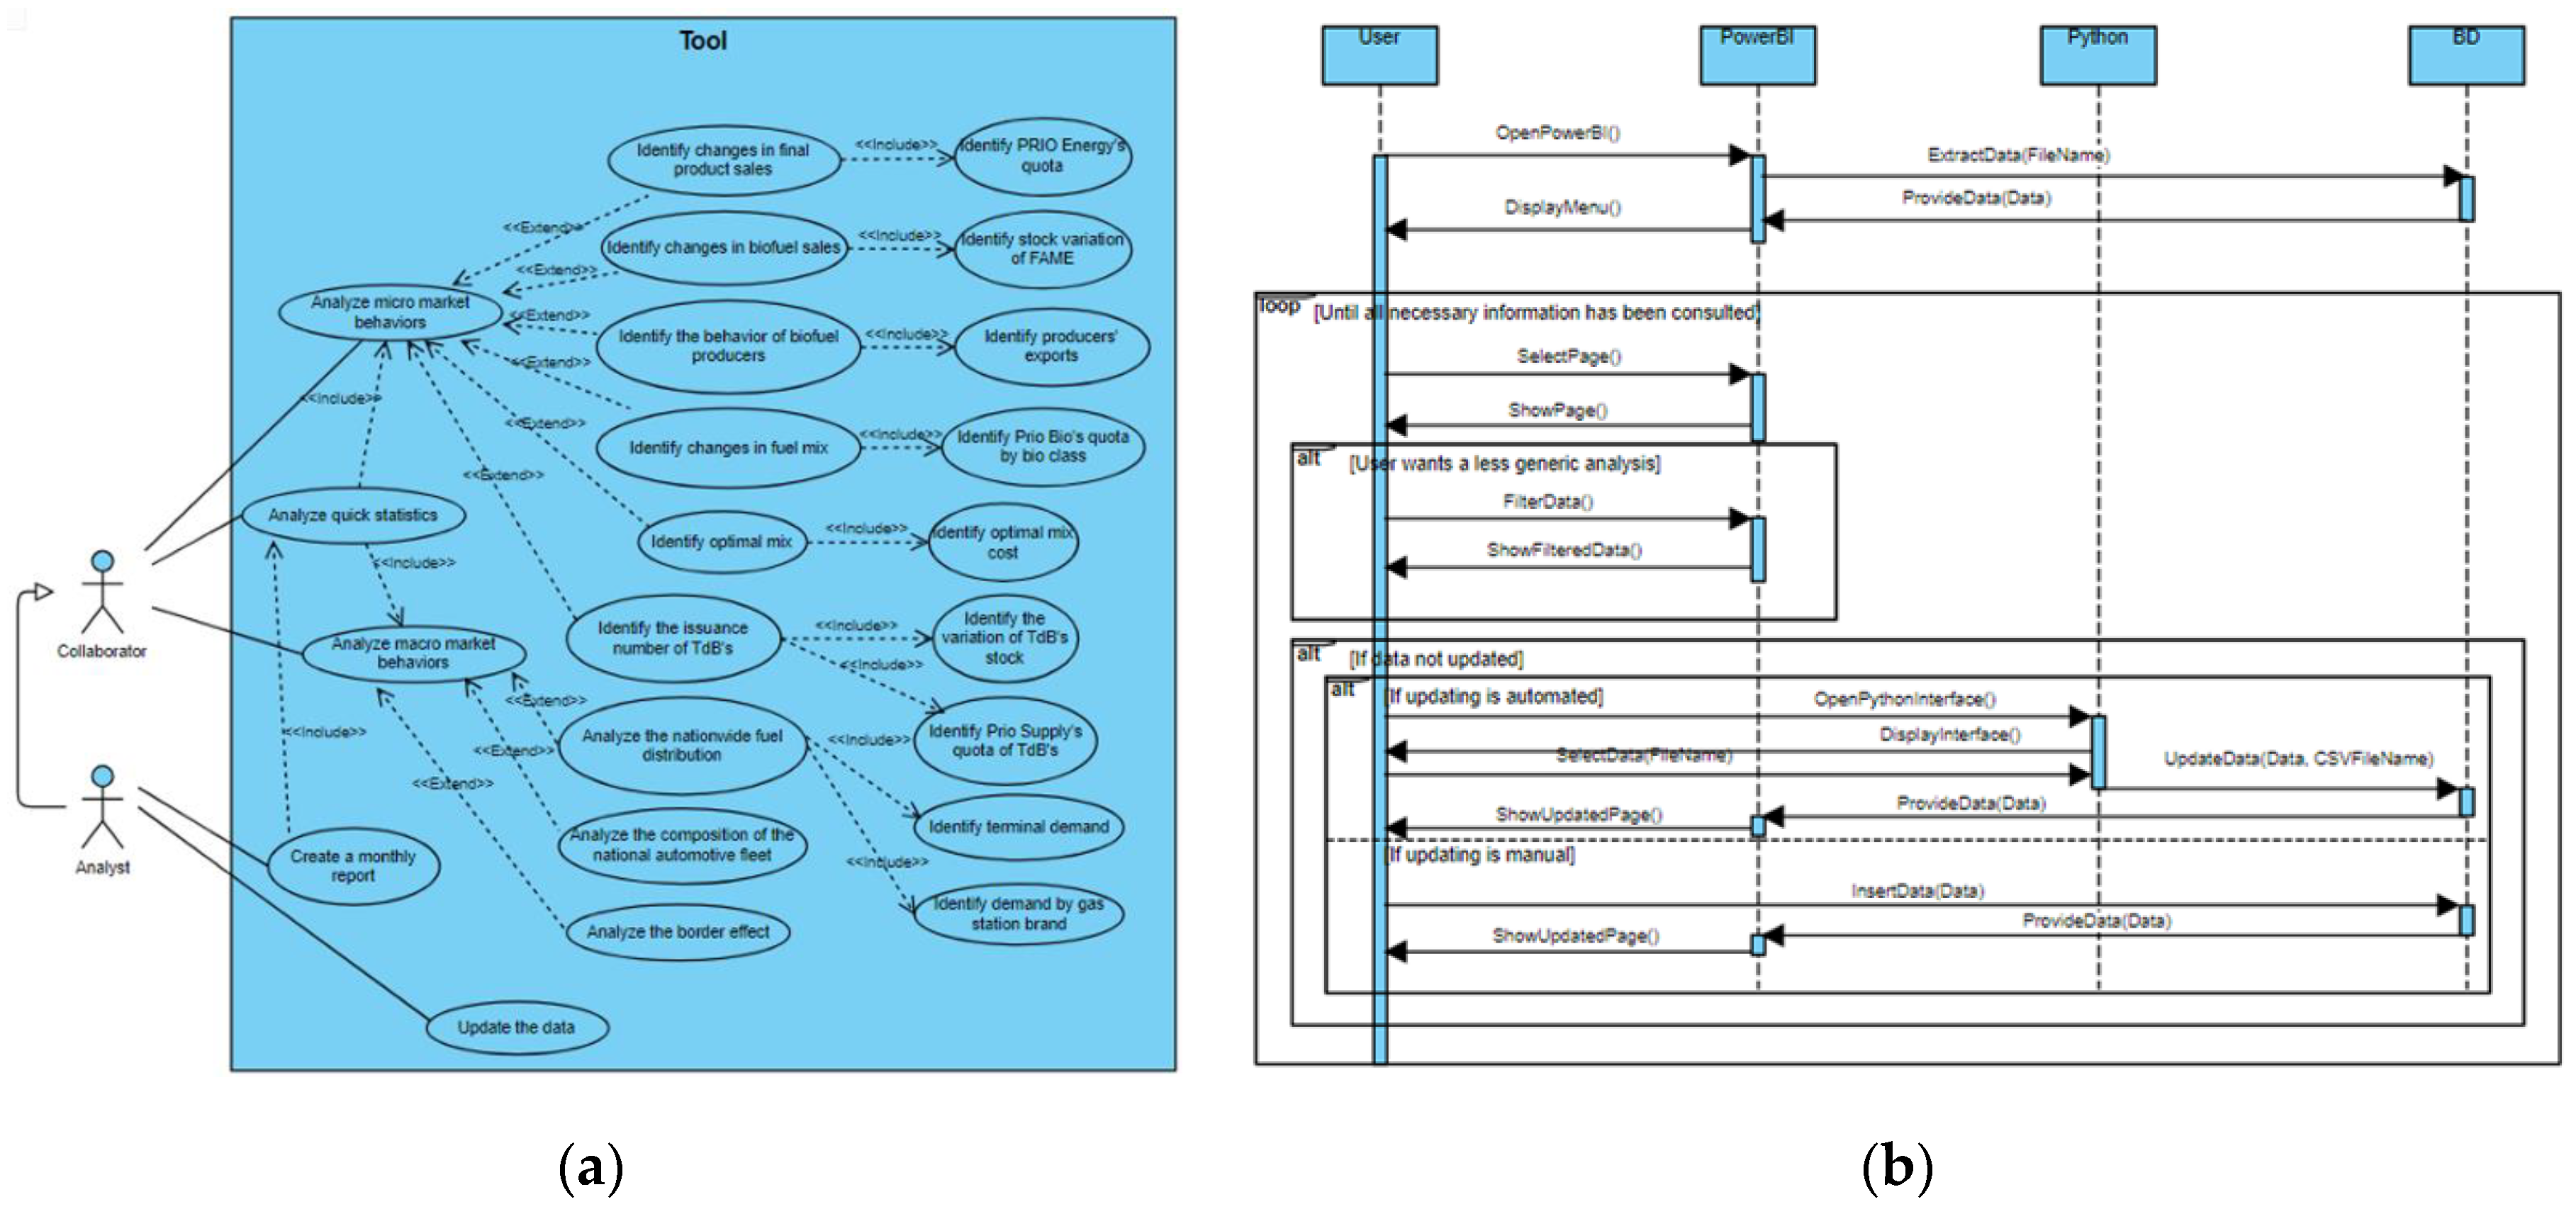
Figure 6.
(a) Package Diagram; (b) Component Diagram.
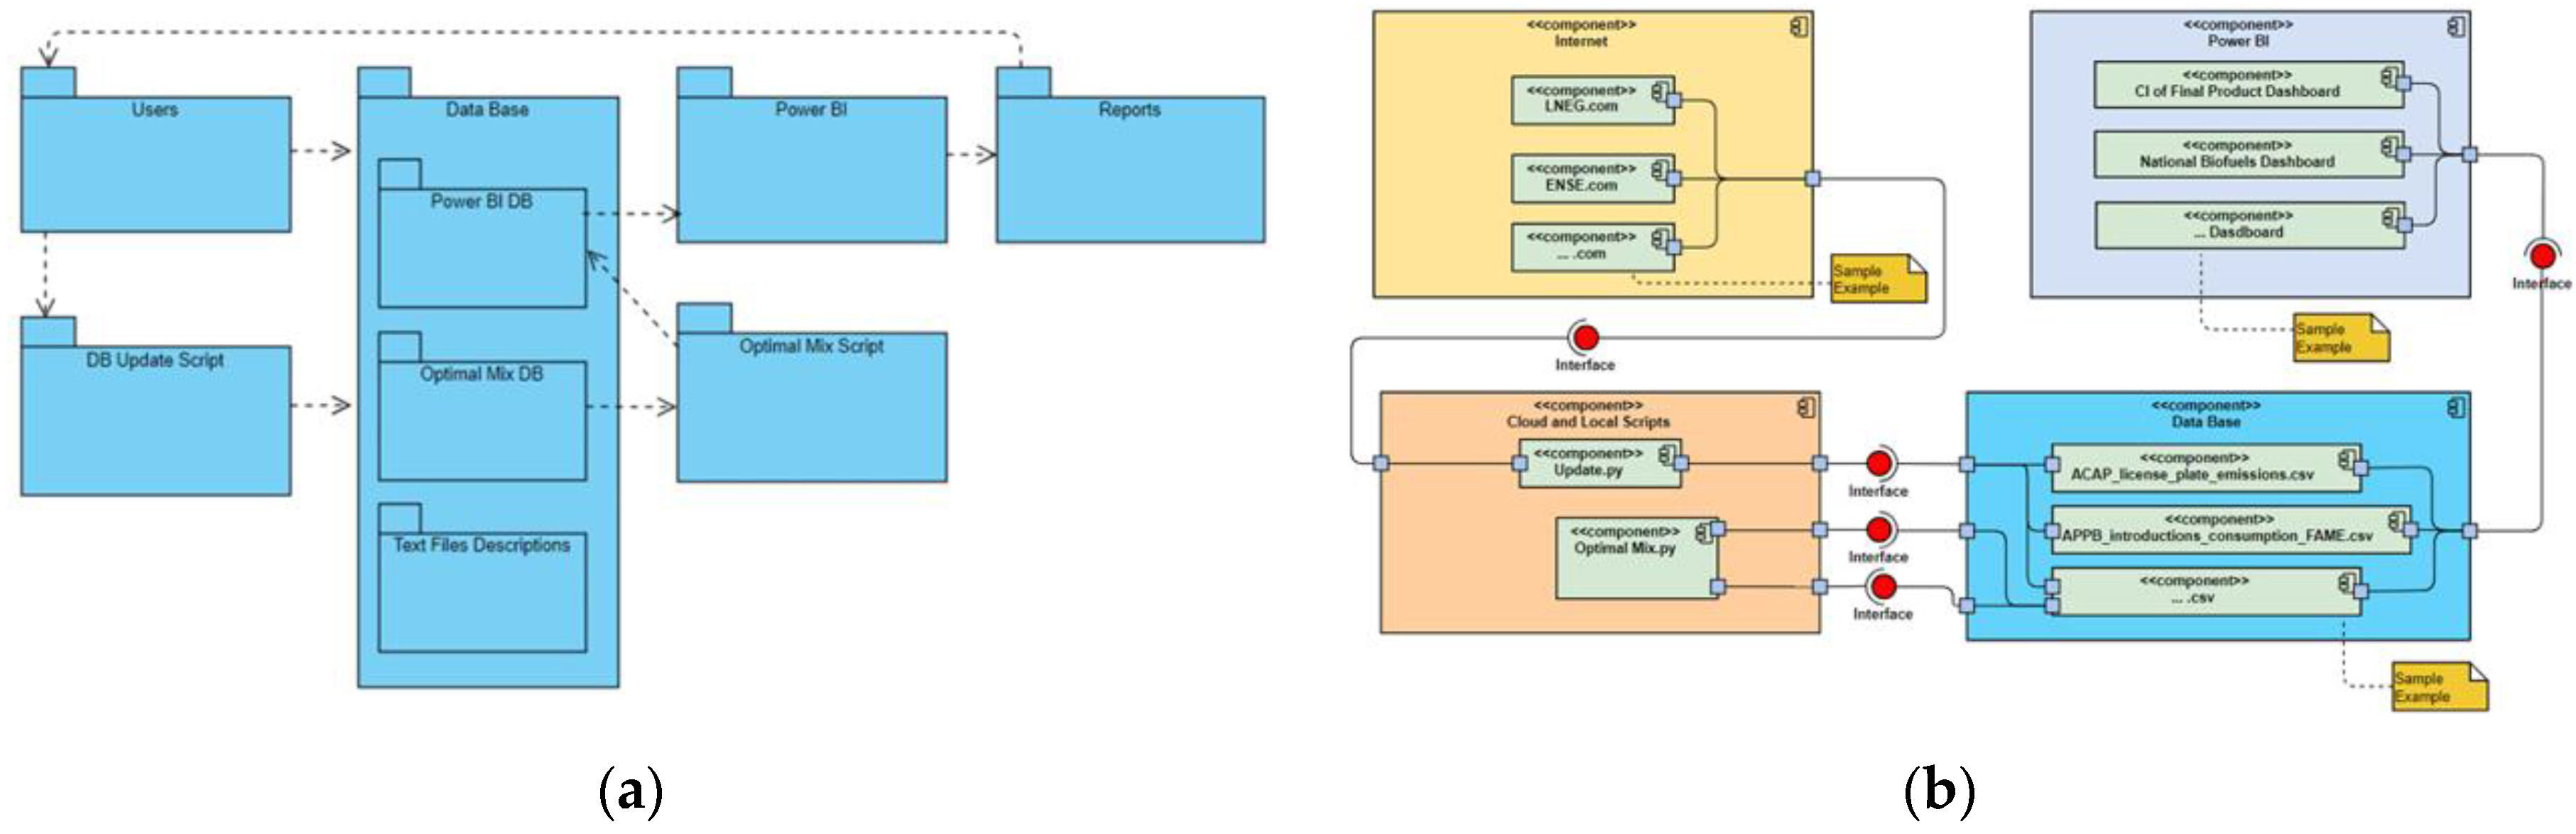
Figure 7.
Tool Evaluation Dashboard.
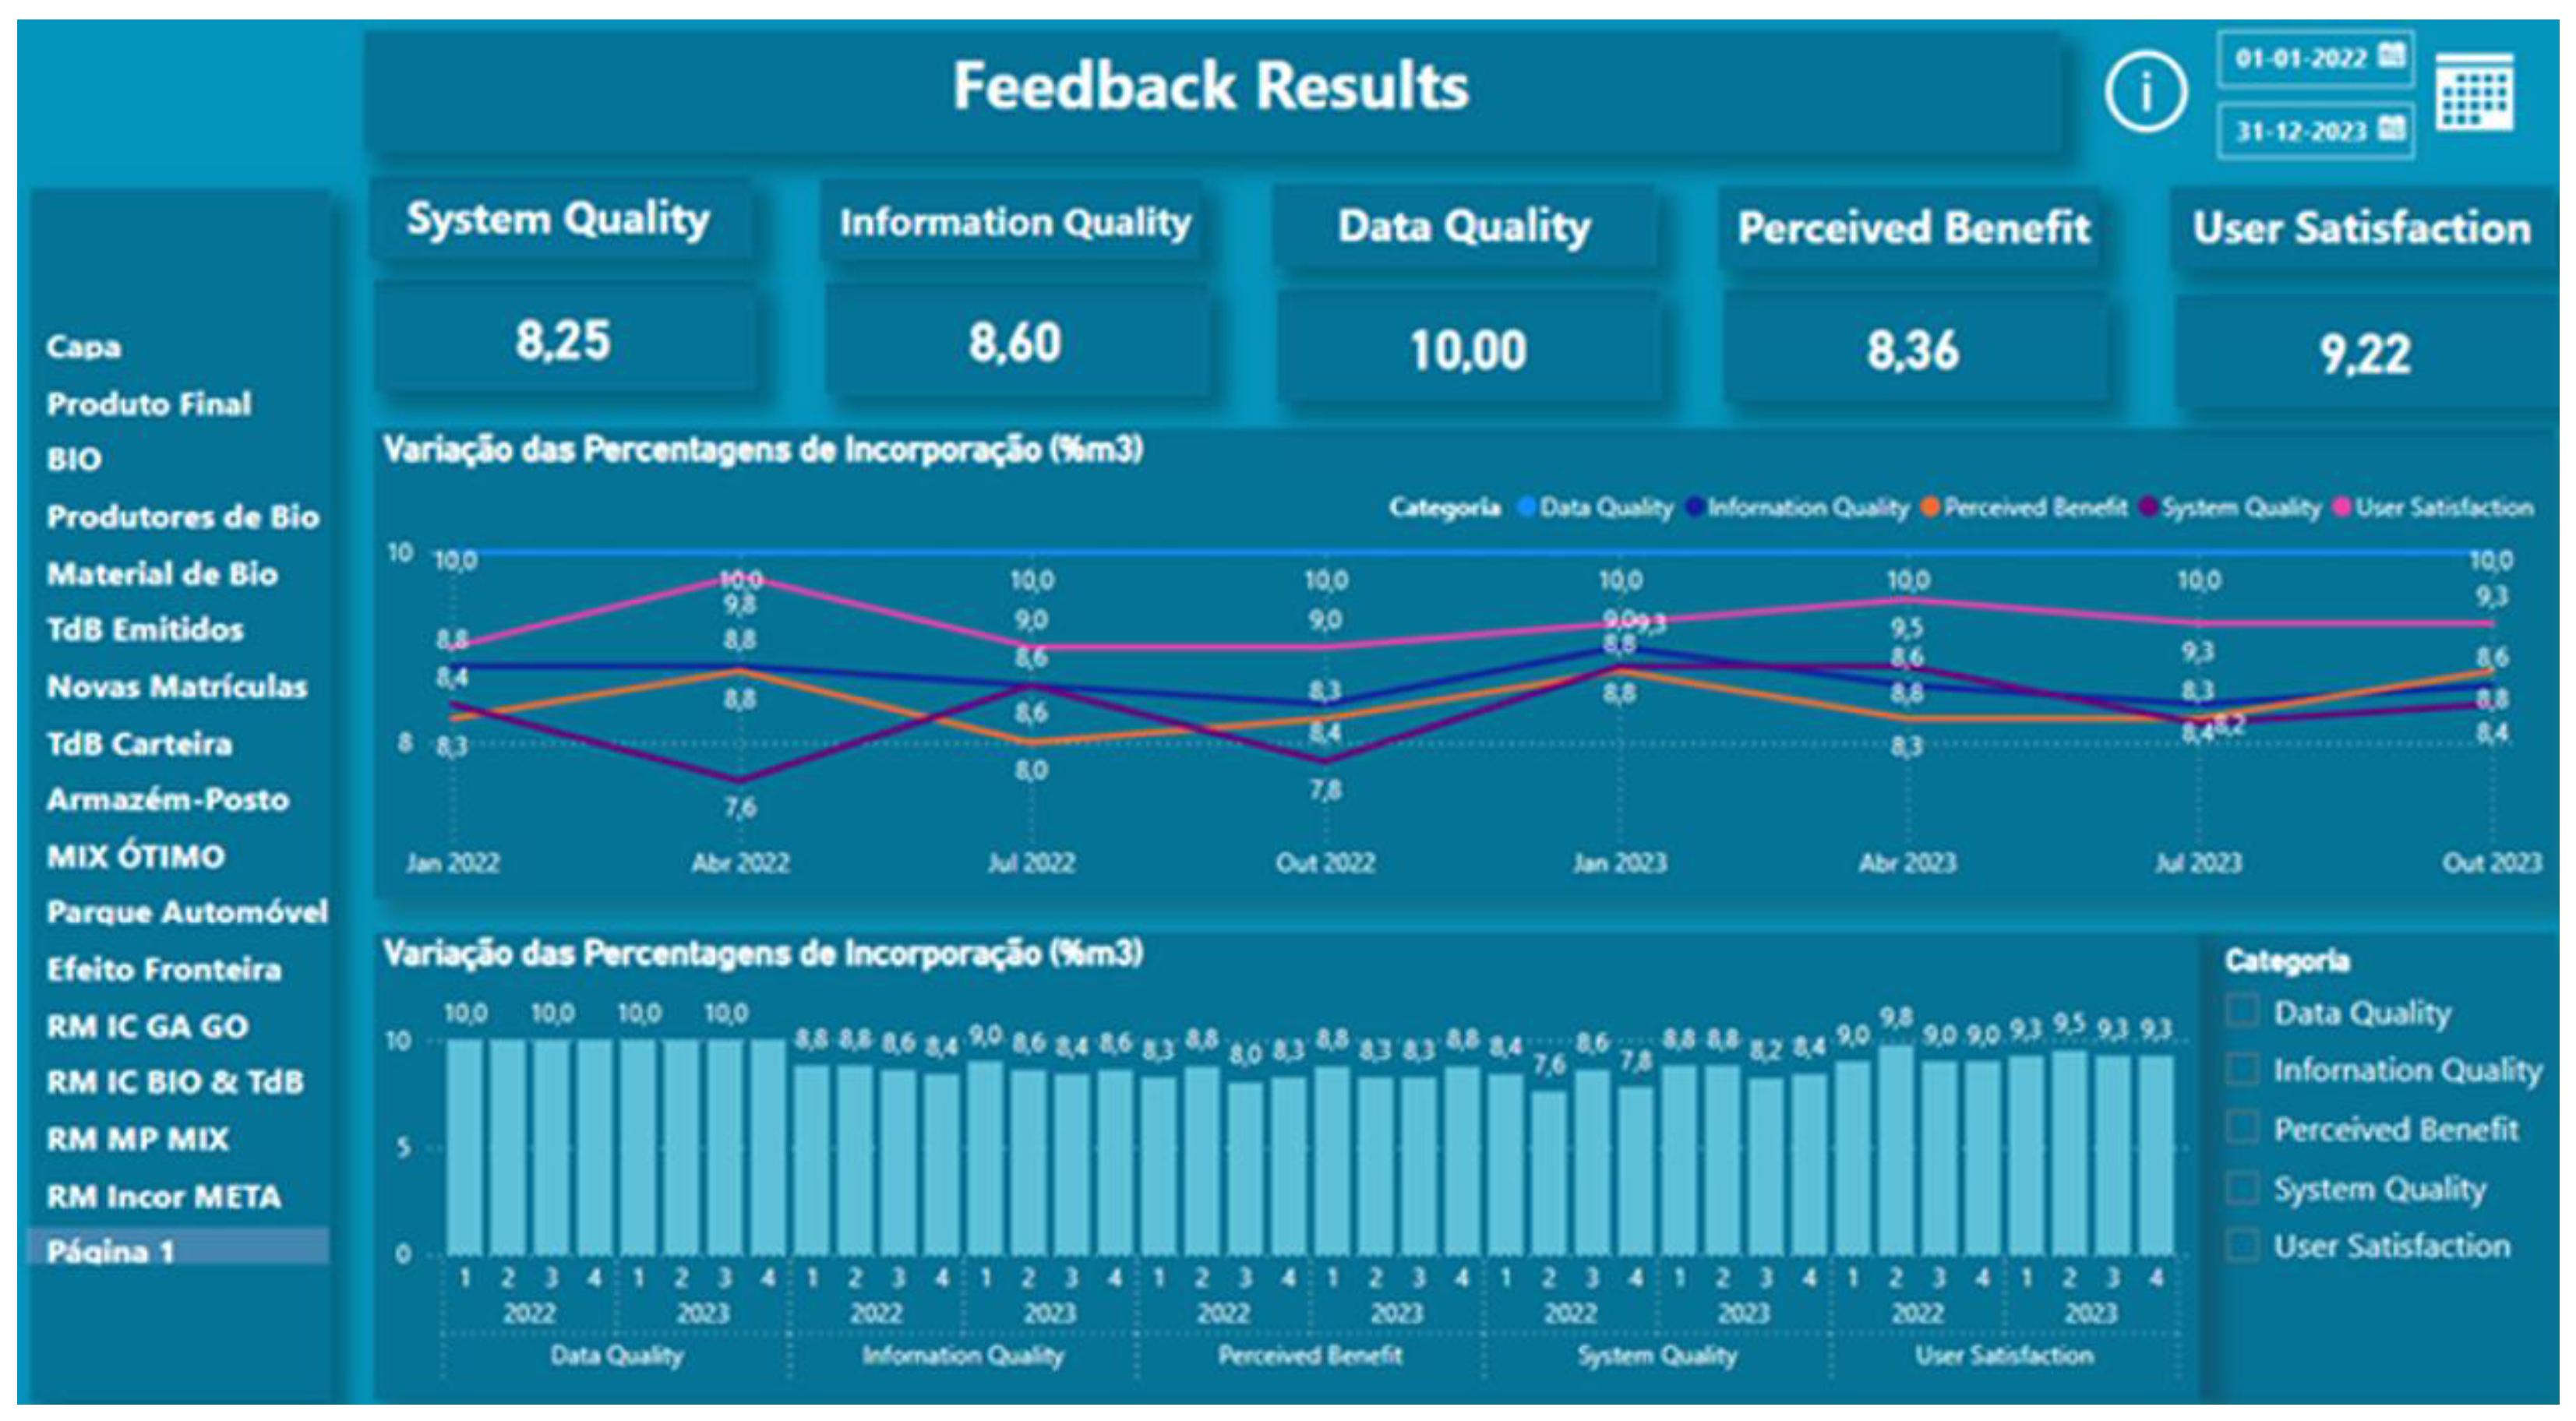
Figure 8.
Data Storage, ENSE Example.
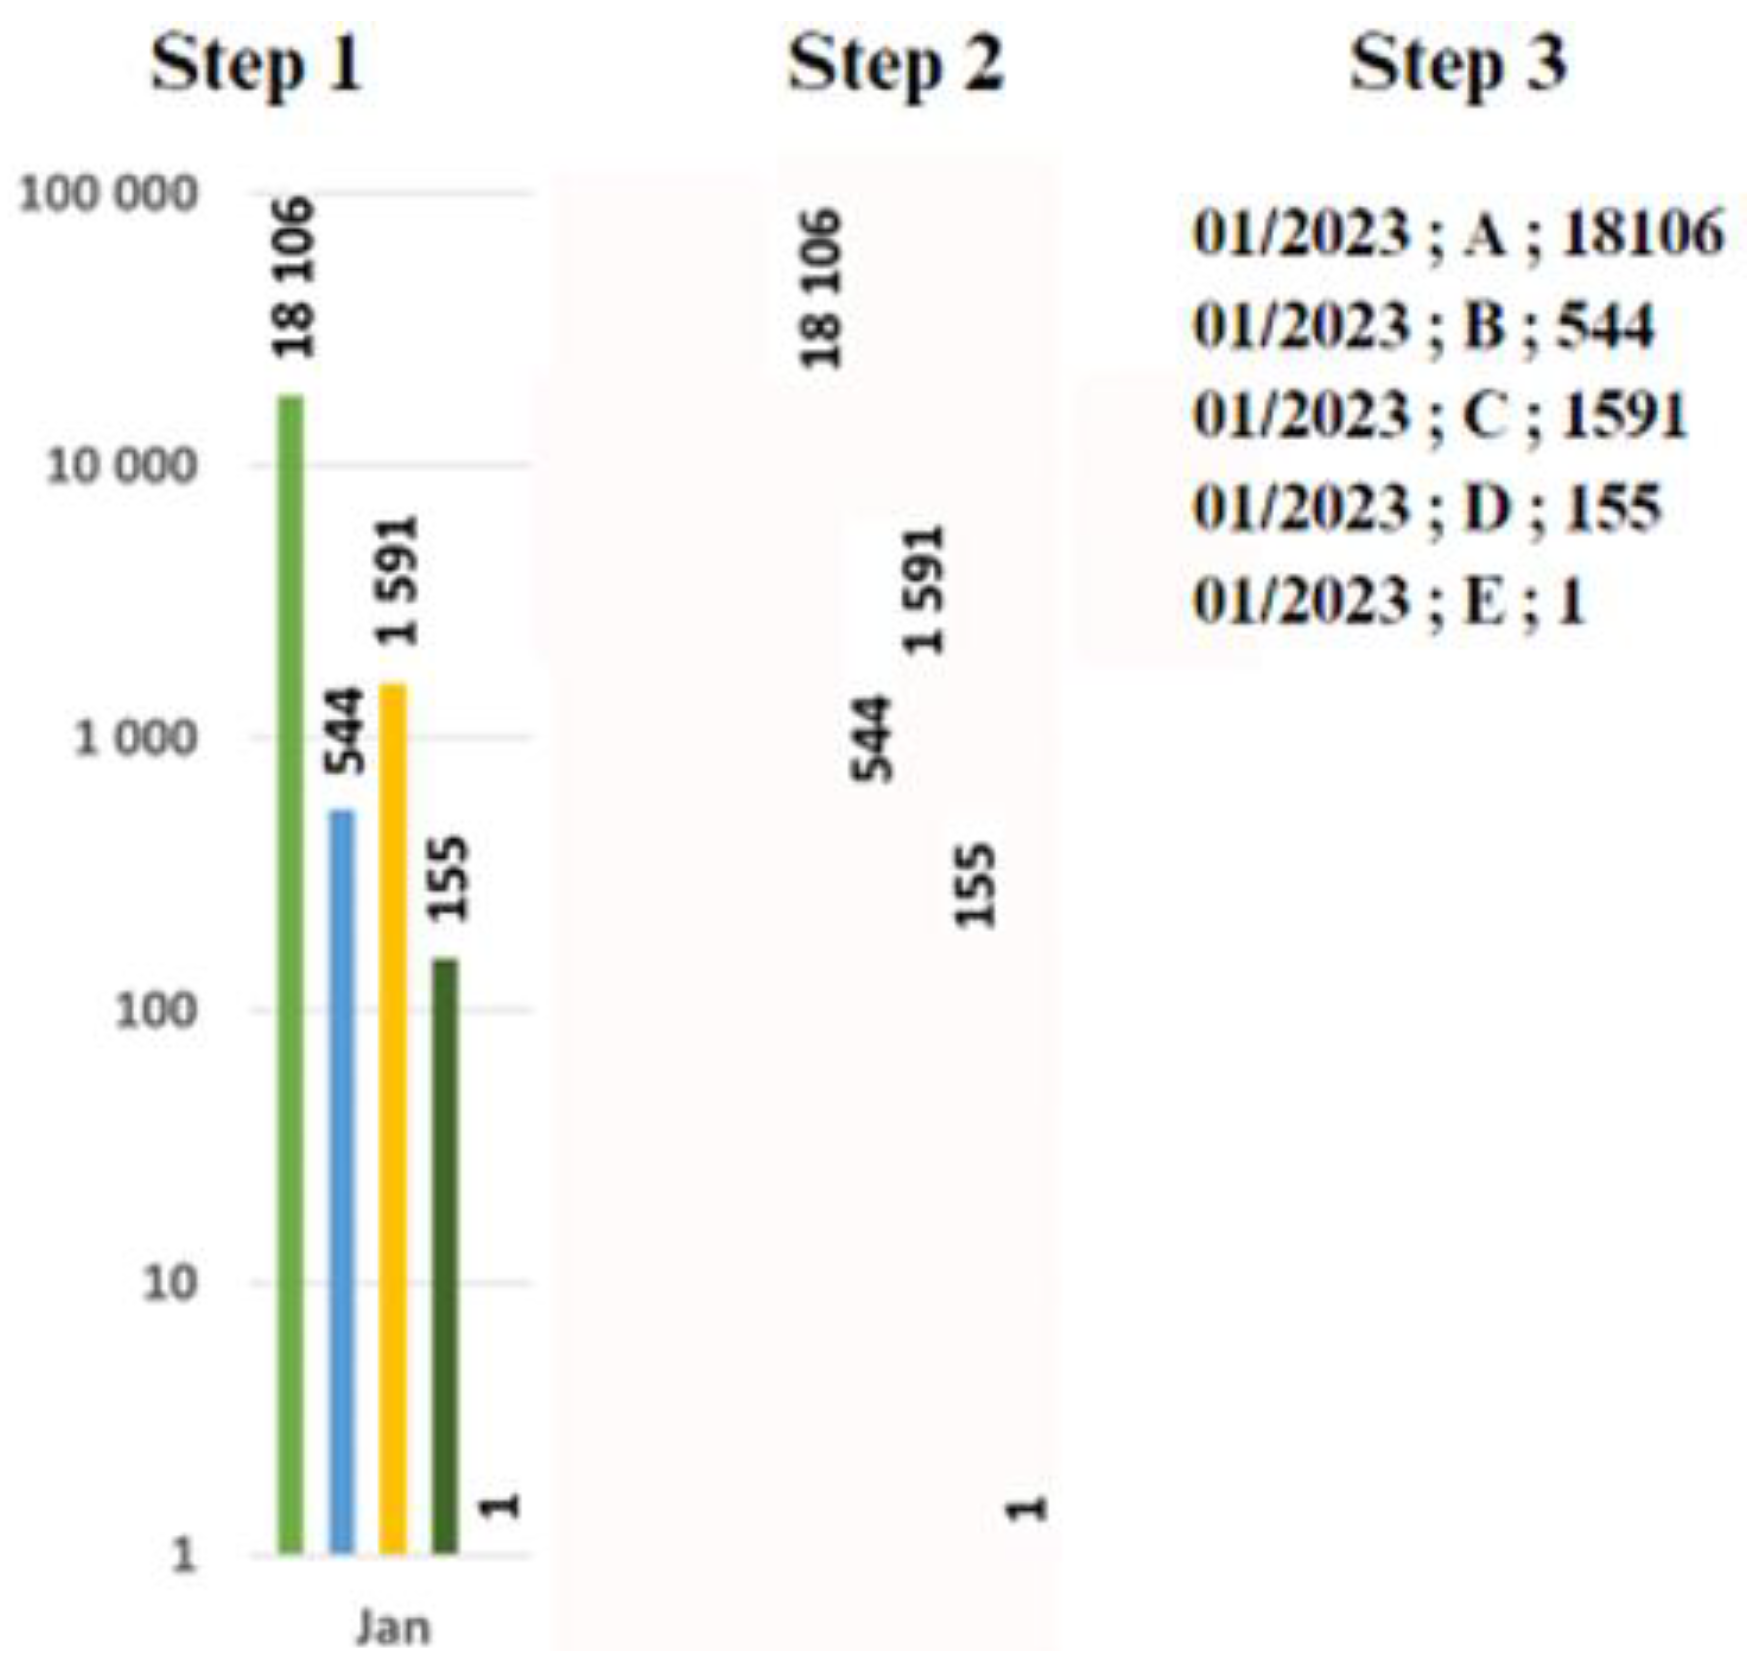
Figure 9.
(a) Dashboard Initial Version; (b) Dashboard Last Version.
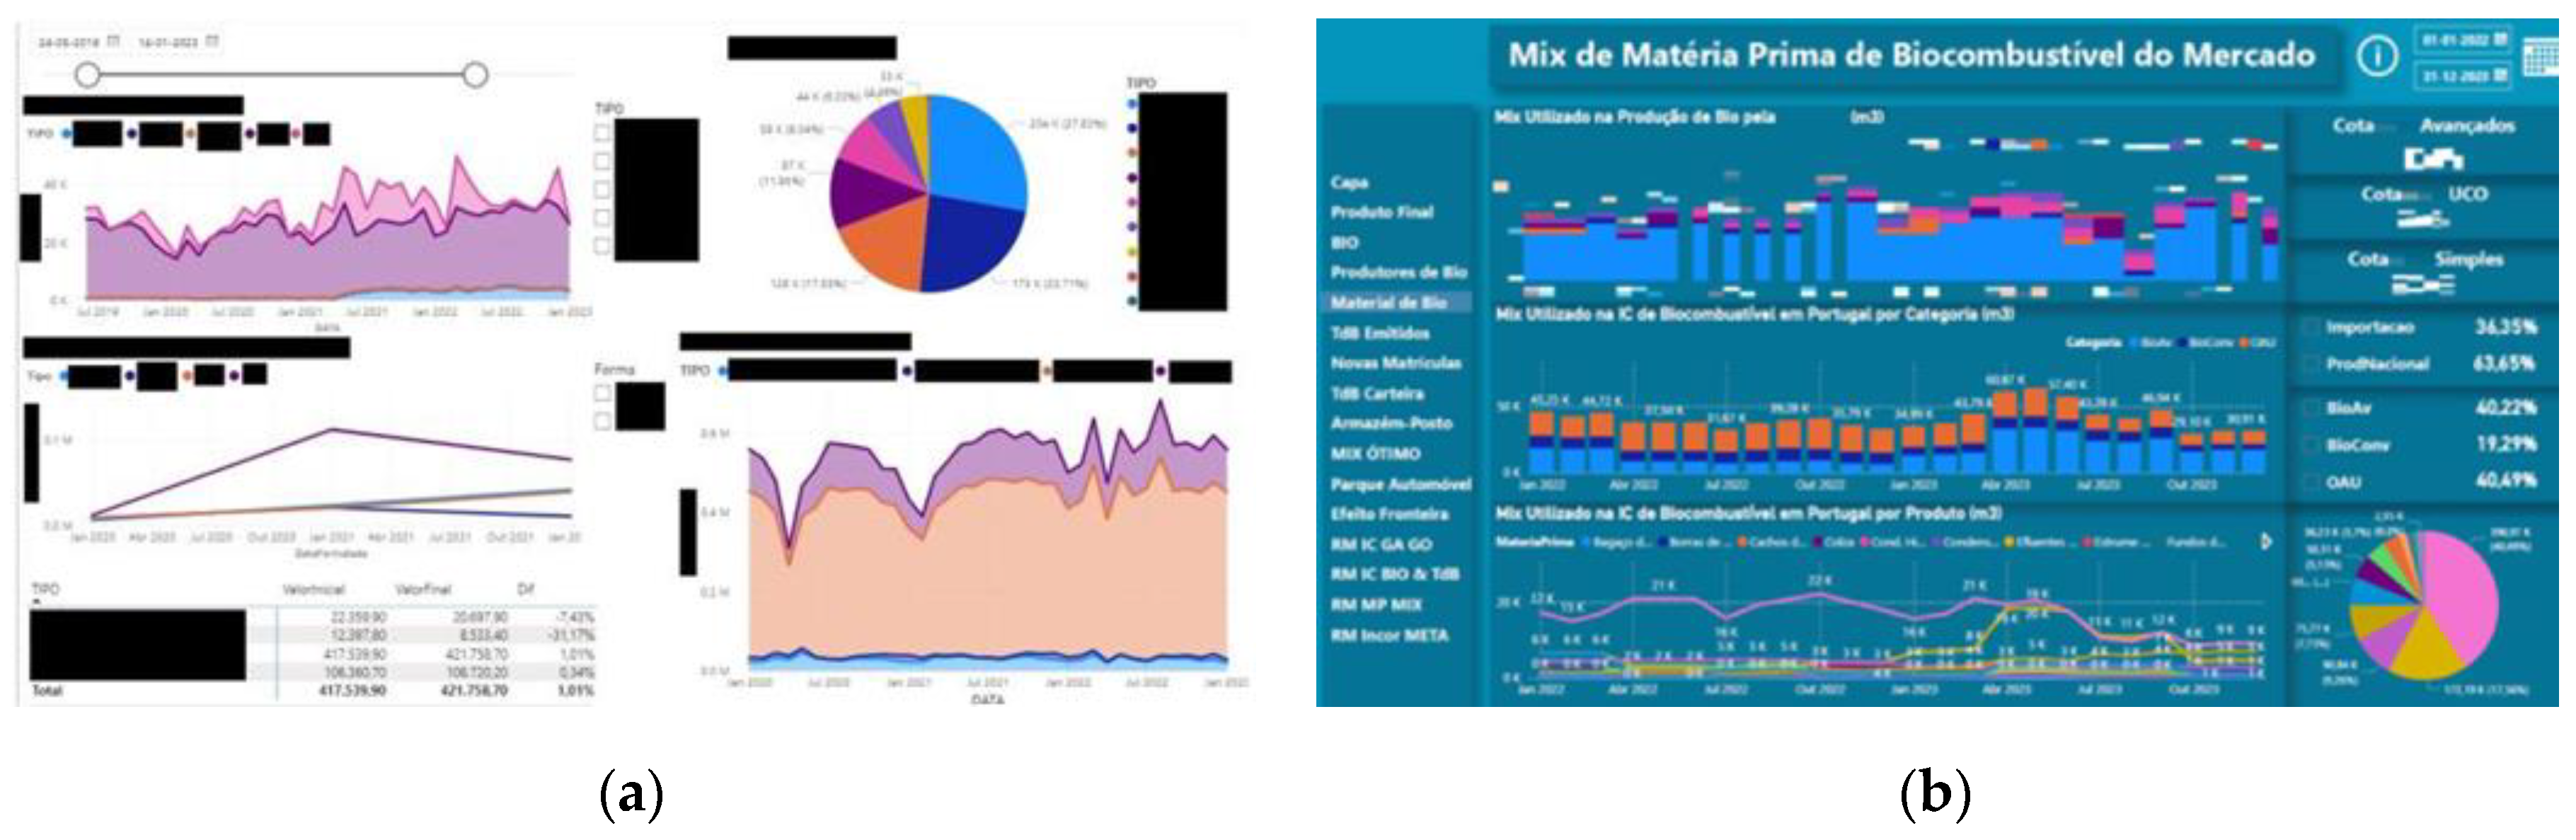

Table 1.
AHP Result.
| Subprocesses | Value | Position |
|---|---|---|
| Retail Pricing | 0.0970 | 5º |
| Retail Margins | 0.0902 | 6º |
| Bios | 0.1765 | 2º |
| Network Expansion | 0.0462 | 9º |
| Optimal Mix | 0.2176 | 1º |
| Benchmark TGL | 0.0601 | 8º |
| Border Effect | 0.1005 | 4º |
| Sales Forecast | 0.0706 | 7º |
| TdBs | 0.1366 | 3º |
Table 2.
Value-Added Analysis.
| BPMN Process | BPMN Activity | Performer | Class |
|---|---|---|---|
| Data Storage | Identify the proposed analysis | DA (Data Analyst) | BVA |
| Identify the necessary data | DA | BVA | |
| Identify the data sources | DA | NVA | |
| Create a Request | DA | BVA | |
| Record the data in Excel from Response | DA | BVA | |
| Locate the External Source | DA | NVA | |
| Record the data from the external source in Excel | DA | BVA | |
| Update the Data from Internal Data Department DB | DA | BVA | |
| Copy the data to Excel from Internal Data Department DB | DA | NVA | |
| Data Transformation | Data Filtering | DA | VA |
| Unit Conversion | DA | VA | |
| Data Integration | DA | VA | |
| Algorithm Application | DA | VA | |
| Trend Analysis | DA | VA | |
| Display Information | Report Creation | DA | BVA |
| Graph Creation and Integration into the Report | DA | VA | |
| Indicator Creation and Integration into the Report | DA | VA | |
| Explanatory Text Creation and Integration into the Report | DA | VA | |
| Identify Required Data | - | ED (External Department) | NVA |
| Create Response File | - | ED | BVA |
Table 3.
Qualitative Evaluation Questionnaire.
| Topic | BPMN Activity | Class |
|---|---|---|
| System Quality | The Power BI is flexible? | 7 |
| The Power BI is reliable? | 9 | |
| The Power BI is easy to use? | 9 | |
| The Power Bi allow the integration of new data? | 9 | |
| The Power BI response time is acceptable? | 8 | |
| Information Quality | Is the information provided by Power BI useful? | 10 |
| Is the information provided by Power BI easily accessible? | 8 | |
| Is the information provided by Power BI understandable? | 9 | |
| Does the information provide by Power BI understandable? | 8 | |
| Is the information provided by Power BI relevant for decision-making? | 9 | |
| Data Quality | Are the underlying data in Power BI accurate (scale)? | 10 |
| Are the underlying data in Power BI correct? | 10 | |
| Are the underlying data in Power BI consistent? | 10 | |
| Are the underlying data in Power BI comprehensive? | 10 | |
| Information Quality | Does Power BI increase individual productivity? | 8 |
| Does Poer BI improve individual performance? | 8 | |
| Does Poer BI improve the quality of decisions? | 8 | |
| Does Power BI allow individuals to perform tasks more quickly? | 9 | |
| Information Quality | Did Power BI meet expectations? | 9 |
| What is the level of satisfaction with the efficiency of Power BI? | 8 | |
| What is the level of satisfaction whit the effectiveness of Power BI? | 9 | |
| What is the overall satisfaction level with Power BI? | 9 |
Disclaimer/Publisher’s Note: The statements, opinions and data contained in all publications are solely those of the individual author(s) and contributor(s) and not of MDPI and/or the editor(s). MDPI and/or the editor(s) disclaim responsibility for any injury to people or property resulting from any ideas, methods, instructions or products referred to in the content. |
© 2024 by the authors. Licensee MDPI, Basel, Switzerland. This article is an open access article distributed under the terms and conditions of the Creative Commons Attribution (CC BY) license (http://creativecommons.org/licenses/by/4.0/).
Copyright: This open access article is published under a Creative Commons CC BY 4.0 license, which permit the free download, distribution, and reuse, provided that the author and preprint are cited in any reuse.


