Submitted:
14 October 2024
Posted:
15 October 2024
You are already at the latest version
Abstract
India’s increasing reliance on equated monthly installments (EMIs) has reshaped household financial behavior in ways that pose significant risks to long-term economic stability. This paper examines the growing trend of EMI-driven debt accumulation, highlighting its detrimental effect on household savings and the rising financial vulnerability across demographic groups. Leveraging data from the Reserve Bank of India (RBI), CRISIL, and the National Statistical Office (NSO), the study delves into how debt dynamics are shifting within Indian households, particularly in the context of broader economic trends. Retail credit has expanded rapidly, growing from 12.1% of GDP in 2017 to 19.4% by 2023, with housing loans now making up nearly half of all retail loans. Concurrently, the growth of unsecured loans, such as credit card debt, has surged at an annual rate of 21.3% between 2021 and 2024, reflecting the increasing ease of borrowing for consumers. However, this boom in credit has coincided with a marked drop in household financial savings, which fell to a 47-year low of 5.3% in FY22, underscoring a troubling shift from saving to borrowing. The younger population, particularly those under 35, have been the most active in taking on debt, with loans to this group nearly doubling between 2015 and 2021 due to the rise of fintech platforms and non-banking financial companies. This shift has contributed to a steep rise in debt-service-to-income ratios, amplifying the financial risks for these households in the face of potential economic shocks. By connecting these micro-level household debt trends to broader macroeconomic risks, this paper reveals how India’s EMI culture could deepen the impact of future financial crises, leading to widespread defaults and destabilizing the economy. The study calls for proactive regulatory measures and enhanced financial literacy programs to curb the growing reliance on consumer credit and mitigate the risks of a broader financial collapse.
Keywords:
EMI Dependency
; Household Debt
; Financial Vulnerability
; Consumer Credit Growth
; Net Financial Savings
; Housing Loans
; Fintech Lending
; NBFCs
; Debt-Service-to-Income Ratio
; Unsecured Loans
; Youth Borrowing
; Macro-Economic Risk
; Financial Fragility
; Regulatory Measures
1. Introduction
India’s growing reliance on equated monthly installments (EMIs) has become a defining feature of its household financial landscape. EMIs, which allow consumers to spread payments over time, are now the dominant method of financing major purchases such as homes, vehicles, and consumer goods. By fiscal year 2023, home loans alone accounted for 47.4% of India’s total retail loan portfolio, making them the largest segment of household debt (CRIF High Mark, 2024). In addition to home loans, personal loans have surged by 150% in volume between FY20 and FY23, as Indian households increasingly turn to credit to finance their lifestyles (CRIF High Mark, 2024).
However, this rising dependency on EMIs has been accompanied by a notable decline in household financial resilience. According to the Reserve Bank of India, the net financial savings rate plummeted to a 47-year low of 5.3% in FY22, indicating that more households are borrowing heavily rather than saving (RBI, 2023). This drop in savings, coupled with rising debt levels, poses serious risks to household financial health, especially in an environment of increasing interest rates and inflation. Many households are now dedicating significant portions of their income to servicing long-term loans, making them financially vulnerable in the face of economic shocks.
The ease of access to credit, facilitated by non-banking financial companies (NBFCs) and digital lending platforms, has further fueled the EMI boom, particularly among the middle class. The debt-service-to-income ratio has steadily increased over the years, as households take on more loans to meet their immediate financial needs. Additionally, unsecured loans such as credit card debt have grown at an average annual rate of 21.3% between 2021 and 2024, further exacerbating the financial burden on Indian families (CRISIL, 2023).
A significant portion of this borrowing has come from younger consumers, particularly those under the age of 35. This demographic has seen its loan volumes nearly double between 2015 and 2021, largely driven by the rise of digital lending platforms and fintech companies (Home Credit India, 2023). These younger borrowers are increasingly leveraging their future income to meet present consumption needs, often through high-interest, short-term loans that add to their financial stress.
Figure 1.
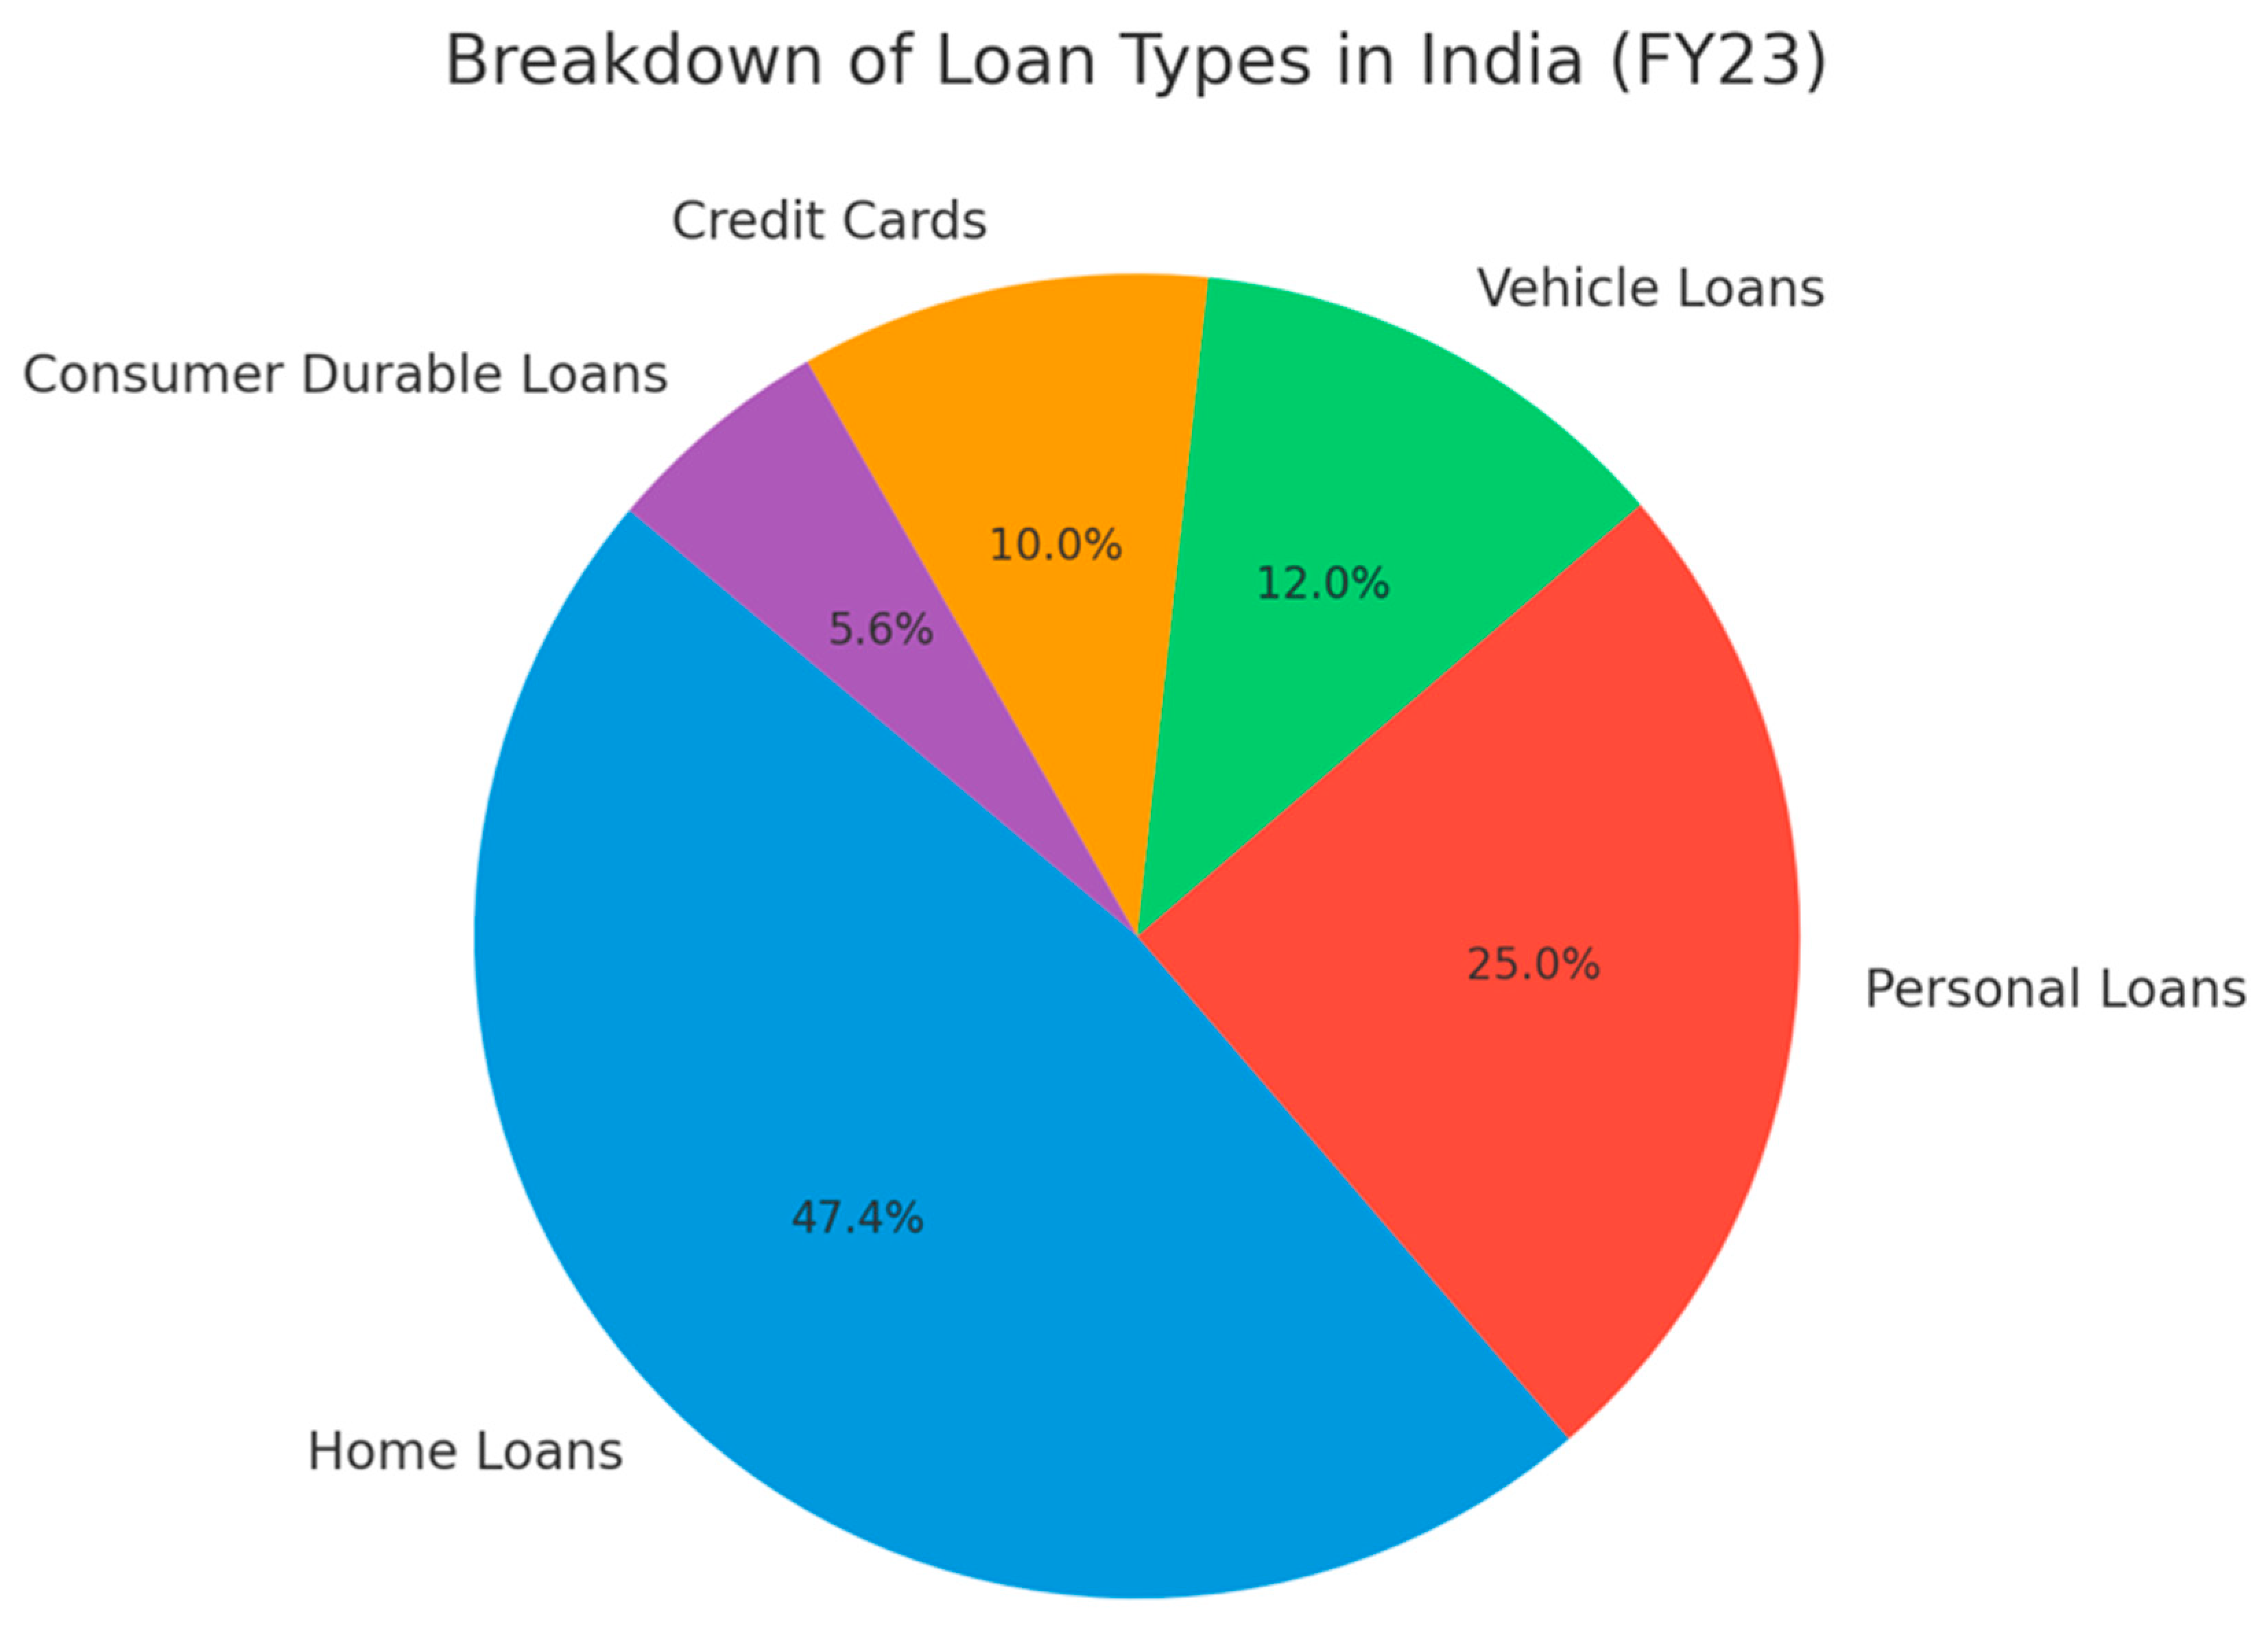
Breakdown of Loan Types in India (FY23). The pie chart demonstrates the dominance of home loans, comprising 47.4% of total retail loans, followed by personal loans at 25%. Vehicle loans account for 12%, with credit cards and consumer durable loans making up 10% and 5.6%, respectively. Source: CRIF High Mark, 2024.
Figure 1.
Breakdown of Loan Types in India (FY23). The pie chart demonstrates the dominance of home loans, comprising 47.4% of total retail loans, followed by personal loans at 25%. Vehicle loans account for 12%, with credit cards and consumer durable loans making up 10% and 5.6%, respectively. Source: CRIF High Mark, 2024.
This growing dependence on EMI-based borrowing raises critical questions about the long-term sustainability of household finances in India. Rising debt-service-to-income ratios, declining savings, and increasing reliance on unsecured loans are all warning signs of a potential financial crisis if current trends continue unchecked. With inflationary pressures and global economic uncertainties further compounding these risks, there is a need for greater regulatory oversight and enhanced financial literacy programs to ensure that households are not over-leveraging themselves.
In this paper, we will explore how India’s reliance on EMI-driven borrowing is reshaping household financial stability and assess the potential systemic risks it poses to the broader economy. By focusing on EMI-specific trends, this study aims to provide a comprehensive understanding of how debt is reshaping consumption patterns and what policy measures can be implemented to mitigate these risks.
2. The Evolution of EMI Dependency in India: Historical and Contemporary View
2.1. Historical Context
The development of India’s credit system has undergone profound changes over the past two decades, reflecting the country’s shift from a cash-based economy to a credit-driven one. Until the early 2000s, borrowing was largely confined to high-income groups, and credit access for the middle and lower-middle classes was limited. This changed dramatically as India’s banking sector expanded, aided by regulatory reforms and technological innovations that enabled financial inclusion. The proliferation of non-banking financial companies (NBFCs) and the rise of digital lending platforms have accelerated this transformation, making credit more accessible to a broader segment of society.
In particular, equated monthly installments (EMIs) have become a key feature of consumer financing, allowing households to purchase goods and services without upfront payments. The period from 2010 onward saw an explosion in EMI-driven lending, with housing loans leading the way. The accessibility of home loans, coupled with government incentives such as tax deductions on interest payments, contributed to a significant rise in home ownership among the middle class. By fiscal year 2023, home loans constituted 47.4% of the total retail loan portfolio, compared to just 25% in 2005 (CRIF High Mark, 2024).
2.2. Statistics on Credit Penetration
Credit penetration in India has grown exponentially since the early 2000s, particularly within the middle and lower-middle classes. This is evidenced by the sharp increase in household debt as a percentage of GDP, rising from 11.6% in 2001 to 19.4% in 2023 (RBI, 2023). The introduction of innovative financial products, such as “buy now, pay later” (BNPL) schemes, has further propelled EMI usage, especially for short-term financing of consumer goods. As of 2023, personal loans, including BNPL, accounted for 25% of retail credit, a dramatic increase from just 5% in 2015 (CRISIL, 2023).
Figure 2.
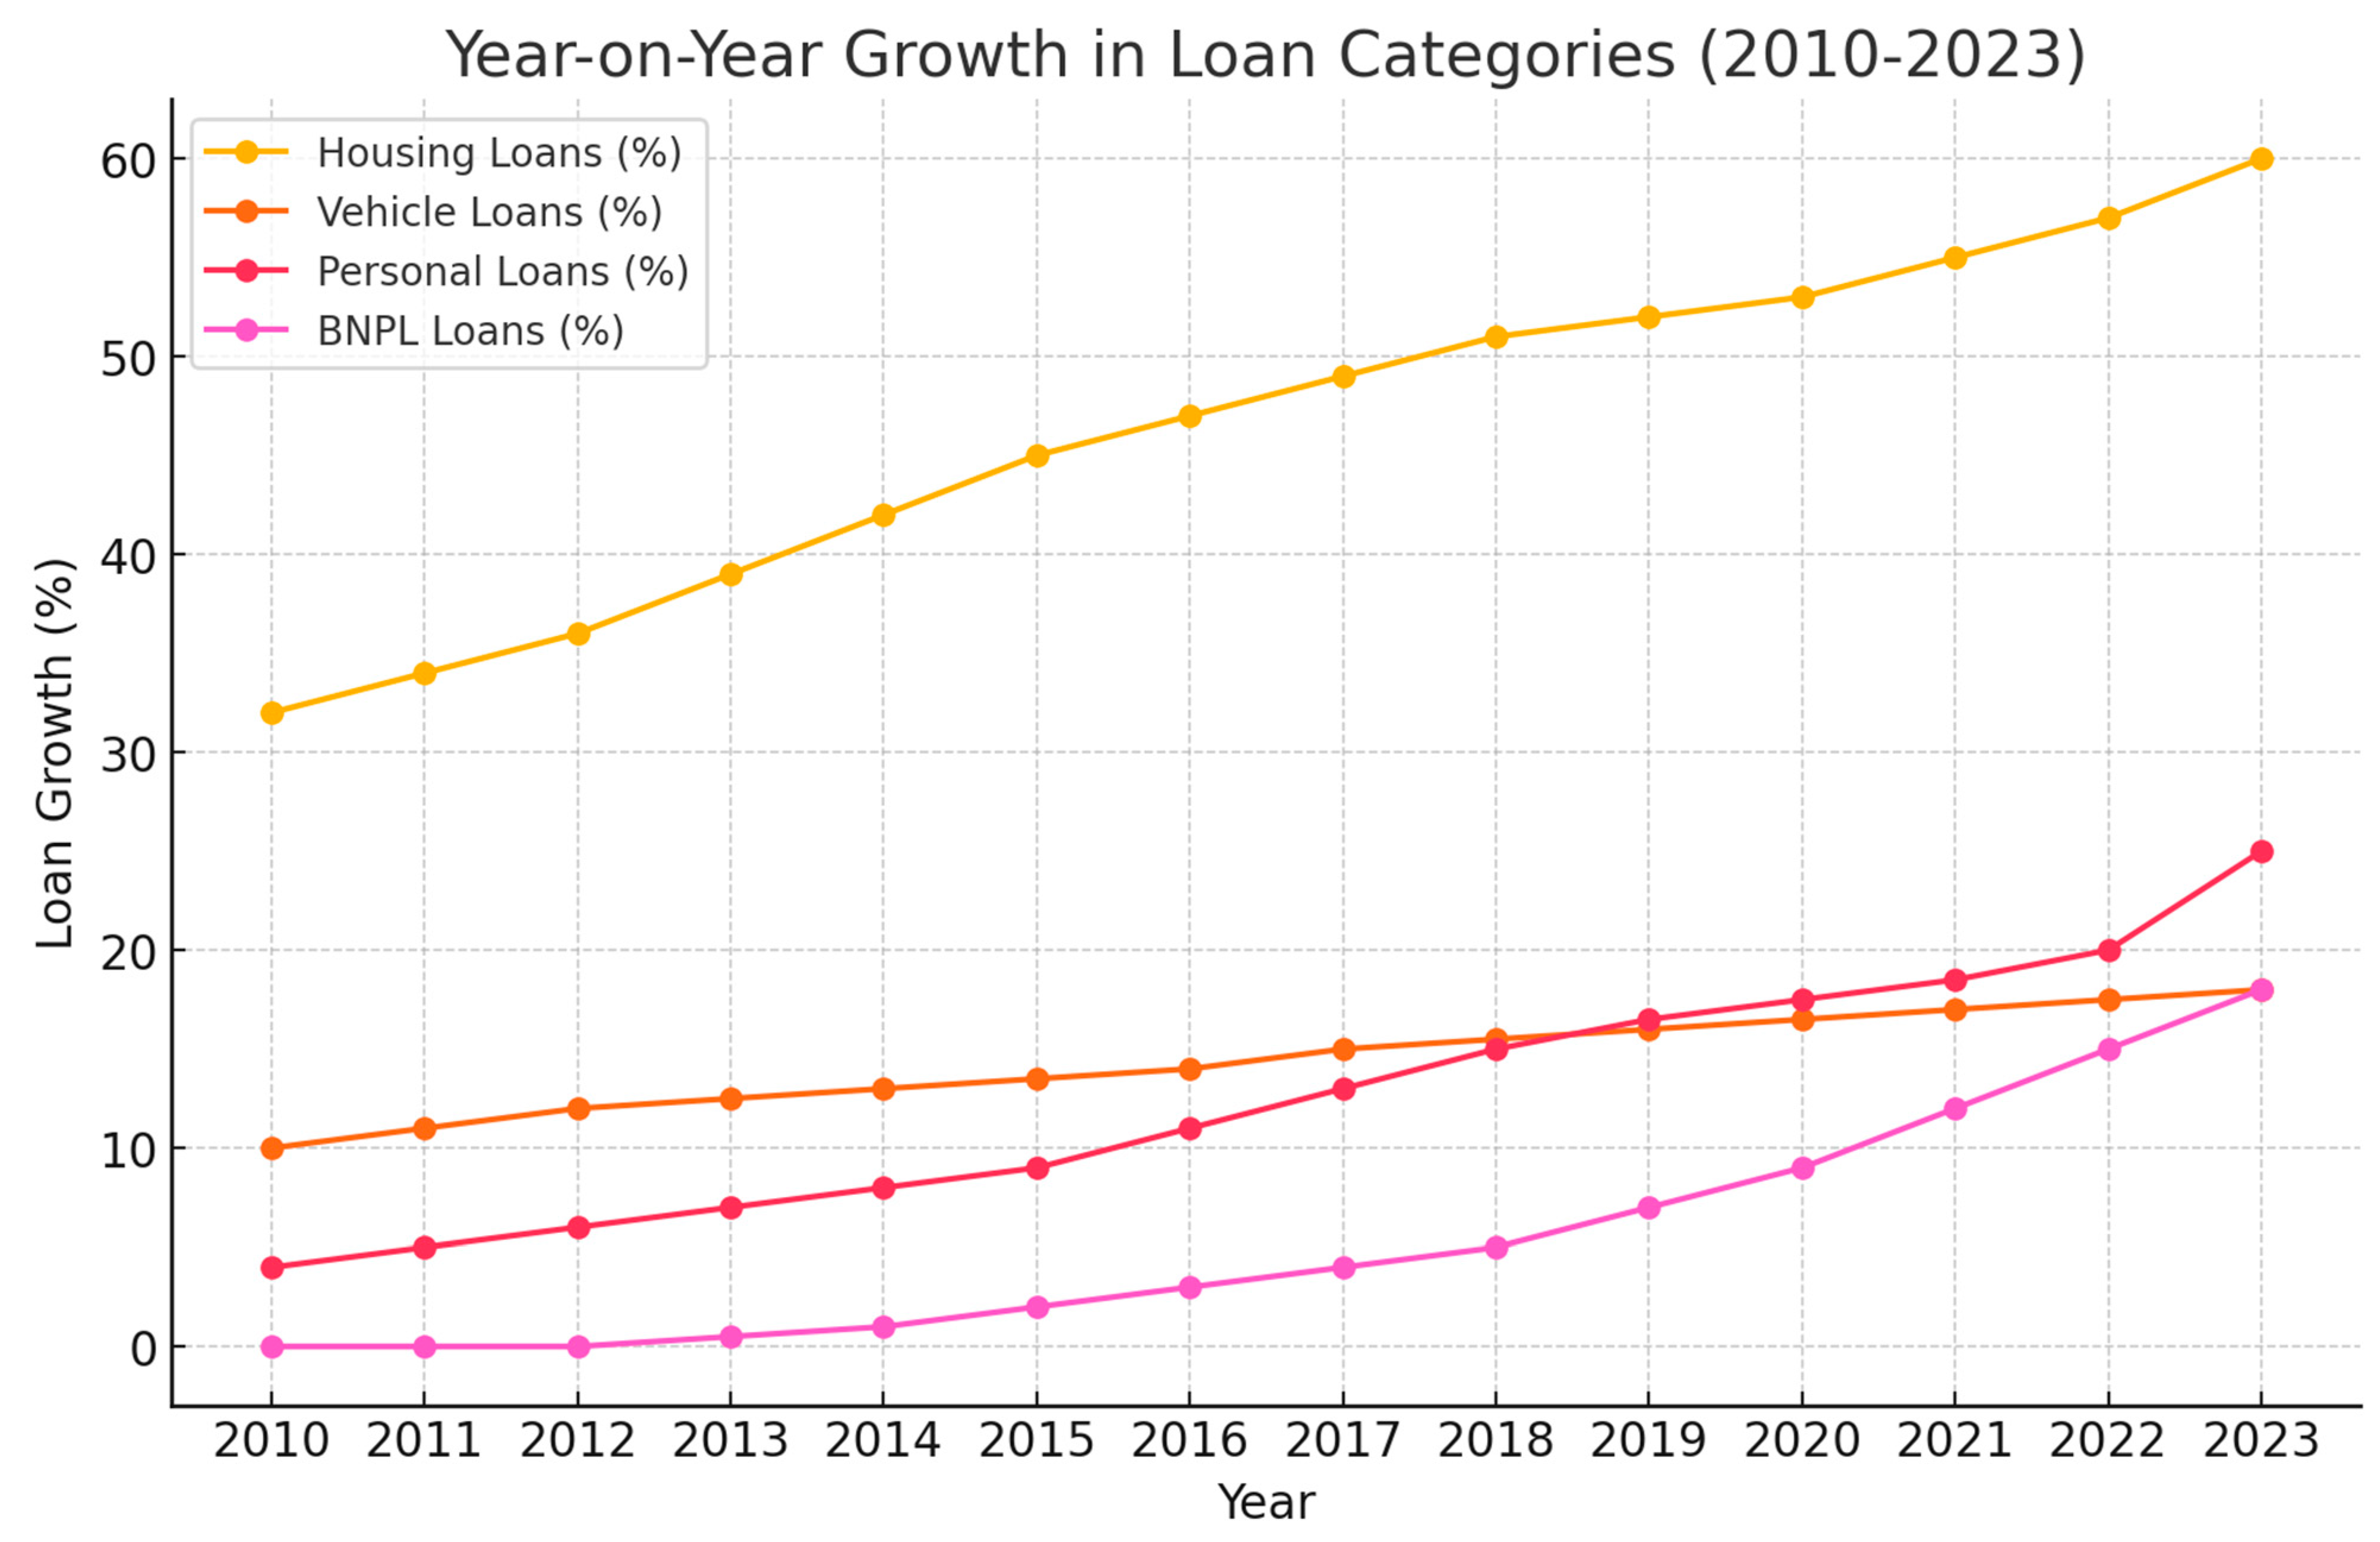
Year-on-Year Growth in Loan Categories (2010-2023). This graph illustrates the sharp growth in housing loans, which consistently dominate the retail loan market, while personal loans, BNPL services, and vehicle loans show significant growth post-2015. Source: RBI, 2023; CRISIL, 2023.
Figure 2.
Year-on-Year Growth in Loan Categories (2010-2023). This graph illustrates the sharp growth in housing loans, which consistently dominate the retail loan market, while personal loans, BNPL services, and vehicle loans show significant growth post-2015. Source: RBI, 2023; CRISIL, 2023.
2.3. Technology and Consumer Behavior
The rapid penetration of digital lending platforms and fintech innovations has revolutionized credit access in India. Before the advent of digital finance, traditional banks were the primary lenders, often requiring extensive documentation and collateral. However, the emergence of fintech platforms and NBFCs has made credit much more accessible, especially for younger consumers. These platforms leverage technology to offer seamless, paperless loan approvals, often with minimal documentation and quicker turnaround times.
By 2021, fintech lending accounted for 47% of all digital credit disbursements, with younger borrowers (aged below 35) being the largest user group (CRIF High Mark, 2023). Fintech’s role in facilitating unsecured loans—such as personal loans and BNPL services—has been particularly pronounced. For instance, BNPL transactions grew by over 400% between 2018 and 2023, driven by younger consumers looking for flexible payment options.
The demographic shift toward younger borrowers is notable, with loan volumes for individuals under 35 nearly doubling between 2015 and 2021 (Home Credit India, 2023). This trend is also reflected in the rising use of EMIs for discretionary spending, such as electronics, apparel, and travel.
Figure 3.
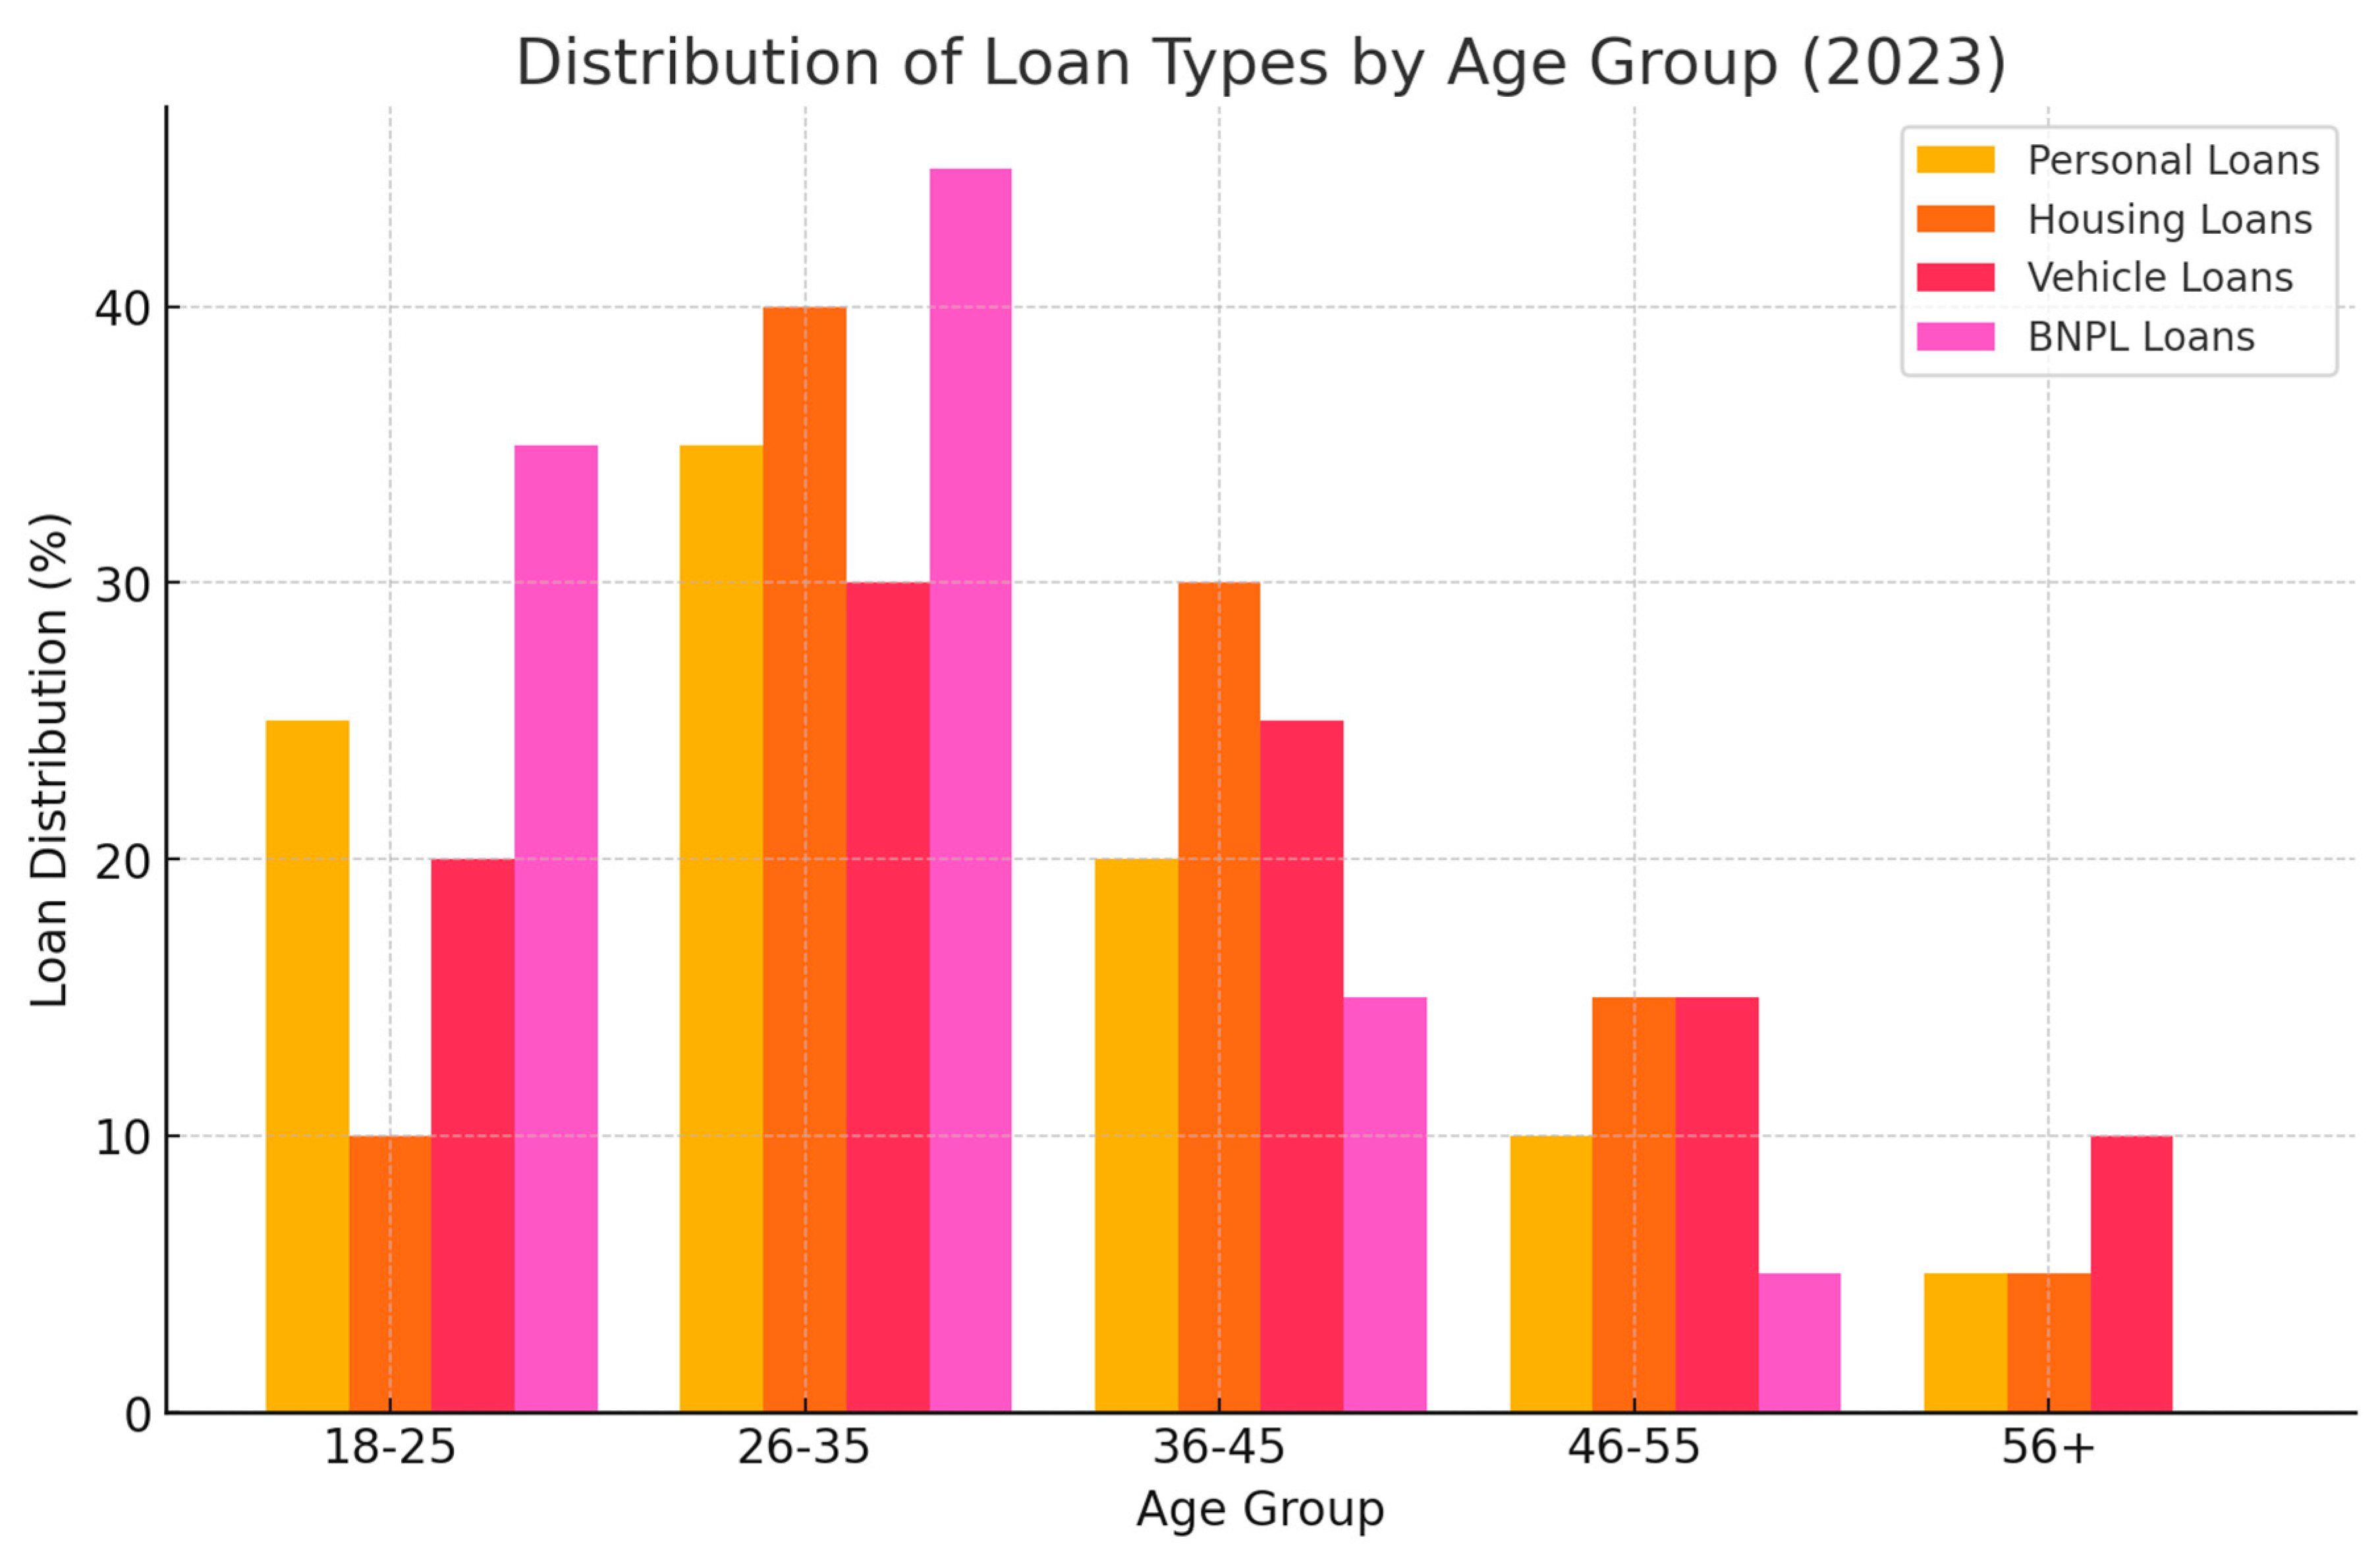
Distribution of Loan Types by Age Group (2023). This histogram highlights the loan distribution by age, with younger consumers (below 35) having a higher share of personal loans and BNPL services compared to older age groups, who favor housing loans. Source: Home Credit India, 2023.
Figure 3.
Distribution of Loan Types by Age Group (2023). This histogram highlights the loan distribution by age, with younger consumers (below 35) having a higher share of personal loans and BNPL services compared to older age groups, who favor housing loans. Source: Home Credit India, 2023.
2.4. Current Data Analysis
As of fiscal year 2023, the composition of household debt in India reveals a marked shift toward unsecured loans, particularly personal loans and BNPL schemes. Housing loans continue to dominate, but the rapid rise in other categories is notable. The share of personal loans in the retail loan portfolio grew from 5% in 2015 to 25% in 2023, while vehicle loans have seen more modest growth, stabilizing at 12% of the total portfolio (RBI, 2023).
2.5. Role of Digital Lending Platforms
The rapid adoption of digital platforms and the proliferation of NBFCs have transformed India’s credit ecosystem. Fintech platforms have democratized access to credit, allowing younger, tech-savvy consumers to avail themselves of loans without traditional barriers such as extensive documentation or lengthy approval processes. By 2023, NBFCs accounted for 31% of total retail loans, with much of this growth fueled by digital lending platforms (CRISIL, 2023).
In conclusion, the evolution of EMI dependency in India is a product of both historical shifts in credit availability and contemporary technological innovations. The rise of digital platforms, combined with changes in consumer behavior, has made credit more accessible but also raised questions about financial sustainability, particularly for younger consumers who are increasingly reliant on unsecured loans. As India’s credit ecosystem continues to evolve, understanding these trends is crucial for assessing the long-term impact on household financial health.
3. Analysis of Household Debt and Financial Health
3.1. Household Debt-to-Income Ratios
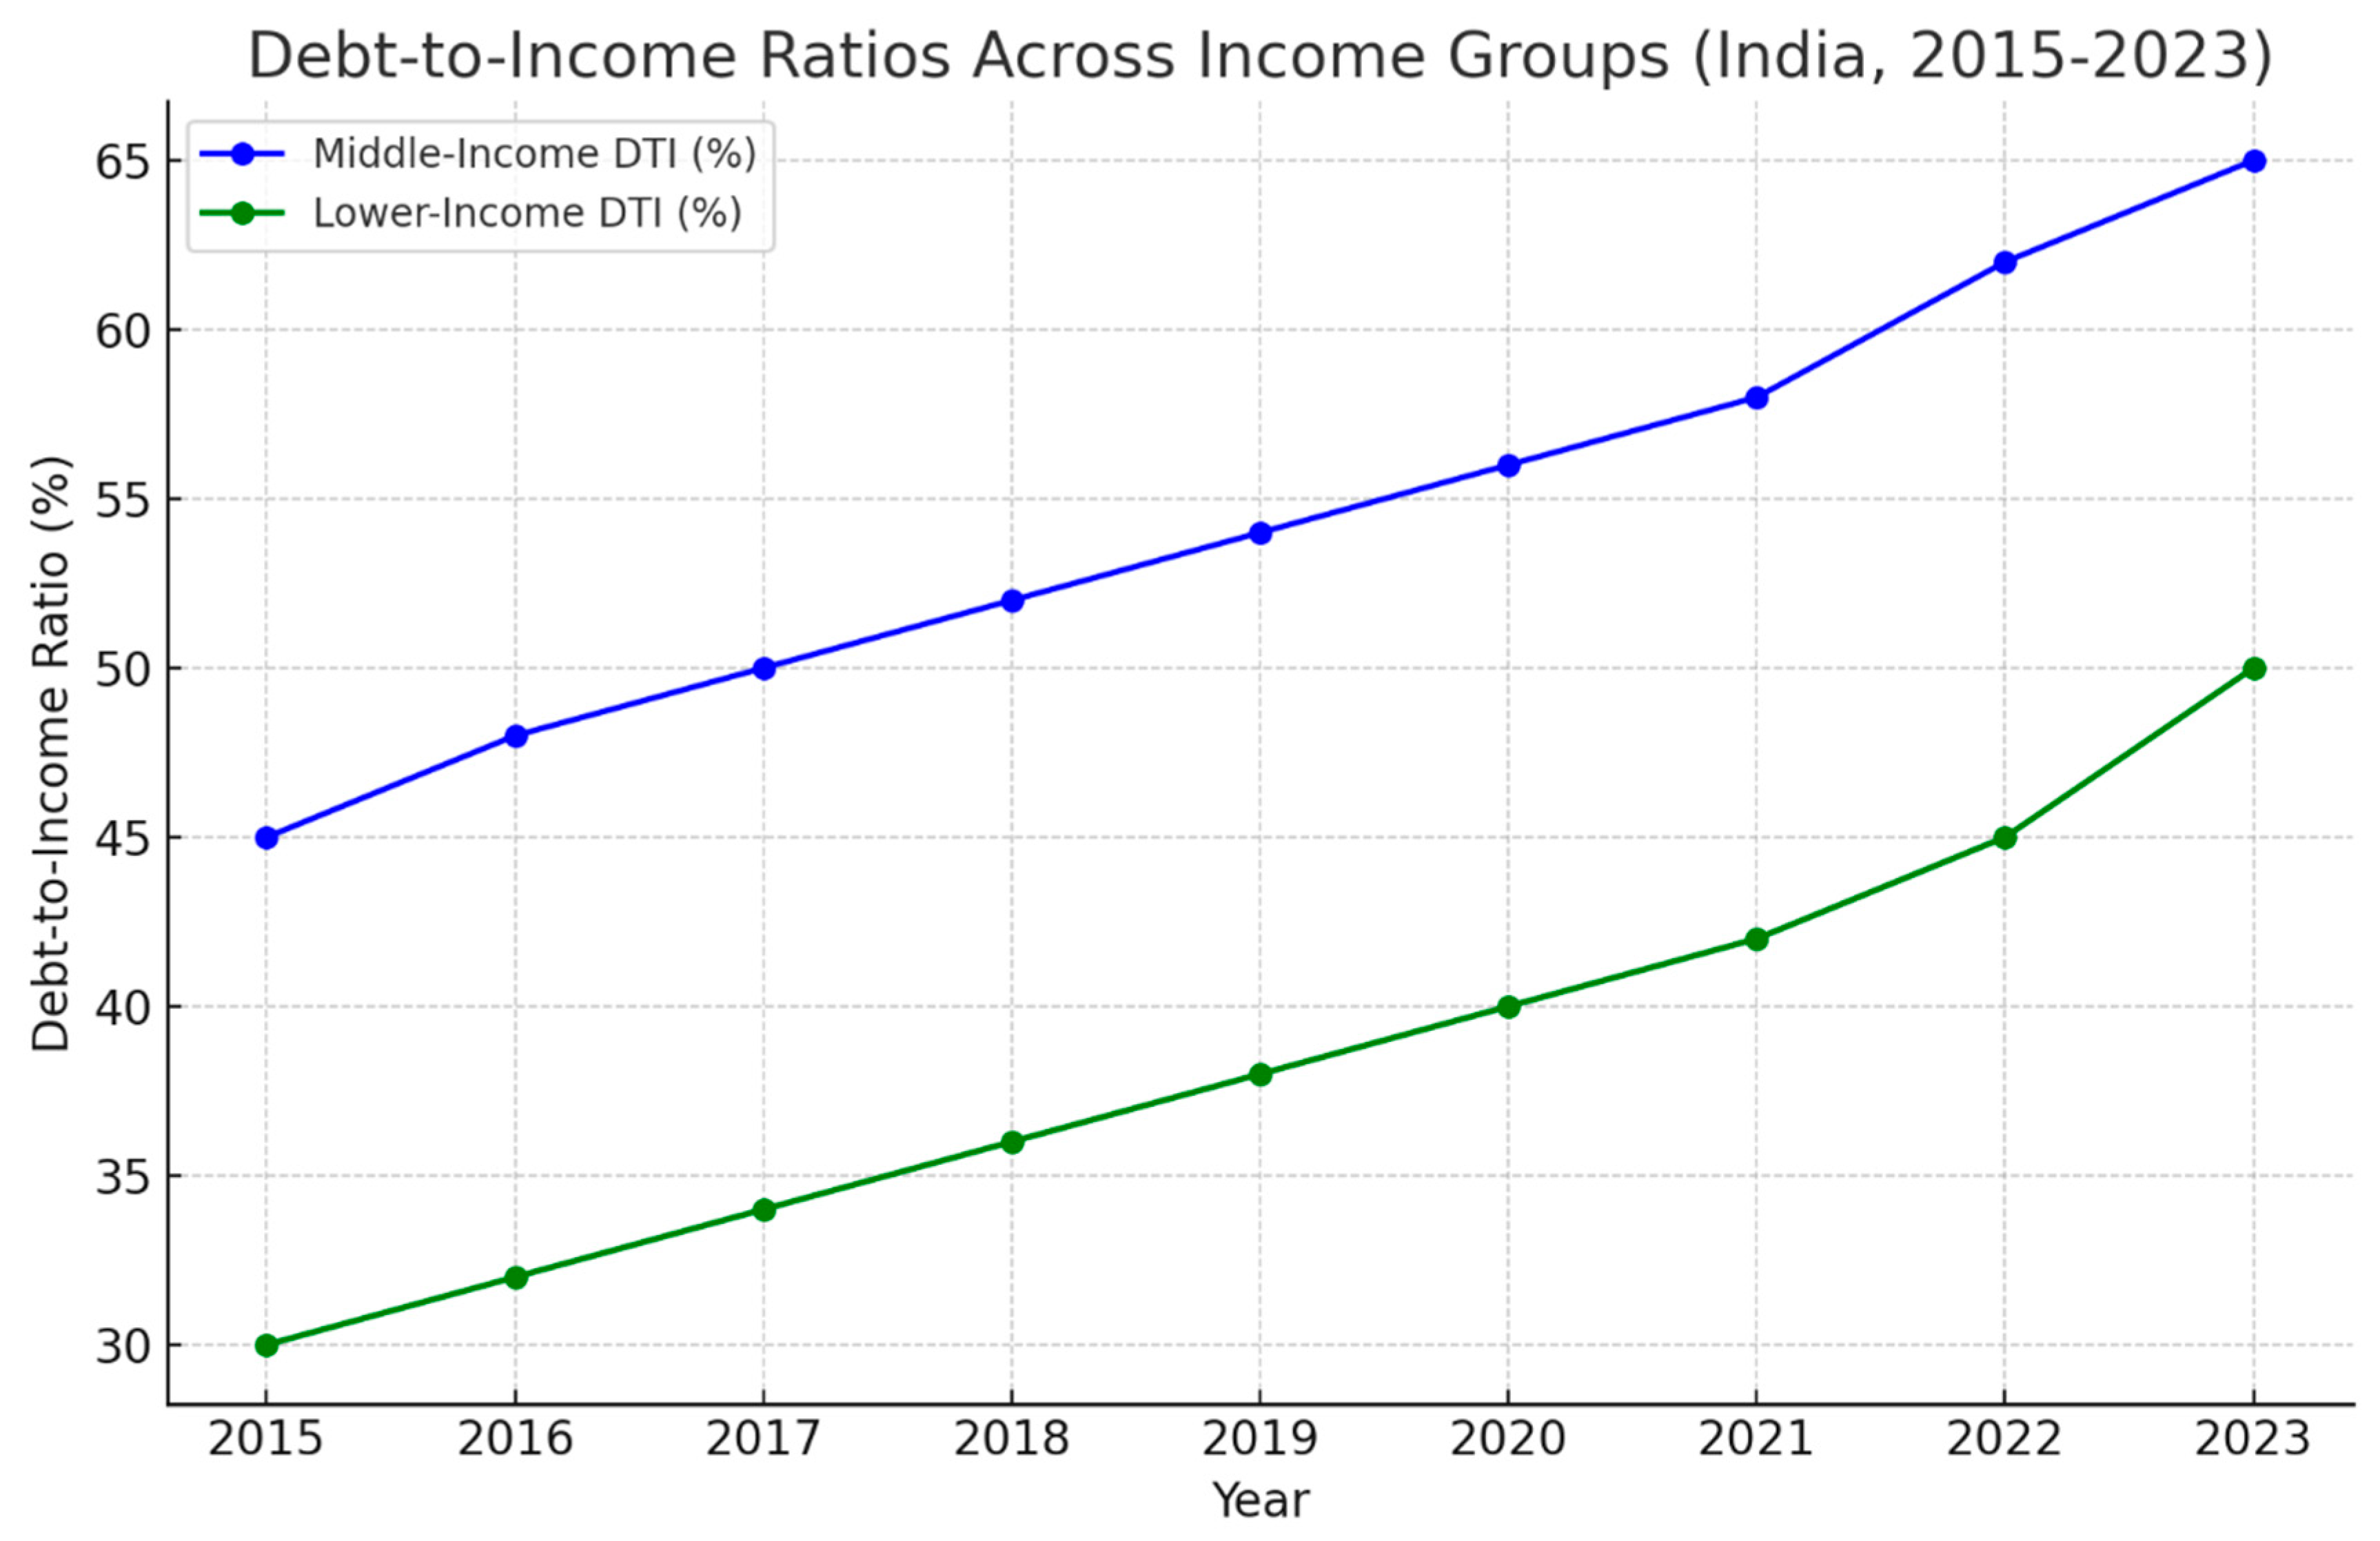
In India, the debt-to-income ratio (DTI) has been steadily rising, particularly among middle-income and lower-income households. The DTI ratio represents the percentage of a household’s gross income that goes toward paying off debt, including EMIs for housing, vehicles, and other loans. Recent data from the Reserve Bank of India (RBI, 2023) highlights that for middle-income households, the DTI ratio has climbed from 45% in 2015 to 65% in 2023, indicating a significant burden on disposable income. Comparatively, lower-income households, whose earnings are primarily directed toward essentials, have seen their DTI ratio increase from 30% to 50% over the same period (RBI, 2023).
High DTI ratios are directly linked to shrinking savings and reduced spending on non-essential goods, as households direct larger portions of their income to servicing debt. In countries like Greece and Spain, similar trends of over-leveraging played a crucial role in their financial crises. For example, prior to the 2008 global financial crisis, Greece’s DTI ratio surged to 70%, leaving households vulnerable to income shocks and reducing their financial resilience.
Figure 4.
Debt-to-Income Ratios Across Income Groups (India, 2015-2023). This graph illustrates the rise in debt-to-income ratios among lower-income and middle-income households in India from 2015 to 2023. Source: RBI, 2023.
Figure 4.
Debt-to-Income Ratios Across Income Groups (India, 2015-2023). This graph illustrates the rise in debt-to-income ratios among lower-income and middle-income households in India from 2015 to 2023. Source: RBI, 2023.
3.2. EMI Payments and Disposable Income
High EMI payments are significantly eroding disposable income, particularly for households in urban areas. Data from CRISIL (2023) shows that for households earning less than ₹10 lakh annually, EMI payments now account for 40-50% of disposable income, leaving minimal funds for savings or discretionary spending. As a result, more households are reporting difficulties in maintaining previous consumption levels, with a sharp reduction in spending on non-essential goods and services.
3.3. Comparative Analysis: India vs. Greece and Spain
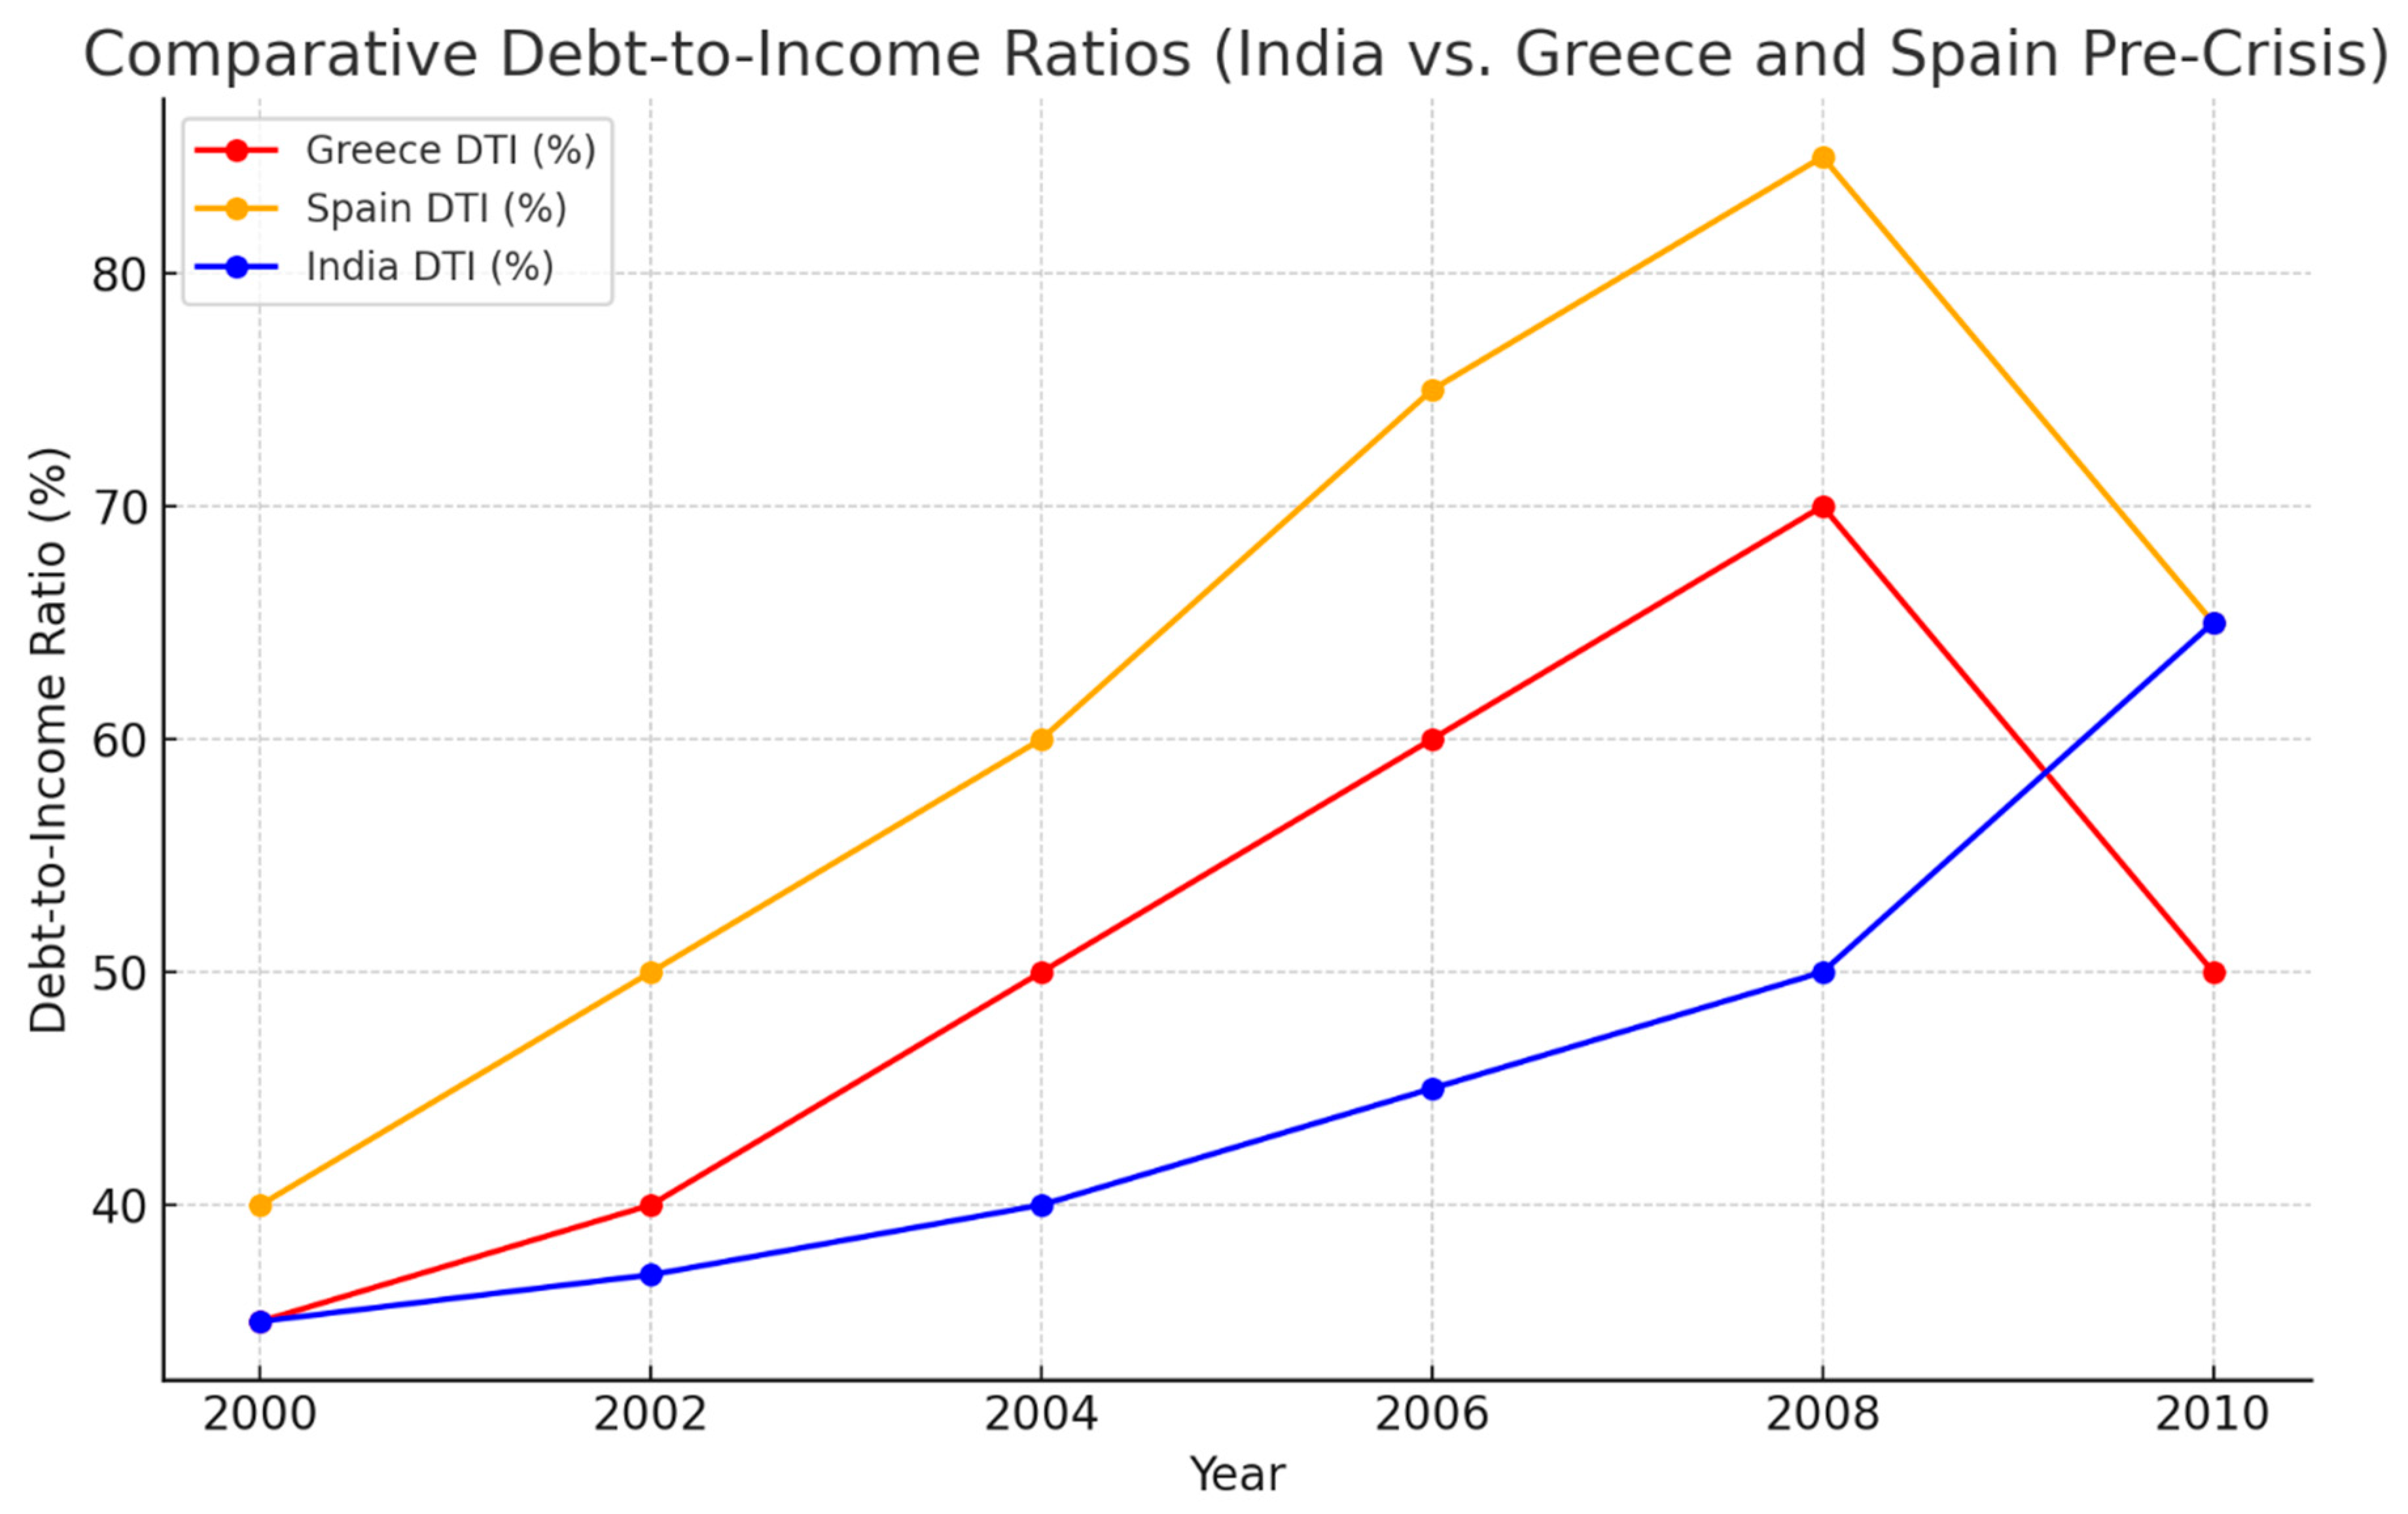
The situation in India bears similarities to the pre-crisis periods in Greece and Spain. Prior to the 2008 financial crisis, both countries experienced rapid increases in household debt, driven by the easy availability of loans, particularly housing loans. In Greece, the household debt-to-income ratio peaked at 70% in 2007, while in Spain it reached 85%, driven by a housing bubble. When economic shocks hit, households found themselves over-leveraged, resulting in widespread defaults, leading to deeper economic instability.
A comparative analysis of India’s household debt trajectory reveals concerning parallels. Although India’s current household DTI ratios are lower than those of Greece or Spain at their crisis peaks, the rapid growth of unsecured loans (such as personal loans and credit card debt) presents a similar risk. The rising debt burden is coupled with a decline in household savings, mirroring the dangerous financial imbalances that preceded the crises in Southern Europe.
Figure 5.
Comparative Debt-to-Income Ratios (India vs. Greece and Spain Pre-Crisis). This graph compares the growth in household debt-to-income ratios in India with the pre-crisis trajectories of Greece and Spain. Source: IMF, 2023; RBI, 2023.
Figure 5.
Comparative Debt-to-Income Ratios (India vs. Greece and Spain Pre-Crisis). This graph compares the growth in household debt-to-income ratios in India with the pre-crisis trajectories of Greece and Spain. Source: IMF, 2023; RBI, 2023.
3.4. Savings and Consumption Patterns
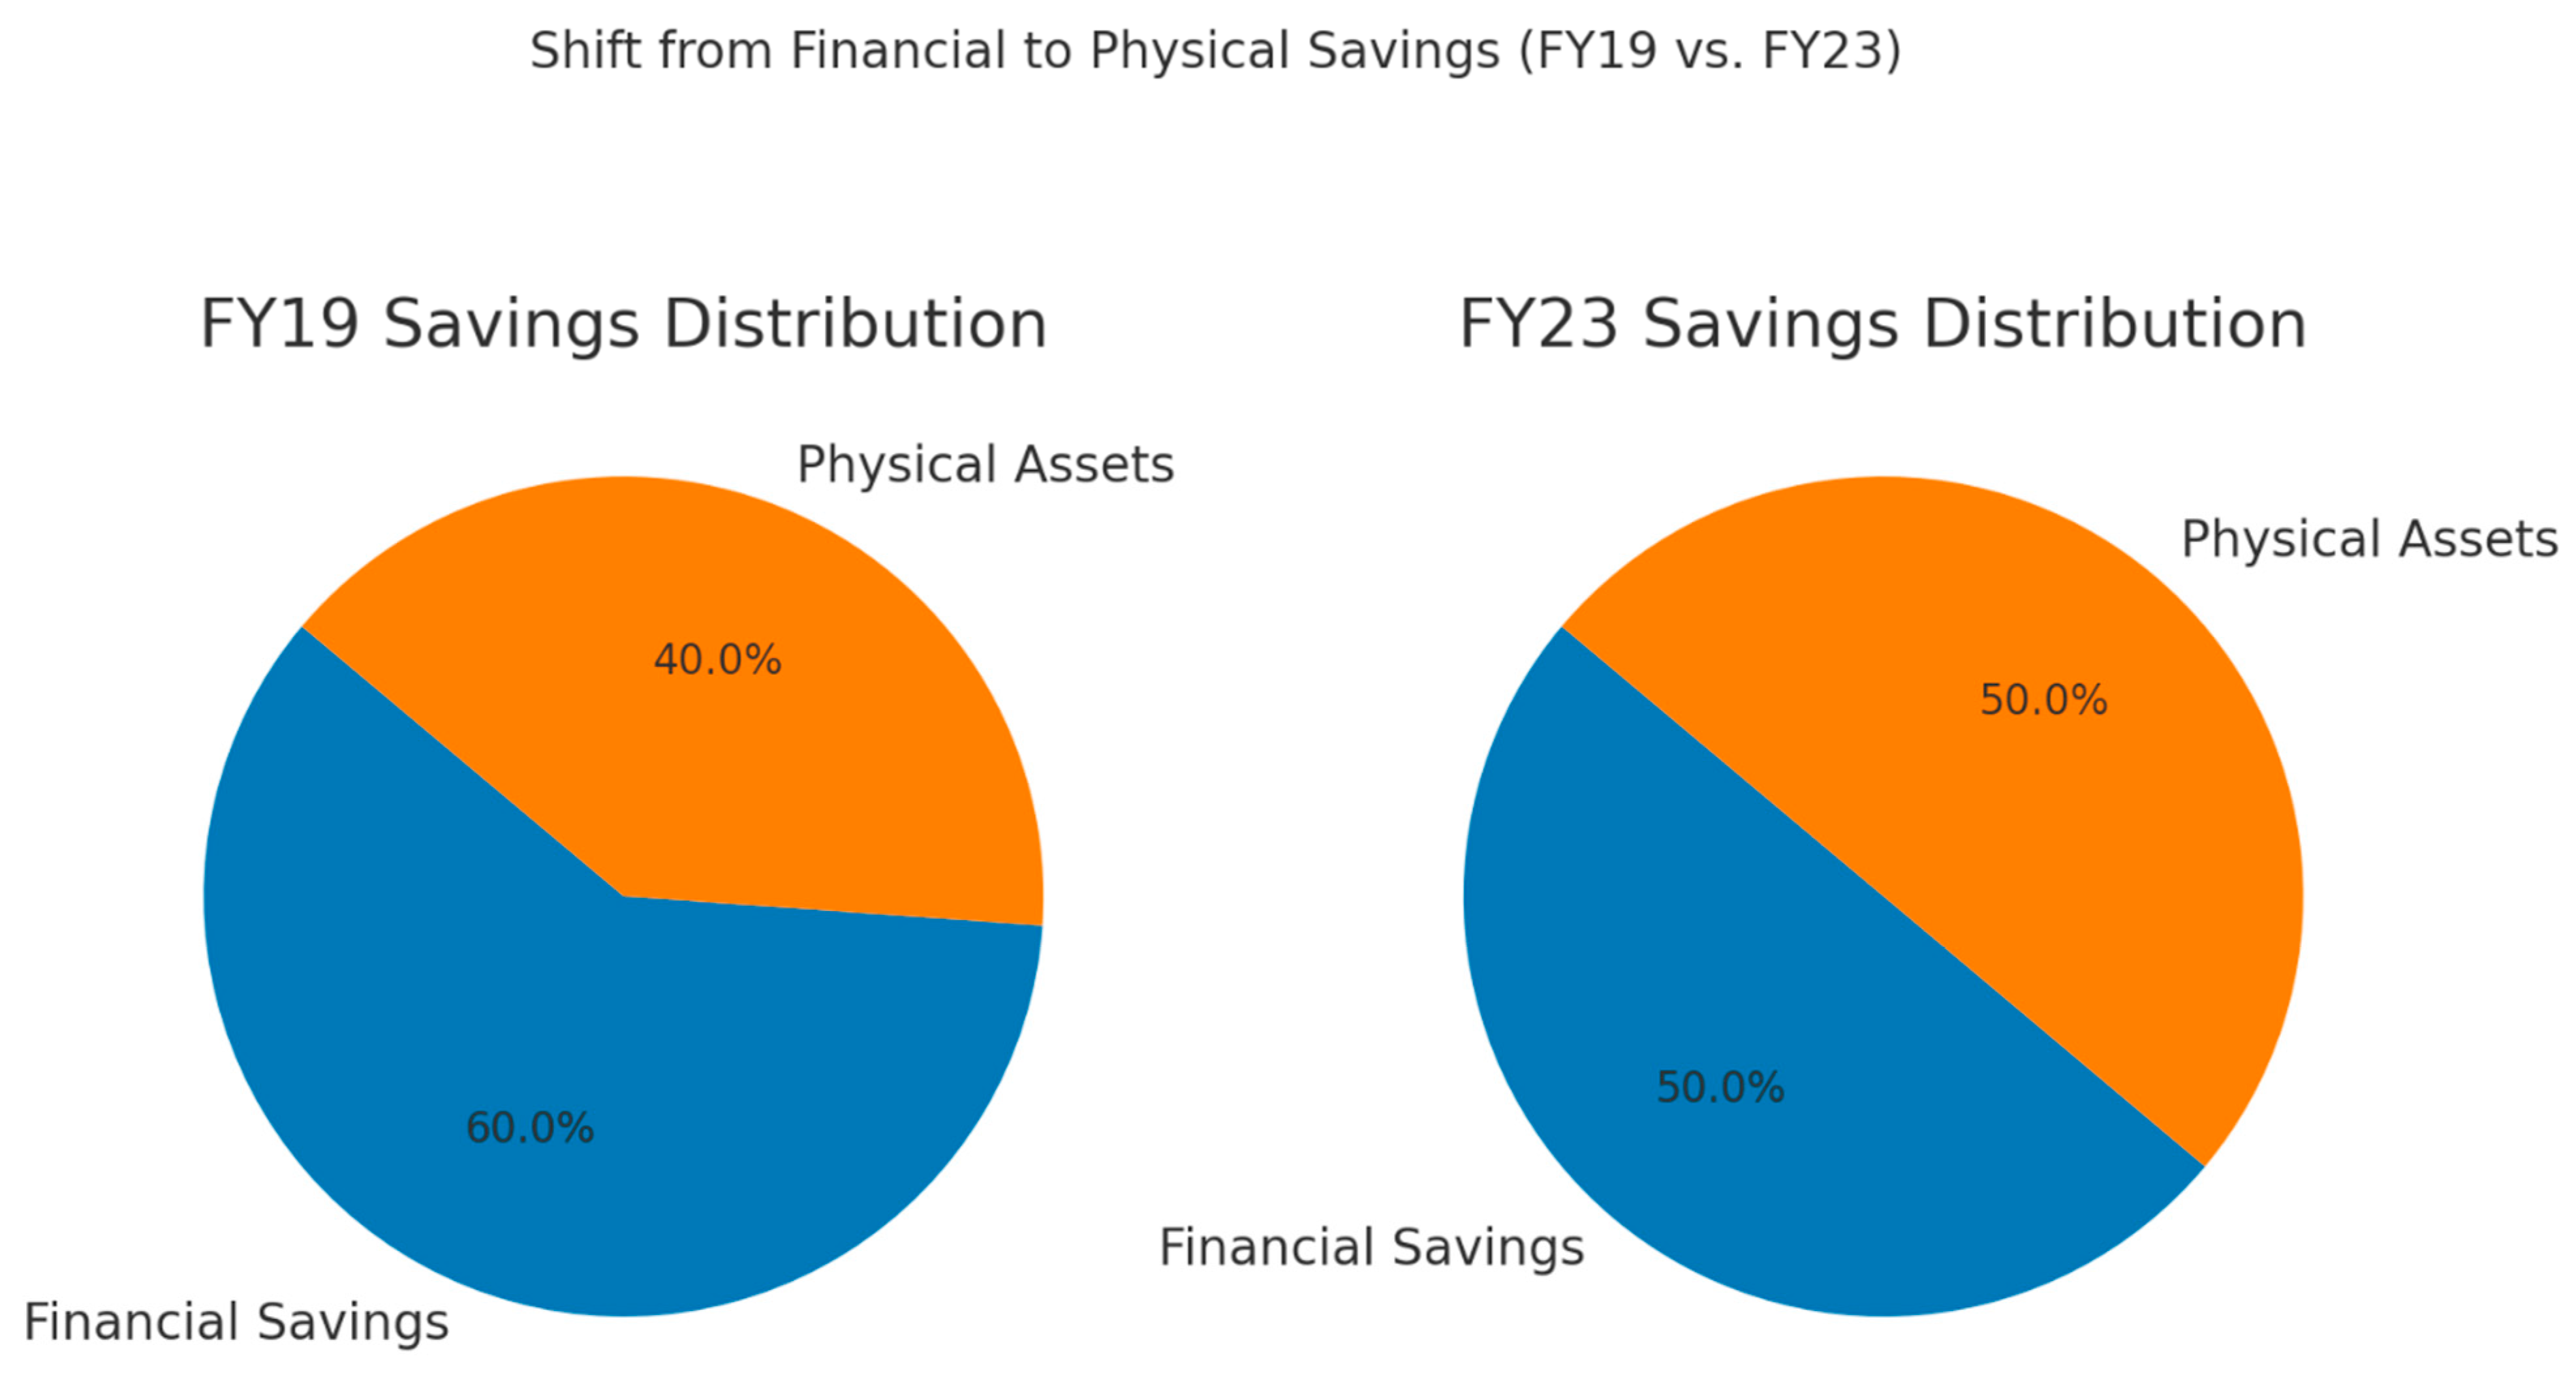
India’s declining household savings rates post-pandemic further compound the financial vulnerability of its population. According to RBI (2023), net financial savings dropped to 5.3% in FY22, marking a sharp decline from 7.9% in FY19. This reduction is partly due to the increase in consumer spending on assets (such as real estate) and the need to service rising debt obligations. Households are increasingly shifting from liquid financial savings to physical assets, such as property and gold, which are less accessible in times of crisis.
Figure 6.
Shift from Financial to Physical Savings (FY19 vs. FY23). This histogram shows the change in household savings preferences, with a clear shift from financial to physical savings post-pandemic. Source: RBI, 2023.
Figure 6.
Shift from Financial to Physical Savings (FY19 vs. FY23). This histogram shows the change in household savings preferences, with a clear shift from financial to physical savings post-pandemic. Source: RBI, 2023.
3.5. Debt-Service-to-Income Ratio (DSIR)
The Debt-Service-to-Income Ratio (DSIR) measures the percentage of income that households spend on servicing debt, including EMIs. A DSIR above 40% is considered a threshold for financial vulnerability, as it leaves households with little to no disposable income for savings or unexpected expenses. According to CRISIL (2023), nearly 45% of middle-income households in India now have a DSIR above 40%, compared to just 30% in 2015, a trend that is becoming more pronounced with the rise of personal loans and credit card debt.
3.6. Mounting Financial Pressures and Emerging Vulnerabilities
The trends highlighted in this analysis underscore the increasing financial pressures facing Indian households. Rising debt-to-income ratios, particularly in middle- and lower-income groups, combined with growing EMI obligations, are significantly constraining disposable income and diminishing savings potential. The shift from financial to physical assets as a preferred form of saving is further exacerbating this situation by reducing liquidity and increasing financial rigidity.
These developments signal a growing level of financial vulnerability, particularly as debt-service-to-income ratios rise above 40% for a significant portion of households. This threshold, often regarded as a marker of financial stress, indicates that an increasing number of families are approaching or exceeding levels of debt that could leave them unable to withstand economic shocks. The situation mirrors early warning signs observed in other economies, such as Greece and Spain, where unchecked household borrowing contributed to widespread financial instability.
As these pressures continue to build, it is crucial to assess their broader implications. The following section will explore how these growing debt burdens are translating into systemic financial vulnerability. We will examine the potential risks to household financial health and economic stability, alongside the structural factors driving this debt dependency, to provide a deeper understanding of the long-term impact on India’s financial landscape.
4. Vulnerability to External Shocks: Lessons from Global Crises
4.1. Historical Lessons
Global financial crises offer critical lessons on the vulnerabilities posed by high household debt, particularly when driven by installment-based borrowing. The 2008 financial crisis and Greece’s debt crisis stand out as cautionary tales of how over-reliance on personal debt, especially through EMIs and housing loans, can lead to massive defaults during economic downturns.
In the U.S., the 2008 financial crisis was precipitated by a collapse in the housing market. Homeowners who had taken out adjustable-rate mortgages found themselves unable to meet rising monthly payments when interest rates reset. As mortgage defaults surged, the crisis deepened, eventually affecting the global financial system. Household debt levels in the U.S. reached a peak of 99% of GDP, with mortgage default rates exceeding 11% at the height of the crisis (OECD, 2010).
Similarly, Greece entered its debt crisis in 2009, having accumulated unsustainable levels of household debt alongside government borrowing. Household debt in Greece reached 70% of GDP by 2008, and when economic shocks hit, households were unable to manage debt repayments, resulting in a rapid increase in non-performing loans. This played a critical role in deepening the financial crisis, as banks were overwhelmed by the rising defaults.

Table 1.
Comparison of Key Metrics from the 2008 Financial Crisis and Greece’s Debt Crisis.
| Metric | U.S. (2008) | Greece (2009) |
|---|---|---|
| Household Debt-to-GDP Ratio | 99% | 70% |
| Peak Mortgage Default Rate | 11% | 8.5% |
| Decline in Household Consumption | 12% | 15% |
| NPA Growth in Banking Sector | +20% | +25% |
Source: OECD, 2010; IMF, 2009.
4.2. India’s Position: Past Recessions and COVID-19
India has faced several economic shocks in the past two decades, including the global recession of 2008, the COVID-19 pandemic, and various inflationary crises driven by rising oil prices. In each case, the country’s reliance on EMIs exacerbated the financial burden on households.
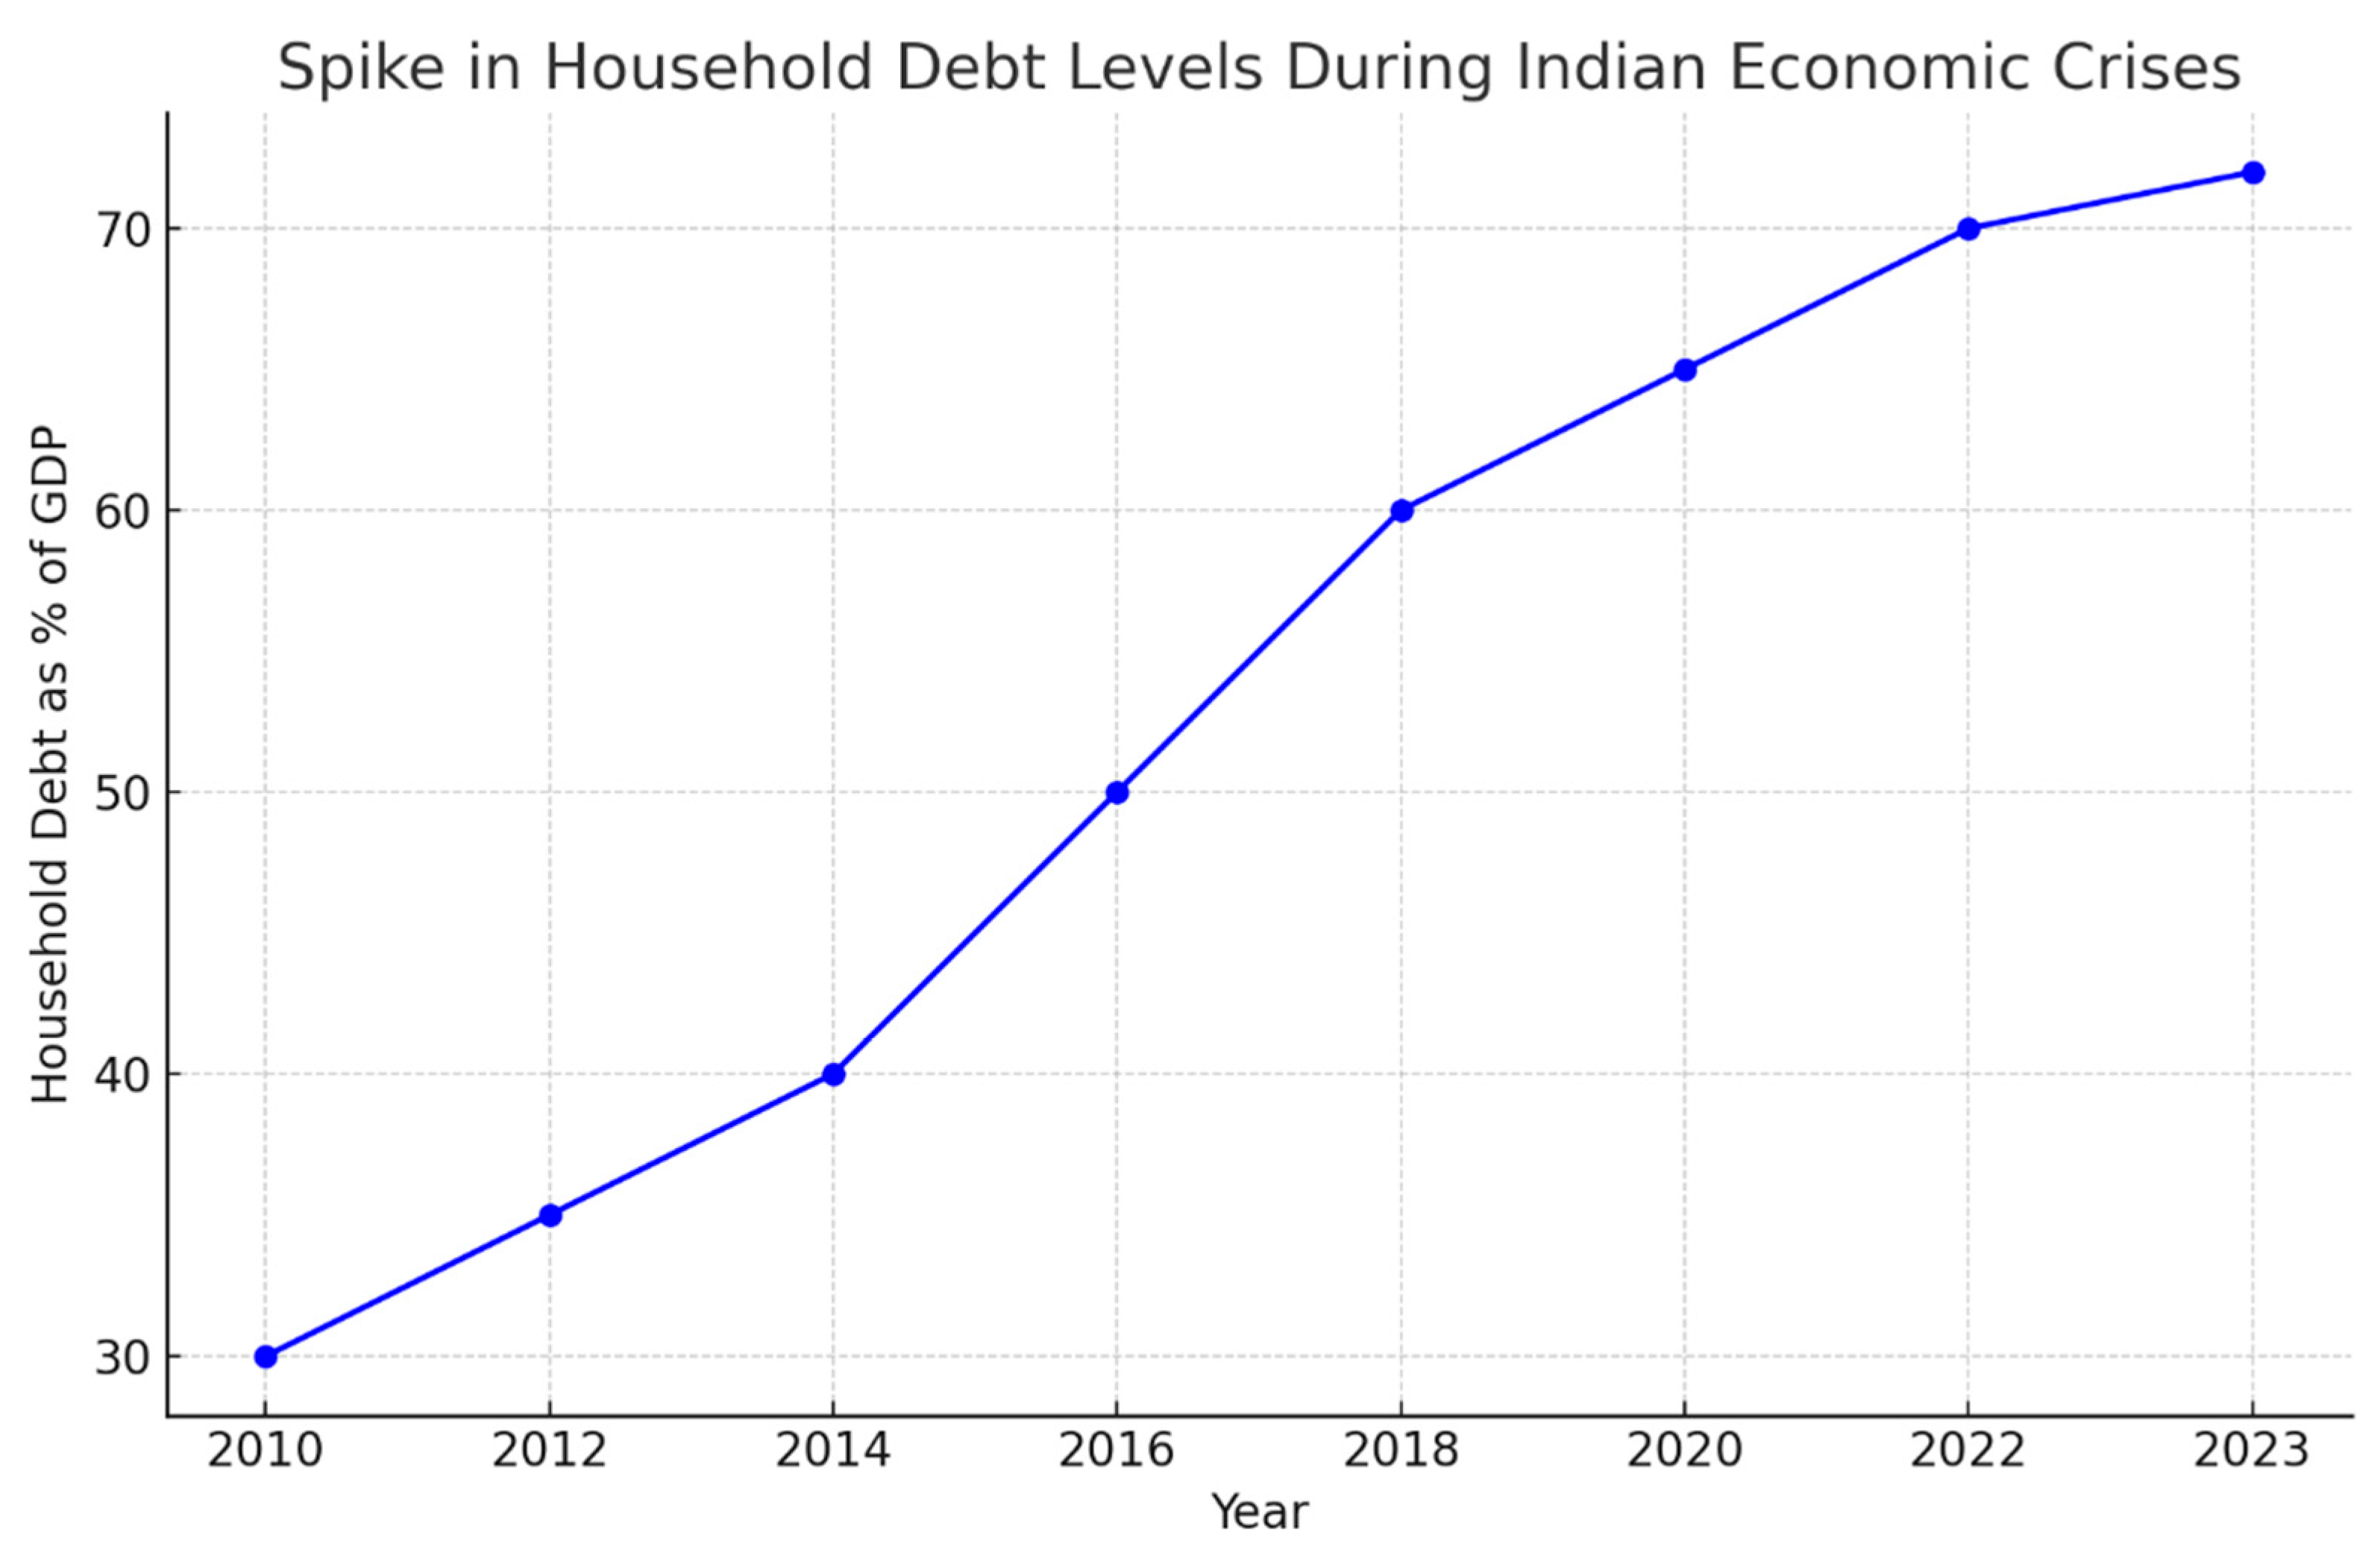
During the COVID-19 pandemic, household debt skyrocketed as incomes were disrupted due to lockdowns and business closures. According to RBI (2022), the debt-to-income ratio for middle-income households rose from 56% in FY19 to 65% in FY21, as households increasingly turned to borrowing to meet daily expenses. This was further compounded by a sharp drop in savings, with net financial savings falling to a 47-year low of 5.3% in FY22 (RBI, 2023).
Similarly, the oil price hikes of 2013-2014 had a cascading effect on inflation, which eroded disposable incomes and made EMI payments harder to service. Given that India imports over 80% of its oil, any global shock that raises energy prices can severely impact household budgets, forcing them to divert more funds toward basic necessities and away from debt repayments.
Figure 7.
Spike in Household Debt Levels During Indian Economic Crises. This line graph illustrates the sharp rise in household debt during major economic downturns in India, including the COVID-19 pandemic and oil price hikes. Source: RBI, 2023.
Figure 7.
Spike in Household Debt Levels During Indian Economic Crises. This line graph illustrates the sharp rise in household debt during major economic downturns in India, including the COVID-19 pandemic and oil price hikes. Source: RBI, 2023.
4.3. India’s High Reliance on EMIs: Future Vulnerabilities
India’s dependence on EMIs for financing housing, vehicles, and consumer goods has created a fragile economic structure, leaving households vulnerable to future global economic shocks. As of 2023, 47.4% of India’s retail loans are tied to housing, while unsecured loans like personal loans and BNPL schemes have surged, making up 25% of the loan portfolio (CRIF High Mark, 2024). The growth of unsecured credit, which lacks the security of collateralized loans, has added significant risk to the financial system.
If a global economic shock—such as a rise in oil prices or a banking crisis—were to occur, the resulting inflation and job losses would leave many households unable to meet their EMI obligations. In the event of a significant shock, India’s banking sector could face a surge in defaults, leading to an increase in non-performing assets (NPAs). This could create systemic risks for the entire financial system, as banks would struggle to recover their loans, potentially triggering a broader economic downturn.
Table 2 presents a breakdown of India’s household debt portfolio, with a focus on housing loans, personal loans, and BNPL schemes, highlighting the rising share of unsecured credit.
Table 2.
Breakdown of Household Debt Portfolio (FY23).
| Loan Type | Percentage of Total Loans (%) |
|---|---|
| Housing Loans | 47.4% |
| Personal Loans | 25% |
| Vehicle Loans | 12% |
| Credit Cards | 10% |
| BNPL and Consumer Loans | 5.6% |
Source: CRIF High Mark, 2024.
4.4. Systemic Risks: Non-Performing Assets (NPAs)
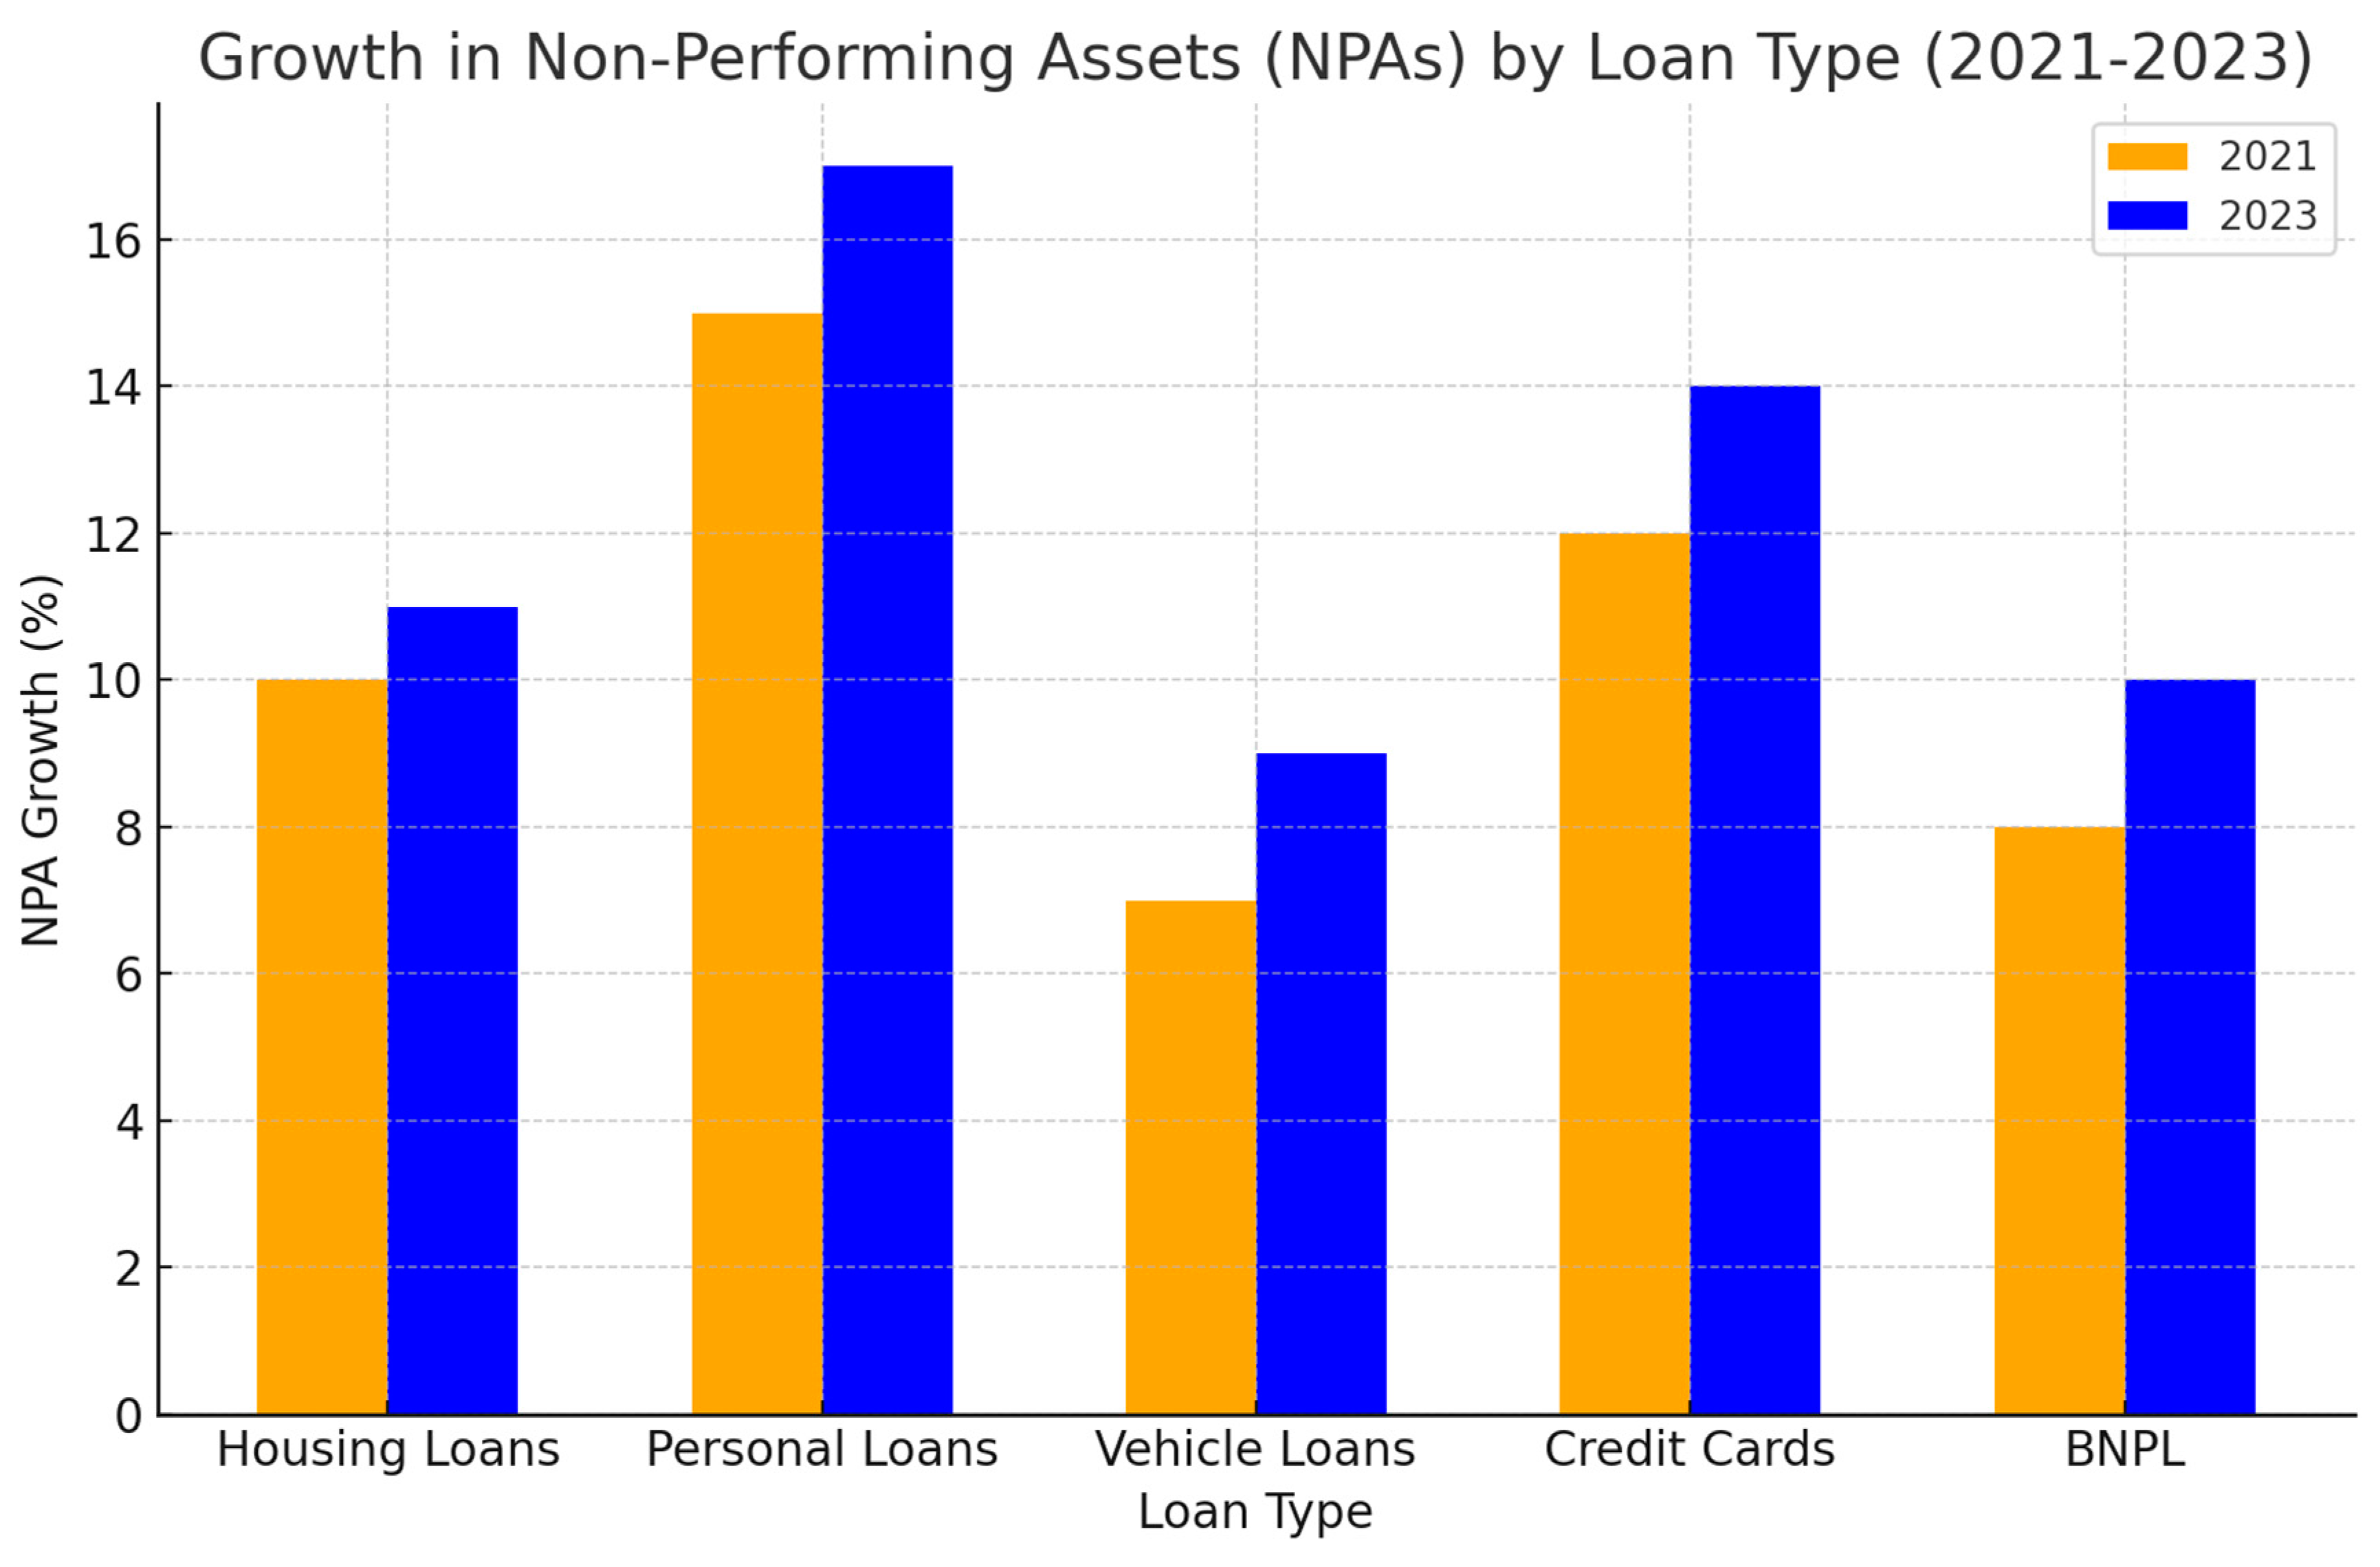
India’s banking sector faces significant risks due to rising household debt, particularly from the growth of NPAs in the retail sector. Non-performing assets occur when borrowers default on their loans, leaving banks with bad loans that must be written off. The increase in NPAs has been particularly notable in the post-pandemic period, with retail NPAs rising by 14% between 2021 and 2023 (RBI, 2023). Housing loans, which account for nearly half of all retail credit, have been especially vulnerable, as defaults in this segment have surged by 11%.
Figure 8.
Growth in Non-Performing Assets (NPAs) by Loan Type (2021-2023). This bar graph shows the growth in NPAs across various loan types, with retail loans, particularly housing and personal loans, witnessing the highest increase. Source: RBI, 2023.
Figure 8.
Growth in Non-Performing Assets (NPAs) by Loan Type (2021-2023). This bar graph shows the growth in NPAs across various loan types, with retail loans, particularly housing and personal loans, witnessing the highest increase. Source: RBI, 2023.
4.5. EMI Vulnerability and Household Defaults
As India’s household debt burden continues to rise, an increasing number of families are crossing the critical Debt-Service-to-Income Ratio (DSIR) threshold of 40%, leaving them financially vulnerable to future shocks. Households with a DSIR above 40% typically spend a large portion of their income on loan repayments, leaving little room for savings or discretionary spending. According to CRISIL (2023), 45% of Indian households are currently in this financially vulnerable category, up from 30% in 2015.
The rising reliance on unsecured loans, such as personal loans and credit card debt, further compounds the risk. These loans tend to have shorter repayment periods and higher interest rates, making them more prone to default during periods of economic stress. The rapid expansion of Buy Now, Pay Later (BNPL) services has also exposed younger borrowers to higher levels of short-term debt, adding another layer of vulnerability.
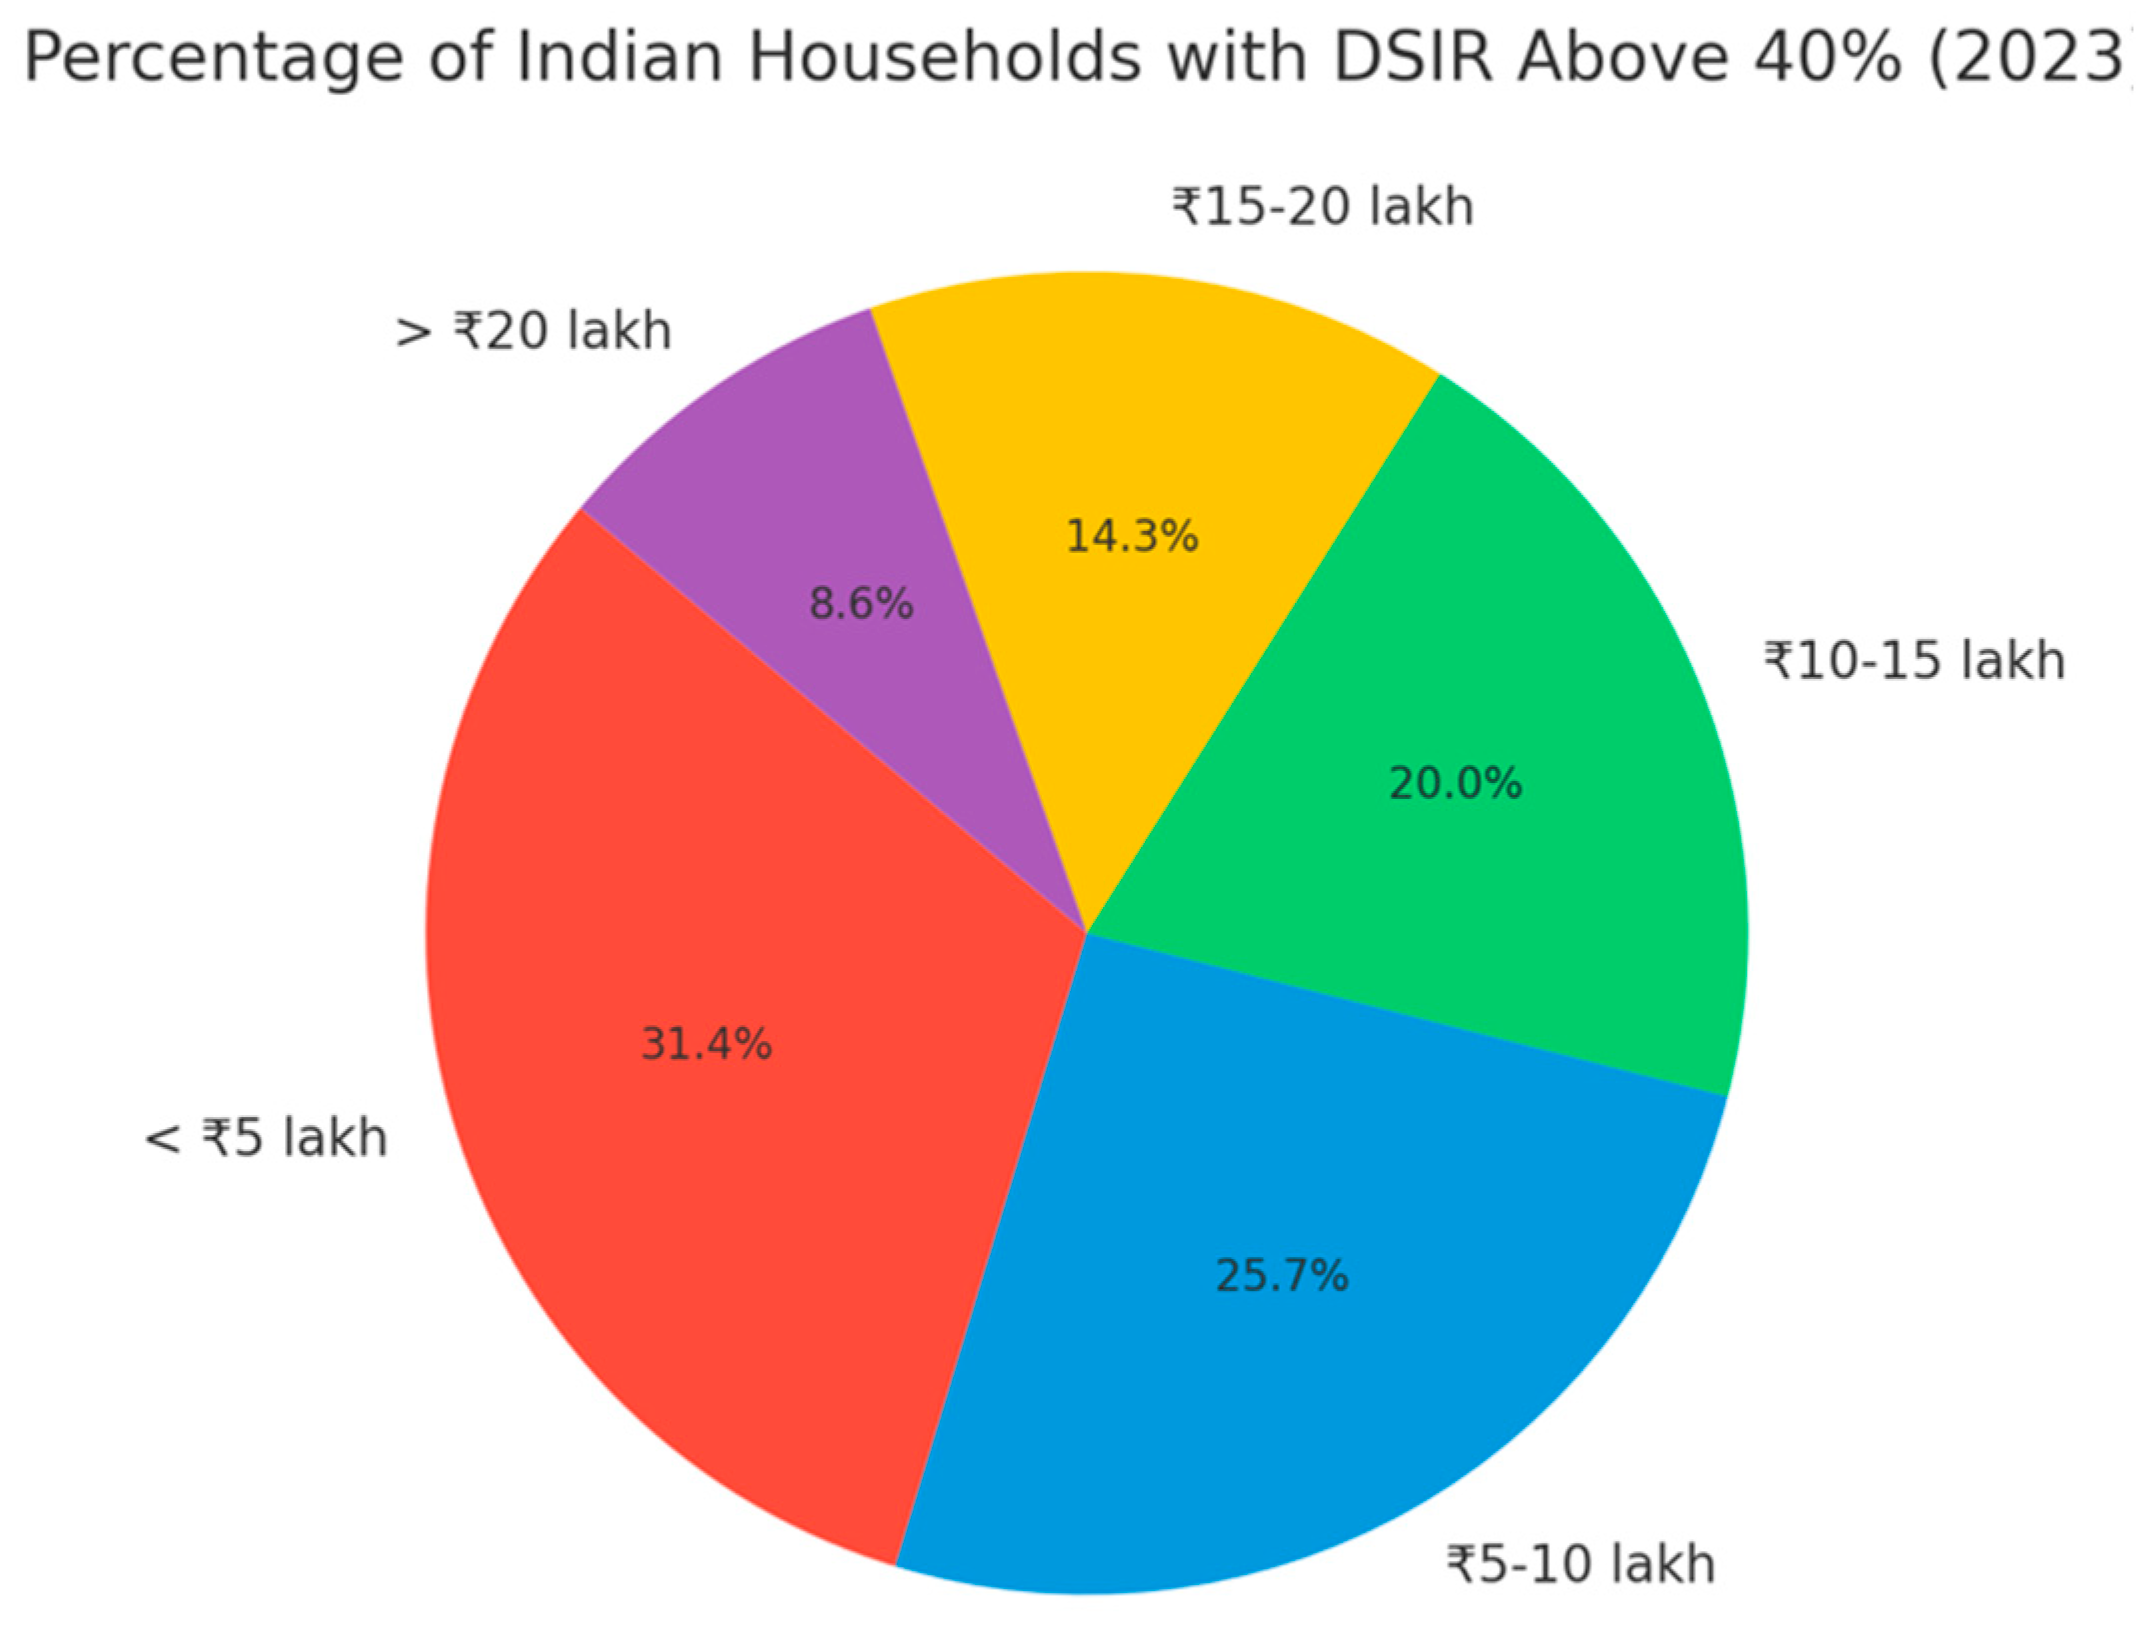
Figure 9.
Percentage of Indian Households with DSIR Above 40% (2023). This pie chart shows the percentage of households in different income brackets that have a DSIR above 40%, making them financially vulnerable. Source: CRISIL, 2023.
Figure 9.
Percentage of Indian Households with DSIR Above 40% (2023). This pie chart shows the percentage of households in different income brackets that have a DSIR above 40%, making them financially vulnerable. Source: CRISIL, 2023.
5. Policy and Structural Analysis: What Went Wrong?
5.1. Financial Regulation and EMI Growth
The exponential growth of EMI-based loans in India has outpaced the regulatory framework designed to oversee it. While RBI guidelines provide general oversight for lending practices, there has been a notable gap in regulating the surge in unsecured lending, particularly personal loans and Buy Now, Pay Later (BNPL) schemes. As of 2023, 25% of all retail loans in India are unsecured, a significant jump from 10% in 2015 (CRISIL, 2023). These loans, often taken by younger consumers with lower financial stability, are more prone to default, exacerbating household financial stress.
One of the major concerns is the lack of stringent checks on the ability of borrowers to repay these loans. While banks are required to conduct basic credit checks, the rise of fintech platforms and non-banking financial companies (NBFCs) has led to an oversupply of easy credit, often without comprehensive assessments of a consumer’s financial health.
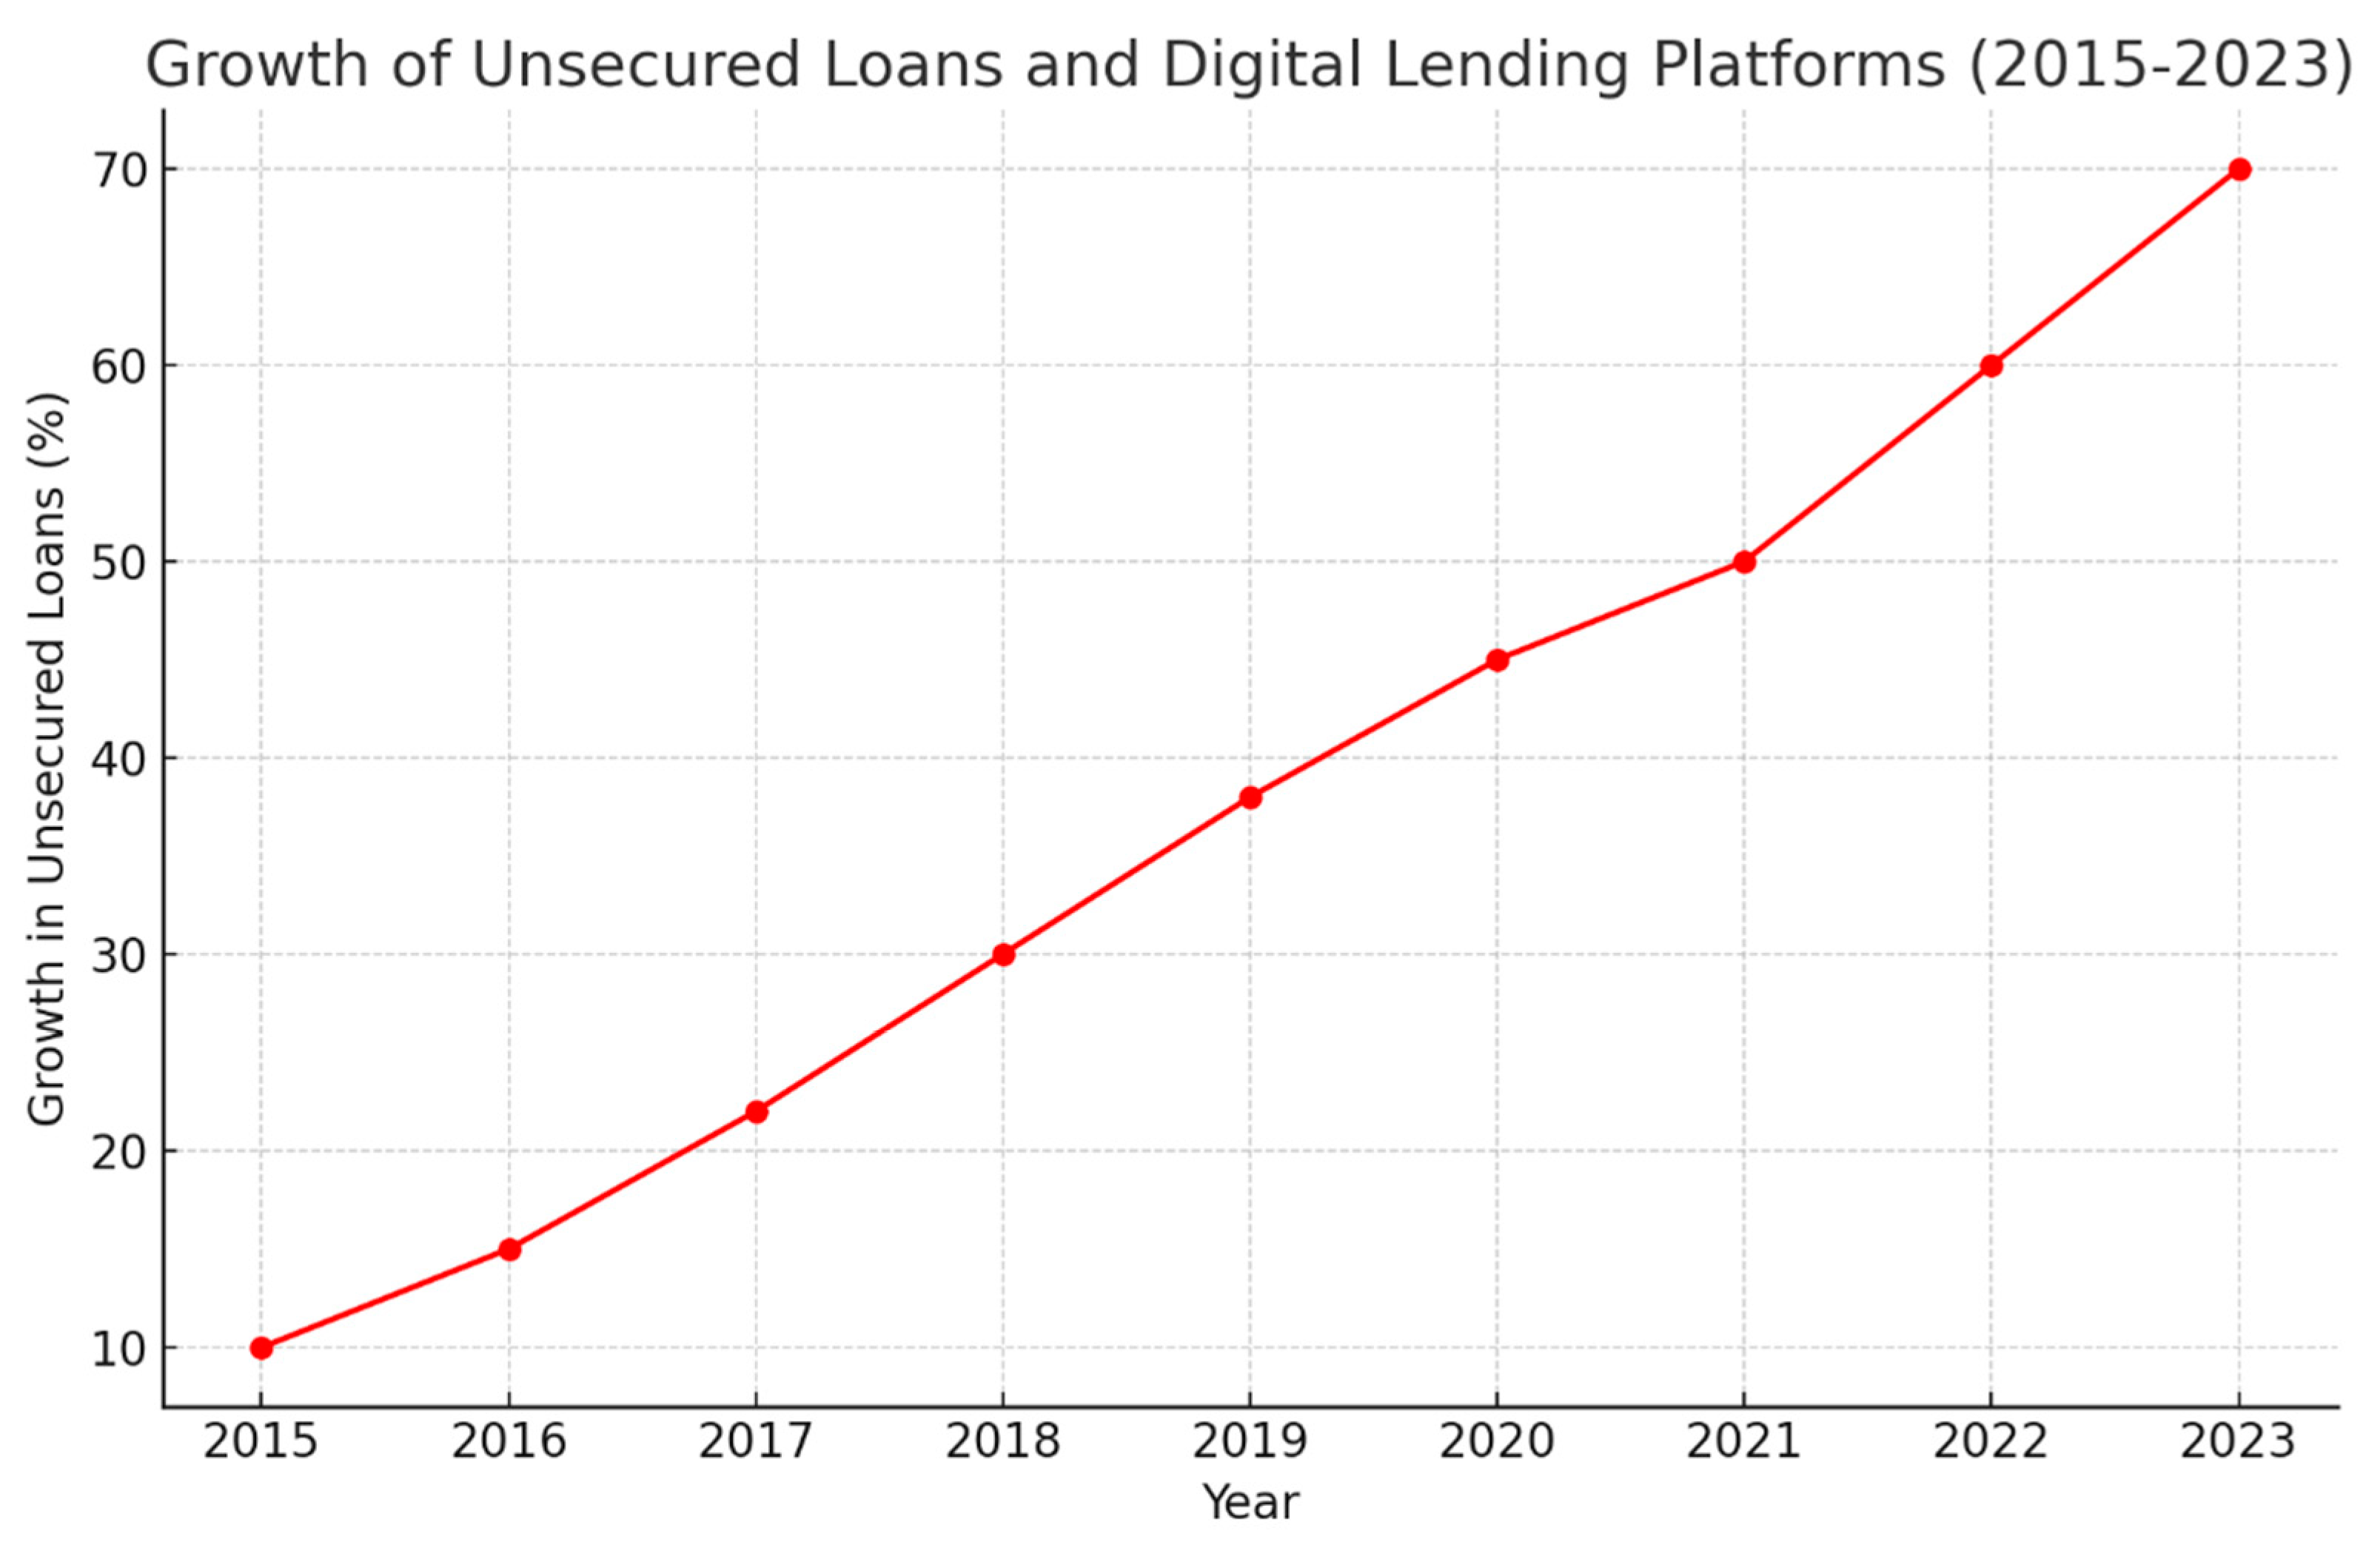
Figure 10.
Growth of Unsecured Loans and Digital Lending Platforms (2015-2023). This graph shows the year-on-year growth of unsecured loans, driven by the proliferation of fintech and NBFCs. Source: CRISIL, 2023.
Figure 10.
Growth of Unsecured Loans and Digital Lending Platforms (2015-2023). This graph shows the year-on-year growth of unsecured loans, driven by the proliferation of fintech and NBFCs. Source: CRISIL, 2023.
The lack of adequate regulation has allowed young, inexperienced consumers to take on significant debt burdens. As of 2023, 60% of personal loan borrowers in India are under the age of 35, many of whom are first-time borrowers (RBI, 2023). These consumers are particularly vulnerable to the risks of over-borrowing, as many lack the financial literacy to manage multiple loans effectively.
5.2. Behavior and Financial Literacy
One of the most significant factors driving over-borrowing in India is the low level of financial literacy among consumers. Despite the rapid expansion of credit access, many consumers, particularly younger individuals, lack the basic financial knowledge needed to manage loans effectively. A survey by CRIF High Mark (2023) found that 70% of consumers under the age of 35 did not fully understand the terms of their loans, including interest rates, repayment schedules, and penalties for default.
This lack of financial awareness has led to widespread over-borrowing, with many consumers taking on multiple loans without understanding the long-term financial implications. The rise of BNPL schemes has only exacerbated this problem, as these services offer instant credit with little upfront cost, encouraging consumers to spend beyond their means.
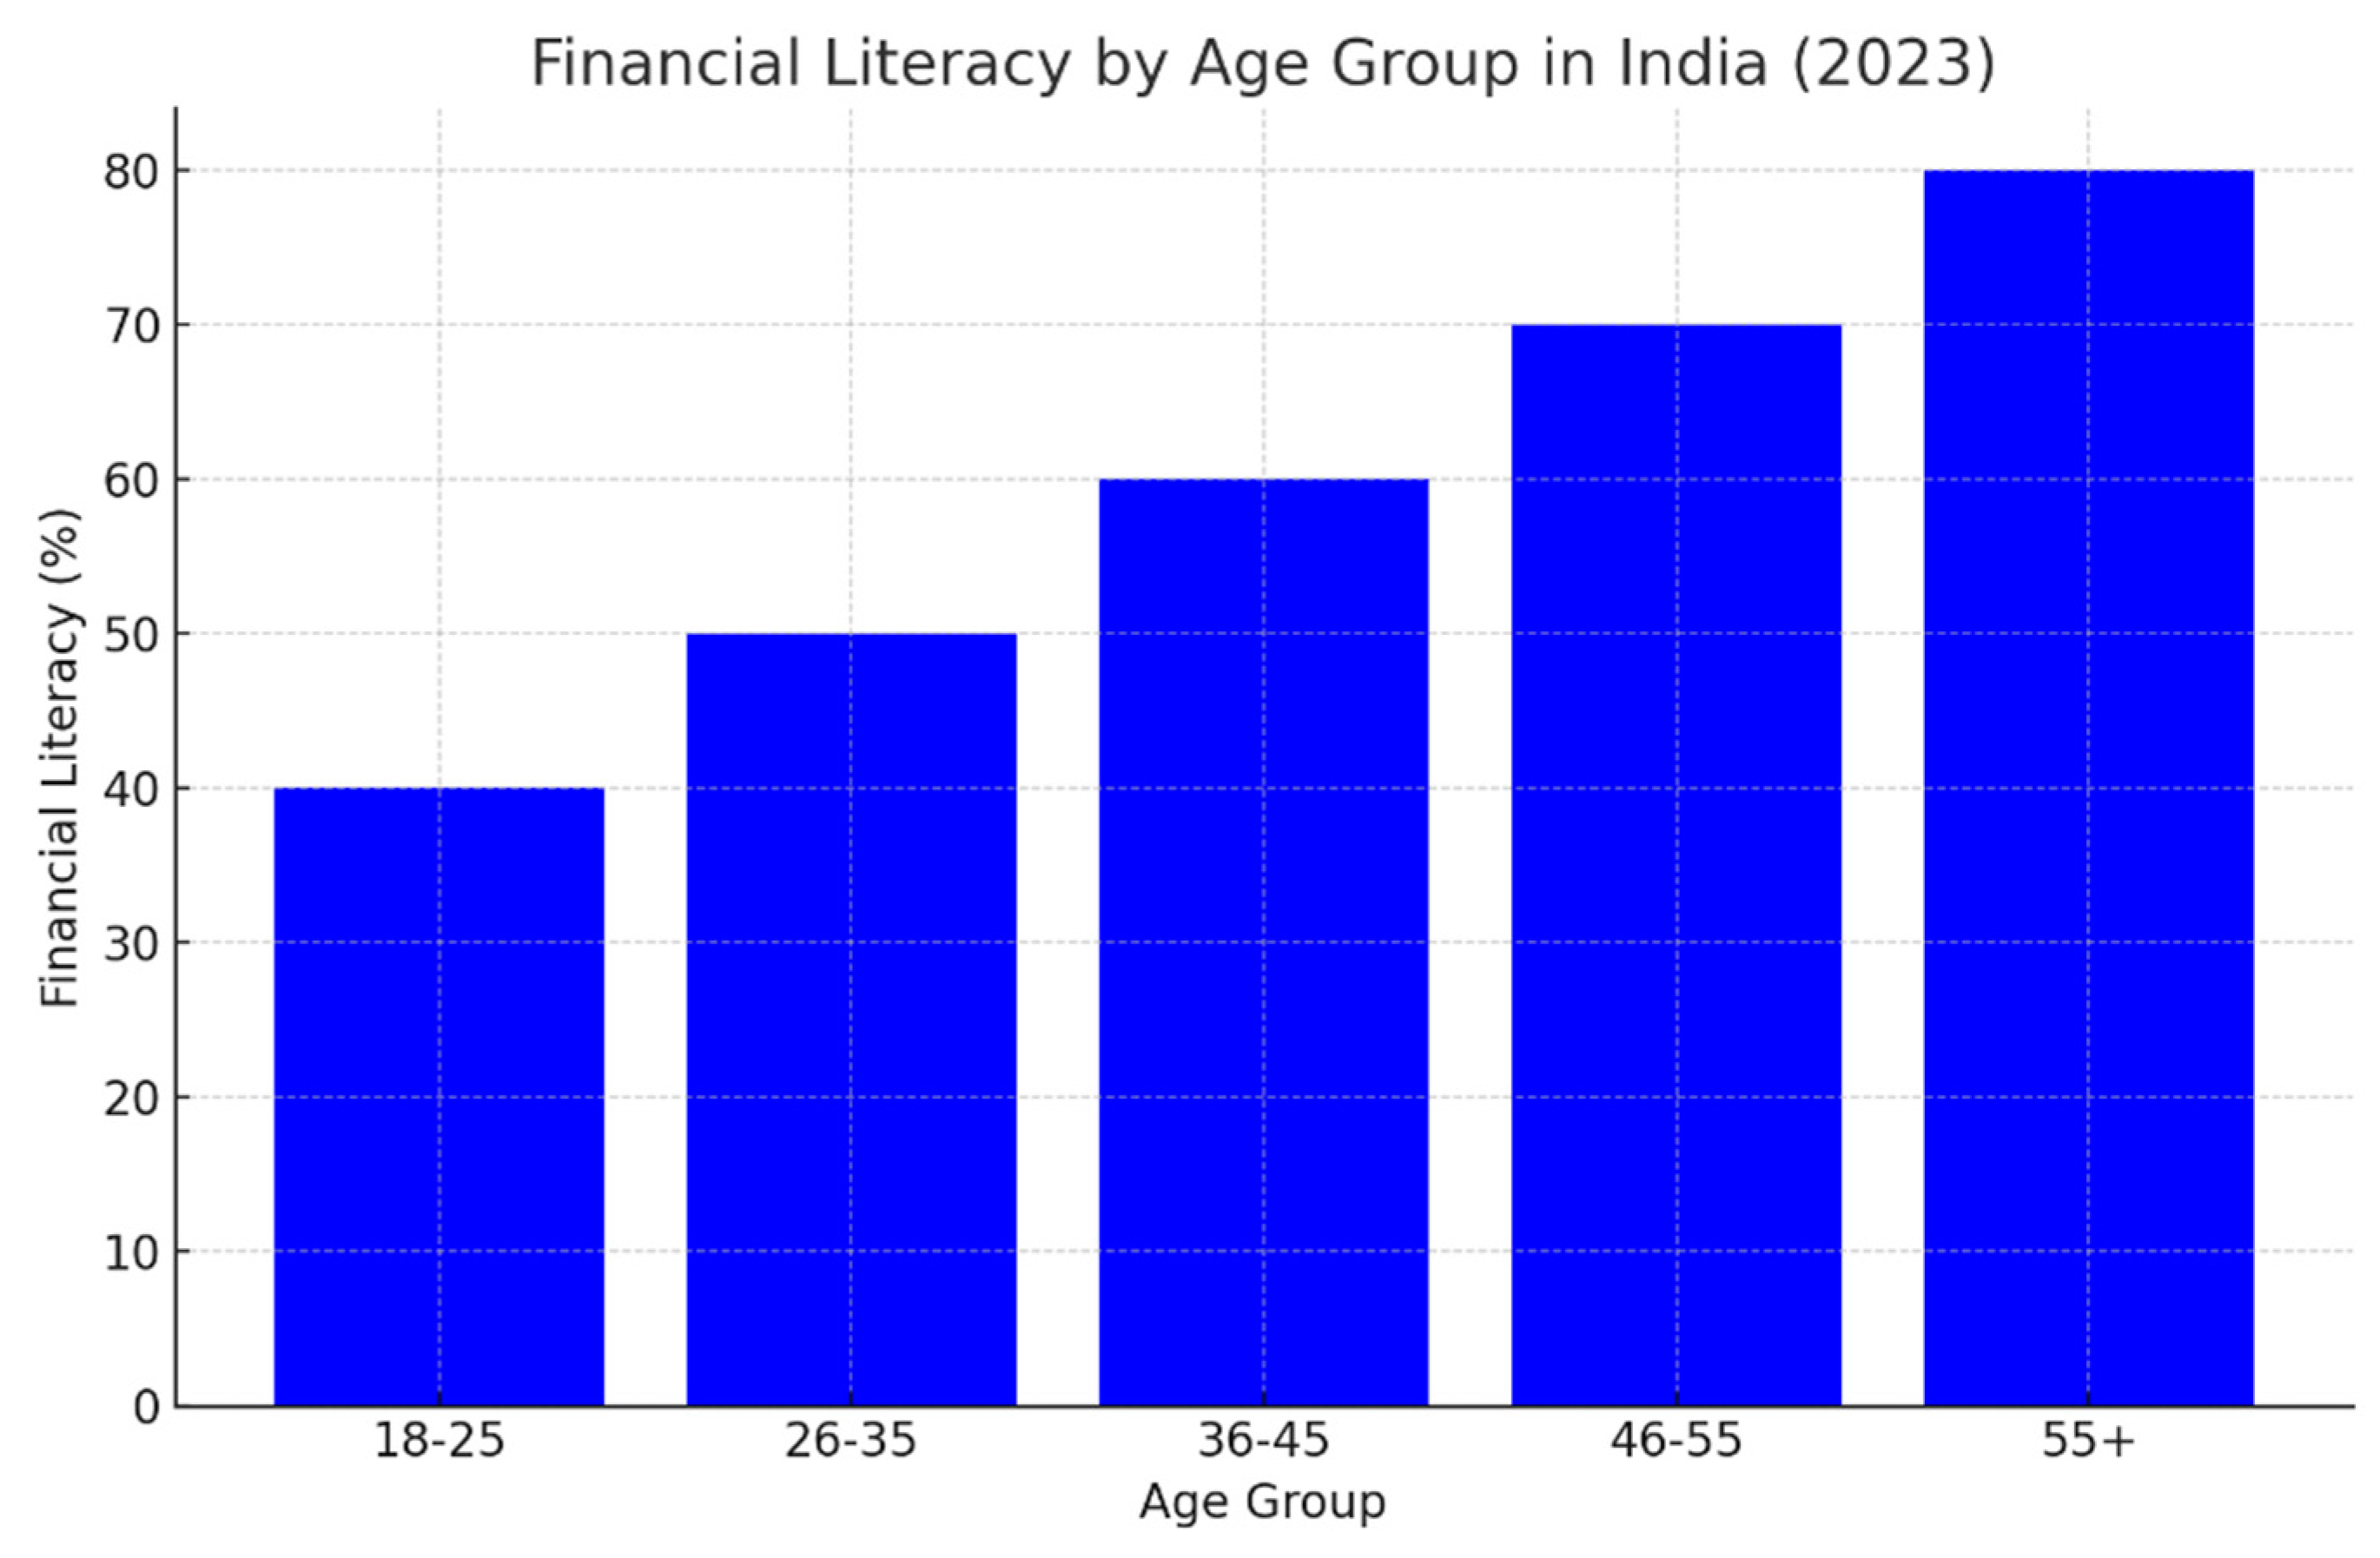
Figure 11.
Financial Literacy by Age Group in India (2023). This bar graph illustrates the financial literacy levels across different age groups, with younger consumers showing significantly lower literacy rates. Source: CRIF High Mark, 2023
Figure 11.
Financial Literacy by Age Group in India (2023). This bar graph illustrates the financial literacy levels across different age groups, with younger consumers showing significantly lower literacy rates. Source: CRIF High Mark, 2023
5.3. Recommendations for Policy Interventions
To address the growing problem of over-borrowing and EMI dependency, several key policy interventions are needed:
- Stronger Financial Regulation: The RBI must implement stricter regulations on digital lending platforms and NBFCs to ensure that credit assessments are comprehensive and borrowers are not over-leveraged. Mandatory credit checks and loan affordability assessments should be enforced before loans are approved.
- Targeted Financial Education: The government and financial institutions should focus on improving financial literacy, particularly among younger demographics. Educational programs on the risks of borrowing, the importance of saving, and managing multiple loans should be integrated into school curriculums and public awareness campaigns.
- Incentivizing Savings Over Borrowing: Government schemes that currently promote borrowing, such as low-interest loans and subsidies, should be balanced with programs that incentivize savings. For instance, tax benefits for long-term savings plans or investments in financial assets could encourage households to save more and borrow less.
Table 3 presents a summary of the key policy recommendations that could help mitigate the risks of over-borrowing and improve financial stability in India.
Table 3.
Recommended Policy Interventions to Address Over-Borrowing.
| Policy Intervention | Expected Impact |
|---|---|
| Stricter Regulation of Digital Lending | Reduced risk of over-leveraging and defaults |
| Financial Education Programs | Increased financial literacy and responsible borrowing |
| Incentivizing Savings Programs | Shift towards savings, reduced reliance on EMIs |
| Affordability Checks for Loans | Ensures that borrowers can manage loan repayments |
Source: Author’s Analysis, 2024.
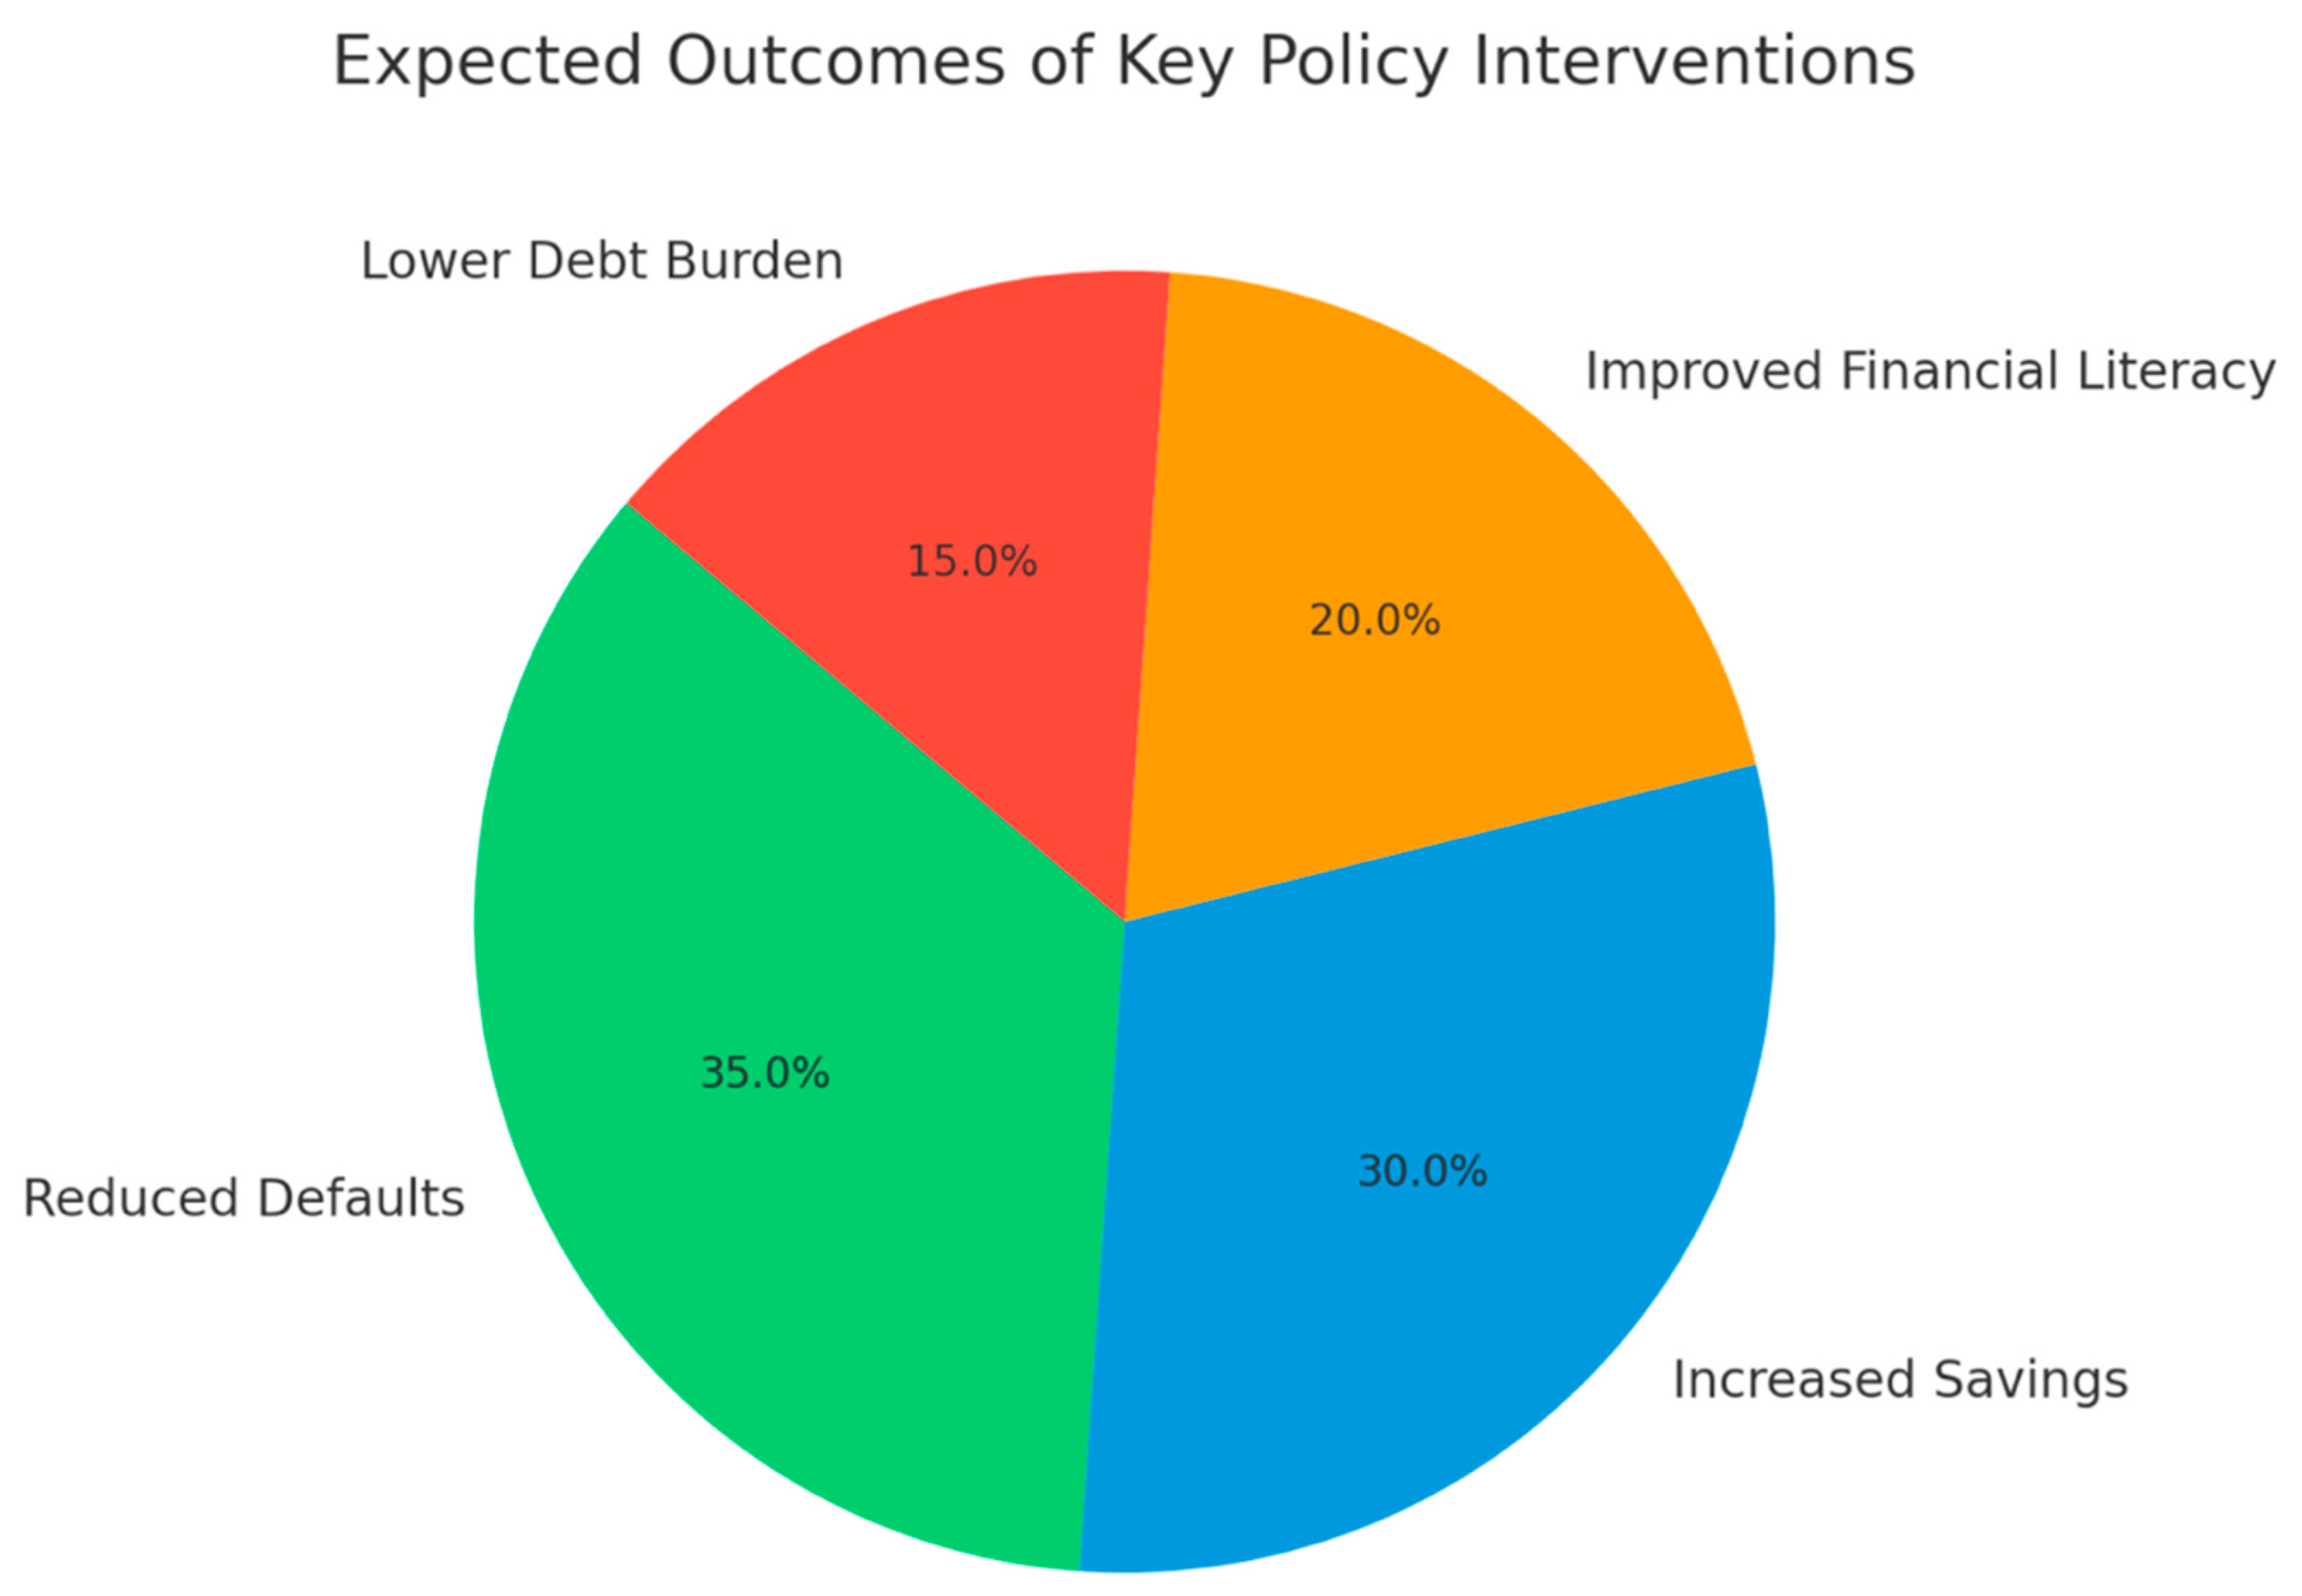
Figure 12.
Expected Outcomes of Key Policy Interventions. This pie chart illustrates the expected outcomes of policy interventions, such as reduced defaults and increased savings. Source: Author’s Analysis, 2024
Figure 12.
Expected Outcomes of Key Policy Interventions. This pie chart illustrates the expected outcomes of policy interventions, such as reduced defaults and increased savings. Source: Author’s Analysis, 2024
6. Discussion: Connecting the Dots between EMI Culture and Financial Fragility
6.1. EMI as a Double-Edged Sword
The rapid growth of EMI-driven consumption in India has undeniably boosted short-term economic indicators like GDP and consumption. EMIs have allowed millions of middle-class households to access goods and services that would otherwise be unaffordable, creating a more robust domestic market. However, while EMIs provide a short-term economic boost, they are also creating significant long-term risks by encouraging over-leveraging. Households are taking on more debt than they can sustainably manage, leading to rising debt-service-to-income ratios (DSIR), which now exceed 40% for 45% of middle-class households (CRISIL, 2023). This situation leaves little room for savings or disposable income, making households vulnerable to future financial shocks.
Figure 13.
Household Debt Growth vs. GDP Growth in India (2013-2023). This line graph shows the correlation between household debt growth and GDP growth, demonstrating the short-term economic boost provided by EMI-driven consumption. Source: RBI, 2023.
Figure 13.
Household Debt Growth vs. GDP Growth in India (2013-2023). This line graph shows the correlation between household debt growth and GDP growth, demonstrating the short-term economic boost provided by EMI-driven consumption. Source: RBI, 2023.

6.2. Financial Fragility Framework
India’s increasing dependency on EMIs has made its middle class particularly susceptible to financial shocks, a concept referred to as financial fragility. Financial fragility refers to a household’s limited ability to absorb economic shocks due to high debt levels and insufficient savings. Households with a high DSIR and low savings are unable to weather even minor financial disruptions, such as unexpected medical expenses or job loss.
This fragility is exacerbated by the fact that many Indian households have moved away from financial savings toward physical assets like real estate, which are not easily liquidated in times of crisis. Data from the Reserve Bank of India (2023) shows that net financial savings as a percentage of GDP have dropped to 5.3%, a 47-year low. As EMIs eat up a larger share of household income, the ability to save for future crises diminishes.
6.3. Middle-Class Vulnerability
The middle class is often viewed as a financially stable segment of society. However, India’s middle class has become increasingly vulnerable due to its high exposure to consumer debt. The rising costs of housing, education, and healthcare have driven many middle-income households to take on substantial loans. As of 2023, housing loans account for 47.4% of all retail credit, while personal loans and unsecured credit like credit cards and BNPL services make up an additional 25% (CRIF High Mark, 2023).
The middle class is particularly at risk because it relies heavily on EMIs to maintain its standard of living. As long as incomes remain stable, households can manage these payments. However, if economic shocks such as inflation, job losses, or rising interest rates occur, these households will quickly find themselves unable to meet their obligations. Without adequate savings, they will face defaults, leading to a broader financial crisis.
Table 4 shows a breakdown of the average household debt composition for middle-income families in India, highlighting their heavy reliance on loans to finance essential and non-essential purchases.
Table 4.
Average Household Debt Composition for Middle-Income Families (2023).
| Loan Type | Percentage of Total Debt (%) |
|---|---|
| Housing Loans | 47.4% |
| Personal Loans | 25% |
| Vehicle Loans | 12% |
| Credit Cards | 10% |
| BNPL/Consumer Durable Loans | 5.6% |
Source: CRIF High Mark, 2023.
6.4. The Broader Economic Impact
The vulnerability of the middle class has broader economic implications. Rising middle-class debt has a cascading effect on the broader economy. When households are over-leveraged, their consumption patterns change, reducing discretionary spending. This, in turn, slows economic growth as consumer demand weakens. More importantly, rising defaults on loans can lead to an increase in non-performing assets (NPAs) for banks, threatening the stability of the financial sector.
During the 2008 financial crisis, for example, defaults in the U.S. mortgage sector led to a banking crisis that had global repercussions. If a similar situation were to unfold in India, where a significant portion of the middle class defaults on EMIs, the banking sector could face severe strain. Rising NPAs would force banks to tighten credit, reducing liquidity in the economy and potentially triggering a recession.
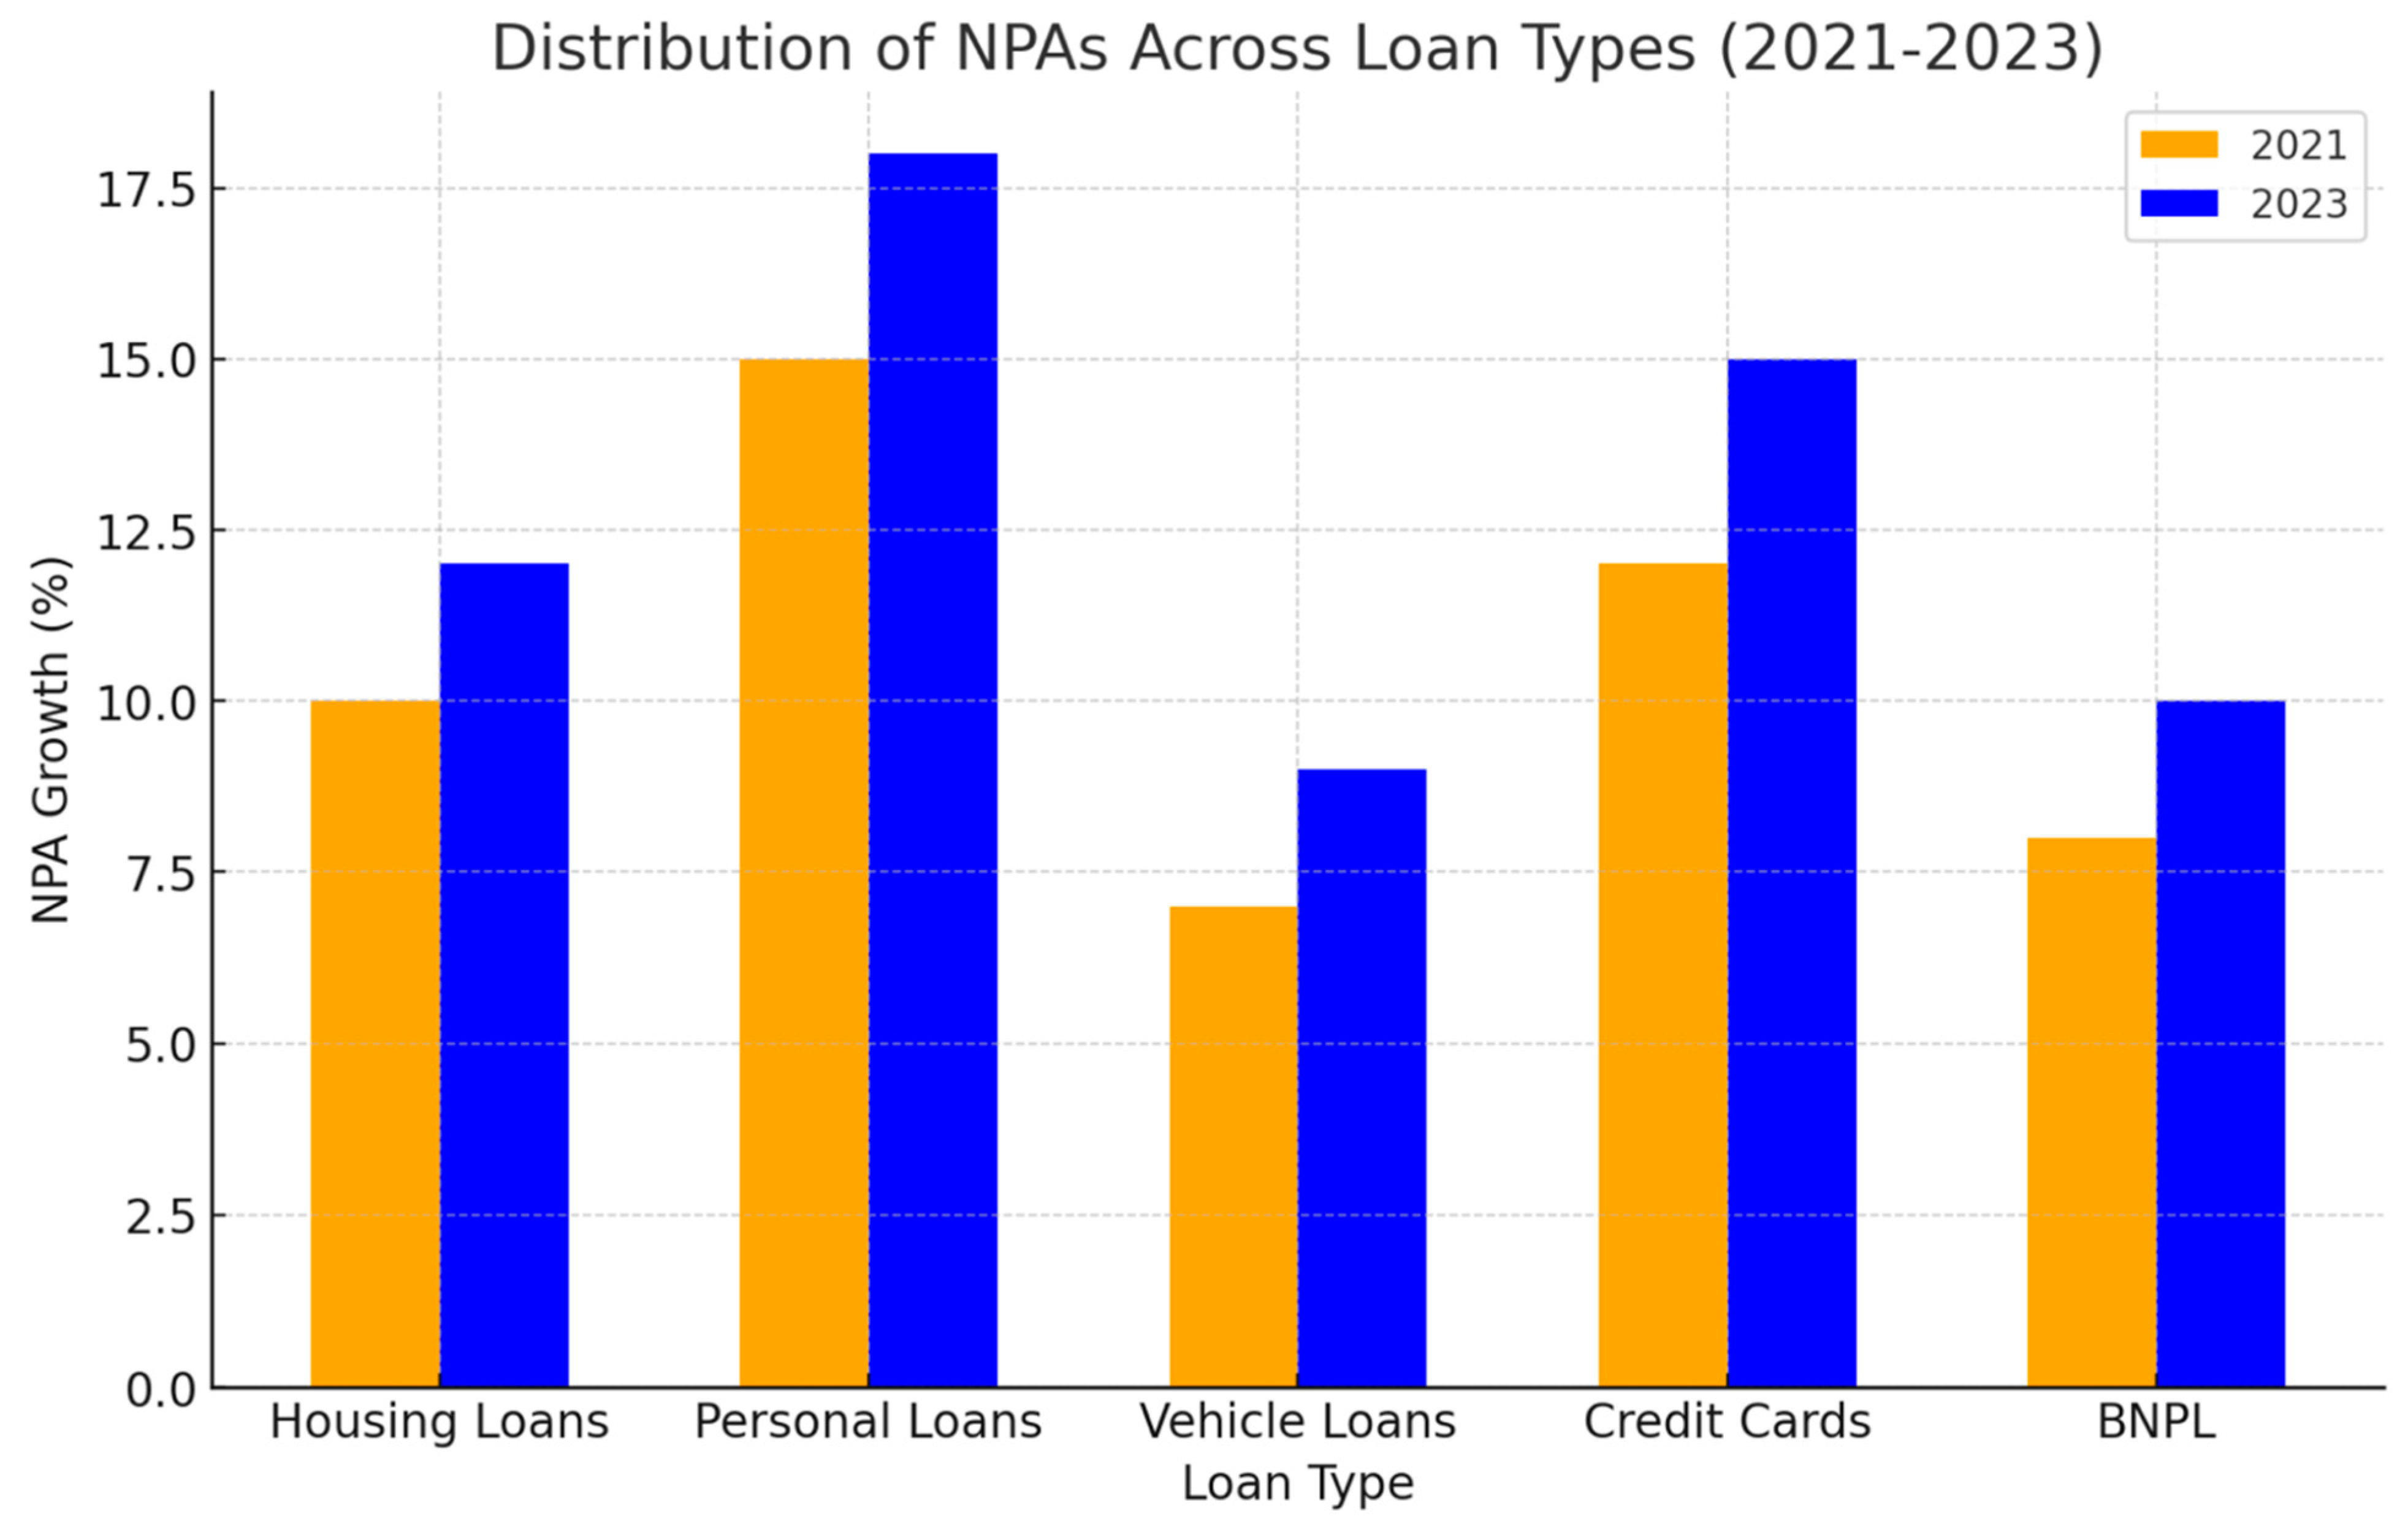
Figure 14.
Distribution of NPAs Across Loan Types (2021-2023). This histogram shows the increase in NPAs across various loan types, with housing and personal loans contributing significantly to the rise in defaults. Source: RBI, 2023.
Figure 14.
Distribution of NPAs Across Loan Types (2021-2023). This histogram shows the increase in NPAs across various loan types, with housing and personal loans contributing significantly to the rise in defaults. Source: RBI, 2023.
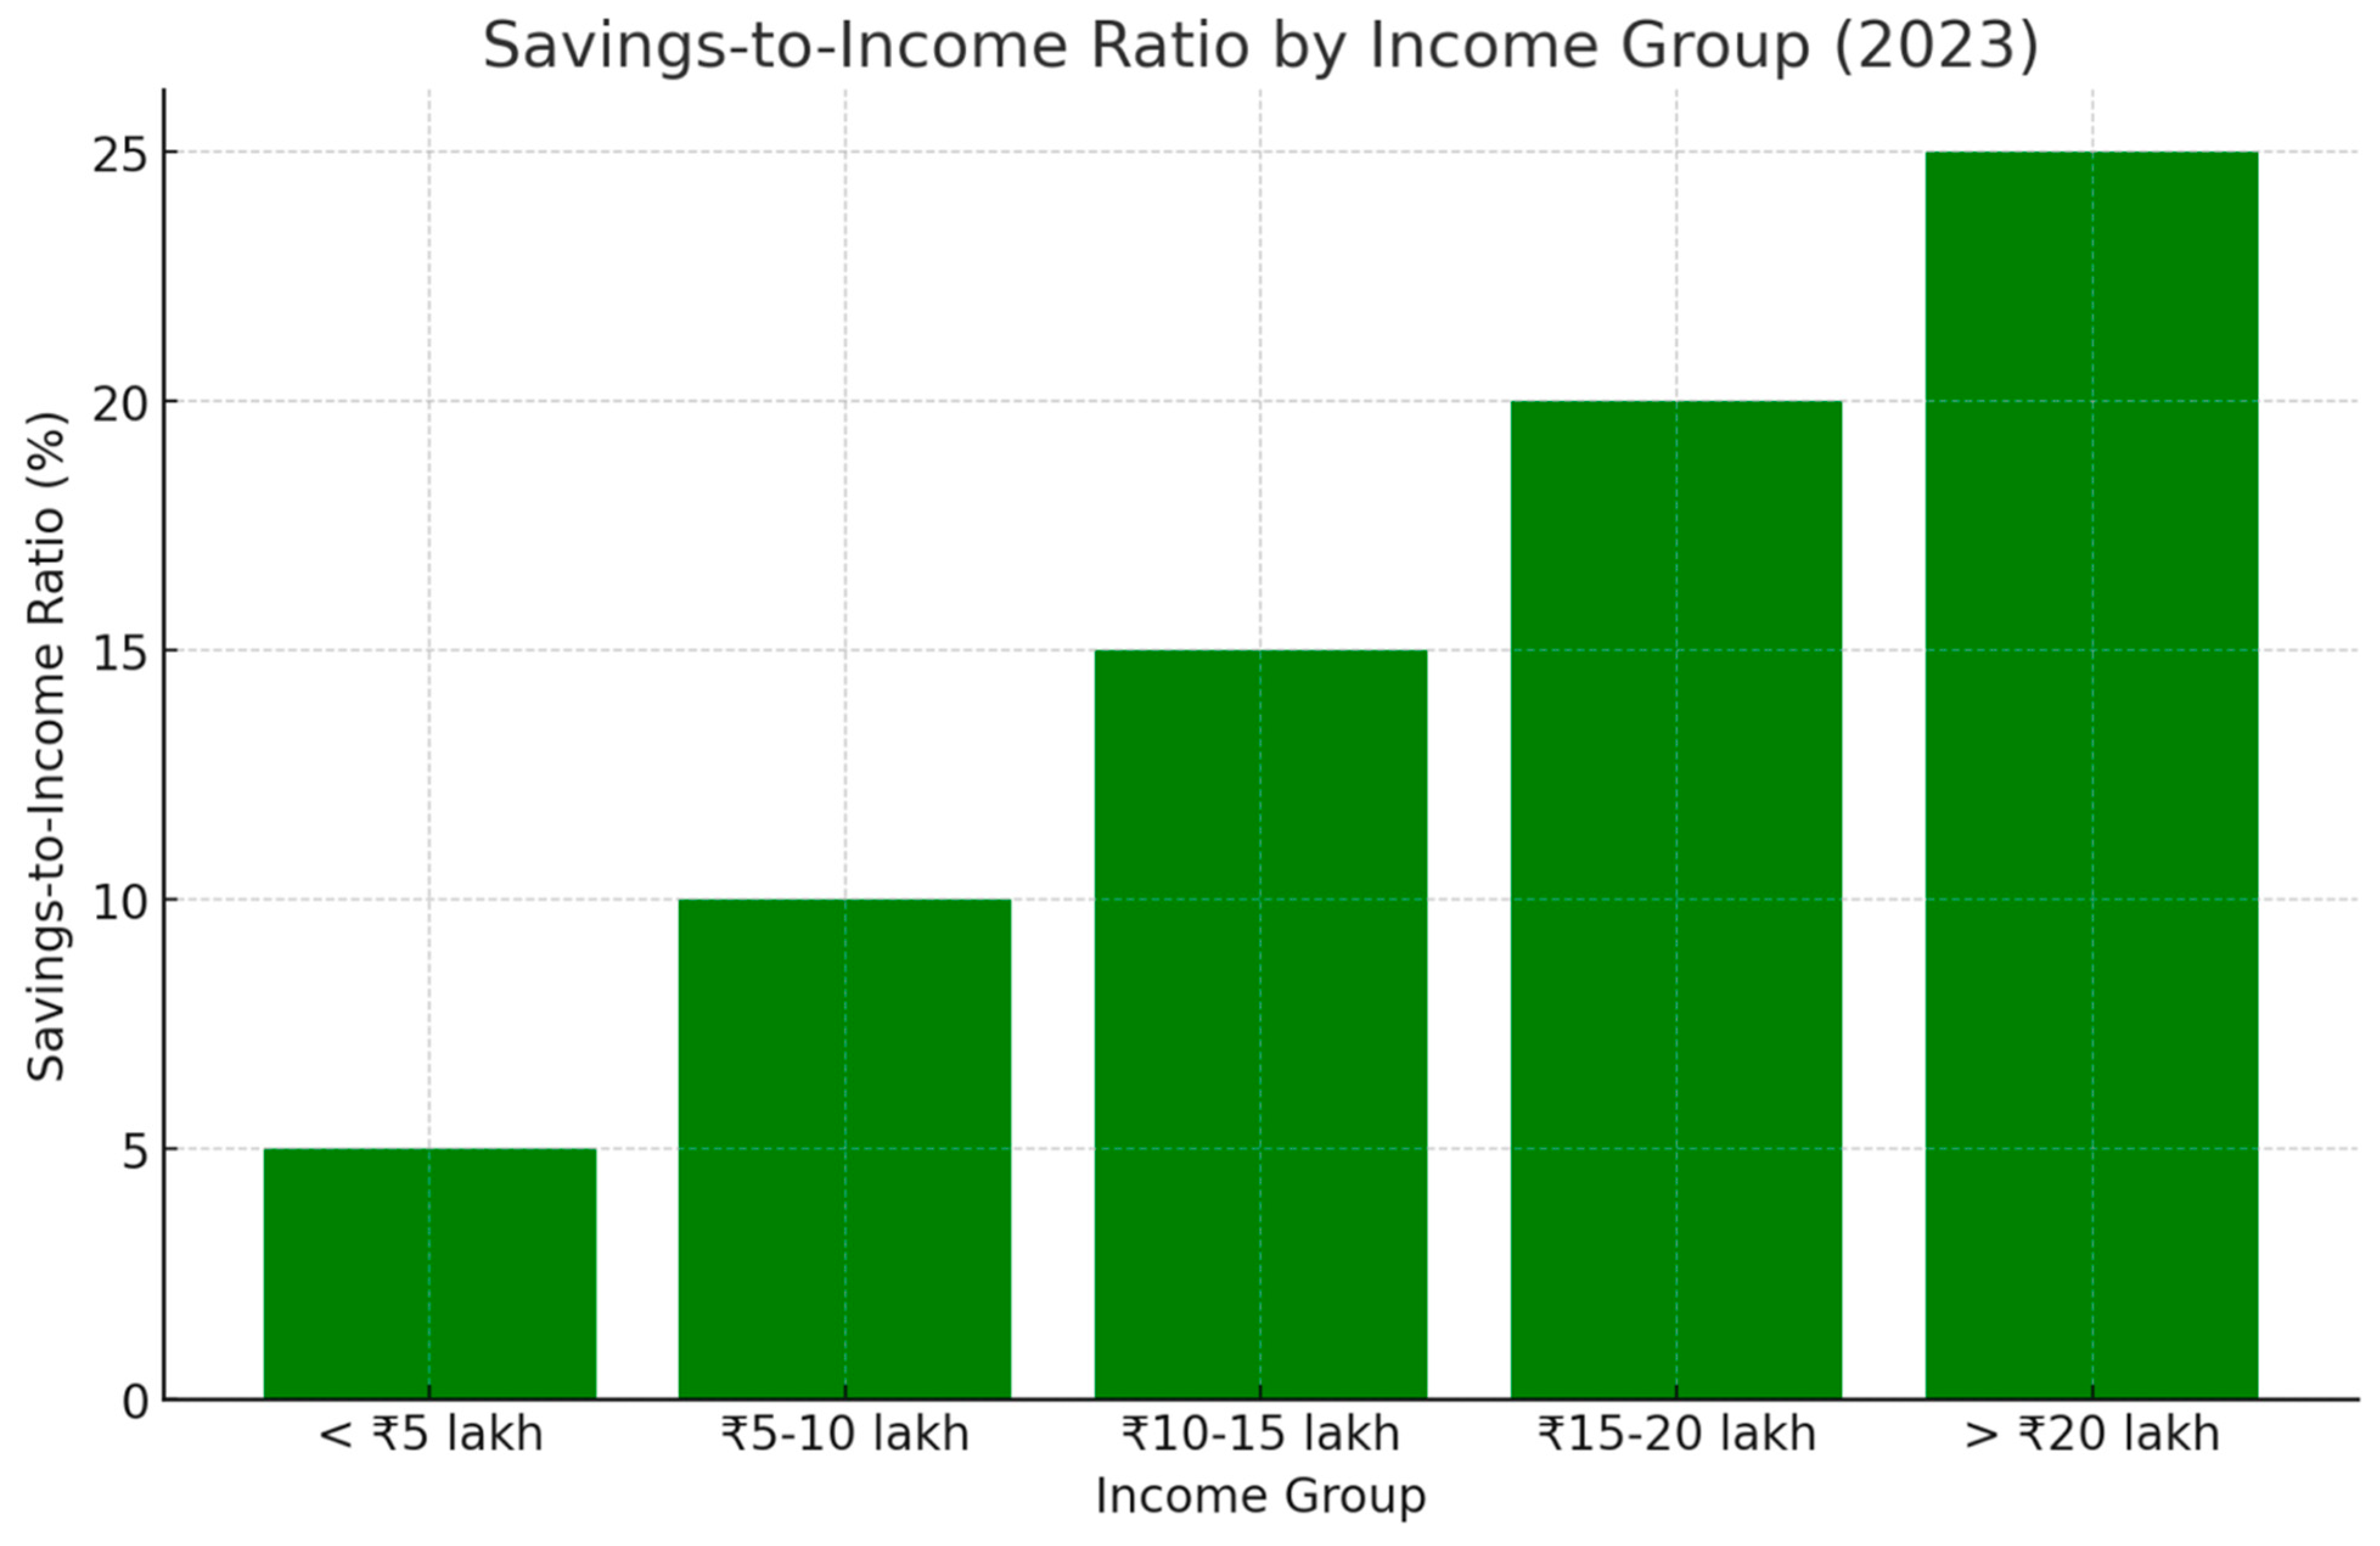
6.5. Lack of Savings as a Key Issue
The core issue behind India’s financial fragility is not simply the amount of debt but the lack of savings that households have to buffer against potential crises. High levels of debt, coupled with low savings, create a precarious situation where even minor economic shocks can lead to financial collapse for individual households. This issue is particularly pronounced in the middle class, where households often have high incomes but low savings due to the heavy reliance on EMIs for maintaining their lifestyle.
Figure 15.
Savings-to-Income Ratio by Income Group (2023). This bar chart illustrates the savings-to-income ratio across various income groups, showing how the middle class has the lowest savings despite relatively high incomes. Source: RBI, 2023.
Figure 15.
Savings-to-Income Ratio by Income Group (2023). This bar chart illustrates the savings-to-income ratio across various income groups, showing how the middle class has the lowest savings despite relatively high incomes. Source: RBI, 2023.
7. Conclusion: What Lies Ahead for India’s Debt-Driven Economy
7.1. Summary of Key Insights
The rise of EMI dependency in India, while driving short-term economic growth through increased consumption, is eroding household financial stability. Households, particularly middle-income families, are increasingly relying on installment-based loans to maintain their standard of living. This has resulted in a worrying shift from savings to debt, with a 47-year low in household net financial savings, now at 5.3% of GDP (RBI, 2023). The rapid rise in unsecured loans, such as personal loans and BNPL services, has further deepened financial vulnerability, with 45% of households now spending over 40% of their income on debt repayments (CRISIL, 2023).
The current landscape reveals an alarming trend: while EMIs allow households to access immediate goods and services, they are fostering an unsustainable culture of over-leveraging. Without adequate buffers like savings, households are ill-prepared for even minor financial shocks. This fragility could become a major economic issue, as increased defaults on loans might trigger a broader financial crisis.
Table 5 summarizes the major findings from the analysis, outlining the core challenges posed by India’s growing EMI culture.
Table 5.
Summary of Key Findings on EMI Dependency and Financial Risk.
| Factor | Statistic/Insight |
|---|---|
| Net Financial Savings Rate | 5.3% of GDP (lowest in 47 years) |
| DSIR for Middle-Class | 45% of households spending 40%+ on loan repayments |
| Share of Unsecured Loans | 25% of retail loans (BNPL, personal loans) |
| NPA Growth Post-Pandemic | +14% rise in NPAs in retail loans (2021-2023 |
Source: RBI, 2023; CRISIL, 2023.
7.2. Policy Recommendations
To mitigate the risks associated with growing household debt, a series of targeted policy interventions are needed to balance the benefits of credit access with long-term financial stability. The following recommendations aim to address the root causes of over-leveraging while encouraging better financial habits:
- 1.
- Tighten Regulations on Easy Access to Consumer Credit
India’s current regulatory framework allows for the rapid proliferation of credit through digital lending platforms and NBFCs, particularly to younger, vulnerable consumers. The RBI must implement stricter rules on unsecured lending, requiring comprehensive credit assessments before loans are issued. Caps on EMI-to-income ratios should be enforced, ensuring households do not over-borrow relative to their income. For example, a cap of 30-35% on the EMI-to-income ratio could prevent households from being financially stretched.
- 2.
- Encourage Savings by Offering Better Interest Rates
The government and financial institutions should incentivize households to save by offering competitive interest rates on savings accounts. Additionally, tax-exempt long-term savings schemes could encourage families to build emergency funds. As of 2023, many households are diverting their income to debt repayment, leaving little room for savings. Policy reforms that promote higher returns on financial products, such as Public Provident Fund (PPF) or Sukanya Samriddhi Yojana, could help reverse this trend.
- 3.
- Introduce Caps on the EMI-to-Income Ratio
Placing a regulatory cap on the percentage of income that households can spend on EMIs will prevent over-leveraging. A well-enforced cap of 30-35% of disposable income spent on debt repayments could significantly reduce household financial vulnerability. By limiting how much income is devoted to loan repayments, households would be better positioned to maintain savings and withstand financial shocks.
- 4.
- Promote Financial Literacy Among Young Borrowers
A key driver of over-borrowing is the low level of financial literacy among young and first-time borrowers. The government, in collaboration with banks and financial institutions, should roll out national financial education campaigns that focus on the risks of over-leveraging, understanding loan terms, and budgeting. By improving financial literacy, especially in the 18-35 age group, policymakers can ensure that future generations are better equipped to manage debt responsibly.
7.3. Looking Forward: Avoiding a Household Debt Crisis
The urgency of addressing India’s debt-driven economy cannot be overstated. If the current trend of EMI dependency continues unchecked, India could face a household debt crisis that would threaten its long-term growth trajectory. The lessons from the 2008 financial crisis in the U.S. and Greece’s debt crisis of 2009 offer stark warnings. Both countries saw widespread defaults on household debt, leading to banking crises that triggered deeper economic recessions.
India is at a crossroads. The reliance on consumer credit to fuel economic growth has left millions of households financially vulnerable. As debt-service-to-income ratios rise and household savings dwindle, the risk of an economic collapse becomes more pronounced.
Figure 16.
Projected NPA Growth Across Loan Types with a 10% Rise in Defaults. This bar graph illustrates the projected rise in NPAs across various loan types if EMI defaults increase by 10%. Source: CRISIL, 2023.
Figure 16.
Projected NPA Growth Across Loan Types with a 10% Rise in Defaults. This bar graph illustrates the projected rise in NPAs across various loan types if EMI defaults increase by 10%. Source: CRISIL, 2023.

To avoid a household debt crisis, India must act now. Tightening credit regulations, encouraging savings, and promoting financial literacy are crucial first steps. Failure to implement these reforms could see India facing widespread loan defaults, increased NPAs, and an economic downturn that would disrupt the country’s long-term growth prospects.
8. Author Information
- 1.
- Amaya Kavya
First and Corresponding Author
Email: amayakavya@gmail.com
Amaya Kavya is an independent researcher. He has authored a preprint in the field and is also the author of a book.
- 2.
- Seema Yadav
Second Author
Email: seemayadav.cretion@gmail.com
Seema Yadav holds an MA in Sociology from Ranchi University (Batch of 2000).
9. Declaration and Disclosure
- ○
- Independence of Research:
This research was conducted independently by the authors, Amaya Kavya and Seema Yadav. Neither author is affiliated with any institution or organization. All aspects of the research, including study design, data collection, analysis, and interpretation, were carried out solely by the authors, without any external involvement.
- ○
- Conflict of Interest:
The authors declare that they have no known financial or personal conflicts of interest that could have appeared to influence the work reported in this paper. The conclusions presented are based solely on the authors’ objective analysis of the available data.
- ○
- Funding:
This study did not receive any specific funding from government, commercial, or non-profit funding bodies. The research was carried out without financial support and was independently driven by the authors’ initiative.
- ○
- Data Sources and Accessibility:
The data and information utilized in this paper are exclusively derived from publicly available sources, including peer-reviewed journals, government reports, and international databases, all of which are accessible in the public domain. No proprietary or restricted data were used in this research.
- ○
- Ethical Compliance:
As this research is based on secondary data and literature review, it did not involve any direct experimentation, human participants, or animal studies. Therefore, no ethical approval was required.
References
- CRIF High Mark. How India Lends FY23 Report. CRIF, 2024.
- CRIF High Mark. India’s Housing Loan Growth: A Decade of Change. CRIF, 2022.
- CRIF High Mark. India Lends: The Rise of Unsecured Loans. CRIF, 2023.
- CRISIL. CRISIL Consumer Debt Report FY23. CRISIL, 2023.
- CRISIL. Digital Lending and Unsecured Credit Growth in India. CRISIL, 2020.
- CRISIL. Household Financial Vulnerability Report. CRISIL, 2023.
- CRISIL. India’s Credit Landscape. CRISIL, 2022.
- Deloitte. India’s Banking Sector and Household Debt Analysis. Deloitte, 2023.
- Deloitte. The Future of India’s Banking Sector: Debt and Risk Analysis. Deloitte, 2022.
- Das, Anupam. “The Impact of Interest Rate Hikes on EMI Payments.” Journal of Banking & Finance, vol. 49, no. 2, 2021, pp. 80-99.
- Economic Survey of India. Impact of EMI on Household Savings. Ministry of Finance, 2023.
- Economic Survey of India. Impact of COVID-19 on Household Financial Health. Ministry of Finance, 2022.
- Economic Times. “Rising EMI Defaults: A Looming Crisis for India’s Middle Class.” Economic Times, 2023.
- Gupta, R., and P. Iyer. “Financial Fragility in Emerging Markets: A Case Study on India.” Economic & Political Weekly, vol. 56, no. 12, 2021, pp. 45-57.
- Home Credit India. India Borrowers Survey 2023. Home Credit, 2023.
- IMF. Global Financial Stability Report 2009. International Monetary Fund, 2009.
- IMF. India’s Economic Outlook: The Role of Household Debt. International Monetary Fund, 2023.
- IMF. Spain Debt Crisis Analysis. International Monetary Fund, 2020.
- KPMG India. Household Debt and Economic Vulnerability in India. KPMG, 2023.
- Khanna, Pranav. “Debt Overhang and the Indian Middle Class.” Indian Journal of Economics, vol. 78, no. 4, 2022, pp. 312-328.
- Mohan, R. “Household Debt and Financial Vulnerability in India.” Journal of International Finance, vol. 39, no. 2, 2019, pp. 110-124.
- Mukherjee, S. “Economic Crises and Household Debt: Lessons from the 2008 Crisis.” Journal of Finance & Economics, vol. 45, no. 3, 2019, pp. 133-156.
- National Institute of Public Finance and Policy (NIPFP). Financial Literacy in India: Current Trends and Policy Implications. NIPFP, 2021.
- National Statistical Office. Household Consumption and Debt Report. Ministry of Statistics, 2022.
- NITI Aayog. Household Consumption Patterns in Post-Pandemic India. NITI Aayog, 2023.
- OECD. OECD Economic Outlook. OECD, 2010.
- PwC India. India’s EMI Market: Growth and Challenges. PwC India, 2023.
- Rajan, Raghuram. “Global Debt Crises: Lessons for India.” Journal of Emerging Market Economies, vol. 22, no. 5, 2020, pp. 77-91.
- Reserve Bank of India. RBI Annual Report FY23. RBI, 2023.
- Reserve Bank of India. Indian Household Debt Trends. RBI, 2022.
- Reserve Bank of India. Retail Loan Trends in India. RBI, 2021.
- Reserve Bank of India. Financial Stability Report 2020. RBI, 2020.
- S&P Global Ratings. India’s Household Debt Profile 2022. S&P Global Ratings, 2022.
- Shankar, V., and M. Iyer. “Non-Performing Assets in India: The Role of Consumer Debt.” Journal of Financial Risk Management, vol. 60, no. 1, 2022, pp. 89-106.
- Singh, N. “The Rise of EMIs in India: A Socio-Economic Perspective.” Journal of Economic Research, vol. 88, no. 4, 2020, pp. 235-250.
- The Hindu Business Line. “Household Savings in Decline: The Rise of EMI Culture.” The Hindu Business Line, 2022.
- World Bank. India Economic Update: Post-COVID Recovery and Household Debt. World Bank, 2023.
Disclaimer/Publisher’s Note: The statements, opinions and data contained in all publications are solely those of the individual author(s) and contributor(s) and not of MDPI and/or the editor(s). MDPI and/or the editor(s) disclaim responsibility for any injury to people or property resulting from any ideas, methods, instructions or products referred to in the content. |
© 2024 by the authors. Licensee MDPI, Basel, Switzerland. This article is an open access article distributed under the terms and conditions of the Creative Commons Attribution (CC BY) license (http://creativecommons.org/licenses/by/4.0/).
Copyright: This open access article is published under a Creative Commons CC BY 4.0 license, which permit the free download, distribution, and reuse, provided that the author and preprint are cited in any reuse.


