Submitted:
13 October 2024
Posted:
15 October 2024
You are already at the latest version
Abstract
In recent years, with the increasing impact of climate change, achieving the "dual carbon" goal has become increasingly urgent. Fossil fuel consumption is one of the main sources of carbon emissions and is closely related to economic development. Therefore, it is necessary to decouple economic growth from fossil fuel consumption as soon as possible. However, the small sample defect in fossil energy consumption panel data has caused great difficulties for machine learning algorithms. To address this defect, this study uses TimeGAN for data augmentation and compares the performance of six regression analysis methods (XGBoost, CatBoost, LGBM, KNN, linear regression, decision tree) in predicting fossil energy consumption. In addition, feature importance and SHAP are used simultaneously to explore the main driving factors of fossil energy consumption. The research results show that the decoupling index of most provinces fluctuated relatively little from 2011 to 2018. Compared to other machine learning algorithms, XGBoost and CatBoost perform better in predicting fossil energy consumption. Finally, based on two interpretable analysis methods, we found that population has the most significant impact on fossil energy consumption, followed by GDP, and urbanization rate is the least important. The research results provide important information for formulating energy sustainable development strategies and further discuss energy-saving solutions based on data methods.
Keywords:
Fossil fuel consumption
; machine learning
; TimeGAN
; decoupling
; spatiotemporal evolution
1. Introduction
Since the Industrial Revolution, the global use of fossil energy has inevitably increased [1,2]. A large body of literature demonstrates that human economic activities are a key source of greenhouse gases [3,4], and the use of fossil fuels and economic growth are closely related to CO2 emissions [5], leading to the accumulation of global greenhouse gases and exacerbating climate change [6]. With the growing threat of global climate change, it has become particularly important to study and understand the link between fossil energy consumption and greenhouse gas emissions. As one of the world's largest energy consumers, China's enormous demand has had a significant impact on its CO2 emissions. Over the past few decades, China's rapid economic development has accelerated industrialization and urbanization, leading to a rapid increase in its consumption of fossil energy. Additionally, as a country with a large population and a developing economy, China's energy demand is closely linked to economic growth. Given that coal is one of the largest sources of carbon emissions, the urgent need to decouple fossil energy consumption from economic growth is evident.
The history of CO2 emissions research in China is divided into two periods. The first phase of research was framed around the year 2005, when China became the world's largest CO2 emitter. The Chinese government pledged to the international community that by 2020, the CO2 emissions per unit of GDP would decrease by 40% to 45% compared to 2005. Against this backdrop, scholars conducted in-depth research and analysis on carbon emission reduction pathways using econometric models. In the 1960s, the widespread application of environmental-economic input-output techniques in various research problems, such as the Leontief production function [7], became a powerful tool for environmental econometric research. Subsequently, Japanese scholar Kaya proposed the index decomposition analysis method when studying the impact of economic, policy, and population factors on carbon emissions [8]. This method transformed the problem into a product of several indicators and has been widely used in policy-making for energy and environmental issues. Depending on the method used to determine the weights, it can be divided into three different forms: the Laspeyres index method [9,10,11,12], the Simple Average Decomposition (SAD) [13], and the Adaptive Weighting Decomposition (AWD) [14,15,16]. As research progresses, scholars have begun to delve into the relationship between economic development and carbon emissions in more detail. Subsequent studies have found that the Kuznets Curve depicts the relationship between carbon emissions and the level of economic development in a country or region, and can effectively assess the carbon emission trends and underlying driving factors among different countries or regions [17,18,19]. However, in 1997, Moomaw et al. conducted a reasonable analysis of the impact mechanism of fossil fuels on carbon emissions using the Environmental Kuznets Curve, and found that the mathematical relationship between them is more complex and cannot be fitted with a "U-shaped" or "N-shaped" curve [20]. Subsequently, Fatima Bibi et al. also found that the Environmental Kuznets Curve hypothesis does not exist in most countries with low income and income levels below the turning point [21]. Therefore, machine learning algorithms have been introduced to consider the spatiotemporal evolution patterns of fossil energy consumption, in order to compensate for the inability to handle spatiotemporal differences. For example, Cao et al. explored the spatiotemporal evolution patterns of fossil energy consumption in Shaanxi Province from 2015 to 2020 using XGBoost, and found that in Shaanxi Province, the level of economic development is positively correlated with fossil energy consumption [22]. In order to fit the non-linear relationship in the data, Roumiani et al. [28] used artificial neural networks to predict the ecological footprint of G-20 countries. Considering the impact of model parameters on the goodness of fit, Janković et al. [29] used Bayesian optimization for artificial neural networks and deployed the model based on GUI.
As we have seen, machine learning is one of the most effective means to statistically analyze the relationship between fossil energy consumption and economic development. In this paper, we analyzed the decoupling degree of fossil energy consumption in 21 provinces based on the Topic Decoupling Index, expanded the time series data of fossil energy consumption using TimeGAN, and predicted the evolution patterns of fossil energy consumption by comparing six machine learning algorithms. Finally, we combined feature importance and SHAP analysis to identify the driving factors of fossil energy consumption. This method can quickly and accurately predict the evolution patterns of fossil energy consumption based on existing data, greatly promoting the achievement of China's "dual carbon" goals. Specifically, our contributions are as follows:
- (1)
- We use the Topic Elasticity Decoupling Index to calculate the decoupling of fossil energy consumption and economic development in 21 provinces, and study the decoupling pattern over time by grouping these provinces with the K-Means algorithm.
- (2)
- Sample augmentation using TimeGAN and comparison of the performance of six regression analysis methods on a fossil energy consumption task.
- (3)
- We conduct interpretable analysis on the model based on SHAP and feature importance, focusing on the main driving factors of fossil energy consumption.
The remaining chapters of this paper are organized as follows: Chapter two gives a detailed description of the dataset and discusses our model work. Chapter three is about our experiments and discussion section. The last chapter provides the corresponding summary.
2. Materials and methods
2.1. Data description
The study is mainly based on the GDP, coal consumption, population, urbanization rate in 21 provinces of China from 2011 to 2019. The data sources are the "China Statistical Yearbook" and the statistical yearbooks of various provinces. Missing data was filled using the mean value.
2.2. Methods
2.2.1. Tapio Decoupling Model
"Decoupling" refers to reducing environmental pressure while achieving economic growth, and this theory is widely applied in the assessment of resource and environmental use [23,24,25]. This paper focuses on fossil energy consumption and defines the decoupling index of fossil energy consumption using an elastic form as the ratio of the change in coal consumption between a certain period and the current GDP growth rate. The formula is as follows:
In the formula, δ represents the Topic Elastic Decoupling Index, F0 and G0 are the coal consumption and total GDP in the base year, and Ft and Gt are the coal consumption and total GDP in the t-th year. F and G respectively represent the changes in coal consumption and GDP from the base year to year t, indicating the growth rate of total GDP from the base year to year t.
2.2.2. Cluster Analysis
In order to be able to simplify the analysis process, we divided different provinces into different groups according to the fossil energy consumption decoupling index. This algorithm was chosen because it can effectively cluster national economic indicators with low complexity and is widely used in econometric research. In the clustering process, we group the 21 provinces under study based on the fossil energy consumption decoupling index. And the analysis is performed through Python.
K-Means is an unsupervised learning algorithm based on cluster clustering, which is mainly through the use of distance as an evaluation index of similarity [26,27]. Specifically, it is based on the size of the Euclidean distance between the sample values, which is divided into k clusters, so that the distance between different clusters is as far as possible, and the same family is as close to each other as possible. Assuming that the set of divided cluster classes is (C1, C2,...,Ck),the intra-cluster Euclidean distance D is:
The center of mass of the set Ci is denoted as ui , and the expression is as follows:
Randomly select centroids from the dataset and calculate the distance from each sample to the centroids using the Euclidean distance formula. Iterate repeatedly for k rounds until the optimal clustering result is obtained, then stop.
2.2.3. The Principle of Machine Learning Algorithms Predicting Fossil Energy Consumption.
Principle of TimeGAN for Data Augmentation
Vector S=[S1,…,Sα] represents α static characteristics of fossil energy consumption, and vector X=[X1,…,Xβ] represents β temporal characteristics of fossil energy consumption. The joint distribution of the state (S, X1:T) is denoted as p, where T is the length of the time series. The distribution of the real fossil energy consumption time data is denoted as Q={(Sn, Xn,1:T )}Nn=1, and the distribution of the generated training data is defined as .
The training goal of TimeGAN is to make the training data distribution infinitely close to the real data distribution. The model utilizes autoregressive decomposition to obtain the time-stepwise conditional distribution , which is a complementary goal to make the model's generative probability distribution at any time step closer to the real data distribution.
The objective function of the model consists of two parts: the overall objective function of fossil energy consumption and the time-dependent distribution function.
The objective function of the overall distribution is:
The time stepwise dependent distribution function is:
Enhanced Data Evaluation
The generated data are mainly mapped to the feature space of corresponding dimensions by Principal Component Analysis or t-Distributed Stochasitc Neighbor Embedding (t-SNE) to reflect the similarity between the generated samples and the real samples.
The t-SNE is a nonlinear dimensionality reduction method that can map high-dimensional data into two or three dimensions while preserving the global or local structure of the data. The positional relationship between the real and generated samples in the low-dimensional space is used to reflect the distributions of both. Two types of data with similar distributions will also have closer sample locations in the low-dimensional space.
PCA is a linear dimensionality reduction method. It realizes the principle of data evaluation more similar to t-SNE, and also visualizes the distribution of samples based on the positional relationship in the space.
Principles of Machine Learning Prediction
- Extreme Gradient Boosting
Extreme Gradient Boosting Tree (XGBoost) is evolved from Gradient Boosting Tree. It integrates multiple weak classifiers into a high-precision prediction model by Boost strategy. In the process of fossil energy consumption prediction, it can effectively improve the structure of the tree by combining multiple classifiers with the prediction of the true value of the error superposition weighted summation and continuous iteration, thus improving the performance of the model. The objective function of the XGBoost algorithm for evaluating the error is:
In the equation, Loss represents the loss function, yj is the true value, yi is the model's predicted value, x is the input data, fm is the approximation function of the tree model, and Ω is the regularization penalty term for the tree model. The approximation function of the tree model is defined as:
- b.
- CatBoost algorithm
CatBoost is an optimization algorithm for GBDT, which optimizes the gradient estimation process and can effectively mitigate the phenomenon of gradient bias and prediction result bias.GBDT calculates the negative gradient during each round of iteration and substitutes the negative gradient as a residual approximation into the next round of the decision tree solving, which leads to the true distribution bias in the domain of feature space. CatBoost is based on the sorting boosting method to reduce the gradient offset, which is based on the following principle: the training set D={xi, yi}(i=1,2,...,n) is sorted, and the sorting result is D1, Z={Z(1),Z(2),...,Z(n)}, and the samples xi are trained to produce the tree models Mi(i=1,2,...,n) , Mz(n)(xi) is the decision tree model corresponding to the sequence Zi-1 training xi, and the computational procedure for each training is:
Interpretability Analysis
- SHAP algorithm
This study uses the SHAP algorithm to conduct interpretability analysis on the results of machine learning. SHAP is a method based on cooperative game theory to measure the contribution of features. The specific calculation process of this algorithm is as follows: first, calculate the contribution of each feature vector to the coal consumption, then calculate the mean of the absolute values of SHAP for sample features, thus obtaining the contribution of each feature to the target variable. The calculation process of the SHAP value for the i-th sample is as follows:
Among them, M is the number of features, f is the model being explained, F is the set of all features, ;x’i is the i-th feature of the feature vector, and is the SHAP value of the i-th feature.
- b.
- Feature Importance Ranking
For tree models, constructing M trees, the data outside the bag for the k-th tree when k=1 is denoted as OOBk, the random perturbation of the i-th feature is denoted as OOBki, and the calculation process is as follows:
3. Results
3.1. Analysis of the Decoupling Relationship between Fossil Energy Consumption and Economic Development
In order to compare and study the decoupling relationship between fossil energy consumption and economic development in different provinces from 2011 to 2018, this article will cluster the calculated Topic decoupling index into four categories based on the K-Means algorithm. As shown in Figure 1, the decoupling situation of fossil energy consumption and economic development varies among provinces, showing a fluctuating pattern. In Figure 1b, from 2011 to 2018, the decoupling index of most provinces did not change significantly, mainly fluctuating between -5 and 10. These provinces are mainly located in the eastern, central, and western regions. Provinces such as Hubei, Sichuan, Guizhou, and Ningxia in the central and western regions have a large total value of fossil energy consumption.
In addition, there have been significant fluctuations in the provinces of Neimenggu, Heilongjiang, Hebei, Liaoning, and Jilin. Among them, the changes in Neimenggu are the most pronounced (Figure 1a), with its decoupling index reaching a low of -37.75 in 2012 and a high of 29.47 in 2013. From 2013 to 2018, the decoupling index of Neimenggu showed an overall decreasing trend. Heilongjiang also experienced significant changes, hitting a low of -16.35 in 2012 and a peak of 27.45 in 2013. From 2013 to 2018, the decoupling index of Heilongjiang fluctuated and showed a decreasing trend. The decoupling index trends of Hebei, Liaoning, and Jilin are relatively similar, fluctuating mainly between -15 and -20. The decoupling indexes of these three provinces were at their lowest in 2012, with Hebei reaching its highest value in 2013, and Liaoning and Jilin reaching their peaks in 2014. After 2015, the decoupling indexes of these three provinces stabilized with minor fluctuations.
3.2. Enhanced Temporal Data on Fossil Fuel Consumption
It shows the distribution of real data and generated data in a low-dimensional space(Figure 2). It can be observed that the fossil energy consumption data generated by TimeGAN in this study is quite similar to the distribution of real data, indicating a certain level of applicability.
3.3. Comparison of Machine Learning Algorithm Prediction Results
In order to quantitatively characterize the relationship between fossil energy consumption and time, this paper compared six regression methods and evaluated the model performance based on MAE, MSE, and RMSE, where smaller values indicate better fitting effects. As shown in Table 1, XGBoost and CatBoost significantly outperform other algorithms in the three indicators, being only around 50% of the values of the other models.
3.4. Driving Factors of Fossil Fuel Consumption
Feature importance is a method for calculating the importance of features built into tree models, while SHAP is a method based on cooperative game theory to measure the contribution of each factor to the target variable. This article continues to perform interpretable analysis on the well-performing XGBoost and CatBoost models based on the two methods mentioned above. The experimental results all show that population is the most important driving factor in fossil energy consumption, followed by GDP, and urbanization rate is the least important.
4. Conclusions
This article explores the spatiotemporal evolution patterns of fossil energy consumption based on machine learning algorithms, serving the goal of sustainable development. We have obtained the following conclusions:
- (1)
- From 2011 to 2018, the decoupling of fossil energy consumption and economic development in various provinces showed a situation of repeated fluctuations. The decoupling index of provinces in the eastern, central, and western regions was relatively stable, while Inner Mongolia, Heilongjiang, Hebei, Liaoning, and Jilin experienced larger fluctuations in their decoupling index, showing an overall trend of fluctuating decline.
- (2)
- The visualization process of PCA and t-SNE intuitively reflects the similarity between the generated samples of fossil energy consumption and real samples, which can greatly alleviate the small sample deficiency of panel data.
- (3)
- Compared four competitive algorithms (Decision Tree, KNN, LGBM, Linear Regression), objectively demonstrating the superiority of XGBoost and CatBoost in fitting fossil energy consumption data.
- (4)
- Through feature importance and SHAP analysis, it was found that the contribution ranking of three economic indicators to fossil energy consumption is: Population>GDP>Urbanization Rate. The impact of population on fossil energy consumption is the most significant. The growth in population size and substantial migration into an area both lead to a rapid increase in regional energy consumption. For instance, in regions such as Zhejiang and Jiangsu, where the economic development level is high, the attraction of a large influx of population can easily result in a rapid increase in fossil energy consumption. Additionally, studies have revealed that the regional elderly dependency ratio has a notably negative effect on carbon emissions from energy consumption within the region, as mentioned in the aforementioned research for regions with considerable fluctuations in the decoupling index such as Heilongjiang, Jilin, and Liaoning. Furthermore, the regional population's educational structure also influences energy consumption within the area; an improvement in population quality facilitates increased social productivity and technological advancement.
5. Discussion
Based on the conclusions of the above-mentioned research, this article further proposes the following suggestions:
The analysis of decoupling degree reflects the relationship between fossil energy consumption and economic growth in China during the research period. Since the "Twelfth Five-Year Plan", China has further promoted its low-carbon strategy, with energy intensity gradually decreasing, effectively promoting the decoupling of fossil energy consumption from economic growth. However, there are significant differences in the decoupling status among provinces. In 2019, China's energy consumption per unit of GDP dropped to 0.49 million tons of standard coal per million yuan, a decrease of 37.97% compared to 2011. China's energy efficiency has gradually improved, but in international comparison, China's energy consumption per unit of GDP is 1.5 times the world average, still significantly lagging behind developed countries. Therefore, to achieve the dual carbon goals and sustainable development, it is necessary to further improve China's energy efficiency and promote the transformation of economic growth patterns [30]. In accordance with the principles of implementing a comprehensive conservation strategy and leveraging market mechanisms proposed in the "Opinions of the CPC Central Committee and the State Council on Fully, Accurately, and Comprehensively Implementing the New Development Philosophy and Doing Well in Carbon Peak and Carbon Neutrality Work", strict control over total energy consumption and growth rate should be exercised, with binding targets set and gradually increasing target requirements. Additionally, the economic growth patterns in most provinces in China mainly rely on the consumption of energy products [31]. Therefore, it is necessary to adjust the energy consumption structure, reduce the excessive reliance of economic development on fossil energy. From 2008 to 2018, the annual average growth rates of hydropower, wind power, and solar power installed capacity in China were 6.5%, 102.6%, and 39.5% respectively. The development and utilization of green energy have reached an internationally leading level, and in the future, it is necessary to continue to consolidate and develop advantages, continuously improve the efficiency of renewable energy utilization, and promote further development of green energy development and utilization technologies. The secondary industry still accounts for a relatively high proportion in China's economic structure, and it is necessary to further accelerate industrial structure adjustment, eliminate outdated production capacity, transform high-carbon industries, especially in inland and northeastern regions, actively promote the renewal and transformation of old industrial bases. In addition, research has found that Guizhou, Ningxia, Inner Mongolia, Heilongjiang, Hebei, Liaoning, and other energy-intensive regions are the main areas of fossil energy consumption [32], as well as key areas for carbon emissions and reduction. Therefore, for energy-intensive regions, it is necessary to accelerate the improvement of a national and local carbon market system, gradually implement mechanisms such as carbon taxation, tax exemptions, and compensation incentives, use market mechanisms to constrain fossil energy consumption, and promote adjustments in emission reduction and economic growth patterns.
Currently, China has not yet achieved basic modernization, and China's per capita GDP is significantly lower than that of developed countries. In this situation, it is extremely challenging for China to achieve the goal of peaking carbon emissions in 2023. Therefore, it is crucial to understand the evolution patterns and main driving factors of fossil energy consumption, to monitor and accurately predict fossil energy consumption. This can provide scientific support for promoting energy conservation, emission reduction, regional coordinated development, and achieving China's "dual carbon" goals. Through feature importance and SHAP analysis, it is found that population is the most significant factor influencing fossil energy consumption. As China's population growth has entered a low-growth stage, a decrease in population growth will lead to a decrease in population energy consumption growth. It is necessary to continue implementing reasonable population policies, controlling population size, raising public awareness of energy conservation and emission reduction, and advocating for a green and low-carbon lifestyle. Additionally, it is important to further leverage the positive role of population factors, strengthen the construction of talent teams, and implement policies for talent introduction and cultivation in provinces with severe aging issues and relative lack of talent. This will promote technological development, improve energy efficiency, and reduce fossil energy consumption. Regarding GDP factors, on one hand, China needs to continue pursuing high-quality economic development. In 2019, China's per capita GDP just exceeded $10,000, while the United States had reached a per capita GDP of $60,000 when it peaked carbon emissions in 2007. For China to achieve the goal of peaking carbon emissions by 2030, both the overall economic size and per capita GDP need to double compared to 2019. On the other hand, there is a need to continuously increase the proportion of "climate investments" in GDP to address climate change. Since the People's Bank of China issued the "Guiding Opinions on Building a Green Financial System" in 2016, green finance in China has rapidly developed. The increase in the proportion of "climate investments" in GDP can provide economic support for improving energy efficiency and promoting technological innovation. The dual impacts of urbanization factors imply the need to reasonably arrange and promote the urbanization process, establish new urbanization policies, and carry out work on "peak carbon emissions" and "carbon neutrality" in areas such as urban infrastructure construction and waste management.
Although the model performs well on sample data, it is unknown whether it has transferability on datasets from other regions. In the future, we will continue to develop a new generation of global econometric models based on strategies such as adversarial samples, online learning, and semi-supervised learning, in order to obtain a model with better generalization capabilities. Additionally, we will use more indicators to construct the model and map the indicators to a two-dimensional space for better observation of high-dimensional data features.
Acknowledgments
This work was supported by the National Natural Science Foundation of China (32161143029), the Alliance of International Science Organizations (ANSO-CRKP-2020-02), the Key Research Program of the Innovation Academy for Green Manufacture, Chinese Academy of Sciences (IAGM-2019-A16), the Strategic Priority Research Program of the Chinese Academy of Sciences (XDA20030200).
References
- Martins F, Felgueiras C, Smitkova M, et al. Analysis of fossil fuel energy consumption and environmental impacts in European countries. Energies, 2019, 12(6): 964. [CrossRef]
- Martins F, Felgueiras C, Smitková M. Fossil fuel energy consumption in European countries. Energy Procedia, 2018, 153: 107-111. [CrossRef]
- Z. Jiang, Z. Ding, H. Zhang, W. Cai, Y. Liu.Data-driven ecological performance evaluation for remanufacturing process.Energy Convers Manage, 12 (198) (2019), pp. 1-12. [CrossRef]
- F. Bilgili, İ. Öztürk, E. Koçak, Ü. Bulut, Y. Pamuk, E. Muğaloğlu, et al.The influence of biomass energy consumption on CO2 emissions: a wavelet coherence approach.Environ Sci Pollut Res Int, 23 (19) (2016), pp. 19043-19061. [CrossRef]
- J. Lv, F. Gu, W. Zhang, J. Guo.Life cycle assessment and life cycle costing of sanitary ware manufacturing: A case study in China.J Cleaner Prod, 238 (2019), pp. 1-16. [CrossRef]
- Wuebbles D J, Jain A K. Concerns about climate change and the role of fossil fuel use. Fuel processing technology, 2001, 71(1-3): 99-119. [CrossRef]
- Roger Perman, Yue Ma, et al. Natural Resource and Environmental Economics . Beijing: China Economic Publishing House, 2002: 532-568.
- Kaya Yoichi. Impact of Carbon Dioxide Emission on GNP Growth: Interpretation of Proposed Scenarios. Presentation to the Energy and Industry Subgroup, Response Strategies Working Group, IPCC, Paris, 1989.
- Park S H. Decomposition of industrial energy consumption: An alternative method . Energy Economics, 1992, 14(4): 265-270. [CrossRef]
- Schipper L, Howarth R B, Carlesarle E. Energy intensity, sect oral activity, and structural change in the Norwegian economy energy . The International Journal, 1992, 17(3): 215-233. [CrossRef]
- Schipper L, Howarth R B, Anderson B. Energy use in Denmark: An international perspective. Natural Resources Forum, 1993, 17(2): 83-103. [CrossRef]
- Howarth R B, Schipper L. Manufacturing energy use in eight OECD countries: Trends through 1988 [J]. Energy Journal, 1991, 12(4): 15-40.
- Boyd G A, Hanson D A, Sterner T. Decomposition of changes in energy intensity: A comparison of the Divisia index and other methods . Energy Economics, 1988, 10(4): 309-312. [CrossRef]
- Liu X Q, Ang B W, Ong H L. The application of Divisia index to the decomposition of changes in industrial energy consumption [J]. The Energy Journal, 1992, 13(4): 161-177.
- Lorna A G, William B D, Schipper L. Comparison of six decomposition methods: Application to aggregate energy intensity for manufacturing in 10 OECD countries . Energy Economics, 1997, 19: 375-390. [CrossRef]
- Schipper L, Murtishaw S, Khrushch M. Carbon emissions from manufacturing energy use in 13 IEA countries: Long-term trends through 1995 . Energy Policy, 2001, 29: 667-688. [CrossRef]
- Hove S, Tursoy T. An investigation of the environmental Kuznets curve in emerging economies. Journal of Cleaner Production, 2019, 236: 117628. [CrossRef]
- Dong K, Sun R, Jiang H, et al. CO2 emissions, economic growth, and the environmental Kuznets curve in China: what roles can nuclear energy and renewable energy play?. Journal of cleaner production, 2018, 196: 51-63. [CrossRef]
- Yao S, Zhang S, Zhang X. Renewable energy, carbon emission and economic growth: A revised environmental Kuznets Curve perspective. Journal of Cleaner Production, 2019, 235: 1338-1352. [CrossRef]
- Moomaw W R, Unruh G C. Are environmental Kuznets curves misleading us? The case of CO2 emissions. Environment and development economics, 1997, 2(4): 451-463. [CrossRef]
- Bibi F, Jamil M. Testing environment Kuznets curve (EKC) hypothesis in different regions. Environmental Science and Pollution Research, 2021, 28: 13581-13594. [CrossRef]
- Cao H, Han L, Liu M, et al. Spatial differentiation of carbon emissions from energy consumption based on machine learning algorithm: A case study during 2015–2020 in Shaanxi, China. Journal of Environmental Sciences, 2023. [CrossRef]
- Zhong Taiyang, Huang Xianjin, Han Li et al. Research progress of decoupling analysis in resources and environment. Journal of Natural Resources,2010,25(08):1400-1412. (in Chinese).
- Song Y, Sun J, Zhang M, et al. Using the Tapio-Z decoupling model to evaluate the decoupling status of China's CO2 emissions at provincial level and its dynamic trend. Structural Change and Economic Dynamics, 2020, 52: 120-129. [CrossRef]
- Wenbo G, Yan C. Assessing the efficiency of China’s environmental regulation on carbon emissions based on Tapio decoupling models and GMM models. Energy Reports, 2018, 4: 713-723. [CrossRef]
- Liu G, Yang J, Hao Y, et al. Big data-informed energy efficiency assessment of China industry sectors based on K-means clustering. Journal of cleaner production, 2018, 183: 304-314. [CrossRef]
- Dai J, Fang J, Guo Z, et al. Research on ecological restoration assessment and eco-economic development of sea area by introducing the K-means clustering algorithm. Environmental Science and Pollution Research, 2023, 30(56): 118318-118331. [CrossRef]
- Ulussever T, Kılıç Depren S, Kartal M T, et al. Estimation performance comparison of machine learning approaches and time series econometric models: evidence from the effect of sector-based energy consumption on CO2 emissions in the USA. Environmental Science and Pollution Research, 2023, 30(18): 52576-52592. [CrossRef]
- Janković R, Mihajlović I, Štrbac N, et al. Machine learning models for ecological footprint prediction based on energy parameters. Neural Computing and Applications, 2021, 33: 7073-7087. [CrossRef]
- Wu N, Shen L, Zhong S, et al. Spatio-temporal coupling relationship between economic growth and carbon emission in Shanxi-Shaanxi-Inner Mongolia. Econ. Geogr, 2019, 39: 17-23.
- Shen M, Shen L, Zhang C, et al. Analysis on the Coordination among Energy Supply, Economic Growth and Environment in Shaanxi Province. Areal Research and Development, 2015, 34 (01): 123-126+143.
- Hu A G. China’s goal of achieving carbon peak by 2030 and its main approaches. Journal of Beijing University of Technology (Social Sciences Edition), 2021, 21(3): 1-15.
Figure 1.
(a)-(d) represent the four groups of results after the research area is clustered using K-Means algorithm.
Figure 1.
(a)-(d) represent the four groups of results after the research area is clustered using K-Means algorithm.
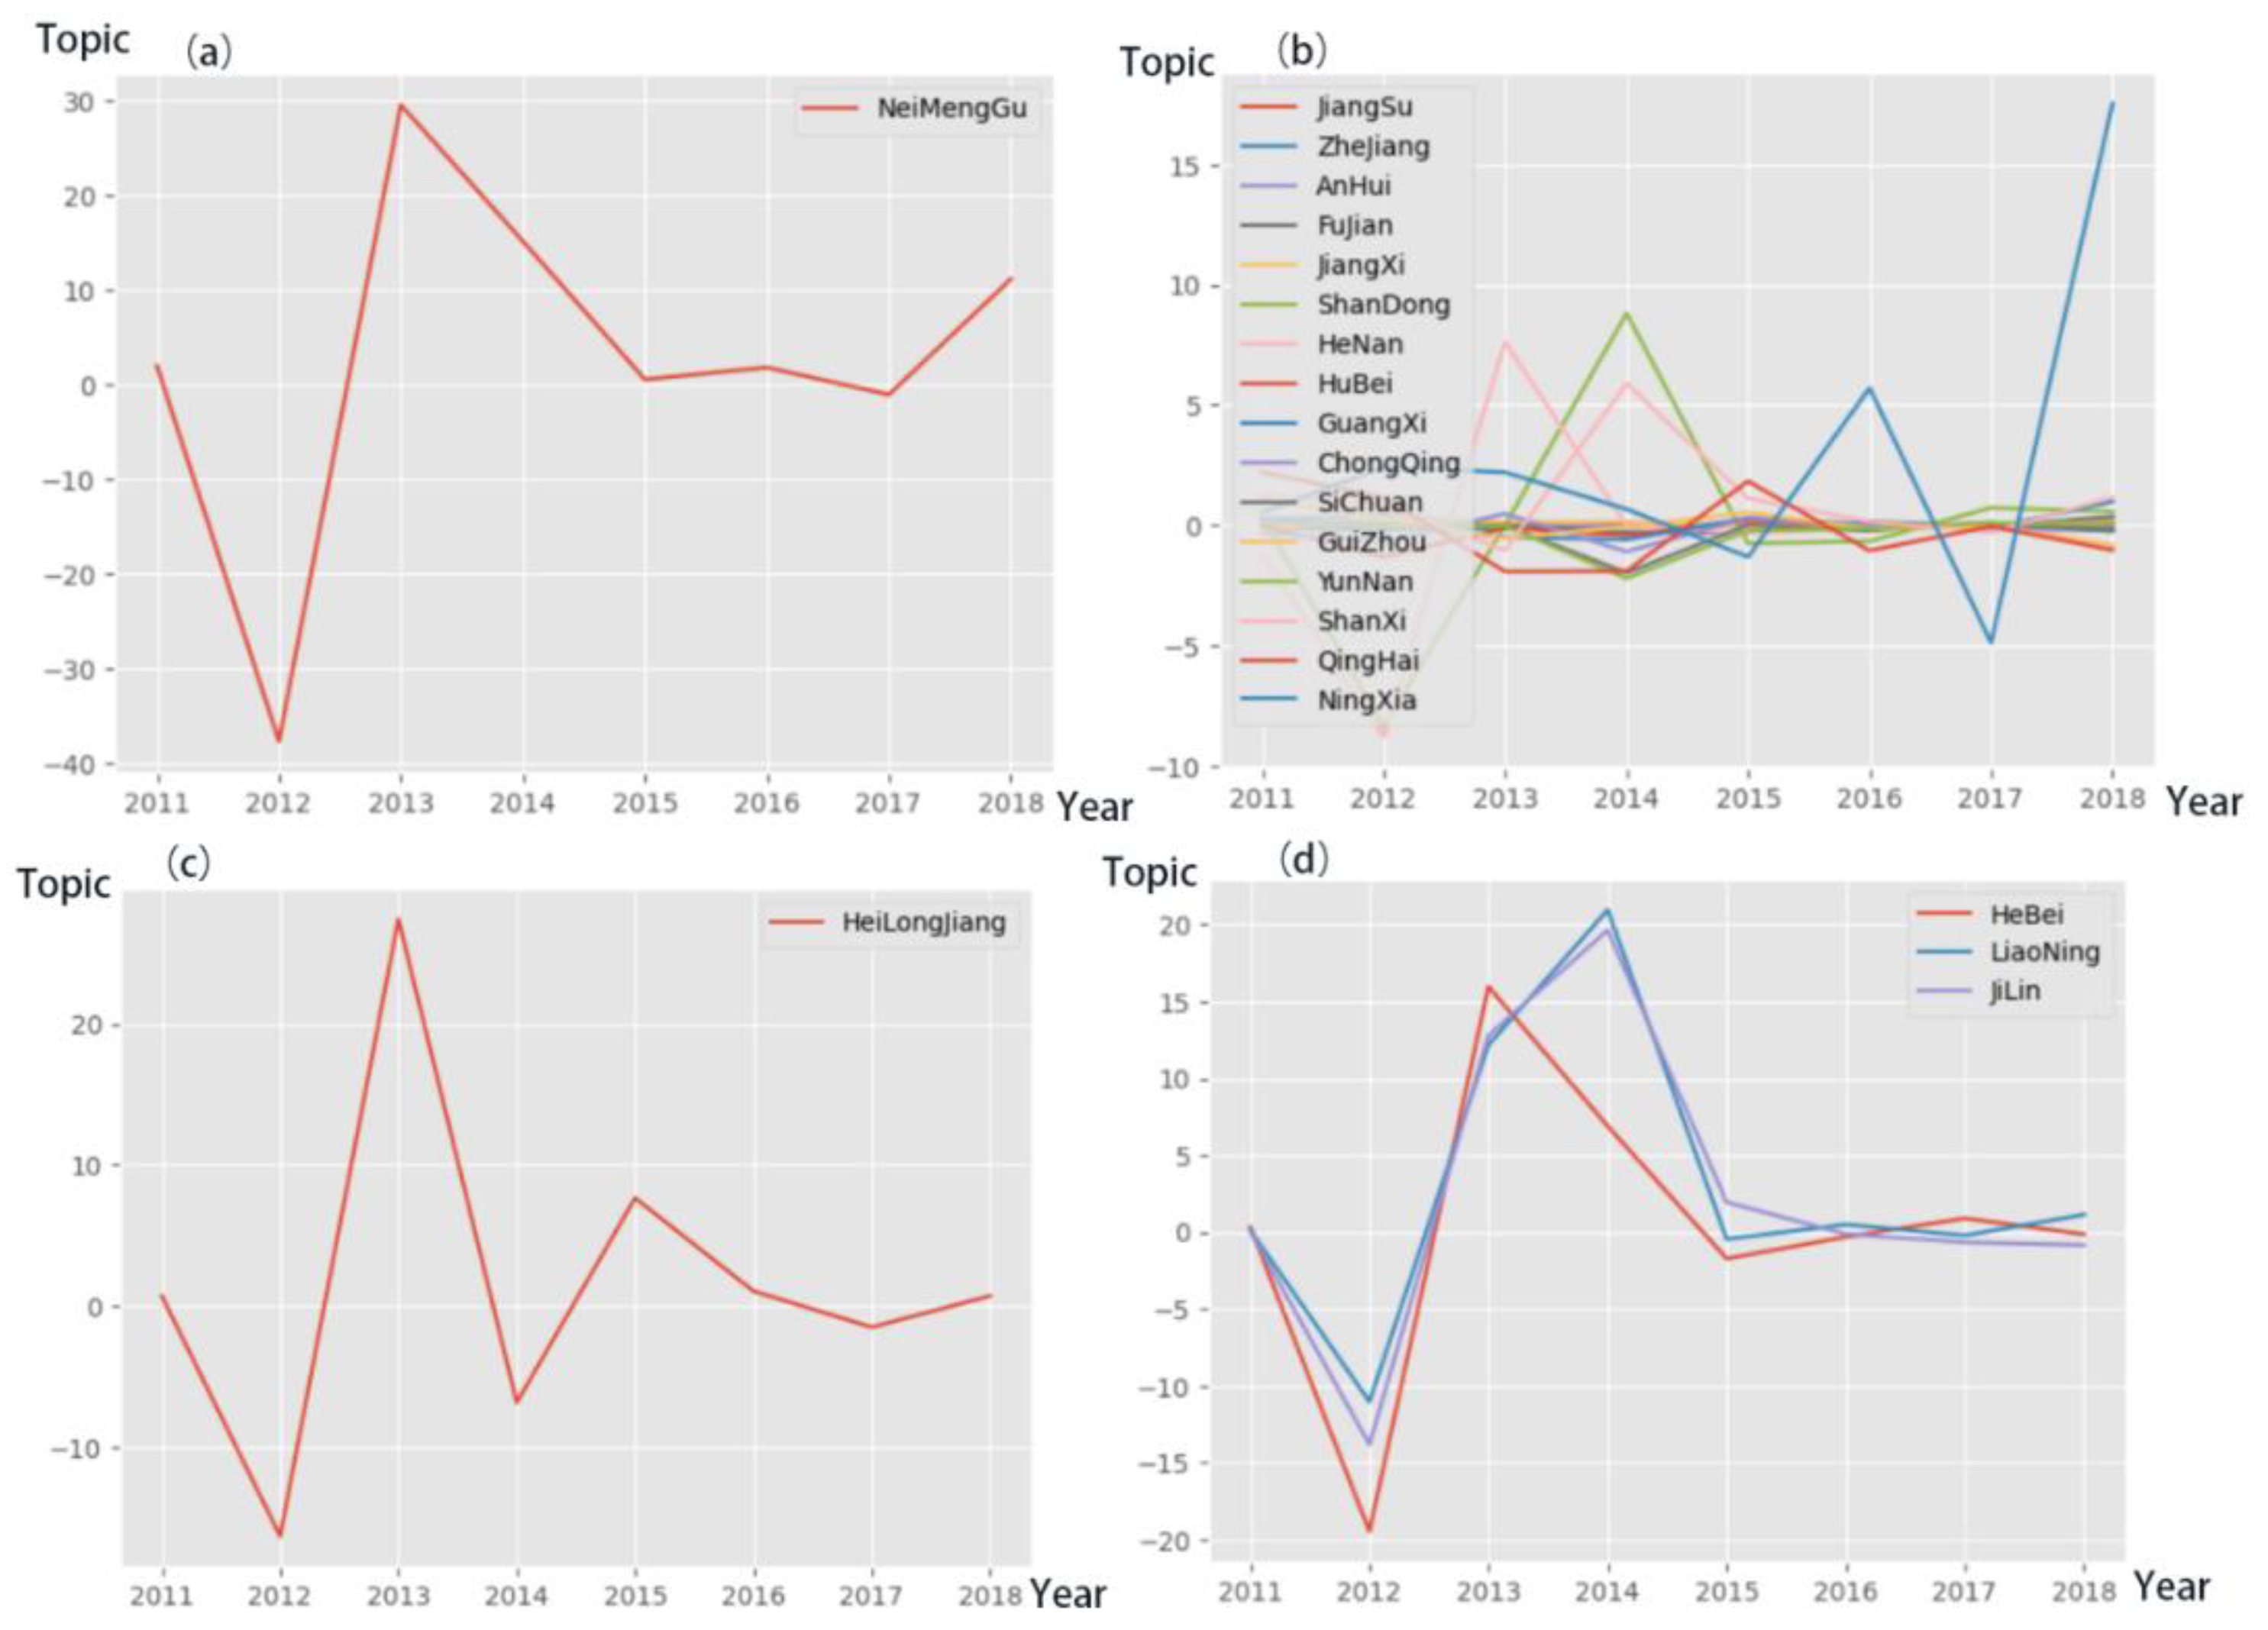
Figure 2.
Evaluation of generated data quality. 2. (a) Evaluation of generated data quality based on PCA. 2. (b) Evaluation of generated data quality based on t-SNE.
Figure 2.
Evaluation of generated data quality. 2. (a) Evaluation of generated data quality based on PCA. 2. (b) Evaluation of generated data quality based on t-SNE.
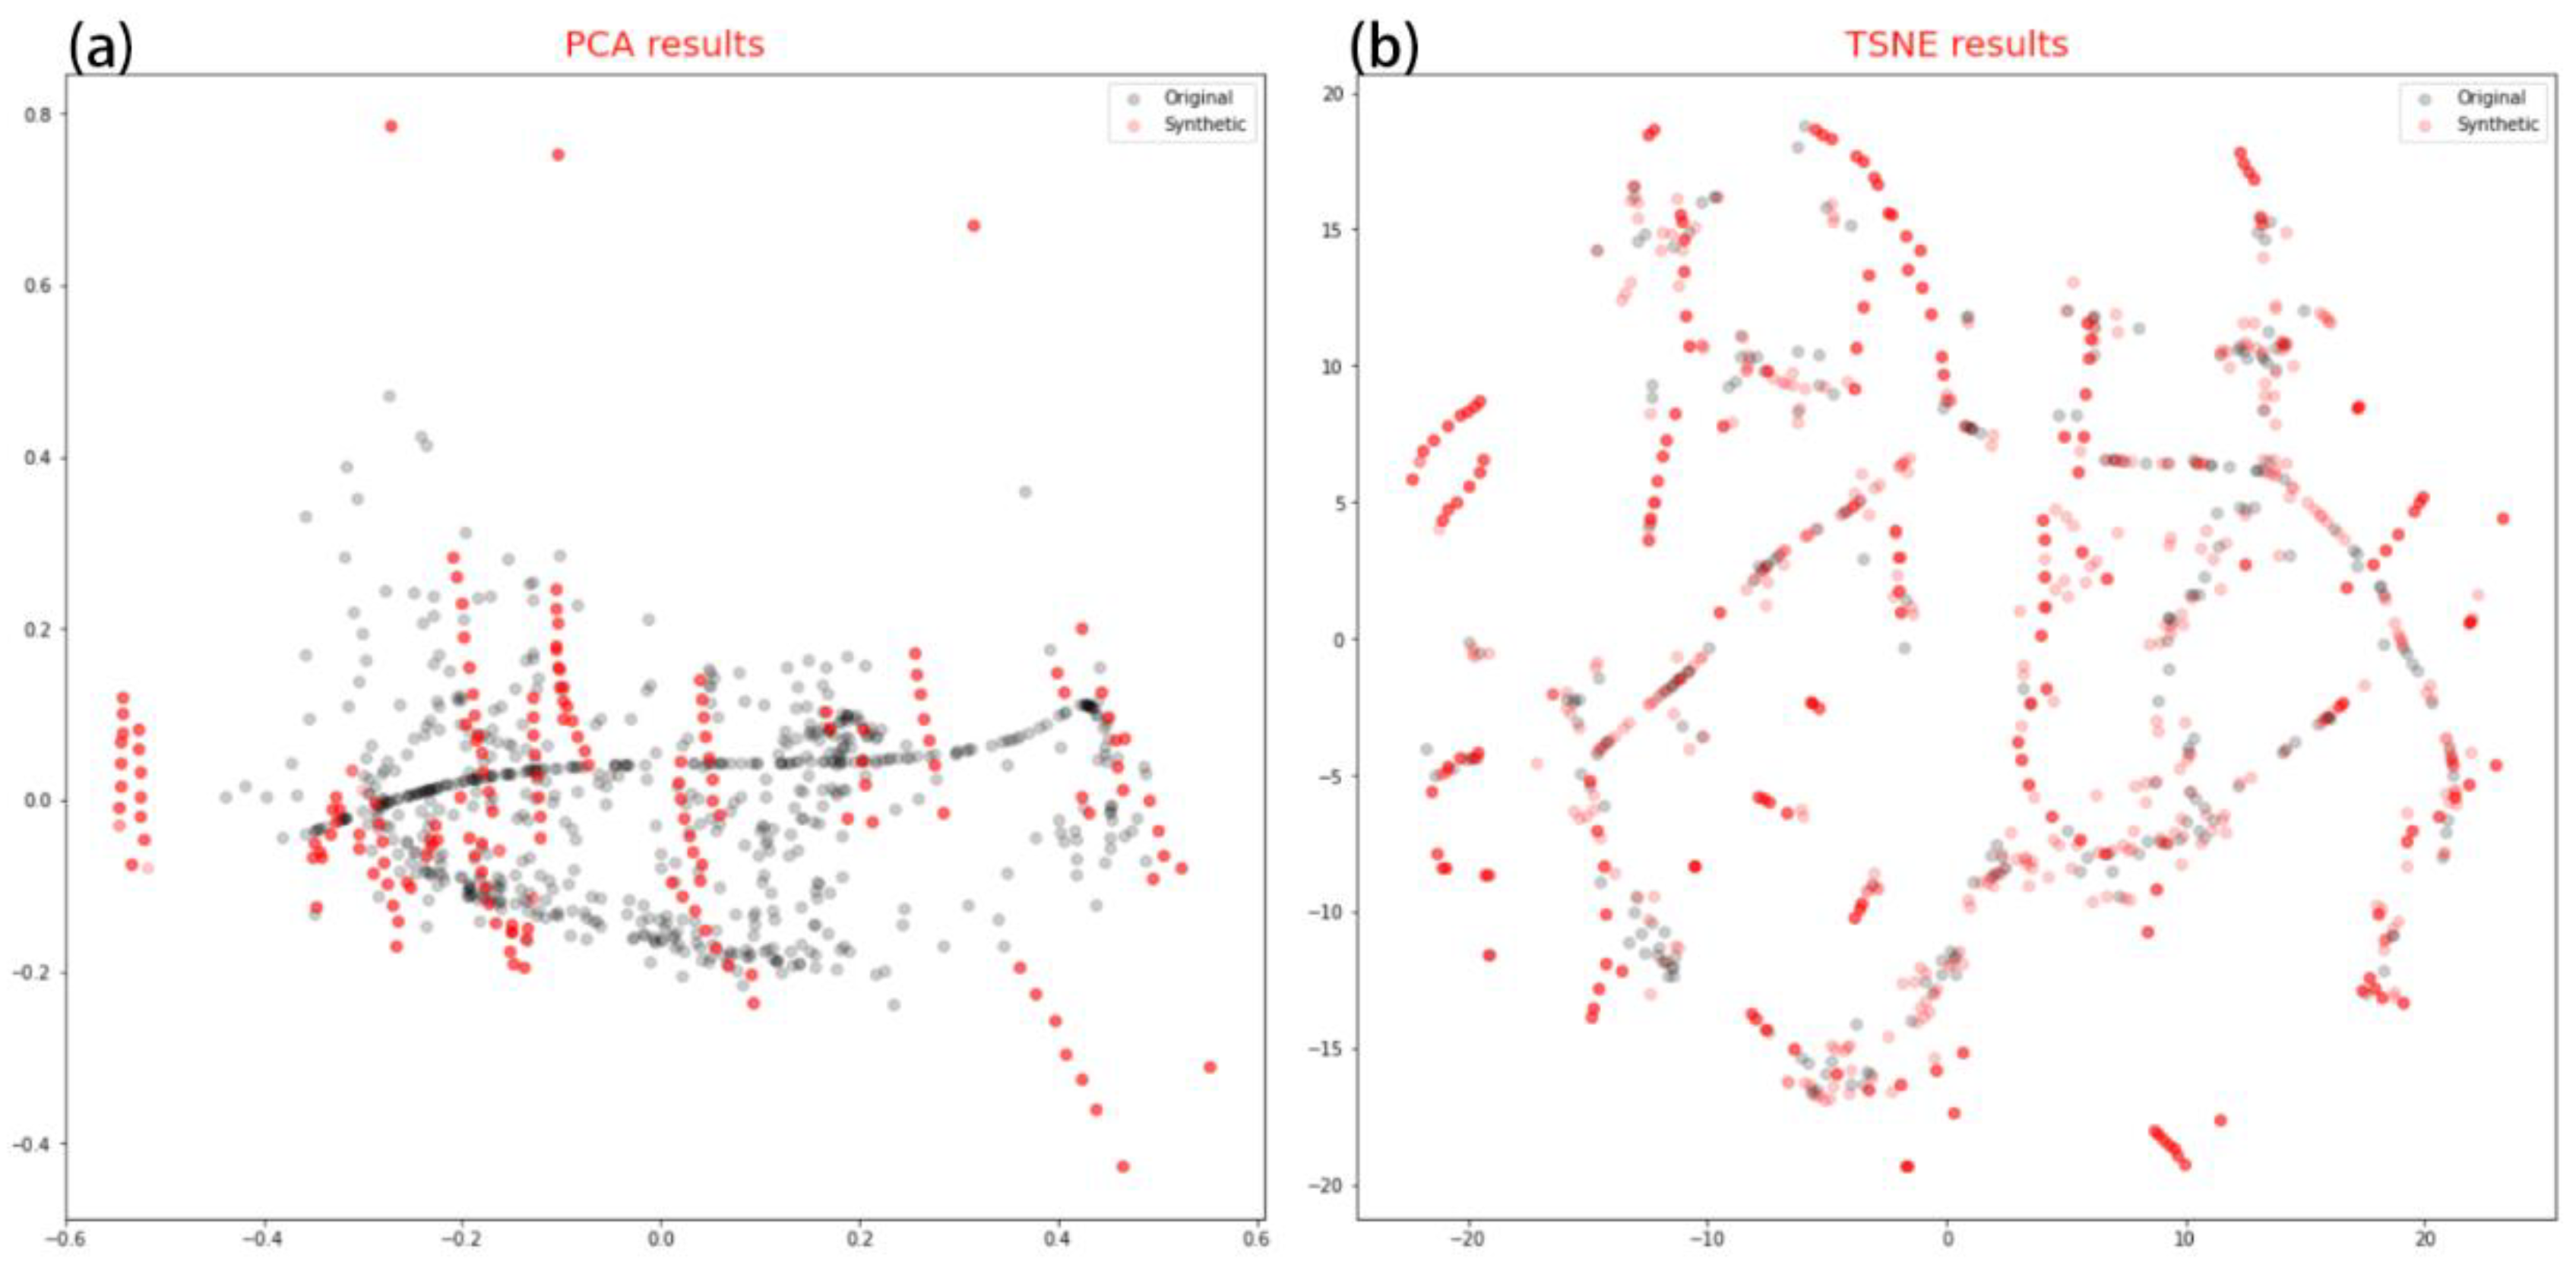
Figure 3.
Analysis of driving factors for fossil energy consumption. 3. (a)-(b) represent the feature importance analysis of XGBoost and CatBoost regression. 3. (c)-(d) represent the SHAP analysis of XGBoost and VatBoost.
Figure 3.
Analysis of driving factors for fossil energy consumption. 3. (a)-(b) represent the feature importance analysis of XGBoost and CatBoost regression. 3. (c)-(d) represent the SHAP analysis of XGBoost and VatBoost.
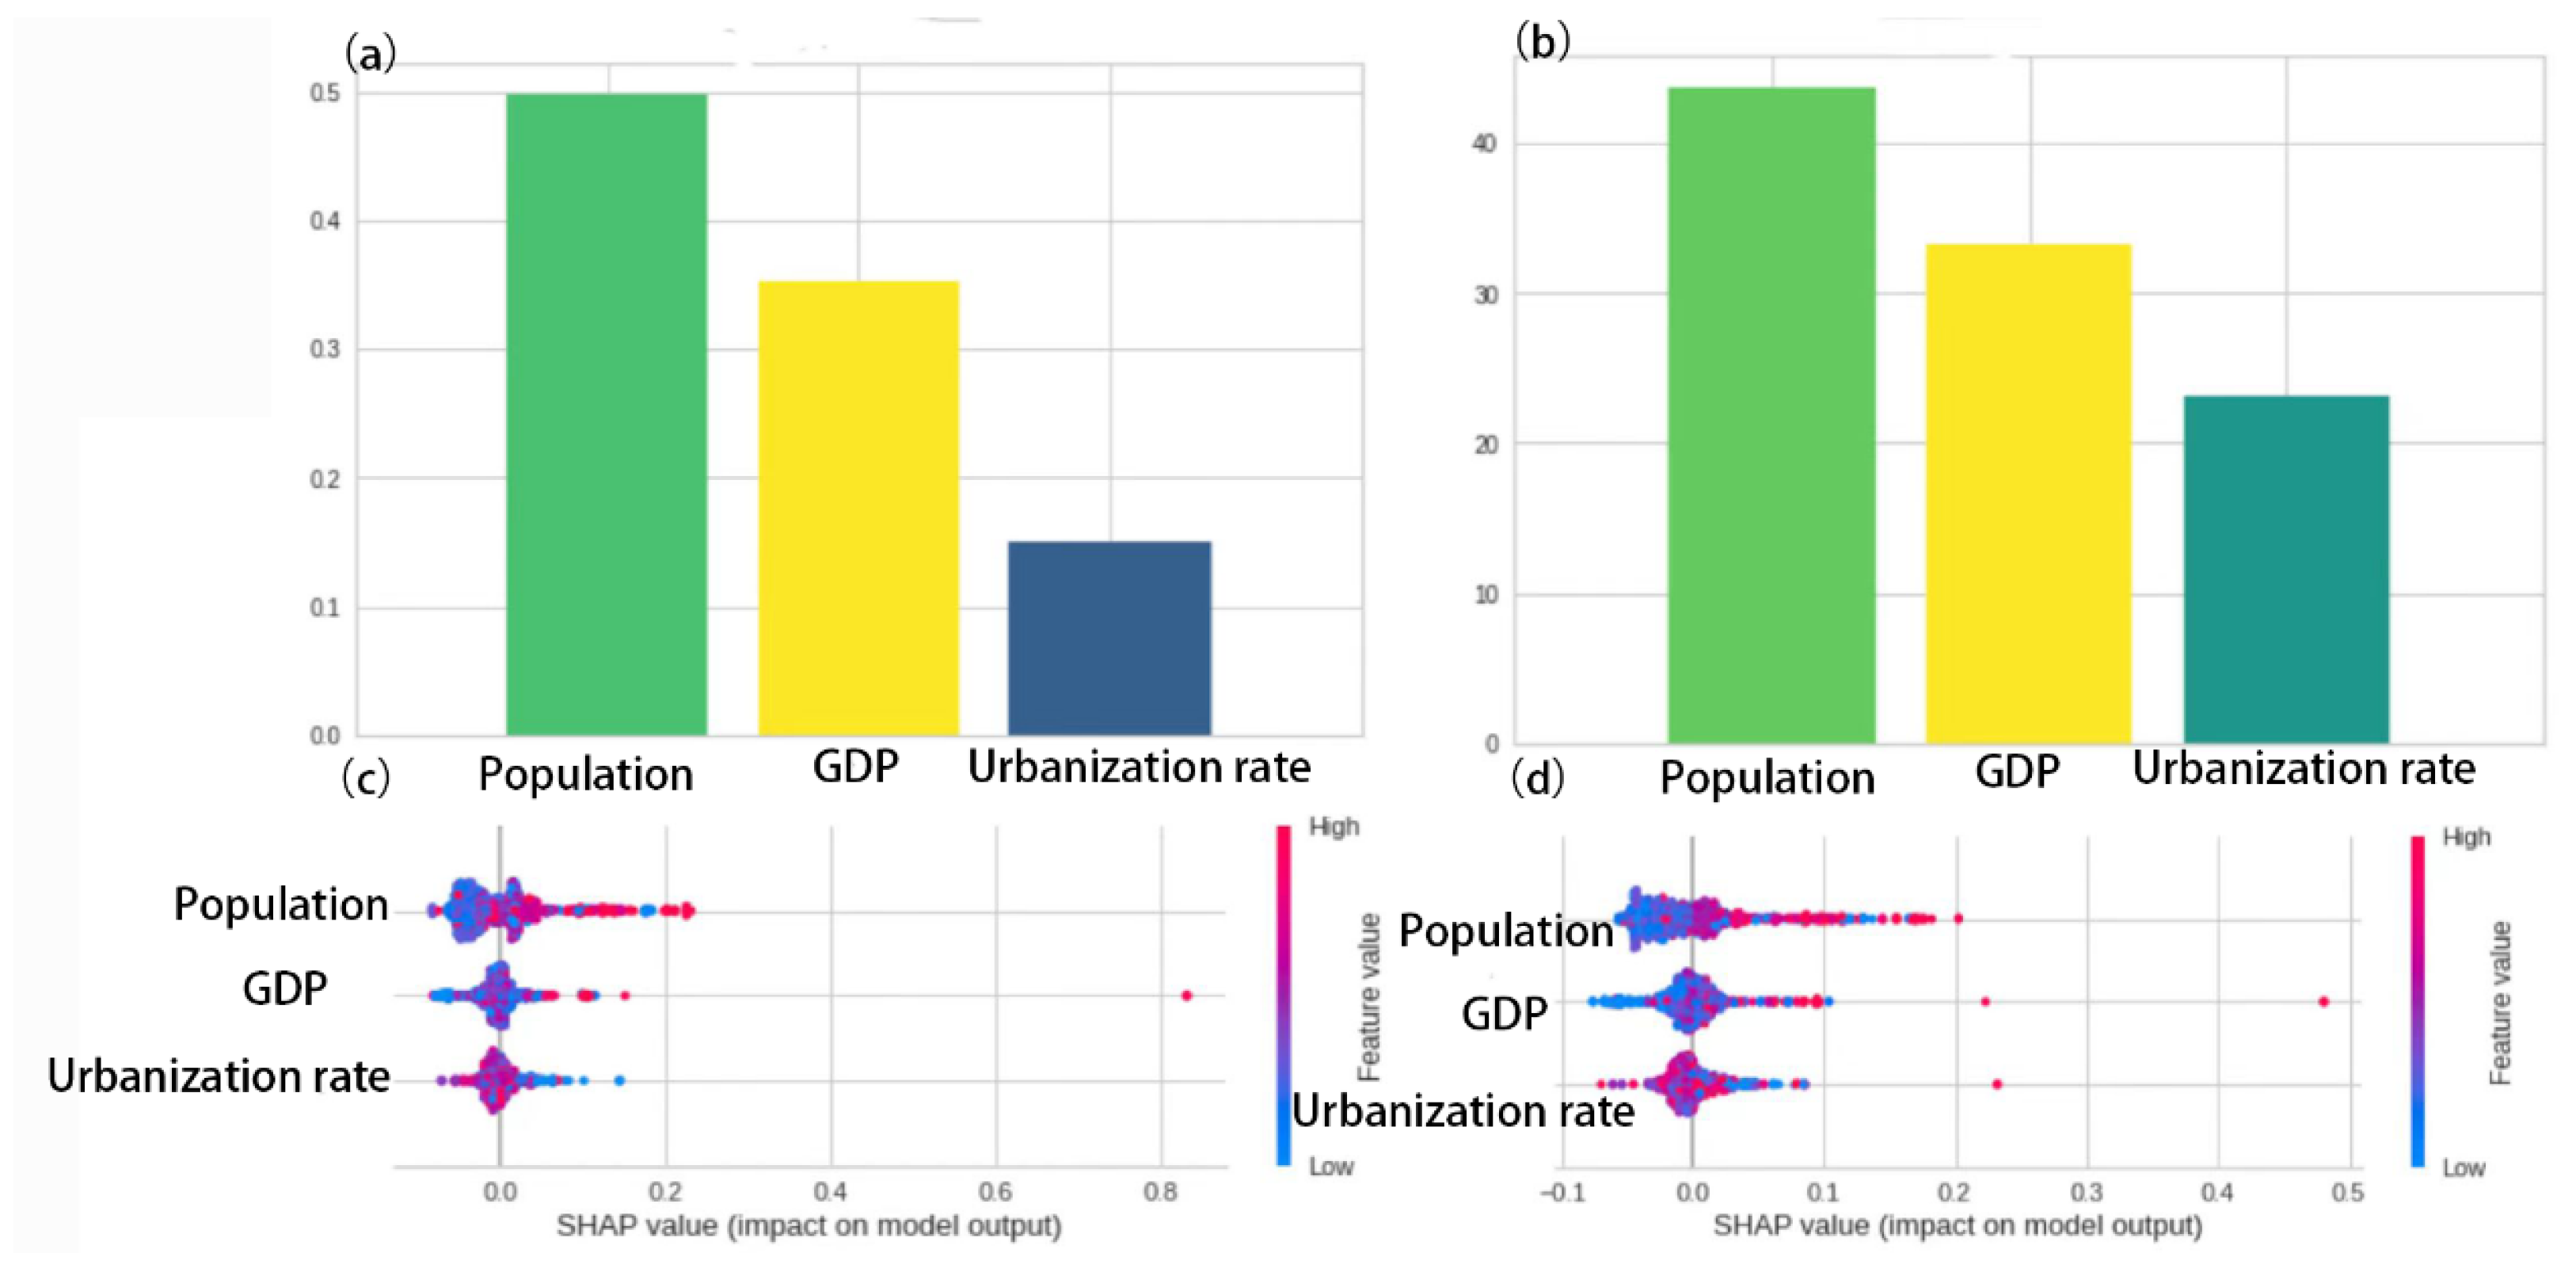

Table 1.
the performance of Multiple machine learning algorithms.
| Model | MAE | MSE | RMSE |
|---|---|---|---|
| XGBoost | 0.013 | 0.0011 | 0.033 |
| CatBoost | 0.018 | 0.0011 | 0.033 |
| LGBM | 0.029 | 0.0035 | 0.059 |
| KNN | 0.034 | 0.0050 | 0.042 |
| Decision Tree | 0.016 | 0.0018 | 0.042 |
| Linear Regression | 0.051 | 0.0074 | 0.086 |
Disclaimer/Publisher’s Note: The statements, opinions and data contained in all publications are solely those of the individual author(s) and contributor(s) and not of MDPI and/or the editor(s). MDPI and/or the editor(s) disclaim responsibility for any injury to people or property resulting from any ideas, methods, instructions or products referred to in the content. |
© 2024 by the authors. Licensee MDPI, Basel, Switzerland. This article is an open access article distributed under the terms and conditions of the Creative Commons Attribution (CC BY) license (http://creativecommons.org/licenses/by/4.0/).
Copyright: This open access article is published under a Creative Commons CC BY 4.0 license, which permit the free download, distribution, and reuse, provided that the author and preprint are cited in any reuse.


