Submitted:
13 October 2024
Posted:
14 October 2024
You are already at the latest version
Abstract
Since its introduction, weight-bearing computed tomography (WBCT) has gained prominence due to its ability to produce accurate three-dimensional images under natural loading conditions, making it particularly useful for assessing complex foot deformities. This review aimed to focus on the diseases of the foot and categorized the pathological conditions into forefoot disease (hallux valgus), midfoot disease (Lisfranc injuries and midfoot osteoarthritis), and progressive collapsing foot deformity. Owing to its superior diagnostic therapeutic value, WBCT is poised to become the gold standard in foot and ankle imaging.
Keywords:
Weight-bearing
; CT
; Hallux valgus
; Lisfranc injury
; Midfoot osteoarthritis
; Progressive Collasping Foot Disease
1. Introduction
Over the past decade, weight-bearing computed tomography (WBCT) has been actively utilized in the field of foot and ankle surgery. In fact, with the development of digitally reconstructed radiographs (DRRs), three-dimensional (3D) processing, and the introduction of artificial intelligence (AI) technologies, WBCT may completely replace conventional radiographs in the near future (Figure 1) [1]. The advantages of WBCT include high accuracy, owing to its 3D imaging that is not affected by bone superimposition or projection angles, low radiation doses, and reduced image acquisition time due to automated processing programs [2].
Recently, Kim et al reviewed the use of weightbearing CT for diseases of the ankle joint [2]. In this review, we aimed to focus on the diseases of the foot and categorized the pathologic conditions into forefoot disease (hallux valgus), midfoot disease (Lisfranc injuries and midfoot instability), and progressive collapsing foot deformity.
2. Forefoot Diseases (Hallux Valgus)
Studies on WBCT in hallux valgus deformity can be classified into the following categories: application of WBCT for conventional parameters used in weight-bearing radiographs, measurement of the first metatarsal pronation, and evaluation of the first ray instability.
2.1. Application of Conventional Radiographic Parameters
Collan et al were the first to apply the conventional parameters used in weight-bearing radiographs on WBCT [3]. The authors compared the hallux valgus angle (HVA) and 1-2 intermetatarsal angles (IMA) on plain radiographs with 2D and 3D angles on WBCT and found strong correlation between the measurement methods. From this finding, authors concluded that WBCT can be used as a primary diagnostic measure for hallux valgus because all conventional data can be obtained accurately, along with three-dimensional rotational status of the first ray. With the development of technology, numerous approaches have been made to more accurately and handily identify the pathological characteristics of hallux valgus. Lalevee et al adopted computerized postprocessing method on distal metatarsal articular angle (DMAA) and reported that conventional radiographs overestimate DMAA by 14 degrees [4]. They suggested that computerized pronation correction of first metatarsal bone (M1) using WBCT would be needed to objectively evaluate the valgus status of the M1 distal articular surface. Similarly, Zhong et al developed an innovative computer-aided design method, which showed comparable measurement reliability with conventional radiographs in terms of HVA and IMA, while better accuracy for DMAA [5].
Moreover, research aimed at automating the measurements for hallux valgus is also being actively conducted. De Carvalho compared semi-automatic and manual measurements for radiographic parameters (HVA, IMA, and IPA (Interphalangeal angle) using WBCT in hallux valgus [6]. Following manual bone segmentation by a user, the software automatically registered a mathematical model, which computed the anatomical landmarks for measurement and longitudinal axes of the selected bones. Using this method, authors concluded that semi-automatic measurements demonstrated reproducible and comparable results to manual measurements. In a multicenter study including 128 feet from 93 patients who underwent WBCT, Day et al compared automatically measured IMA using the AI software with manually measured IMA on DRRs [7]. Authors reported that AI-based automatic measurement showed strong correlations with manual measurements, with near-perfect reproducibility. If applicable in the clinical setting, automatic measurement would enable an intuitive identification of WBCT data and prompt development of therapeutic strategies for hallux valgus.
2.2. First Metatarsal Pronation
Traditionally, hallux valgus has been understood as a two-dimensional deformity, that is varus deviation of the first metatarsal bone (M1) and valgus orientation of the great toe [8]. As a result, classic radiographic parameters (i.e. HVA, IMA, and DMAA) that defines the horizontal relationship between metatarsals and phalanges have been considered an important reference to establish a treatment strategy in hallux valgus deformity [9]. With the development in diagnostic modalities, however, consensus have been made that the deformity also involves a coronal component, namely, pronation of the M1 [10]. Consequently, a three-dimensional approach should now be made to enhance the understanding of the complex triplanar deformity of hallux valgus.
Using a semi-weightbearing CT, Kim et al devised the alpha angle to evaluate the pronation of the M1 [11]. It was determined on the axial view by measuring the angle between the line bisecting the M1 and the vertical line perpendicular to the horizontal ground axis (Figure 2). Authors reported that 87.3% of the patients with hallux valgus had a more pronated M1 than the control group, with a greater alpha angle. Similarly, Campbell et al measured the M1 rotation with 3D geometrically determined angles and found that M1 pronation relative to second metatarsal was 8.2 degrees greater in the hallux valgus group than in the control group [12]. Furthermore, Mansur et al used WBCT to verify the round sign, an indirect sign of M1 pronation in conventional radiographs, and concluded that round sign weakly correlated with the alpha angle measured on WBCT [13]. Overall, these findings suggest that it is challenging to fully recognize the complex 3D deformities of hallux valgus using only conventional radiographs and incorporation of WBCT would be beneficial.
Several studies focused on the impact of M1 pronation after hallux surgery. Conti et al conducted a study to determine if postoperative decrease in M1 pronation observed in WBCT would be associated with changes in patient-reported outcomes [14]. Patients who underwent modified Lapidus procedure for hallux valgus were divided into two groups with regards to the amount of postoperative M1 pronation change, and the Patient Reported Outcomes Measurement Information System (PROMIS) scores were compared between groups. At 2 years postoperatively, patients who had significant decrease in M1 pronation after modified Lapidus procedure showed greater improvement in the PROMIS physical function domain. Choi et al utilized simulated weight bearing CT to evaluate the association between preoperative M1 pronation and postoperative recurrence after proximal chevron osteotomy [15]. To quantify the amount of preoperative M1 pronation, authors measured M1 pronation angle (M1PA) (Figure 3). They reported that patients who had significant correction loss at 1 year after surgery exhibited higher preoperative M1PA, with a 28.4 degrees threshold. These results pose an importance of recognizing preoperative M1 pronation through WBCT because rotational component of the hallux valgus deformity would impact postoperative outcomes and recurrence rates after surgery.
2.3. First Ray Instability
Extensive research has demonstrated that hypermobility of the first ray is strongly involved in the pathogenesis of hallux valgus [16,17]. Previously, only two-dimensional, sagittal component of the first ray mobility could be measured with conventional radiographs [18]. With WBCT, however, 3D components of the first ray hypermobility in hallux valgus could also be considered (Figure 4).
Kimura et al used simulated WBCT and evaluated details regarding instability of the first ray [17]. They reported that first ray instability occurs at every single joint that composes the first ray, and each joint demonstrates unique 3D motion. For instance, the hallux valgus group showed greater dorsiflexion, inversion and adduction of the first metatarsal compared with medial cuneiform at the first tarsometatarsal (TMT) joint, while greater eversion and abduction of the medial cuneiform than navicular bone at the medial cuneonavicular joint. Furthermore, they also evaluated displacement of the first-second intercuneiform joint in a separate study and concluded that patients with hallux valgus had greater dorsiflexion, inversion, and abduction relative to the medial cuneiform [19]. Lee et al also investigated signs of instability of the first TMT joint on WBCT and concluded that hallux valgus group demonstrated instability predominantly in sagittal and axial planes [20]. Based on the results of aforementioned studies, WBCT could be regarded as a valuable tool to accurately capture the 3D instability of the first ray in hallux valgus and to determine the necessity of surgical intervention.
3. Midfoot Disease
3.1. Lisfranc Injuries
Lisfranc injury indicates injuries on the tarsometatarsal joint of the foot resulting from low-energy induced ligamentous injury to high-energy induced fracture or dislocation [21]. Among the injury spectrum, low-energy induced subtle Lisfranc injuries are often misdiagnosed initially because these are presented without substantial radiographic abnormality on the weight-bearing radiographs [22]. In fact, owing to the biomechanical importance of the Lisfranc joint as a keystone in the foot arch, even a subtle injury should be diagnosed precisely and managed properly [23]. Although conventional CT or MRI can be accompanied to overcome the relatively low sensitivity, unloaded condition may not fully demonstrate the physiologic property of the midfoot [24,25].
Recently, multiple studies have reported the use of WBCT in Lisfranc injuries. Sripanich et al conducted an experiment on 24 intact cadaveric feet to investigate the amount of Lisfranc ligamentous complex (LLC) joint widening after injury under different loading conditions [26]. They found that Lisfranc joint widening greater than 1.5mm under partial weight bearing conditions on WBCT could be regarded as a complete Lisfranc injury. In fact, additional adjacent ligament injury was needed for Lisfranc joint widening to be greater than 2mm, which is a well-known diagnostic cut-off value on conventional radiographs. This finding indicates that isolated Lisfranc ligament injury could be overlooked in conventional radiographs if 2mm widening was used as a radiographic threshold.
To enhance the diagnostic accuracy, Campbell et al proposed an augmented stress weight-bearing CT to detect subtle, dynamically unstable Lisfranc injuries [27]. With weight bearing on both feet facing forward, the patient was asked to raise both heels from the scanner platform. This plantarflexion force on the midfoot provides augmented stress on the midfoot, which would improve the sensitivity to identify subtle Lisfranc injury.
Instead of conventional axial measurement of the Lisfranc joint, some novel WBCT parameters have been developed and introduced to be used in the clinical setting. Sripanich evaluated 96 cadaveric specimen and designed a WBCT protocol to enhance the reliability of Lisfranc joint measurement [27]. They found that measuring the distance between medial cuneiform and second metatarsal with coronal WBCT imaging would be a reproducible way to localize the interosseous Lisfranc ligament injury. Similarly, Bhimani et al evaluated the Lisfranc joint complex using one dimensional (1D), two dimensional (2D), and 3D measurements on WBCT scans among operatively confirmed Lisfranc instability (Figure 5) [28]. They concluded that coronal 3D volumetric measurement had higher sensitivity and specificity than 2D and 1D measurements, because the second metatarsal tends to displace both laterally and superiorly in Lisfranc injury. Despite its inherent limitation to be actively used in acute condition, WBCT may enhance diagnostic accuracy for suspicious Lisfranc injuries with uncertain conventional radiograph findings.
3.2. Midfoot Osteoarthritis
In the midfoot, precise identification of associated articulations and osseous borders in conventional weightbearing radiographs may not be handy because it can be affected by overlapping of adjacent bones viewed two-dimensionally [29]. (Figure 6) For this reason, WBCT could be an alternative as it enables clear joint space visualization and enhanced bony landmark identification under physiological weightbearing condition. Steadman et al compared weightbearing radiograph and WBCT with regards to diagnostic accuracy in midfoot osteoarthritis [30]. They found that weightbearing radiograph demonstrated 61.5 to 72.5 % sensitivity and 87.9 to 96.1 % specificity in identifying midfoot osteoarthritis. It also showed less accurate localization of degenerative changes and a greater tendency to underestimate disease severity compared to WBCT. These findings indicate that WBCT would be a better diagnostic option in midfoot osteoarthritis as it provides earlier and more reliable diagnosis.
With the support of such high accuracy of WBCT, Kim et al aimed to re-establish the prevalence of midfoot arthritis [31]. Analyzing 606 patients who underwent WBCT for foot and ankle problems, authors detected that 57.9% of the patients had midfoot arthritis, which is higher than previous studies that were based on surveys, physical examination, and conventional radiographs. Authors also confirmed the related factors associated medical history and comorbid foot deformities for midfoot arthritis, which was previously determined based on conventional radiographs [32]. They concluded that older age, right sided, increased body mass index (BMI), PCFD, and lateral toe deformities contribute to higher possibility of midfoot arthritis, based on WBCT. Given the significant differences compared to previous results, we believe that WBCT should be more actively used in the clinical assessment of patients presenting with dorsal foot pain.
4. Progressive Collapsing Foot Deformity
In 2020, Myerson et al proposed a term “Progressive Collapsing Foot Deformity (PCFD)” and a new classification system to summarize the adult acquired flatfoot deformity [33]. The new system includes terms “progressive” and collapsing” to give a better idea of worsening and evolving nature of complexity of the 3D deformity. It covers varying degrees of hindfoot valgus (Class A), mid/forefoot abduction (Class B), medial column instability (Class C), peritalar subluxation (Class D), and ankle instability (Class E). Given these points, WBCT could be a highly effective tool for interpreting and classifying a complex 3D deformity within PCFD.
4.1. Hindfoot Valgus Deformity (Class A)
As in plain radiographs, the hindfoot alignment angle (HAA) and hindfoot moment arm (HMA) are commonly used measurements in WBCT as indicators for assessing hindfoot valgus in PCFD [34]. de Cesar Netto et al reported that clinical examination of the HAA tends to underestimate the extent of hindfoot valgus and suggested that WBCT measurements would be more reliable and repeatable [35]. These parameters, however, are limited in that they cannot account for the fact that forefoot deformity can act as a contributor to hindfoot deformity [36].
As an alternative, FAO is considered a validated measurement demonstrating relationship between center of ankle joint and center of tripod of the foot, which can be calculated semiautomatically using WBCT (Figure 7) [37]. Because it simultaneously reflects the alignment of hindfoot, midfoot, and forefoot, FAO is being widely used to measure the overall 3D foot deformity. Lintz et al reported that FAO values greater than 4.6% have a specificity of 100% and a sensitivity of 89.2% for diagnosis of PCFD [38]. Day et al. compared the FAO values before and after surgery in the feet of 20 PCFD patients, showing a significant difference from 9.8% before surgery to 1.3% after surgery [39]. Consequently, FAO is considered a critical measurement modality in evaluating the overall PCFD before surgery and predicting the extent of correction after surgery.
4.2. Midfoot/Forefoot Abduction (Class B)
The talonavicular coverage angle is also used in WBCT as an indicator to assess midfoot abduction [34]. In fact, a new classification system for PCFD includes sinus tarsi impingement as one of the findings of midfoot abduction. Sinus tarsi impingement, which commonly causes lateral hindfoot pain, is caused by bony contact between the talus and calcaneus and should be addressed when establishing a therapeutic strategy in PCFD [40]. Because of superimposition effects, however, sinus tarsi impingement is difficult to identify using conventional radiographs. Instead, WBCT allows for identification of bony impingement in physiological standing position. Kim et al devised a novel method to measure the talocalcaneal distance, which features realignment of the coronal and sagittal planes to directly trace the inferior border of the lateral process of the talus [41] (Figure 8). The inferior border of lateral process of the talus is chosen to reconstruct the coronal reference plane because it is a constant anatomical landmark to obtain minimal talocalcaneal distance. Using this method, authors investigated correlation of talocalcaneal distance narrowing with common radiographic parameters on standard weight-bearing radiograph. They observed that talocalcaneal narrowing correlated most with talonavicular coverage, with cutoff value of 41.2 degrees. Andres et al conducted a comparative study to identify whether there is an association between WBCT-based measurements and MRI findings [42]. They found that MRI findings overestimate the presence of bony sinus tarsi impingement in approximately 42% of included population and concluded that WBCT would be a better diagnostic option to detect bony impingement in PCFD.
B. At this point, the narrowest distance between the inferior border and the calcaneal floor is measured in the selected coronal slice (Asterisk).
Lastly, Kim et al suggested that talar malrotation in the axial plane should be considered an underlying feature of abduction deformity in PCFD [43]. They detected that the talus was significantly more internally rotated in reference to the lateral malleolus and the ankle transmalleolar axis and the lateral malleolus in PCFD patients compared to controls (Figure 9). Moreover, the severe abduction group (talonavicular coverage angle (TNC) > 40 degrees) showed more internal rotation compared with moderated abduction group (TNC 20 to 40 degrees). With the use of WBCT, surgeons can take axial components of PCFD into consideration at the time of reconstructive surgery in PCFD.
4.3. Medial Column Instability (Class C)
Forefoot arch angle (FAA) and medial cuneiform-to-floor distance (MCFD) are the measurements used to evaluate medial column instability in PCFD [34]. FFA is determined in the coronal plane by establishing a line from the most plantar aspect of the medial cuneiform to the fifth metatarsal. The angle between this line and the ground is defined as FAA. MCFD is measured in the sagittal plane from the most plantar aspect of the medial cuneiform to the ground plate (Figure 10). de Cessar Netto et al reported that both FAA and MCFD reflect medial column instability with almost perfect reliability [34]. In non-weight-bearing and weight-bearing CT scans, the MCFD measured 29mm and 18mm, respectively, and the FFA measured 13 degrees and 3 degrees, respectively, indicating medial column instability with differences observed under weight-bearing conditions.
4.4. Peritalar Subluxation (Class D)
Peritalar subluxation is known to be a key pathological index in PCFD. It defines the complex 3D distortion that occurs in PCFD and is characterized by subluxation of the hindfoot through the triple joint complex [44]. The percentage of middle facet subluxation (MFS) and incongruence angle are considered validated markers for peritalar subluxation measured in WBCT [44]. Assessed at the midpoint of the subtalar joint middle facet in the sagittal plane, uncoverage of the middle facet on a coronal plane image is measured. Then, the percentage of MFS is measured by dividing the uncoverage of the middle facet by the width of the talar middle facet. The incongruence angle is the angle between both articular surfaces at the midpoint of the middle facet of the subtalar joint (Figure 11). De Cesar Netto et al reported that incongruence angle of > 8.4° and MFS percentage of >17.9° were found to be highly diagnostic for symptomatic stage-II adult acquired foot deformity [44]. Authors also compared the amount of subluxation of middle and posterior facet of the subtalar joint to identify the superior marker to detect early peritalar subluxation [45]. They reported significantly pronounced subluxation of the middle facet than that of posterior facet by an average of 17.7%, which implies that MFS may present an earlier and more significant sign of progressive peritalar subluxation.
Subfibular impingement is also one of the findings characterizing peritalar subluxation in PCFD. To address this, Jeng et al devised a calcaneofibular distance measured on the WBCT coronal view (Figure 12) [46]. The calcaneofibular distance is defined as the closest distance between lateral aspect of the posterior facet of the calcaneus, which is the most reproducible point to measure from the calcaneus lateral wall, and the fibula. Using this method, Kim et al observed that subfibular impingement detected on the WBCT correlated best with HMA in the weight bearing radiograph [41]. They also added that HMA cutoff values of 25.4mm and 38.1mm would be useful for ruling out and diagnosing calcaneofibular impingement, respectively.
4.5. Valgus Tilting (Class E)
Myerson et al described ankle valgus deformity as a continuum of posterior tibial tendon dysfunction (PTTD) and classified this condition as the final stage of PTTD, known as stage IV [47]. However, ankle valgus is caused by the rupture of the deltoid ligament rather than being a continuation of PTTD, and can be considered an independent feature of PCFD [48]. As a result, in a new classification, ankle valgus is described as Class E, one of the five independent features of PCFD.
Mansur et al conducted a study to see if traditional hallmarks of peritalar subluxation could be adopted in patients with class E deformity in PCFD [49]. They detected paradoxical reduction of peritalar subluxation despite underlying peritalar ligamentous incompetence. Authors interpreted that the deformity fulcrum would be changed proximally in class E. They recommended using FAO as an imaging parameter in class E and concluded that FAO greater than 12.14% is a strong predictor of ankle valgus deformity in PCFD.
4.6. Transverse Arch Collapse
In addition to the collapse of the medial longitudinal arch, Schmidt et al focused on the transverse arch in PCFD [50]. They defined the transverse arch plantar (TAP) angle to evaluate the angle formed between the first, second, and fifth metatarsals in the coronal plane, which was significantly higher in PCFD. Furthermore, the authors measured the distance between the bones composing the transverse arch and a line connecting the most inferior aspect of medial cuneiform and the fifth metatarsal. Location of collapse along the transverse arch was most prominent at the second metatarsal and medial cuneiform (Figure 13). In this way, WBCT proves to be useful with regards to converting multiple points on the coronal plane into lines within a single plane and assessing the angles formed by these lines to determine the amount of transverse arch collapse. Besides, it allows for the identification of the location of arch collapse in specific planes that may be obscured by bone superimposition in conventional radiographs.
4.7. Distance Mapping in PCFD
Distance mapping is a recently validated technology to quantify and compare joint surface interaction by postprocessing the WBCT data [51]. It visualizes the joint surface distance distribution through a color-coded map and enables identification of relative positions between joint surfaces three-dimensionally. Since PCFD is characterized with abnormal subluxation and impingement of bones around multiple joints within the foot, distance mapping is being widely used to objectively quantify the amount of deformity [51]. Furthermore, the concept of coverage mapping has been suggested by Dibbern et al to better highlight areas of proper joint interaction, joint subluxation, and impingement [51]. This method distinguishes articular coverage, bony impingement, periarticular interaction, and the shadow of the talus using distinct colors, which would enhance interpretability and clinical utility of distance mapping in PCFD. Using coverage mapping, authors reported decreased articular coverage in articular regions and increased impingement in nonarticular regions in patients with PCFD [52]. In detail, they found significantly increased uncoverage in the middle facet, not in the anterior or posterior facets, and significantly increased sinus tarsi coverage along with impingement. In a subsequent study, authors detected significantly decreased articular coverage of the anterior aspect of the ankle gutters and talar dome in PCFD patients, which is consistent with early plantarflexion of the talus within the ankle mortise. Through the advanced techniques processing WBCT data, clinicians are now able to achieve a more objective understanding of the complex three-dimensional deformities in PCFD.
5. Conclusions
The implementation of WBCT for pathologies of the foot has made significant strides in diagnostic accuracy, particularly in assessing complex three-dimensional deformities and instabilities. Future directions should focus on the further integration of WBCT with AI technologies to enhance diagnostic automation and accuracy. Moreover, exploring its use in surgical planning and postoperative evaluations could revolutionize patient outcomes by providing a more comprehensive understanding of complex deformities of the foot. We believe that WBCT is poised to become the gold standard in foot and ankle imaging, leading to improved clinical outcomes and more personalized treatment approaches.
Funding
This work was supported by the National Research Foundation of Korea (NRF) grant funded by the Korean government (MSIT) (No. 2021R1C1C1013218).
Acknowledgments
All the figures included in this paper are made with WBCT data and images acquired from our institution and informed consent was obtained from all individuals included in this study.
Conflicts of Interest
The authors declare no conflict of interest.
References
- Reddy:, S.; Bernasconi, A.; Netto, C.C.; Ellis, S.; Lintz, F.; Richter, M.M. Use of Weightbearing CT Imaging in Clinical Practice. Foot Ankle Spec 2024, 19386400241238608. [Google Scholar] [CrossRef]
- Kim, J.; Kim, J.; Kim, S.; Yi, Y. Weight-Bearing CT for Diseases around the Ankle Joint. Diagnostics (Basel) 2024, 14. [Google Scholar] [CrossRef] [PubMed]
- Collan, L.; Kankare, J.A.; Mattila, K. The biomechanics of the first metatarsal bone in hallux valgus: a preliminary study utilizing a weight bearing extremity CT. Foot Ankle Surg 2013, 19, 155–161. [Google Scholar] [CrossRef] [PubMed]
- Lalevée, M.; Barbachan Mansur, N.S.; Lee, H.Y.; Maly, C.J.; Iehl, C.J.; Nery, C.; Lintz, F.; de Cesar Netto, C. Distal Metatarsal Articular Angle in Hallux Valgus Deformity. Fact or Fiction? A 3-Dimensional Weightbearing CT Assessment. Foot Ankle Int 2022, 43, 495–503. [Google Scholar] [CrossRef] [PubMed]
- Zhong, Z.; Zhang, P.; Duan, H.; Yang, H.; Li, Q.; He, F. A Comparison Between X-ray Imaging and an Innovative Computer-aided Design Method Based on Weightbearing CT Scan Images for Assessing Hallux Valgus. J Foot Ankle Surg 2021, 60, 6–10. [Google Scholar] [CrossRef]
- de Carvalho, K.A.M.; Walt, J.S.; Ehret, A.; Tazegul, T.E.; Dibbern, K.; Mansur, N.S.B.; Lalevée, M.; de Cesar Netto, C. Comparison between Weightbearing-CT semiautomatic and manual measurements in Hallux Valgus. Foot Ankle Surg 2022, 28, 518–525. [Google Scholar] [CrossRef]
- Day, J.; de Cesar Netto, C.; Richter, M.; Mansur, N.S.; Fernando, C.; Deland, J.T.; Ellis, S.J.; Lintz, F. Evaluation of a Weightbearing CT Artificial Intelligence-Based Automatic Measurement for the M1-M2 Intermetatarsal Angle in Hallux Valgus. Foot Ankle Int 2021, 42, 1502–1509. [Google Scholar] [CrossRef]
- Wagner, E.; Wagner, P. Metatarsal Pronation in Hallux Valgus Deformity: A Review. J Am Acad Orthop Surg Glob Res Rev 2020, 4. [Google Scholar] [CrossRef]
- Wynes, J.; Lamm, B.M.; Andrade, B.J.; Malay, D.S. Preoperative Planning and Intraoperative Technique for Accurate Translation of a Distal First Metatarsal Osteotomy. J Foot Ankle Surg 2016, 55, 49–54. [Google Scholar] [CrossRef]
- Najefi, A.A.; Malhotra, K.; Patel, S.; Cullen, N.; Welck, M. Assessing the Rotation of the First Metatarsal on Computed Tomography Scans: A Systematic Literature Review. Foot Ankle Int 2022, 43, 66–76. [Google Scholar] [CrossRef]
- Kim, Y.; Kim, J.S.; Young, K.W.; Naraghi, R.; Cho, H.K.; Lee, S.Y. A New Measure of Tibial Sesamoid Position in Hallux Valgus in Relation to the Coronal Rotation of the First Metatarsal in CT Scans. Foot Ankle Int 2015, 36, 944–952. [Google Scholar] [CrossRef] [PubMed]
- Campbell, B.; Miller, M.C.; Williams, L.; Conti, S.F. Pilot Study of a 3-Dimensional Method for Analysis of Pronation of the First Metatarsal of Hallux Valgus Patients. Foot Ankle Int 2018, 39, 1449–1456. [Google Scholar] [CrossRef] [PubMed]
- Mansur, N.S.B.; Lalevee, M.; Schmidt, E.; Dibbern, K.; Wagner, P.; Wagner, E.; de Souza Nery, C.A.; de Cesar Netto, C. Correlation between indirect radiographic parameters of first metatarsal rotation in hallux valgus and values on weight-bearing computed tomography. Int Orthop 2021, 45, 3111–3118. [Google Scholar] [CrossRef] [PubMed]
- Conti, M.S.; Patel, T.J.; Zhu, J.; Elliott, A.J.; Conti, S.F.; Ellis, S.J. Association of First Metatarsal Pronation Correction With Patient-Reported Outcomes and Recurrence Rates in Hallux Valgus. Foot Ankle Int 2022, 43, 309–320. [Google Scholar] [CrossRef]
- Choi, Y.H.; Kim, J.S.; Ahn, J.H.; Kim, G.J.; Jeong, H.; Kim, Y.C. Preoperative increased pronation angle of the first metatarsus associated with correction loss after hallux valgus surgery: A semi-weight-bearing computed tomography study. Foot Ankle Surg 2024. [Google Scholar] [CrossRef]
- Faber, F.W.; Kleinrensink, G.J.; Verhoog, M.W.; Vijn, A.H.; Snijders, C.J.; Mulder, P.G.; Verhaar, J.A. Mobility of the first tarsometatarsal joint in relation to hallux valgus deformity: anatomical and biomechanical aspects. Foot Ankle Int 1999, 20, 651–656. [Google Scholar] [CrossRef]
- Kimura, T.; Kubota, M.; Taguchi, T.; Suzuki, N.; Hattori, A.; Marumo, K. Evaluation of First-Ray Mobility in Patients with Hallux Valgus Using Weight-Bearing CT and a 3-D Analysis System: A Comparison with Normal Feet. J Bone Joint Surg Am 2017, 99, 247–255. [Google Scholar] [CrossRef]
- Dietze, A.; Bahlke, U.; Martin, H.; Mittlmeier, T. First ray instability in hallux valgus deformity: a radiokinematic and pedobarographic analysis. Foot Ankle Int 2013, 34, 124–130. [Google Scholar] [CrossRef]
- Kimura, T.; Kubota, M.; Suzuki, N.; Hattori, A.; Marumo, K. Comparison of Intercuneiform 1-2 Joint Mobility Between Hallux Valgus and Normal Feet Using Weightbearing Computed Tomography and 3-Dimensional Analysis. Foot Ankle Int 2018, 39, 355–360. [Google Scholar] [CrossRef]
- Lee, H.Y.; Lalevee, M.; Mansur, N.S.B.; Vandelune, C.A.; Dibbern, K.N.; Barg, A.; Femino, J.E.; de Cesar Netto, C. Multiplanar instability of the first tarsometatarsal joint in hallux valgus and hallux rigidus patients: a case-control study. Int Orthop 2022, 46, 255–263. [Google Scholar] [CrossRef]
- Benirschke, S.K.; Meinberg, E.; Anderson, S.A.; Jones, C.B.; Cole, P.A. Fractures and dislocations of the midfoot: Lisfranc and Chopart injuries. J Bone Joint Surg Am 2012, 94, 1325–1337. [Google Scholar] [CrossRef] [PubMed]
- Anderson, R.B.; Hunt, K.J.; McCormick, J.J. Management of common sports-related injuries about the foot and ankle. J Am Acad Orthop Surg 2010, 18, 546–556. [Google Scholar] [CrossRef] [PubMed]
- Porter, D.A.; Barnes, A.F.; Rund, A.; Walrod, M.T. Injury Pattern in Ligamentous Lisfranc Injuries in Competitive Athletes. Foot Ankle Int 2019, 40, 185–194. [Google Scholar] [CrossRef] [PubMed]
- Essa, A.; Levi, A.; Ron, T.G.; Ner, E.B.; Finestone, A.S.; Tamir, E. The role of three dimension computed tomography in Lisfranc injury diagnosis. Injury 2022, 53, 3530–3534. [Google Scholar] [CrossRef]
- Tamir, E.; Essa, A.; Levi, A.; Beit Ner, E.; Kachko, E.; Finestone, A.S. Lisfranc Injury Diagnosis: What Is the Diagnostic Reliability of New Radiographic Signs Using Three-dimensional CT? Clin Orthop Relat Res 2023, 481, 2271–2278. [Google Scholar] [CrossRef]
- Sripanich, Y.; Weinberg, M.; Krähenbühl, N.; Rungprai, C.; Saltzman, C.L.; Barg, A. Change in the First Cuneiform-Second Metatarsal Distance After Simulated Ligamentous Lisfranc Injury Evaluated by Weightbearing CT Scans. Foot Ankle Int 2020, 41, 1432–1441. [Google Scholar] [CrossRef]
- Sripanich, Y.; Weinberg, M.W.; Krähenbühl, N.; Rungprai, C.; Saltzman, C.L.; Barg, A. Reliability of measurements assessing the Lisfranc joint using weightbearing computed tomography imaging. Arch Orthop Trauma Surg 2021, 141, 775–781. [Google Scholar] [CrossRef]
- Bhimani, R.; Sornsakrin, P.; Ashkani-Esfahani, S.; Lubberts, B.; Guss, D.; De Cesar Netto, C.; Waryasz, G.R.; Kerkhoffs, G.; DiGiovanni, C.W. Using area and volume measurement via weightbearing CT to detect Lisfranc instability. J Orthop Res 2021, 39, 2497–2505. [Google Scholar] [CrossRef]
- Walter, W.R.; Hirschmann, A.; Tafur, M.; Rosenberg, Z.S. Imaging of Chopart (Midtarsal) Joint Complex: Normal Anatomy and Posttraumatic Findings. AJR Am J Roentgenol 2018, 211, 416–425. [Google Scholar] [CrossRef]
- Steadman, J.; Sripanich, Y.; Rungprai, C.; Mills, M.K.; Saltzman, C.L.; Barg, A. Comparative assessment of midfoot osteoarthritis diagnostic sensitivity using weightbearing computed tomography vs weightbearing plain radiography. Eur J Radiol 2021, 134, 109419. [Google Scholar] [CrossRef]
- Kim, K.C.; Schmidt, E.; de Carvalho, K.A.M.; Lalevee, M.; Mansur, N.; Dibbern, K.; Auch, E.; Behrens, A.; Netto, C.C. Prevalence of midfoot arthritis and lesser toe deformities. Foot Ankle Surg 2024, 30, 423–431. [Google Scholar] [CrossRef] [PubMed]
- Kim, K.C.; Schmidt, E.; de Carvalho, K.A.M.; Lalevee, M.; Mansur, N.; Dibbern, K.; Auch, E.; Jasper, R.; Netto, C.C. Risk Factors for Midfoot Arthritis Associated With Medical History by Weight Bearing Computed Tomography. J Foot Ankle Surg 2024, 63, 532–536. [Google Scholar] [CrossRef] [PubMed]
- Myerson, M.S.; Thordarson, D.B.; Johnson, J.E.; Hintermann, B.; Sangeorzan, B.J.; Deland, J.T.; Schon, L.C.; Ellis, S.J.; de Cesar Netto, C. Classification and Nomenclature: Progressive Collapsing Foot Deformity. Foot Ankle Int 2020, 41, 1271–1276. [Google Scholar] [CrossRef] [PubMed]
- de Cesar Netto, C.; Schon, L.C.; Thawait, G.K.; da Fonseca, L.F.; Chinanuvathana, A.; Zbijewski, W.B.; Siewerdsen, J.H.; Demehri, S. Flexible Adult Acquired Flatfoot Deformity: Comparison Between Weight-Bearing and Non-Weight-Bearing Measurements Using Cone-Beam Computed Tomography. J Bone Joint Surg Am 2017, 99, e98. [Google Scholar] [CrossRef] [PubMed]
- de Cesar Netto, C.; Shakoor, D.; Roberts, L.; Chinanuvathana, A.; Mousavian, A.; Lintz, F.; Schon, L.C.; Demehri, S. Hindfoot alignment of adult acquired flatfoot deformity: A comparison of clinical assessment and weightbearing cone beam CT examinations. Foot Ankle Surg 2019, 25, 790–797. [Google Scholar] [CrossRef]
- Lôbo, C.F.T.; Pires, E.A.; Bordalo-Rodrigues, M.; de Cesar Netto, C.; Godoy-Santos, A.L. Imaging of progressive collapsing foot deformity with emphasis on the role of weightbearing cone beam CT. Skeletal Radiol 2022, 51, 1127–1141. [Google Scholar] [CrossRef]
- Lintz, F.; Welck, M.; Bernasconi, A.; Thornton, J.; Cullen, N.P.; Singh, D.; Goldberg, A. 3D Biometrics for Hindfoot Alignment Using Weightbearing CT. Foot Ankle Int 2017, 38, 684–689. [Google Scholar] [CrossRef]
- Lintz, F.; Bernasconi, A.; Li, S.; Lalevée, M.; Fernando, C.; Barg, A.; Dibbern, K.; de Cesar Netto, C. Diagnostic accuracy of measurements in progressive collapsing foot deformity using weight bearing computed tomography: A matched case-control study. Foot Ankle Surg 2022, 28, 912–918. [Google Scholar] [CrossRef]
- Day, J.; de Cesar Netto, C.; Nishikawa, D.R.C.; Garfinkel, J.; Roney, A.; M, J.O.M.; J, T.D.; S, J.E. Three-Dimensional Biometric Weightbearing CT Evaluation of the Operative Treatment of Adult-Acquired Flatfoot Deformity. Foot Ankle Int 2020, 41, 930–936. [Google Scholar] [CrossRef]
- Malicky, E.S.; Crary, J.L.; Houghton, M.J.; Agel, J.; Hansen, S.T., Jr.; Sangeorzan, B.J. Talocalcaneal and subfibular impingement in symptomatic flatfoot in adults. J Bone Joint Surg Am 2002, 84, 2005–2009. [Google Scholar] [CrossRef]
- Kim, J.; Rajan, L.; Fuller, R.; Sofka, C.; Cororaton, A.; Demetracopoulos, C.; Ellis, S.; Deland, J. Radiographic Cutoff Values for Predicting Lateral Bony Impingement in Progressive Collapsing Foot Deformity. Foot Ankle Int 2022, 43, 1219–1226. [Google Scholar] [CrossRef] [PubMed]
- Andres, L.; Donners, R.; Harder, D.; Burssens, A.; Nüesch, C.; Krähenbühl, N. Association Between Weightbearing CT and MRI Findings in Progressive Collapsing Foot Deformity. Foot Ankle Int 2024, 45, 526–534. [Google Scholar] [CrossRef] [PubMed]
- Kim, J.; Rajan, L.; Henry, J.; Mizher, R.; Kumar, P.; Srikumar, S.; Demetracopoulos, C.; Ellis, S.; Deland, J. Axial Plane Rotation of the Talus in Progressive Collapsing Foot Deformity: A Weightbearing Computed Tomography Analysis. Foot Ankle Int 2023, 44, 281–290. [Google Scholar] [CrossRef] [PubMed]
- de Cesar Netto, C.; Godoy-Santos, A.L.; Saito, G.H.; Lintz, F.; Siegler, S.; O'Malley, M.J.; Deland, J.T.; Ellis, S.J. Subluxation of the Middle Facet of the Subtalar Joint as a Marker of Peritalar Subluxation in Adult Acquired Flatfoot Deformity: A Case-Control Study. J Bone Joint Surg Am 2019, 101, 1838–1844. [Google Scholar] [CrossRef] [PubMed]
- de Cesar Netto, C.; Silva, T.; Li, S.; Mansur, N.S.; Auch, E.; Dibbern, K.; Femino, J.E.; Baumfeld, D. Assessment of Posterior and Middle Facet Subluxation of the Subtalar Joint in Progressive Flatfoot Deformity. Foot Ankle Int 2020, 41, 1190–1197. [Google Scholar] [CrossRef]
- Jeng, C.L.; Rutherford, T.; Hull, M.G.; Cerrato, R.A.; Campbell, J.T. Assessment of Bony Subfibular Impingement in Flatfoot Patients Using Weight-Bearing CT Scans. Foot Ankle Int 2019, 40, 152–158. [Google Scholar] [CrossRef]
- Myerson, M.S. Adult acquired flatfoot deformity: treatment of dysfunction of the posterior tibial tendon. Instr Course Lect 1997, 46, 393–405. [Google Scholar]
- Deland, J.T.; de Asla, R.J.; Sung, I.H.; Ernberg, L.A.; Potter, H.G. Posterior tibial tendon insufficiency: which ligaments are involved? Foot Ankle Int 2005, 26, 427–435. [Google Scholar] [CrossRef]
- Mansur, N.S.B.; Lalevee, M.; Shamrock, A.; Lintz, F.; de Carvalho, K.A.M.; de Cesar Netto, C. Decreased Peritalar Subluxation in Progressive Collapsing Foot Deformity with Ankle Valgus Tilting. JB JS Open Access 2023, 8. [Google Scholar] [CrossRef]
- Schmidt, E.; Lalevée, M.; Kim, K.C.; Carvalho, K.A.M.; Dibbern, K.; Lintz, F.; Barbachan Mansur, N.S.; de Cesar Netto, C. The Role of the Transverse Arch in Progressive Collapsing Foot Deformity. Foot Ankle Int 2024, 45, 44–51. [Google Scholar] [CrossRef]
- Dibbern, K.N.; Li, S.; Vivtcharenko, V.; Auch, E.; Lintz, F.; Ellis, S.J.; Femino, J.E.; de Cesar Netto, C. Three-Dimensional Distance and Coverage Maps in the Assessment of Peritalar Subluxation in Progressive Collapsing Foot Deformity. Foot Ankle Int 2021, 42, 757–767. [Google Scholar] [CrossRef] [PubMed]
- Dibbern, K.; Vivtcharenko, V.; Salomao Barbachan Mansur, N.; Lalevée, M.; Alencar Mendes de Carvalho, K.; Lintz, F.; Barg, A.; Goldberg, A.J.; de Cesar Netto, C. Distance mapping and volumetric assessment of the ankle and syndesmotic joints in progressive collapsing foot deformity. Sci Rep 2023, 13, 4801. [Google Scholar] [CrossRef] [PubMed]
Figure 1.
Digitally reconstructed radiographs (DRRs) demonstrating foot anteroposterior (A) and hindfoot alignment (B) views.
Figure 1.
Digitally reconstructed radiographs (DRRs) demonstrating foot anteroposterior (A) and hindfoot alignment (B) views.
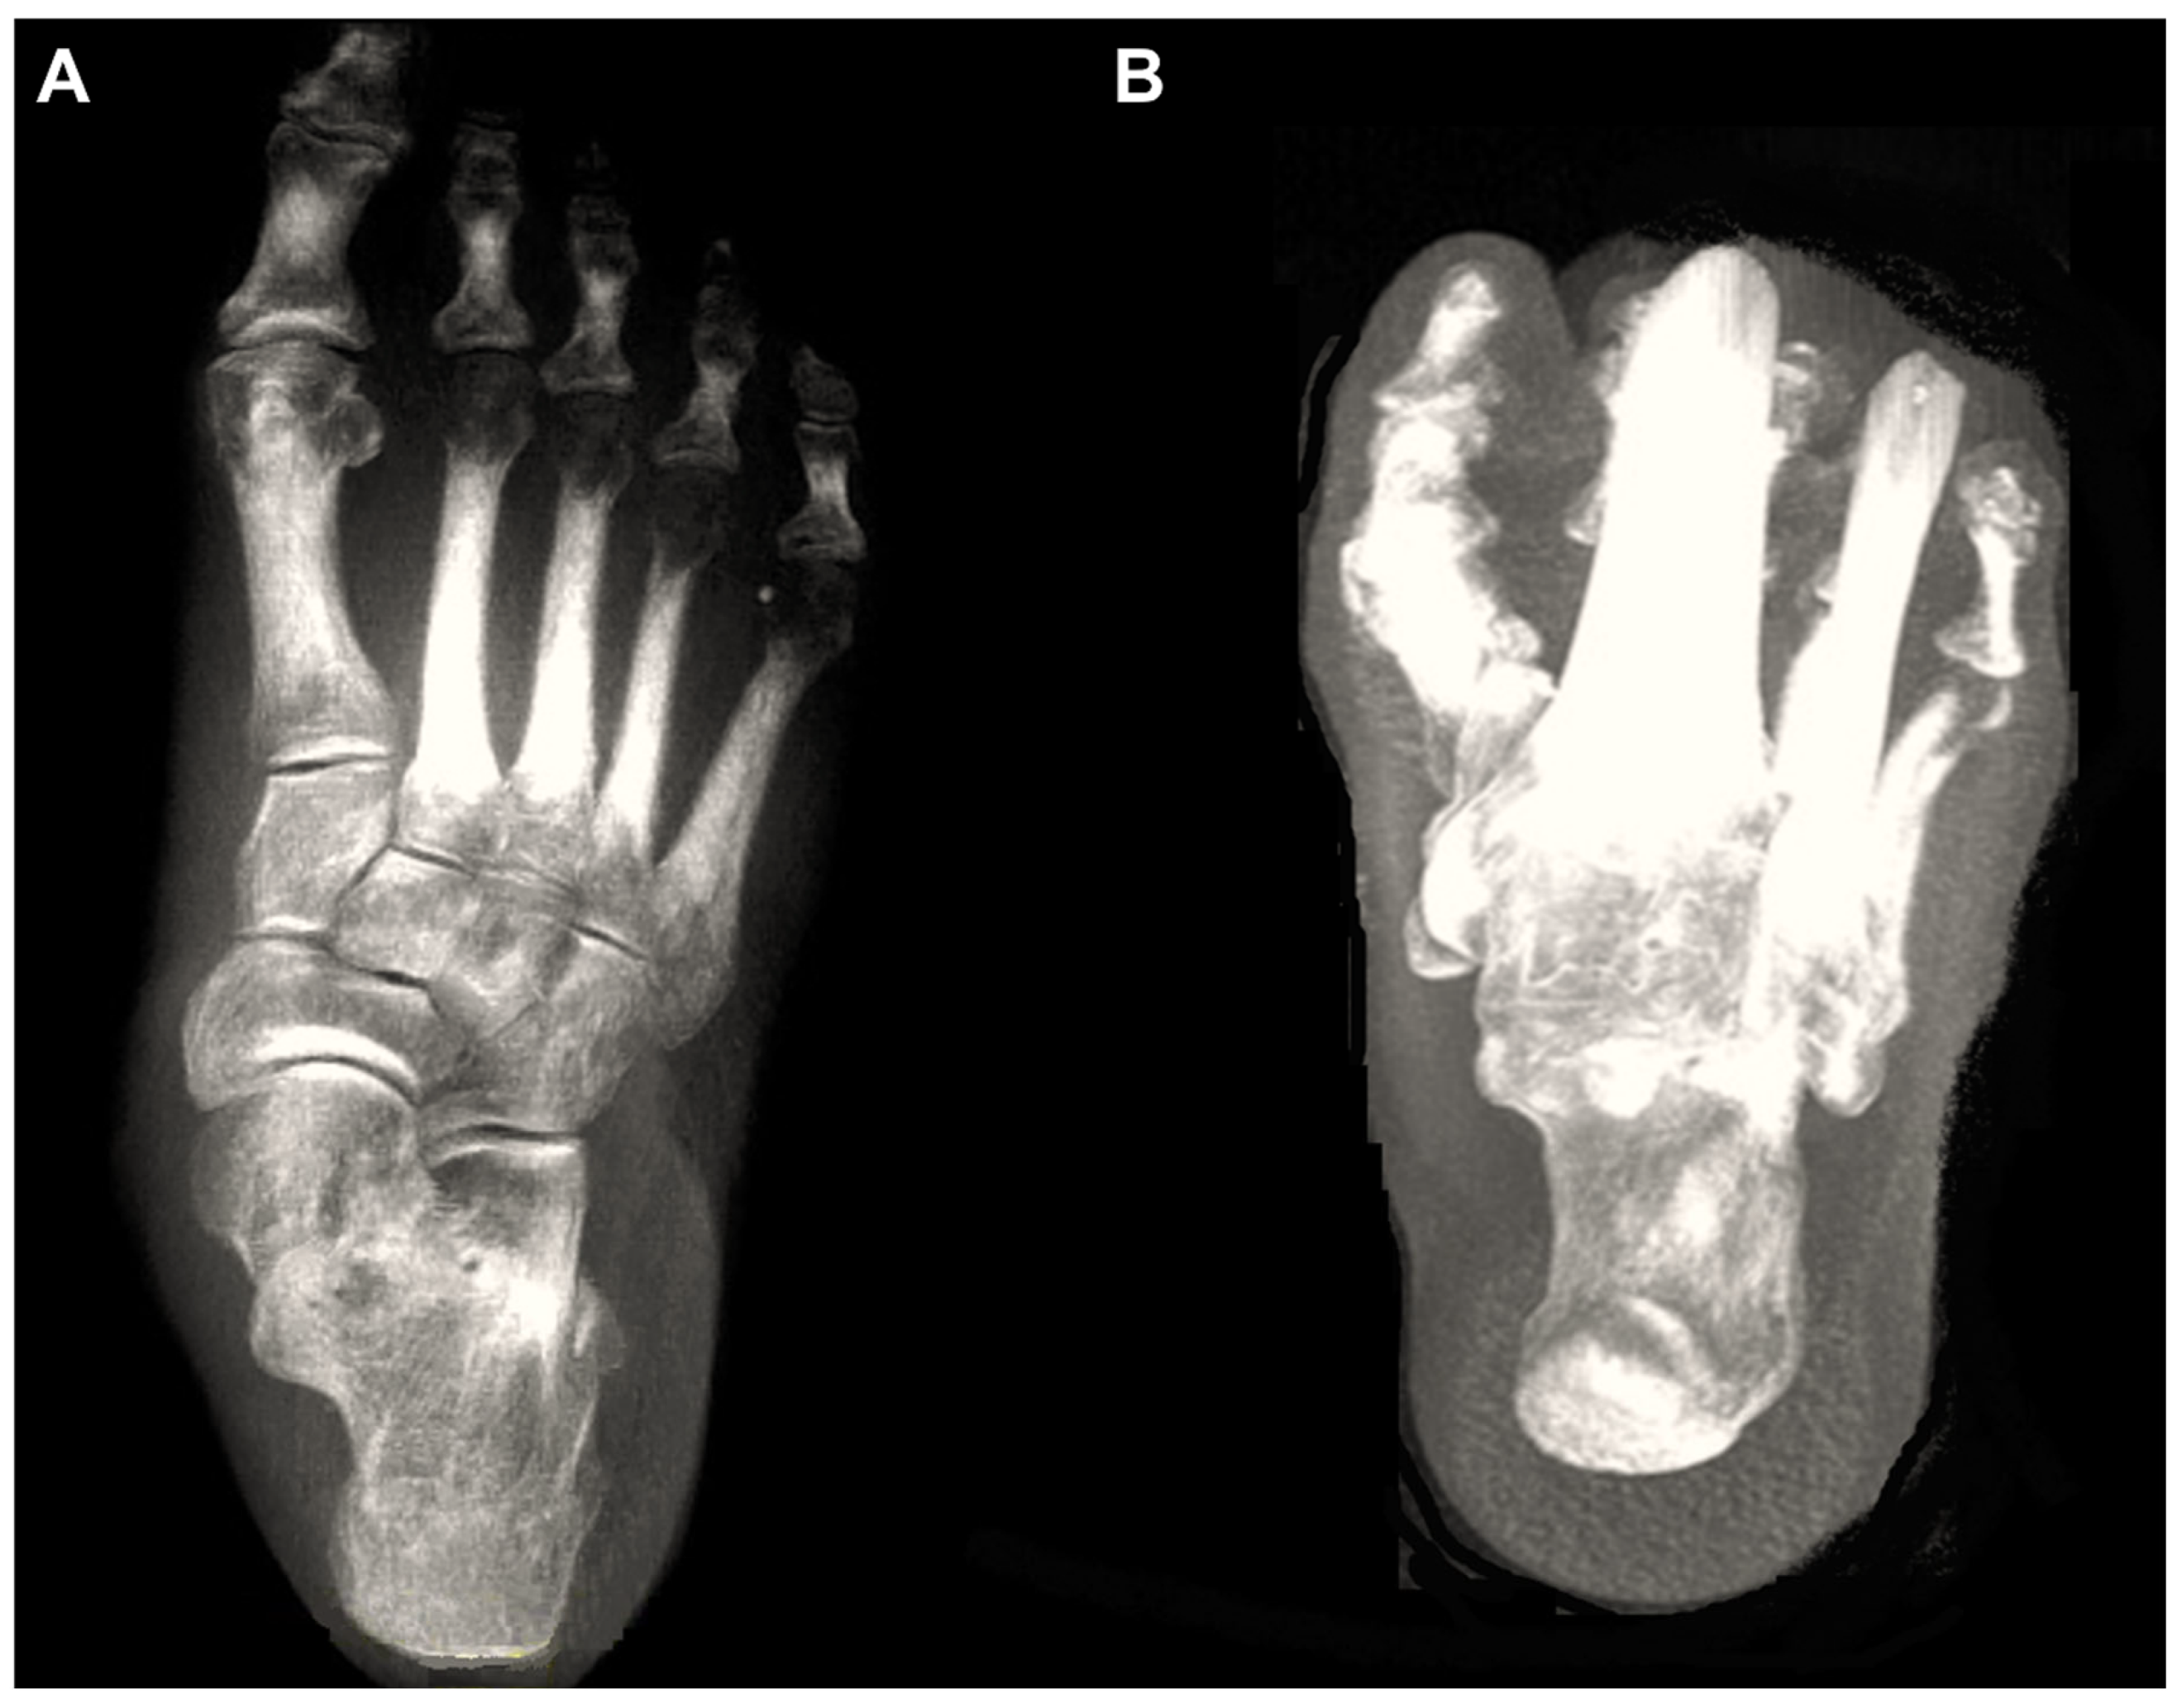
Figure 2.
To obtain the alpha (α) angle, first, an inferior line is drawn between the lateral edge of the lateral sulcus and the medial edge of the medial sulcus (a). Subsequently, a superior line is drawn between the point of the medial and lateral corners of the first metatarsal head (b). Second, bisections of the above 2 lines are connected to a straight line perpendicular to the horizontal ground axis (c). Third, the angle is measured between the straight line (c) and the vertical line perpendicular to the ground axis (d) that is obtained from the first step.
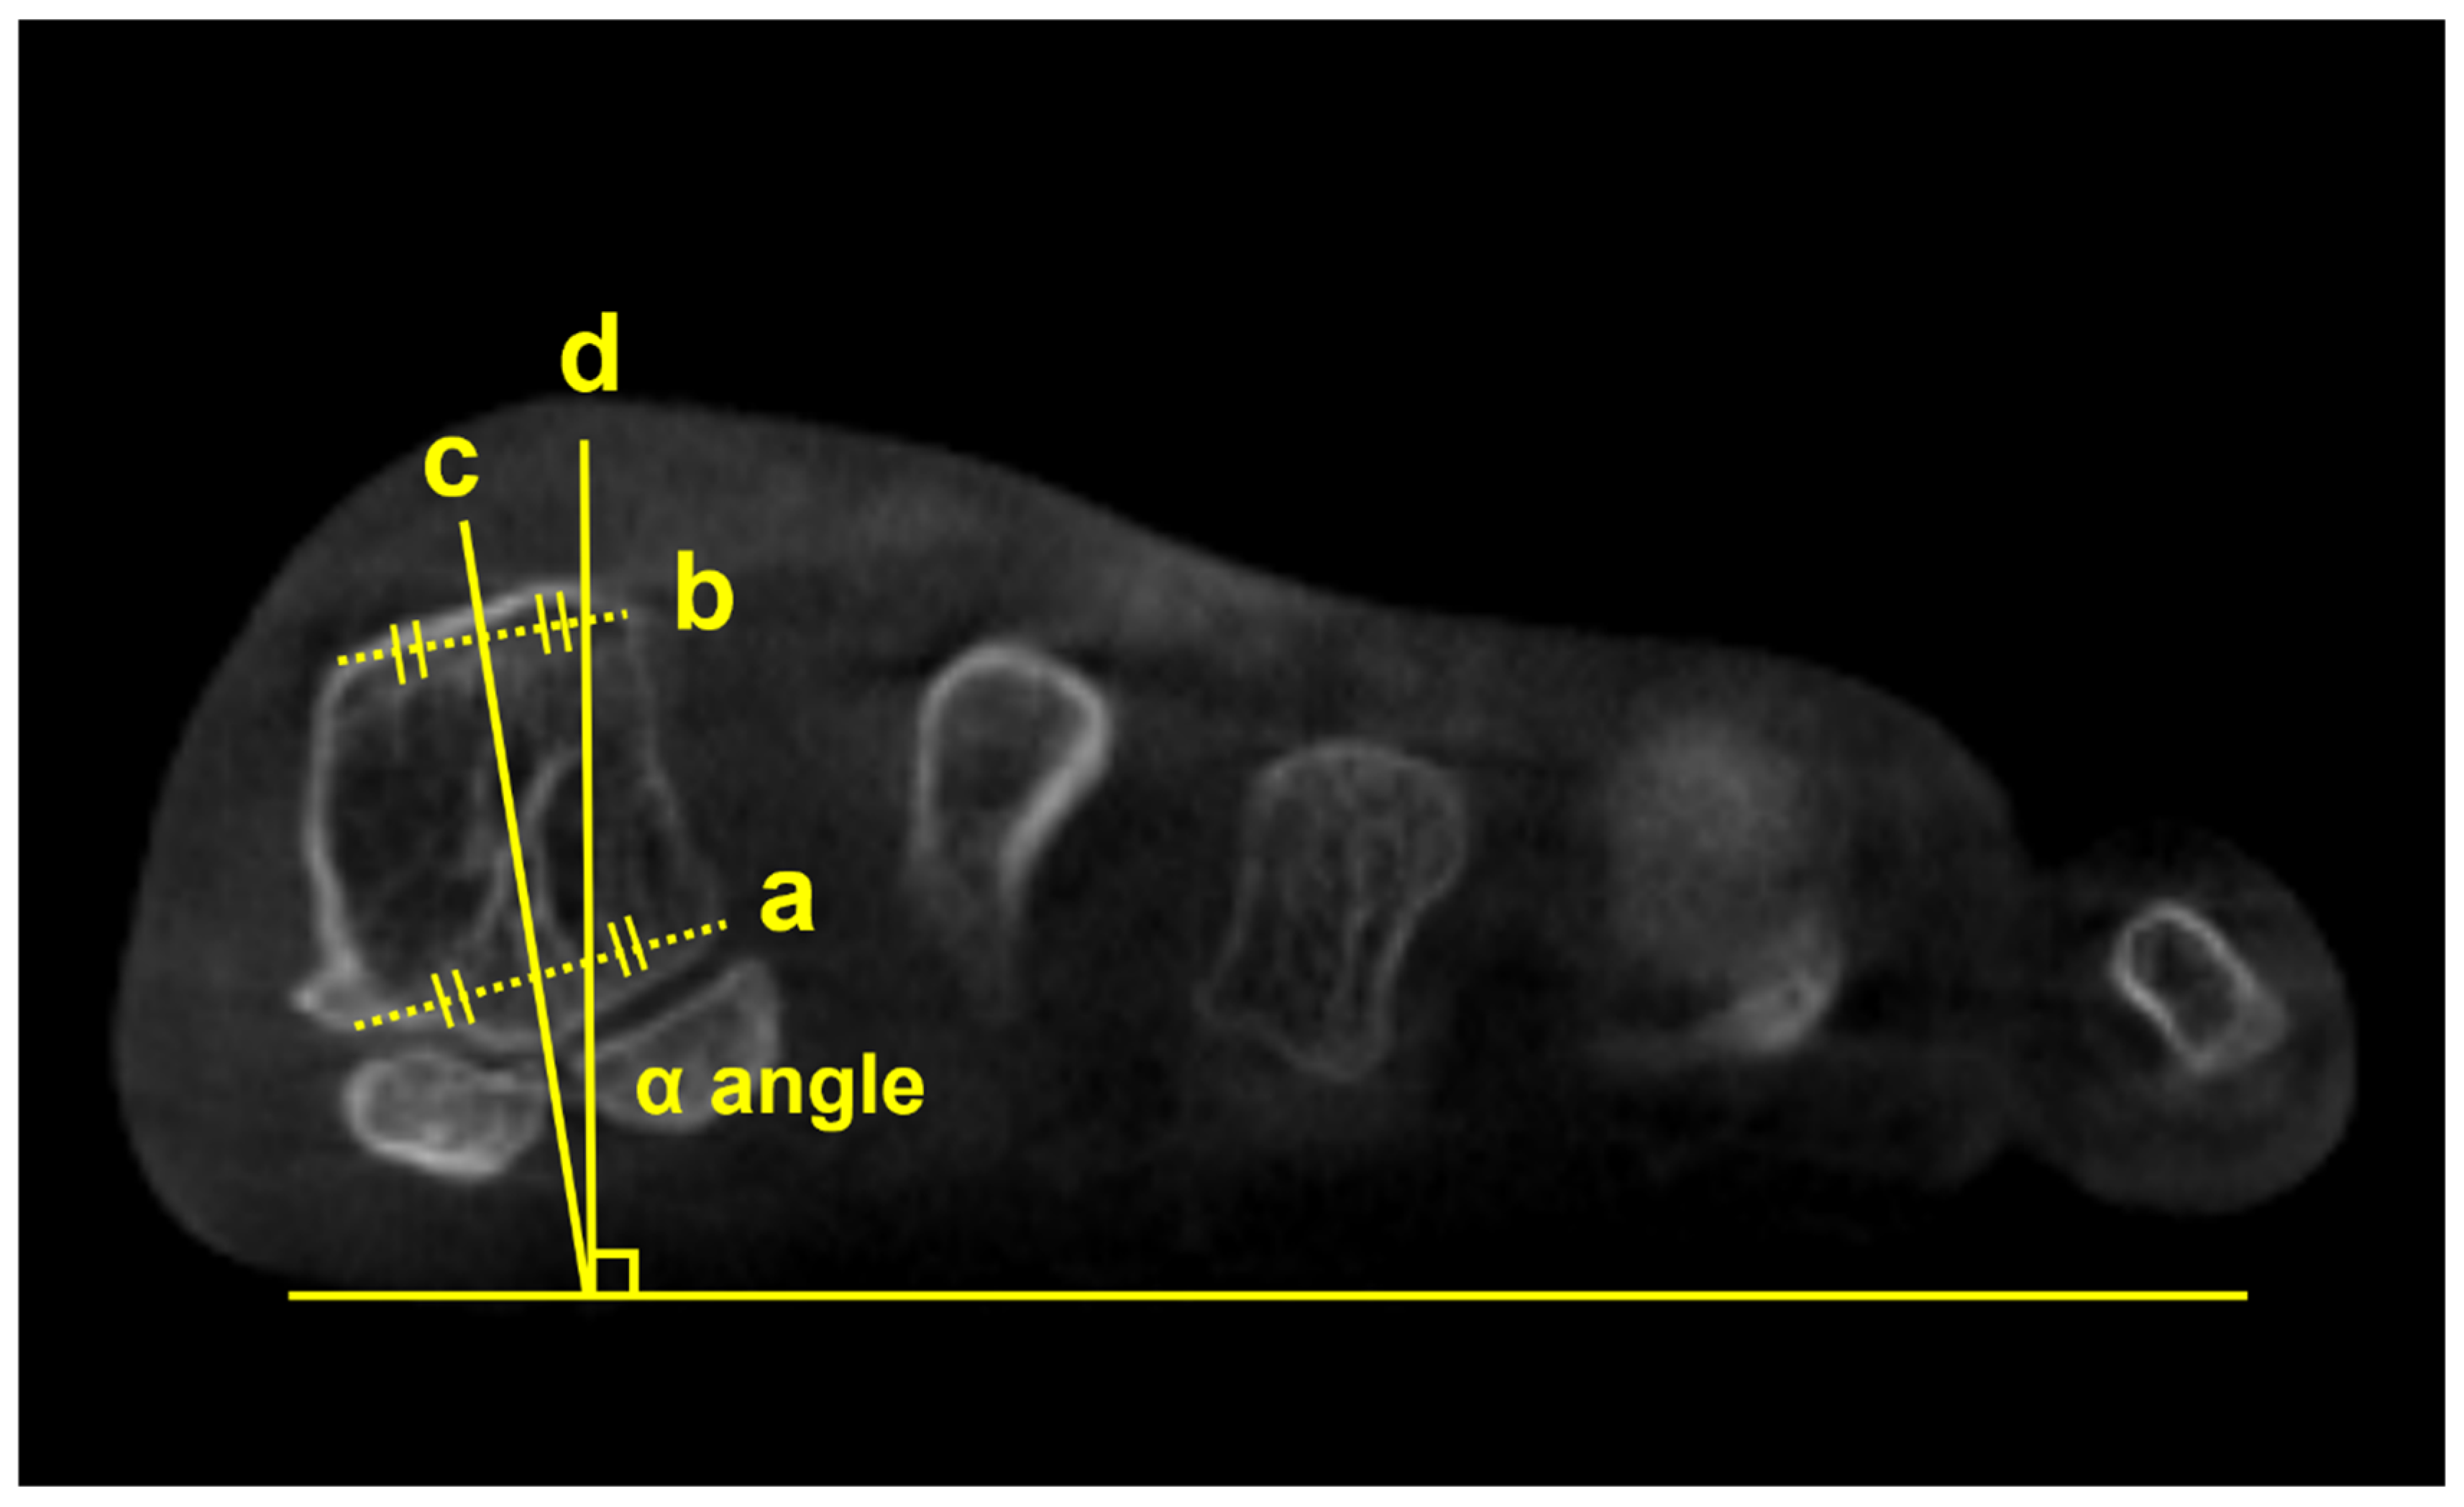
Figure 3.
M1 pronation angle (M1PA) is the angle between the floor (a) and a line drawn from the most inferomedial border of the medial sesamoid facet to the most lateral border of the lateral sesamoid facet (b).
Figure 3.
M1 pronation angle (M1PA) is the angle between the floor (a) and a line drawn from the most inferomedial border of the medial sesamoid facet to the most lateral border of the lateral sesamoid facet (b).
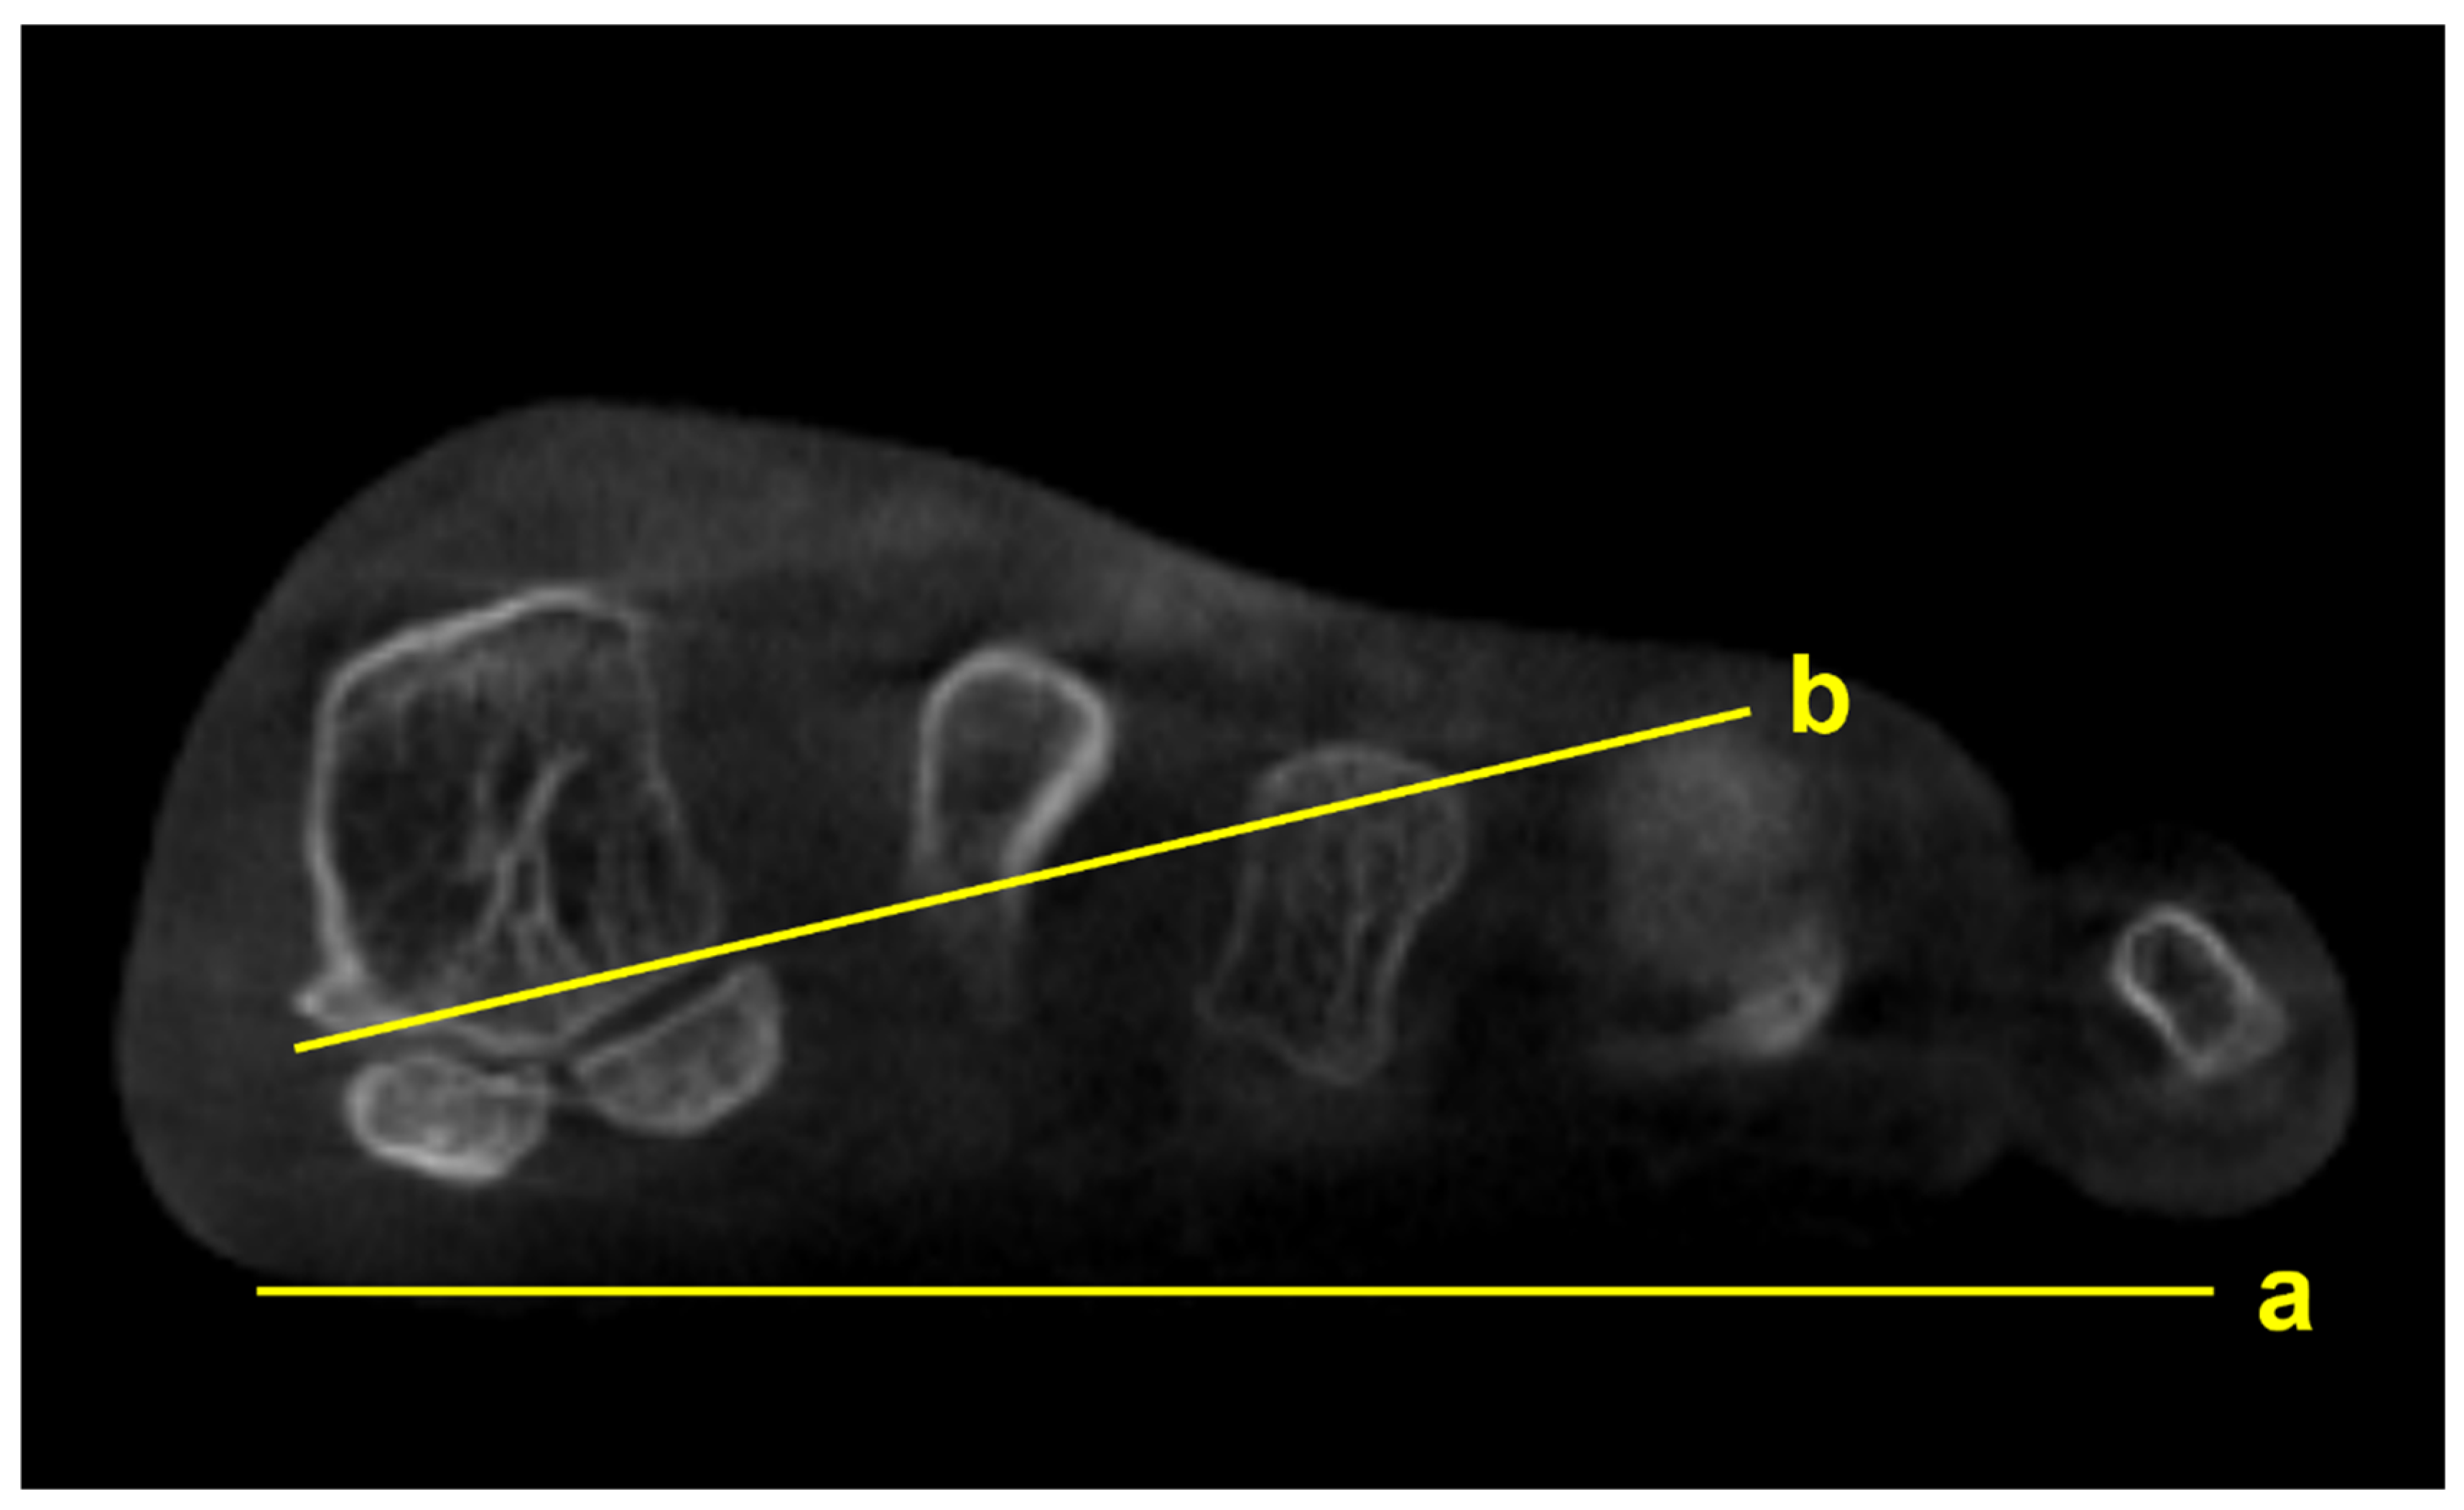
Figure 4.
An illustration depicting 3D components of the first ray hypermobility in hallux valgus.
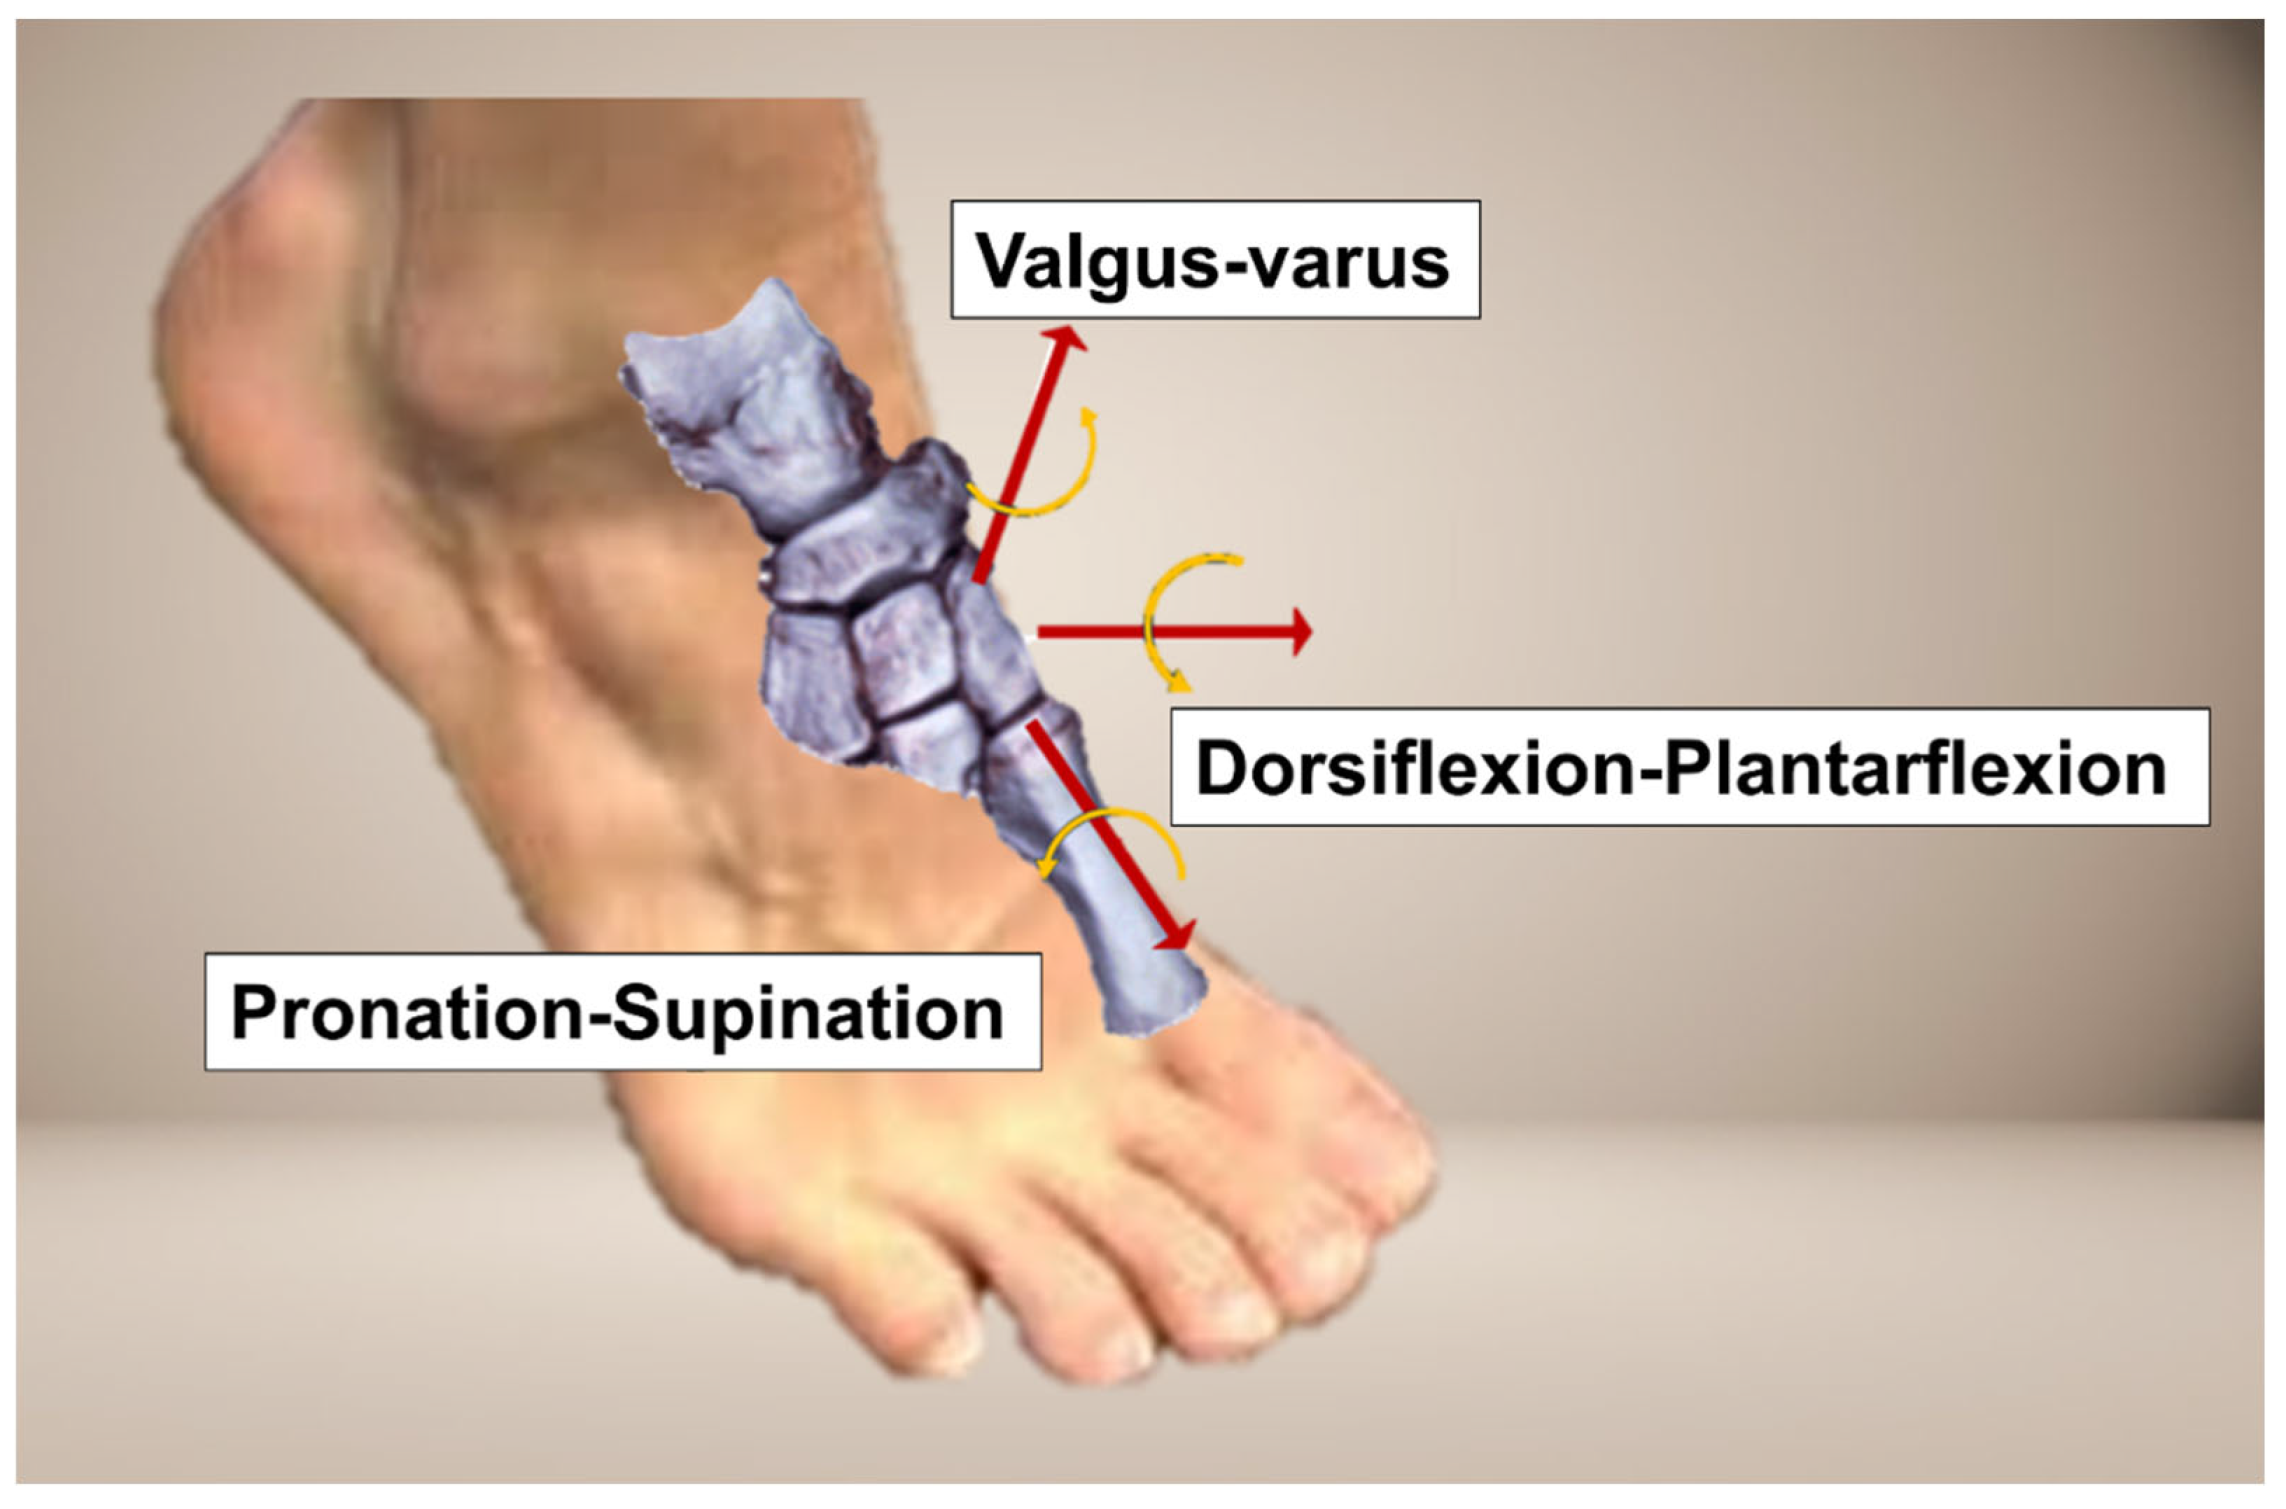
Figure 5.
3D volumetric measurement of the Lisfranc joint.
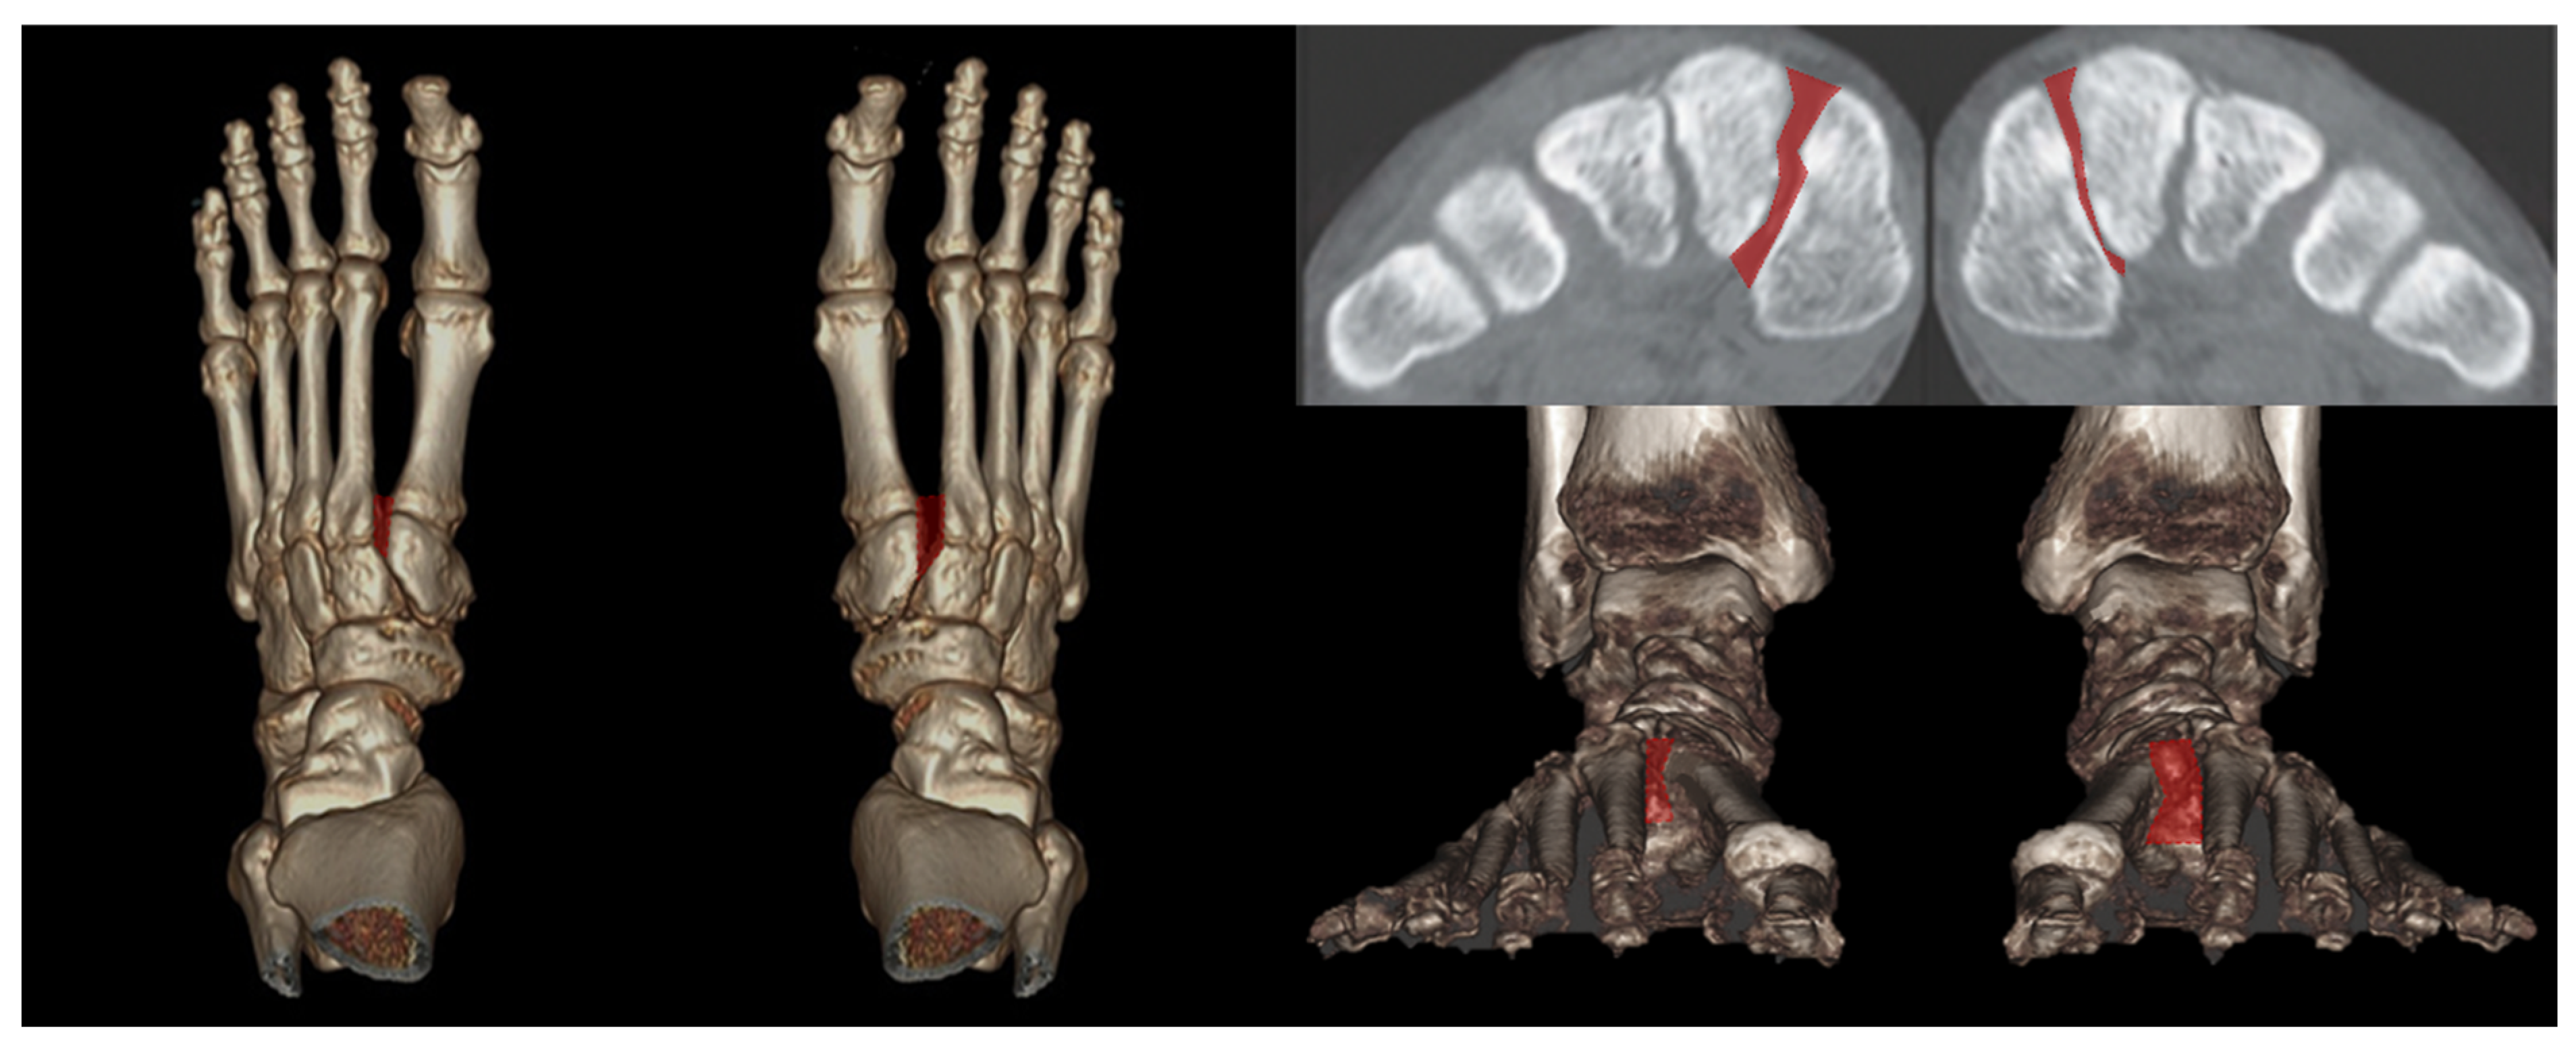
Figure 6.
In the plain radiograph, osteoarthritis of the third tarsometatarsal (TMT) joint is not clearly visible (A); however, weight-bearing computed tomography (WBCT) reveals distinctive joint space narrowing and sclerotic changes (B, C).
Figure 6.
In the plain radiograph, osteoarthritis of the third tarsometatarsal (TMT) joint is not clearly visible (A); however, weight-bearing computed tomography (WBCT) reveals distinctive joint space narrowing and sclerotic changes (B, C).
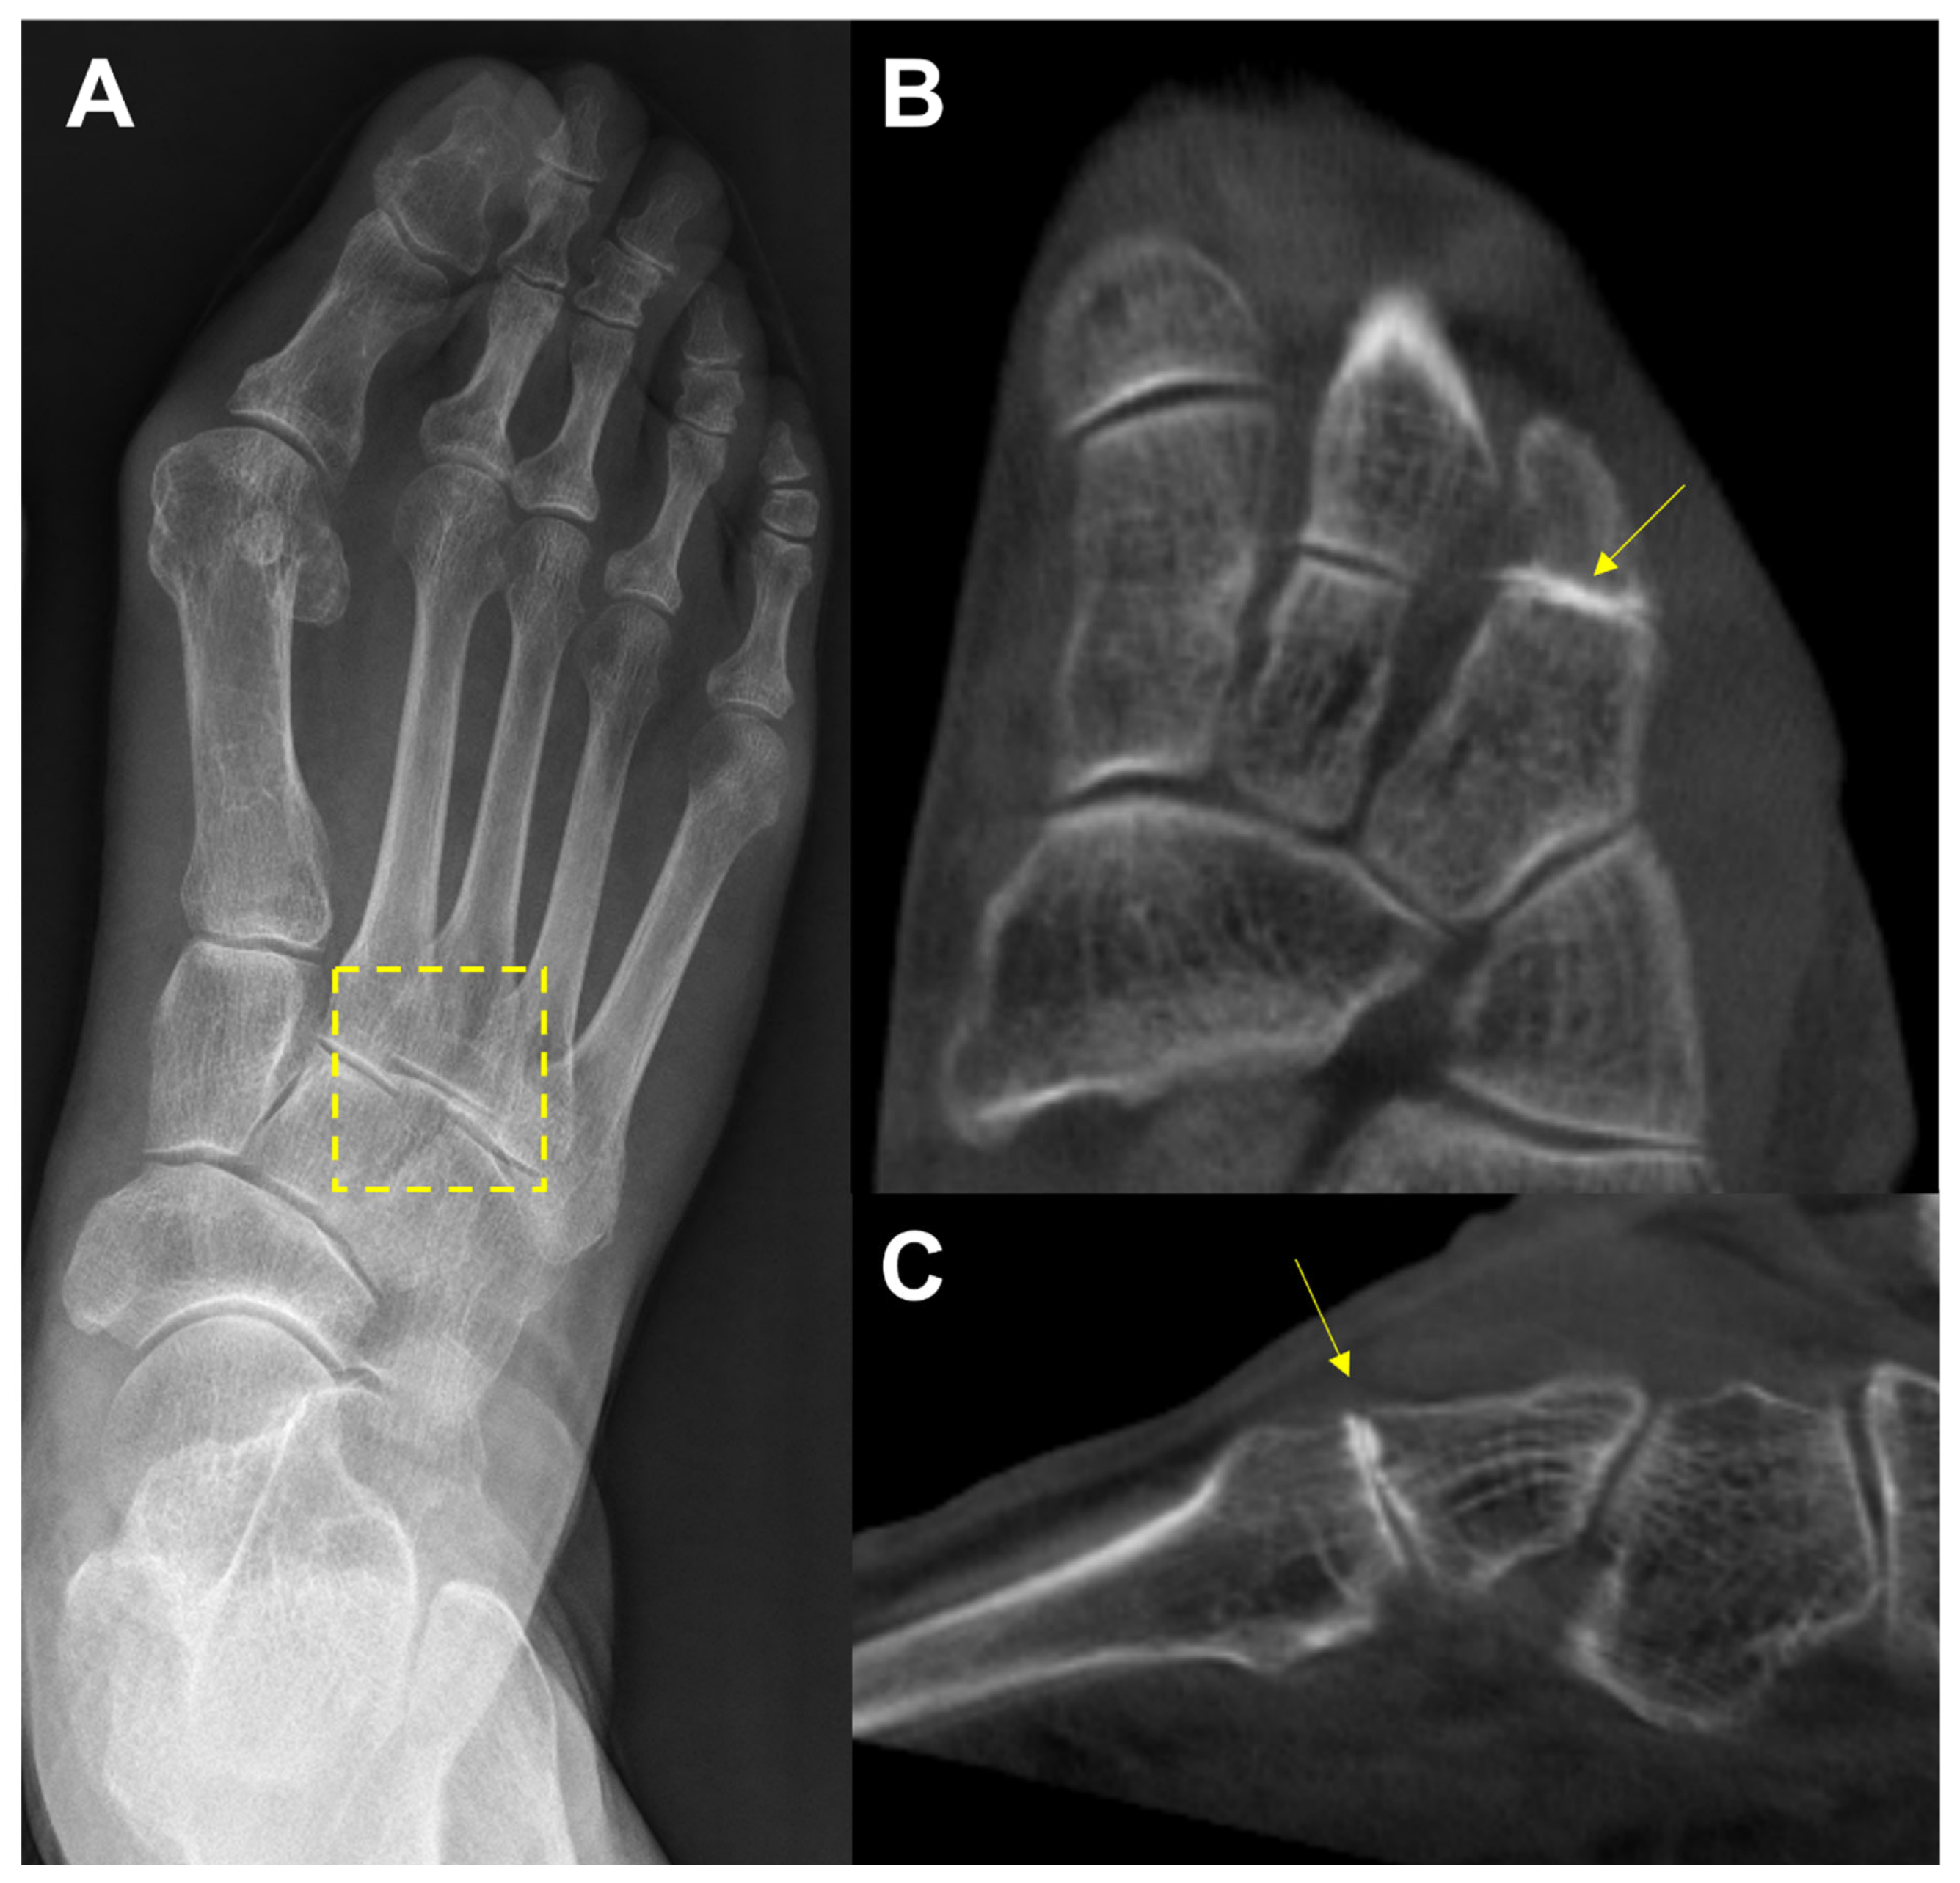
Figure 7.
Foot-ankle offset (FAO). First, the most plantar aspect of the M1, the most plantar aspect of the M5, and the most plantar aspect of the calcaneal tuberosity (C) are marked to create the foot tripod. Then, the talar dome center (T1) is established on the foot tripod. The FAO represents the percentage of ankle deviation from the tripod’s center (C1) (Figure 2).
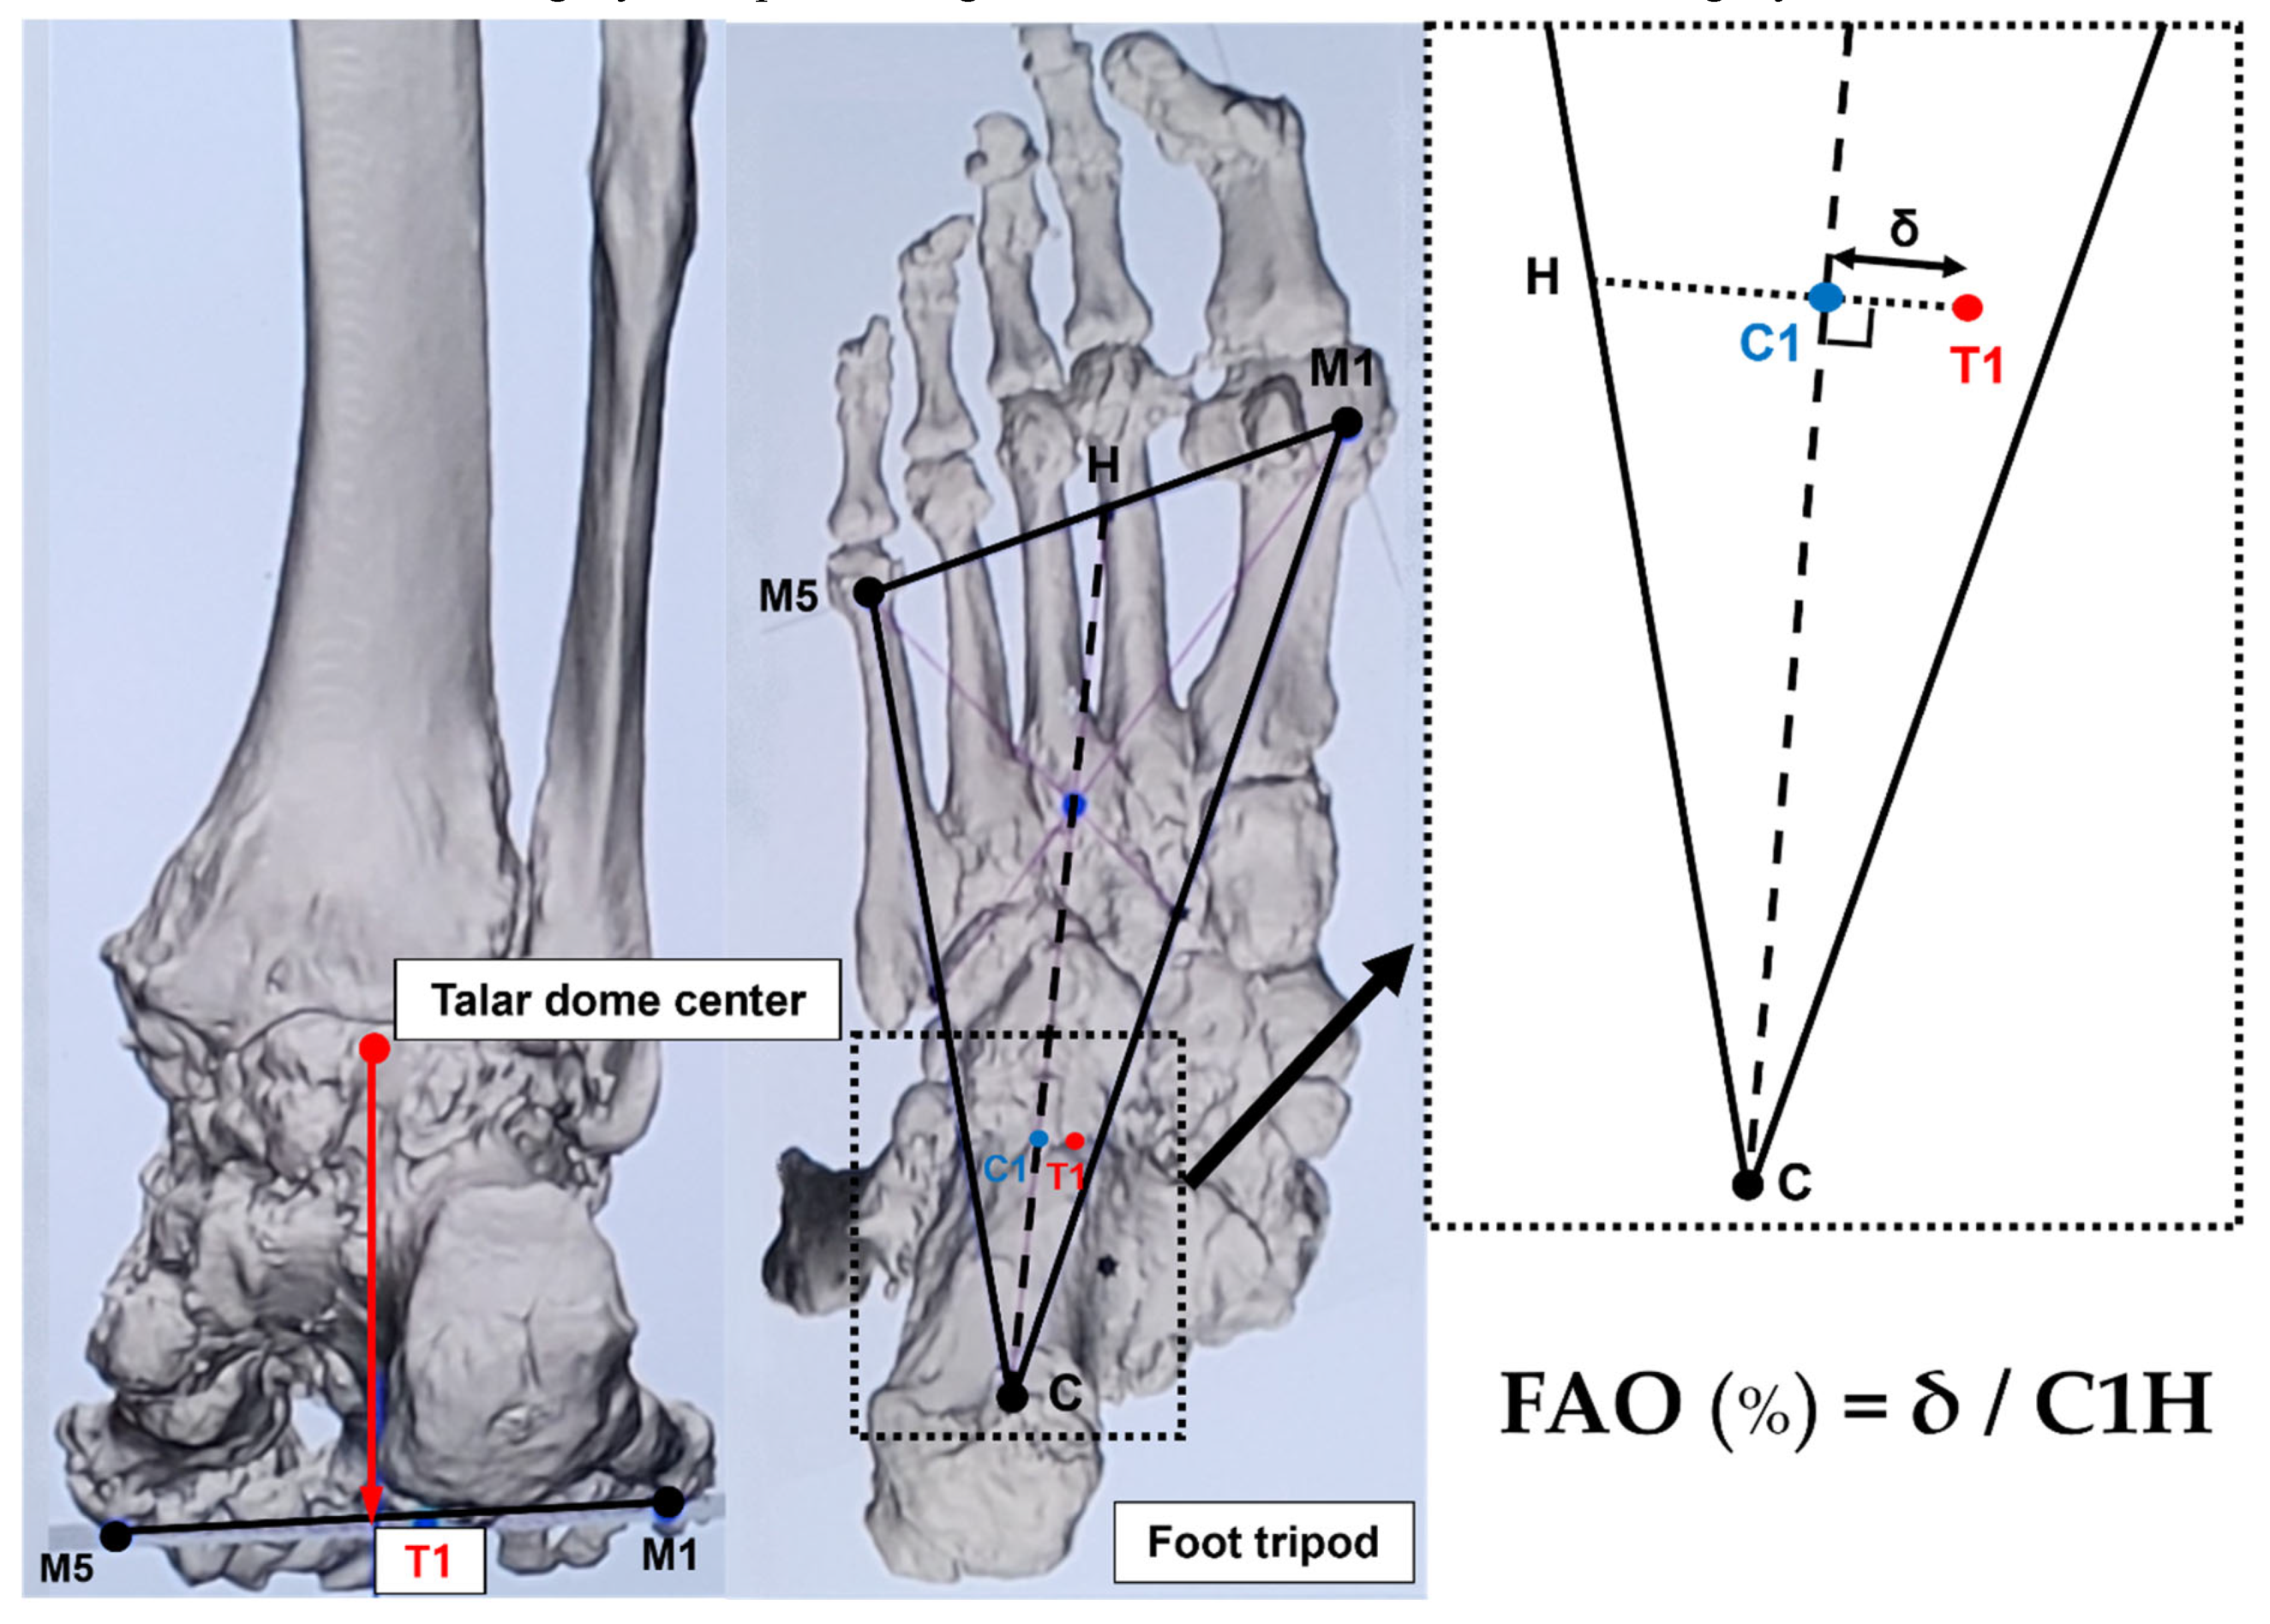
Figure 8.
Talocalcaneal distance. A. Using the sagittal view for reference, the most inferior point of the lateral process is identified.
Figure 8.
Talocalcaneal distance. A. Using the sagittal view for reference, the most inferior point of the lateral process is identified.
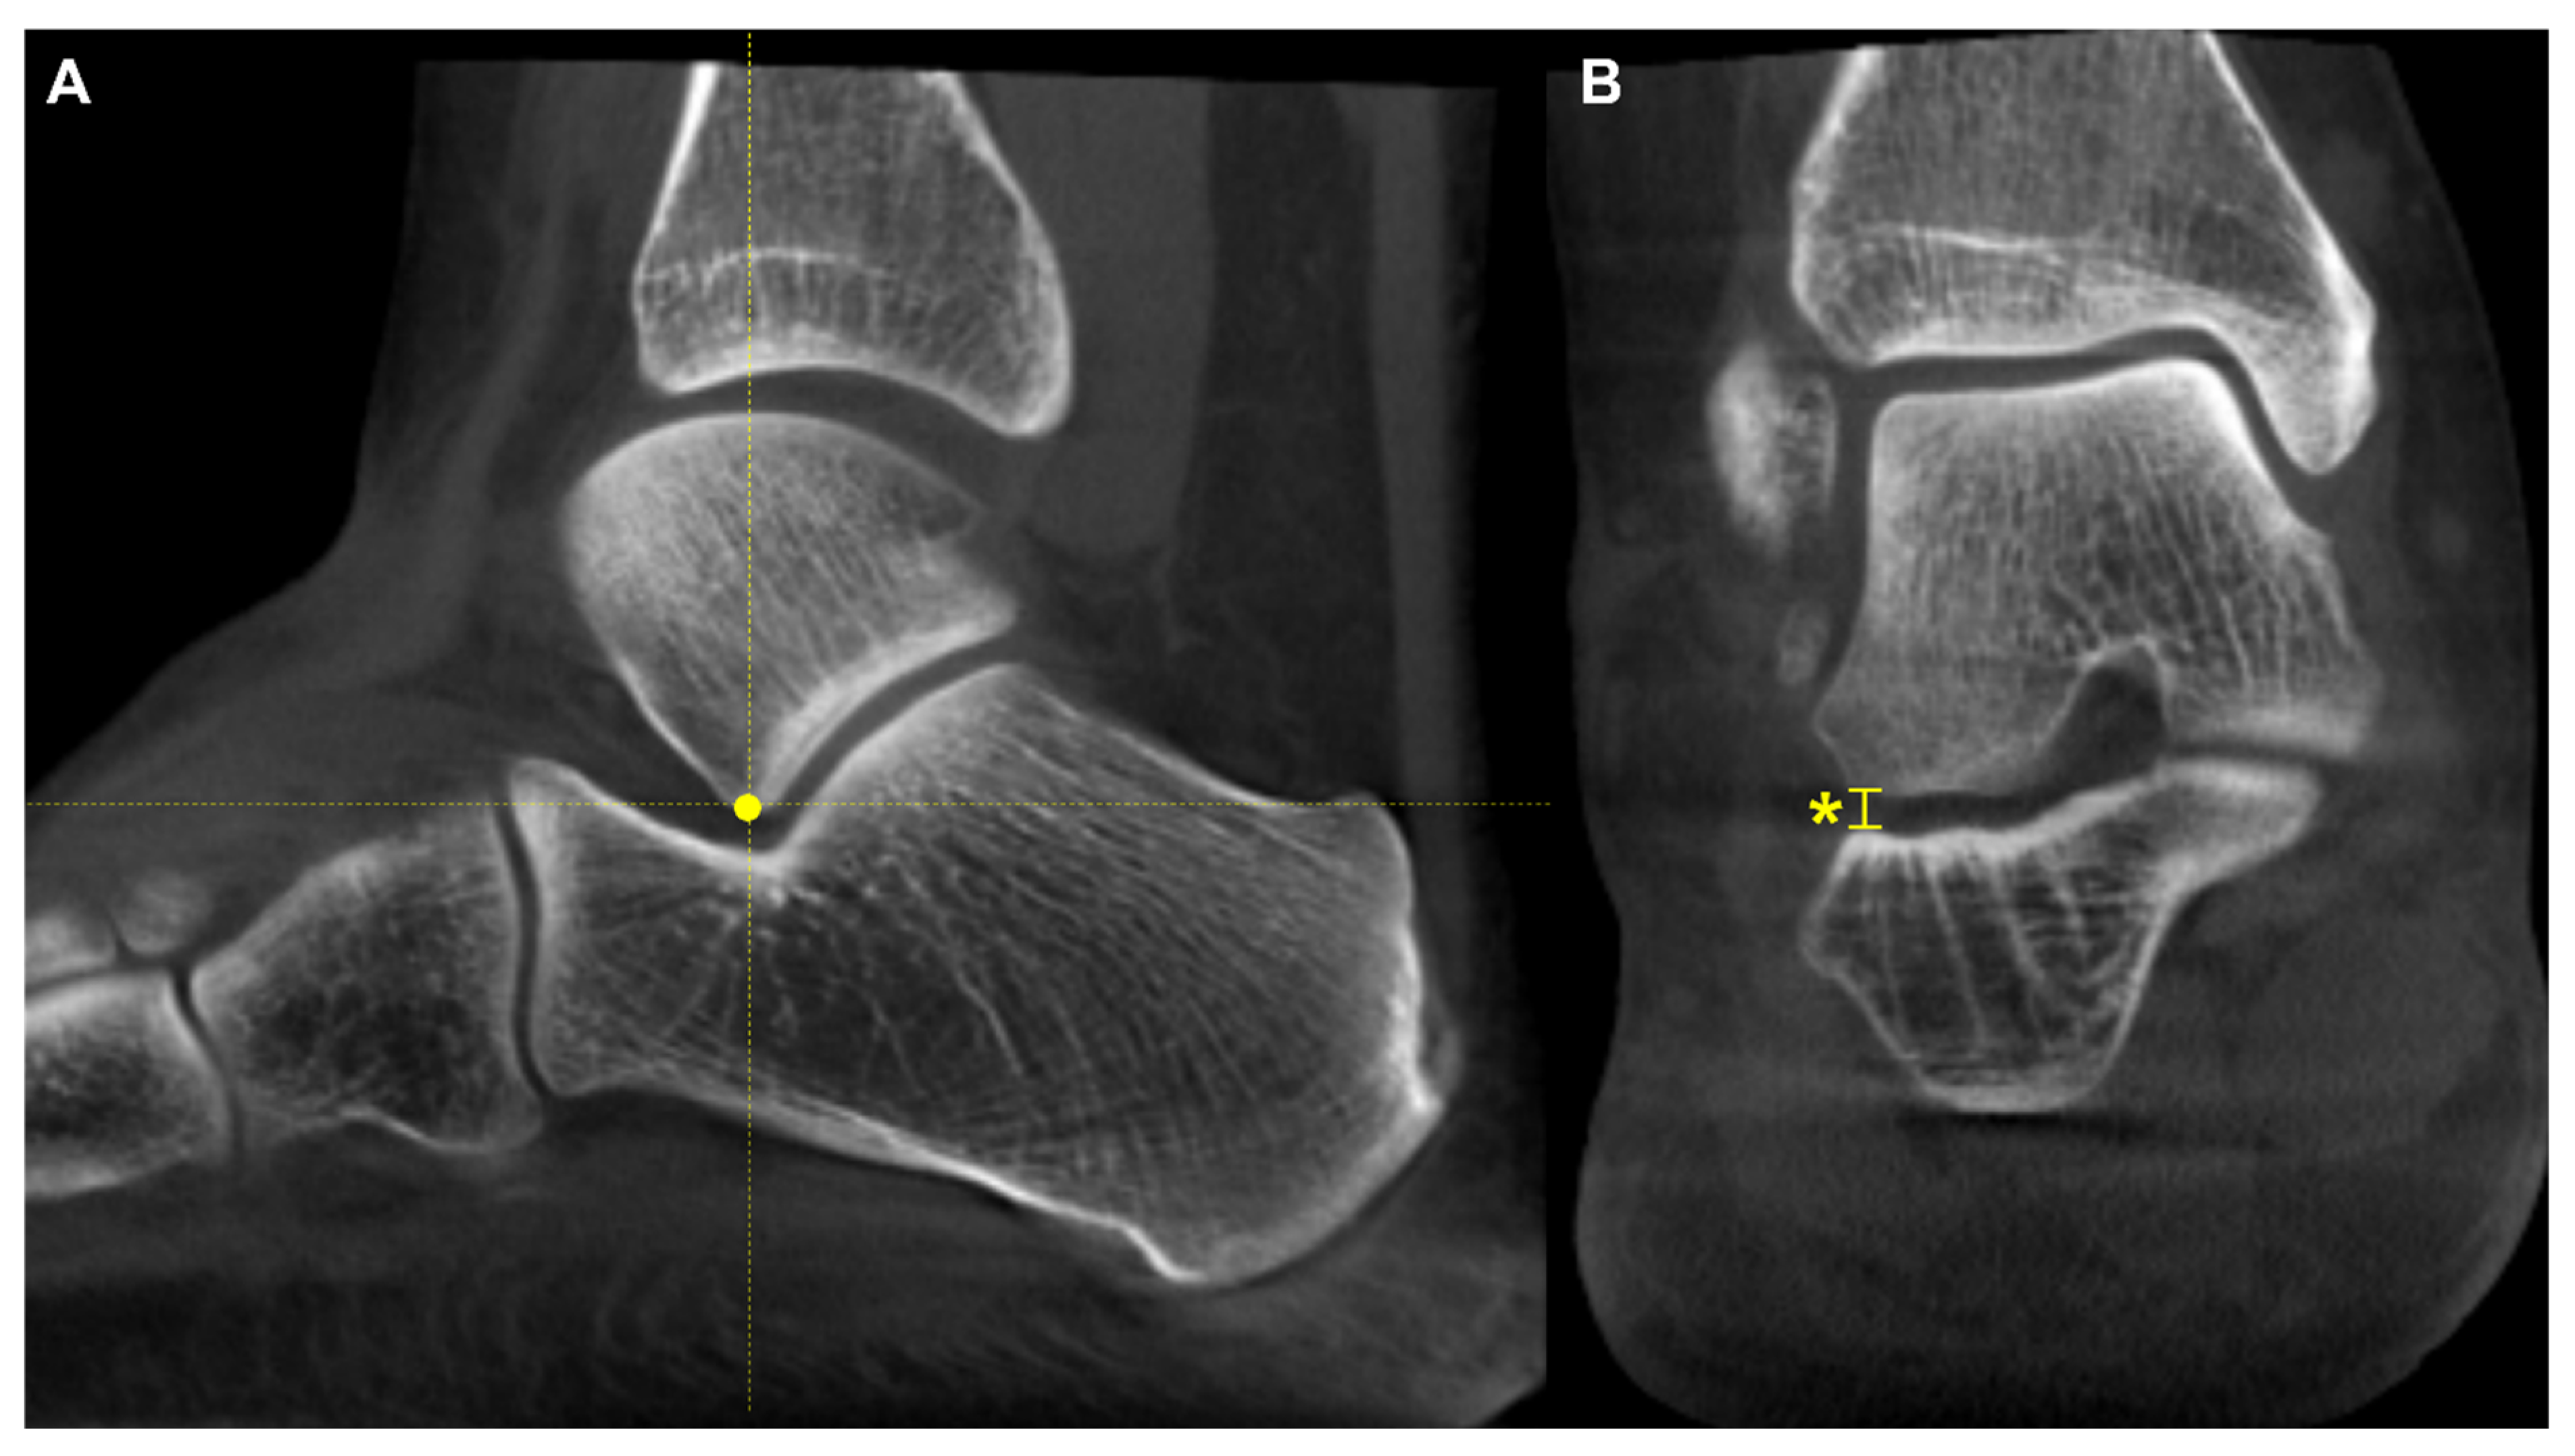
Figure 9.
A 71-year-old male PCFD patient with 35 degrees talonavicular coverage angle (A) and 20 degrees lateral Meary’s angle (B). The talus is internally rotated with regards to lateral malleolus on the weight-bearing CT axial image (C).
Figure 9.
A 71-year-old male PCFD patient with 35 degrees talonavicular coverage angle (A) and 20 degrees lateral Meary’s angle (B). The talus is internally rotated with regards to lateral malleolus on the weight-bearing CT axial image (C).
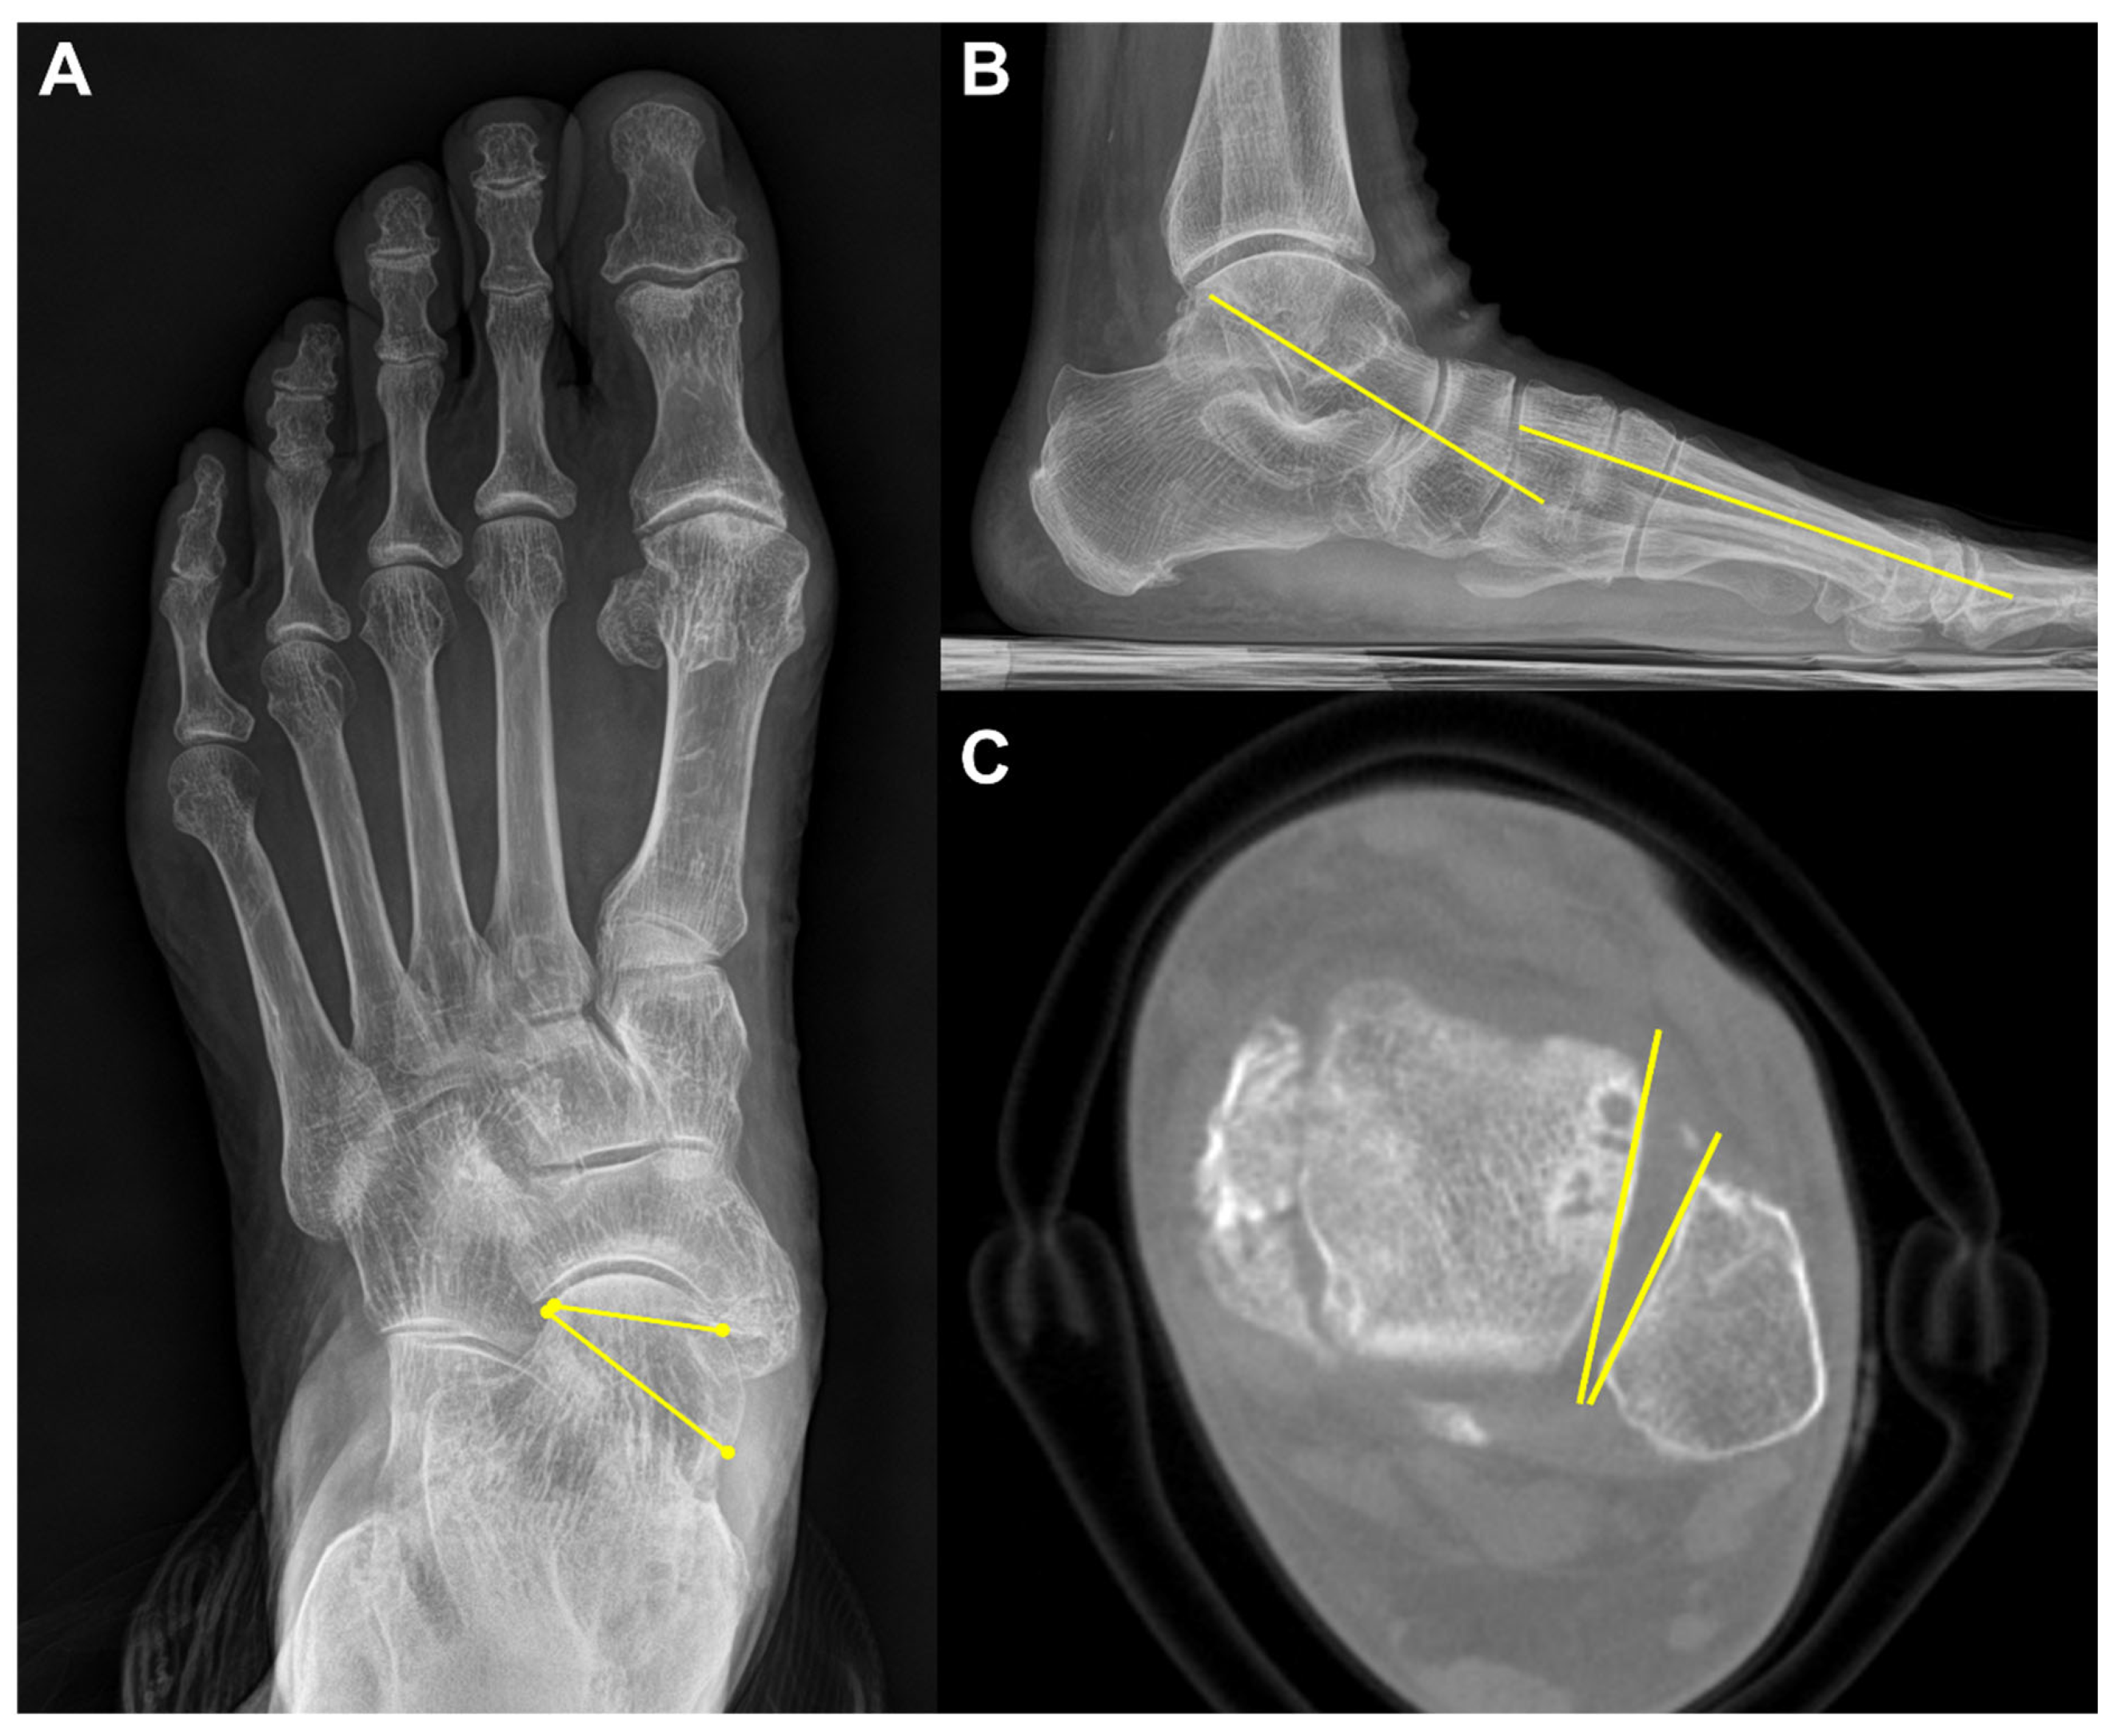
Figure 10.
Forefoot arch angle (FFA) and medial cuneiform-to-floor distance (MCFD). A. FFA is defined as an angle between the floor (a) and the line connecting the most plantar aspect of the medial cuneiform and 5th metatarsal (b).B. MCFD is measured from the most plantar aspect of the medial cuneiform to the floor (asterisk).
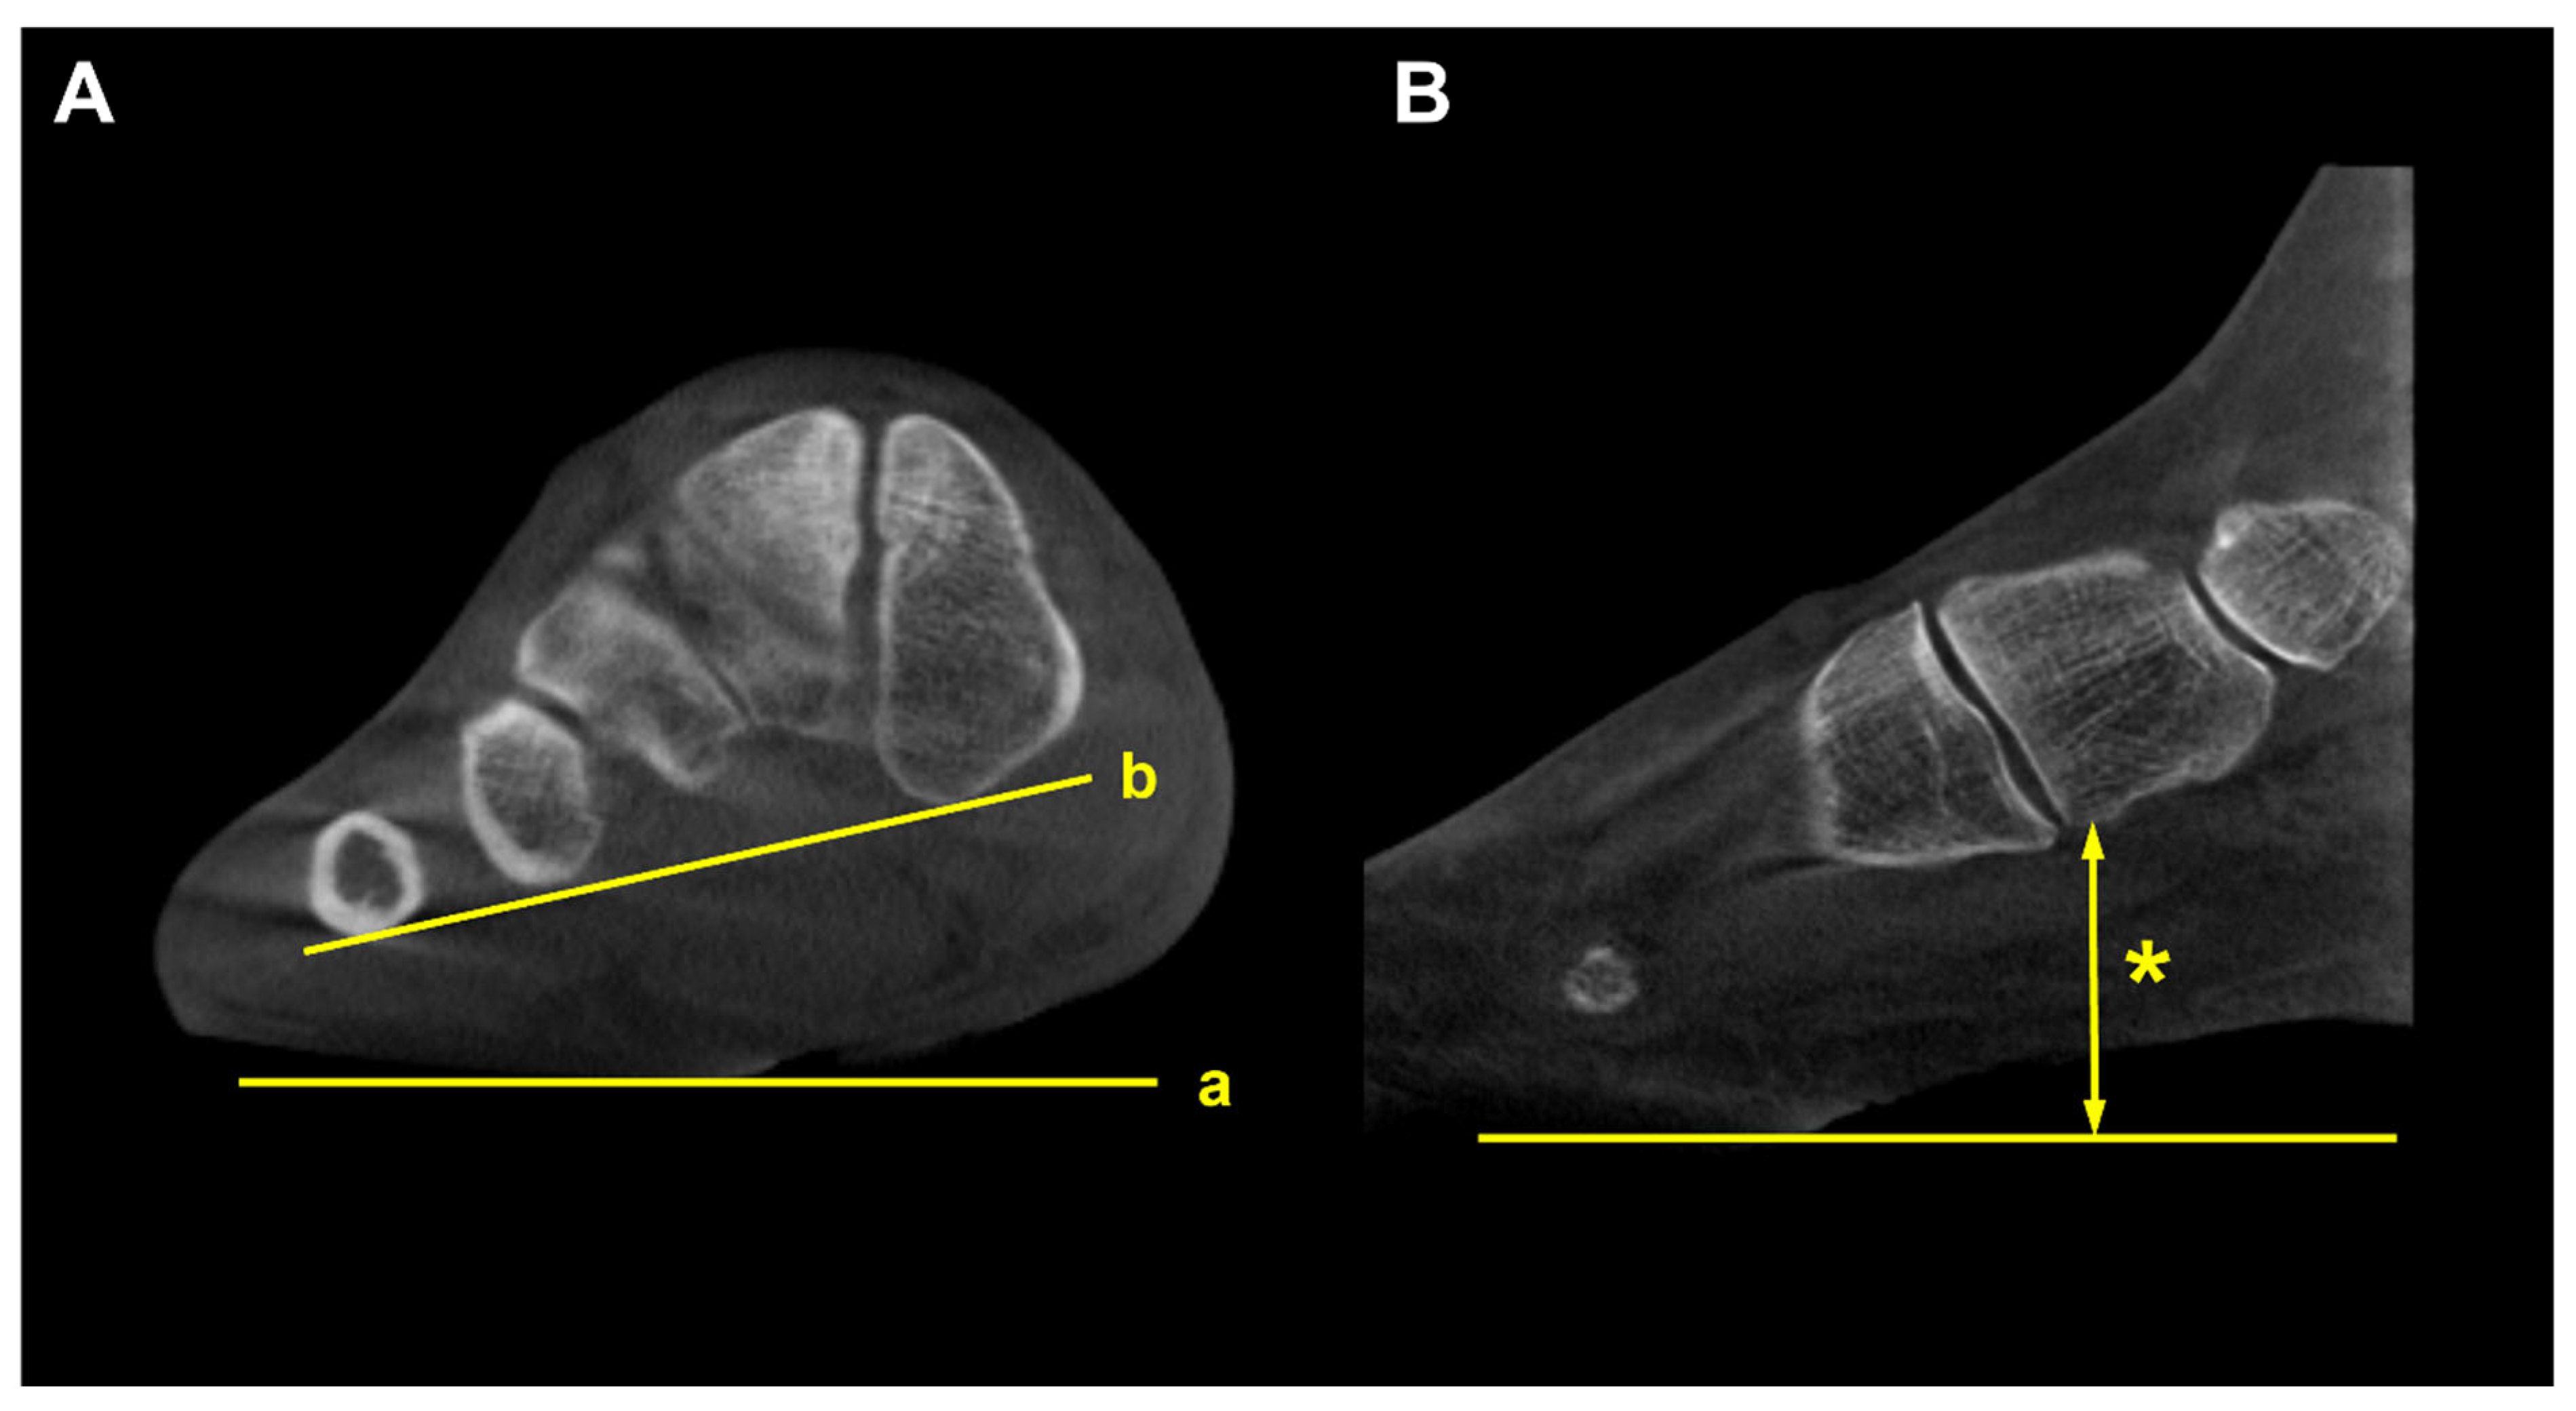
Figure 11.
Middle facet subluxation. A. Measurement of the incongruence angle of the middle facet of the subtalar joint on a coronal-plane weight-bearing CT image, which is an angle between both articular surfaces (a and b) B. Measurement of the percentage of “uncoverage” of the middle facet of the subtalar joint on a coronal-plane weight-bearing CT image. c = the width of the talar middle facet, and d = the linear measurement of the middle facet uncoverage. The percentage of uncoverage of the middle facet of the subtalar joint = d/c.
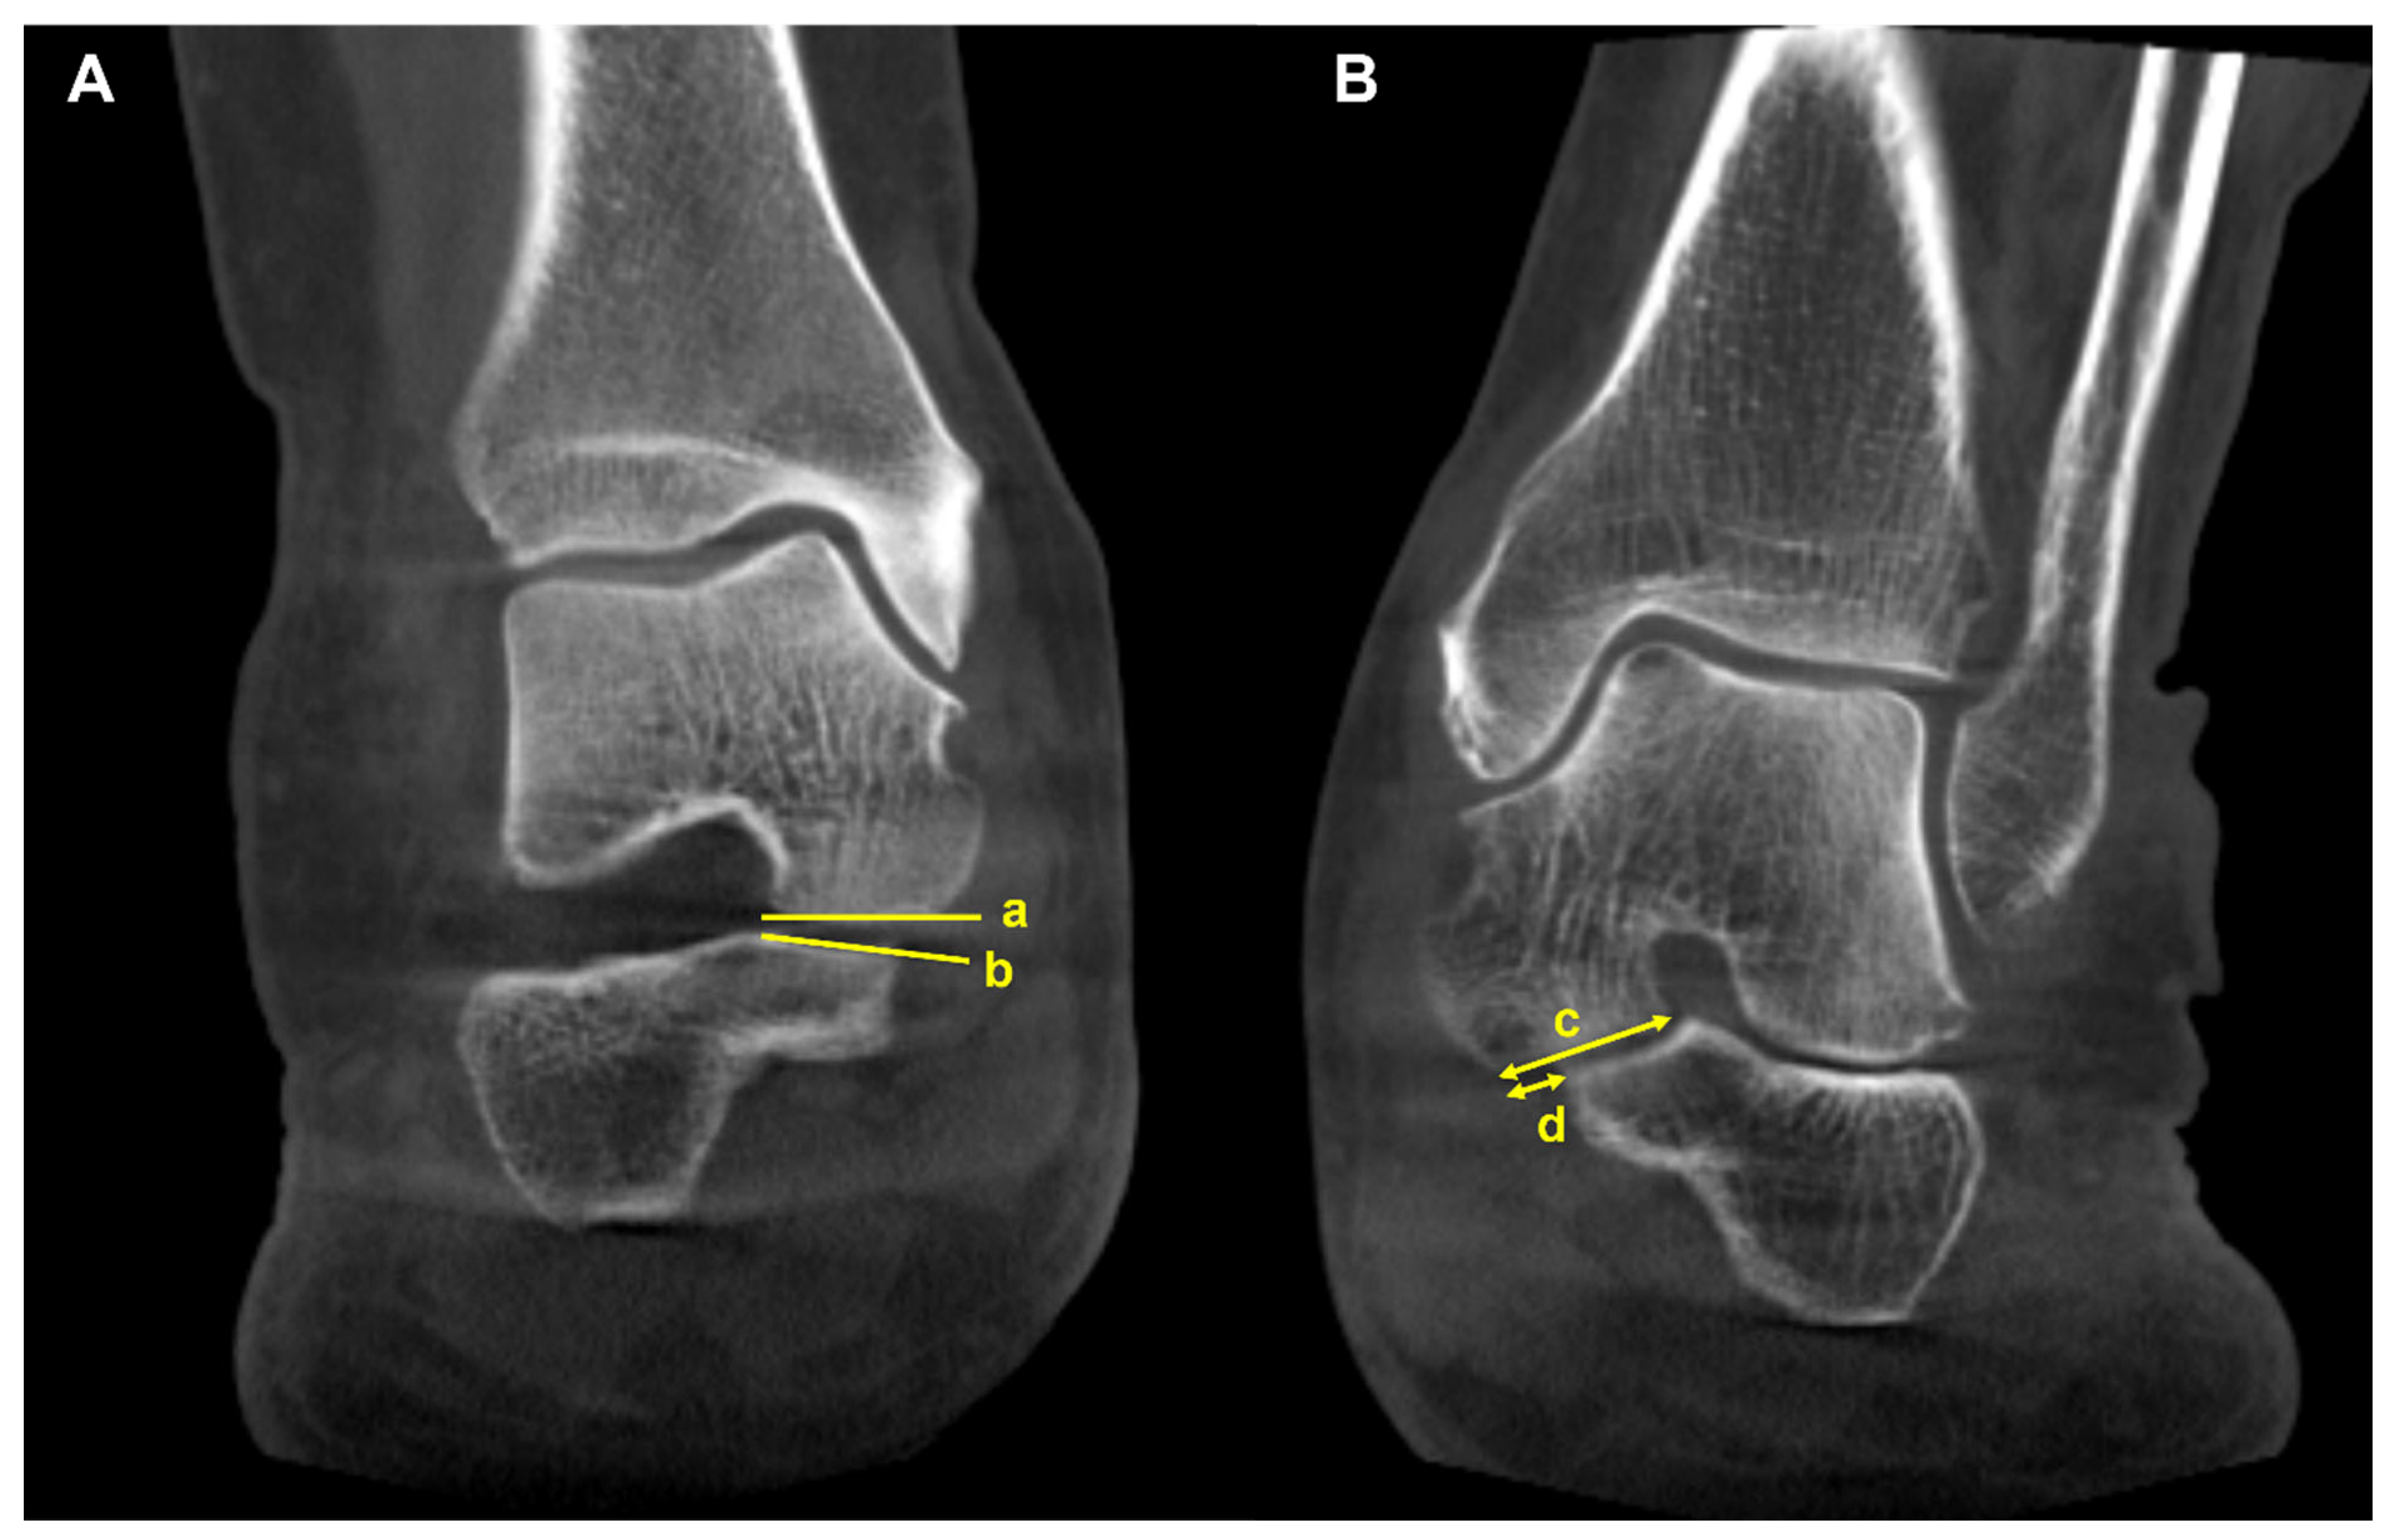
Figure 12.
Calcaneofibular distance is the shortest distance from the fibula to the lateral margin of the posterior facet of the calcaneus in the coronal image (asterisk).
Figure 12.
Calcaneofibular distance is the shortest distance from the fibula to the lateral margin of the posterior facet of the calcaneus in the coronal image (asterisk).
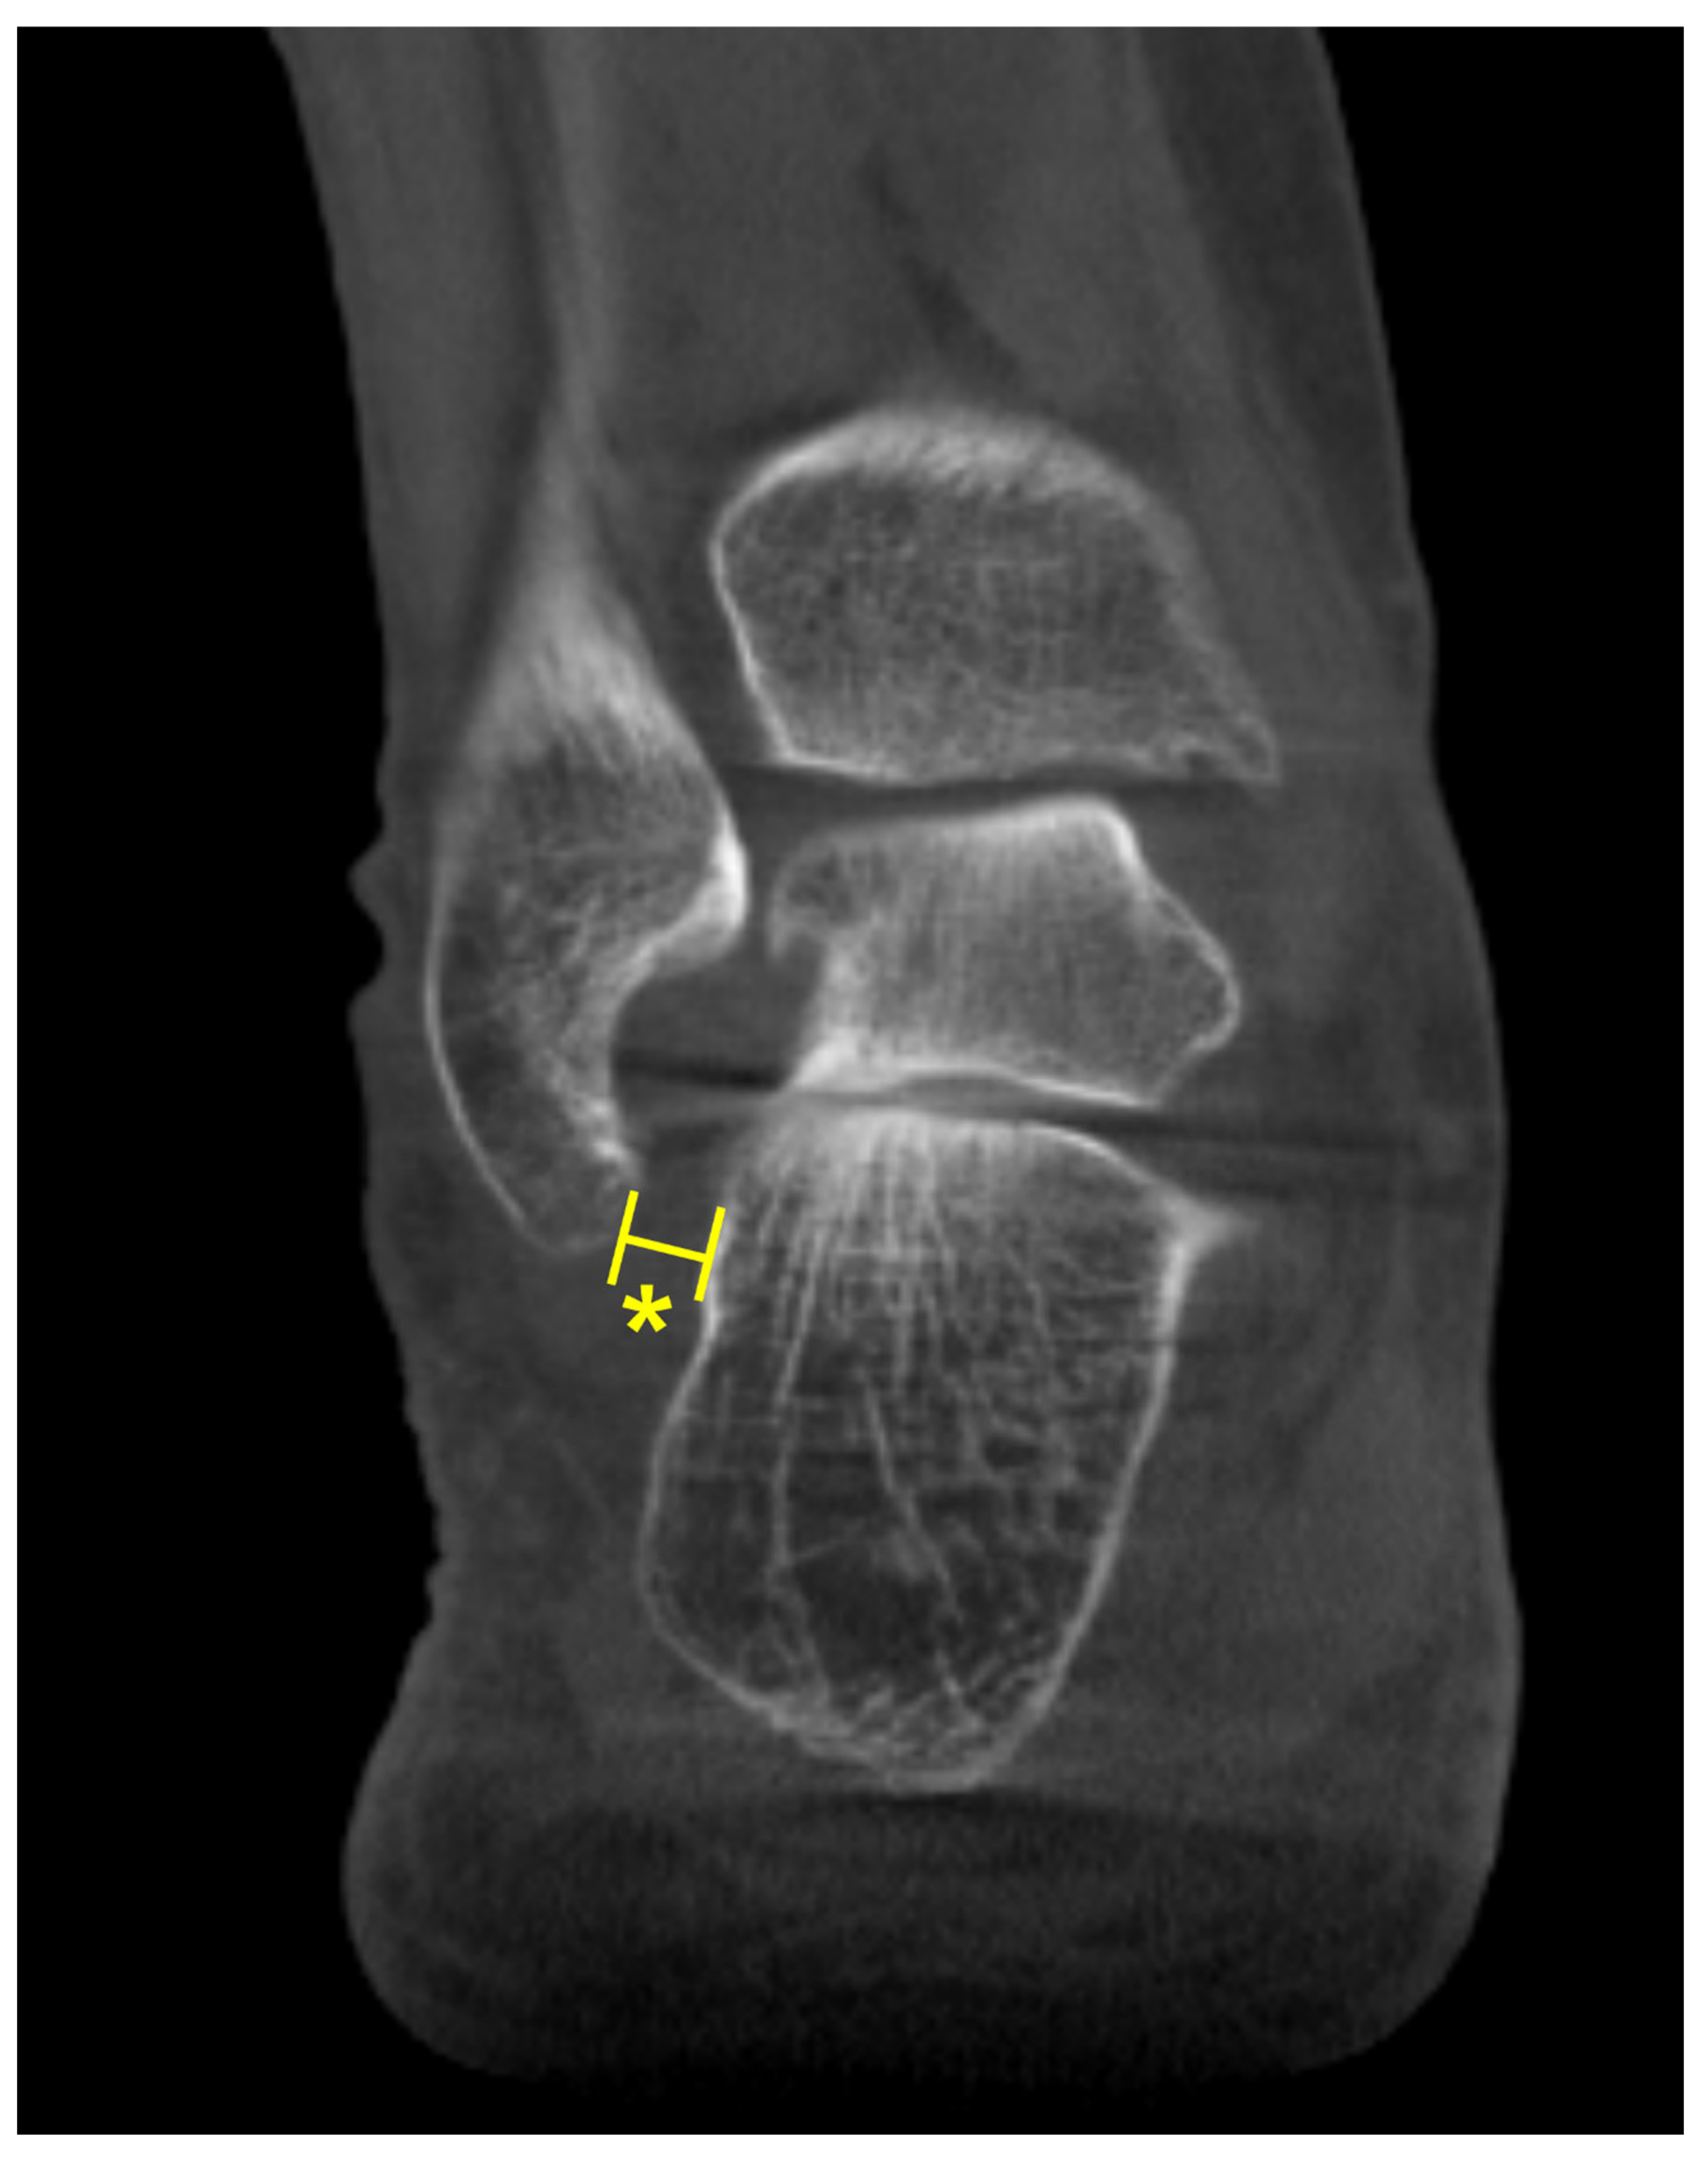
Figure 13.
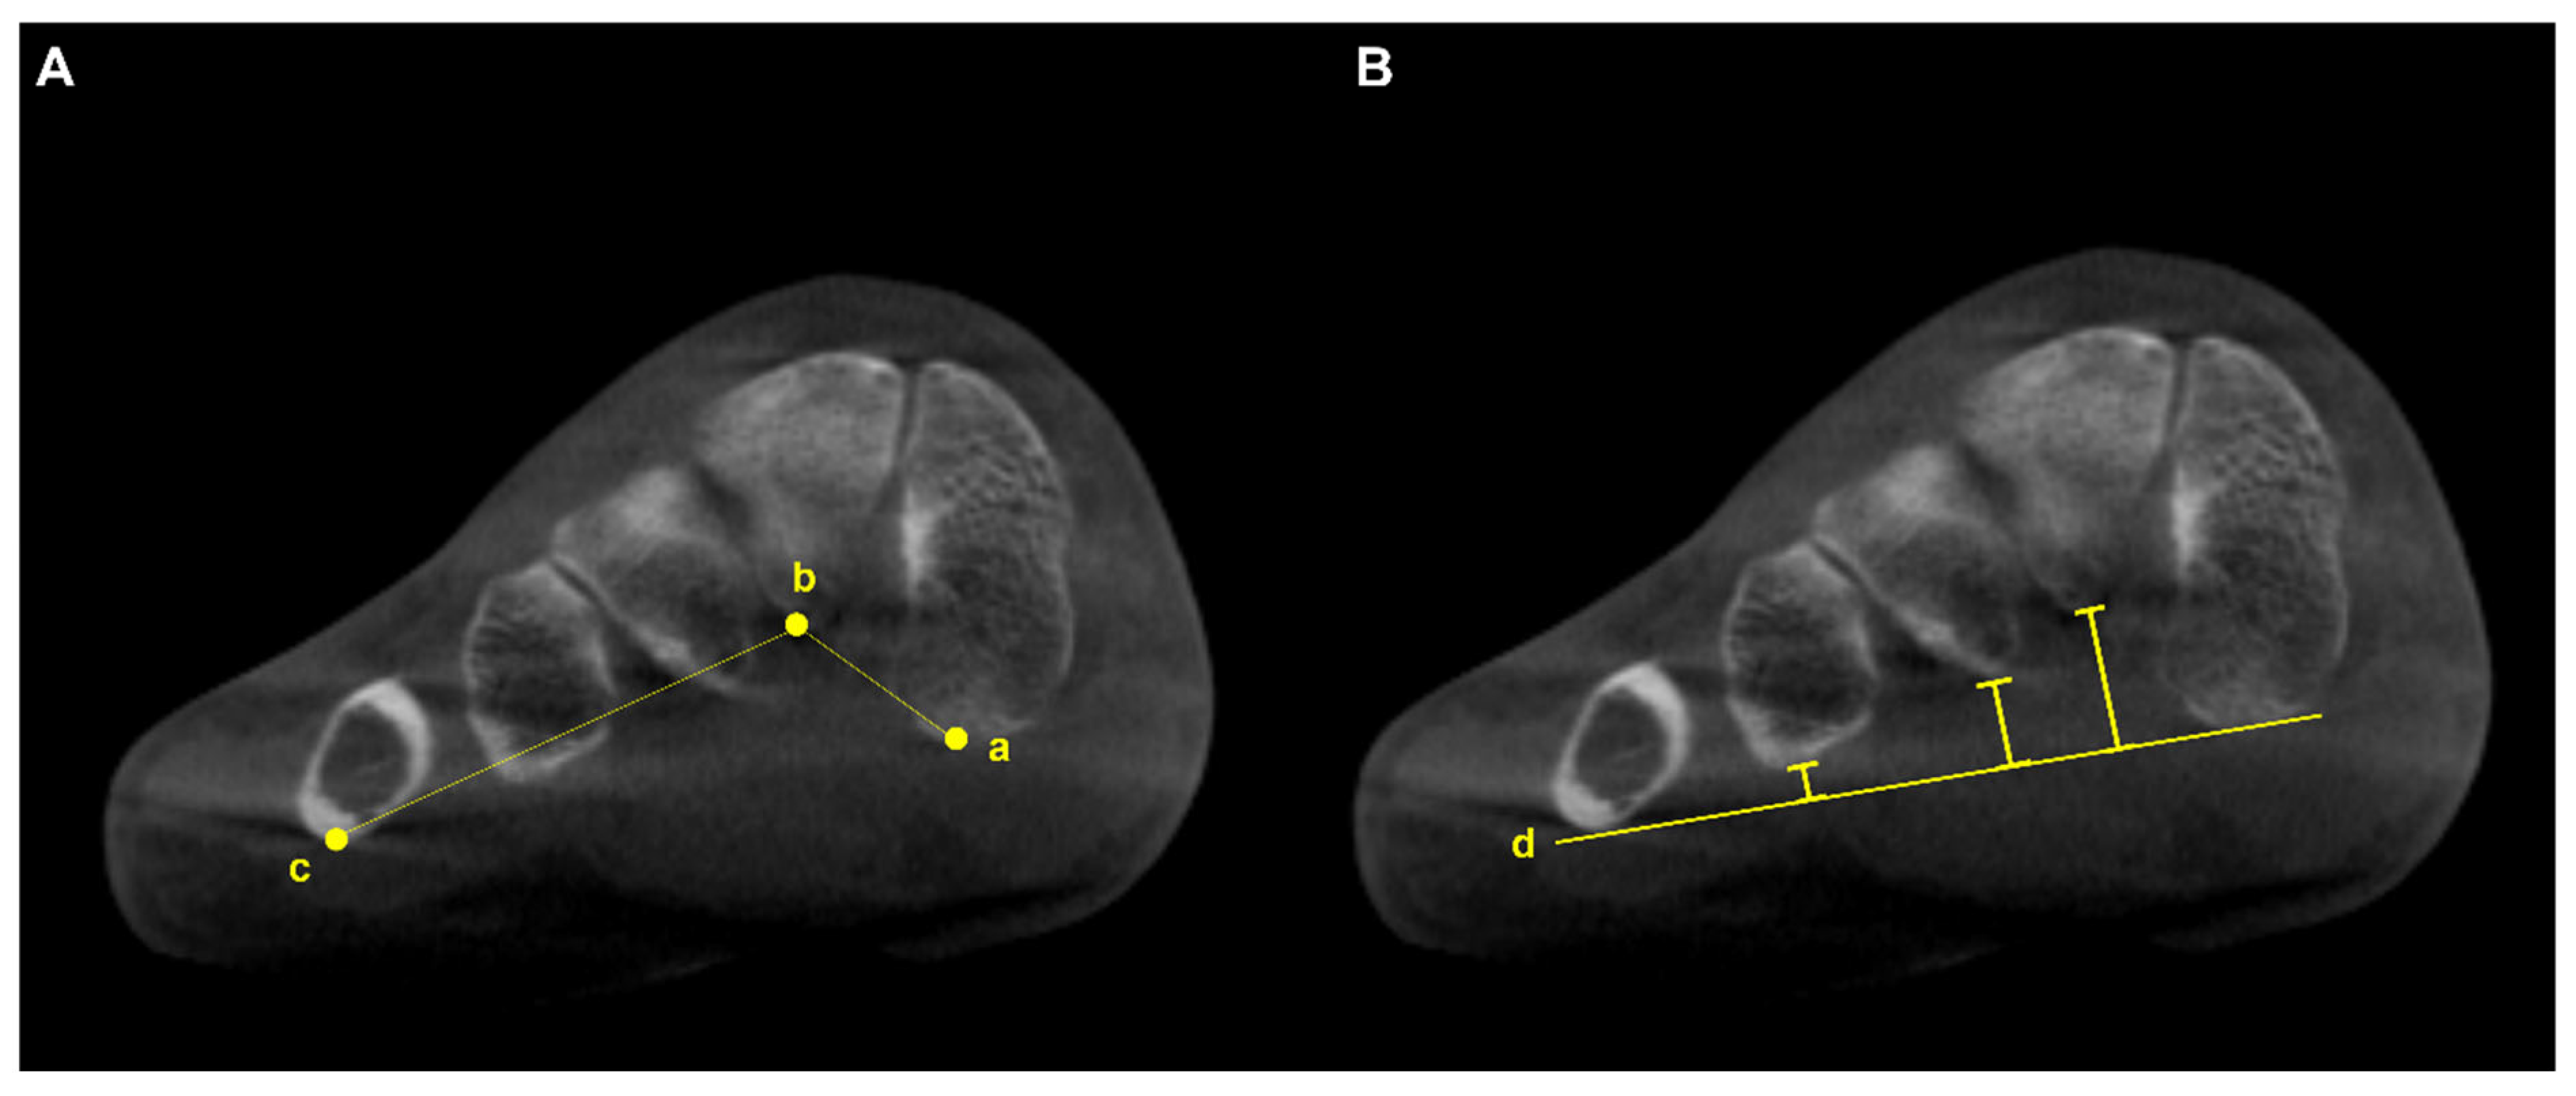
A. Transverse arch plantar (TAP) angle is represented by the angle between the most plantar parts of the 1st (a), 2nd (b), and 5th (c) TMT joints. B. Location of collapse along the transverse arch is determined by comparing the distance between the line connecting the most inferior aspect of the medial cuneiform and the 5th metatarsal bone (d) and specific components of the transverse arch.
Figure 13.
A. Transverse arch plantar (TAP) angle is represented by the angle between the most plantar parts of the 1st (a), 2nd (b), and 5th (c) TMT joints. B. Location of collapse along the transverse arch is determined by comparing the distance between the line connecting the most inferior aspect of the medial cuneiform and the 5th metatarsal bone (d) and specific components of the transverse arch.
Disclaimer/Publisher’s Note: The statements, opinions and data contained in all publications are solely those of the individual author(s) and contributor(s) and not of MDPI and/or the editor(s). MDPI and/or the editor(s) disclaim responsibility for any injury to people or property resulting from any ideas, methods, instructions or products referred to in the content. |
© 2024 by the authors. Licensee MDPI, Basel, Switzerland. This article is an open access article distributed under the terms and conditions of the Creative Commons Attribution (CC BY) license (http://creativecommons.org/licenses/by/4.0/).
Copyright: This open access article is published under a Creative Commons CC BY 4.0 license, which permit the free download, distribution, and reuse, provided that the author and preprint are cited in any reuse.


