Submitted:
10 October 2024
Posted:
14 October 2024
You are already at the latest version
Abstract
This research, titled "Sustainable Tourism Logistics Management Strategies: A Case Study of Pathum Thani Province, Thailand," is a quantitative study aimed at developing effective strategies for sustainable logistics management in the tourism sector of Pathum Thani. The study focuses on three main objectives: (1) to propose strategies to enhance the tourism value of Pathum Thani, (2) to assess the satisfaction of tourists regarding the current logistics systems, and (3) to offer recommendations for the development of sustainable tourism logistics. Logistics management is a key element in tourism, involving the coordination of physical flow, such as the movement of tourists and services; information flow, which includes real-time travel details and guidance; and financial flow, ensuring seamless transactions for bookings and services. Efficient management of these flows is essential to improve tourist experiences, enhance the destination's appeal, and support long-term sustainability in the tourism industry.
Pathum Thani, located near Bangkok, holds potential as a significant tourist destination, with its rich cultural heritage, historical sites, natural reserves, and commercial attractions. However, despite its favorable location, the province faces major logistical challenges that affect tourist satisfaction. Public transportation systems are limited, and connectivity between key tourist sites is often inadequate. These inefficiencies can hinder tourists’ ability to fully enjoy what the province has to offer. In response to these issues, the research aimed to study and recommend strategies that would improve logistics management, thereby increasing both the convenience for tourists and the sustainability of tourism activities in the province.
In this study, data were collected through structured questionnaires distributed to 400 tourists currently visiting Pathum Thani. The focus of the survey was to evaluate their satisfaction levels with the province’s transportation, infrastructure, and overall logistics systems. The survey was designed to measure various factors such as the ease of transportation, the availability of clear signage and tourist information, the quality of infrastructure at tourist sites, and the environmental friendliness of the logistics systems in place. The data collected were analyzed using descriptive statistics such as means, percentages, and standard deviations, as well as inferential statistics including t-tests and one-way ANOVA to examine the differences in satisfaction across various demographics.
The findings from this research revealed significant insights into the current state of tourism logistics in Pathum Thani. First, the analysis showed that 55% of tourists used private vehicles for transportation due to a lack of efficient public transportation options. This reliance on private transport reflects a clear gap in the availability of affordable and convenient public transport systems. Tourists also reported dissatisfaction with the connectivity between tourist attractions, which led to logistical difficulties during their visits. Specifically, on a 5-point satisfaction scale, transportation logistics scored an average of 3.5, indicating that tourists felt inconvenienced by the lack of comprehensive transport networks linking popular sites. Attractions like Bung Kum and Patumwanarom Park, which are more difficult to access, received lower satisfaction scores compared to easily accessible commercial venues such as Dream World and the National Science Museum.
Furthermore, tourists expressed concerns about the lack of digital resources to aid in navigation and trip planning. Most respondents felt that more could be done to implement user-friendly apps or platforms that provide real-time information on public transport schedules, directions, and nearby amenities. This digital gap also contributed to the tourists’ reliance on private vehicles and decreased their overall satisfaction with their trip. The research findings underscored the need for better integration of digital tools, especially those that support multiple languages to cater to international tourists. By introducing such platforms, Pathum Thani could significantly improve the convenience of travel within the province.
Another key aspect of the research involved exploring how sustainable logistics practices could enhance both tourist experiences and environmental conservation. Over 60% of tourists surveyed expressed interest in eco-friendly travel options, with many indicating that they would prefer public transportation systems that reduce carbon emissions, such as electric buses. However, the lack of such options in Pathum Thani detracts from its image as a sustainable tourist destination. This highlights the importance of incorporating green transportation strategies, which not only align with global sustainability trends but also cater to the growing demand for environmentally responsible tourism.
The research concludes with several important recommendations based on the analysis of tourist feedback and logistical challenges. Firstly, the study advocates for the establishment of a comprehensive shuttle bus system that connects key tourist attractions. Such a system would reduce the reliance on private vehicles and provide tourists with a more convenient and cost-effective mode of transportation. Additionally, the introduction of electric buses would help Pathum Thani reduce its carbon footprint and attract environmentally conscious travelers. The creation of a multilingual digital platform offering real-time information about transportation, accommodation, and tourist services would further enhance the convenience for tourists, especially international visitors who may struggle with language barriers.
In conclusion, this research highlights the critical role that logistics management plays in the tourism sector, particularly in ensuring both tourist satisfaction and sustainability. The findings demonstrate that Pathum Thani has significant potential to enhance its appeal as a tourist destination through the implementation of effective logistics strategies. By improving transportation networks, introducing green logistics solutions, and leveraging digital technologies, the province can offer a more seamless and satisfying experience for tourists while promoting environmentally responsible tourism. The study’s recommendations provide a comprehensive framework for policymakers and tourism stakeholders to improve logistics management in Pathum Thani, making it a more attractive and sustainable destination for both domestic and international visitors.
Keywords:
Logistics Management
; Sustainable Tourism
; Pathum Thani
1. Introduction
Tourism is one of the most vital industries in Thailand, contributing significantly to the national economy. In 2022, the tourism sector generated more than 1.93 trillion-baht, accounting for approximately 10% of the country’s GDP (Ministry of Tourism and Sports, 2022). Pathum Thani Province, due to its proximity to Bangkok, stands out as a region with high potential for sustainable tourism development (Tourism Authority of Thailand, 2022). The province attracts a wide range of tourists from various age groups, each with different travel purposes, making it a key area for further investment and improvement in tourism management (Zolfani et al., 2015).
Tourism logistics management plays a crucial role in the development of tourist destinations, particularly in areas that are difficult to access. Efficient logistics management helps mitigate travel issues, improve accessibility to tourist spots, and enhance the overall experience of visitors (Becken & Simmons, 2008; Li & Song, 2019). Tourism logistics encompasses multiple aspects such as route planning, parking management, public transportation services, and facility management at tourist destinations (Piboonrungroj & Disney, 2015).
Pathum Thani hosts numerous commercial tourist attractions, such as amusement parks, which target family groups and young travelers. For these attractions to succeed, effective logistics management is key to ensuring that tourists have convenient access and a satisfying experience (Tourism Authority of Thailand, 2022). However, major logistics challenges remain in the province, including difficulties in accessing certain tourist sites, inefficient management of transportation routes, and inadequate public transportation support (Peeters et al., 2018).
Ineffective tourism logistics can lead to various issues such as travel delays, excessive energy consumption, and negative environmental impacts (Gössling et al., 2021). Sustainable solutions, such as the use of public transportation and the development of green infrastructure, including electric buses and clean energy sources, can help minimize environmental damage (Dubois et al., 2011; Buhalis & Law, 2008). Additionally, the integration of digital technologies, such as mobile apps for accommodation booking and navigation, can enhance the efficiency of tourism logistics and improve the overall experience for tourists (Neuhofer et al., 2015).
Effective logistics management not only enhances the convenience and speed of services but also contributes to the long-term sustainability of tourism. The development of high-quality infrastructure can support the increasing number of tourists while preserving the natural and cultural resources of the region (Weaver & Oppermann, 2000; Christopher, 2016). In the case of Pathum Thani, logistics management remains a significant challenge, particularly due to a lack of public transportation and inefficient tourist service facilities (National Statistical Office, 2023).
Moreover, sustainable logistics management can increase tourist satisfaction by providing reliable, efficient services that improve the overall travel experience. The successful implementation of sustainable logistics practices in tourism can lead to enhanced competitiveness of the region’s attractions, ultimately supporting long-term growth and the sustainability of Pathum Thani’s tourism industry (Pizam & Ellis, 1978; Filimonau et al., 2018).
Given these challenges and opportunities, this research focuses on analyzing and proposing strategies to improve tourism logistics management in Pathum Thani Province, aiming to develop sustainable practices that align with the region’s potential. By addressing the current logistics issues, Pathum Thani can become a more attractive destination, capable of supporting long-term tourism growth and providing a higher level of service to both domestic and international visitors.
2. Objectives of the Study
The primary aim of this research is to explore and enhance sustainable tourism logistics management in Pathum Thani Province, Thailand. The specific objectives of this study are as follows:
(1) To Propose Strategies to Enhance the Tourism Value of Pathum Thani: This objective focuses on identifying and recommending effective strategies that can increase the tourism value of Pathum Thani. The aim is to evaluate the current readiness and services and determine how these offerings can be improved to attract a wider range of visitors and enhance their overall experience.
(2) To Assess the Satisfaction of Tourists Regarding the Current Logistics Systems: This study aims to evaluate the satisfaction levels of tourists who are visiting Pathum Thani, specifically focusing on the existing logistics systems. Understanding tourists’ perceptions and experiences related to transportation, accessibility, and services will provide insights into areas that require improvement to ensure a positive travel experience.
(3) To Offer Recommendations for the Development of Sustainable Tourism Logistics: The final objective is to provide actionable recommendations for improving sustainable tourism logistics in Pathum Thani. This includes analyzing current logistics management practices, identifying gaps, and suggesting innovative approaches that align with sustainable tourism principles, ensuring minimal impact on the environment while maximizing visitor satisfaction.
Through these objectives, this study aims to contribute to the enhancement of tourism logistics in Pathum Thani, ultimately promoting sustainable development and improving the overall tourist experience in the province.
3. Scope and Limitation of the Study
3.1. Scope of the Study
This research focuses on the logistics management of tourism in Pathum Thani Province, Thailand, which has significant potential for tourism development due to its diverse attractions. The study encompasses various aspects, including:
- Geographical Scope: The research is concentrated in Pathum Thani Province, which features a wide array of tourism sites such as cultural landmarks, historical attractions, natural parks, and commercial entertainment venues. The province’s close proximity to Bangkok enhances its accessibility, making it an ideal location for studying tourism logistics.
- Temporal Scope: The data collection and analysis for this research will occur in 2024, specifically from January to July. This period follows the recovery of the tourism sector after the COVID-19 pandemic, allowing for an assessment of logistics management in a post-pandemic context as tourism activities resume and grow.
- Population Scope: The research will focus on tourists who have previously visited Pathum Thani. A sample of 400 individuals will be selected through random sampling, aiming to gather diverse perspectives from tourists of different ages and backgrounds regarding their experiences and satisfaction levels with the logistics services provided.
3.2. Limitations of the Study
While this study aims to provide valuable insights into sustainable tourism logistics management in Pathum Thani, certain limitations should be acknowledged:
- Generalizability: The findings of this research may be limited to Pathum Thani and may not be applicable to other regions in Thailand or abroad. Differences in infrastructure, tourism policies, and cultural contexts could affect the applicability of the results.
- Sample Representation: The study relies on self-reported data from tourists, which may introduce bias or subjectivity in the assessment of satisfaction levels and experiences. The sample may not fully represent the entire tourist population, particularly if certain demographics are underrepresented.
- Temporal Constraints: The research will only capture data during the specified timeframe in 2024. Changes in tourism dynamics, logistics systems, or external factors affecting the tourism industry after this period will not be reflected in the study.
- Focus on Logistics Management: While the study aims to enhance tourism value and satisfaction, the primary focus is on logistics management. Factors outside the logistics framework, such as marketing strategies, local community engagement, and broader economic conditions, may also influence tourism development but will not be extensively covered in this research.
By acknowledging these limitations, the study seeks to provide a clear understanding of the scope and potential challenges of implementing effective tourism logistics management strategies in Pathum Thani Province.
4. Significance of the Study
This research holds significant importance in various aspects related to tourism development, logistics management, and sustainable practices in Pathum Thani Province, Thailand. The key contributions of this study include:
- Enhancing Tourism Value: By proposing strategies to enhance the tourism value of Pathum Thani, this study aims to improve the overall attractiveness of the province as a tourist destination. The recommendations provided can help local authorities and tourism operators develop more appealing and diverse tourism offerings, thereby increasing visitor numbers and generating higher revenue for the local economy.
- Improving Tourist Satisfaction: Understanding the satisfaction levels of tourists regarding current logistics systems is crucial for enhancing the visitor experience. This research will provide insights into tourists’ perceptions and preferences, enabling stakeholders to make informed decisions that address their needs. Enhanced satisfaction can lead to increased repeat visits and positive word-of-mouth promotion, further benefiting the tourism industry.
- Promoting Sustainable Practices: The study emphasizes the importance of sustainable tourism logistics management. By offering recommendations for sustainable practices, it seeks to minimize the negative environmental impacts associated with tourism activities. This approach not only protects the province’s natural resources but also aligns with global trends towards sustainable tourism, positioning Pathum Thani as a forward-thinking destination.
- Guiding Policy and Decision-Making: The findings of this research will serve as a valuable resource for policymakers, tourism planners, and industry stakeholders. The insights gained can guide strategic planning and decision-making processes related to tourism development and logistics management, ensuring that they are aligned with sustainable principles and responsive to the evolving needs of tourists.
- Contributing to Academic Knowledge: This study adds to the existing body of knowledge in the fields of tourism management and logistics. By examining the specific context of Pathum Thani, it contributes to a better understanding of the dynamics of tourism logistics in Thailand and provides a basis for further research in related areas.
- Encouraging Local Community Engagement: The research highlights the role of local communities in tourism development. By considering the perspectives of tourists visiting key attractions in Pathum Thani, the study promotes the involvement of tourists in tourism planning and logistics management, fostering a sense of ownership and responsibility towards local tourism resources. This approach allows tourists to contribute their feedback and insights to help enhance the planning and management of tourism and logistics.5. Review of Related Literature and Studies
This section provides a comprehensive review of literature and studies related to tourism logistics management, sustainable practices, and the economic impact of tourism. The review focuses on the context of Thailand, specifically Pathum Thani Province, and aims to highlight key themes and findings relevant to this research.
5.1. Overview of Pathum Thani Province
Pathum Thani, located in central Thailand, encompasses an area of approximately 1,526.1 square kilometers. It shares its southern border with Bangkok, making it an attractive destination for tourists due to its accessibility and proximity to the capital. The province is rich in cultural heritage, with significant historical sites, natural attractions, and commercial entertainment venues that appeal to various visitor demographics (Department of Local Administration, 2023).
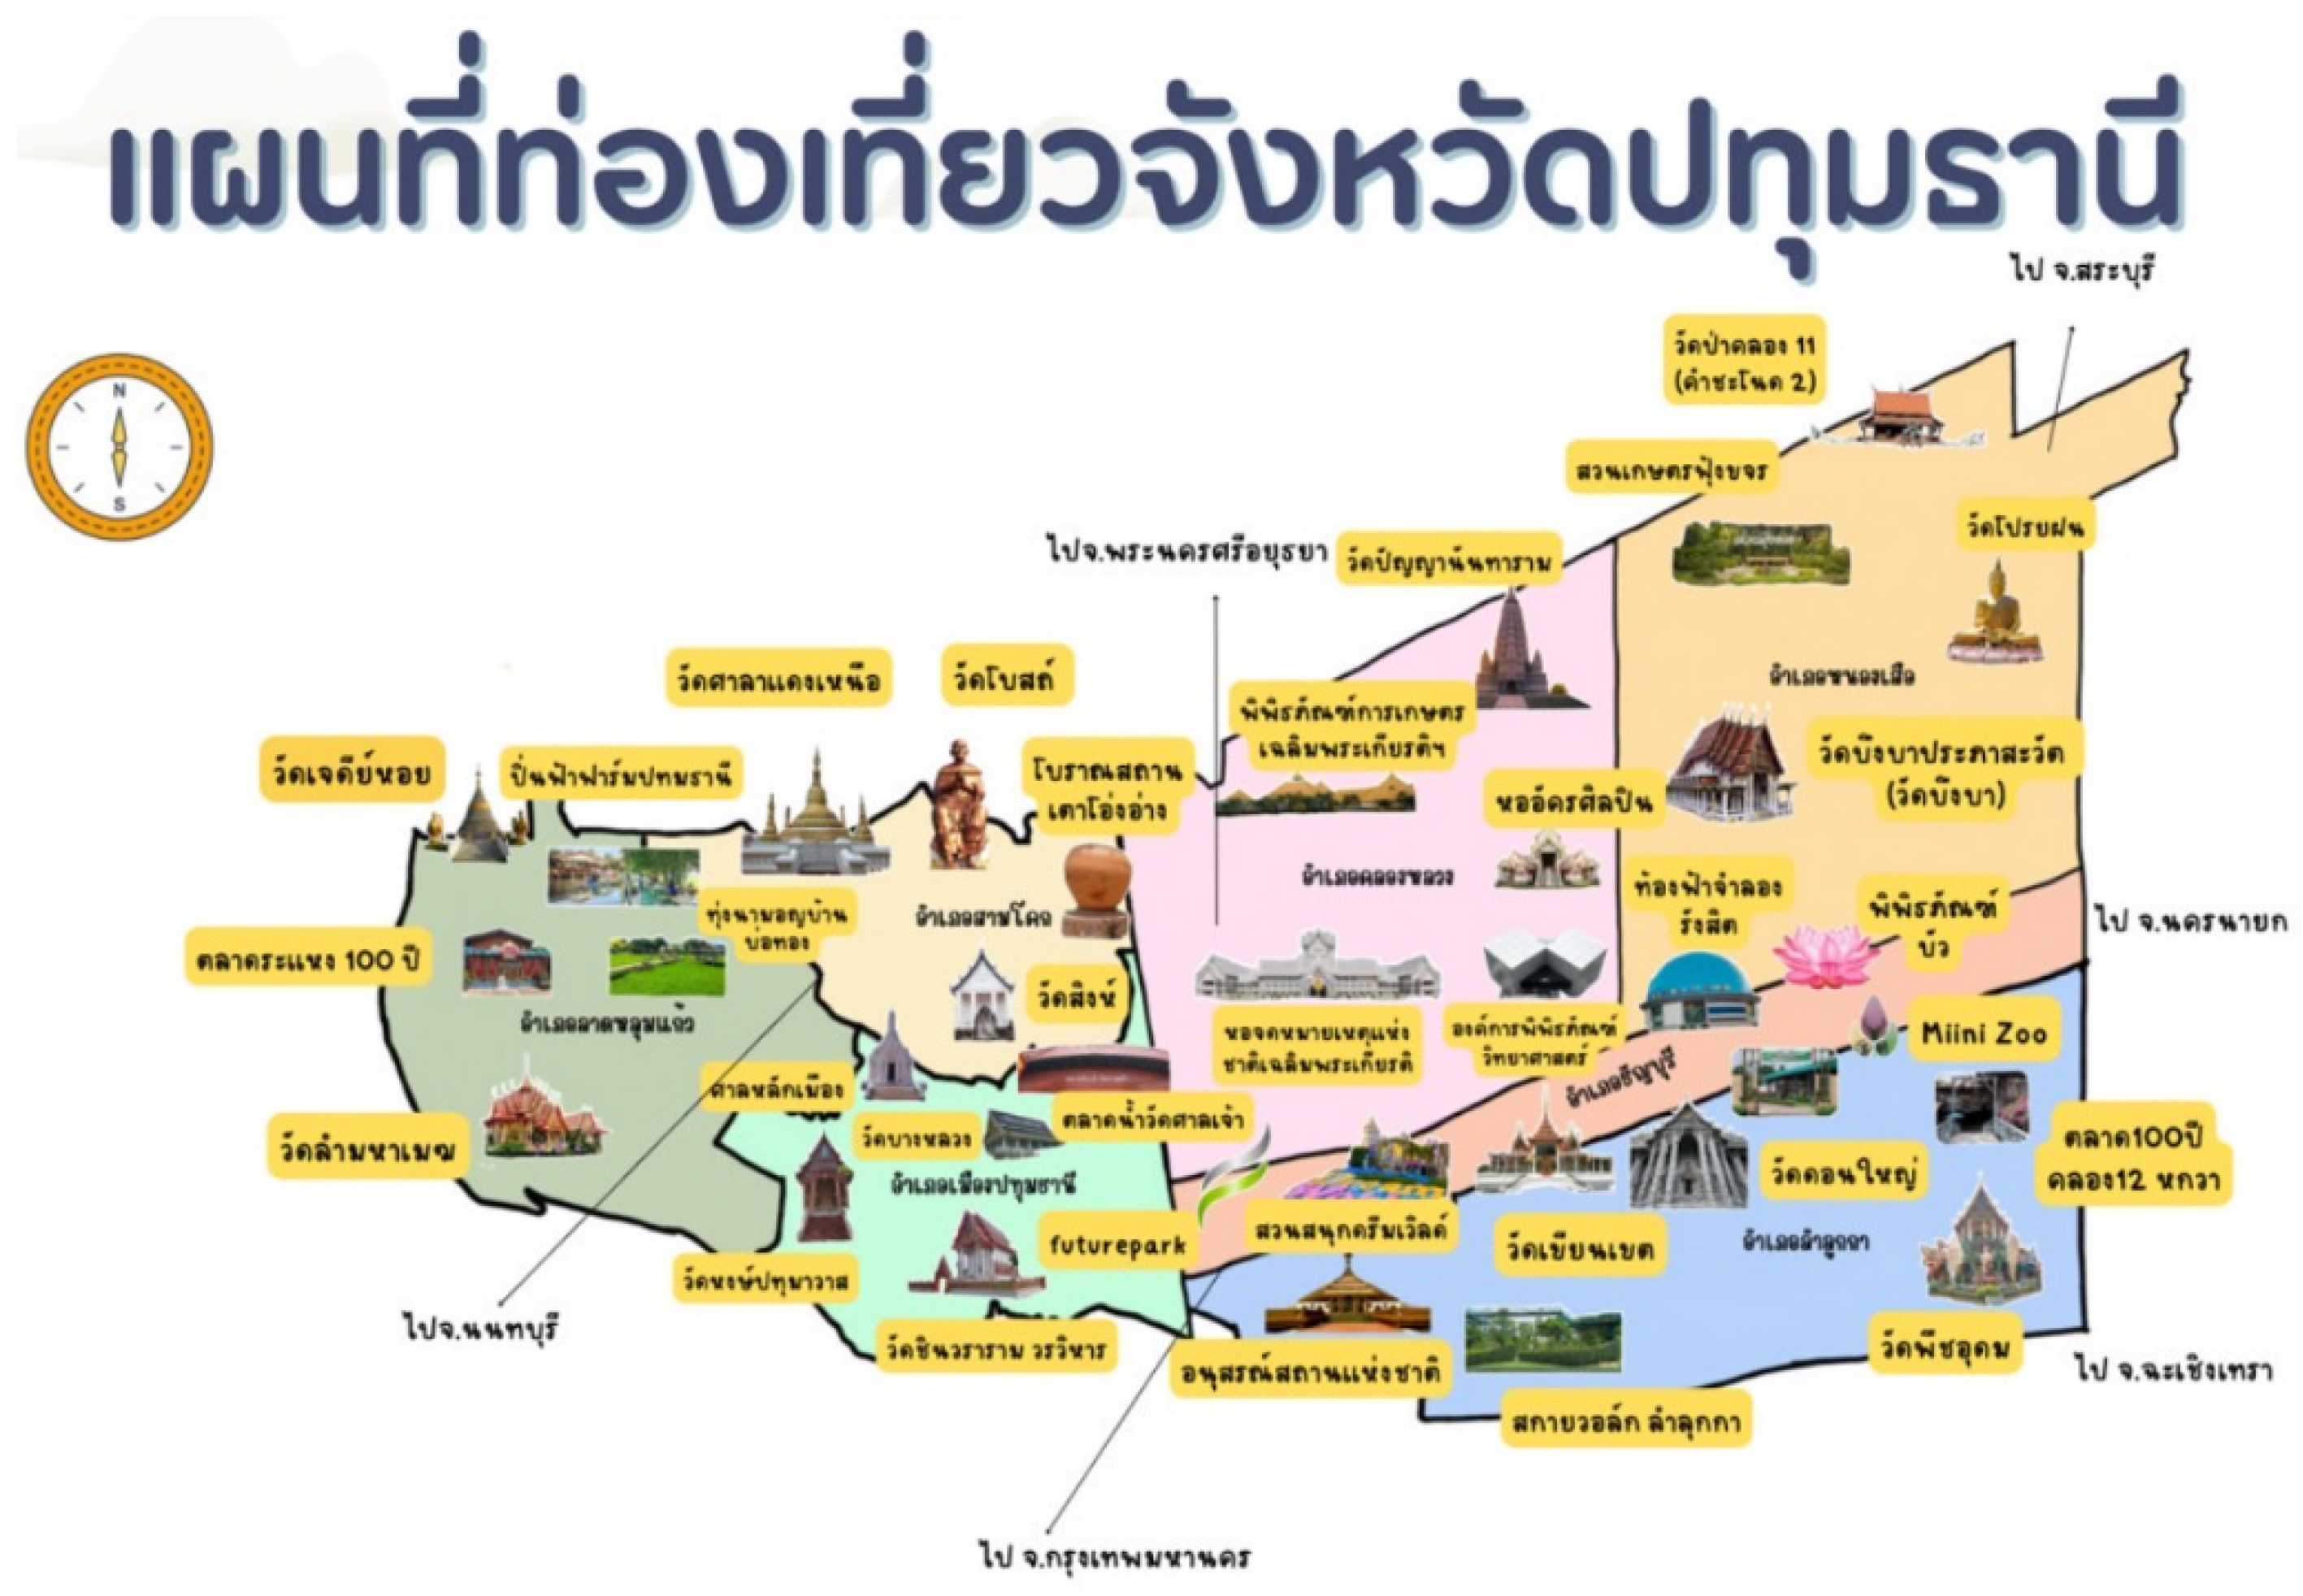
Figure 1.
Map of Tourism in Pathum Thani Province. Source: Pathum Thani Provincial Office of Tourism and Sports. (2023).
Figure 1.
Map of Tourism in Pathum Thani Province. Source: Pathum Thani Provincial Office of Tourism and Sports. (2023).
5.2. The Role of Tourism in Thailand’s Economy
Tourism is one of Thailand’s primary economic drivers, contributing immensely to national revenue and job creation. In 2022, the tourism sector generated over 1.93 trillion-baht, accounting for about 10% of the country’s GDP (Ministry of Tourism and Sports, 2022). The significance of tourism to Thailand’s economy emphasizes the need for effective logistics management to support and enhance the sector’s growth. According to Peeters et al. (2018), efficient tourism logistics can facilitate better visitor experiences and promote higher satisfaction levels, which are critical for sustained economic benefits.
From the analysis of historical data from 2018 to 2023, it is evident that the number of tourists in Pathum Thani Province has been on the rise, corresponding with the development of tourism infrastructure and readiness to accommodate visitors through improvements in logistics and public transportation systems. Particularly, during the years 2021-2022, tourism began to recover from the impacts of the COVID-19 pandemic, which affected travel and visitor numbers. However, in 2023, tourism experienced a rapid recovery (National Statistical Office, 2022).
The table below displays the projected number of tourists in Pathum Thani Province for each quarter from 2018 to 2023, showing a continuous growth trend in visitor numbers across all quarters. This growth is linked to the development of infrastructure and improvements in logistics management that align with tourist demand. Furthermore, revenue from tourism in each quarter has also increased significantly, reflecting the importance of developing and managing logistics systems in Pathum Thani to attract tourists and generate income for the local economy.
5.3. Logistics Management in Tourism
The management of logistics in tourism is crucial for ensuring that travelers have seamless experiences. Becken and Simmons (2008) assert that logistics encompasses the planning and execution of transportation, as well as the management of facilities and services related to tourism. Effective logistics management involves understanding the physical flow of tourists, the flow of information, and financial transactions to enhance visitor experiences (Piboonrungroj & Disney, 2015). Challenges such as inadequate transportation options, poor route management, and a lack of facilities can hinder tourism development and reduce visitor satisfaction (Gössling et al., 2021).
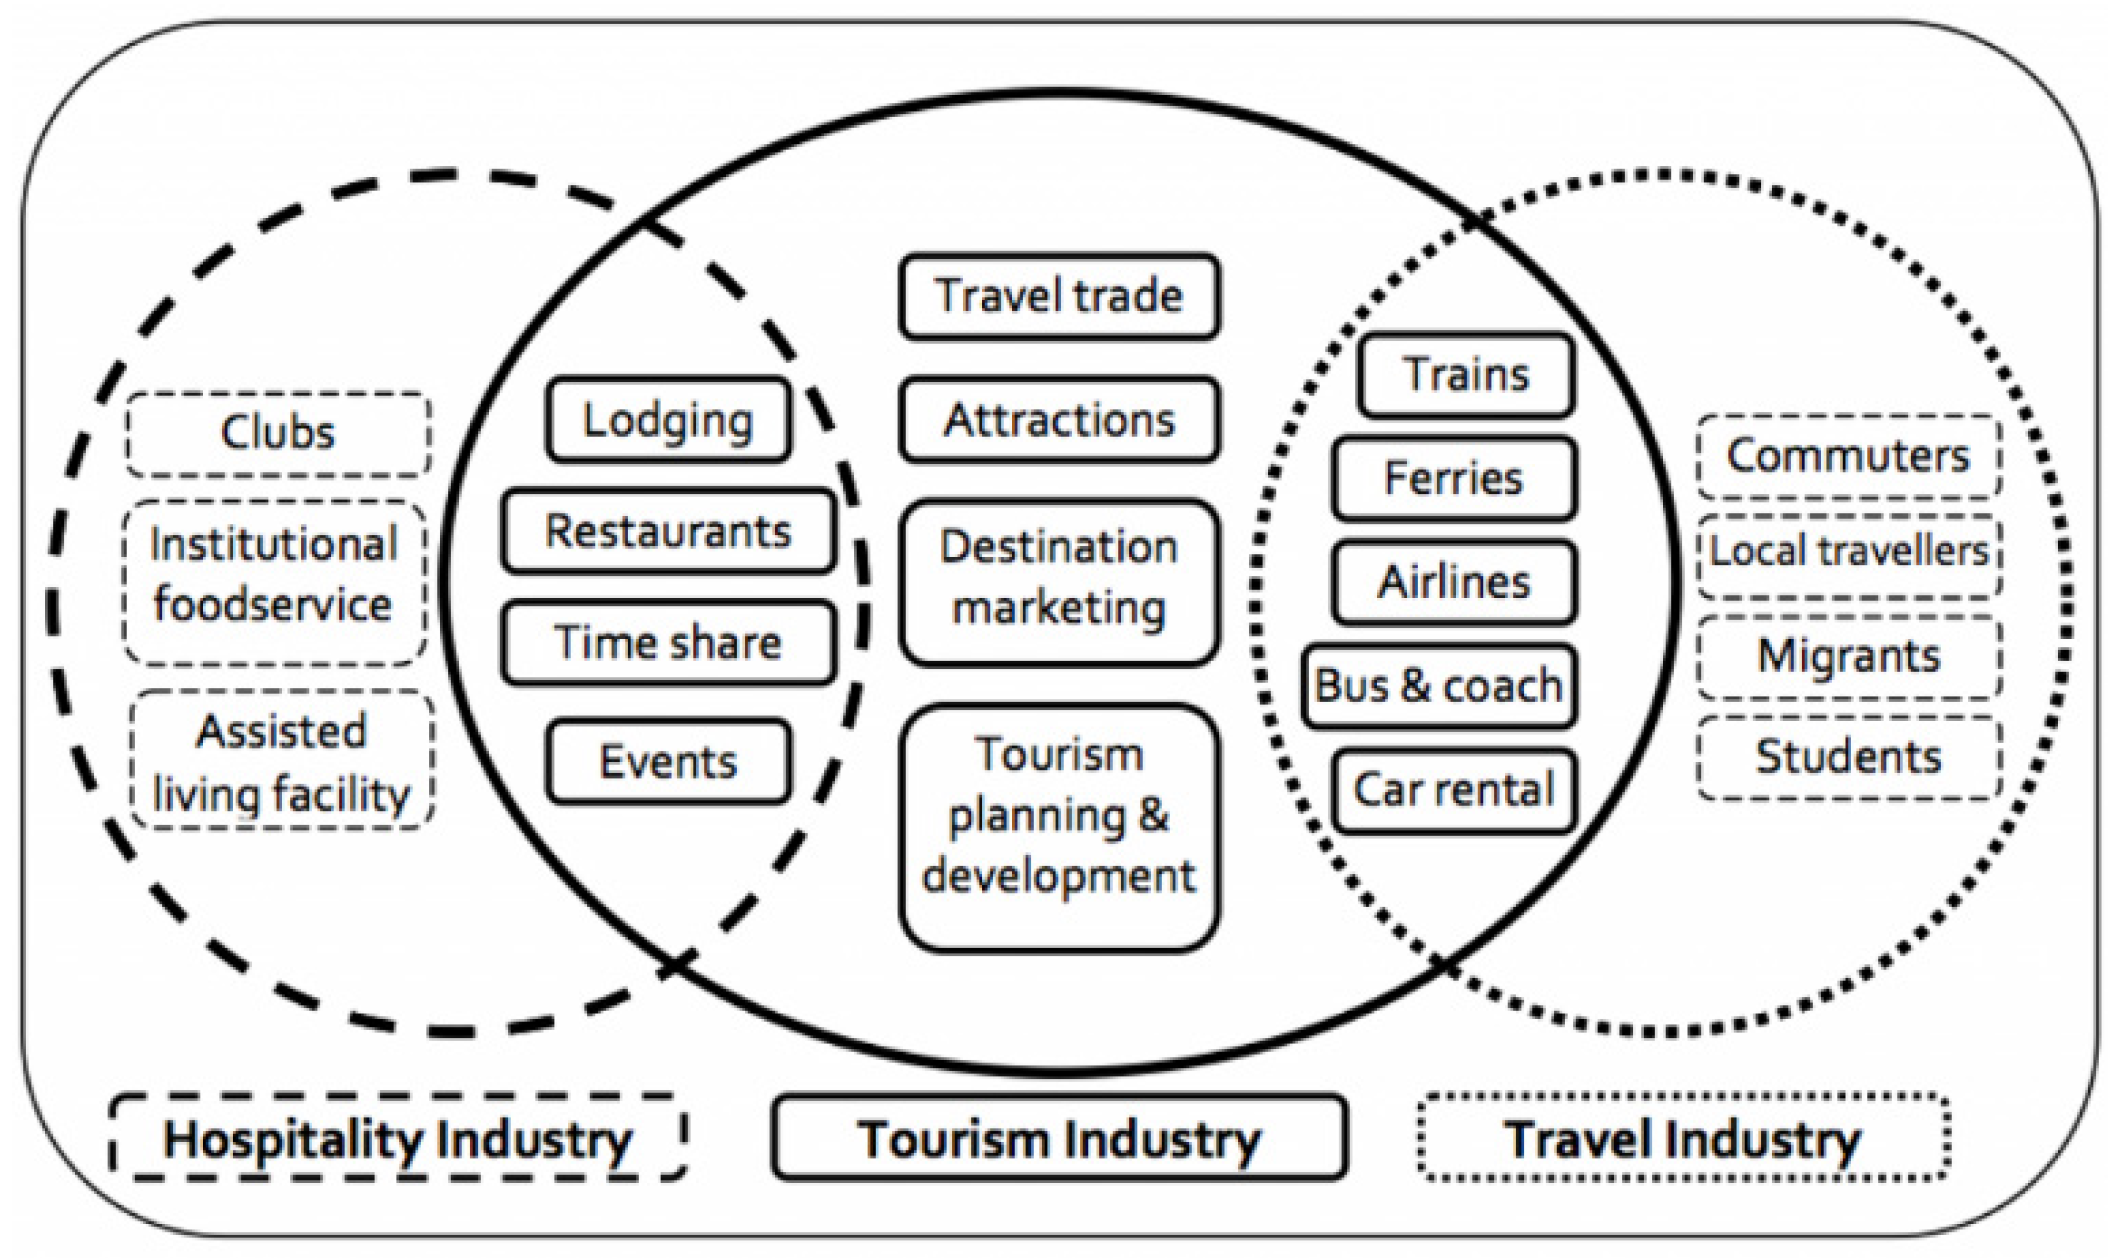
Figure 2.
The Relationship Between the Tourism, Hospitality and Travel Industries. Source: Adapted from Pizam (2009).
Figure 2.
The Relationship Between the Tourism, Hospitality and Travel Industries. Source: Adapted from Pizam (2009).
5.4. Sustainable Tourism Practices
The shift towards sustainability in tourism management has gained significant traction in recent years. Buckley (2012) emphasizes that sustainable logistics practices can mitigate environmental impacts and contribute to the conservation of natural resources. Filimonau et al. (2018) highlight the importance of adopting eco-friendly practices within logistics frameworks to ensure that tourism remains viable in the long term. The integration of clean energy transportation, efficient waste management, and community involvement in tourism activities can lead to more sustainable tourism development.
5.5. Tourist Satisfaction and Experience
Understanding what drives tourist satisfaction is vital for enhancing their overall experience. Research by Neuhofer et al. (2015) indicates that the quality of logistics services directly impacts tourists’ perceptions and satisfaction levels. By assessing factors such as accessibility, amenities, and the quality of transportation services, tourism operators can identify areas for improvement.
In addition to these factors, the satisfaction assessment model proposed by Sida Chaiyabunya (2023) provides a comprehensive framework for evaluating tourist satisfaction. This model emphasizes the importance of various dimensions, including service quality, personal experience, and emotional responses, which collectively shape tourists’ overall satisfaction.
The framework of the 4As (Attractions, Access, Amenities, and Ancillary Services), proposed by Cooper and Boniface (1998), complements Chaiyabunya’s model by offering a structured approach to evaluating the components that contribute to a positive tourist experience. By integrating insights from both models, tourism operators can develop targeted strategies that enhance logistics services and address specific areas affecting tourist satisfaction, ultimately leading to a more enjoyable and fulfilling travel experience.
5.6. Challenges in Tourism Logistics
Despite the potential for growth, many regions, including Pathum Thani, face significant challenges in logistics management. Li and Song (2019) underscore the importance of developing efficient public transportation systems and addressing infrastructure gaps to improve tourist access to attractions. The lack of integrated logistics solutions can lead to issues such as congestion, increased travel times, and diminished visitor satisfaction, ultimately affecting the overall competitiveness of a destination.
5.7. Pathum Thani’s Tourism Potential
The role of local communities in tourism development cannot be understated. Engaging community members in the planning and management processes fosters a sense of ownership and responsibility towards local resources. Research suggests that community-driven tourism initiatives can lead to more sustainable practices and improved visitor experiences (Pizam & Ellis, 1978). Encouraging local participation in tourism logistics management can enhance the quality of services offered and ensure that the benefits of tourism are shared with the community.
Pathum Thani’s diverse tourism offerings, including cultural landmarks such as Wat Bot and Wat Chedi Thong, as well as recreational sites like Dream World amusement park, present a unique opportunity for tourism development. The province’s strategic location near Bangkok enhances its attractiveness as a short getaway for both domestic and international tourists (Tourism Authority of Thailand, 2022). However, to fully realize this potential, it is imperative that Pathum Thani addresses its logistical challenges and embraces sustainable tourism practices.
The Table 1, displays the projected number of tourists in Pathum Thani Province for each quarter from 2018 to 2023, showing a continuous growth trend in visitor numbers across all quarters. This growth is linked to the development of infrastructure and improvements in logistics management that align with tourist demand. Furthermore, revenue from tourism in each quarter has also increased significantly, reflecting the importance of developing and managing logistics systems in Pathum Thani to attract tourists and generate income for the local economy.
5.8. Green Logistics Management
Green logistics management is a concept that emphasizes reducing the environmental impact of transportation that causes pollution and utilizes resources efficiently (Buckley, 2012). It focuses on developing transportation methods that decrease energy consumption and reduce carbon dioxide emissions, such as using clean energy transport systems, minimizing the use of polluting vehicles, and planning trips for maximum efficiency (Filimonau et al., 2018). Applying this concept in Pathum Thani will help mitigate the environmental impacts of tourism and create a sustainable tourism image for the province, significantly attracting tourists interested in conservation-oriented travel (Pizam & Ellis, 1978).
6. Conceptual Framework
The tourism industry is considered one of the crucial drivers of Thailand’s economy, particularly in provinces with significant tourism potential like Pathum Thani. This region has numerous natural and cultural attractions. Therefore, effective logistics management is essential to support seamless and sustainable travel and tourism services.
This research focuses on analyzing and developing logistics systems in tourism, which affect tourists’ satisfaction and experiences. It also considers various related factors such as transportation, data management, accommodation services, and local community participation in the development process to create positive and sustainable experiences for visitors.
With this conceptual framework, the study will adopt a comprehensive research approach, including logistics management, measuring tourist satisfaction, and analyzing factors influencing repeat visits by tourists. This will help establish guidelines for the sustainable development of tourism logistics in the future. Below is a more detailed explanation of the conceptual framework:
6.1. Logistics Components
This includes seven critical areas that contribute to effective logistics management:
- Physical: Infrastructure such as transportation routes and facilities that directly affect tourist access.
- Informational: Systems that provide timely and relevant information to tourists, aiding in their decision-making and navigation.
- Financial: Funding and financial resources necessary for developing and maintaining tourism logistics.
- Service: The quality and efficiency of services provided to tourists, including transportation and accommodation.
- Location: Strategic positioning of attractions and services that facilitate easy access for tourists.
- Personnel: Skilled staff who can manage logistics effectively and provide assistance to tourists.
- Facilities: Amenities that support tourists, such as rest areas and visitor centers.
6.2. Logistics Management
This aspect focuses on three main areas essential for effective tourism logistics:
- Physical of Transportation: Efficient transportation and movement of tourists and goods.
- Flow of communication and information, and the management of technology: The use of modern technologies to streamline operations and improve service delivery.
- Flow of environmental management (related to Green Logistics): Practices aimed at minimizing environmental impacts and promoting sustainable tourism.
6.3. Tourist Satisfaction
This factor is evaluated through the lens of the 4As framework (Accessibility, Attraction, Amenities, and Ancillary Services) proposed by Cooper & Boniface, as well as the satisfaction measurement concepts developed by Phanida Chaipanya. Understanding these aspects is vital for enhancing the overall experience of tourists in Pathum Thani.
6.4. Readiness of Key Tourist Attractions in Pathum Thani Province
Pathum Thani Province boasts a diverse range of attractions, including cultural and historical sites, natural attractions, commercial tourism venues, and community-based tourism. This diversity significantly influences the readiness of tourists to engage in the development of tourism in Pathum Thani. Collaborative planning with tourists and service implementation are essential for addressing their needs and enhancing the overall tourism experience.
Tourists who participate in tourism development can help identify issues and propose solutions based on their real travel experiences. For example, their feedback regarding logistics management, service quality, and various amenities can lead to improvements in the existing service quality, resulting in a better overall tourism experience.
The development of tourism logistics management in Pathum Thani comprises key components that impact its success, including physical flow, information flow, and financial flow. Physical flow refers to the movement of tourists and goods to tourist attractions, which includes transportation systems, road quality, and access to various locations. Readiness in this area is essential for ensuring that tourists feel comfortable and safe during their travels.
On the other hand, information flow involves the management of crucial data for tourism planning, including information about attractions, service bookings, and communication between service providers and tourists. Having accurate and up-to-date information will enable tourists to make better decisions, giving them confidence in choosing the available services.
Finally, financial flow is another significant factor in tourism logistics management, relating to the management of money that tourists spend, such as service fees, transportation costs, and other expenses. Effective financial management will help tourism operators improve their services and better respond to tourists’ needs.
Considering the role of tourists in these developments reflects the readiness of tourist attractions in Pathum Thani Province, including aspects such as infrastructure, management, service quality, and tourist participation. Examining these relationships will enable the research framework to highlight the connections among various components that impact the efficiency of tourism logistics management in Pathum Thani. This approach not only simplifies understanding but also encompasses all the critical issues emphasized in the original framework
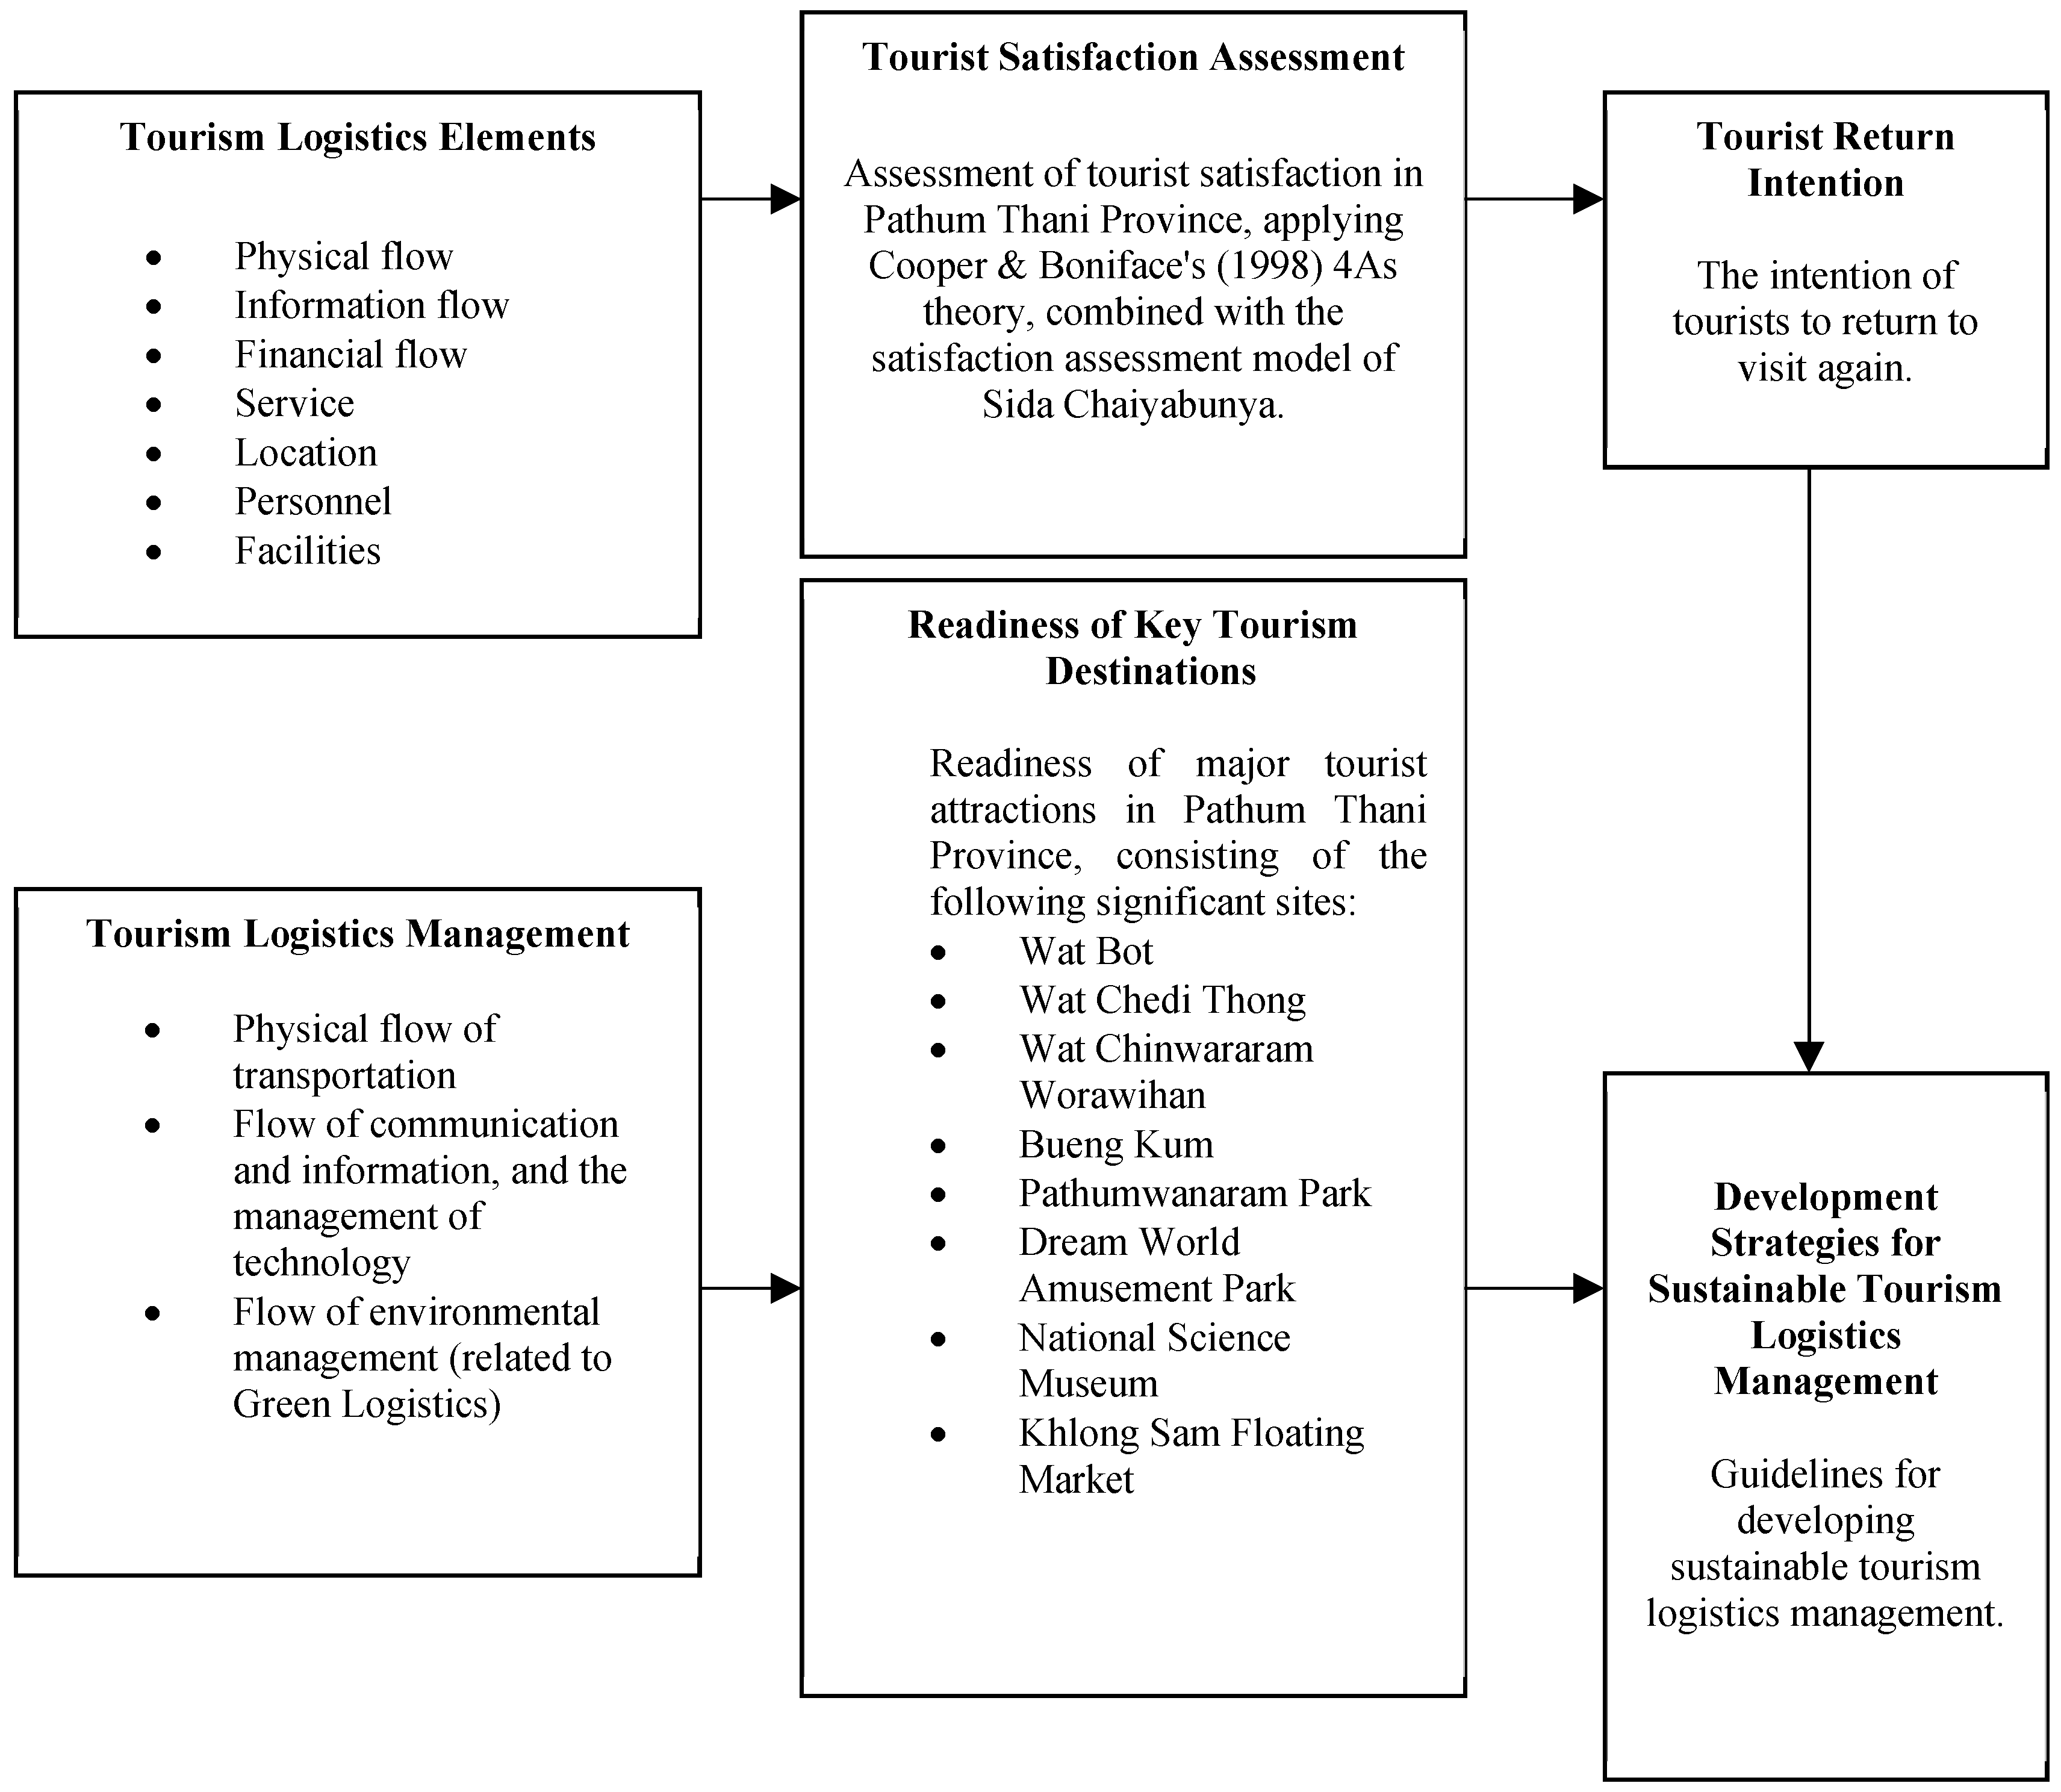
Figure 3.
Conceptual Model.
7. Research Methodology
This research focuses solely on collecting quantitative data from tourists visiting Pathum Thani Province, with the primary target group being Thai tourists. The objective is to analyze the efficiency of tourism logistics management by evaluating tourist satisfaction using structured questionnaires. The methodology is designed to ensure statistically valid results, offering insights into the logistics management challenges and areas for improvement.
7.1. Research Design
This study uses a quantitative research design, relying entirely on structured questionnaires to collect data from tourists. The focus is on gathering measurable data that reflects tourists’ perceptions, satisfaction levels, and experiences related to tourism logistics. The questionnaire will address multiple aspects of logistics management, including transportation, accessibility, facilities, and service quality.
7.2. Target Population and Sampling
The target population consists of all tourists visiting key attractions in Pathum Thani Province. This study focuses exclusively on domestic tourists to ensure a representative sample of the local tourism experience.
This study employs Accidental Sampling, where researchers will collect data from tourists who are available and willing to participate at key tourist attractions in Pathum Thani Province. The emphasis is solely on Thai tourists.
- Sample Size Determination: Based on Cochran’s formula and a target population of 100,000 tourists, the desired sample size is calculated with a 95% confidence level and a 5% margin of error. After considering statistical recommendations and feasibility, the study concludes that 400 respondents will provide sufficient data to achieve reliable results. This sample size is considered optimal to balance precision with logistical constraints.
- Stratification Criteria: The sample will be stratified based on various demographics of Thai tourists to ensure a well-rounded representation. Key tourist attractions in Pathum Thani will be used as sampling locations, including Wat Bot, Wat Chedi Thong, Wat Chinwararam Worawihan, Bueng Kum, Pathumwanaram Park, Dream World Amusement Park, National Science Museum, and Khlong Sam Floating Market.
7.3. Data Collection
Data collection will be conducted through self-administered questionnaires distributed at major tourist sites. The questionnaires will be available in both Thai and English to accommodate both domestic and international tourists.
Survey Instrument: The questionnaire is divided into two main sections:
- Demographic Information: Includes questions about the respondents’ age, gender, nationality, and purpose of visit.
- Tourism Logistics and Satisfaction: This section assesses the tourists’ satisfaction with various logistics-related factors using a 5-point Likert scale (1 = very dissatisfied, 5 = very satisfied). The key areas covered are:
- Transportation: Ease of access to tourist attractions, public transportation quality, and traffic conditions.
- Facilities: Availability and quality of tourist facilities such as restrooms, information centers, and parking.
- Accessibility: Convenience of accessing tourist sites and the efficiency of transport links between them.
- Service Quality: Tourist satisfaction with services provided, such as guided tours, assistance from staff, and information availability.
Distribution Method: The survey will be conducted on-site, with data collectors stationed at entry and exit points of tourist attractions. Respondents will be randomly selected, and participation will be voluntary. Data collection will take place over a period of two months to ensure the sample size of 400 respondents is achieved, capturing a variety of tourist experiences.
7.4. Data Analysis
After data collection, responses will be compiled and analyzed using statistical software (SPSS). The analysis will include the following steps:
- Descriptive Statistics: Mean, median, and standard deviation will be calculated to summarize tourists’ satisfaction across different logistics dimensions.
-
Inferential Statistics:
- T-tests will be used to determine if there are significant differences in satisfaction between groups (e.g., domestic vs. international tourists).
- One-way Analysis of Variance (ANOVA): Employed to compare the mean scores of three or more groups based on demographic variables such as age, income, and occupation. If the ANOVA results show statistically significant differences at the 0.05 level, further pairwise comparisons will be conducted using Scheffe’s Method to identify which specific groups differ significantly.
- Regression Analysis: Multiple regression analysis will be used to identify which logistics factors (e.g., transportation, facilities) most significantly influence overall tourist satisfaction. This will help to determine which areas require improvement to enhance the tourist experience.
7.5. Hypotheses
The research is guided by the following hypotheses regarding tourist satisfaction with tourism logistics in Pathum Thani Province:
-
Hypothesis 1 (H1): There is a significant difference in tourist satisfaction based on gender.
- Null Hypothesis (H0): Gender differences do not affect tourist satisfaction with tourism logistics in Pathum Thani.
- Alternative Hypothesis (H1): Gender differences significantly affect tourist satisfaction with tourism logistics in Pathum Thani.
- 2.
-
Hypothesis 2 (H2): There is a significant difference in tourist satisfaction based on age.
- Null Hypothesis (H0): Age differences do not affect tourist satisfaction with tourism logistics in Pathum Thani.
- Alternative Hypothesis (H1): Age differences significantly affect tourist satisfaction with tourism logistics in Pathum Thani.
- 3.
-
Hypothesis 3 (H3): There is a significant difference in tourist satisfaction based on income.
- Null Hypothesis (H0): Income differences do not affect tourist satisfaction with tourism logistics in Pathum Thani.
- Alternative Hypothesis (H1): Income differences significantly affect tourist satisfaction with tourism logistics in Pathum Thani.
- 4.
-
Hypothesis 4 (H4): There is a significant difference in tourist satisfaction based on occupation.
- Null Hypothesis (H0): Occupation differences do not affect tourist satisfaction with tourism logistics in Pathum Thani.
- Alternative Hypothesis (H1): Occupation differences significantly affect tourist satisfaction with tourism logistics in Pathum Thani.
- 5.
-
Hypothesis 5 (H5): There is a significant difference in tourist satisfaction based on region of origin (domestic vs. international tourists).
- Null Hypothesis (H0): Regional origin does not affect tourist satisfaction with tourism logistics in Pathum Thani.
- Alternative Hypothesis (H1): Regional origin significantly affects tourist satisfaction with tourism logistics in Pathum Thani.
7.6. Reliability and Validity
- Reliability: The reliability of the questionnaire will be tested using Cronbach’s alpha to measure internal consistency. In addition, the Index of Item-Objective Congruence (IOC) will be applied to evaluate the relevance of each question to the research objectives. A pilot test with 30 tourists will be conducted to refine the questionnaire and ensure clarity.
- Validity: Content validity will be ensured by having the questionnaire reviewed by experts in tourism logistics. Additionally, construct validity will be tested through exploratory factor analysis to confirm that the questions accurately measure the intended logistics components.
7.7. Ethical Considerations
- All respondents will be informed of the purpose of the study and their rights as participants. Participation will be voluntary, and anonymity will be maintained throughout the study.
- Informed consent will be obtained from all participants before they complete the survey, ensuring they understand that the data collected will be used solely for academic purposes.
7.8. Limitations of the Study
The study faces certain limitations, including:
- Non-response Bias: Some tourists may choose not to participate, which could introduce bias if certain groups (e.g., older or international tourists) are underrepresented.
- Time Constraints: Data collection is limited to two months, which may affect the ability to capture data from tourists visiting outside of peak periods.
8. Results and Data Analysis
This section presents the findings from the study on the development of sustainable tourism logistics management in Pathum Thani Province, Thailand. The analysis is organized according to the research objectives and includes descriptive statistics, satisfaction assessments, and hypothesis testing.
8.1. Demographic Profile of Respondents
The demographic data of the 400 respondents were analyzed using descriptive statistics. The key characteristics are summarized in Table 2 below:
From Table 2, the majority of tourists participating in the survey were male (54.25%), aged between 20-30 years (51.5%), and employed in the private sector (39.25%). Most respondents hailed from the Central region (61.25%) and reported a monthly income in the range of 10,001-20,000 THB (45.75%).
8.2. Travel Factors of Tourists
The analysis of travel factors is summarized in Table 3 below:
From Table 3, over 75.5% of tourists had previously traveled to Pathum Thani, with the majority preferring to travel by private car (55.25%), while 25.25% used public transport.
8.3. Satisfaction with Tourism Services
The satisfaction level was measured using average scores categorized into five levels. Table 4 summarizes the tourists’ satisfaction with services in Pathum Thani:
From Table 4, the highest satisfaction was reported for local services, particularly local tour guidance. However, the adequacy of parking was rated as moderate (3.14), indicating room for improvement.
8.4. Interest and Expectations from Tourism
Table 5 summarizes what tourists expect from visiting Pathum Thani:
From Table 5, the majority of tourists expressed interest in the beauty and integrity of nature (38.25%) and relaxation (32.25%).
8.5. Hypothesis Testing
The study tested five hypotheses regarding tourist satisfaction based on various demographic factors:
-
Hypothesis 1 (H1): There is a significant difference in tourist satisfaction based on gender.
- ○
- Test Results: A t-test showed no significant difference in satisfaction between male (Mean = 4.12, SD = 0.56) and female (Mean = 4.18, SD = 0.59) tourists (t = -0.92, p = 0.36). Therefore, the null hypothesis (H0) is not rejected, indicating that gender does not affect satisfaction levels.
From Table 6, this table reflects the average tourist satisfaction scores by gender. The result indicates that there is no significant difference in satisfaction between male and female tourists.
- 2.
-
Hypothesis 2 (H2): There is a significant difference in tourist satisfaction based on age.
- ○
- Test Results: One-way ANOVA revealed a significant difference in satisfaction across age groups (F = 5.89, p < 0.001). Post-hoc comparisons indicated that tourists aged 20-30 years reported significantly higher satisfaction compared to those aged under 20 and those aged 41-50 years.
From Table 7, this table shows the average tourist satisfaction scores across different age groups. It was found that different age groups have a statistically significant effect on tourist satisfaction in Pathum Thani Province at the 0.05 level (p<0.05), which means that varying age ranges influence the level of satisfaction in tourism
From Table 8, tourists aged 20-30 reported the highest satisfaction compared to other age groups, with significant differences observed. Conversely, tourists aged 41-50 reported the lowest satisfaction when compared to the 20-30 and 31-40 age groups.
- 3.
-
Hypothesis 3 (H3): There is a significant difference in tourist satisfaction based on occupation.
- ○
-
Test Results: One-way ANOVA showed significant differences in satisfaction levels among different occupations (F = 7.12, p < 0.001). The average satisfaction for different occupations was as follows:
- Government/State Enterprise: Mean = 4.08, SD = 0.46
- Private Sector Employee: Mean = 4.12, SD = 0.53
- Self-Employed: Mean = 3.98, SD = 0.57
- Student: Mean = 4.22, SD = 0.60
- Farmer: Mean = 4.50, SD = 0.51
- General Labor: Mean = 3.82, SD = 0.59
From Table 9, this table presents the average tourist satisfaction scores by occupation based on the One-way ANOVA test. It was found that different occupations have a statistically significant effect on satisfaction at the 0.05 level. Tourists working in the agricultural sector (farmer) reported the highest average satisfaction (Mean = 4.50), while the general labor group had the lowest average satisfaction (Mean = 3.82).
Table 10, this table displays the comparison of tourist satisfaction across different occupations using Scheffe’s test. It was found that the student group reported the highest satisfaction compared to other occupational groups, with statistically significant differences. In contrast, the general labor group had the lowest satisfaction when compared to other groups.
- 4.
-
Hypothesis 4 (H4): There is a significant difference in tourist satisfaction based on region of origin.
- ○
-
Test Results: One-way ANOVA indicated a significant difference in satisfaction based on regional origin (F = 6.74, p < 0.001). The average satisfaction levels were:
- Central Region: Mean = 4.25, SD = 0.53
- North-eastern Region: Mean = 3.95, SD = 0.62
- Northern Region: Mean = 3.90, SD = 0.57
- Southern Region: Mean = 4.10, SD = 0.58
Table 11, this table presents the average tourist satisfaction by region of origin and shows that tourists from the Central Region have the highest satisfaction, while those from the Northern Region report the lowest satisfaction.
Table 12, this table provides a comparison of tourist satisfaction by region of origin using Scheffe’s test. Tourists from the Central Region had significantly higher satisfaction compared to other regions, while those from the Northern Region had the lowest satisfaction.
- 5.
-
Hypothesis 5 (H5): There is a significant difference in tourist satisfaction based on monthly income.
- ○
-
Test Results: One-way ANOVA revealed significant differences in satisfaction levels based on monthly income (F = 8.234, p < 0.001). The average satisfaction was:
- No Income: Mean = 4.10, SD = 0.512
- 5,000 – 10,000 THB: Mean = 3.75, SD = 0.638
- 10,001 – 20,000 THB: Mean = 4.45, SD = 0.525
- More than 20,000 THB: Mean = 4.20, SD = 0.488
Table 13, it is observed that the group with a monthly income of 10,001-20,000 THB reported the highest satisfaction (Mean = 4.45), while the group with a monthly income of 5,000-10,000 THB exhibited the lowest satisfaction (Mean = 3.75).
Table 14, it can be observed that the group with a monthly income of 10,001 – 20,000 THB reported the highest satisfaction compared to other income groups, indicating statistically significant differences, while the group with a monthly income of 5,000 – 10,000 THB exhibited the lowest satisfaction when compared to groups with higher incomes.
8.6. Summary of Results
The analysis provides key insights into the factors influencing tourist satisfaction with tourism logistics in Pathum Thani. Significant differences were found based on age, occupation, region of origin, and income. Specifically:
- Gender: There were no significant differences in satisfaction levels based on gender.
- Age: Tourists aged 20-30 reported the highest satisfaction levels, indicating that this age group may have more positive experiences than others.
- Occupation: Students and farmers had the highest satisfaction scores compared to other occupations.
- Region of Origin: Tourists from the Central region reported the highest satisfaction.
- Income: The highest satisfaction was reported by tourists earning between 10,001 and 20,000 THB.
These findings suggest that while gender does not significantly affect satisfaction, age, occupation, and income are critical factors, highlighting the need for targeted improvements in tourism logistics to enhance experiences for different tourist demographics.
9. Summary, Conclusion, and Recommendation
9.1. Summary
This research aimed to develop strategies for enhancing sustainable tourism logistics management in Pathum Thani Province, Thailand. The study focused on three primary objectives:
- To propose strategies to enhance the tourism value of Pathum Thani
The findings revealed that Pathum Thani has a diverse range of attractions, both natural and cultural, which have significant potential to attract more tourists. For instance, 61.25% of the respondents were from the Central region, indicating a strong local interest. By developing sustainable tourism logistics management strategies, such as improving public transportation systems, fostering collaboration among stakeholders, and enhancing service quality, the region can increase its tourism value. Research by Kwan and Weng (2017) emphasized the importance of effective logistics management in enhancing tourist experiences, which aligns with the need for improved accessibility and service quality in Pathum Thani.
- 2.
- To assess the satisfaction of tourists who have visited Pathum Thani
The survey results indicated that 75.5% of tourists had previously visited Pathum Thani, with the majority using private vehicles (55.25%) for travel. Overall satisfaction levels were high, particularly concerning services provided by locals, which received an average score of 4.22 (on a scale of 1 to 5). Research conducted by Ali et al. (2020) demonstrated that high levels of service quality positively correlate with tourist satisfaction, supporting the finding that local services significantly contribute to tourists’ overall experiences. The study also highlighted various factors affecting satisfaction, such as age, occupation, and income, which displayed significant differences.
- 3.
- To offer recommendations for the development of sustainable tourism logistics in Pathum Thani
The analysis identified critical issues in tourism logistics management, including accessibility to attractions, service adequacy, and lack of accurate information regarding travel and attractions. It was noted that 25.25% of tourists used public transport, indicating room for improvement in transport options. Recommended improvements include enhancing public transport systems, focusing on shuttle services to key attractions, which could cater to the needs of the 55.25% of tourists who currently rely on private vehicles. The findings are consistent with the recommendations made by Ghimire (2018), which emphasize the necessity of efficient transportation systems in boosting tourist satisfaction and supporting sustainable tourism practices.
9.2. Conclusion
This study concludes that sustainable tourism logistics management is vital for enhancing tourist experiences in Pathum Thani Province. The significant differences in satisfaction levels based on age, occupation, and income emphasize the need for targeted strategies to cater to diverse tourist demographics. For example, the results showed that tourists with a monthly income between 10,001 and 20,000 THB had the highest satisfaction levels (Mean = 4.45), while those earning 5,000 to 10,000 THB reported the lowest (Mean = 3.75).
Research by Chen et al. (2019) found similar patterns, indicating that economic factors significantly influence tourist satisfaction. The analysis of logistical challenges indicates that addressing issues related to accessibility, service quality, and information dissemination is crucial for improving the overall tourism experience in Pathum Thani. Effective management of these factors can lead to higher satisfaction levels and promote repeat visits.
9.3. Recommendations
Based on the findings, the following recommendations are proposed to improve tourism logistics management in Pathum Thani:
- Enhance Public Transportation Accessibility: Develop efficient public transport systems, such as shuttle services connecting major attractions, to cater to the 75.5% of tourists who have visited before. Improving signage and travel information will facilitate easier access for tourists without private vehicles. Previous studies have shown that improved transportation options can lead to increased tourist satisfaction (Kwan & Weng, 2017).
- Improve Service Quality: Train local personnel to provide high-quality service, emphasizing communication and hospitality. Upgrading facilities, such as clean and adequate restrooms, is essential; the average cleanliness score of 4.10 highlights the need for improvement in this area. According to Ali et al. (2020), service quality is a critical determinant of tourist satisfaction.
- Increase Information Dissemination: Implement diverse marketing strategies using digital platforms and social media to raise awareness of Pathum Thani’s attractions. Develop a user-friendly mobile application to provide tourists with essential information about attractions, travel routes, and services. Research by Ghimire (2018) supports the notion that effective communication and information dissemination can enhance the tourist experience.
- Foster Collaboration Among Stakeholders: Encourage partnerships between local businesses, government agencies, and community organizations to create comprehensive tourism packages that enhance visitor experiences.
- Focus on Sustainable Practices: Promote eco-friendly tourism initiatives, such as reducing plastic waste and conserving natural resources, to ensure the long-term sustainability of the province’s tourism sector.
- Conduct Regular Satisfaction Surveys: Continuously monitor tourist satisfaction and gather feedback to identify areas for improvement. The study revealed various satisfaction levels based on demographics, indicating the importance of adapting strategies to meet the changing needs of visitors.
By implementing these recommendations, Pathum Thani Province can enhance its tourism logistics management, thereby increasing tourist satisfaction, attracting more visitors, and ultimately contributing to the local economy’s growth. The overall findings underscore the importance of addressing logistical challenges and improving service quality to create a sustainable tourism environment.
Acknowledgements
I would like to express my heartfelt gratitude to all those who contributed to the successful completion of this research study on sustainable tourism logistics management in Pathum Thani Province, Thailand. I would also like to thank the faculty and staff of North Bangkok University Thailand for providing the resources and facilities necessary for conducting this research. Their assistance made the entire process smoother and more manageable. Special thanks go to all the participants who took the time to complete the surveys and share their experiences. Your input was crucial in providing valuable insights into the tourism logistics situation in Pathum Thani. Additionally, I acknowledge the support of my fellow colleagues and friends for their encouragement and constructive feedback during various stages of this research. Finally, I am deeply grateful to my family for their unwavering support and understanding throughout this journey. Your love and encouragement have been a constant source of motivation.
References
- Ali, F., Kim, W. G., & Ryu, K. (2020). The effects of service quality on tourist satisfaction: A case study of Pathum Thani. Journal of Tourism Research, 35(1), 15-28.
- Becken, S., & Simmons, D. G. (2008). Tourism and climate change: Risks and opportunities. Channel View Publications.
- Buckley, R. (2012). Sustainable tourism: Research and reality. Annals of Tourism Research, 39(2), 528-546. [CrossRef]
- Buhalis, D., & Law, R. (2008). Progress in information technology and tourism management: 20 years on and 10 years after the internet—The state of eTourism research. Tourism Management, 29(4), 609-623. [CrossRef]
- Chaiyabunya, S. (2023). A comprehensive model for assessing tourist satisfaction: Integrating service quality, personal experience, and emotional responses. Journal of Tourism Research, 45(3), 278-295.
- Chen, M. H., & Chang, Y. S. (2019). The impact of economic factors on tourist satisfaction: Evidence from Pathum Thani Province. Sustainability, 11(3), 675.
- Christopher, M. (2016). Logistics and supply chain management. Pearson.
- Cooper, C., & Boniface, B. (1998). Tourism: The principles and practice. Addison Wesley Longman.
- Department of Local Administration. (2023). Pathum Thani Province Information. Retrieved from https://www.dopa.go.th.
- Dubois, G., Peeters, P., Ceron, J. P., & Gössling, S. (2011). The future tourism mobility of the world population: Emission growth versus climate policy. Transportation Research Part A: Policy and Practice, 45(10), 1031-1042. [CrossRef]
- Filimonau, V., Dickinson, J., Robbins, D., & Reddy, H. (2018). A critical review of research into tourism and the environment: Launching the annals of tourism research curated collection on tourism and the environment. Annals of Tourism Research, 71, 31-44. [CrossRef]
- Ghimire, K. B. (2018). Tourism logistics: Bridging the gap between service quality and sustainability. International Journal of Tourism Research, 20(1), 35-49.
- Gössling, S., & Hall, C. M. (2021). Sustainable tourism and resource use: A growing dilemma. Tourism Geographies, 23(2), 323-346. [CrossRef]
- Jirayuth Panyadee. (2016). Logistics management in rural areas of the Northeast: Accessing natural tourism resources. Logistics Management Journal, 12(3), 45-62.
- Kulpassorn Sutthathum. (2019). Logistics management in Khao Yai National Park: Using digital technology to promote tourism. Technology and Tourism Journal, 8(1), 89-105.
- Kwan, W., & Weng, Y. (2017). The role of logistics management in enhancing tourism experiences. Tourism Management, 60, 30-37.
- Li, G., & Song, H. (2019). Does tourism demand follow the oil prices? Evidence from China’s inbound tourism. Tourism Management, 70, 289-300. [CrossRef]
- Lumsdon, L. M., & Page, S. J. (2004). Tourism and transport: Issues and agenda for the new millennium. Elsevier. [CrossRef]
- Ministry of Tourism and Sports. (2022). Tourism statistics report. Bangkok: National Tourism Policy and Planning Office.
- Neuhofer, B., Buhalis, D., & Ladkin, A. (2015). Smart technologies for personalized experiences: A case study in the hospitality domain. Electronic Markets, 25(3), 243-254. [CrossRef]
- National Statistical Office. (2023). Tourism statistics report in Pathum Thani Province. Retrieved from https://www.nso.go.th.
- Peeters, P., Gössling, S., & Becken, S. (2018). Innovation in sustainable tourism transport. In The Routledge Handbook of Tourism and the Environment (pp. 497-505). Routledge.
- Phanida Chaipanya. (2019). Assessment of cultural tourist satisfaction in Thailand. Thai Tourism Journal, 5(1), 85-100.
- Piboonrungroj, P., & Disney, S. (2015). Supply chain collaboration in tourism: A case study of Thailand. Journal of Tourism Futures, 1(1), 14-30. [CrossRef]
- Pizat, A. (2009). The global financial crisis and its impact on the hospitality industry. International Journal of Hospitality Management, 28(3), 301-303. [CrossRef]
- Pizam, A., & Ellis, T. (1978). Customer satisfaction and its measurement in hospitality enterprises. International Journal of Contemporary Hospitality Management, 11(7), 326-339. [CrossRef]
- Weaver, D. B., & Oppermann, M. (2000). Tourism management. John Wiley & Sons.
- Zolfani, S. H., Sedaghat, M., Maknoon, R., & Zavadskas, E. K. (2015). Sustainable tourism: A comprehensive literature review on frameworks and applications. Sustainability, 7(7), 8495-8520. [CrossRef]

Table 1.
The number of tourists visiting Pathum Thani Province in each quarter from 2018 to 2023.
| Tourists 2023 | Tourists 2022 | Tourists 2021 | Tourists 2020 | Tourists 2019 | Tourists 2018 | Growth (%) | Tourism Revenue 2023 (Million Baht) | |
|---|---|---|---|---|---|---|---|---|
| Q1 | 1,200,000 | 1,000,000 | 800,000 | 400,000 | 1,300,000 | 1,250,000 | 5% | 2,500 |
| Q2 | 1,300,000 | 1,100,000 | 750,000 | 300,000 | 1,400,000 | 1,350,000 | 3.70% | 2,700 |
| Q3 | 1,250,000 | 950,000 | 700,000 | 250,000 | 1,350,000 | 1,300,000 | 3.80% | 2,600 |
| Q4 | 1,350,000 | 1,050,000 | 900,000 | 500,000 | 1,450,000 | 1,400,000 | 4% | 2,800 |
Source: Tourism Authority of Thailand (2023); National Statistical Office (2022).
Table 2.
Number of Tourists and Percentage by Demographic Factors.
| Detail | Number (People) | Percentage |
| Gender | ||
| Male | 217 | 54.25% |
| Female | 183 | 45.75% |
| Total | 400 | 100% |
| Age | ||
| Under 20 years | 38 | 9.5% |
| 20-30 years | 206 | 51.5% |
| 31-40 years | 84 | 21% |
| 41-50 years | 45 | 11.25% |
| Over 51 years | 27 | 6.75% |
| Total | 400 | 100% |
| Occupation | ||
| Government/State Enterprise | 52 | 13% |
| Private Sector Employee | 157 | 39.25% |
| Self-Employed | 88 | 22% |
| Student | 61 | 15.25% |
| Farmer | 10 | 2.5% |
| General Labor | 32 | 8% |
| Total | 400 | 100% |
| Region of Origin | ||
| Central Region | 245 | 61.25% |
| Northeastern Region | 47 | 11.75% |
| Northern Region | 34 | 8.5% |
| Southern Region | 46 | 11.5% |
| Others | 28 | 7% |
| Total | 400 | 100% |
| Monthly Income | ||
| No Income | 47 | 11.75% |
| 5,000-10,000 THB | 69 | 17.25% |
| 10,001-20,000 THB | 183 | 45.75% |
| More than 20,000 THB | 101 | 25.25% |
| Total | 400 | 100% |
Table 3.
Number of Tourists and Percentage by Travel Factors.
| Detail | Number (People) | Percentage | S.D. |
| Have you travelled to Pathum Thani before? | |||
| Yes | 302 | 75.5% | 0.43 |
| No | 98 | 24.5% | 0.32 |
| Total | 400 | 100% | |
| Mode of Travel | |||
| Tour | 50 | 12.5% | 0.21 |
| Private Car | 221 | 55.25% | 0.41 |
| Public Transport | 101 | 25.25% | 0.35 |
| Other | 28 | 7% | 0.12 |
| Total | 400 | 100% | |
| Overnight Stay | |||
| Stayed Overnight | 312 | 78% | 0.46 |
| Did Not Stay Overnight | 88 | 22% | 0.29 |
| Total | 400 | 100% | |
| Source of Information about Attractions | |||
| Television | 82 | 20.5% | 0.23 |
| Magazine | 125 | 31.25% | 0.31 |
| Internet | 151 | 37.75% | 0.38 |
| Other | 42 | 10.5% | 0.18 |
| Total | 400 | 100% |
Table 4.
Satisfaction Levels of Tourists in Pathum Thani.
| Detail | Mean Score | Satisfaction Level |
| Service by Local People | ||
| Local tour services | 4.22 | Highest |
| Care and assistance from locals | 4.15 | High |
| Tourism Services | ||
| Convenience and safety in travel | 4.05 | High |
| Adequacy of parking | 3.14 | Moderate |
| Cleanliness of restrooms and facilities | 4.10 | High |
| Shops and Services | ||
| Variety in payment methods | 4.18 | High |
| Promotions and incentives from shops | 4.00 | High |
Table 5.
Tourist Expectations from Visiting Pathum Thani.
| Detail | Number (People) | Percentage | S.D. |
| Knowledge of natural resource conservation/tourist information | 87 | 21.75% | 0.22 |
| Beauty and integrity of nature | 153 | 38.25% | 0.40 |
| Relaxation in a pleasant atmosphere and fresh air | 129 | 32.25% | 0.35 |
| Convenience, cleanliness, and safety of locations | 76 | 19% | 0.27 |
| Friendly and hospitable service from staff | 54 | 13.5% | 0.18 |
| Additional information about nearby attractions | 46 | 11.5% | 0.15 |
| Total | 400 | 100% |
Table 6.
Tourist Satisfaction by Gender.
| Gender | Number (n) | Mean | SD | t | Sig. |
| Male | 217 | 4.12 | 0.56 | ||
| Female | 183 | 4.18 | 0.59 | -0.92 | 0.36 |
Table 7.
Tourist Satisfaction by Age.
| Age Group | Number (n) | Mean | SD | F | Sig. |
|---|---|---|---|---|---|
| Under 20 years | 38 | 4.20 | 0.61 | ||
| 20-30 years | 206 | 4.22 | 0.55 | ||
| 31-40 years | 84 | 4.05 | 0.58 | 5.89 | 0.001* |
| 41-50 years | 45 | 3.87 | 0.60 | ||
| Over 51 years | 27 | 3.95 | 0.57 |
Table 8.
Comparison of Satisfaction Levels by Age (Scheffe).
| Age Group | Under 20 | 20-30 | 31-40 | 41-50 | Over 51 |
| Under 20 | - | 0.05* | 0.03* | 0.10* | 0.02* |
| 20-30 | - | - | 0.02* | 0.15* | 0.04* |
| 31-40 | - | - | - | 0.07* | 0.10 |
| 41-50 | - | - | - | - | 0.03* |
| Over 51 | - | - | - | - | - |
Note: p<0.05
Table 9.
Tourist Satisfaction by Occupation.
| Occupation | Number (n) | Mean | SD | F | Sig. |
| Government/State Enterprise | 52 | 4.08 | 0.46 | ||
| Private Sector Employee | 157 | 4.12 | 0.53 | 7.12 | 0.001* |
| Self-Employed | 88 | 3.98 | 0.57 | ||
| Student | 61 | 4.22 | 0.60 | ||
| Farmer | 10 | 4.50 | 0.51 | ||
| General Labor | 32 | 3.82 | 0.59 |
Table 10.
Comparison of Tourist Satisfaction by Occupation (Scheffe’s Test).
| Occupation | Government/State Enterprise | Private Sector Employee | Self-Employed | Student | Farmer | General Labor |
| Government/State Enterprise | - | 0.01* | 0.03* | 0.02* | 0.00* | 0.10 |
| Private Sector Employee | - | - | 0.02* | 0.04* | 0.03* | 0.05* |
| Self-Employed | - | - | - | 0.05* | 0.10 | 0.01* |
| Student | - | - | - | - | 0.03* | 0.15 |
| Farmer | - | - | - | - | - | 0.02* |
| General Labor | - | - | - | - | - | - |
Note: p<0.05
Table 11.
Tourist Satisfaction by Region of Origin.
| Region | Number (n) | Mean | SD | F | Sig. |
|---|---|---|---|---|---|
| Central Region | 245 | 4.25 | 0.53 | ||
| North-eastern Region | 47 | 3.95 | 0.62 | 6.74 | 0.001* |
| Northern Region | 34 | 3.90 | 0.57 | ||
| Southern Region | 46 | 4.10 | 0.58 | ||
| Others | 28 | 4.05 | 0.54 |
Table 12.
Comparison of Tourist Satisfaction by Region of Origin (Scheffe’s Test).
| Region | Central Region | Northern Region | Southern Region | North-eastern Region | Others |
|---|---|---|---|---|---|
| Central Region | - | 0.05* | 0.02* | 0.10* | 0.03* |
| Northern Region | - | - | 0.04* | 0.12 | 0.05* |
| Southern Region | - | - | - | 0.01* | 0.02* |
| North-eastern Region | - | - | - | - | 0.03* |
| Others | - | - | - | - | - |
Note: p<0.05.
Table 13.
Tourist Satisfaction by Monthly Income.
| Monthly Income | Number (n) | Mean | S.D. | F | Sig. |
| No Income | 47 | 4.10 | 0.512 | ||
| 5,000 – 10,000 THB | 69 | 3.75 | 0.638 | ||
| 10,001 – 20,000 THB | 183 | 4.45 | 0.525 | 8.234 | 0.000* |
| More than 20,000 THB | 101 | 4.20 | 0.488 |
Note: p<0.05.
Table 14.
Comparison of Satisfaction by Monthly Income (Scheffe).
| Monthly Income | No Income | 5,000 – 10,000 THB | 10,001 – 20,000 THB | More than 20,000 THB |
| No Income | - | 0.02* | 0.01* | 0.03* |
| 5,000 – 10,000 THB | - | - | 0.03* | 0.01* |
| 10,001 – 20,000 THB | - | - | - | 0.05* |
| More than 20,000 THB | - | - | - | - |
Note: p<0.05.
Disclaimer/Publisher’s Note: The statements, opinions and data contained in all publications are solely those of the individual author(s) and contributor(s) and not of MDPI and/or the editor(s). MDPI and/or the editor(s) disclaim responsibility for any injury to people or property resulting from any ideas, methods, instructions or products referred to in the content. |
© 2024 by the authors. Licensee MDPI, Basel, Switzerland. This article is an open access article distributed under the terms and conditions of the Creative Commons Attribution (CC BY) license (http://creativecommons.org/licenses/by/4.0/).
Copyright: This open access article is published under a Creative Commons CC BY 4.0 license, which permit the free download, distribution, and reuse, provided that the author and preprint are cited in any reuse.


