Submitted:
10 October 2024
Posted:
14 October 2024
You are already at the latest version
Abstract
The deterioration of living conditions is highlighting the benefits of urban greenery for creating sustainable cities. Using Washington D.C. as a case, we demonstrate the performance of GVI and examine disparities in greening surrounding affordable housing. With the pre-trained segmentation model, we generated GVI based on 54,691 Street View images and applied the Spearman’s correlation analysis to examine LST cooling effect. We found that LST shows significant negative correlations (p<0.001) with GVI and newly developed GVI-3D with coefficients of -0.60 and -0.73. The distribution of GVI in residential zoning was polarised, affordable housing projects have less greenery. In conclusion, we argue that it is of practical significance to monitor GVI instead of large scale NDVI for urban environments due to its controllability and human-centric attributes.
Keywords:
green view index
; temperature mitigation
; street greenery
; environmental justice
; image semantic segmentation
; google street view image
1. Introduction
Our human society just experienced the warmest decade on record between 2011 and 2020 [51]. For the global majority living in cities, urban heat islands represent an issue for both livability and health. Given the heat-absorbing properties of greenery, researcher have developed a range of vegetation-related indices to examine the climate change mitigation potentials such as Normalised Difference Vegetation Index (NDVI) [8,56], and examine distributional equity such as park areas [41], while they are all plat 2-dimensional indices which cannot drill down to accurate small-scale space analysis and vertical vegetation detection. The Green View Index (GVI) [34,53] provided a refined and 3-dimensional metric for quantifying urban greenery by authentically simulating pedestrian’s visual experience and perception, thus reflecting the actual exposure of humans to greenery [7]. Advances in computer vision and image processing tools now make it more feasible to examine the impact of GVI on urban environments. In this paper, we add to the literature by measuring the relationship between urban green space and land surface temperature (LST). Using Washington D.C. as a case, we demonstrate the performance of the GVI, and use it to examine disparities in urban greening surrounding affordable housing.
2. Literature Review
Urban Heat Island (UHI) effect is the thermal aggregation issue coming with urbanisation and industrialisation, which leads to increased human health risks [20] and influences socioeconomic development [43]. In the 21st century, an increasingly urbanised population over 3 billion are directly exposed to UHI in worldwide [43]. Simultaneously, cities’ physical environment and spatial structure [5,13,46] greatly influence the distribution of UHI causing environmental justice issue where different groups suffer distinctly due to their locations, greenery environment around housing and demographic characteristics. Affluent neighbourhoods, high-income groups and the white population in United States [19,22,39] were widely considered to have environmental advantages and low heat exposure risks, while the vulnerable populations suffer more.
Even though a large amount of greenery indices were invented [1,23] to respond the UHI exposure problems based on different criteria, “the most widely used index remains the NDVI” [1] (p.114). The impact of significant greenery index NDVI on the urban environment, especially the thermal environment was meticulously examined by many scholars. Lo, C. P. et al. (1997) verified that irradiance with an emphasis on commercial and services land cover contributed to the development of urban heat islands, he found there was a negative correlation between NDVI and irradiance of different land covers [36]. In addition, Li, J. et al. (2011), Grover, A. & Singh, R. (2015), Jamei, Y. et al. (2019), and Chakraborty, T. et al. (2020) all concluded that NDVI, in conjunction with other built environment indices can significantly predict Land Surface Temperature (LST) on the regional scale [6,17,26,31].
In contrast, GVI, after the automatic extraction and calculation method revolution by Li, X. et al. (2015), as an emergent index measuring urban vegetation in three dimensions, only limited research investigated its impact on the urban environment [34]. Sabedotti, M. E. S. et al. (2023) examined the association between GVI and air pollution such as PM 2.5, nitrogen dioxide, and carbon dioxide, and found an interquartile range increase of GVI can contribute to a 7.4 percent decrease in NO2 [44]. Other scholars scrutinised the relationships between GVI and greenery accessibility and environmental justice [32,34], human recreational behaviours [38,49], walking time [27,37], GVI best path [57] and road parameters [10]. These studies present GVI’s significant values and exact measurability to the built environment. However, there is simultaneously a deficiency in the study of applying GVI to measure mitigation of the Urban Heat Island (UHI) effects measured by Land Surface Temperature (LST), especially the contribution of the vertical side view of greenery that can closely represent the real volume of the cooling source.
This study thus focuses on temperature mitigation effects and urban greenery environment measured by GVI, which first examined the distributional and genus difference of GVI in Washington, D.C.’s ‘Local North’ and ‘Local South’ wards with different residential and housing environment. We tried to explore applying GVI and newly refined metric (GVI-3D) to measure and examine the relationship between urban street greenery and UHI represented by LST, and examine the different contribution from street greenspace measured by GVI, GVI-3D and NDVI toward heat mitigation.
3. Data and Methods
3.1. Study Areas and Background
The real estate risk appraisal program conducted by the Federal Home Loan Bank Board (FHLBB) in 1935 assigned a 4-point grade concerning infamous security [21], which revealed the modern history of inequality in 239 American cities. Since then, the fourth grade and labels of hazardous areas were assigned to most neighbourhoods with African Americans. Since then, inequality transformed into racial steering. Washington, D.C., ‘a city with a legacy of Black plurality’ [29], seemingly disenfranchised its Black residents’ rights to socioeconomic and political equality [9,28,29,35]. The city’s diversity and complexity contribute to its local dilemma as a global city where historical and modern inequality exists extensively, nowadays Washington, D.C. has serious polarisation represented by an expensive housing market [4], lowest homeowenership rate nationwide [12] and high unemployment rate [48]. On the other hand, urban greenery, as one of the most important built environments, not only plays the role of public infrastructure but also has economic attributes that could affect people’s settlement choices. Scholars found that some special income [27] or ethnic groups [32] lived in neighbourhoods with high or low GVI. Washington, D.C. is a model city in the U.S. where the urban greenery work deserves, many actions such as the District of Columbia Urban Tree Canopy Plan, DC State Forest Action Plan (SFAP), and other management strategies and assessment work [11] contributed to the improvement of urban greenery environment. Although 9 percent urban tree cover is desirable [10], detection of local gaps and equitable development are also important. Therefore, we highlighted ‘Local North’ Wards 3 and 4 with poverty and ‘Local South’ Wards 7 and 8 with study areas. The poverty rates for Wards 3, 4, 7, and 8 were 9.1 percent, 11.4 percent, 27.7 percent and, 36.8 percent respectively according to D.C. State Data Centre Visualisation Portal [24].
Figure 1.
Study areas of four wards in Washington, D.C.
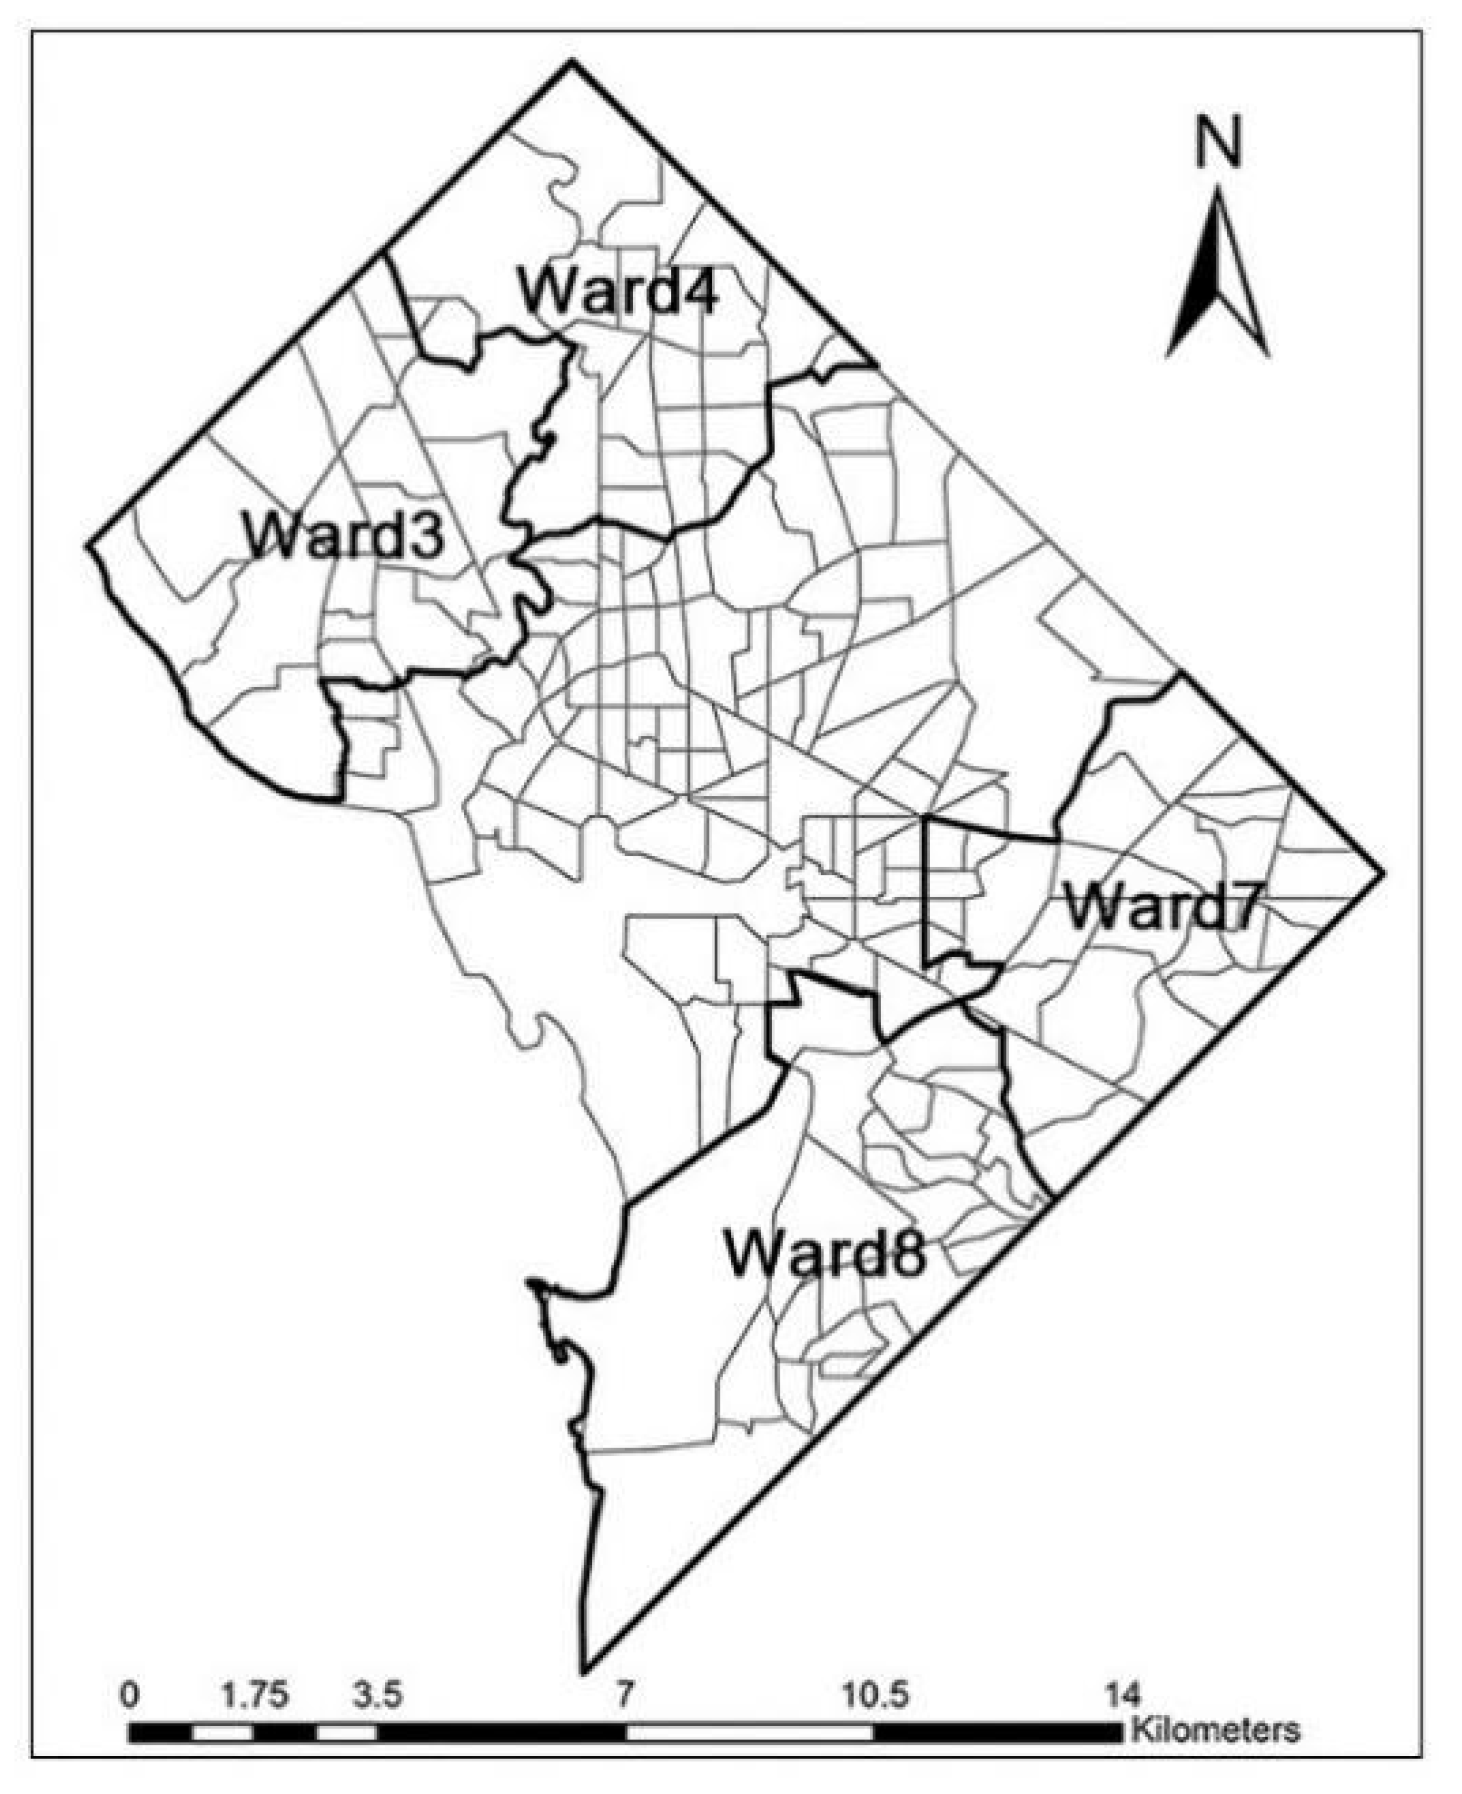

Table 1.
Basic information of selected and unselected areas for study.
| Label | Ward | Population (2014-2018) | Poverty rate (2019) |
|---|---|---|---|
| Selected study areas |
3 | 85,067 | 9.1% |
| 4 | 87,775 | 11.4% | |
| 7 | 81,299 | 27.7% | |
| 8 | 85,024 | 36.8% | |
| Other wards | 1 | 85,134 | 13.6% |
| 2 | 77,791 | 14.3% | |
| 5 | 87,850 | 17.7% | |
| 6 | 94,558 | 13.4% |
3.2. Data and Source
Our workflow is to apply indicators of urban greenery environment including NDVI, GVI, and GVI-3D to examine their different contribution to the indicator of urban thermal environment represented by LST (Figure 2).
3.2.1. Greenery Environment Data
The image dataset used here is the Auto Arborist Dataset, which is a large-scale dataset extracted from Google Street View images that joins public tree censuses from 23 cities with a large collection of street-level and aerial imagery over 2 million taken on or before 1 Jan, 2018 [2]. This dataset focuses on street trees containing at least one tree stem captured in each individual image, and Beery, S. et al. (2022) identified detailed genus information for each image [2]. To align with the image acquisition date from the Auto Arborist Dataset images and conduct comparison analyses with time continuity, we tried to use all other data close to the acquisition time of the street image data. To obtain better resolution for comparison analysis, the Normalised Difference Vegetation Index (NDVI) is calculated based on a cloud-free Sentinel-2 satellite imagery data captured on 30 July, 2017, with 10m*10m grid-cell resolution.
3.2.2. Greenery Environment Data
Similarly, to respond acquisition time of street view images from the Auto Arborist Dataset and ensure the time continuity of comparison analyses, we calculated the LST based on data collected between 2014 and 2018. The LST dataset is from Open Data DC, it was computed from 2014 to 2018 and the resultant temperatures were averaged together to produce this 5-year average data.
3.2.3. Affordable Housing Data
Despite there being many policy tools supporting Washington, D.C.’s housing affordability, the affordable housing development community relies on heavily is the Housing Production Trust Fund. Only in 2003, the HPTF obtained 15 percent of revenue from deed transfer and recordation tax according to DC Council. Housing Production Trust Fund (HPTF) has the form of revolving loan and is entirely funded by money raised within the city, and are therefore closer to the local market and housing supply and demand. HPTF provides developers with “gap financing” to directly build affording housing for low- and extremely low-income groups. Therefore, we believe that the greenery environment around affordable housing projects has strong correlations with HPTF. The HPTF affordable housing data were between 2010 to 2022, their coordinate data and basic information were grabbed from Google Maps using Python programs according to their project names listed in each HPTF annual report. Other Open Data DC datasets include zoning district boundaries in 2016 and ward boundaries in 2021.
3.3. Methods
3.3.1. Street-Level Indices Calculation
With the pre-trained semantic segmentation model of OpenMMLab where the training dataset is Cityscape and the framework is DeepLabV3. Vegetation areas were inferred and GVI was calculated based on 54,691 Google Street View images in study area including Wards 3, 4, 7 and 8. Former studies developed different calculation methods of GVI. Li et al. (2015) revolutionised the calculation method of GVI and the whole workflow by introducing panoramic Google Street View pictures combined with images with more angles and semantic segmentation algorithms, thus automating the extraction of GVI from 6 images covering the 360° horizontal surroundings [34]. On these bases, some scholars such as Dong, R. et al. (2018), Ki, D. & Lee, S. (2021) and Li, X. (2021) have proposed simplified formula, but they all follow the fundamental logic of calculating the proportion of green pixels in street images using a large amount of data with geospatial locations [10,27,32]. This study follows Ki, D. and Lee, S.’s method. The formula is shown below:
The GVI ranges from 0 to 100 percent, where a higher value indicates more greenspace are available in a single image. The green pixels in the example of segmented results represented the greenery on the streets (Figure 3).
The NVDI is calculated based on the formula below. In order to better compare NDVI with GVI, we normalise NDVI by multiplying 100, all the following NDVI metrics in this article are normalised NDVI:
GVI is highly structural data because it is alongside the urban street networks based on Google Street View map. But NDVI and LST are relatively continuous spatial data that cover all land surfaces. Given the width of streets with data collection location and mature tree canopy diameter of less than 18m [42], we first used segmented street space with 18m width along streets and 30m length perpendicular to extract mean GVI, thus most tree canopy can be included (Figure 4). Same street space was also used to extract mean LST and NDVI. To examine the relationship between the tree genus and LST, other buffer areas with a 10m radius based on each individual image location were used as statistical areas. All analyses were conducted with Python, R Studio, and ArcGIS pro.
Scholars addressed that GVI is a 3-dimensional index, but it virtually only represents vertical greening elevation with depth. To better describe the 3-dimensional greenery volume, we further develop GVI-3D following the logic of calculating the volume of a tree cone (Figure 5). In our study, we think of trees approximately as cones, the NDVI measured from overhead by satellite represents the base area of the cone, the root of GVI represents the height of tree canopy. Therefore, the newly developed GVI-3D can be calculated as follows:
3.3.2. Correlation Analysis and LINEAR REGRESSION
This study focuses on the mitigation impact of greenery variables on LST. To investigate the correlation among LST, GVI, and NDVI, Spearman’s correlation analysis was applied. To examine and compare the cooling effects, bivariate correlations were first conducted between LST and GVI, and LST and NDVI respectively. To further examine the comprehensive effect of greenery volume measured by GVI-3D, the ordinary least square regression model (OSL) was used to examine the association between LST and GVI-3D. Variables for 4 Wards were calculated both individually and collectively.
3.3.3. Greenery Environment Examination in Residential Zones and Affordable Housing Surroundings
Housing greenery environment was conducted at all residential zoning areas including Residential Apartment Zone (RAZ), Residential Flat Zone (RFZ), Residential Zone (RZ), and 22 sub-zoning areas, and 500-meter buffer areas of 98 affordable housing projects between 2010 and 2022 in four wards. We used descriptive statistics to scrutinise the macro-level districts and micro-level housing greenery environment.
4. Results
At the macro-quantity level, the number of street view images containing trees is similar. ‘Local North’ Wards 3 and 4 have 12558 and 11559 images respectively, while Wards 7 and 8 have 16871 and 13703 images. However, the urban greenery disparities were clearly revealed in other statistical perspectives including per capita occupancy, mean GVI, temperature cooling effect, tree genus, and residential and affordable housing greening environments. Every 6.79 and 7.32 people share one tree/vegetation point in Wards 3 and 4 compared with every 5.08 and 6.22 for that in Wards 7 and 8 respectively. The spatial distribution of GVI is shown in Figure 5, where the larger radius and greener means the higher GVI. Basically, the GVI under 30 indicates that these vegetation’s cooling effects can’t break through the threshold of 82.5 Fahrenheit (28.5 degree Celsius) mean LST according to Figure 7, which is nearly at the transition point where Giannaros, T. M. (2014) believed 27 to 29 degrees Celsius can make majority population fell discomfort according to their LST comfort ranges [14].
4.1. LST Mitigation Effect Comparison between GVI and NDVI
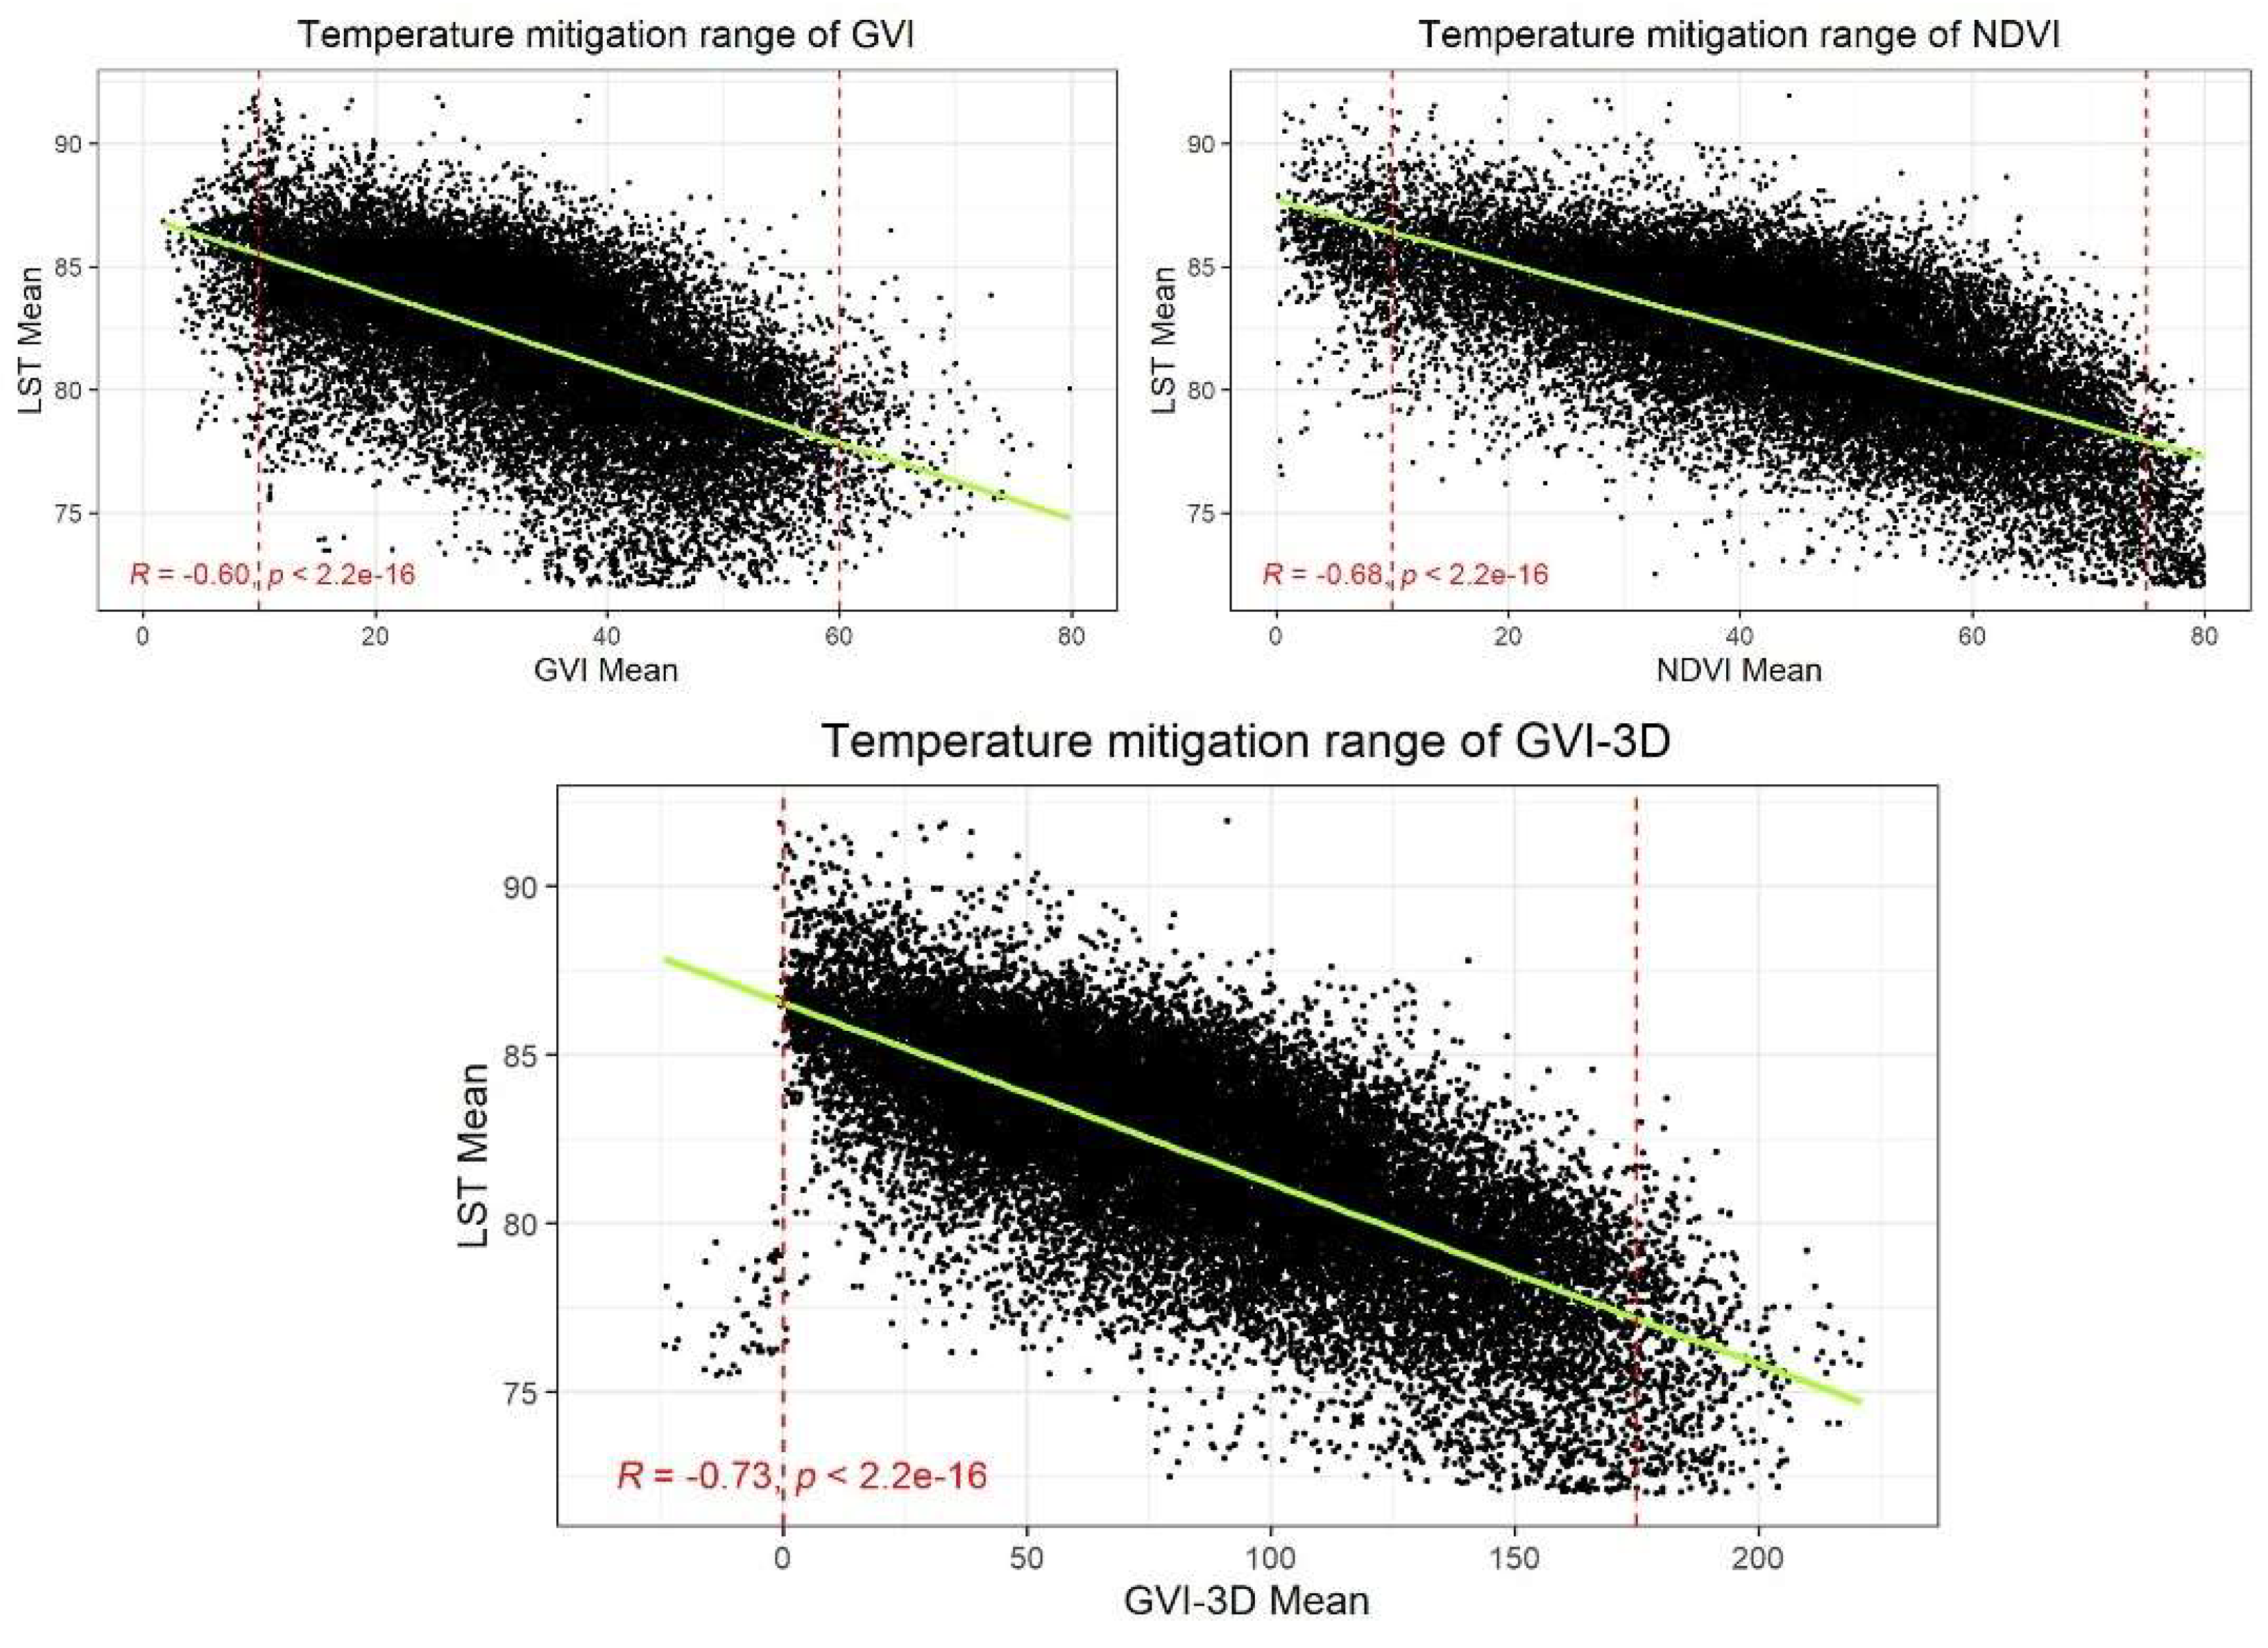
We next examined the relationship between LST and our two measures of greenspace. We observed negative relationships between LST and these measures, indicating that spaces with greater shares of greening had lower LST relative to areas without. The correlation coefficient of -0.60 between the mean LST and GVI mean was drawn, although less correlated than that with NDVI (-0.68), their LST mitigation effects are virtually the same as represented by regression lines (Figure 7) and the reduction in LST is between 15 and 20 Fahrenheit degree for both GVI and NDVI. The effective cooling range of GVI is from 15 to 60, and it is from 15 to 75 for that of NDVI, which were manifested by red dash lines in Figure 6. The temperature mitigation effect appears to stop when GVI reaches around 60 representing the 60 percent vegetation proportion, which can guide urban greening work to prevent the tree canopy from becoming excessively large without producing the cooling effect. On the other hand, there is no clear stagnating trend for NDVI, which can be explained by that NDVI is a large spatial scale metric measured by electromagnetic spectrum, while GVI focuses more on middle and micro-scale street space. Meanwhile, the NDVI scatter plot presented an obvious spindle shape when the values were closer to 0.
The newly developed index, GVI-3D, presented the best correlation with LST compared with GVI and NDVI, the coefficient is -0.73 (p<0.001), which means this index has high explanatory power for temperature mitigation (Figure 7). The effective cooling range of GVI-3D is from 0 to 175, and GVI-3D scatter plot reflects a better point data distribution than GVI and NDVI.
Figure 7.
The temperature mitigation effects of GVI, NDVI, and GVI-3D in all wards.
4.2. Cooling Effect Disparity between the ‘Local South’ and ‘Local North’
4.2.1. Disparity by Wards
The correlation analysis results by wards demonstrated the greenery environment disparity between the ‘Local South’ and ‘Local North’. In Wards 7 and 8, fewer GVI mean values (24.84% and 13.35% respectively) were over than 40, which prevents street-level LST from dropping to 80 degrees Fahrenheit or lower (Figure 8). In contrast, 62.06 percent GVI mean values were over 40 in Ward 3, they played important roles in cooling the surrounding street space. The distribution of point data presented obvious movement to the upper left for Wards 7 and 8 compared with Wards 3 and 4 (Figure 7), which makes the point clusters closer to 90 degrees Fahrenheit, however, there are fewer points close to 90 degrees Fahrenheit in Ward 4, few in Ward 3.
4.2.2. Disparity by Tree Genus
If we scrutinise the detailed genus of trees in each Ward, we found that the quantity of genus showed a small difference, but GVI by genus showed huge gaps. GVI of all genera was extensively lower in Wards 7 and 8 compared with Wards 3 and 4, and we visualised the GVI of top 20 genera (Figure 9). The value of red dash line is 30, and we found that most top 20 genera have GVI blow 30 in Wards 7 and 8, which the situations are opposite in Wards 3 and 4 (Figure 9). The first-layer genera with the most quantity is either 4 or 3 categories in four Wards. Prunus stood out all genera in Ward 3, followed by Acer, Quercus, and Cercis. Cercis, Zelkova, and Prunus are dominated genera in Ward 4. Acer, Ulmus, Quercus, and Prunus are the first-layer genera in Ward 7, and Quercus, Acer, Prunus and Ulmus are the dominated genera in Ward 8. The number of trees by genus dropped off a cliff in Wards 3 and 8 (Figure 9), suggesting several dominant tree genera, which is closely related to their cooling effect. We used a simple classification to label the cooling effect of different tree genera, and found that the dominant tree genus also presented subtle inequality in terms of their cooling effects on surrounding environments. (Table 2) More genera with high and medium cooling effects are dominated in Wards 3 and 4, in contrast, Wards 7 and 8 mostly get benefits from genera with medium and low cooling effects, and few genera with high cooling effects are primary in these two Wards. According to Virginia Department of Forestry (2023), the seedling prices for the genus Prunus (with high cooling effect) and Quercus (with medium cooling effect) are both $85 for 50, while Acer with a low cooling effect has the seedling price of $80 for 50, the budget difference might explain the quantity, genus and GVI gaps between the ‘Local North’ and ‘Local North’ in Washington, D.C.
4.3. Greenery Distribution Disparity in Residential Zones and Affordable Housing Surroundings
The GVI also varies across each different sub-zoning areas. The mean GVI distribution in 3 residential and 22 sub-zoning areas (Table A1) is shown in Figure 10. In general, the mean GVI in the Residential Zone (RZ) is higher than that in the Residential Apartment Zone (RAZ) and Residential Flat Zone (RFZ). The R-1A zone has the highest mean GVI at around 42.5, the RA-1 zone has the lowest mean GVI at around 25. In local perspectives, the opposite mean distribution appears within RZ and RAZ. In RZ, with the increase of housing density, the zoning type transfers from R-1A to R-1B, R-2, and R-3, the mean GVI presented an obvious decrease from around 42.5 to 26, which indicated the normal relationship between land use and urban greenery. All R-1A and variations showed high mean GVI around or above 40, and small deviation from the mean values, the cliffs between R-1A and R-2 or R-3 are distinct.
However, the denser the residential zoning type within RAZ, the higher mean GVI values show out. For example, the RA-4 which provides for areas developed with predominantly medium- to high-density residential has the highest mean GVI of around 37, while the RA-1 which permits low- to moderate-density development, including detached dwellings, rowhouses, and low-rise apartments has the lowest mean GVI around 25. In addition, the mean GVI of RF-1 which belongs to RFZ is neither high nor low, which is around 28.
The distribution difference simultaneously revealed the inequality of residential land use. Zoning types with high mean GVI are mostly located in ‘Local North’ Wards 3 and 4, while low mean GVI zoning areas are concentrated in Wards 7 and 8. Wards 7 and 8 have 31 and 26 RA-1 zones (the lowest GVI zoning), in comparison, Wards 3 and 4 only have 7 and 10 RA-1 zones respectively. As for RA-1 zones (the highest GVI zoning), Wards 3 and 4 have 7 and 3 respectively, and Wards 7 and 8 do not have such kind of zoning.
We found that 98 affordable housing projects in different wards and zoning also presented disparity (Table 3). Due to the wealth of Ward 3, only one HPTF affordable housing project was built between 2010 and 2022, which is Woodley House. Wards 4, 7, and 8 have 38, 32, and 27 affordable housing projects built in during 13 years. The mean GVI of all affordable housing projects is 27.2, which is quite as low as the mean GVI in R-3 zoning. The only project in Ward 3 has a mean GVI of 43.51, the mean GVI of projects in Ward 4 is 31.1, far higher than the projects with the highest GVI of 30.96 and in Wards 7 and 28.24. The average GVI of affordable housing projects in Wards 7 and 8 are only 25.9 and 22.6, indicating the huge gaps between affordable housing projects in different Wards. What’s more, the affordable housing project with the highest GVI in Ward 7 is located in Mixed-Use Zones where the commercial and institutional use are prior, the multi-family residential development are secondary residential zoning areas (Appendices).
5. Discussion
This study contributes to the validation of environmental injustice issues and significant temperature mitigation effects measured by GVI and GVI-3D. Taking Washington, D.C. as an example, we found that the greenery environment inequality, from macro-level to micro-level, extensively existed in the ‘Local North’ and ‘Local South’ with serious wealth polarisation, which reveals the infrastructure property attributes of street-level vegetation. GVI and LST are highly correlated, the new index GVI-3D presented a higher correlation with LST, with the increase of these two indices, the street-level space becomes cooler around 10 to 15 degrees Fahrenheit in a linear way. GVI-3D presented a better measurement of LST mitigation, which contributed to establishing the model of a true mathematics mapping of this index to canopy volume in physical urban space. As for the good measurability, we believed that the side views of street greenery images provide more possibilities to measure the actual volume of tree canopies which are the main cooling source for urban street-level microenvironment.
However, the cooling effects of different tree genera differs, some dominant genus has better temperature mitigation effects such as Prunus, Cercis, and Zelkova, while Acer and Ulmus show low mitigation effects. These subtle differences are difficult to spot, and even their cooling effect may be budget-related because we found that affluent wards tend to have more high cooling effect trees compared with non-affluent wards at the local level.
The GVI values also connect with land use type and housing density. The higher the density of detached or semi-detached Residential Zoning, the lower the GVI was found in those areas. In contrast, the higher the density of Residential Apartment Zoning, we get the higher GVI. This may be explained by the degree of intensive utilisation of land that needs to reach a certain value before it can function well. Unlike the average greenery environments of residential areas, the greenery environments of affordable housing were worse measured by GVI. Despite increased greenery is common sense that can mitigate the heat exposure risks, they also mean government or developers need balance investment and budget for targeted neighbourhoods. As for affordable housing, they usually have less accessibility to parks, forests and gardens, thus the urban street greenery becomes the limited or only green environment that affordable housing can directly benefit from so as to decrease heat exposure risks. Therefore, the significance of urban street greenery and its metrics should be addressed.
Some limitations should be addressed. First, despite the accuracy of a similar semantic segmentation model being around 85 percent according to prior research [27,33,59], changing the detection image dataset from European based cities to American cities can have an influence on the accuracy of the algorithm. As for the temperature mitigation effect, we only consider the single variable of urban greenery, more variables can be included such as Impervious Surface Area (ISA) [25,55,60]. Besides, more data may give the correlation analysis and regression model better explanatory power. Despite the GVI-3D generated a fine R-squared value of 0.73, the 0.60 R-squared value of GVI still has the possibility of being improved.
6. Conclusion and Policy Proposals
In conclusion, GVI has virtually the same explanatory power as NDVI when it comes to the LST mitigation effect, while GVI-3D has the best. This study argues that it is of practical significance to monitor GVI and GVI-3D rather than NDVI of small-scale street environments due to their readability, controllability, and human-centric attributes. It is feasible to adjust GVI by controlling the size, quantity, and density of street greenery, a 60 percent GVI can be a cut-off for urban greening work to prevent excessively large tree canopies concerning their cooling effects. However, large-scale NDVI measurements make it difficult to contribute to improved policy suggestions for street greening. The related housing and greenery policies can have improvements as follows.
6.1. Focus on Greenery Quality Rather than Only Quantity
According to Fang (2020), DC’s greenery-related government departments already made huge efforts to plant trees in non-affluent areas such as Wards 7 and 8 [11], their achievements can be reflected in the number of tree/vegetation image points mentioned above. However, greenery quality is more essential indicated by GVI and GVI-3D in this study. Through measuring GVI, it is easy to find that vegetation proportion over 60 percent can’t produce a substantial cooling effect. Therefore, more emphasis and resources can be invested in the improvements of quality of the greenery environment such as the balance of tree genus and the volume of tree canopies so that we can pursue better temperature mitigation effects by quantifying GVI or GVI-3D. Those resources to manage excessively huge tree canopies can be transferred to ‘Local South’ areas by managing the life cycle of the trees.
6.2. Highlight the Greenery Environment of Affordable Housing Projects
The locations of HPTF affordable housing projects are precise. Ward 3 only built one affordable housing during 13 years. However, the gaps between this only one project and the others were huge. A suitable greenery environment for housing has the significant impact on the health of residents [18,30], housing values [54,58], and environmental justice [45,52]. The affordable housing projects have the necessitates to set aside a part of the budget and resources for the improvement of the surrounding green environment in terms of tree genus and volume. The density of affordable housing projects can be improved from the evidence that higher density Residential Apartment Zone tends to have better greenery environment measured by GVI. In addition, the assessment of the difference between affordable housing projects and normal housing projects is necessary.
Author Contributions
Conceptualization, Zhang, Z. and Fang, F.; methodology, Zhang, Z.; software, Zhang, Z. and Fang, F.; validation, Zhang, Z. and Lou, J.; formal analysis, Zhang, Z., Fang, F. and Greenlee, A.; investigation, Zhang, Z.; resources, Fang, F.; data curation, Zhang, Z.; writing—original draft preparation, Zhang, Z.; writing—review and editing, Zhang, Z., Fang, F., and Greenlee, A. and Lou, J.; visualization, Zhang and Lou, J., Z.; supervision, Fang, F. and Greenlee, A; project administration, Zhang, Z., Fang, F. and Greenlee, A; funding acquisition, Fang, F. and Greenlee, A. All authors have read and agreed to the published version of the manuscript.
Funding
This research received no external funding.
Institutional Review Board Statement
Not applicable.
Data Availability Statement
Data is available in: https://google.github.io/auto-arborist/; https://github.com/open-mmlab/mmcv; https://opendata.dc.gov/.
Acknowledgments
Not applicable.
Conflicts of Interest
The authors declare no conflicts of interest.
Appendix A
Table A1.
The description of residential zoning categories in Washington, D.C.
| Zoning | Sub-Category | Description |
|---|---|---|
| Residential Apartment Zone | RA-1 | The RA-1 zone provides for areas predominantly developed with low- to moderate-density development, including detached dwellings, rowhouses, and low-rise apartments. |
| RA-2 | The RA-2/RC zone is intended to provide for areas developed with predominantly moderate- and medium-density rowhouses and apartments. | |
| RA-3 | The RA-3 zone provides for areas developed with predominantly medium-density residential. | |
| RA-4 | The RA-4 zone provides for areas developed with predominantly medium- to high-density residential. | |
| RA-1/NO | The RA-1/NO zone provides for areas predominantly developed with low- to moderate-density development, including detached dwellings, rowhouses, and low-rise apartments in the vicinity of the U.S. Naval Observatory. | |
| Residential Flat Zone | RF-1 | The RF-1 zone is to provide for areas predominantly developed with row houses on small lots within which no more than two (2) dwelling units are permitted. |
| Residential Zone | R-1A | The R-1A zone is intended to provide areas predominantly developed with detached houses on large lots. |
| R-1A/CBUT | All R-1A variations permit detached houses on large lots. They also have the purpose to protect specific areas’ low density, natural topography, historic or ceremonial importance, or special missions, including Chain Bridge Road/University Terrace, Forest Hills, Tree and Slope Protection zones, Naval Observatory/Tree and Slope Protection zones and Wesley Heights. | |
| R-1A/FH | ||
| R-1A/TS | ||
| R-1A/TS/NO | ||
| R-1A/WH | ||
| R-1B | The R-1B zone is intended to provide areas predominantly developed with detached houses on moderately sized lots. | |
| R-1B/FH | All R-1B variations permit detached houses on moderately-sized lots. They also have the purpose to protect specific areas’ low density, natural topography, historic or ceremonial importance, or special missions, including Forest Hills, Georgetown National Historic Landmark District, Naval Observatory, Sixteenth Street Heights and Wesley Heights. | |
| R-1B/GT | ||
| R-1B/NO | ||
| R-1B/SH | ||
| R-1B/WH | ||
| R-2 | The R-2 zone is intended to provide for areas predominantly developed with semi-detached houses on moderately sized lots that also contain some detached dwellings. | |
| R-2/FH | The purposes of the R-2/FH zone are to preserve the natural topography and mature trees to the maximum extent feasible in the Forest Hills neighbourhoods, which permit semi-detached houses on moderately sized lots that also contain some detached dwellings. | |
| R-3 | The purpose of the R-3 zone is to allow for row dwellings, while including areas within which row dwellings are mingled with detached dwellings, semi-detached dwellings, and groups of three or more row dwellings. | |
| Mixed-Use (MU) Zones | MU-7B | The MU-7B zone is intended to permit medium-density mixed-use development with a focus on employment. |
References
- Bannari, A., Morin, D., Bonn, F., & Huete, A. R. (1995). A review of vegetation indices. Remote Sensing Reviews, 13(1–2), 95–120. https://doi.org/10.1080/02757259509532298. [CrossRef]
- Beery, S., Wu, G., Edwards, T., Pavetic, F., Majewski, B., Mukherjee, S., Chan, S., Morgan, J., Rathod, V., & Huang, J. (2022). Data_The Auto Arborist Dataset: A Large-Scale Benchmark for Multiview Urban Forest Monitoring Under Domain Shift. 2022 IEEE/CVF Conference on Computer Vision and Pattern Recognition (CVPR), 21262–21275. https://doi.org/10.1109/CVPR52688.2022.02061. [CrossRef]
- Brain M. (2016). The Housing Production Trust Fund, explained. Available online: https://ggwash.org/view/43443/the-housing-production-trust-fund-explained (accessed on 09/04/2024).
- Bright MLS. (2023). Bright MLS May 2023 Mid-Atlantic Market Report. Available online: https://www.brightmls.com/press-release/bright-mls-may-2023-mid-atlantic-market-report (accessed on 09/04/2024).
- Cao, Bright MLS. (2023). Bright MLS May 2023 Mid-Atlantic Market Report. Available online: https://www.brightmls.com/press-release/bright-mls-may-2023-mid-atlantic-market-report (accessed on 09/04/2024)S., Weng, Q., & Lu, L. (2022). Distinctive roles of two- and three-dimensional urban structures in surface urban heat islands over the conterminous United States. Urban Climate, 44, 101230. https://doi.org/10.1016/j.uclim.2022.101230. [CrossRef]
- Chakraborty, T., Hsu, A., Manya, D., & Sheriff, G. (2020). A spatially explicit surface urban heat island database for the United States: Characterization, uncertainties, and possible applications. ISPRS Journal of Photogrammetry and Remote Sensing, 168, 74–88. https://doi.org/10.1016/j.isprsjprs.2020.07.021. [CrossRef]
- Cho, Y. H., Jo, H. K., & Han, B. H. (2010). Practice in application of the index of streetscape greenness on environmental impact assessment-Case study of street in Seoul. Journal of Environmental Impact Assessment, 19(2), 205-213.
- Chun, B., & Guldmann, J.-M. (2018). Impact of greening on the urban heat island: Seasonal variations and mitigation strategies. Computers, Environment and Urban Systems, 71, 165–176. https://doi.org/10.1016/j.compenvurbsys.2018.05.006. [CrossRef]
- Conrad, E. (2010). Race, Class, and Inequality in Washington, D.C.
- Dong, R., Zhang, Y., & Zhao, J. (2018). How Green Are the Streets Within the Sixth Ring Road of Beijing? An Analysis Based on Tencent Street View Pictures and the Green View Index. International Journal of Environmental Research and Public Health, 15(7), 1367. https://doi.org/10.3390/ijerph15071367. [CrossRef]
- Fang, F., McNeil, B. E., Warner, T. A., Maxwell, A. E., Dahle, G. A., Eutsler, E., & Li, J. (2020). Discriminating tree species at different taxonomic levels using multi-temporal WorldView-3 imagery in Washington D.C., USA. Remote Sensing of Environment, 246, 111811. https://doi.org/10.1016/j.rse.2020.111811. [CrossRef]
- FRED. (2023). Homeownership Rate for the District of Columbia. Available online: https://fred.stlouisfed.org/series/DCHOWN (accessed on 09/04/2024).
- Gage, E. A., & Cooper, D. J. (2017). Relationships between landscape pattern metrics, vertical structure and surface urban Heat Island formation in a Colorado suburb. Urban Ecosystems, 20(6), 1229–1238. https://doi.org/10.1007/s11252-017-0675-0. [CrossRef]
- Giannaros, T. M., Melas, D., Daglis, I. A., & Keramitsoglou, I. (2014). Development of an operational modeling system for urban heat islands: An application to Athens, Greece. Natural Hazards and Earth System Sciences, 14(2), 347–358. https://doi.org/10.5194/nhess-14-347-2014. [CrossRef]
- Government of the District of Columbia. (2013). District of Columbia Urban Tree Canopy Plan. Available online: https://doee.dc.gov/sites/default/files/dc/sites/ddoe/page_content/attachments/Draft_Urban_Tree_Canopy_Plan_Final.pdf (accessed on 09/04/2024).
- Government of the District of Columbia/ District Department of Transportation. (2010). District of Columbia assessment of urban forest resources and strategy. Washington D.C. Available online: https://ddot.dc.gov/sites/default/files/dc/sites/ddot/publication/attachments/dc_assessment_urban_forest_resources_strategy_2010-06.pdf (accessed on 09/04/2024).
- Grover, A., & Singh, R. (2015). Analysis of Urban Heat Island (UHI) in Relation to Normalized Difference Vegetation Index (NDVI): A Comparative Study of Delhi and Mumbai. Environments, 2(4), 125–138. https://doi.org/10.3390/environments2020125. [CrossRef]
- Hanzl, M., & Rembeza, M. (2022). Greenery and Urban Form vs. Health of Residents: Evaluation of Modernist Housing in Lodz and Gdansk. Urban Planning, 7(4). https://doi.org/10.17645/up.v7i4.5831. [CrossRef]
- Harlan, S. L., Brazel, A. J., Darrel Jenerette, G., Jones, N. S., Larsen, L., Prashad, L., & Stefanov, W. L. (2007). In the shade of affluence: The inequitable distribution of the urban heat island. In Equity and the Environment (pp. 173-202). Emerald Group Publishing Limited.
- Heaviside, C., Macintyre, H., & Vardoulakis, S. (2017). The Urban Heat Island: Implications for Health in a Changing Environment. Current Environmental Health Reports, 4(3), 296–305. https://doi.org/10.1007/s40572-017-0150-3. [CrossRef]
- Hillier, A. E. (2003). Redlining and the Home Owners’ Loan Corporation. Journal of Urban History, 29(4), 394–420. https://doi.org/10.1177/0096144203029004002. [CrossRef]
- Hsu, A., Sheriff, G., Chakraborty, T., & Manya, D. (2021). Disproportionate exposure to urban heat island intensity across major US cities. Nature Communications, 12(1), 2721. https://doi.org/10.1038/s41467-021-22799-5. [CrossRef]
- Huete, A. R. (2012). Vegetation Indices, Remote Sensing and Forest Monitoring. Geography Compass, 6(9), 513–532. https://doi.org/10.1111/j.1749-8198.2012.00507.x. [CrossRef]
- Ilena, P. (2019). Ward 2 boasts high household income, education rates. The GW Hatchet. Available online: https://gwhatchet.com/2019/03/04/ward-2-boasts-high-household-income-education-rates/ (accessed on 09/04/2024).
- Imhoff, M. L., Zhang, P., Wolfe, R. E., & Bounoua, L. (2010). Remote sensing of the urban heat island effect across biomes in the continental USA. Remote Sensing of Environment, 114(3), 504–513. https://doi.org/10.1016/j.rse.2009.10.008. [CrossRef]
- Jamei, Y., Rajagopalan, P., & Sun, Q. (Chayn). (2019). Spatial structure of surface urban heat island and its relationship with vegetation and built-up areas in Melbourne, Australia. Science of The Total Environment, 659, 1335–1351. https://doi.org/10.1016/j.scitotenv.2018.12.308. [CrossRef]
- Ki, D., & Lee, S. (2021). Analyzing the effects of Green View Index of neighborhood streets on walking time using Google Street View and deep learning. Landscape and Urban Planning, 205, 103920. https://doi.org/10.1016/j.landurbplan.2020.103920. [CrossRef]
- Kijakazi, K. (2016). The Color of Wealth in the Nation’s Capital. Durham, NC: Duke University.
- King, C. J., Buckley, B. O., Maheshwari, R., & Griffith, D. M. (2022). Race, Place, And Structural Racism: A Review Of Health And History In Washington, D.C.: Article examines race, place and structural racism in Washington, D.C. Health Affairs, 41(2), 273–280. https://doi.org/10.1377/hlthaff.2021.01805. [CrossRef]
- Kuchcik, M., Dudek, W., Błażejczyk, K., Milewski, P., & Błażejczyk, A. (2016). Two faces to the greenery on housing estates–mitigating climate but aggravating allergy. A Warsaw case study. Urban Forestry & Urban Greening, 16, 170–181. https://doi.org/10.1016/j.ufug.2016.02.012. [CrossRef]
- Li, J., Song, C., Cao, L., Zhu, F., Meng, X., & Wu, J. (2011). Impacts of landscape structure on surface urban heat islands: A case study of Shanghai, China. Remote Sensing of Environment, 115(12), 3249–3263. https://doi.org/10.1016/j.rse.2011.07.008. [CrossRef]
- Li, X. (2021). Examining the spatial distribution and temporal change of the green view index in New York City using Google Street View images and deep learning. Environment and Planning B: Urban Analytics and City Science, 48(7), 2039–2054. https://doi.org/10.1177/2399808320962511. [CrossRef]
- Li, X., Cai, B. Y., Qiu, W., Zhao, J., & Ratti, C. (2019). A novel method for predicting and mapping the occurrence of sun glare using Google Street View. Transportation Research Part C: Emerging Technologies, 106, 132–144. https://doi.org/10.1016/j.trc.2019.07.013. [CrossRef]
- Li, X., Zhang, C., Li, W., Ricard, R., Meng, Q., & Zhang, W. (2015). Assessing street-level urban greenery using Google Street View and a modified green view index. Urban Forestry & Urban Greening, 14(3), 675–685. https://doi.org/10.1016/j.ufug.2015.06.006. [CrossRef]
- Lloyd, J. M. (2014). Community Development, Research, and Reinvestment: The Struggle against Redlining in Washington, DC, 1970–1995. Progress in Planning, 88, 1–49. https://doi.org/10.1016/j.progress.2013.02.001. [CrossRef]
- Lo, C. P., Quattrochi, D. A., & Luvall, J. C. (1997). Application of high-resolution thermal infrared remote sensing and GIS to assess the urban heat island effect. International Journal of Remote Sensing, 18(2), 287–304. https://doi.org/10.1080/014311697219079. [CrossRef]
- Lu, Y. (2018). The Association of Urban Greenness and Walking Behavior: Using Google Street View and Deep Learning Techniques to Estimate Residents’ Exposure to Urban Greenness. International Journal of Environmental Research and Public Health, 15(8), 1576. https://doi.org/10.3390/ijerph15081576. [CrossRef]
- Lu, Y. (2019). Using Google Street View to investigate the association between street greenery and physical activity. Landscape and Urban Planning, 191, 103435. https://doi.org/10.1016/j.landurbplan.2018.08.029. [CrossRef]
- Mitchell, B. C., & Chakraborty, J. (2015). Landscapes of thermal inequity: Disproportionate exposure to urban heat in the three largest US cities. Environmental Research Letters, 10(11), 115005. https://doi.org/10.1088/1748-9326/10/11/115005. [CrossRef]
- NASA Earth Observatory. (2024). Vegetation & Land Surface Temperature. Available online: https://earthobservatory.nasa.gov/global-maps/MOD_NDVI_M/MOD_LSTD_M#:~:text=Land%20surface%20temperature%20is%20a,cools%20more%20quickly%20than%20air. (accessed on 09/04/2024).
- Nesbitt, L., Meitner, M. J., Girling, C., Sheppard, S. R. J., & Lu, Y. (2019). Who has access to urban vegetation? A spatial analysis of distributional green equity in 10 US cities. Landscape and Urban Planning, 181, 51–79. https://doi.org/10.1016/j.landurbplan.2018.08.007. [CrossRef]
- Phillip, J. (2020). Specific and Achievable Canopy Targets: How to Model Your Capacity for Tree Canopy. Available online: https://treenet.org/resource/specific-and-achievable-canopy-targets-how-to-model-your-capacity-for-tree-canopy/ (accessed on 09/04/2024).
- Rizwan, A. M., Dennis, L. Y. C., & Liu, C. (2008). A review on the generation, determination and mitigation of Urban Heat Island. Journal of Environmental Sciences, 20(1), 120–128. https://doi.org/10.1016/S1001-0742(08)60019-4. [CrossRef]
- Sabedotti, M. E. S., O’Regan, A. C., & Nyhan, M. M. (2023). Data Insights for Sustainable Cities: Associations between Google Street View-Derived Urban Greenspace and Google Air View-Derived Pollution Levels. Environmental Science & Technology, 57(48), 19637–19648. https://doi.org/10.1021/acs.est.3c05000. [CrossRef]
- Schmid, H.-L., & Säumel, I. (2021). Outlook and insights: Perception of residential greenery in multistorey housing estates in Berlin, Germany. Urban Forestry & Urban Greening, 63, 127231. https://doi.org/10.1016/j.ufug.2021.127231. [CrossRef]
- Shaker, R. R., Altman, Y., Deng, C., Vaz, E., & Forsythe, K. W. (2019). Investigating urban heat island through spatial analysis of New York City streetscapes. Journal of Cleaner Production, 233, 972–992. https://doi.org/10.1016/j.jclepro.2019.05.389. [CrossRef]
- Urban Forestry Division, District Department of Transportation. (2021). District of Columbia State Forest Action Plan. Available online: https://dc-forest-action-plan-dcgis.hub.arcgis.com/documents/0c256a32d0c842aeb8d3b0ab3dc7195b/explore (accessed on 09/04/2024).
- USAFACTS. (2023). Economy of Washington, DC. Available online: https://usafacts.org/topics/economy/state/district-of-columbia/ (accessed on 09/04/2024).
- Villeneuve, P. J., Ysseldyk, R. L., Root, A., Ambrose, S., DiMuzio, J., Kumar, N., Shehata, M., Xi, M., Seed, E., Li, X., Shooshtari, M., & Rainham, D. (2018). Comparing the Normalized Difference Vegetation Index with the Google Street View Measure of Vegetation to Assess Associations between Greenness, Walkability, Recreational Physical Activity, and Health in Ottawa, Canada. International Journal of Environmental Research and Public Health, 15(8), 1719. https://doi.org/10.3390/ijerph15081719. [CrossRef]
- Virginia Department of Forestry. (2023). Seedling Price Guide 2023-2024. Available online: https://dof.virginia.gov/wp-content/uploads/Seedling-Price-Guide.pdf (accessed on 09/04/2024).
- World Meteorological Organisation (WMO), (2023). The Global Climate 2011-2020: A decade of accelerating climate change. Available online: https://wmo.int/publication-series/global-climate-2011-2020-decade-of-acceleration (accessed on 09/04/2024).
- Xiao, C., Shi, Q., & Gu, C.-J. (2021). Assessing the Spatial Distribution Pattern of Street Greenery and Its Relationship with Socioeconomic Status and the Built Environment in Shanghai, China. Land, 10(8), 871. https://doi.org/10.3390/land10080871. [CrossRef]
- Yang, J., Zhao, L., Mcbride, J., & Gong, P. (2009). Can you see green? Assessing the visibility of urban forests in cities. Landscape and Urban Planning, 91(2), 97–104. https://doi.org/10.1016/j.landurbplan.2008.12.004. [CrossRef]
- Ye, Y., Xie, H., Fang, J., Jiang, H., & Wang, D. (2019). Daily Accessed Street Greenery and Housing Price: Measuring Economic Performance of Human-Scale Streetscapes via New Urban Data. Sustainability, 11(6), 1741. https://doi.org/10.3390/su11061741. [CrossRef]
- Yuan, F., & Bauer, M. E. (2007). Comparison of impervious surface area and normalized difference vegetation index as indicators of surface urban heat island effects in Landsat imagery. Remote Sensing of Environment, 106(3), 375–386. https://doi.org/10.1016/j.rse.2006.09.003. [CrossRef]
- Yue, W., Xu, J., Tan, W., & Xu, L. (2007). The relationship between land surface temperature and NDVI with remote sensing: Application to Shanghai Landsat 7 ETM+ data. International Journal of Remote Sensing, 28(15), 3205–3226. https://doi.org/10.1080/01431160500306906. [CrossRef]
- Zhang, J., & Hu, A. (2022). Analyzing green view index and green view index best path using Google street view and deep learning. Journal of Computational Design and Engineering, 9(5), 2010–2023. https://doi.org/10.1093/jcde/qwac102. [CrossRef]
- Zhang, Y., & Dong, R. (2018). Impacts of Street-Visible Greenery on Housing Prices: Evidence from a Hedonic Price Model and a Massive Street View Image Dataset in Beijing. ISPRS International Journal of Geo-Information, 7(3), 104. https://doi.org/10.3390/ijgi7030104. [CrossRef]
- Zhao, H., Shi, J., Qi, X., Wang, X., & Jia, J. (2017). Pyramid Scene Parsing Network (arXiv:1612.01105). arXiv. http://arxiv.org/abs/1612.01105.
- Ziter, C. D., Pedersen, E. J., Kucharik, C. J., & Turner, M. G. (2019). Scale-dependent interactions between tree canopy cover and impervious surfaces reduce daytime urban heat during summer. Proceedings of the National Academy of Sciences, 116(15), 7575–7580. https://doi.org/10.1073/pnas.1817561116. [CrossRef]
Figure 2.
Overall data workflow.
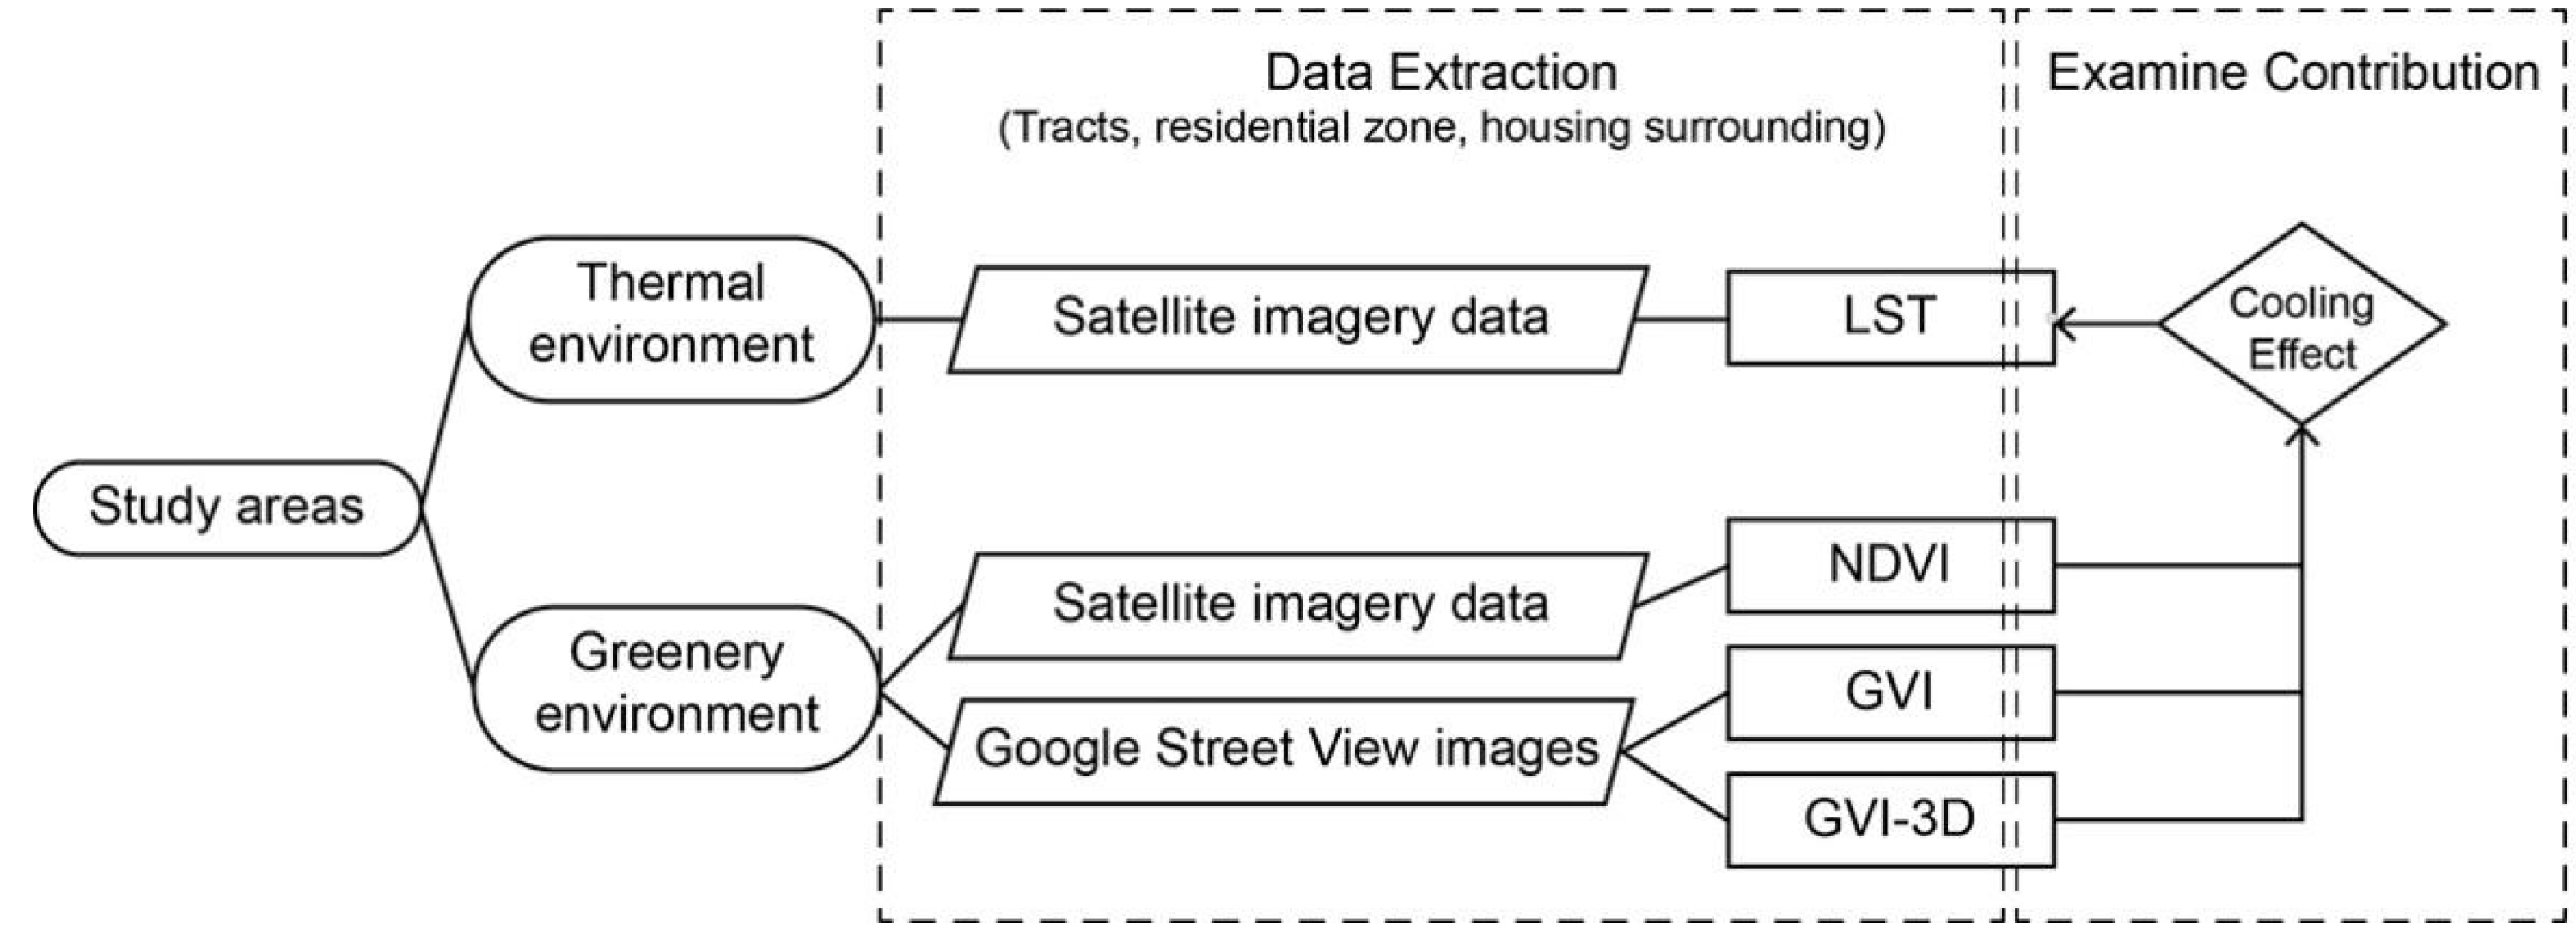
Figure 3.
Examples of different GVI images.
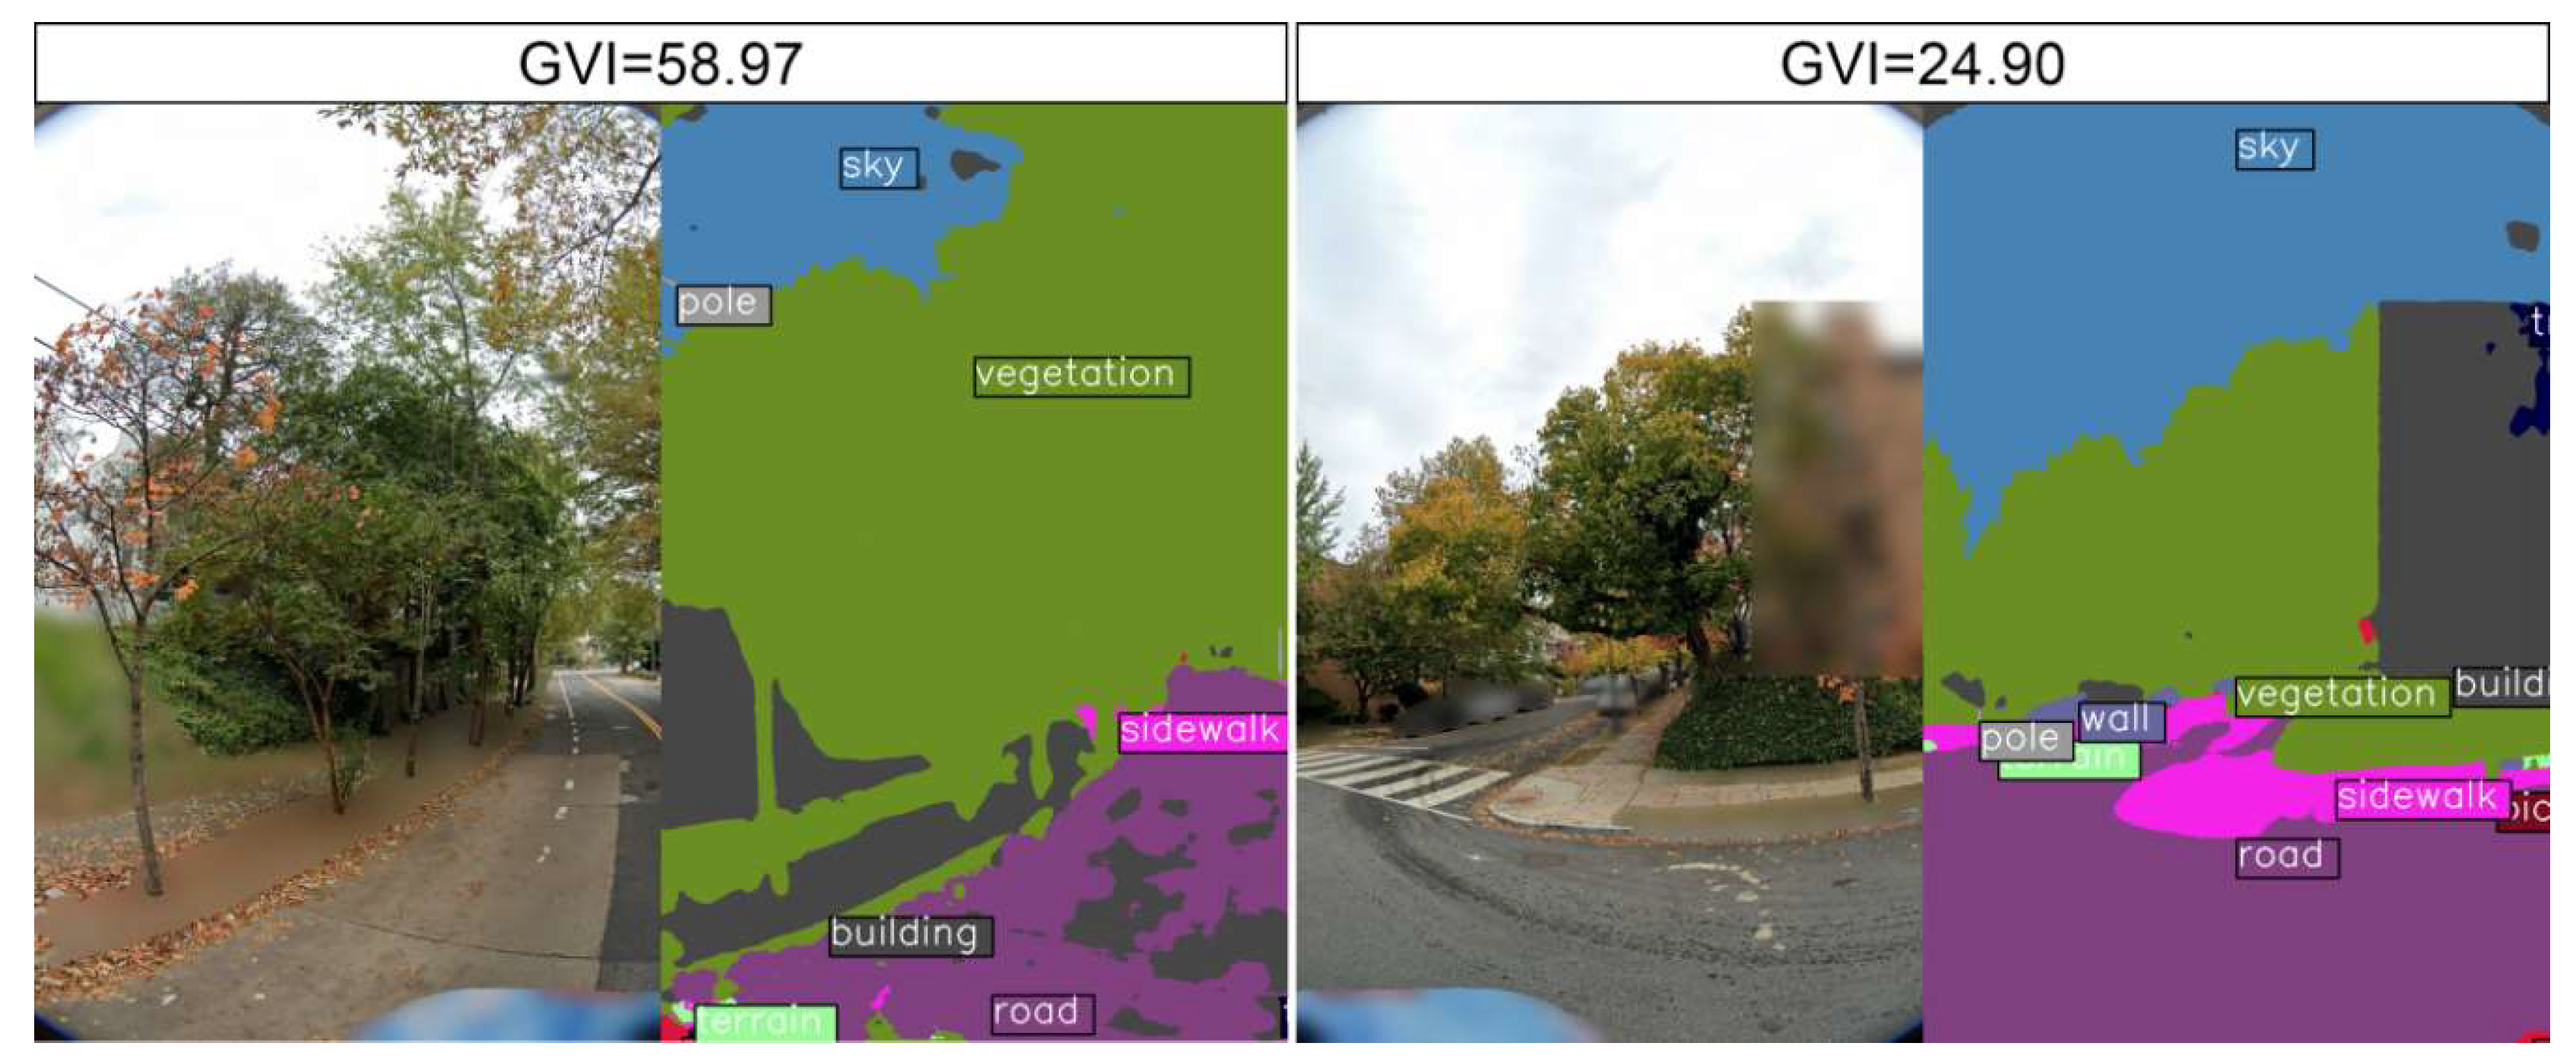
Figure 4.
Extracting mean indices from segmented street space in Ward 3’s Tract 10.01.
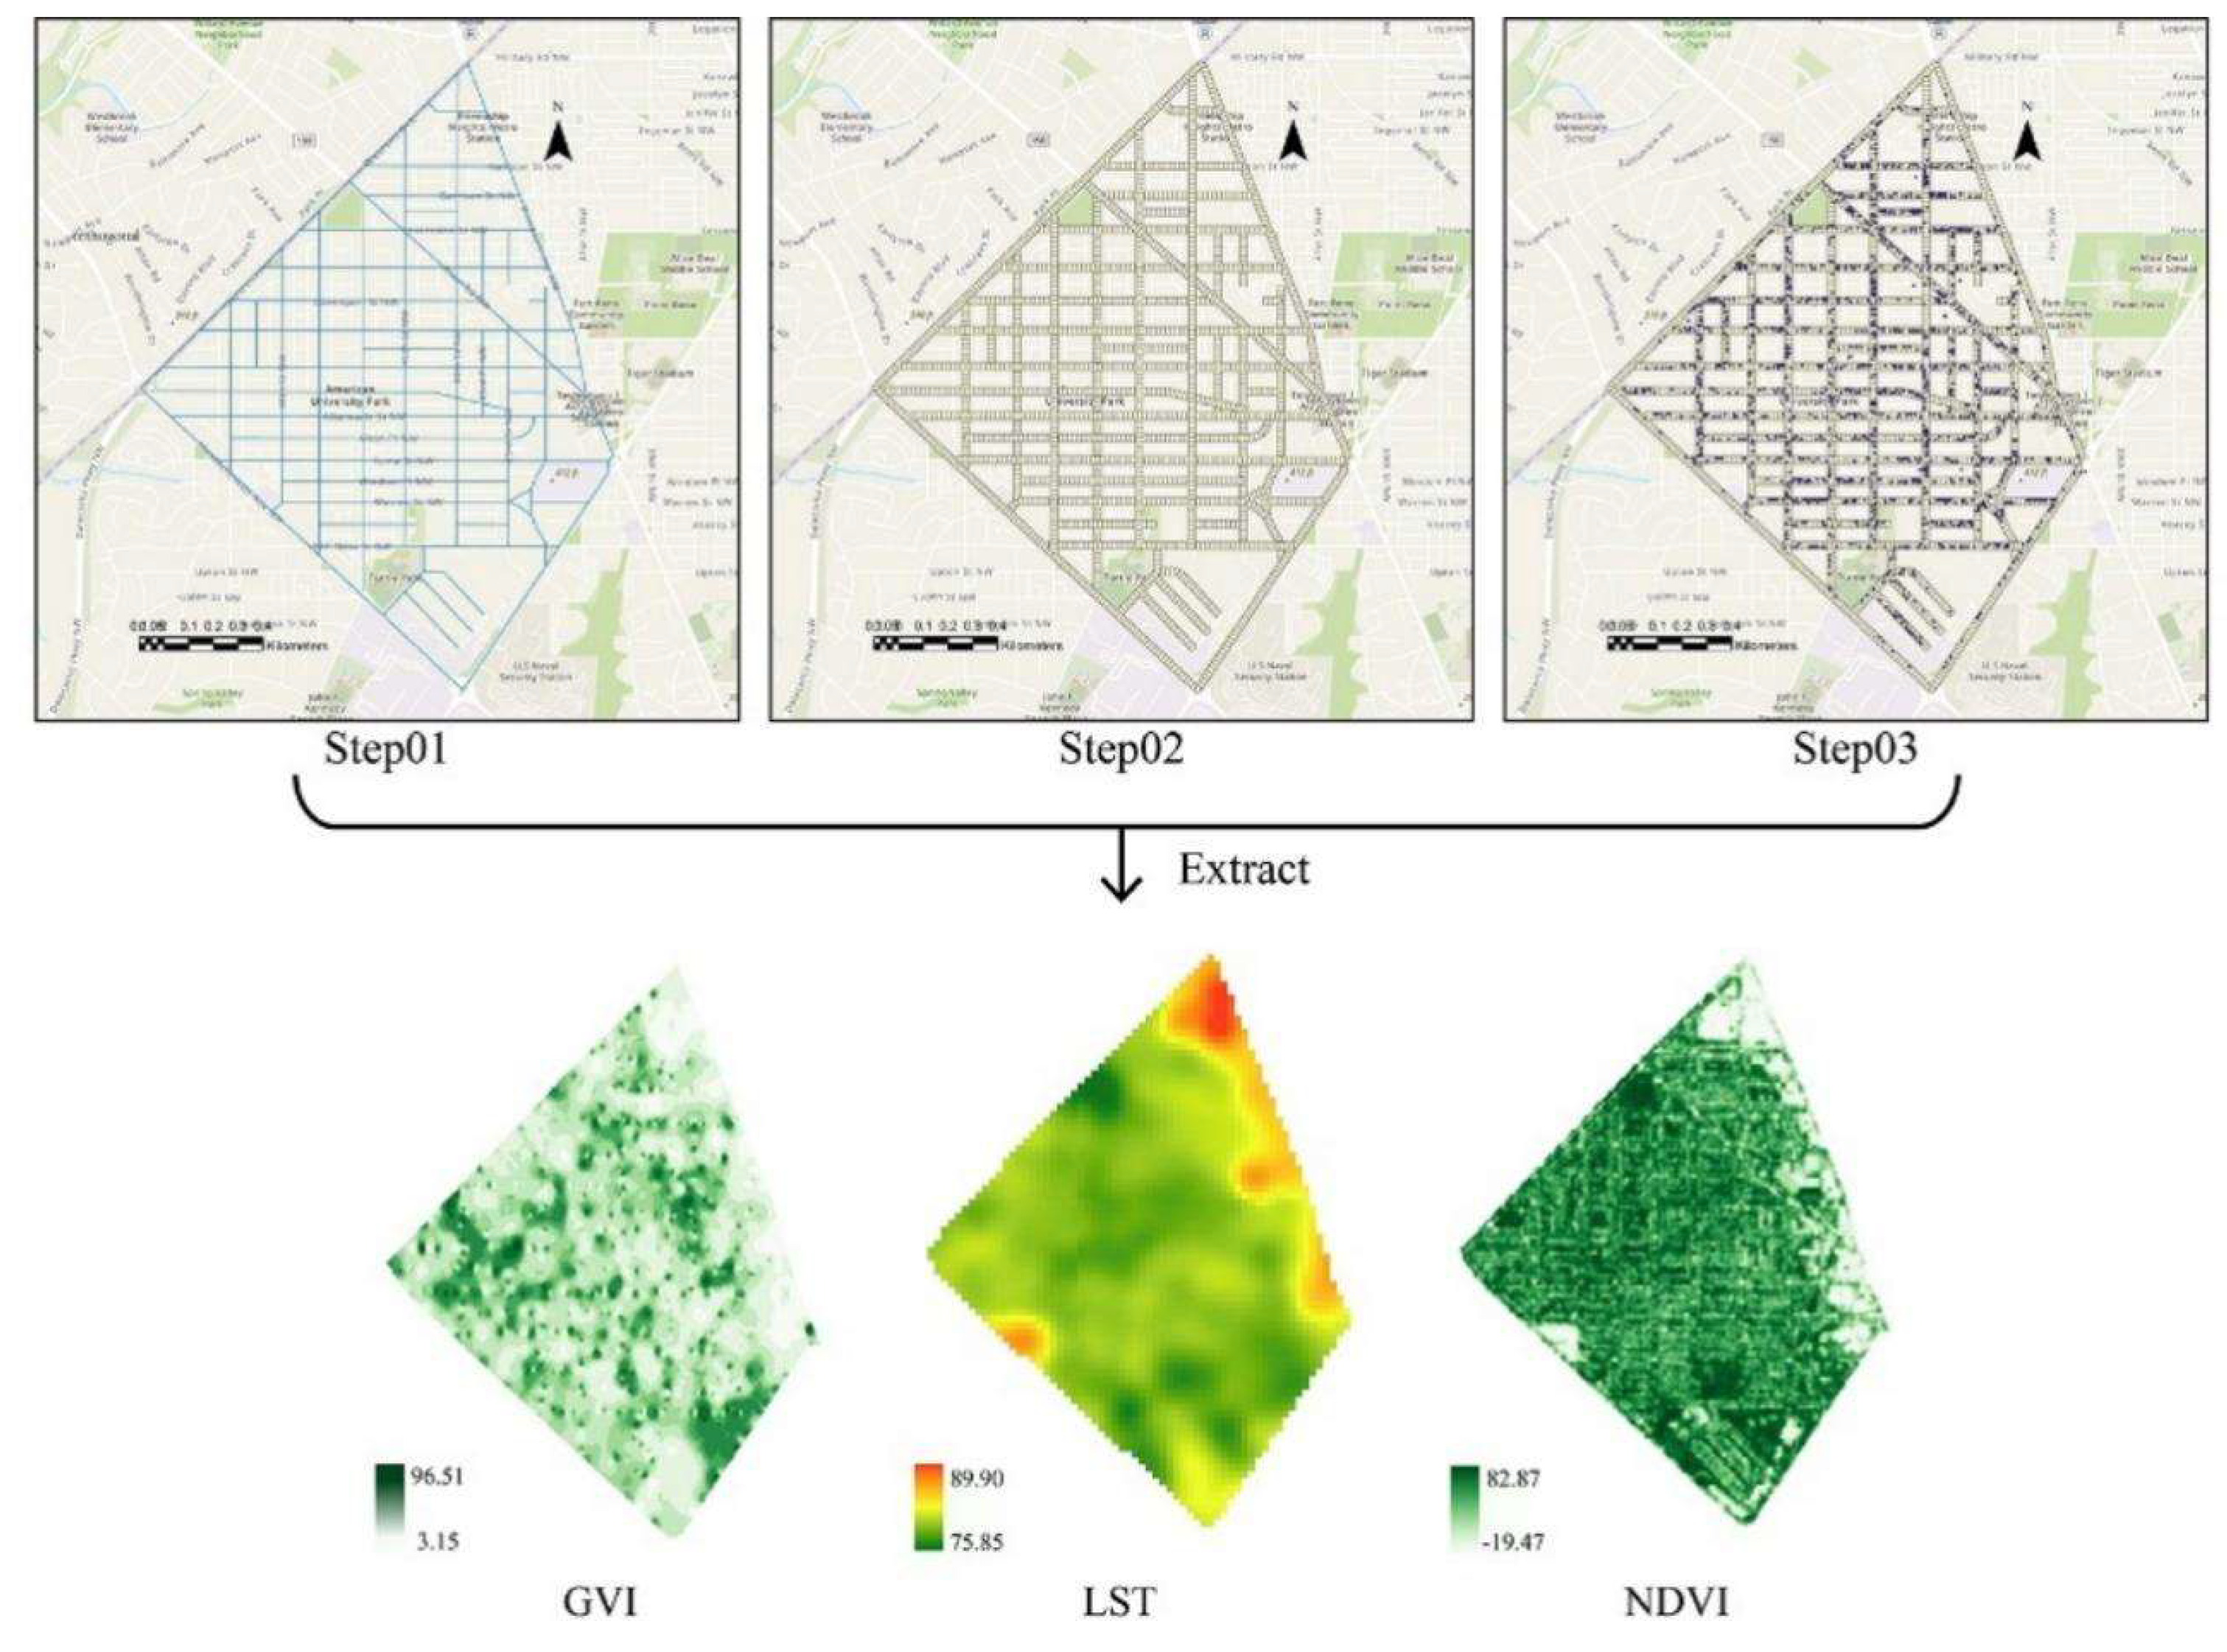
Figure 5.
The calculating logic of new developed GVI-3D.
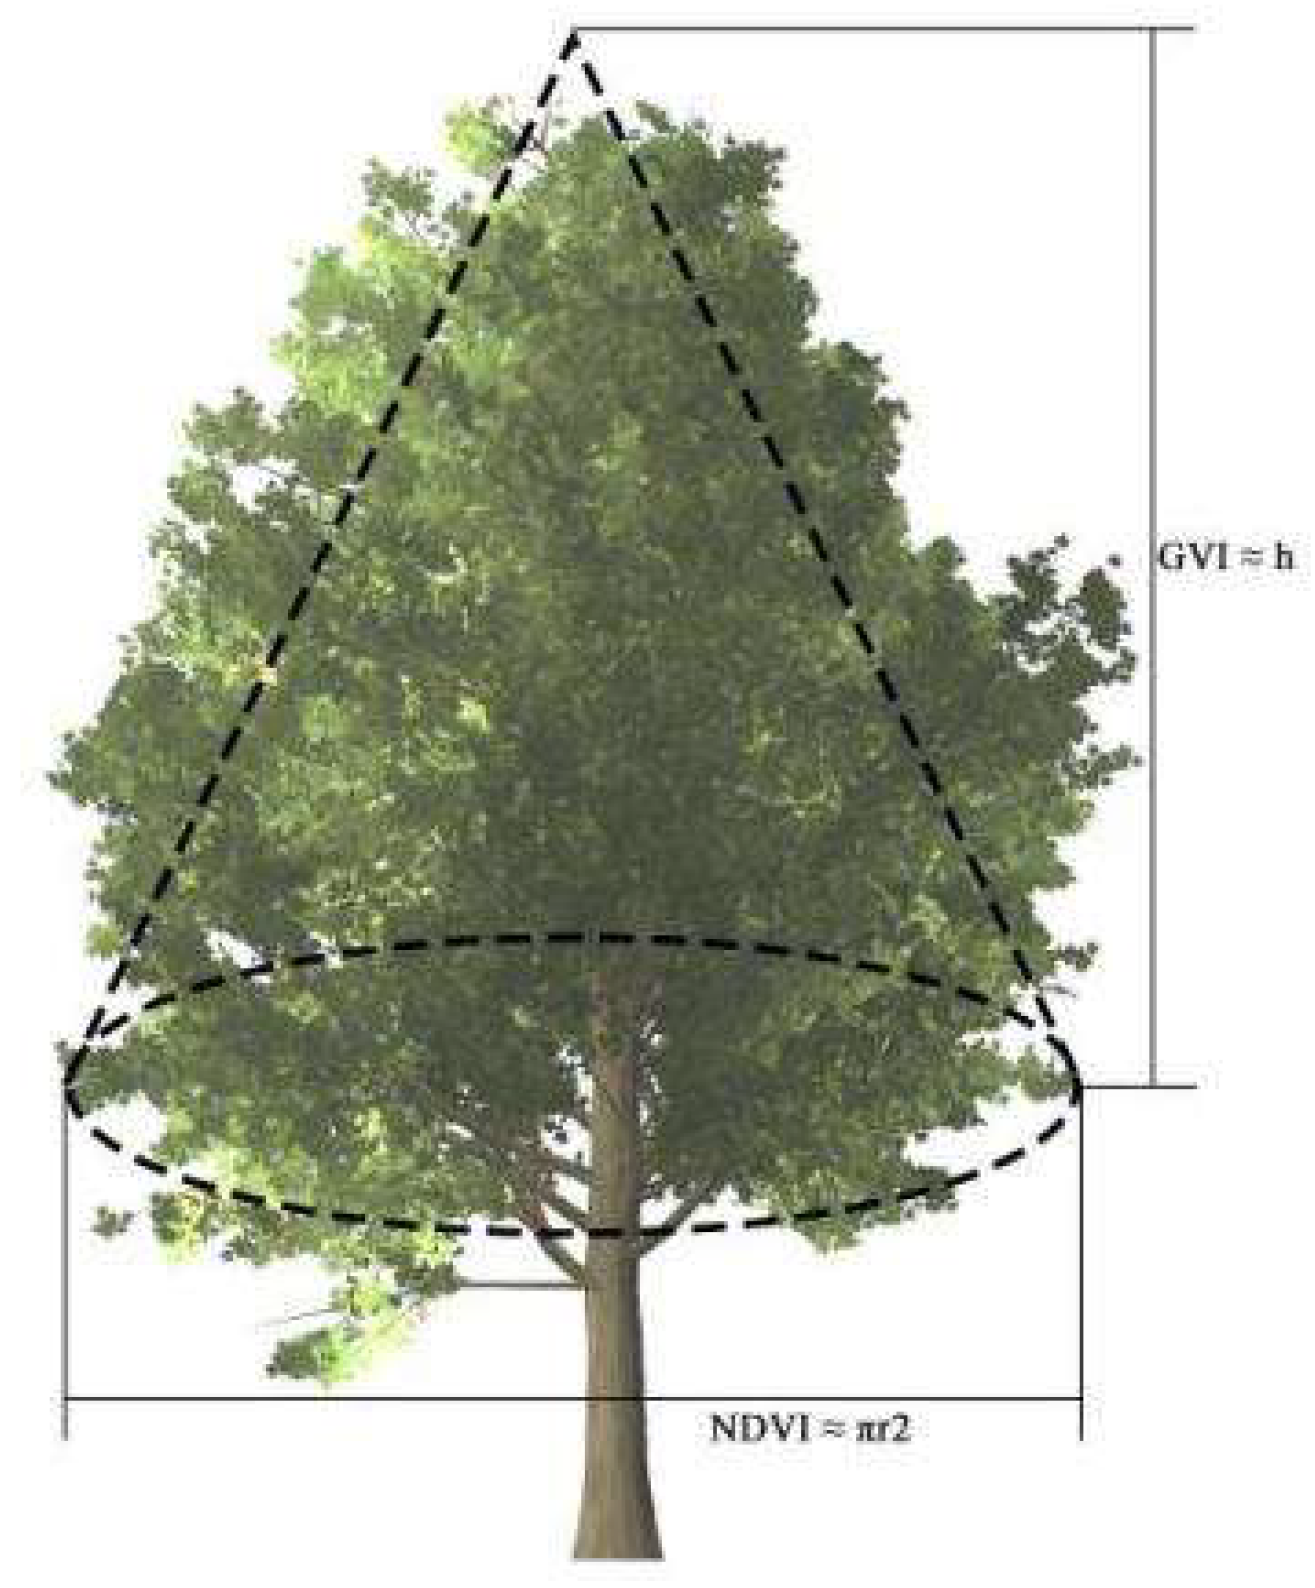
Figure 6.
The spatial distribution of GVI in ‘Local North’ and ‘Local South’.
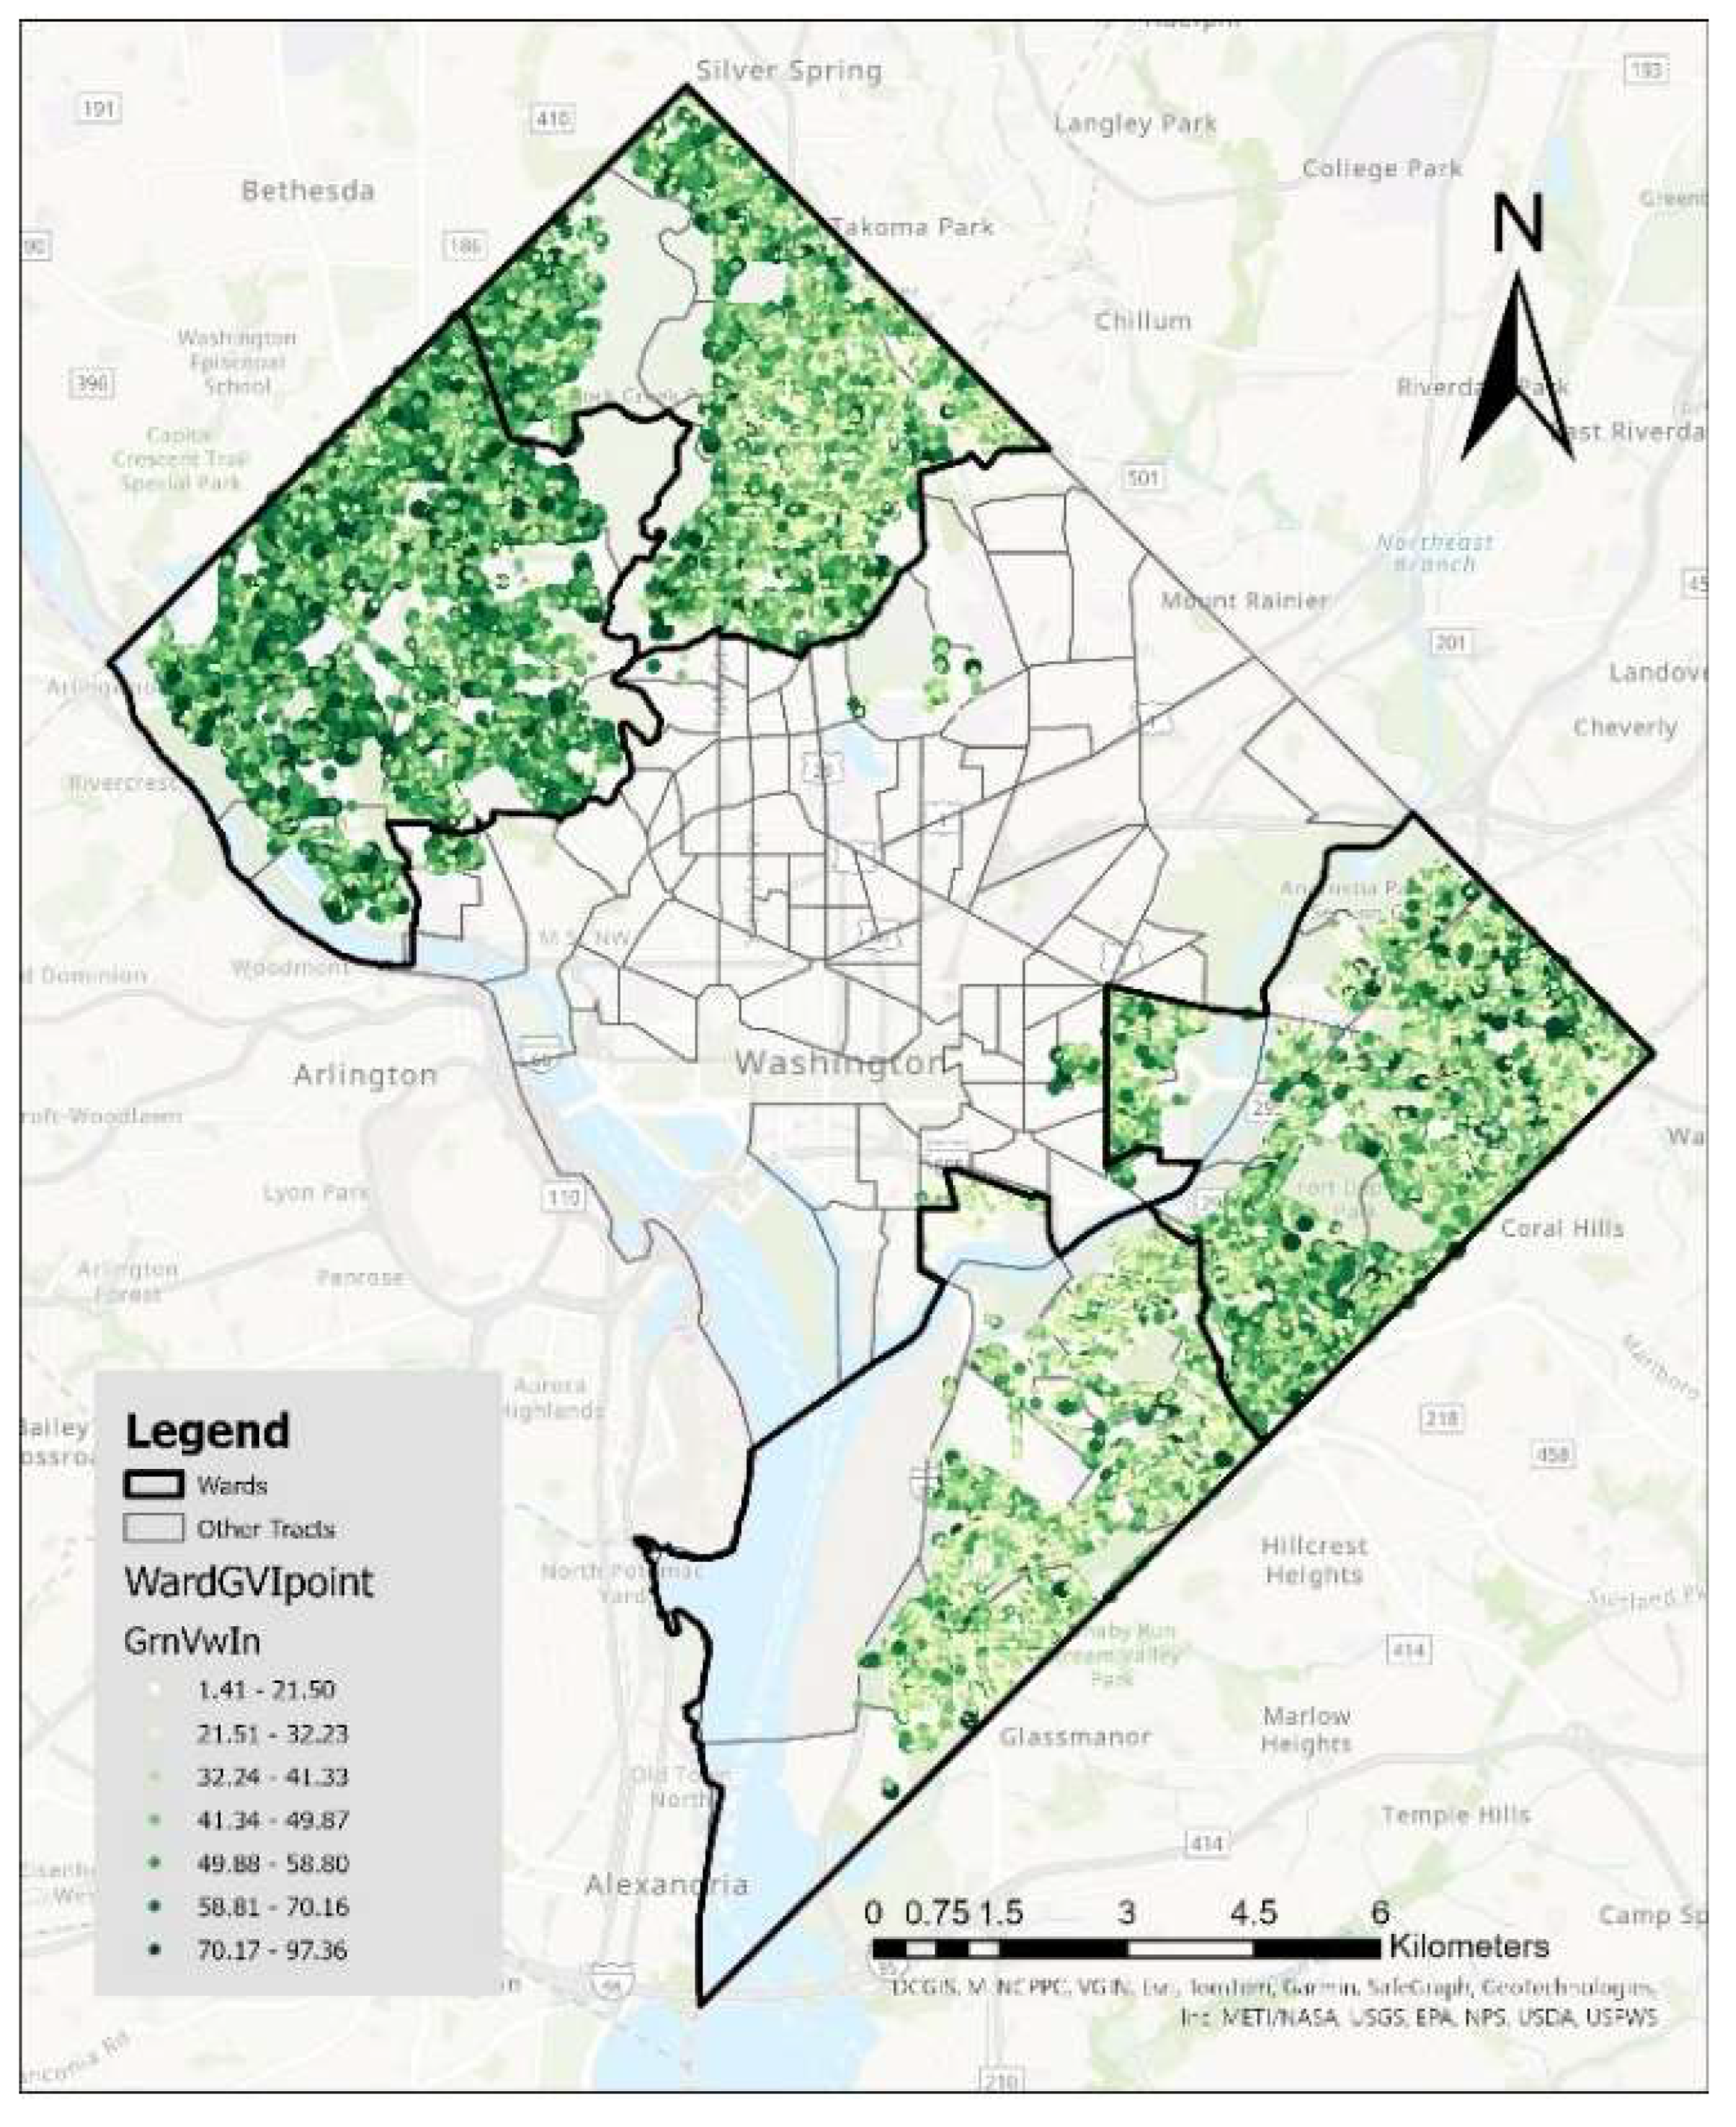
Figure 8.
The GVI temperature mitigation effect gaps in Wards 3, 4, 7 and 8.
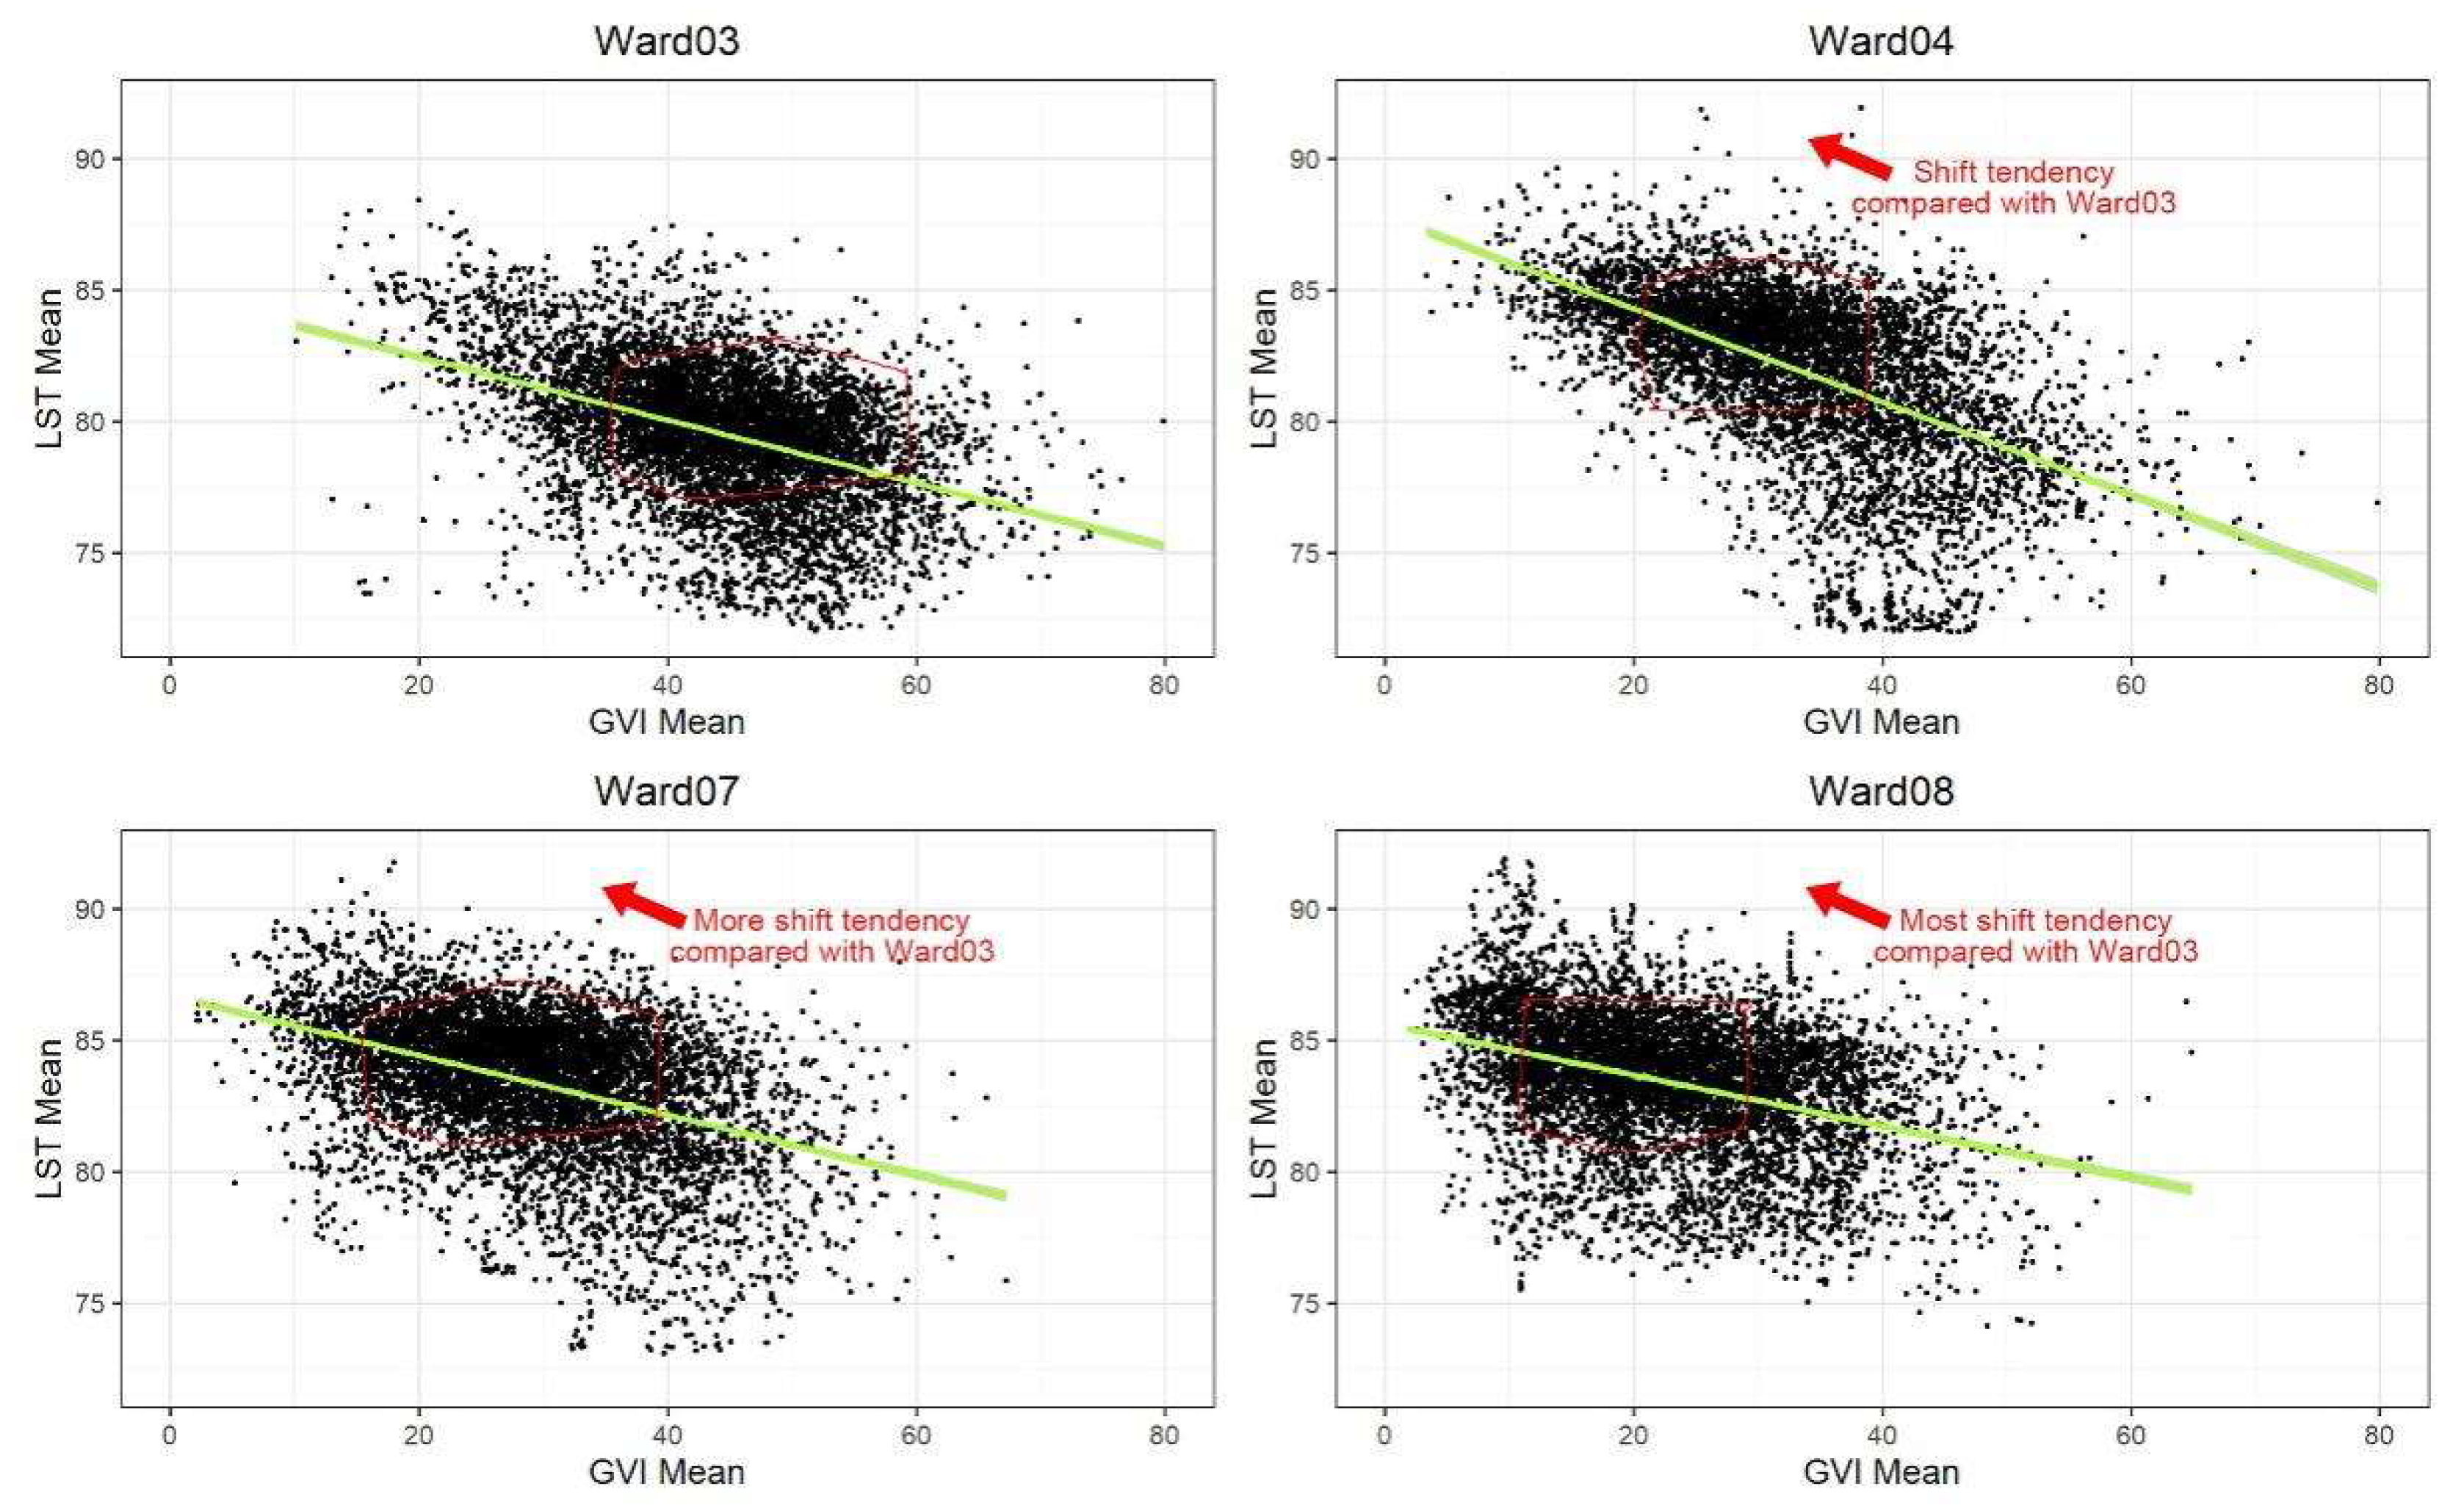
Figure 9.
The tree genus distribution and GVI by genus in Wards 3, 4, 7 and 8.
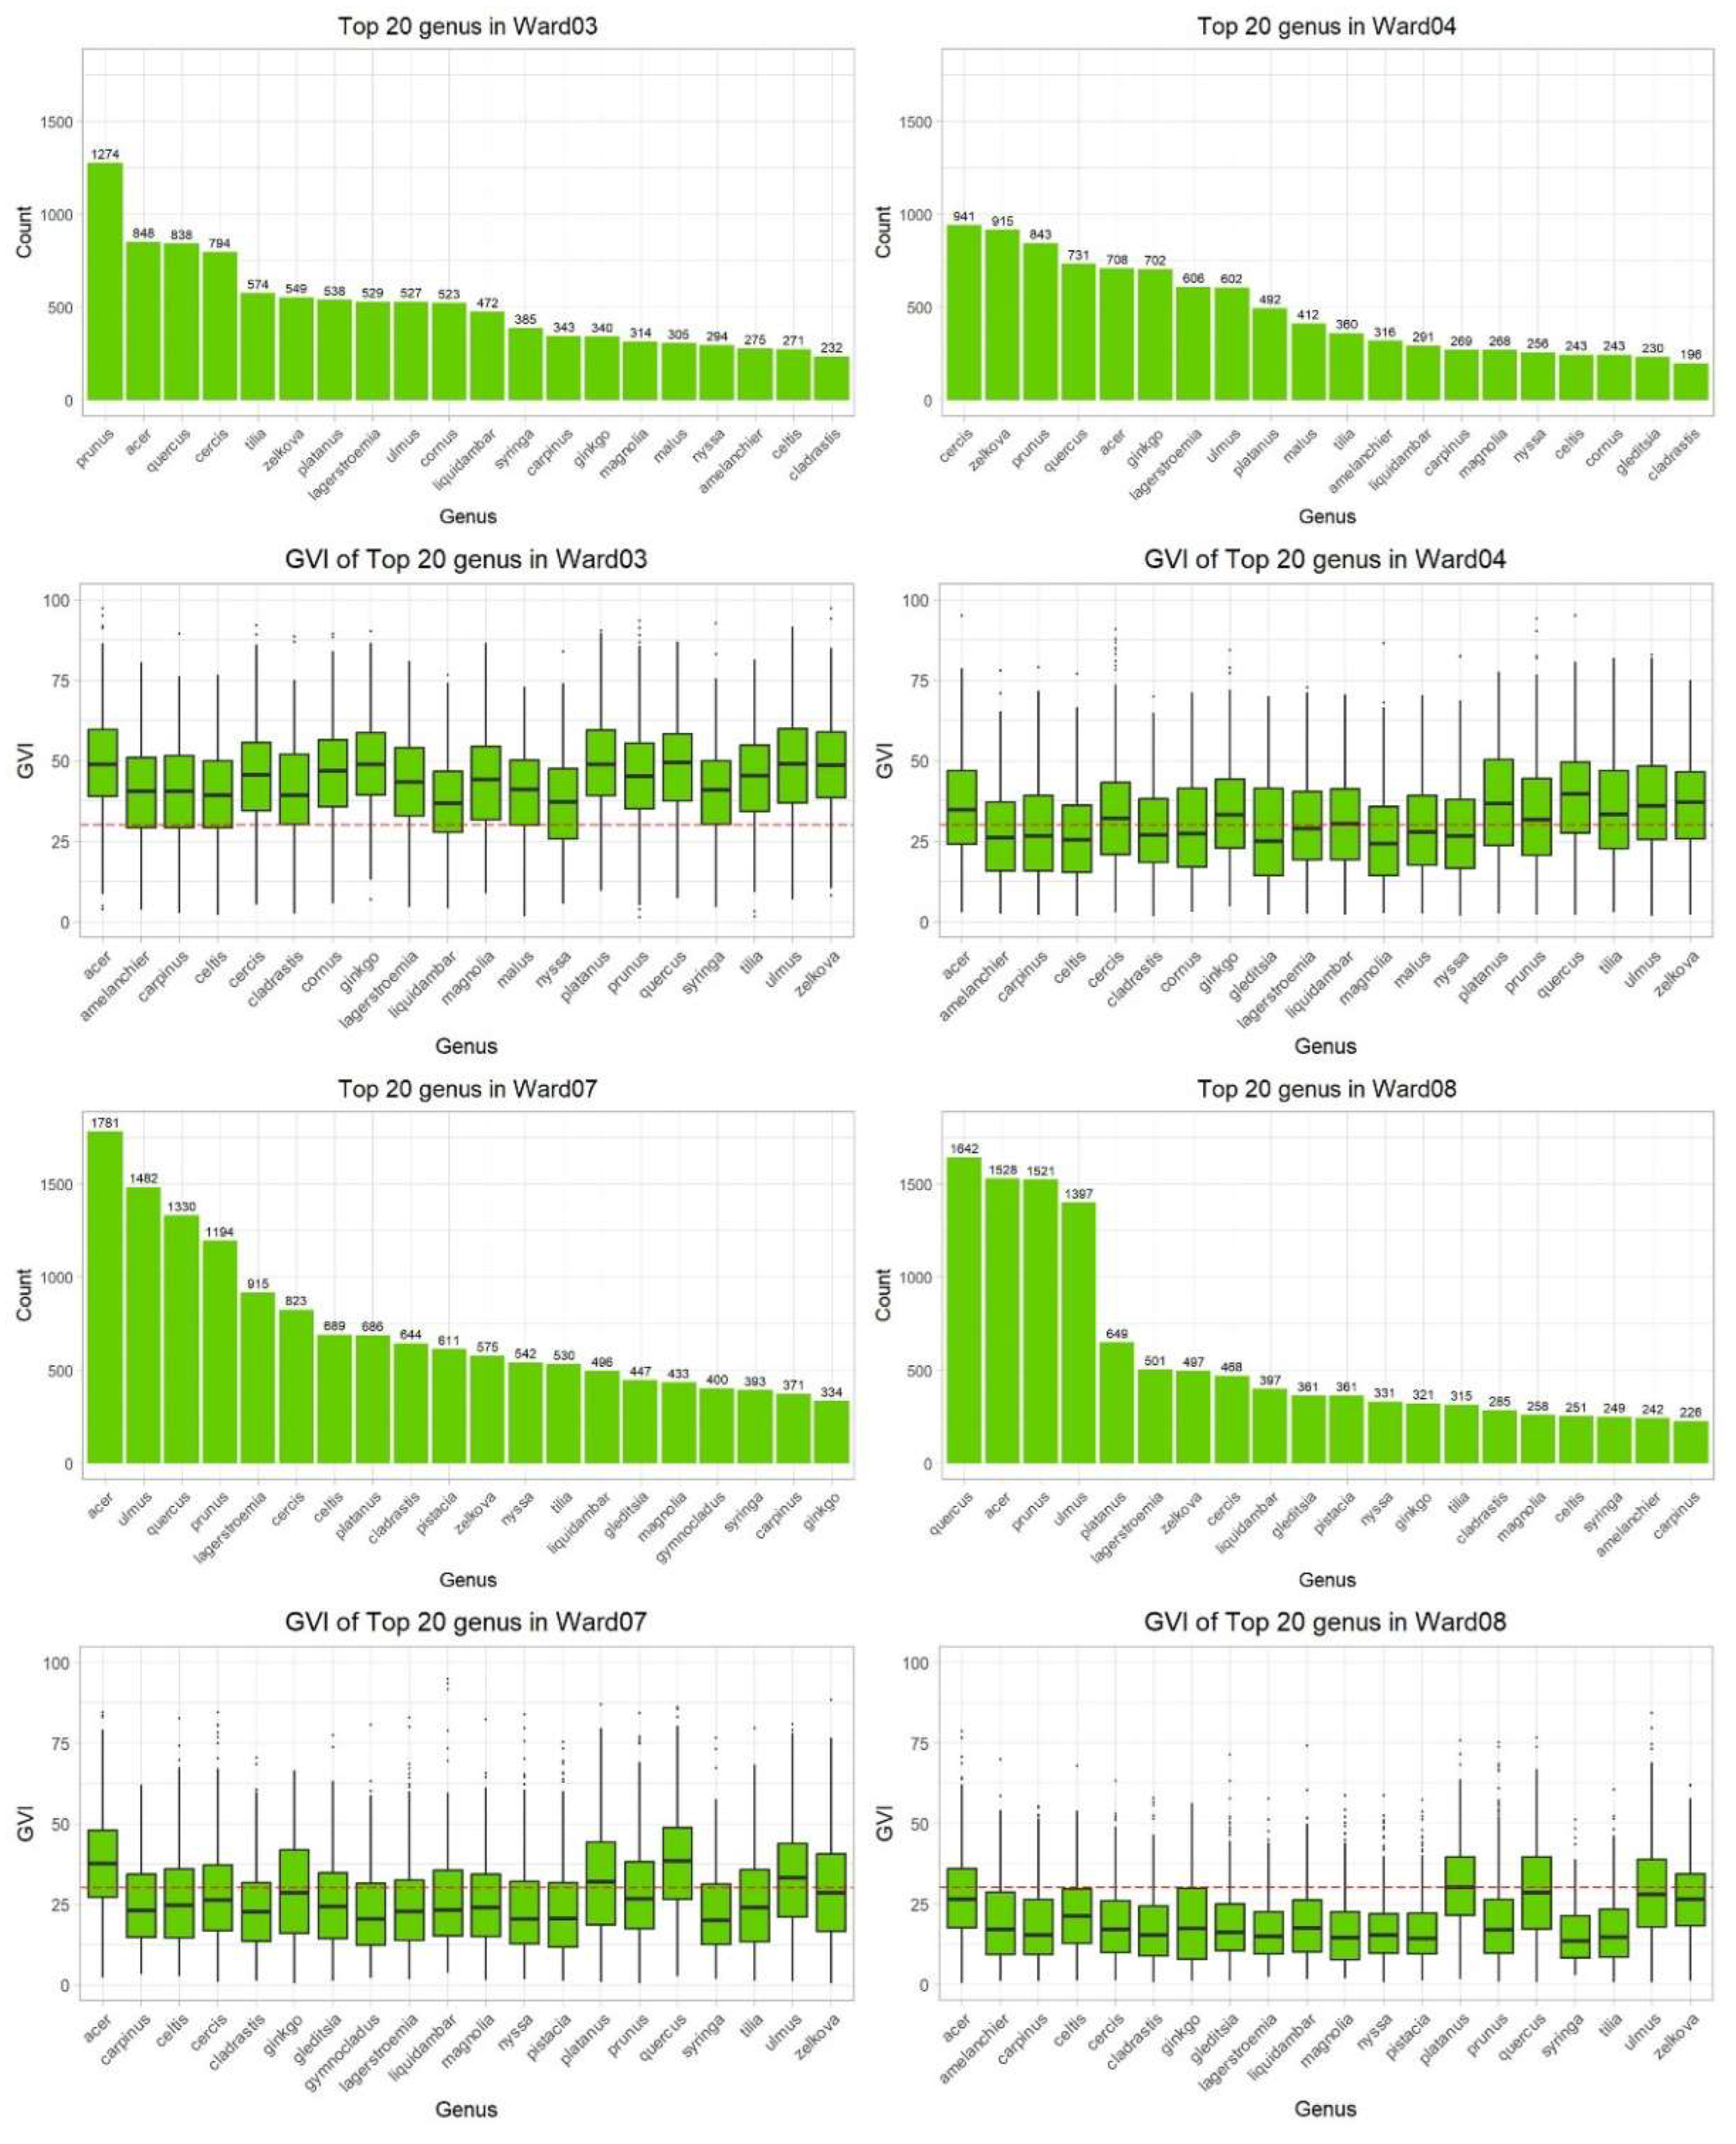
Figure 10.
The distribution of GVI mean by zoning category.
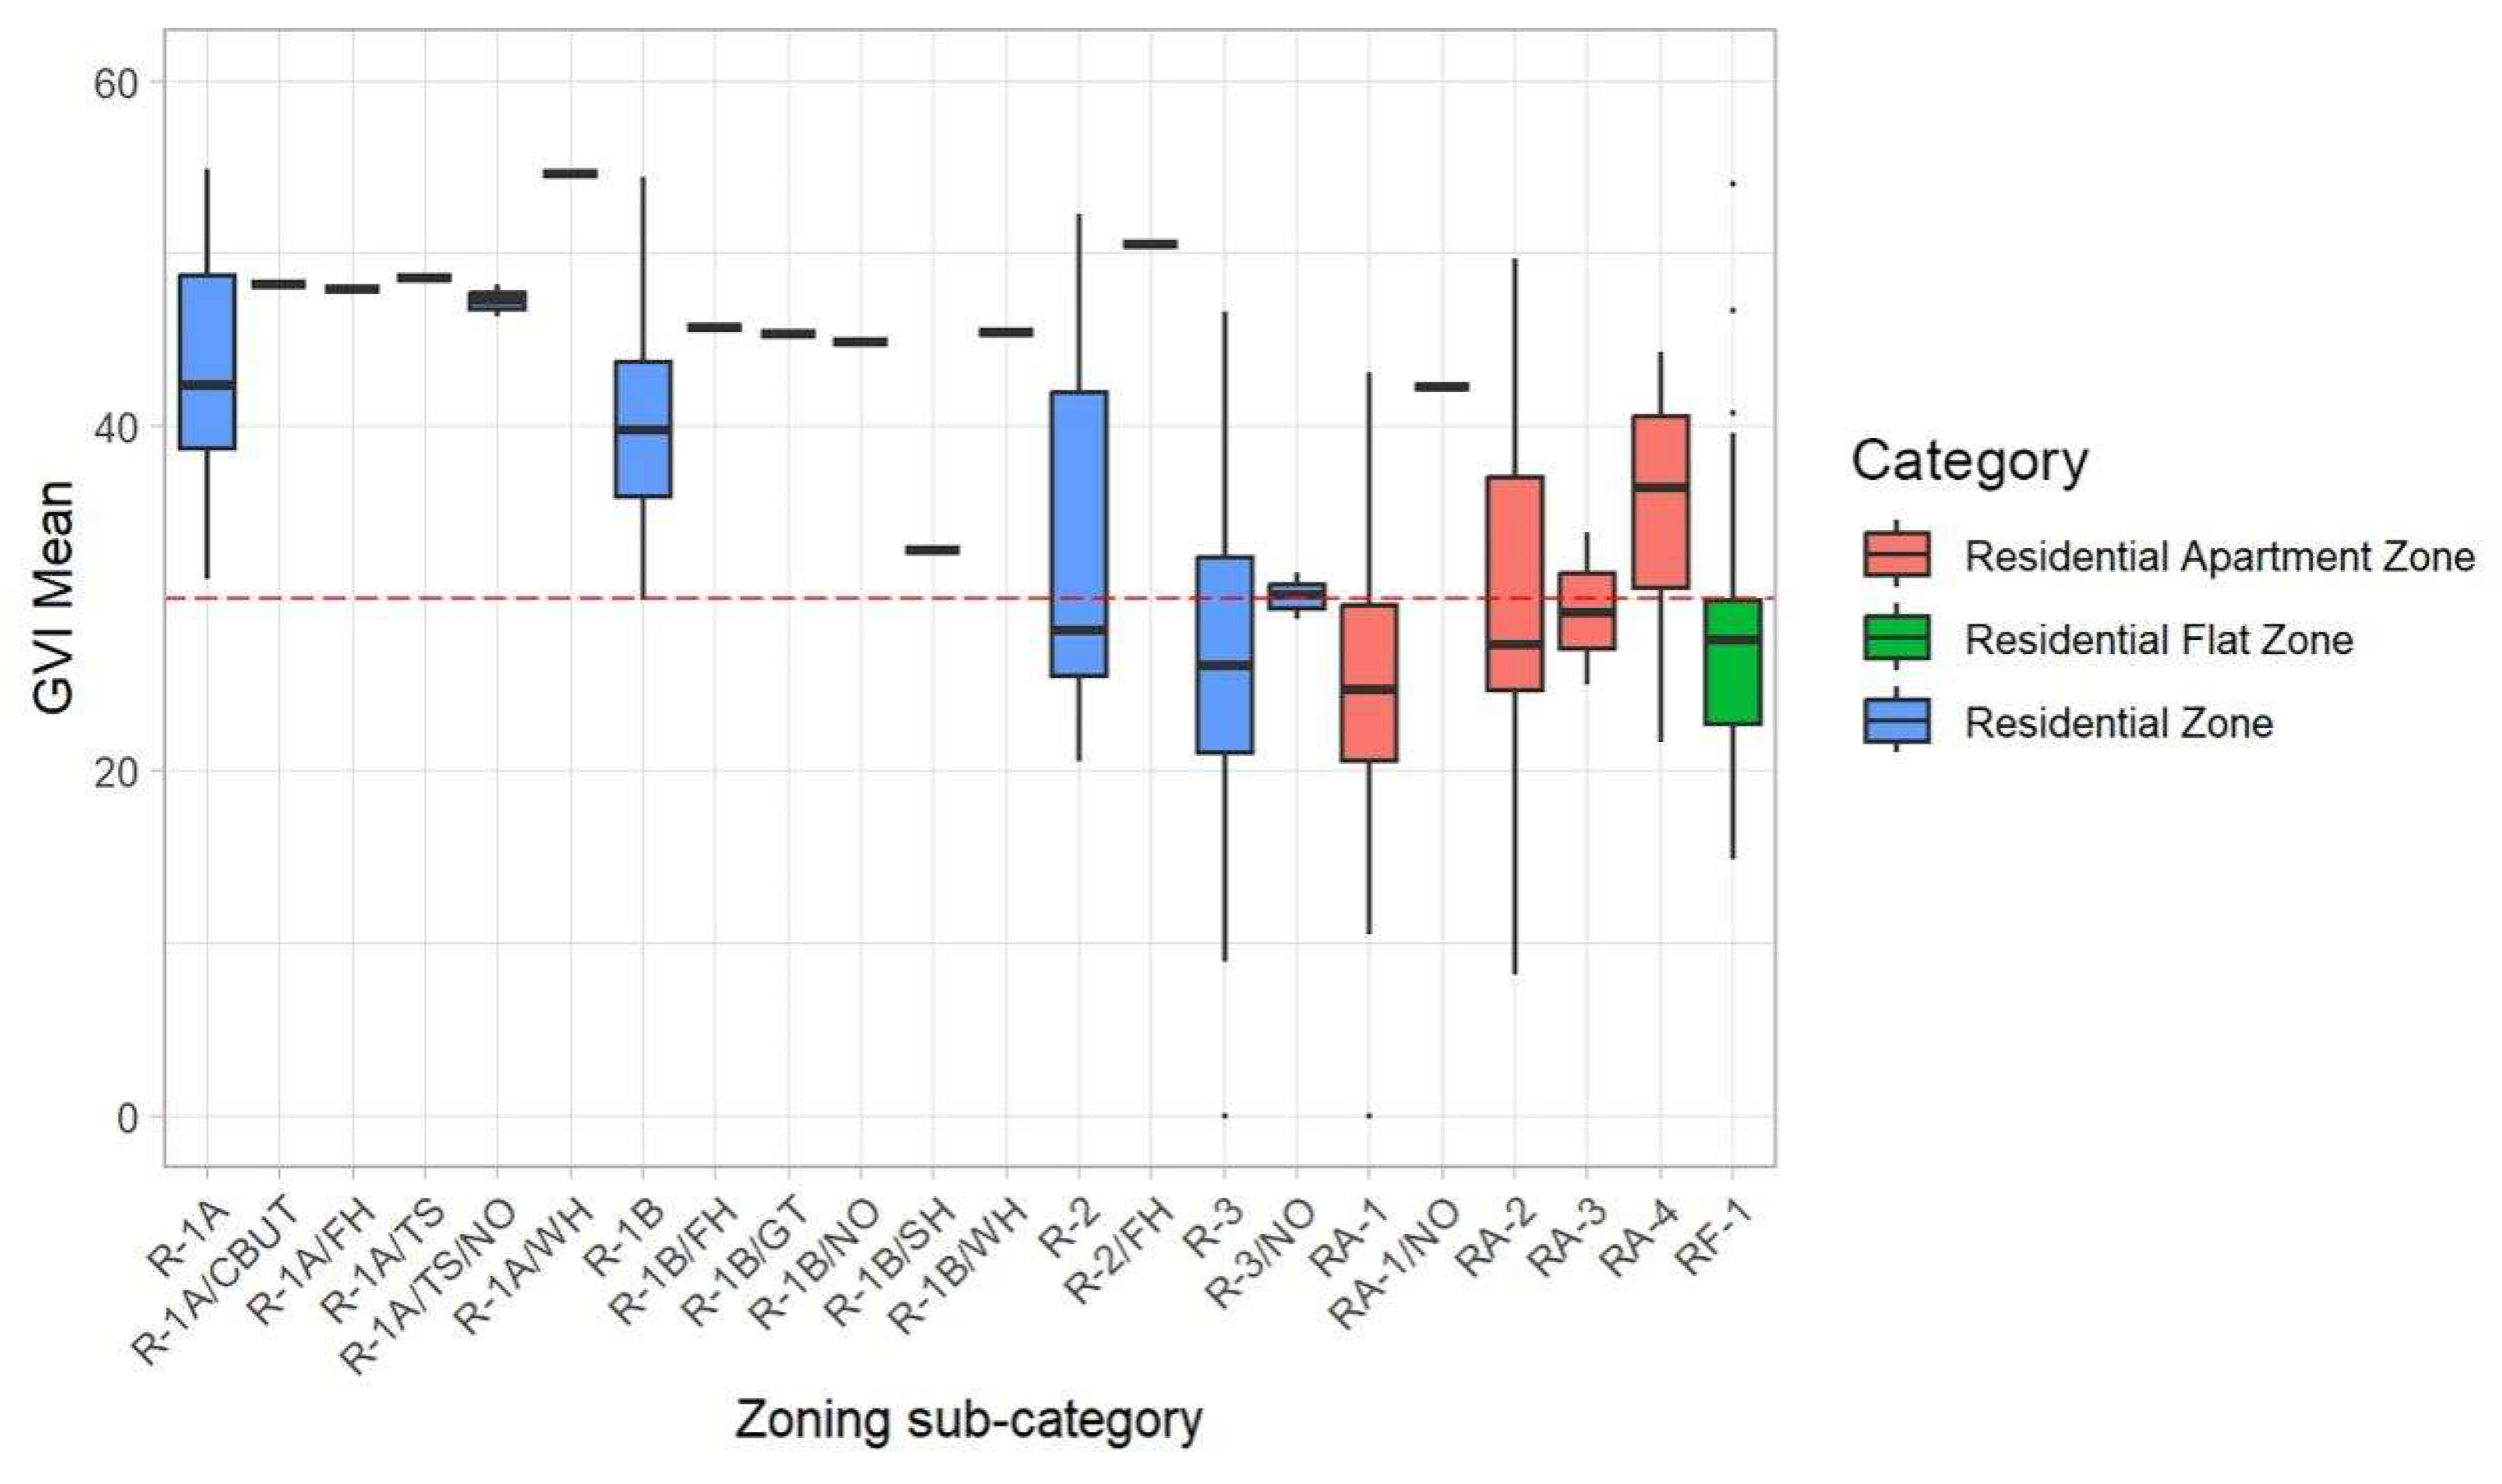
Table 2.
The subtle gaps between cooling effect of different dominated genera.
| Ward | Ranking | Genus | Number | Correlation coefficient (All p < 2.2e-16) |
Cooling effect |
|---|---|---|---|---|---|
| Ward 3 | 1 | Prunus | 1,274 | -0.52 | High |
| 2 | Acer | 848 | -0.43 | Low | |
| 3 | Quercus | 838 | -0.46 | Medium | |
| 4 | Cercis | 794 | -0.49 | High | |
| Ward 4 | 1 | Cercis | 941 | -0.49 | High |
| 2 | Zelkova | 915 | -0.50 | High | |
| 3 | Prunus | 843 | -0.52 | High | |
| Ward 7 | 1 | Acer | 1,781 | -0.43 | Low |
| 2 | Ulmus | 1,482 | -0.40 | Low | |
| 3 | Quercus | 1,330 | -0.46 | Medium | |
| 4 | Prunus | 1,194 | -0.52 | High | |
| Ward 8 | 1 | Quercus | 1,642 | -0.46 | Medium |
| 2 | Acer | 1,528 | -0.43 | Low | |
| 3 | Prunus | 1,528 | -0.52 | High | |
| 4 | Ulmus | 1,397 | -0.40 | Low |
Table 3.
500-meter buffer GVI differences by HPTF housing projects.
| Ward | Project name | Zoning | GVI | |
|---|---|---|---|---|
| Attribute | Value | |||
| Ward 3 | Woodley House | RA-2 | Only value | 43.51 |
| Ward 4 | NCCLT-905 R St. NW | R-1A | Highest value | 40.20 |
| Ward 7 | 1847-49 Good Hope Road, SE | MU-7B | Highest value | 30.96 |
| Ward 8 | Stanton Square Apartments | R-3 | Highest value | 28.24 |
Disclaimer/Publisher’s Note: The statements, opinions and data contained in all publications are solely those of the individual author(s) and contributor(s) and not of MDPI and/or the editor(s). MDPI and/or the editor(s) disclaim responsibility for any injury to people or property resulting from any ideas, methods, instructions or products referred to in the content. |
© 2024 by the authors. Licensee MDPI, Basel, Switzerland. This article is an open access article distributed under the terms and conditions of the Creative Commons Attribution (CC BY) license (http://creativecommons.org/licenses/by/4.0/).
Copyright: This open access article is published under a Creative Commons CC BY 4.0 license, which permit the free download, distribution, and reuse, provided that the author and preprint are cited in any reuse.


