Submitted:
09 October 2024
Posted:
10 October 2024
You are already at the latest version
Abstract
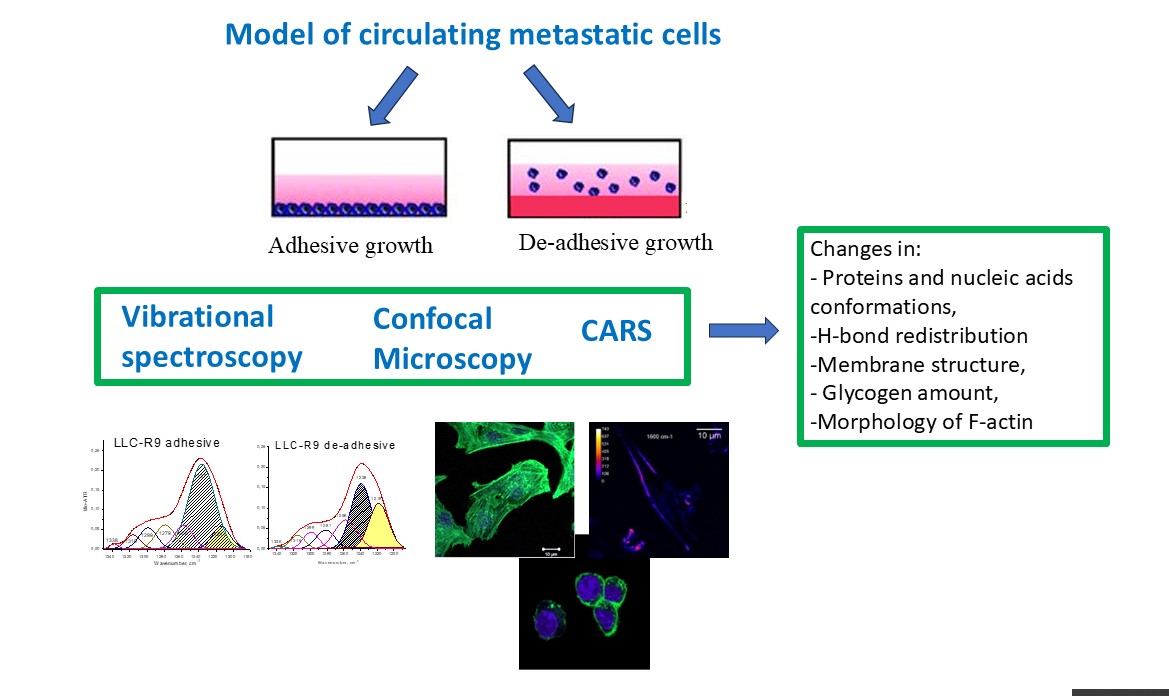
Metastasis in oncological diseases remains one of the main reasons for negative prognosis regarding treatment. Any new data on the biophysical and biochemical characteristics of circulating metastatic cells will help to develop the concept of antimetastatic therapy. In this study we found a number of differences in spectroscopic and morphological features of circulating metastatic cells. FTIR and Raman spectra of cultivated by adhesive and de-adhesive methods (last as a model for metastatic cells) have showed spectroscopic features, namely in FTIR in the region of CH - stretching vibrations associated with structural rearrangements in the cell membrane, as well as changes in the intensity and position of the PO2- group vibrations bands correlated with a proliferative activity. The spectral features in the regions of OH stretching and Amid I vibrations and other spectral markers of the metastatic cells under different cultivation conditions were derived. Raman spectra showed redistribution of amino acid Tyr/Trp ratio and in Tyr duplet intensity in the region of 500-900 cm-1 , as well different glycogen level in different cells. The spectroscopic markers are in the accordance with biochemical data. CARS and confocal optical microscopy were applied for determination a state of the cells and F-actin expression level that turned out to be higher for adhesive cells in comparison with de-adhesive cells. Shape and morphological property of the cells drastically differs. The correlation of vibrational markers with biochemical data and cytofluorometric method were discussed.
Keywords:
metastatic cells
; Lewis lung carcinoma tumour cells( LLC-R9)
; adhesive and de-adhesive cultivation
; spectroscopic and microscopic markers
; FTIR
; Raman
; CARS spectroscopy
; confocal microscopy
; F-actin expression
1. Introduction
Metastases are known as final stage of tumor progression, significantly complicate the course of cancer. Most deaths (> 90%) of cancer patients are not caused by the primary tumor, but by metastatic damage to vital organs. Metastasis is a process during which cancer cells spread from the primary tumor to distant organs and tissues in the patient's body. At the first stage of this process (metastatic cascade), the tumor cell must separate from the primary tumor and enter the bloodstream - become a circulating metastatic cell. [1,2].
Studying the biochemical and morphological characteristics of such cells is an extremely difficult task, because when they enter the blood, most of them die by apoptosis. However, a small part still survives and reaches another healthy organ, where secondary tumors (metastases) develop.
Carcinoma is the most common type of cancer, accounting for 80% to 90% of all neoplasm diagnoses. Carcinoma forms in the epithelial tissue that lines various organs, internal body cavities, and the skin. One of the properties that distinguishes normal epithelial cells from tumor cells with metastatic potential is adhesiveness. Cell adhesion is the process by which cells interact and attach to neighboring cells through specialized cell surface molecules. When adhesion is disrupted, it leads to the death of normal epithelial cells by apoptosis. Metastatic tumors contain metastatically active cells that can survive by detaching from the main body of the tumor.
The latest research made it possible to identify the main biological phenomena that ensure the process of metastasis, including the epithelial-mesenchymal transition of cells, during which epithelial intercellular contacts are lost (adhesion disorders), reorganization of the cytoskeleton, changes in the shape of cells, while epithelial markers (cytokeratins, occludin, E -cadherin) are replaced by mesenchymal ones (N-cadherin, vimentin). Also important is the formation of clusters of circulating metastatic cells with other cells, including normal cells, as well as the important influence of the microenvironment [3,4]. The task of developing an effective model of circulating metastatic cells is important both for studying the mechanisms of metastasis and for developing new antimetastatic drugs. In our previous works [5,6] it was shown that the transition from adhesive to non-adhesive growth is accompanied by differences in glucose consumption, lactate production, intracellular level of ROS (reactive oxygen species) and proliferative heterogeneity of LLC cells.
Since the end of the last century, biomedical vibrational spectroscopy began to develop actively and became a separate field of biophysical research [7]. The methods of Infrared and Raman spectroscopy are widely applied for testing of molecular structure and conformation states of biological polymers [8] as well organization of complex molecules, drug influence on the organelles, cells, tissue, viruses, diagnostics of diseases [9,10] etc. New methods as Surface enhanced infrared absorption (SEIRA) [11,12] and Surface enhanced Raman scattering spectroscopy (SERS) [13,14] drastically enhanced a sensitivity of the methods of vibrational spectroscopy. Application of non-linear optical methods as Second Harmonic Generation (SHG) [15] and Coherent anti-Stocks Raman Scattering (CARS) spectroscopy [16,17] and imaging introduced new possibilities by recording not only the spectrum but also the image in mapping mode, identifying of organels [18], proteins, lipids, DNA etc. [19,20] etc. with greater sensitivity than in linear optics.
The spectroscopic data analyzed and processing with different mathematical approaches including cluster analyses, principal component analysis, neural networks etc. that is a fundamental for different base data and artificial intelligence now and in nearest feature [7].
Despite the fact that much attention was paid to the study of tumor cells and tissues by spectroscopic methods and significant obtained results [21,22], there is practically no data on metastatic cells. Here we present vibrational and microscopic data on models of metastatic cells, arising from oncological disease. The determination of the biophysical and biochemical characteristics of circulating metastatic cells can give us a new concept for antimetastatic therapy as well clear up the mechanism of disease.
Here we are going to state spectroscopic markers of metastatic Lewis lung carcinoma tumour (LLC-R9) cells based on adhesive and de-adhesive models, features of the cell morphology as well cytoplasm protein F-actin expression level by confocal and biochemical methods.
2. Materials and Methods
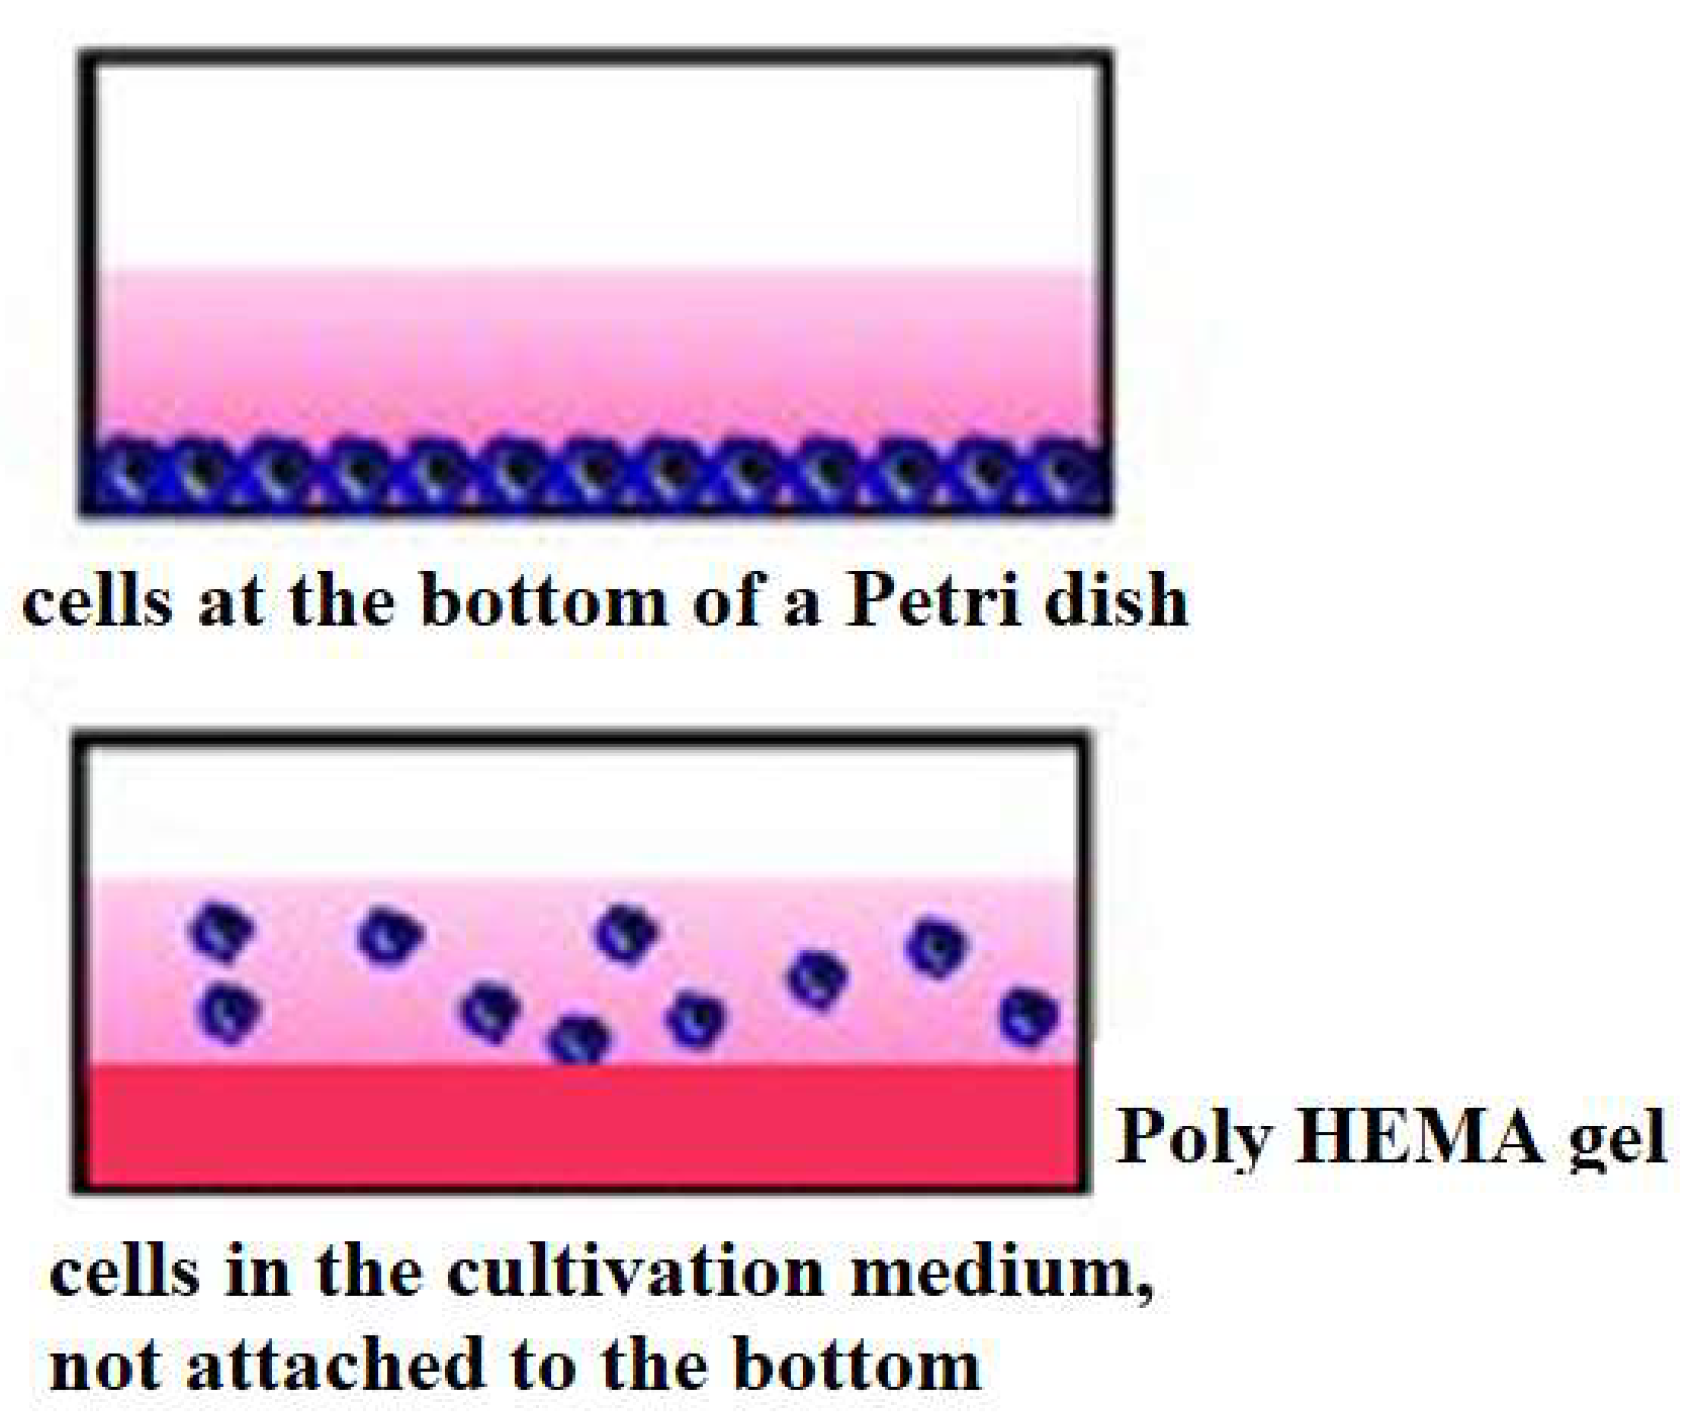
Cells from the National Bank of Cell Lines and Tumour Strains of the IEPOR (Kavetskiy Institute of experimental pathology, oncology and radiology) of the National Academy of Sciences of Ukraine were used in the study, namely Lewis lung carcinoma cells LLC/R9. This tumor cell strain was obtained as a result of a number of chemotherapy courses and is resistant to cisplatin, as well as having a high angiogenic potential and being less metastatically active than the original LLC strain [6,23,24]. The cell cultures were grown in vitro at 37°C in a humidified atmosphere with 5% CO2 in RPMI 1640 incubation medium containing 10% fetal calf serum, 40 μg/ml gentamicin and 2 mM L-glutamine. LLC/R9 cells in the amount of 0.3 × 10⁶ were seeded in 60-mm Petri dishes. These dishes were either pretreated with poly-HEMA solution to model a de-adgesive growth or left untreated to model an adhesive cell growth. The cells were then incubated for 3 days without changing the incubation medium. The original cells were taken as a zero point.
Figure 1.
Picture of incubation of tumor cells during their adhesive and de-adhesive growth. For the latter, Petri dishes were treated with poly-HEMA solution.
Figure 1.
Picture of incubation of tumor cells during their adhesive and de-adhesive growth. For the latter, Petri dishes were treated with poly-HEMA solution.
Staining of LLC/R9 cells during adhesive growth was performed when cells were grown on coverslips. The staining of LLC/R9 cells under de-adhesive growth was carried out in suspension (1.5 x 10⁶ cells) to preserve the native shape of the cells. Coverslips with cells were fixed in 4% formalin in FSB at 370 C for 15 minutes, after which the cells were washed 3 times with 3 ml of FSB and permeabilized in 0.5% Triton X-100 in FSB at room temperature for 1 hour for phalloidin staining -iFluor48), after which FSB was washed 2 times. Blocking of nonspecific binding was performed by incubating coverslips or cells in 10% ETS in FSB for 1 hour at room temperature. After blocking cells were stained with phalloidin in 10% ETS/FSB at a dilution of 1:1000 at room temperature for 1 hour. After staining, the coverslips and cells were washed with FSB 3 times, and drugs were embedded in ProLong Glass Antifade Mountant with NucBlue (cat. number P36983, Invitrogen, USA) with its polymerization overnight, after which microscopic studies of cell visualization were performed.
The Raman spectra of the cells were recorded at room temperature in the backscattering geometry using a Horiba Jobin-Yvon T64000 triple Raman spectrometer (200 ÷ 1700 nm) with solid-state lasers Spectra Physics EXLSR-532-150-CDRH (532 nm).
FTIR spectra of the cells were recorded at room temperature using INVENIO-R (Bruker) instrument in 3800–600 cm−1 region in the attenuated total reflection mode. For tis reason we used Bio-ATR attachment, wich was created by Bruker Optics GmbH especially for investigation of biomolecules, cells and tissue. The wavenumber accuracy was about 0.01 cm-1, and the absorbance accuracy was about 0.1%. For registration of ATR spectra samples were deposited on a working surface of the Bio-ATR attachment and then dried in the nitrogen flow at room temperature. All FTIR spectra were baselined and normalised at the maximum of Amid A band at 3290 cm-1 region . The positions of the absorbance bands were determined using the OPUS 8.2 software (Bruker). For spectra deconvolution the PeakFit4.0 program was used, the band contour was approximated by a Gaussian curve.
Images of cells stained with fluorescent dyes were obtained on a laser scanning confocal microscope Carl Zeiss (Germany) LSM 510 META. The research was carried out in three modes: in the light microscope mode (in the light of a halogen lamp, which illuminated the sample), in the fluorescent microscope mode (in the light of an ultraviolet mercury lamp HBO-103 W/2, which excited the fluorescence of dyes), as well as in the confocal microscope mode (excitation of fluorescence of dyes using lasers). A Plan-Apochromat 40x/1.30 Oil DIC objective was used to obtain overview images of cells, and a Plan-Apochromat 100x/1.4 Oil DIC objective was used for more detailed ones. Confocal images were obtained in the MultiTrack mode, when the fluorescence of the dyes was excited and their fluorescence was recorded. A diode laser (λ = 405 nm, 25 mW) was used to excite the Hoechst 33342 dye, and a BP 420-480 nm emission light filter was used to record fluorescence. An argon laser (λ = 488 nm, 30 mW) was used to excite the iFluor 488 dye, and a BP 505-570 nm emission light filter was used to record fluorescence.
We used an unique home-made CARS system assembled at the Lithuanian Centre for Physical Research and Technology, Vilnius (FTMC). The system onsist on a simple and compact picosecond pulsed Nd:YVO4 laser EKSPLA Ltd with a pulse repetition rate of 1 MHz and an optical parametric oscillator with a tunable frequency from 700-4500 cm-1.
3. Results
Fourier transform infrared spectroscopy (FTIR) is a powerful tool for studying biological objects such as biomolecules, cells and tissues. Unlike staining procedures and other biochemical analysis methods, this technique is fast, non-invasive and does not require additional treatment with drugs or dyes. Spectral differences between cancerous and normal cells indicate the differences in metabolic processes and allow them to be distinguished. FTIR spectroscopy provides us with a tool that allows one to establish a molecular level correspondence between spectral markers and morphological features in the structure of the objects under study. However, the widespread use of the infrared spectral method in biology, biochemistry and clinical practice faces certain difficulties due to the complexity of identifying and deciphering spectral information. The infrared absorption spectrum of a cell is a superposition of the absorption of its molecular components such as proteins, lipids, nucleic acids [25]. In our previous works, we have performed spectral analysis of cellular components [10,11] of normal and pathological cells [26,27].
The following model was used to analyze the FTIR absorption spectra (see Figure 2). The high frequency region of 3800-2400 cm-1 refers to the absorption of hydrogen-bonded OH and NH molecular groups. The regions of CH stretching (the bands centered at 2950, 2920, 2880, and 2850 cm-1 ) are related to the absorption of lipids and bending vibrations (the bands 1460-1320 cm-1 ) are mainly related to the absorption of proteins [28]. Proteins are the major contributor in the 950–1700 cm-1 region whereas lipids are the major contributor in the 2800–2950 cm-1 region. DNA, RNA, and glycogen only make substantial contributions between 950 and 1300 cm-1, and even over most of this range protein is a major contributor. There are no DNA or RNA absorbance bands that do not overlap with other components.
The last metric, the ratio of the peak height at 1400 cm-1 to the peak height at 2852 cm-1, which is approximately a measure of protein/lipid content, The absorption of the protein fraction is analysed by the Amide I (centеred near 1645 cm-1) and Amide II (centred at about 1545 cm-1) bands. The protein component of the cell is characterised by the absorption of the amide group, i.e. the peptide bond - CO-NH- vibration bands. The amide I and amide II absorption bands have clearly defined frequencies for the α-helix, β-sheet and disordered polypeptide chain structure, which allows for conformational analysis of the secondary structure of the protein fraction.
For the polypeptide chain ordered conformations, the absorption band at 1658 cm-1 can be separated into several components due to specific interactions between neighboring peptide groups. For the antiparallel β-sheets, the most intense component is observed at 1632 cm-1 and the weakest at 1685 cm-1. The α-helix structure is characterized by a strong band at 1650 cm-1 and a weak band at 1646 cm-1 [29]. The contribution from the nucleic acid fraction in the FT-IR spectrum of a cell overlaps with the contribution from the protein (in the 1800-1500 region) and lipid fractions (in the РО2- region), but in the absorption region of РО2- (1240, 1080) groups, contribution from the phosphate backbone of nucleic acids [30] dominates.
3.1. IR spectral Analysis of Tumor Cells LLC-R9
Significant differences in the FT-IR absorption spectra of LLC-R9 cells grown under adhesive or de-adhesive methods were registered in the regions of hydrogen bonds (3600-3000 cm-1), vibrations of the lipid fraction (3000-2850 cm-1), proteins (1700-950 cm-1) and nucleic acids (1350-950 сm-1).
In the spectral regions of hydrogen-bonded OH groups vibrations, an increase in the contribution of weak hydrogen bonds is observed for de-adhesive LLC-R9 cells, which is manifested as broadening of the Amide A band, although the position of the band remains the same for all three samples (3290 cm-1, NH stretching vibrations) (Figure 3).
The area of the low-frequency shoulder (from 3400 to 3700 cm-1) for cells grown by the de-adhesive method is 399, by the adhesive method - 312, for the zero point this indicator is 308.
According to the theory of hydrogen bonds, it can be assumed a weakening of hydrogen bonding in case of de-adhesive growth (we register a rise in shoulder intensity at 3450 cm-1 while the peak of intensity is located at 3290 cm-1). Appeance of the shouder at 3450 cm-1 corresponds to a decrease in the energy of H-bonding [31,32], formula (1).
-ΔH (kcal/Mol) = 0.3(ΔνOH – 40)1/2 (1)
According to [33] the position of free OH is equalled to 3700 cm-1. Estimation according (1) shows the appearance of new H-bonding, which is on average 1.4 kcal.mol less for de-agesive cells in comparison with adgesive once.
In the region of СH stretching vibrations, we registered more intense СH2 vibration bands (centred at 2923, 2852 cm-1) for LLC- R9 zero point cells, while the contribution of the СH3 vibrations remains unchanged. In this case, the method of cultivation - adhesive or de-adhesive - does not significantly change the region of CH stretching vibrations, however, as compared to the zero point cells, we have a decrease in the contribution from CH2 and an increase in that from CH3 groups vibrations, which may indicate changes in the structure of the cell membrane.
In the Amide I absorption region of (Figure 4), we noted the differences in the width and position of this band for LLC-R9 upon their adhesive and de-adhesive growth. In particular, upon de-adhesive growth, the Amide I band has a symmetrical structure with a maximum near 1644 cm-1 , which can be attributed to the predominant contribution from α-helical protein components. Such features may be directly related to the proliferative heterogeneity of the two cell strains. In particular, this observation is consistent with the previous findings that LLC-R9 strain on the third day of cultivation has a predominant contribution from the G2/M phase, characterised by active protein synthesis [6] . For a more detailed analysis of this spectral region, the Amide I band was decomposed into components. The following model assignment of the components was used: α-- helix 1645 cm-1, β - sheet folded structures 1690 cm-1 and 1630 cm-1, turns 1675 cm-1, side groups 1615 cm-1, disordered structure 1659 cm-1 (see Figure 3 and Table 1 [29]. The conformational analysis confirms a larger contribution from α-helical protein components for the cells grown by both adhesive and de-adhesive methods, but the contribution from the disordered form increases for the de-adhesive growth method.
The analysis of the РО2- asymmetric vibration band (Figure 3 and Figure 4) shows a lower- frequency position for LLC-R9 under the adhesive growth - 1237 cm-1 and 1238 cm-1 under the de-adhesive growth. However, in the case of the adhesive growth, there is a major contribution from the central maximum corresponding to the α-form of DNA, while the lateral components corresponding to other forms of DNA are weaker. And in the case of the de-adhesive growth, the contribution of the component at 1218 cm-1 increases significantly.
Thus, de-adhesive cells show more proteins and DNA conformations in comparison with adhesive forms and membrane reorganization. Indicators of the transformation are redistribution of H- bonds, changes in CH stretching vibrations, Amid 1, phosphate bonds as well transformation in the low-frequency region responsible for vibrations of big parts of the molecules.
Figure 5.
Decomposition of РО2- asymmetric stretching vibration band of LLC- R9 cells under their adhesive (a) and de-adhesive (b) growth.
Figure 5.
Decomposition of РО2- asymmetric stretching vibration band of LLC- R9 cells under their adhesive (a) and de-adhesive (b) growth.
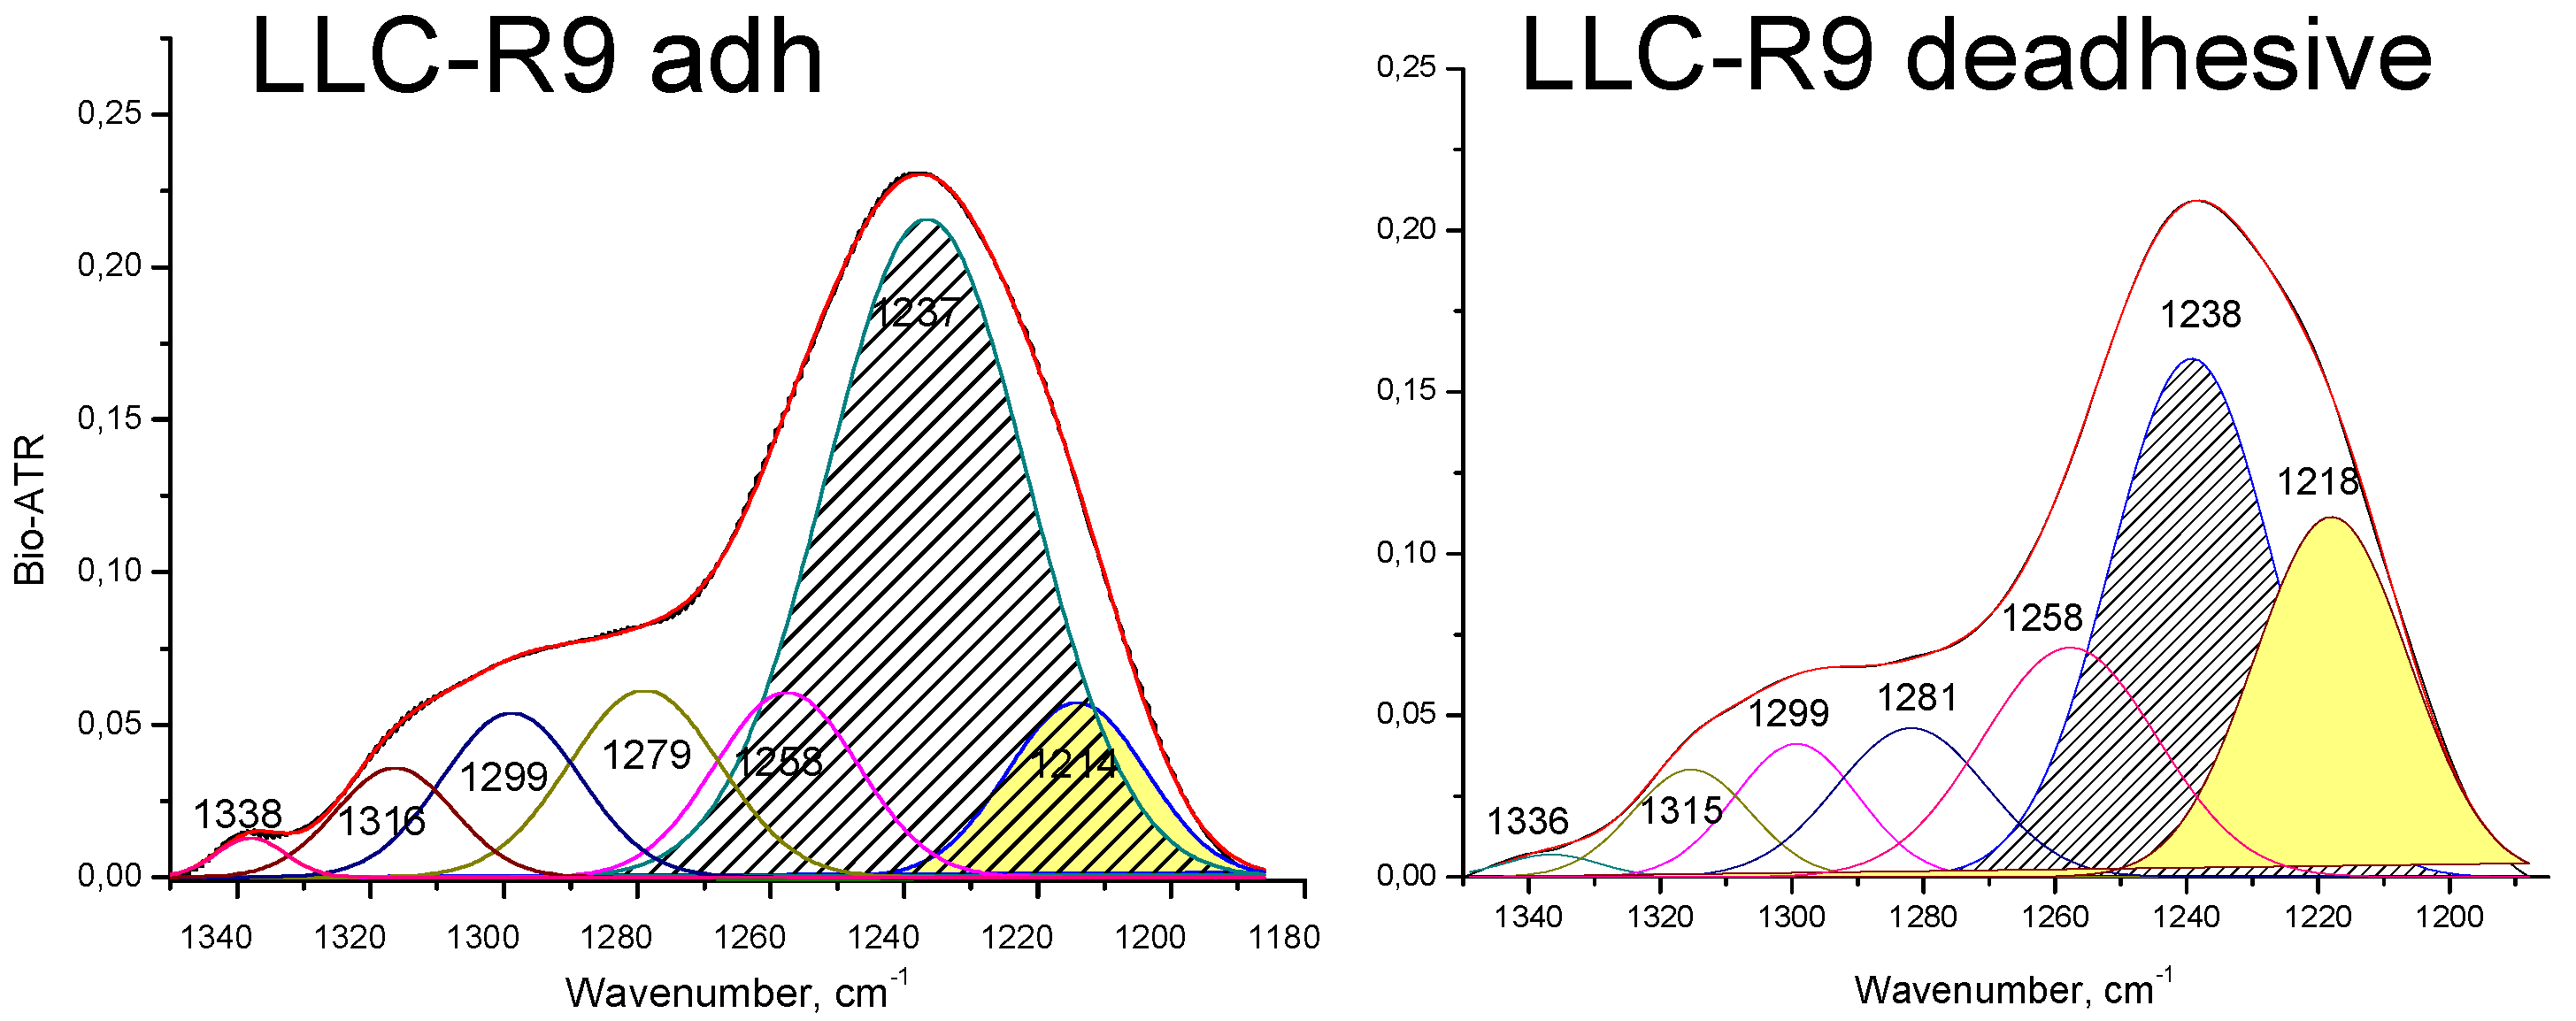

Table 2.
LLC-R9 cells absorption band assignement.
| LLC-R9 | |||
| De-adhesive | Adhesive | Zero point | Assignment |
| 3450 | 3450 | 3450 | Str OH |
| 3288 | 3286 | 3290 | Amid A, Str NH, |
| 3066 | 3068 | 3068 | Amid B, Fermi resonance Amid II |
| 2959 | 2959 | 2956 | Str CH3 asym |
| 2923 | 2925 | 2923 | Str CH2 asym |
| 2873 | 2872 | 2872 | Str CH3 sym |
| 2851 | 2852 | 2852 | Str CH2 sym |
| 1735 | 1735 | Str C=O | |
| - | - | 1657 | Amid I, Str C=O, Str C-N, Def N-H |
| 1644 | 1645 | 1649 | Amid I, Str C=O, Str C-N, Def N-H, def OH |
| 1543 | 1542 | 1544 | Amid II, Str C-N, Def N-H |
| - | - | 1533 | Amid II, Str C-N, Def N-H |
| 1451 | 1454 | 1455 | Def CH2 |
| 1398 | 1396 | 1393 | Def CH3 |
| 1238 | 1237 | 1240 | Str РО2- asym |
| 1218 | 1214 | Str РО2- asym | |
| 1170 | 1171 | 1171 | Str C-C, def C-OH, strC-O, C-OH |
| 1084 | 1081 | 1083 | Str РО2- sym |
| 1058 | 1062 | 1063 | Str C-O deoxyribose |
| 990 | 987 | C-C, C-O DNA and deoxyribose | |
| 970 | 973 | 967 | C-O DNA and deoxyribose |
| 917 | 917 | 925 | C-C, C-O |
| 858 | 858 | 854 | C3’ endo/anti (A-helix of DNA) |
| 834 | 835 | 835 | C2’ endo/anti (B-helix of DNA) |
| 778 | 780 | 782 | Out-of-plane bend |
| 699 | 701 | Out-of-plane bend | |
| 678 | C-C-H out-of-plane bend | ||
| 655 | 660 | C-C-O out-of-plane bend | |
3.2. Analysis of Raman Spectra
In the CH stretching vibrations region, we do not observe any significant differences between the two cultivation methods. However, in the low-frequency region of 400-900 cm-1 there are different components contributions attributed to individual amino acids: tyrosine (Tyr), tryptophane (Trp) etc. For example, the band in the region of 856-830 cm-1 is attributed to out of plane ring breathing (854 cm-1) and 825 cm-1 to in plane ring breathing, the band in the region of 780-750 cm-1 to tryptophan. The ratio between the bands 854 cm-1 to 825 cm-1 is marker for the H-bonding environment changes influencing the structural transformation in proteins [34, tabl 3]. Ratio increase from 1.33 to 1,67 possibly means a transtion Tyr from electron acceptor type interaction in H-bonding to donor type [34]. Tyr can indicate changes in intermolecular interactions due to environmental changes and the reorganization of proteins under de-adhesive method of cell growth.
The another band at 484 cm-1 refers to glycogen uptake, which is more intense for de-adhesive growth. Such changes may indicate the differences in metabolic processes. This is consistent with previous conclusions drawn from the IR spectroscopic studies.
Figure 6.
Raman spectra of LLC- R9 cells grown under adhesive and de-adhesive method in the region of 3600-250 cm-1.
Figure 6.
Raman spectra of LLC- R9 cells grown under adhesive and de-adhesive method in the region of 3600-250 cm-1.
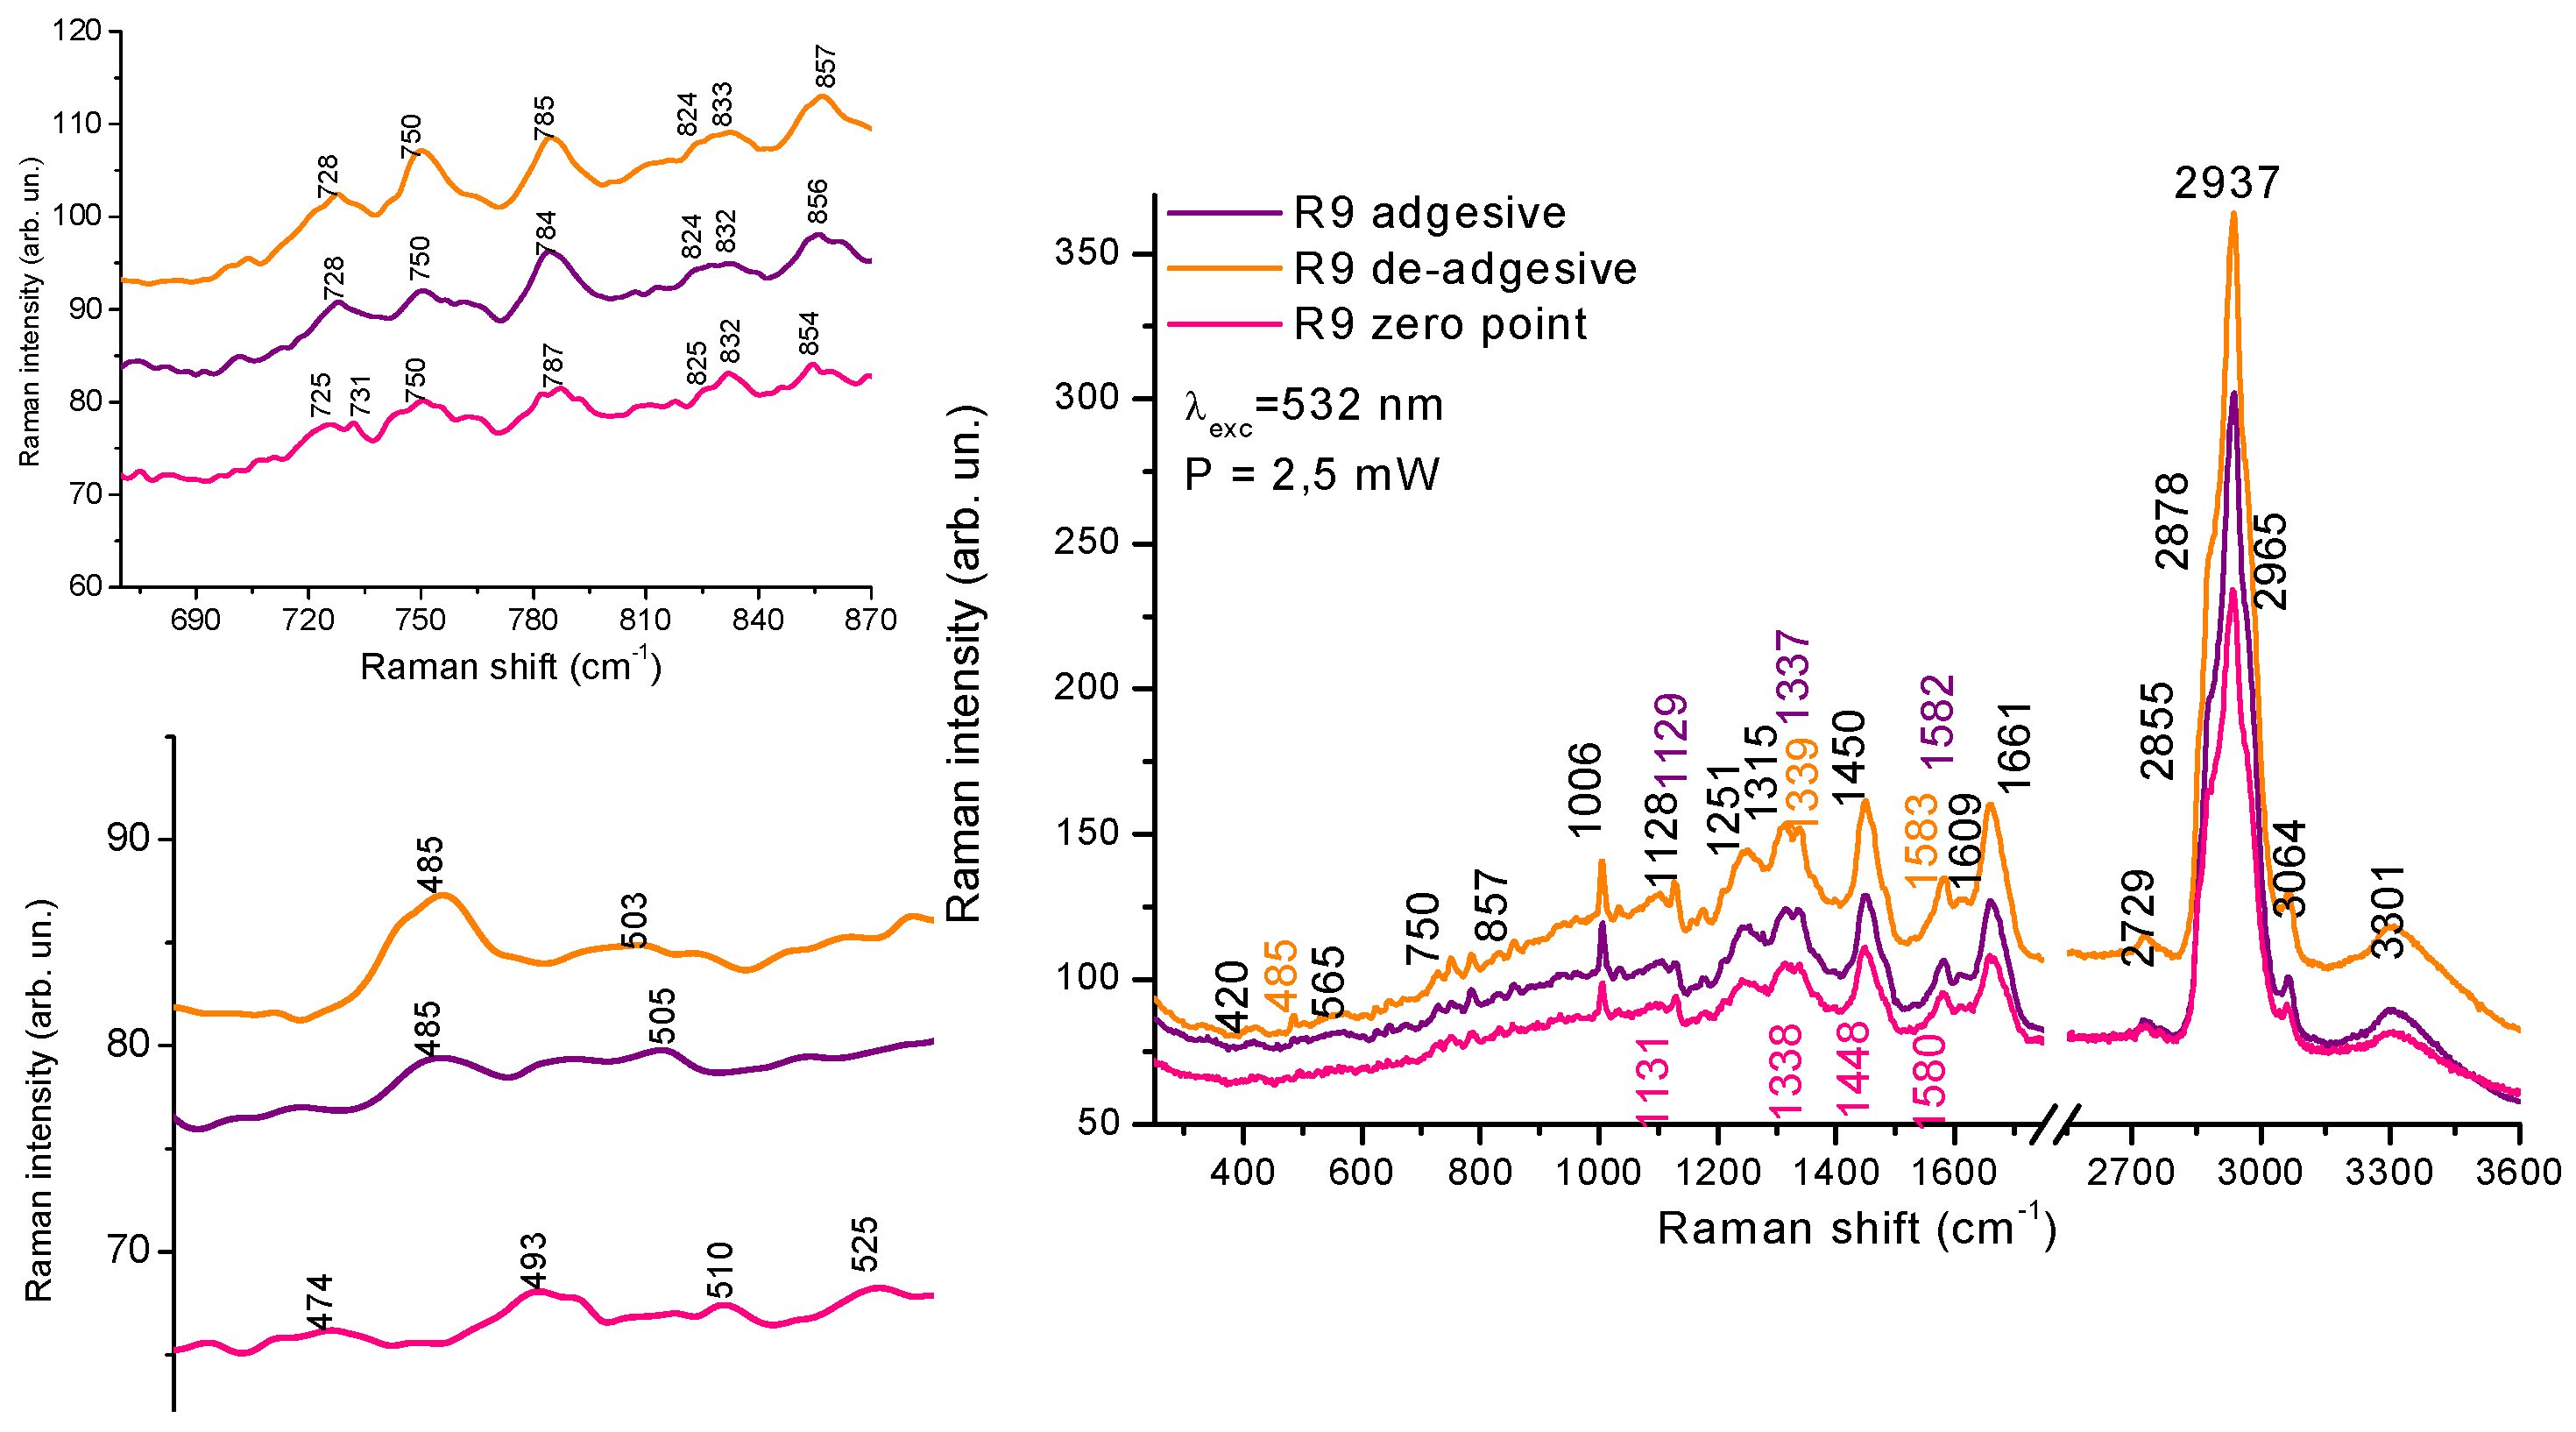
Table 3.
Ratio of intensity of Tyr\ Trp, Tyr\Tyr , Trp\DNA and intensity in arbitrary inits of glycogen for the cells of different cultivation.
Table 3.
Ratio of intensity of Tyr\ Trp, Tyr\Tyr , Trp\DNA and intensity in arbitrary inits of glycogen for the cells of different cultivation.
| 825 Tyr/750Trp | 854Tyr/825 Tyr | 750 Trp/785 DNA | Glycogen, a.u. | |
| De-adhesive | 0,43 | 1,67 | 1,0 | 4,77 |
| Adgesive | 0,50 | 1,33 | 0,85 | 1,85 |
| Zero-point | 0,60 | 1,33 | 0,83 | - |
Raman spectra showed features in the region of 400-900 cm-1, assigned to different aminoacids, DNA and glycogen, namely, redistribution in Tyr duplet intensity,854/825, ratio of Tyr/Trp and Trp/DNA , as well different glycogen level for adhesive and de-adhesive cells Really, we can find the difference in the region of mid range also, however there is a strong overlap of components in this range.
3.3. Experimental Data from CARS Microscopy
For the registration of CARS images, LLC/R9 cells of adhesive nature were grown on the surface of a glass slide. After culturing the cells for 1 day, the slides were washed once with phosphate buffer and then dried under a fume hood, the used for CARS spectroscopy and imaging [36].
Due to the high non-resonant background at the Lithuanian CARS facility, it was not possible to detect structural components in the cell. That is why we registered only 1 type of the model cells, namely adhesive cells.
The images were registered at 1600 cm-1 in forward and epi-modes. CARS image of the cell is clear, with high contrast. The membrane stands out particularly clearly, but the internal morphology of the cell is difficult to discern. Heterogeneity in the volume of the cell is noticeable, but it is difficult to clearly distinguish the nucleus or other organelles. At the first registration, one bright spot is observed on the image of the cell. During the second pass, they become larger, they are noticeably brighter. In epi mode, the cell looks more contrasty. The heterogeneity in the structure of the membrane is visible. (Figure 7).
According to Hamaguchi [35] the line near 1600 cm-1 is a characteristic of vitality of the cell, the Raman spectroscopic signature of life” and really, a strong CARS band was observed at 1595 cm-1 only when cells were under good nutrient conditions. A sudden disappearance the band near 1600 cm-1 followed by the change in the shape and intensity of the phospholipid bands was observed, indicating a strong relationship between the cell activity and the intensity of this band. We therefore can call according Hamaguchi this band “the Raman spectroscopic signature of life”. Shift between positions of the lines in Raman and CARS spectra are in the region of 3-15 cm-1- [36]. We registered only weak band in Raman spectra (Figure 6- position of the line in Raman is equalled to 1609 cm-1) in this region in comparison with CARS, seems due to close to resonant condition in CARS. After repeated scans we see the bright dots in the cell (Figure 8), which were not in the cell in Figure 7. We suppose that bright spots are attributed to Cytochrome C.
Really, we found round-shape cells in population of adhesive cells and assigh them to early stage of apoptosos or necrosis. However we can suppose about changing of functional activity of these cells being alive.
From the overall appearance of the CARS spectra, we can say that the images obtained are off-resonant, however close to it. However, there are certain features in the spectra that are characteristic of the cells. Namely, the bands in the 1500-1600 cm-1 region can be attributed to the C=O and C=C vibrations of proteins and lipids. In the case of necrosis sample -cells look damaged, the membrane is broken, a position of Amid 1 shifted in the low frequency region from 1654-1656 cm-1 (α-conformation) in upper images to 1644 cm-1 indicated increase of β-protein conformations (Figure8)- image and spectrum) The samples appear to be completely flat and have no volume. The image is not of high contrast and the signal intensity is low. Deformation vibrations of CH2 at 1400 and 1430 сm-1 were registered and belongs to proteins.
A characteristic minimum at 1470 сm-1, seems to be associated with the electronic subsystem excitation. Thus, CARS images and spectra are additional to Raman with more sensitivity and contrast, however this home-made instrument is not enough for obtaining information about structural components of the cell that is why we applied confocal microscopy and staining also.
3.4. Confocal Microscopy Data
It is known that the process of transition of cancer cells to a metastatic state is accompanied by the formation of invasive structures in the cell, which in turn leads to rearrangements of the cytoskeleton. Therefore, the study of F actin expression is an important stage for understanding epithelial-to-mesenchymal or/and mesenchymalto-epithelial transitions and, therefore, for the development of new approaches in antimetastatic therapy [37]. Visualization using the method of confocal microscopy allows to study the distribution and shape of actin fibers.
Immunostaining data recorded with a confocal microscope can be used to quantify the relative levels of a test molecule by measuring the average fluorescence intensity in the region of interest (ROI), the number of cells, and the percentage of the cells in the sample that are "positive" for staining with a fluorescent probe. Thus, in these cases, the MFI (mean fluorescence intensity) value in the ROI , calculated as the sum of pixels in the ROI divided by the total number of pixels, is likely to accurately detect whether the cell/tissue sample has markers that differ from the control.
Another similar methods as western blotting (WB), enzyme-linked immunosorbent assay (ELISA) and flow cytometry (FC) have long been used to assess and quantify the relative expression of protein in cultured cells and tissue samples. However, WB and ELISA have a limited ability to reliably quantify relative protein levels in tissues with complex cellular composition, while tissue dissociation followed by FC is not possible when tissue is limited and/or cells are difficult to isolate. While detection of protein in tissue using immunofluorescent (IF) probes has traditionally been considered a qualitative technique, advances in probe stability and confocal imaging make IF data easy to quantify, although reproducible quantification of relative protein expression requires careful attention to appropriate controls, experimental design, and data collection.
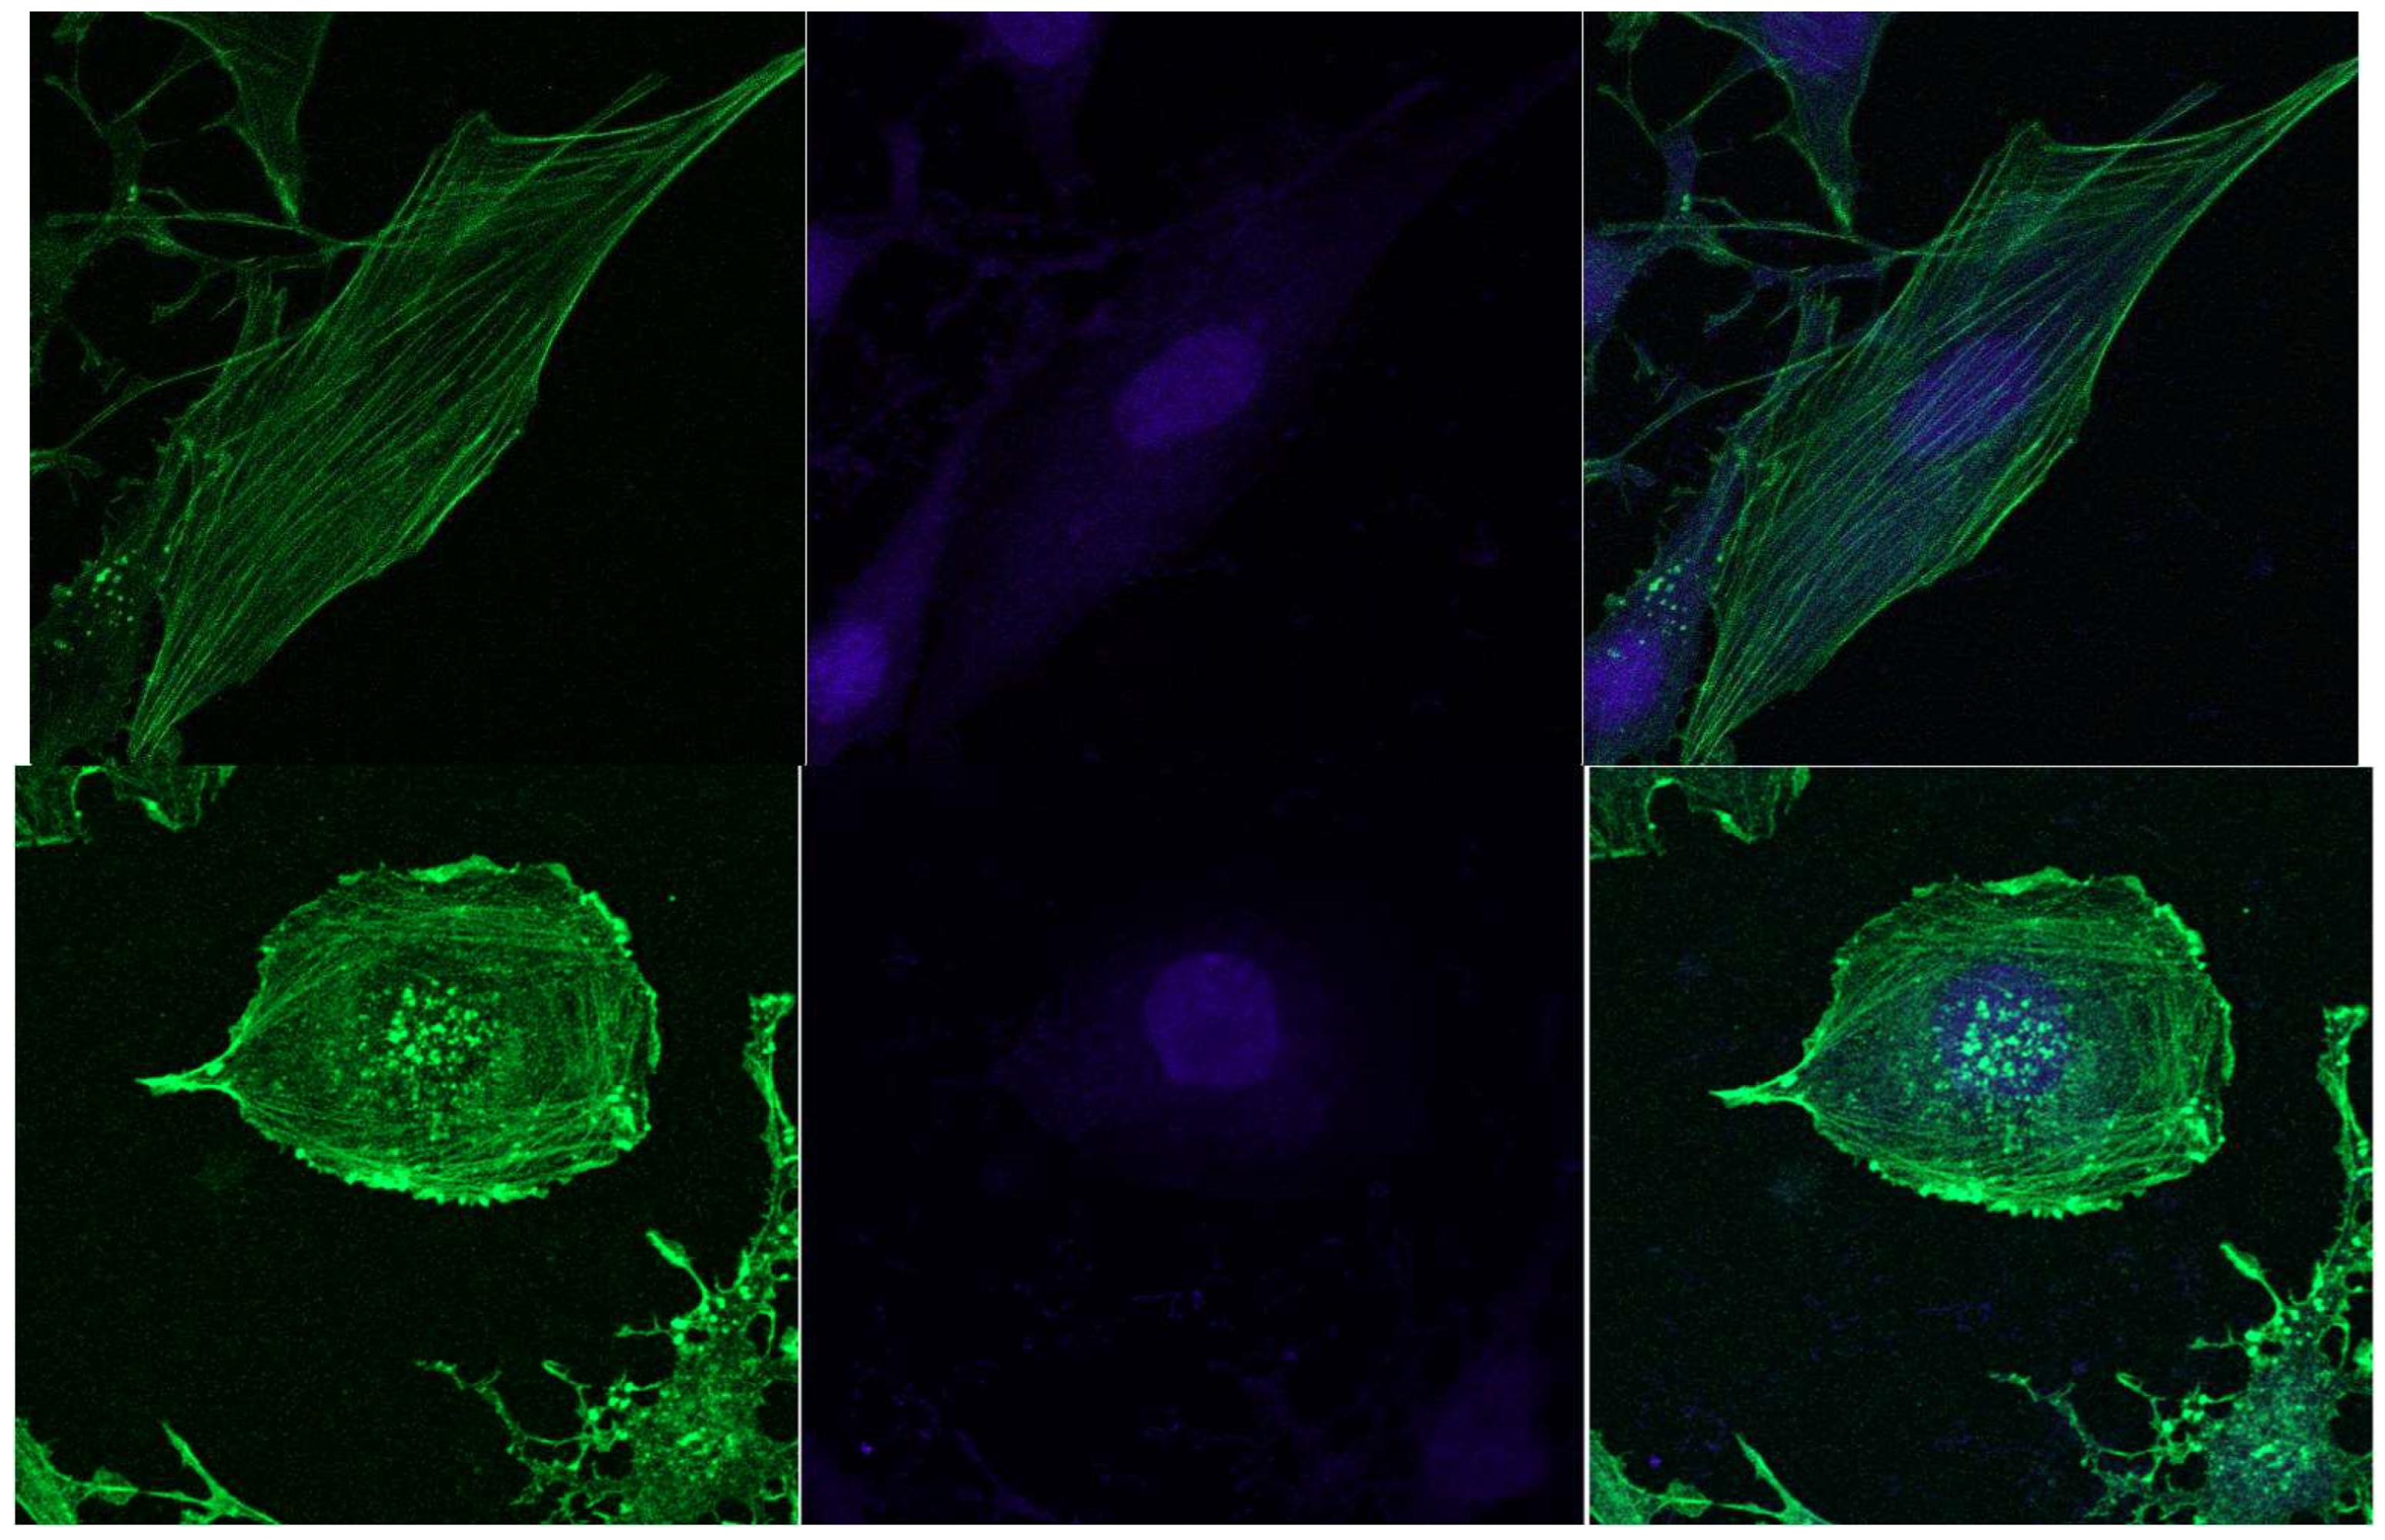
In the mouse aortic endothelial cells (MAECs), which can be used as reference non- tumour cells, the F-actin fibres are uniform in size, evenly distributed, located in narrow angle ranges, crossing the nucleus lines, and their clusters are closer to the nucleus. Alexa Fluor488 dye was used in the experiment
Figure 9.
Confocal images of the mouse aortic endothelial cells. F-actin, Alexa Fluor 488 staining, cell nuclei stained by Hoechst 33342..
Figure 9.
Confocal images of the mouse aortic endothelial cells. F-actin, Alexa Fluor 488 staining, cell nuclei stained by Hoechst 33342..
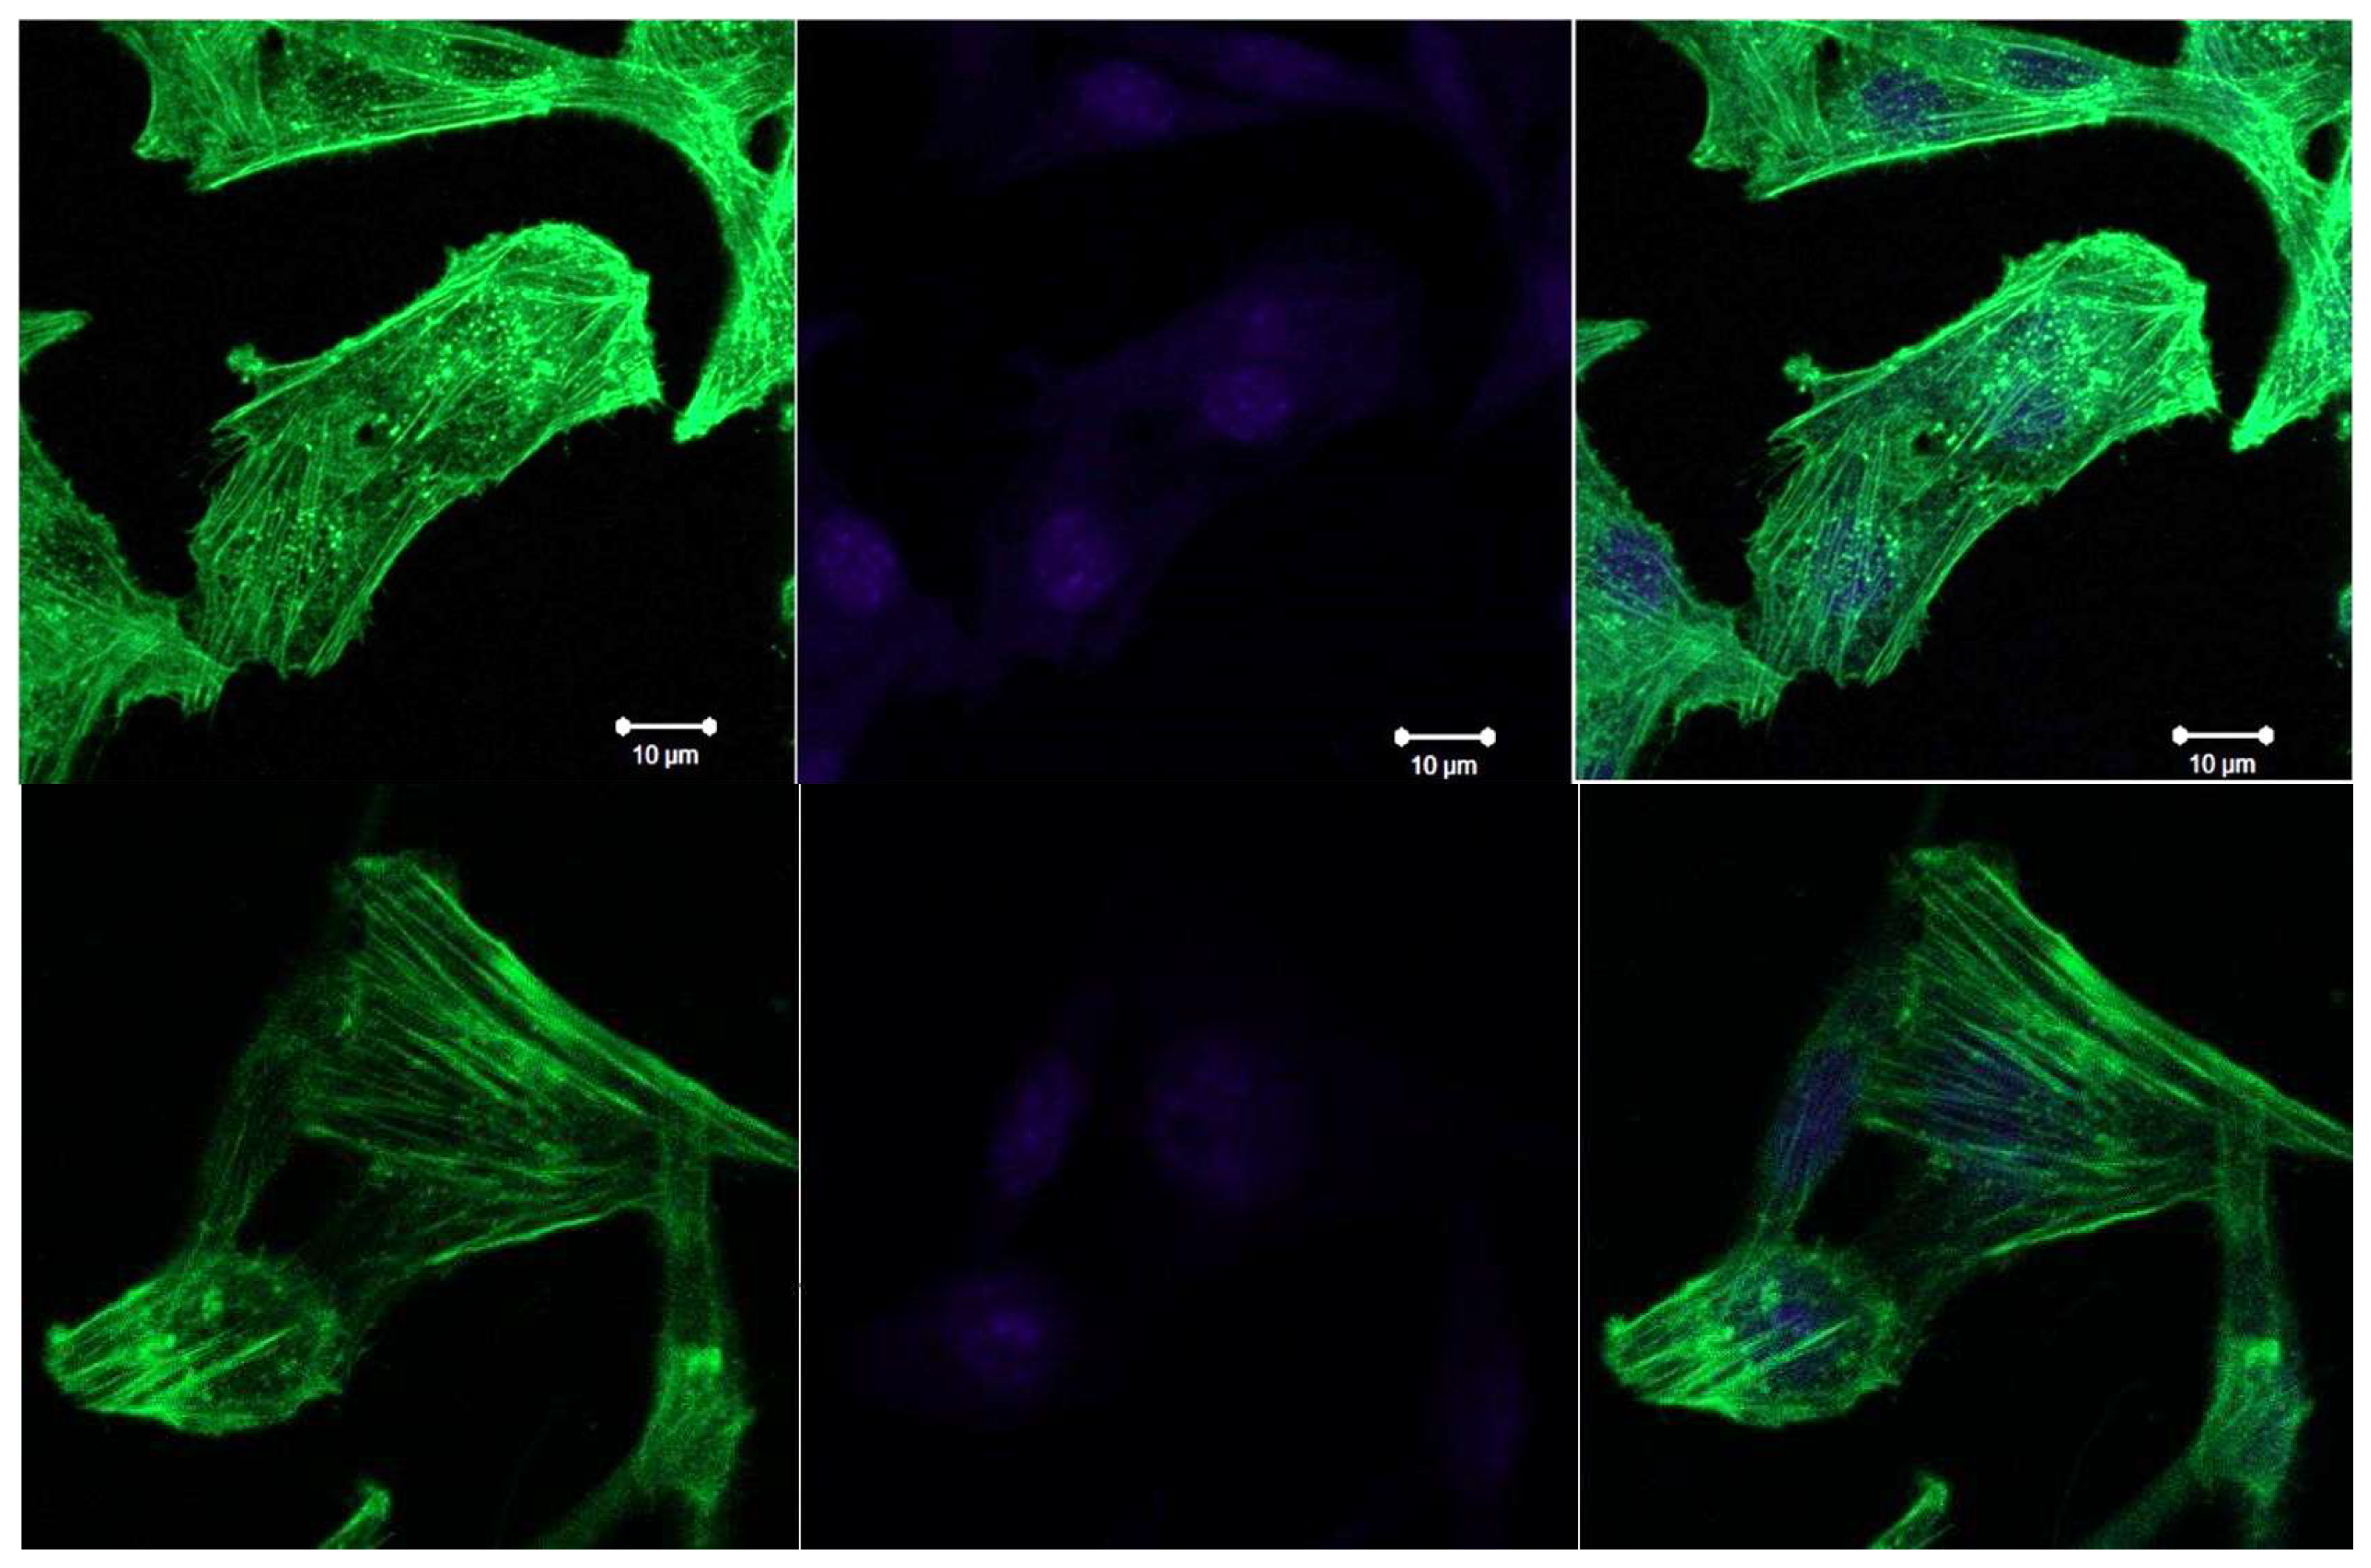
In contrast to MAEC cells, the LLC-R9 cells, when grown adherently, show a less developed network of actin fibres, with smaller diameters and shorter lengths. The nucleus also occupies a significant part of the cell, which suggests that the cells are in the G2 phase.
Figure 10.
Confocal images of F-actin staining of LLC-R9 cells during adherent growth., cell nuclei stained by Hoechst 33342.
Figure 10.
Confocal images of F-actin staining of LLC-R9 cells during adherent growth., cell nuclei stained by Hoechst 33342.
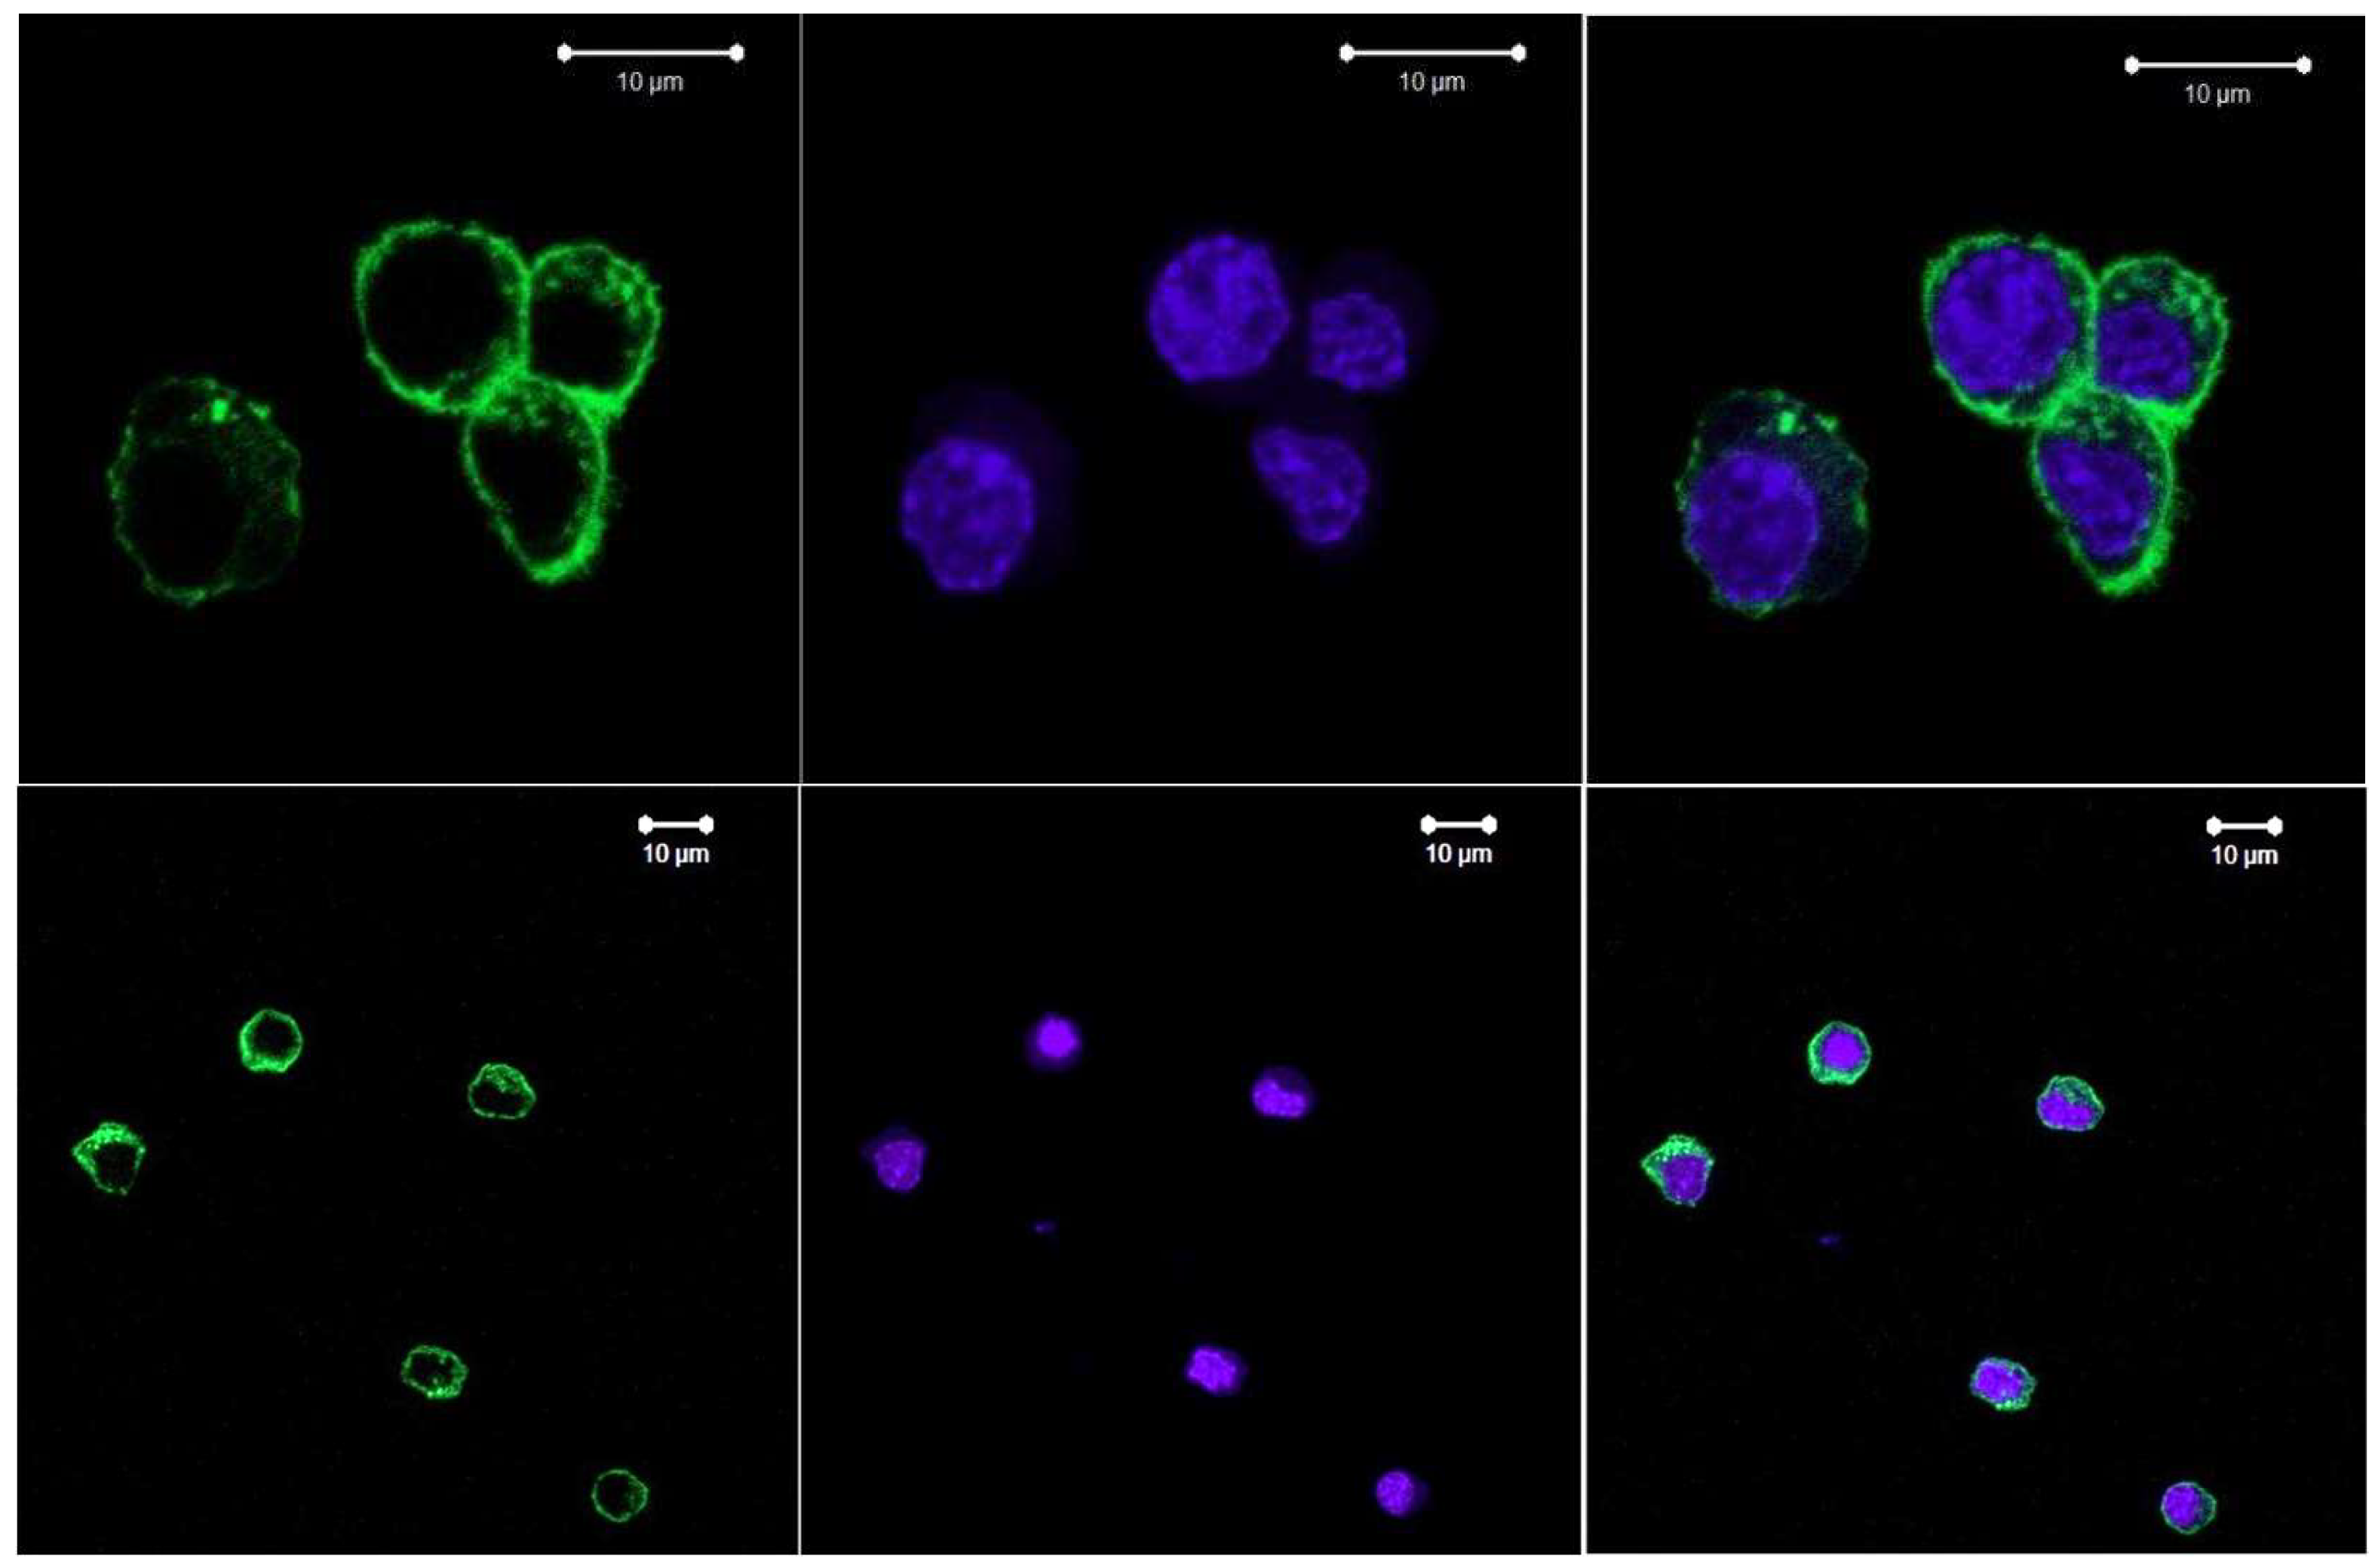
In the case of de-adherent growth of the LLC cells, we can see the location of F-actin fibres in close proximity to the nucleus, the fibres are tightly packed, tightly covering the nucleus. In LLC-R9 cells,F-actin fibres also tightly encircle the nucleus, but it can be argued that, as in the case of the adherent growth, they have smaller diameters and shorter lengths.
Figure 11.
Confocal images of F-actin staining in LLC-R9 cells under de-adherent growth., cell nuclei stained by Hoechst 33342.2.
Figure 11.
Confocal images of F-actin staining in LLC-R9 cells under de-adherent growth., cell nuclei stained by Hoechst 33342.2.
In contrast to LLC cells, LLC-R9 cells, when growing adherently, show a less developed network of actin fibres, with smaller diameters and shorter lengths. The nucleus also occupies a significant part of the cell, which suggests that the cells are in the G2 phase.
The fluorescent images obtained from confocal microscopy were processed using Fiji (ImageJ) software [38] to measure mean fluorescence intensity (MFI) in a region of interest (ROI). The method was previously described to analyze the samples with varying counts and shapes of the cells [39]. The green color channel was extracted from each image to focus on the Alexa Fluor488 staining. The ROIs were manually outlined by visible cell verges and MFI was measured.
According to Table 4, the MFI in MAEC cell images is generally lower compared to LLC-R9 images. The adherent LLC-R9 samples tend to contain higher staining signals relative to de-adherent ones except for the one, presumably, outlier.
Table 4 shows that level of F-actin in reference cells is in the region of 45,6 and 42,1%, for adgesive cells – 67,3-72,1% and deadgesive 38,0—46,1%. This means that the level of actin is higher for adhesive cells.Now we are in the process of developing of new method for accurate estimation of actin and vimentin level with confocal microscopy. Due to different focusing on the plane of the cell of different thickniss, the data could be different even for the same cell. That is why, Z-scan should be apply in this case.
According to flow cytofluorimetry, the level of F-actin in LLC/R9 cells during de-adhesive growth is statistically significantly reduced by more than 38% compared to adhesive growth. The distribution of F-actin under de-adhesive and adhesive growth conditions of LLC/R9 cells is also significantly different: F-actin is fixed in the form of microfilaments during de-adhesive growth and in the form of threads during adhesive growth. De-adhesive growth of metastatic cells is accompanied by a decrease in the level of F-actin. Thus the data obtained from the analysis of confocal images are in accordance with the data obtained using flow cytofluorimetry.
Therefore, morfological property of the cells grown by adhesive and de-adhesive way, are different.The adhesive cells have prolongated forms and de-adhesive round-like shape, however, in the population of adhesive cells, you can find cells of other shapes, in contrast to de-adhesive cells that have a rounded shape. The amount of F-actin increases by approximately 40% in adhesive cells compared to de-adhesive cells, which was proven by biochemical methods and using a confocal microscope. As a rule, a more branched network of fibrils is observed in adhesive cells. The biochemical method also indicates an increase in vimentin in adhesive cells.
4. Conclusions
In this study a model of cultivation of circulating metastatic cells in a de-adhesive and adhesive method was tested on the basis of Lewis lung carcinoma tumour cells (LLC-R9). Various physical and biological methods applied to these cells showed differences in the spectroscopic and morphological properties of the cells. Namely:
- FTIR spectra of adhesive and de-adhesive cells show protein conformations transformation, membrane changes and H-bond reorganization.
- From the Raman spectra in the region of 400-900 cm-1, Trp, Tyr aminoacids and glycogen level characterized special features which indicates changes in the environment for adhesive and de-adhesive cells, H-bonds redistribution, reorganization of proteins etc.
- CARS data correlate with Raman data and together with confocal microscopy data indicate that a small number of round cells can be detected in the population of adherent cells, which may be the result of apoptosis or necrosis or changes in their functional activity under the influence of external stimuli or the environment.
- LLC cells during de-adhesive growth are rounded, significantly reducing the cell surface. During adhesive growth, thin actin threads are clearly visible, which are part of the contractile and migration apparatus. During de-adhesive growth, F-actin is fixed in the form of microfilaments in the cytoskeleton of cells. F-actin in LLC/R9 cells for de-adhesive growth is statistically significantly reduced by more than 38% compared to adhesive growth. The nature of F-actin distribution under de-adhesive and adhesive growth conditions of LLC/R9 cells is also significantly different: F-actin is fixed in the form of microfilaments during de-adhesive growth and in the form of threads during adhesive growth.
Acknowledgments
The research was supported by NRFU 2021.01/0229 Project ”Biophysical and biochemical characteristics of metastatic circulating cells as potential targets of antimetastatic therapy” (O.G, D.K, G.S and G.D.) .
References
- Saxena, M.; Christofori, G. Rebuilding cancer metastasis in the mouse. Mol Oncol. 2013, 7, 283–296. [Google Scholar] [CrossRef] [PubMed]
- Eslami-S, Z.; Cortés-Hernández, L.E.; Thomas, F.; et al. Functional analysis of circulating tumour cells: the KEY to understand the biology of the metastatic cascade. Br J Cancer 2022, 127, 800–810. [Google Scholar] [CrossRef] [PubMed]
- Lin, D.; Shen, L.; Luo, M.; et al. Circulating tumor cells: biology and clinical significance. Sig Transduct Target Ther 2021, 6, 404. [Google Scholar] [CrossRef]
- Nasr, M.M.; Lynch, C.C. How circulating tumor cluster biology contributes to the metastatic cascade: from invasion to dissemination and dormancy. Cancer Metastasis Rev 2023, 42, 1133–1146. [Google Scholar] [CrossRef]
- Solyanik, G.; Kolesnyk, D.; Gnatyuk, O.; Dovbeshko, G. Changes in glucose metabolism during detachment of metastatic cells. Scientific Collection «InterConf+» 2023, 35, 179–193. [Google Scholar] [CrossRef]
- Solyanik, I.; Kolesnik, D.L.; Prokhorova, I.V.; Yurchenko, O.V.; Pyaskovskaya, O.N. Mitochondrial dysfunction significantly contributes to the sensitivity of tumor cells to anoikis and their metastatic potential. Heliyon 2024, 10. [Google Scholar] [CrossRef] [PubMed]
- Mantsch, H.H. Biomedical Vibrational Spectroscopy in the Era of Artificial Intelligence. Molecules 2021, I, 1439. Biological and biomedical Infrared spectroscopy, edited by A.Barth P.Haris,IOS Press-Amsterdam-Berlin-Tokyo-Washington, DC, 2009,435P. [CrossRef]
- Helburn, R.; Nolan, K. Characterizing biological macromolecules with attenuated total reflectance–Fourier transform infrared spectroscopy provides hands-on spectroscopy experiences for undergraduates. Biochem Mol Biol Educ. 2022, 50, 381–392. [Google Scholar] [CrossRef]
- Finlayson, D.; Rinaldi, C.; Baker, M.J. Is Infrared Spectroscopy Ready for the Clinic? Anal. Chem. 2019, 91, 12117. [Google Scholar] [CrossRef]
- Dovbeshko, G.I.; Gridina, N.Y.; Kruglova, E.B.; et al. FTIR spectroscopy studies of nucleic acid damage. Talanta 2000, 53, 233–246. [Google Scholar] [CrossRef]
- Dovbeshko, G.I.; Chegel, V.I.; Gridina, N.Y.; Repnytska, O.P.; Shirshov, Y.M.; Tryndiak, V.P.; Todor, I.M.; Solyanik, G.I. Surface enhanced IR absorption of nucleic acids from tumor cells: FTIR reflectance study. Biopolymers 2002, 67, 470–486. [Google Scholar] [CrossRef]
- Dovbeshko, G.I.; Chegel, V.I.; Gridina, N.Y.; Repnytska, O.P.; Shirshov, Y.M.; Tryndiak, V.P.; Todor, I.M.; Zynio, S.A. Surface enhanced infrared absorption of nucleic acids on gold substrate. Semiconductor Physics Quantum Electronics & Optoelectronics 2001, 4, 202–206. [Google Scholar]
- Vo-Dinh, T.; Yan, F.; Wabuyele, M.B. Surface-Enhanced Raman Scattering for Biomedical Diagnostics and Molecular Imaging. In: Kneipp, K., Moskovits, M., Kneipp, H. (eds) Surface-Enhanced Raman Scattering. In Topics in Applied Physics; Springer: Berlin, Heidelberg, 2006; Volume 103. [Google Scholar] [CrossRef]
- Fesenko, O.; et al. Graphene-enhanced Raman spectroscopy of thymine adsorbed on single-layer graphene. Nanoscale Res. Lett 2015, 10, 1–7. [Google Scholar] [CrossRef] [PubMed]
- Cox, G. Biological applications of second harmonic imaging. Biophys. Rev. 2011, 3, 131–141. [Google Scholar] [CrossRef] [PubMed]
- Dovbeshko, G.; Fesenko, O.; Dementjev, A.; Karpicz, R.; Fedorov, V.; Posudievsky, O.Y. Coherent anti-Stokes Raman scattering enhancement of thymine adsorbed on graphene oxide. Nanoscale Res Lett 2014, 9, 263. [Google Scholar] [CrossRef] [PubMed]
- Dementjev, A.; Rutkauskas, D.; Polovy, I. Mindaugas Macernis, Darius Abramavicius, Leonas Valkunas & Galina Dovbeshko Characterization of thymine microcrystals by CARS and SHG microscopy. Sci Rep 2020, 10, 17097. [Google Scholar] [CrossRef]
- Hnatiuk, S.I.; Dovbeshko, G.I. Studies of mitochondria – FT-IR and nano-IR. Conference Proceedings of the Youth Science League. Priority directions and vectors of development of world science. November 19, Drohobych, Ukraine. 2021. 82-85.
- Chen, X.; Nadiarynkh, O.; Plotnikov, S.; Campagnola, P.J. Second harmonic generation microscopy for quantitative analysis of collagen fibrillar structure. Nat. Protoc 2012, 7, 654–669. [Google Scholar] [CrossRef] [PubMed]
- Wurpel, G.W.; Rinia, H.A.; Müller, M. Imaging orientational order and lipid density in multilamellar vesicles with multiplex CARS microscopy. J Microsc. 2005, 218 Pt 1, 37–45. [Google Scholar] [CrossRef]
- Chen, H.; Li, X.; Zhang, S.; Yang, H.; Gao, Q.; Zhou, F. Rapid and sensitive detection of esophageal cancer by FTIR spectroscopy of serum and plasma. Photodiagnosis and Photodynamic Therapy 2022, 40, 103177. [Google Scholar] [CrossRef]
- Malins, D.C.; Polissar, N.L.; Nishikida, K.; Holmes, E.H.; Gardner, H.S.; Gunselman, S.J. The etiology and prediction of breast cancer. Fourier transform-infrared spectroscopy reveals progressive alterations in breast DNA leading to a cancer-like phenotype in a high proportion of normal women. Cancer 1995, 75, 503–517. [Google Scholar] [CrossRef]
- Pyaskovskaya, O.N.; Dasyukevich, O.I.; Kolesnik, D.L.; Garmanchouk, L.V.; Todor, I.N.; Solyanik, G.I. Changes in VEGF level and tumor growth characteristics during lewis lung carcinoma progression towards cis-DDP resistance. Exp Oncol. 2007, 29, 197–202. [Google Scholar]
- Pyaskovskaya, O.N.; Kolesnik, D.L.; Garmanchouk, L.V.; Yanish, Y.u.V.; Solyanik, G.I. Role of tumor/endothelial cell interactions in tumor growth and metastasis. Exp Oncol 2021, 43, 104–110. [Google Scholar] [CrossRef] [PubMed]
- Parker, F.S. Biochemical Applications of Infrared and Raman Spectroscopy / F.S. Parker. New York: Plenum Press. 1983. p. 528 p.
- Kolesnik, D.L.; Pyaskovskaya, O.N.; Gnatyuk, O.P.; et al. The effect of 2D tungsten disulfide nanoparticles on Lewis lung carcinoma cells in vitro. RSC Advances 2021, 11, 16142–16150. [Google Scholar] [CrossRef]
- Gnatyuk, O.P.; Dovbeshko, G.I.; Yershov, A.; et al. 2D-BN nanoparticles as a spectroscopic marker and drug delivery system with protection properties. RSC Advanced 2018, 8, 30404–30411. [Google Scholar] [CrossRef]
- Mourant, J.R.; Yamada, Y.R.; Carpenter, S.; Dominique, L.R.; Freyer, J.P. FTIR spectroscopy demonstrates biochemical differences in mammalian cell cultures at different growth stages. Biophys J. 2003, 85, 1938–1947. [Google Scholar] [CrossRef]
- Barth, A. Infrared spectroscopy of proteins. Biochim Biophys Acta 2007, 1767, 1073–1101. [Google Scholar] [CrossRef] [PubMed]
- Movasaghi, Z.; Rehman, S.; Rehman, I. Fourier Transform Infrared (FTIR) Spectroscopy of Biological Tissues. Applied Spectroscopy Reviews 2008, 43, 134–179. [Google Scholar] [CrossRef]
- Badger, R.M.; Bauer, S.H. Spectroscopic studies of the hydrogen bond. II. The shift of the O\H vibrational frequency in the formation of the hydrogen bond. J. Chem. Phys. 1937, 5, 839–851. [Google Scholar] [CrossRef]
- Badger, R.M.; Bauer, S.H. Spectroscopic Studies of the Hydrogen Bond I. A Photometric Investigation of the Association Equilibrium in the Vapor of Acetic Acid. J. Chem. Phys. 1937, 5, 605–608. [Google Scholar] [CrossRef]
- Lutz, H.D.; Eckers, W.; Haeuseler, H. OH stretching frequencies of solid hydroxides and of free OH− ions. Journal of Molecular Structure 1982, 80, 221–224. [Google Scholar] [CrossRef]
- Kumar, S.; Verma, T.; Mukherjee, R.; Ariese, F.; Somasundaram, K.; Umapathy, S. Raman and infra-red microspectroscopy: towards quantitative evaluation for clinical research by ratiometric analysis. Chem. Soc. Rev. 2016, 10.1039, C5CS00540J. [Google Scholar] [CrossRef]
- Huang, Y.S.; Karashima, T.; Yamamoto, M.; Hamaguchi, H.O. Molecular-level investigation of the structure, transformation, and bioactivity of single living fission yeast cells by time- and space-resolved Raman spectroscopy. Biochemistry 2005, 44, 10009–10019. [Google Scholar] [CrossRef] [PubMed]
- Dovbeshko, G.; Gnatyuk, O.; Dementjev, A.; Rutkauskas, D.; Kovalska, E.; Baldycheva, A.; Ilchenko, O.; Krasnenkov, D.; Kaplas, T. Coherent anti-stokes Raman scattering spectroscopy (CARS) and imaging of DNA on graphene layers and glass covers. FlatChem. 2021, 27, 100243. [Google Scholar] [CrossRef]
- Izdebska, M.; Zielińska, W.; Grzanka, D.; Gagat, M. The Role of Actin Dynamics and Actin-Binding Proteins Expression in Epithelial-to-Mesenchymal Transition and Its Association with Cancer Progression and Evaluation of Possible Therapeutic Targets. BioMed Research International 2018, 4578373. [Google Scholar] [CrossRef] [PubMed]
- Schindelin, J.; Arganda-Carreras, I.; Frise, E.; et al. Fiji: an open-source platform for biological-image analysis. Nat Methods 2012, 9, 676–682. [Google Scholar] [CrossRef]
- Shihan, M.H.; Novo, S.G.; Le Marchand, S.J.; Wang, Y.; Duncan, M.K. A simple method for quantitating confocal fluorescent images. Biochem Biophys Rep. 2021, 25, 100916. [Google Scholar] [CrossRef]
Figure 2.
Regions in the FT-IR absorption spectrum of LLC cells that can be attributed to the absorption of lipid and protein fractions and nucleic acids.
Figure 2.
Regions in the FT-IR absorption spectrum of LLC cells that can be attributed to the absorption of lipid and protein fractions and nucleic acids.
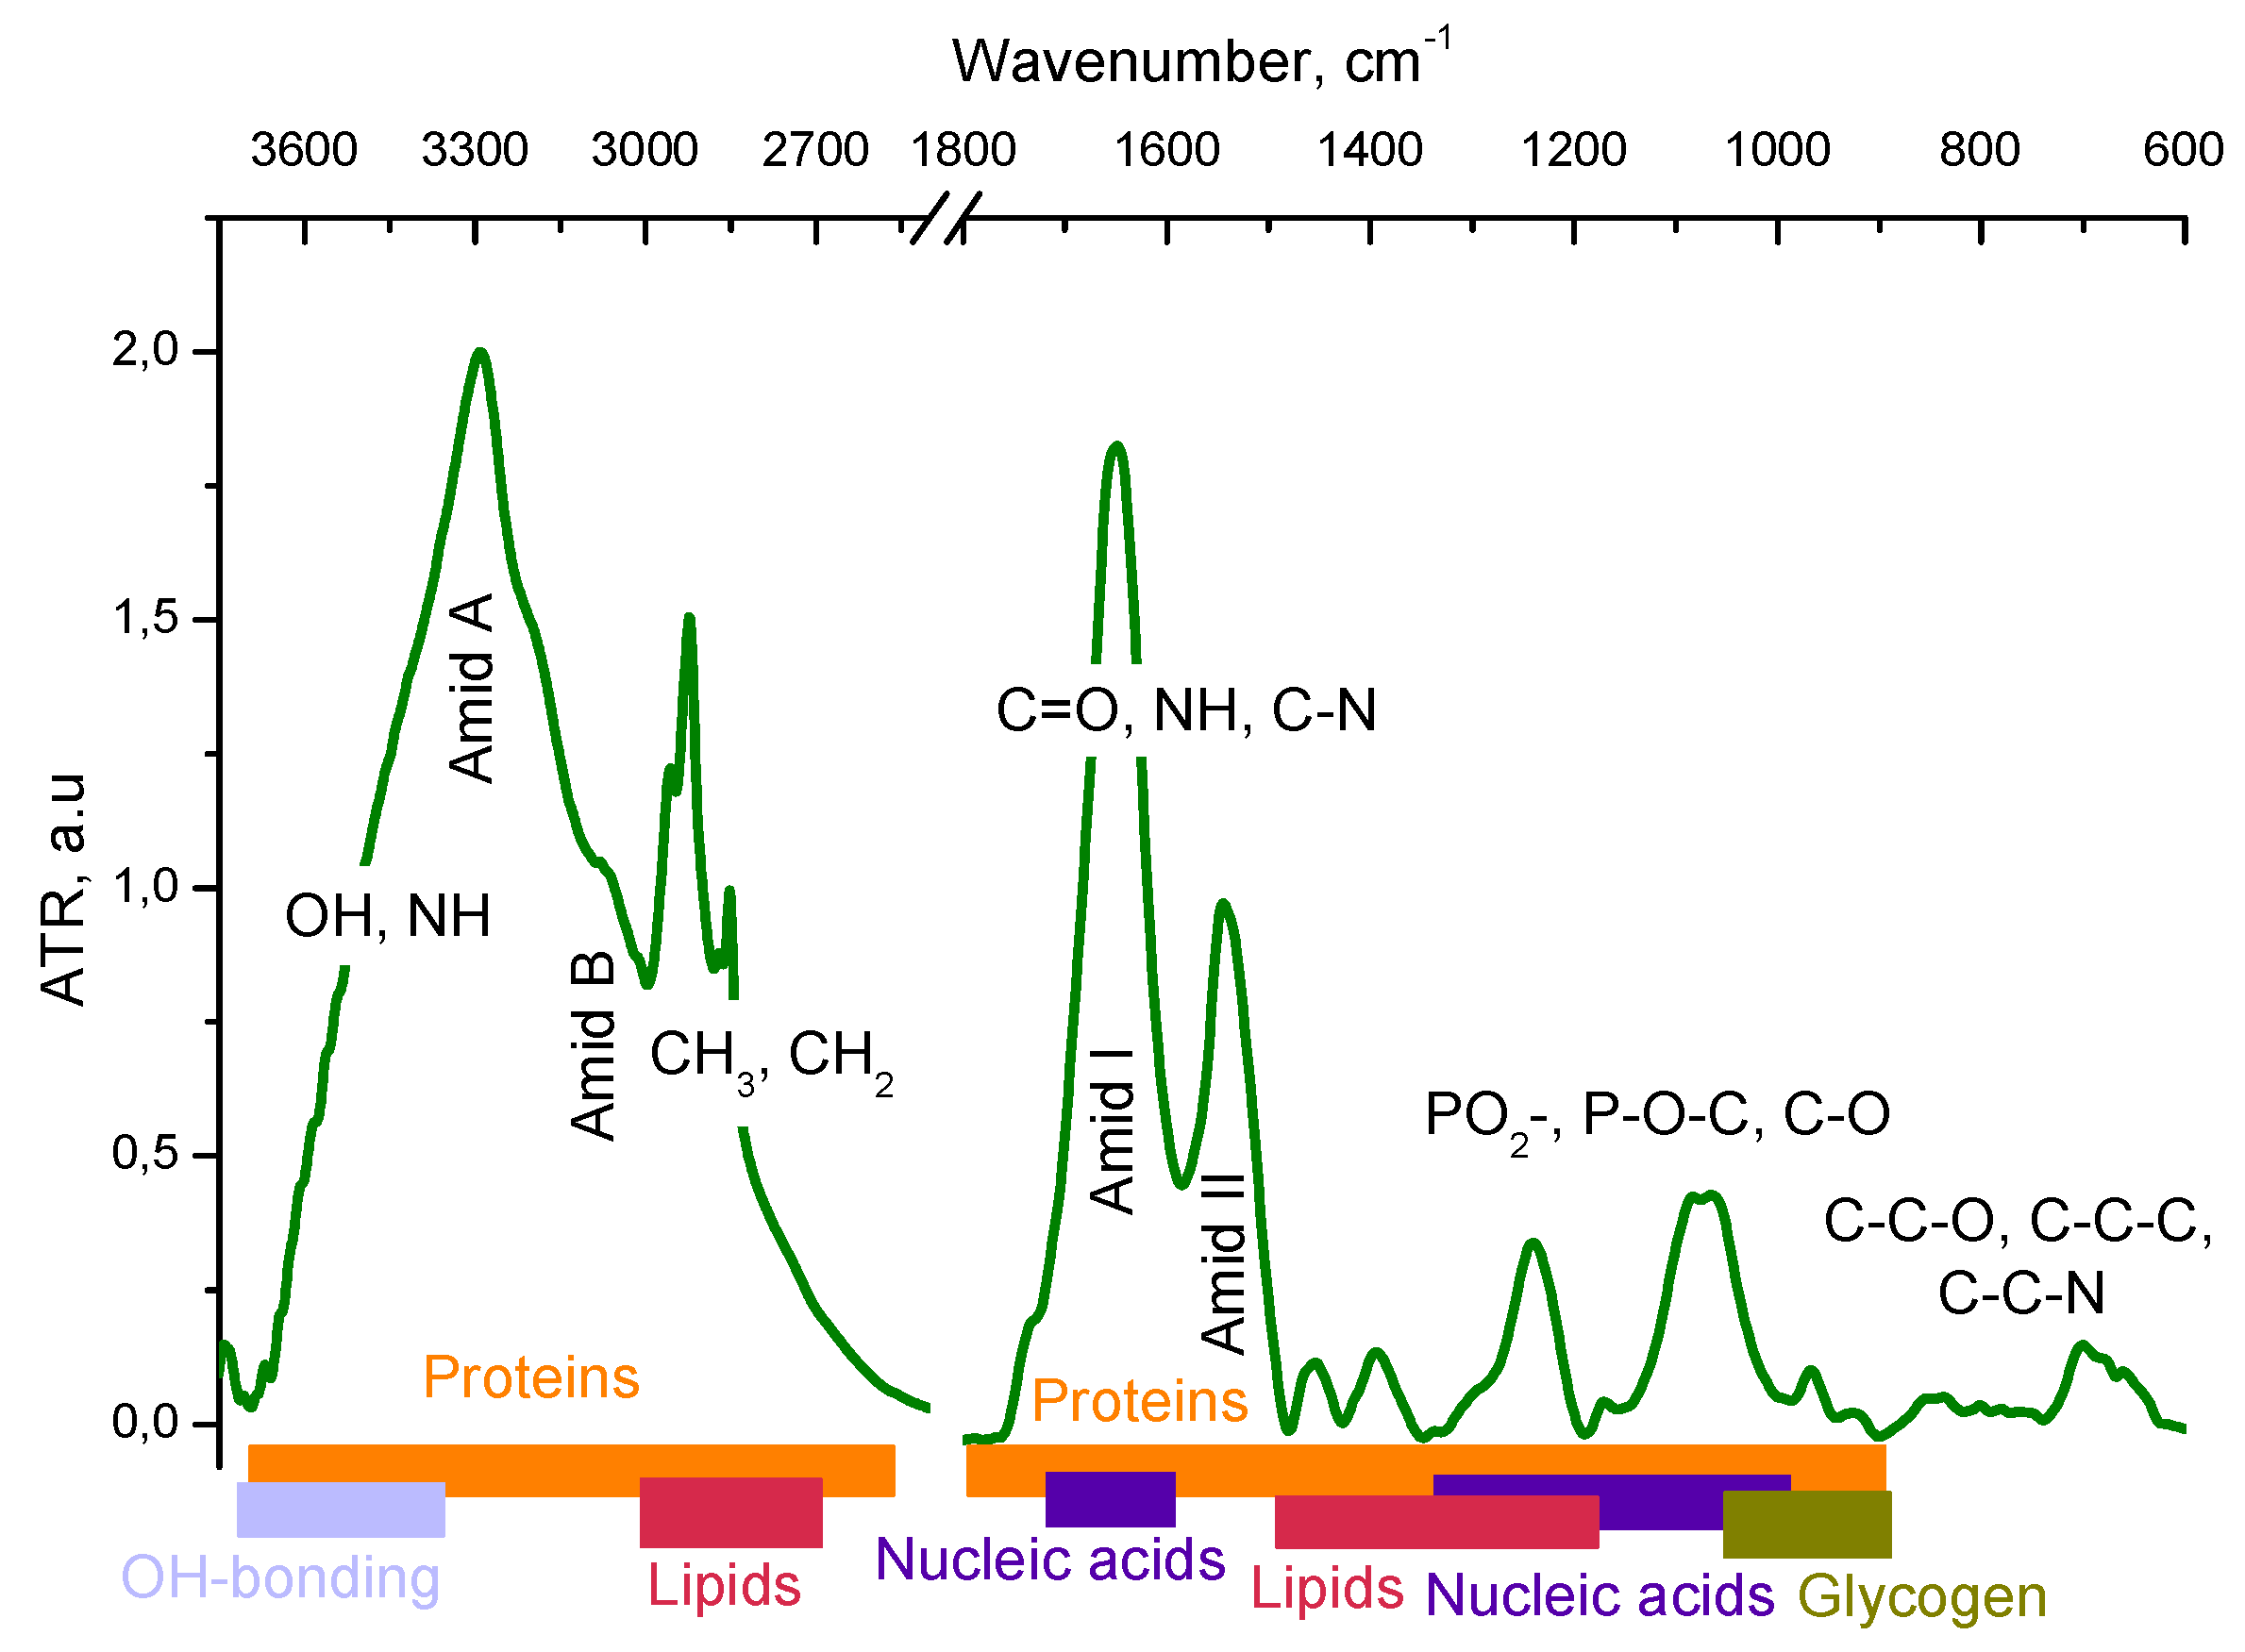
Figure 3.
Normalized FTIR absorption spectra of LLC-R9 cells grown under adhesive (blue curve) or de- adhesive (purple curve) conditions. The black curve refers to zero point cells. The positions of the bands were estimated according the first derivative- curves in the bottom on the figure.
Figure 3.
Normalized FTIR absorption spectra of LLC-R9 cells grown under adhesive (blue curve) or de- adhesive (purple curve) conditions. The black curve refers to zero point cells. The positions of the bands were estimated according the first derivative- curves in the bottom on the figure.
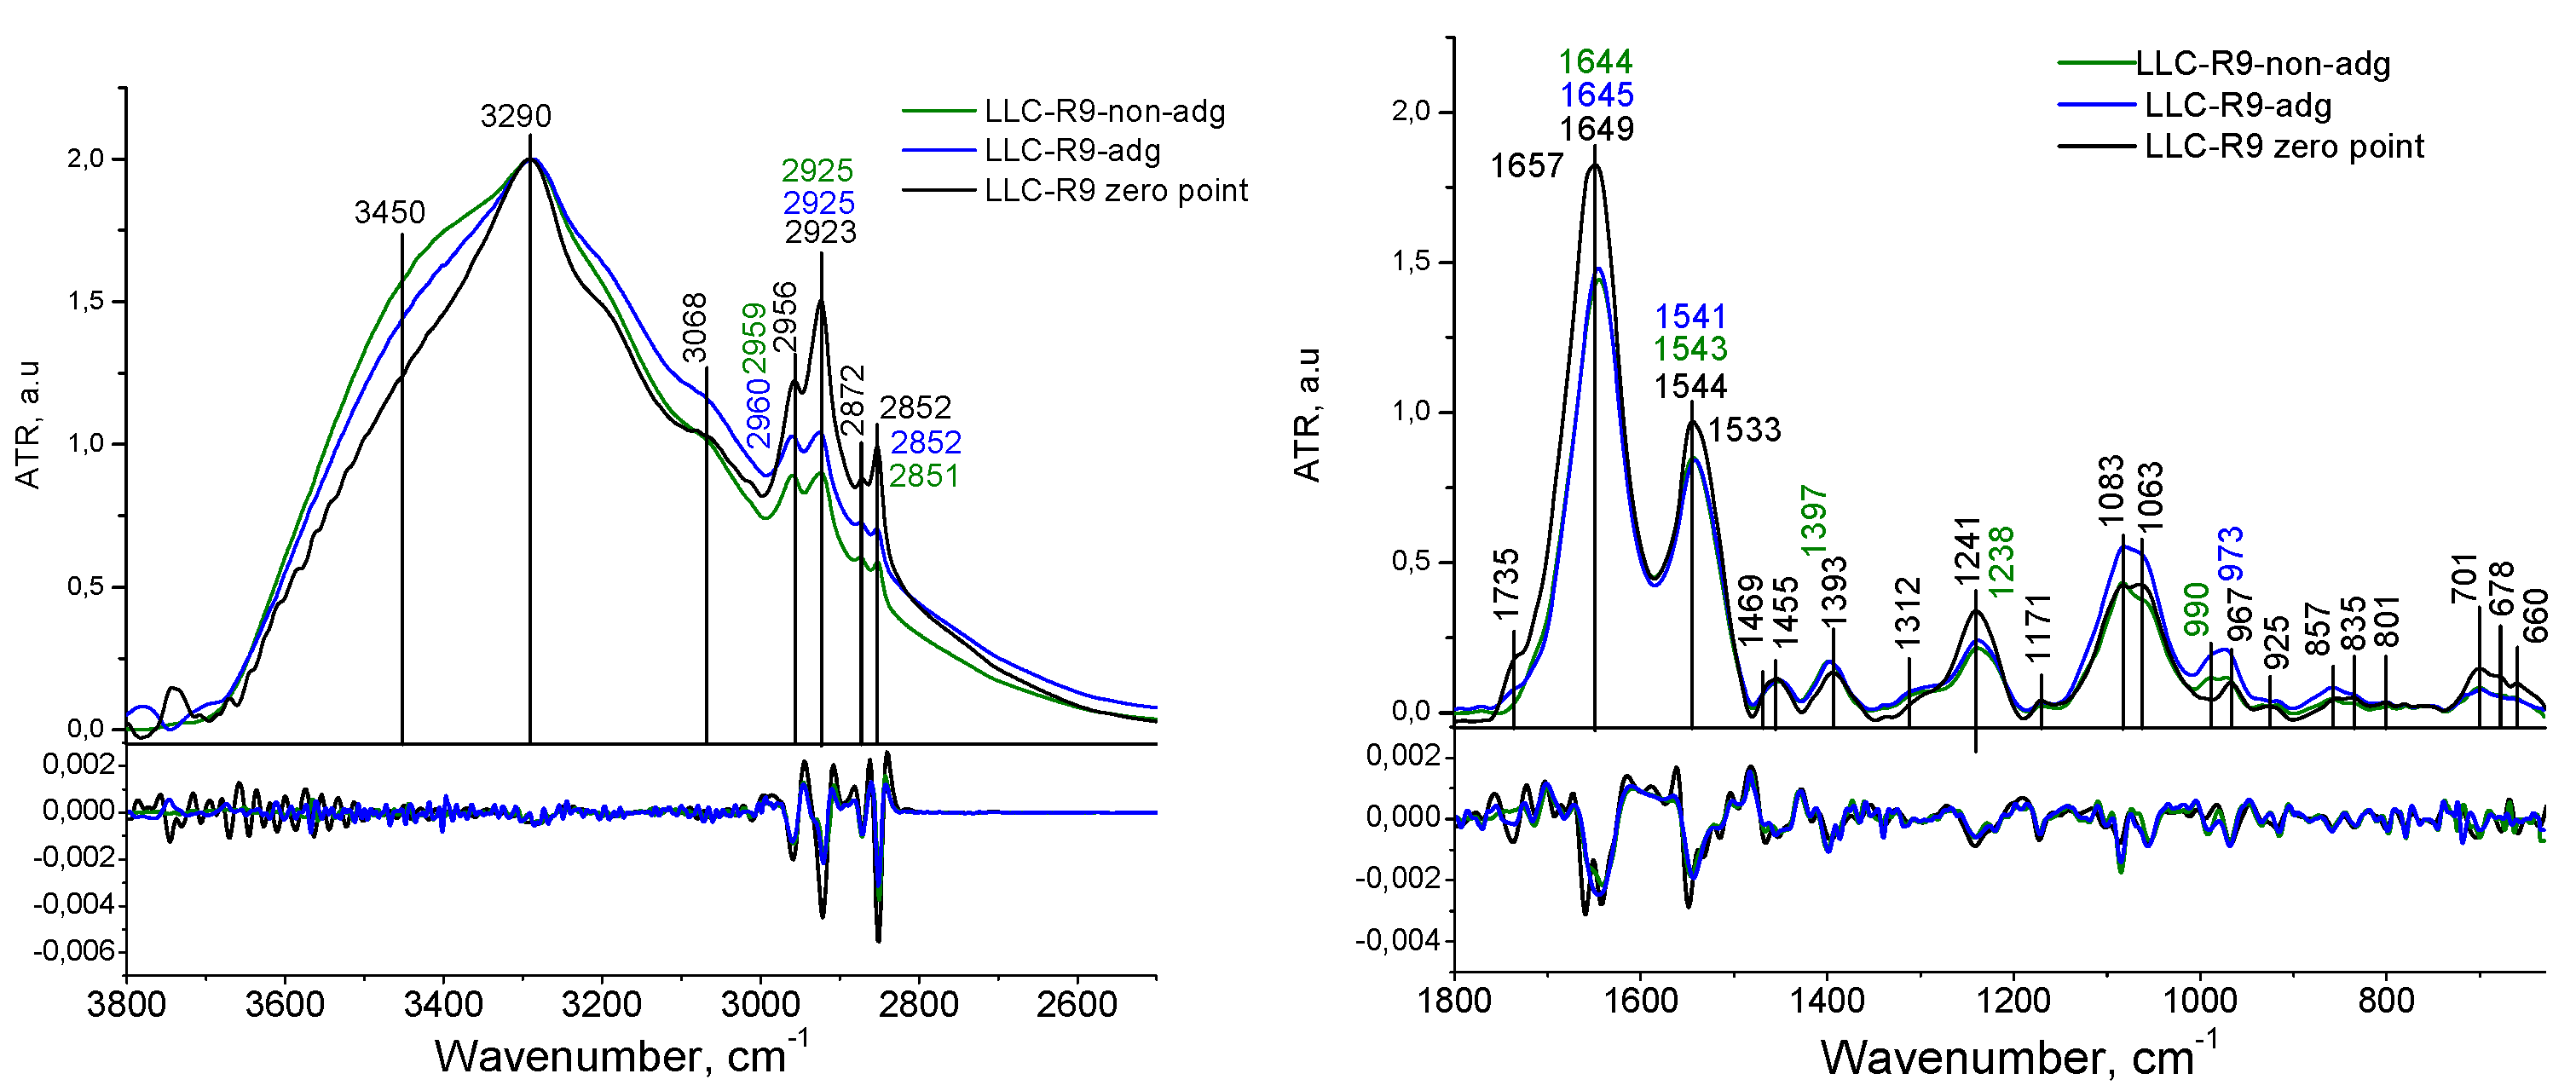
Figure 4.
Decomposition of the Amide I band of LLC-R9 cells grown under adhesive (a) and de-adhesive (b) conditions.
Figure 4.
Decomposition of the Amide I band of LLC-R9 cells grown under adhesive (a) and de-adhesive (b) conditions.
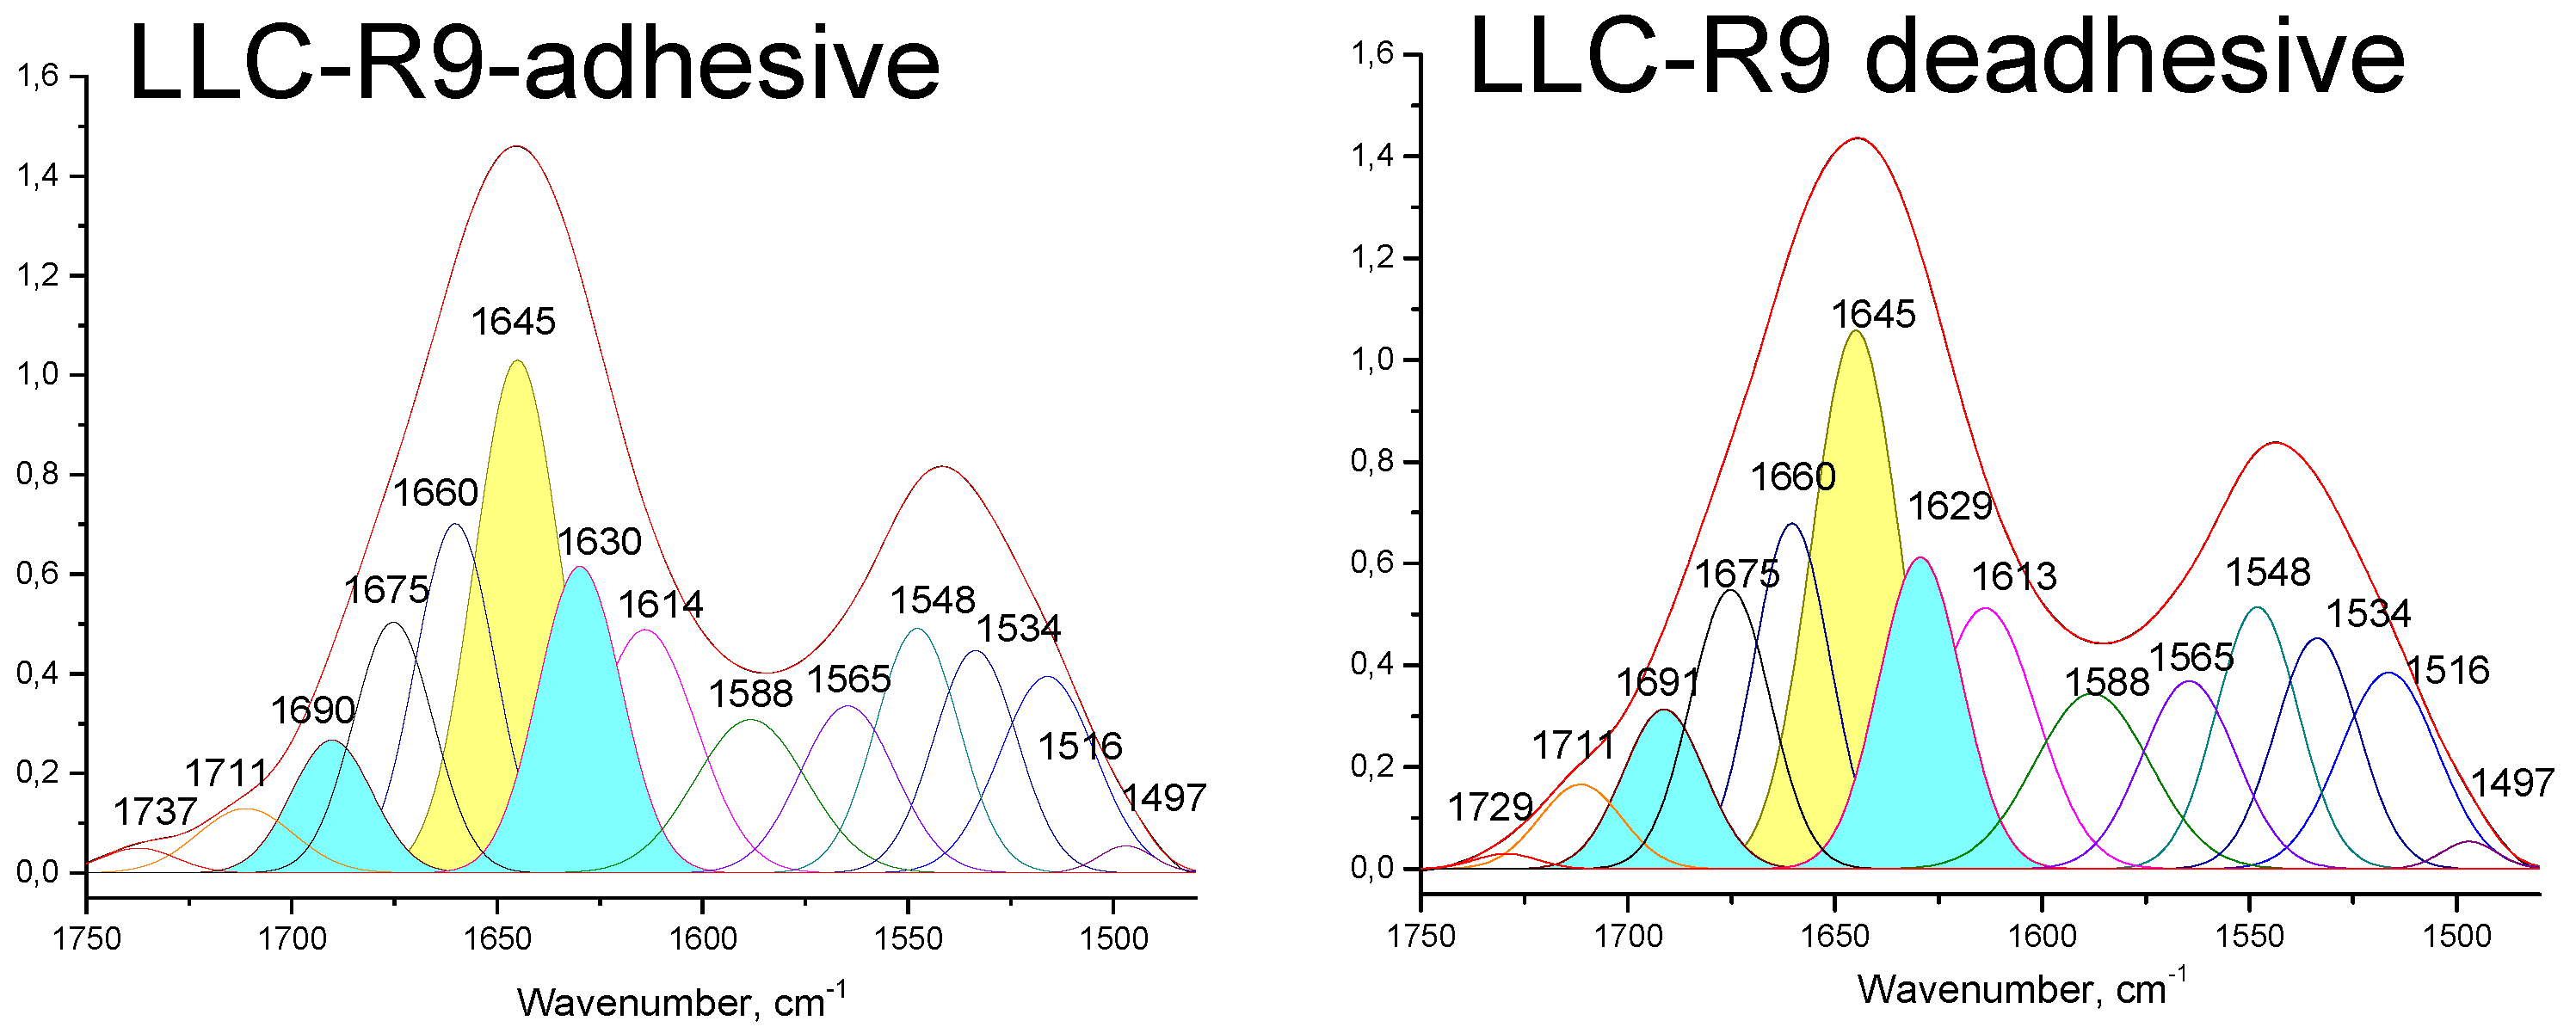
Figure 7.
Epi CARS (E-CARS) 940μW_1H_5400μW CARS image of LLC/R9 cells on the cover glass surface. Resonance at 1600 cm -1.
Figure 7.
Epi CARS (E-CARS) 940μW_1H_5400μW CARS image of LLC/R9 cells on the cover glass surface. Resonance at 1600 cm -1.
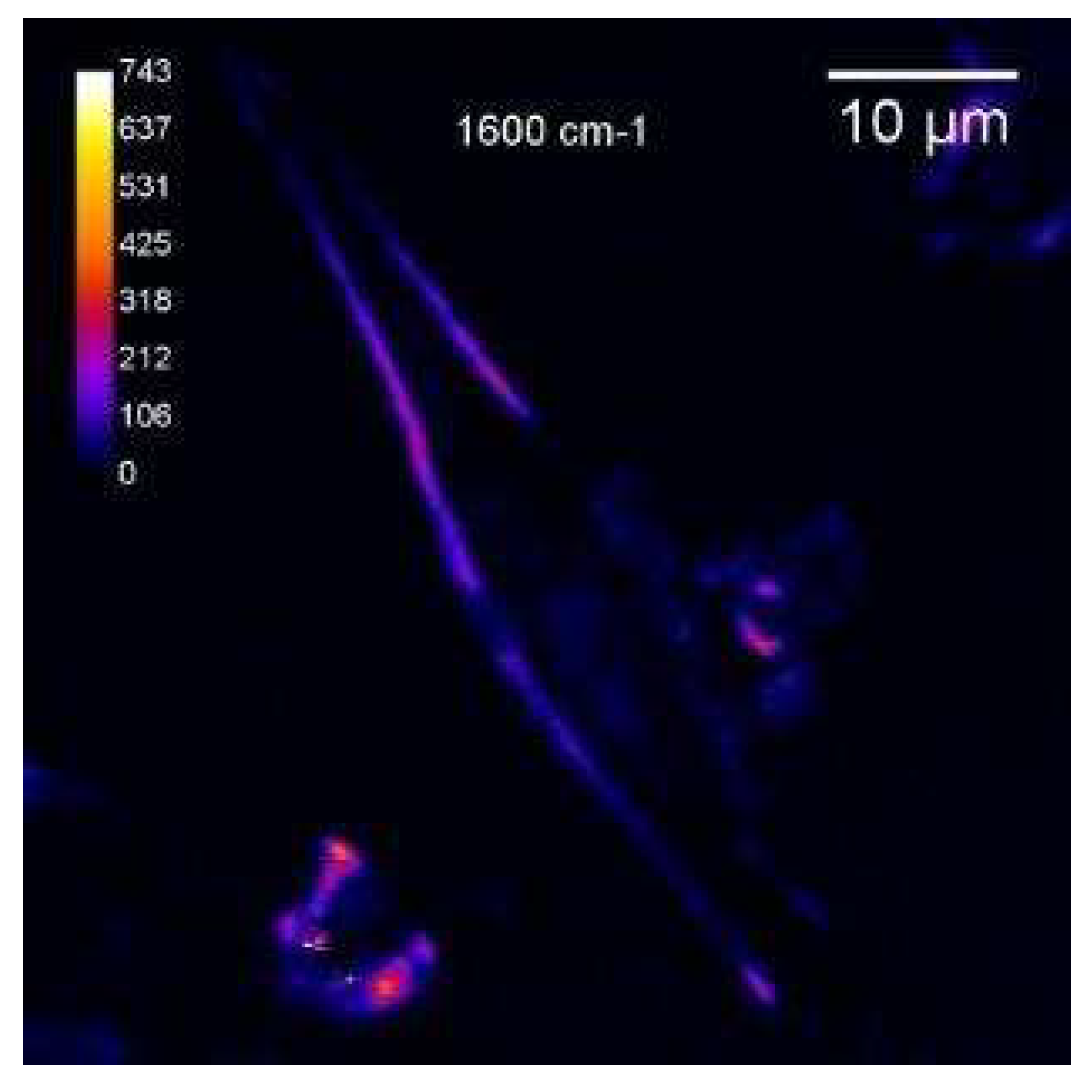
Figure 8.
CARS spectra and images of LLC/R9 asdgesive cells on cover glass surface. Resonance at 1600 cm-1. The scalebar is 10 μm. a) CARS image of normal LLC/R9 cell . b) CARS image of necrotic LLC/R9 cell.
Figure 8.
CARS spectra and images of LLC/R9 asdgesive cells on cover glass surface. Resonance at 1600 cm-1. The scalebar is 10 μm. a) CARS image of normal LLC/R9 cell . b) CARS image of necrotic LLC/R9 cell.
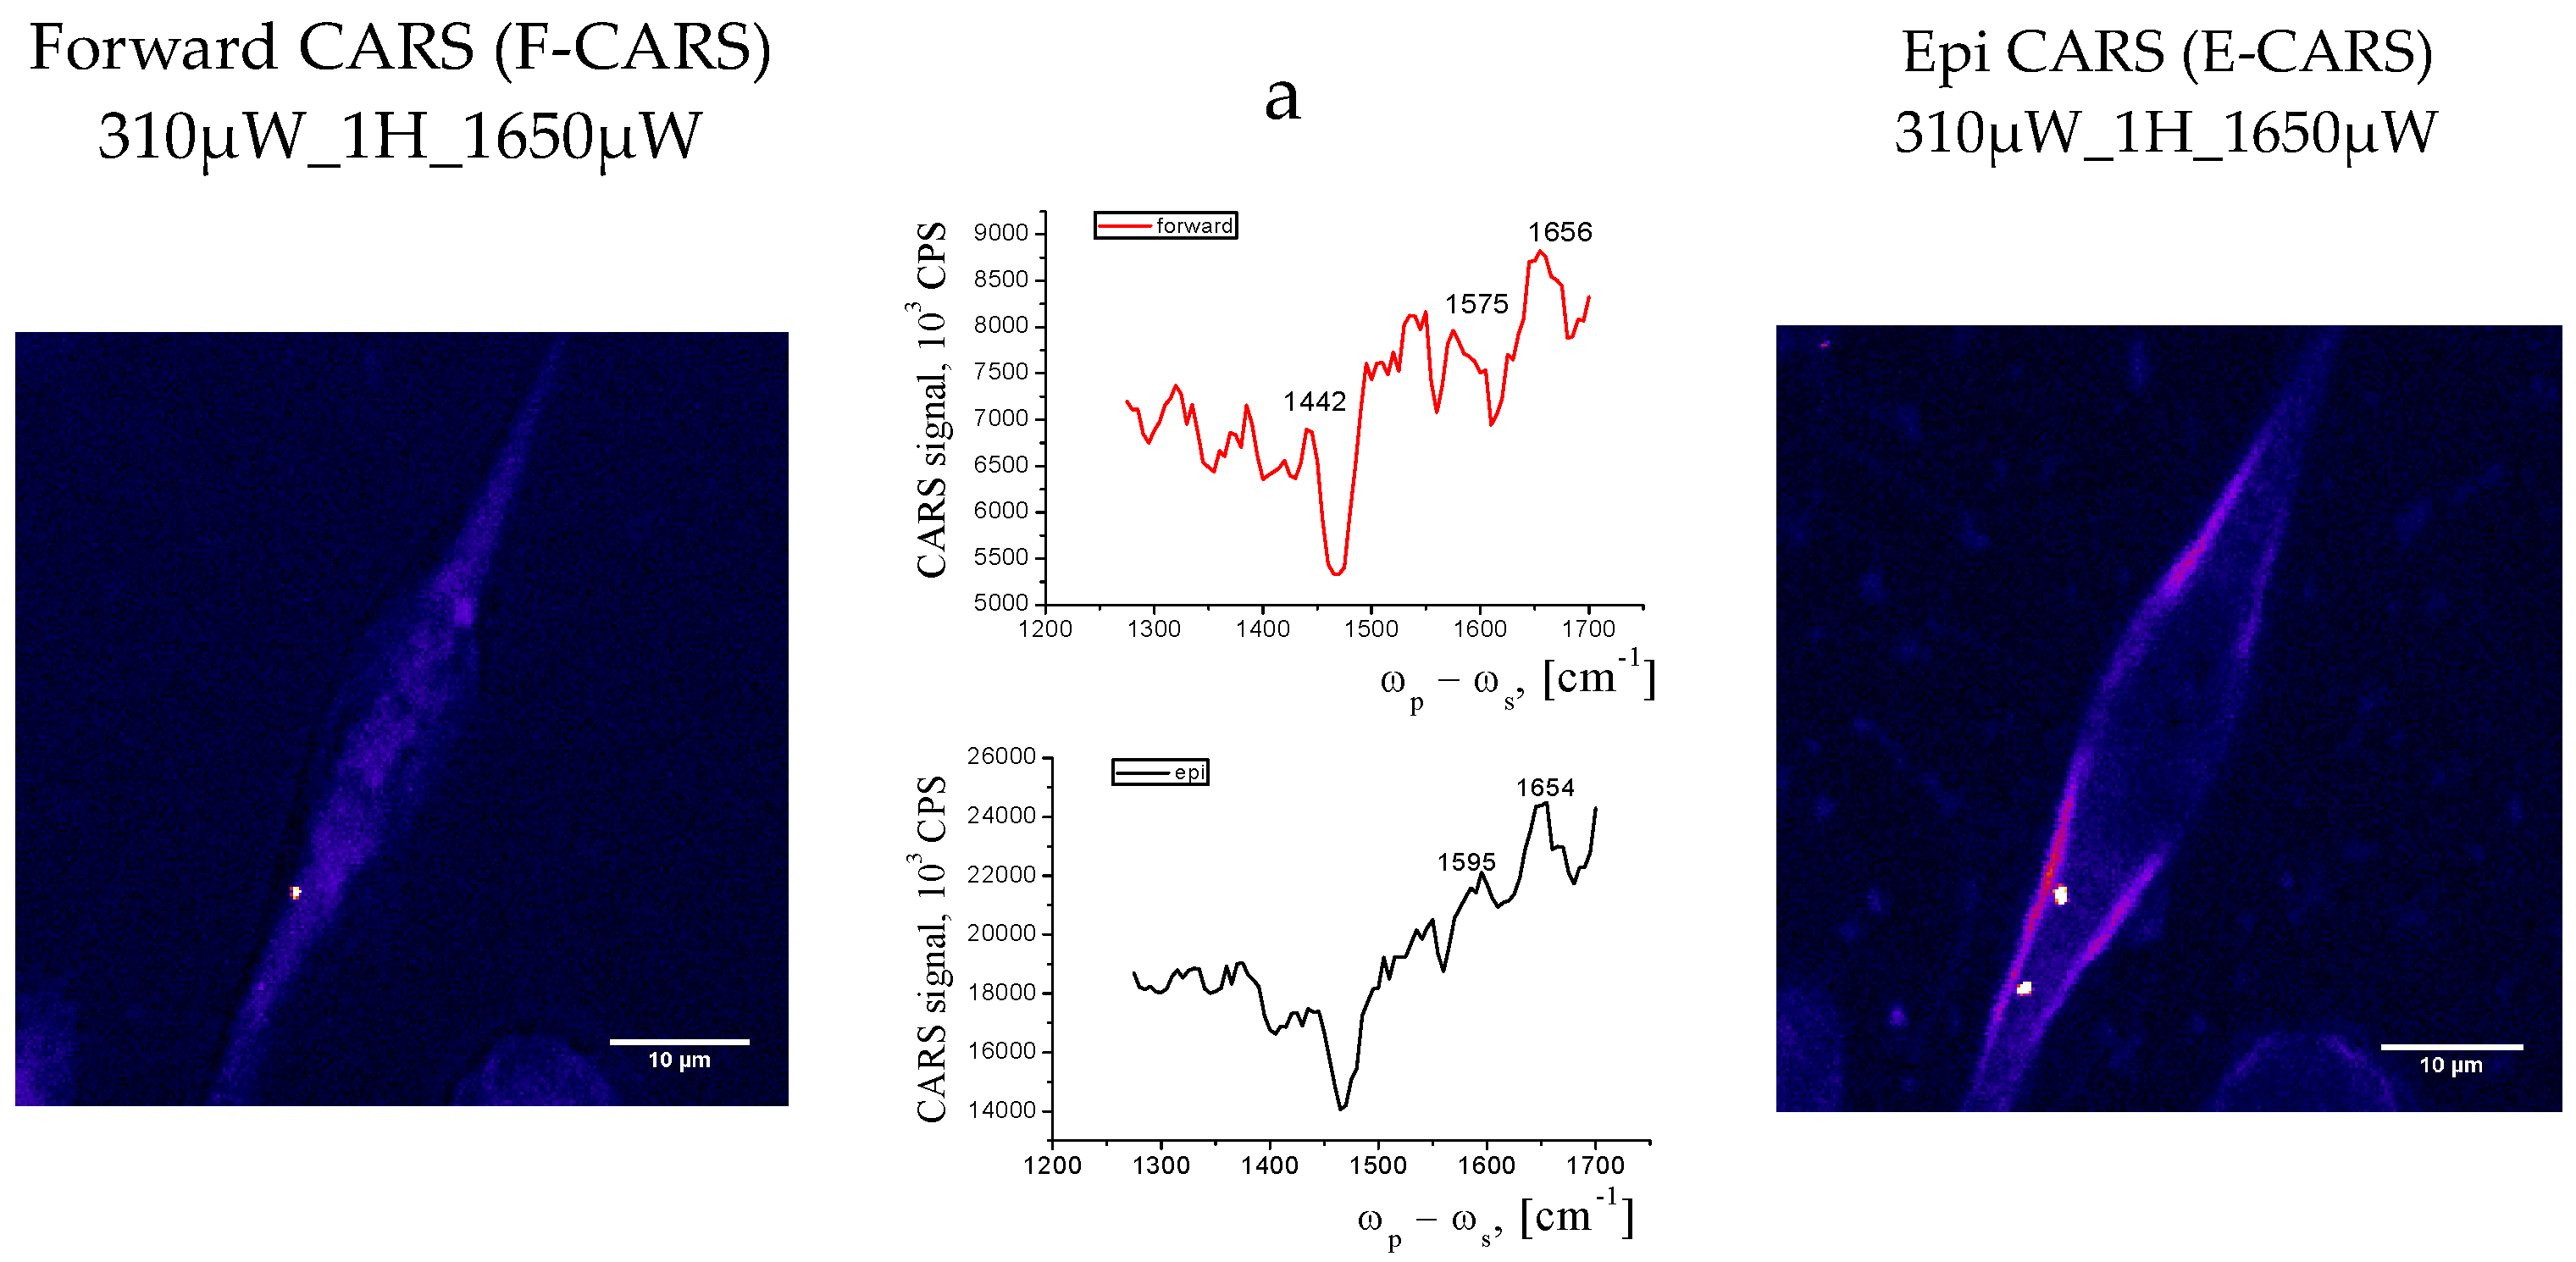
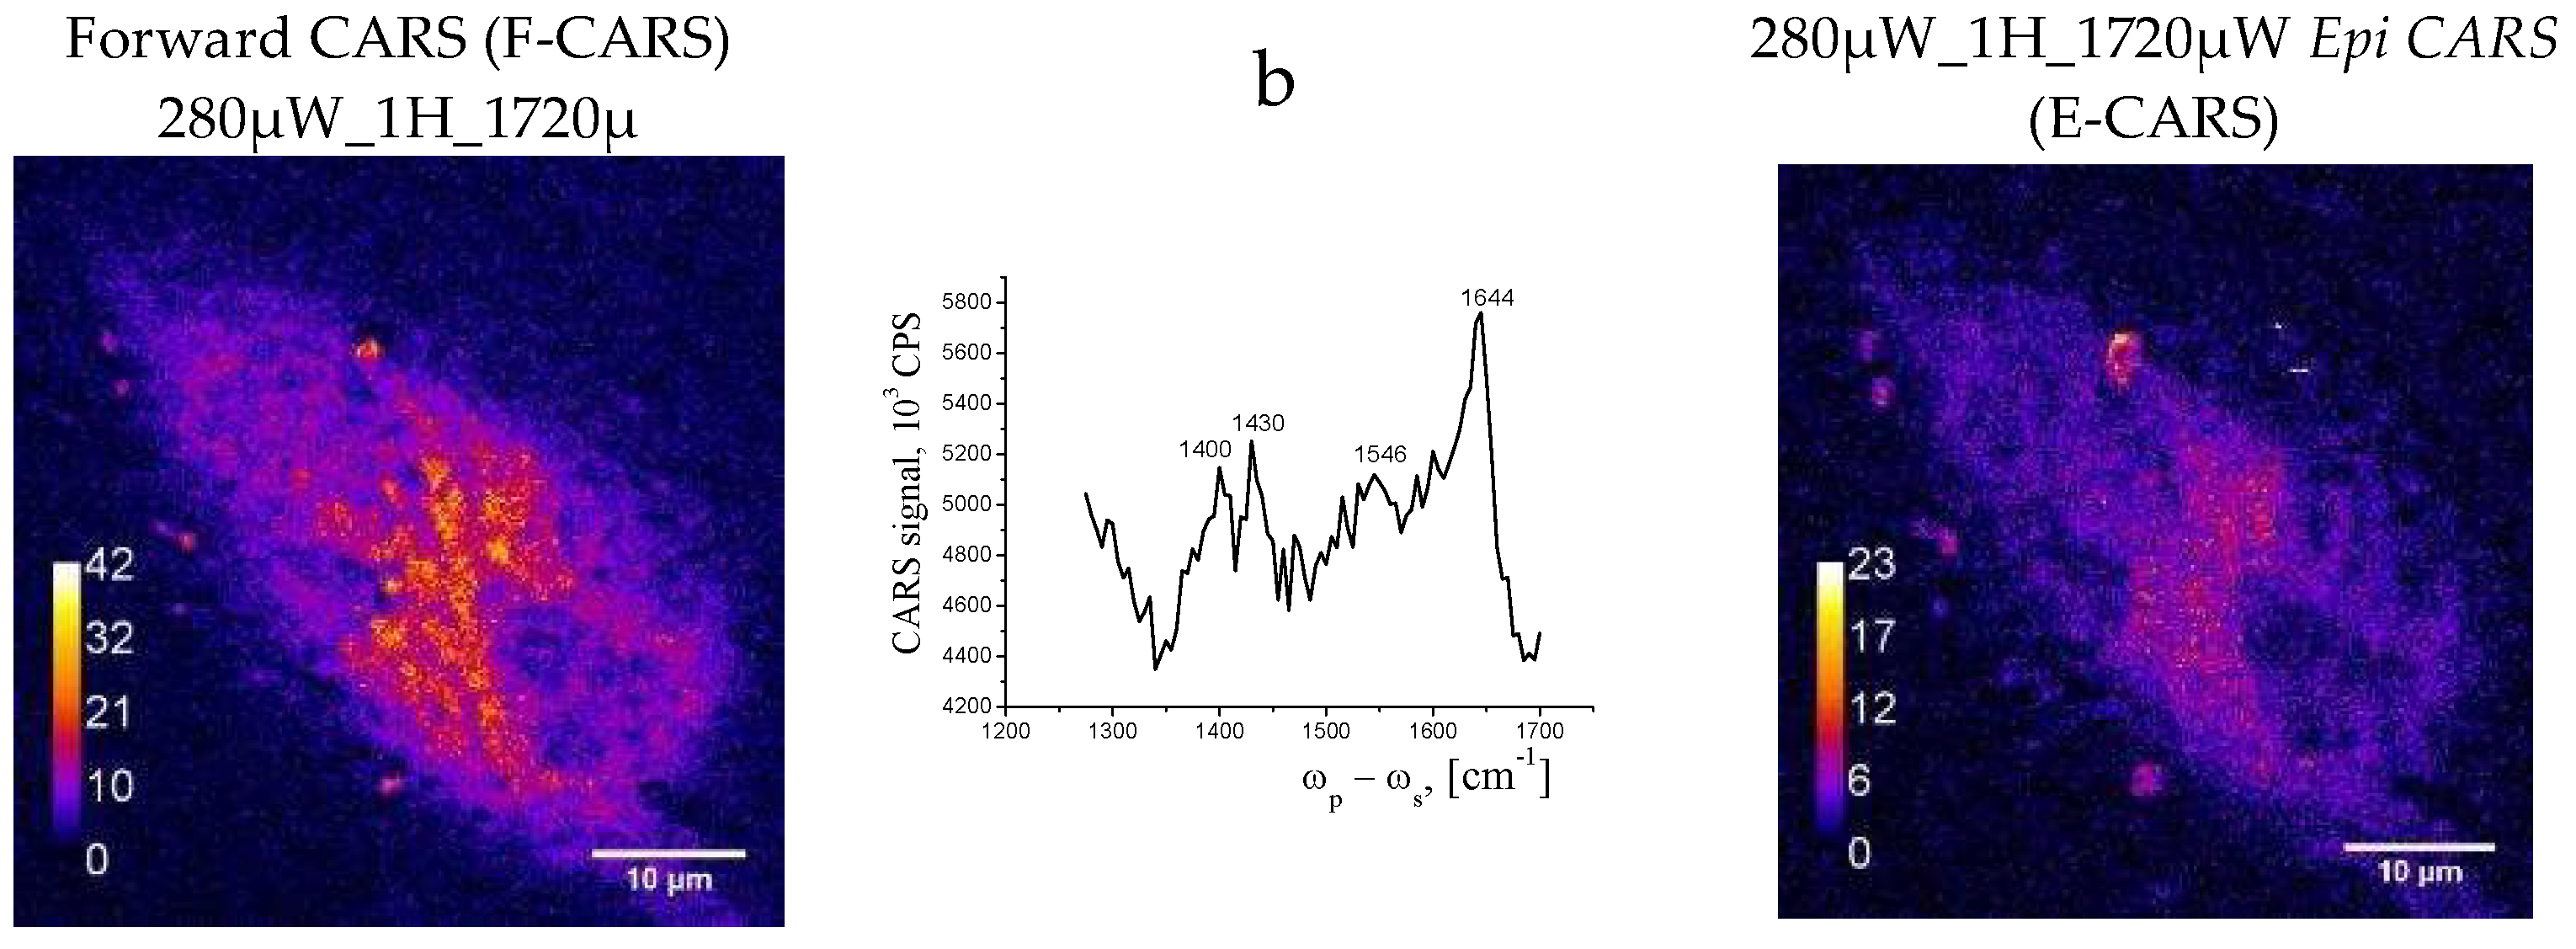
Table 1.
LLC-R9 cells Amide I absorption band components.
| Secondary structure | LLC-R9 adhesive | LLC-R9 de-adhesive | ||
| Position, cm-1 | Contribution$$$$$in % of total | Position, cm-1 | Contribution$$$$$in % of total | |
| α-helix | 1645 | 26.2 | 1645 | 26.4 |
| β-sheet | 1630, 1690 | 21.3 | 1629, 1691 | 21.5 |
| Turns | 1675 | 11.8 | 1676 | 12.3 |
| Side groups | 1614 | 14.6 | 1613 | 14.8 |
| Disordered form | 1660 | 16.3 | 1660 | 14.8 |
Table 4.
The MFI of the cell fluorescent images obtained from confocal microscopy.
| Cell type | MFI |
| MAEC-2 | 45.6 |
| MAEC-5 | 42.1 |
| LLC-R9- adgesive -2 | 72.1 |
| LLC-R9- adgesive -4 | 67.3 |
| LLC-R9-de- adgesive -1 | 46.1 |
| LLC-R9-de- adgesive -2 | 38.0 |
Disclaimer/Publisher’s Note: The statements, opinions and data contained in all publications are solely those of the individual author(s) and contributor(s) and not of MDPI and/or the editor(s). MDPI and/or the editor(s) disclaim responsibility for any injury to people or property resulting from any ideas, methods, instructions or products referred to in the content. |
© 2024 by the authors. Licensee MDPI, Basel, Switzerland. This article is an open access article distributed under the terms and conditions of the Creative Commons Attribution (CC BY) license (http://creativecommons.org/licenses/by/4.0/).
Copyright: This open access article is published under a Creative Commons CC BY 4.0 license, which permit the free download, distribution, and reuse, provided that the author and preprint are cited in any reuse.


