Submitted:
10 October 2024
Posted:
11 October 2024
You are already at the latest version
Abstract
The sediments deposited at the lower reaches of 90 medium and minor rivers from 5 states along western India were analysed for mineralogy and, major and trace elements chemistry. Kaolinite followed by minor illite and gibbsite and traces of goethite and, smectite followed by minor kaolinite, illite and chlorite are characteristic of the clays from Archean-Proterozoic (A-P) terrain and Deccan Trap (DT) terrain, respectively. The sediments were depleted with Si, Ca, Mg, Na and K relative to that of Post Archean average Australian Shale. The SiO2/Al2O3 ratio suggests the sediments from A-P terrain resemble lateritic soils, while those from DT terrain are non-lateritic, chemically weathered soils. The weathering indices indicate intensely weathered and compositionally mature sediments from Kerala, Karnataka and Maharashtra and, intermediate to intensely weathered sediments from Goa and Gujarat. The sediments exhibit relatively high Th, U, La, Zr and Hf from A-P terrain and, high Sc, Cr, Co, Ni, V and Ga from DT terrain. The total trace element content (∑TE) was lower for the clay than silt fractions of sediments. The peak high ∑TE occur in the silt fraction of sediments from Kerala and Maharashtra. The Th/U and Rb/Sr ratios are controlled by the intensity of weathering and lithology of source rocks. The standard plots using trace elements reveal intermediate provenance between felsic and mafic source. Clay fractions from both terrains are more mafic implying mafic-component dominated sediments are transported to the adjacent Seas and Oceans. Therefore, it would be challenging to identify the clays transported from granitic terrain in the Oceans, using trace element chemistry.
Keywords:
fluvial sediments
; trace elements
; Western Ghats
; Deccan Trap terrain
; Archean-Proterozoic terrain
; chemical weathering
; provenance
1. Introduction
Rivers are the most significant dynamic systems, which erode the Earth’s surface and transport weathered continental material to the oceans. The composition of river sediment can be influenced by factors such as the type of source rocks, climate, low and high relief, degree of chemical weathering, transport, and post-depositional diagenetic effects (Nesbitt and Young, 1982; Nesbitt et al., 1996; Taylor and McLennan, 1985; McLennan, 1989; McLennan et al., 1993; Fedo et al., 1995; Selvaraj and Chen, 2006; Borges et al., 2008; Liu et al., 2012; Lupker et al., 2013; Garzanti and Resentini, 2016; Hossain et al., 2018). The river sediments thus provide cumulative information on the composition of the continental crust, impact of weathering, tectonic setting of the source terrain and sedimentary processes associated with transportation and deposition (Roser and Korsch, 1986, 1988; Amajor, 1987; Cox et al., 1995; Hayashi et al., 1997; Roy and Roser, 2013; Armstrong-Altrin et al., 2021; Hossain, 2020; Boruah and Laskar, 2022). It is, however, possible to point out the influence of these parameters from the mineral and chemical characteristics of sediments. For example, high precipitation and intense chemical weathering are typical in humid, tropical climatic conditions. Chemical weathering not only affects global climate by consuming atmospheric carbon-dioxide by silicate weathering (Berner and Berner, 1997; Kump et al., 2000), but also causes chemical degradation of rocks resulting in high dissolved load of mobile elements and enrichment of immobile elements in the sediments and, high sediment yield into the rivers. The erosional products of chemical weathering are finer than those derived from physical or mechanical weathering. Topography influences the sediment characteristics. For instance, the steep slopes promote more of physical weathering and produce coarser sediment. Sediment texture, mineralogy and chemistry are modified by hydraulic sorting processes. Post-depositional processes such as diagenesis modify the sediment composition depending on oxic, sub-oxic and anoxic conditions in the sediments. However, recent sediments exhibit little or no diagenetic effect on sediment composition (Chamley, 1989).
Numerous studies have been carried out on mineralogy and geochemistry of the sediments from large as well as small rivers to better understand the provenance and impact of chemical weathering on source rocks (Sarma and Rajamani 2001; Selvaraj and Chen 2006; Sen Sarma et al., 2008; Bhuiyan et al., 2011; Maharana et al., 2018; He et al., 2020; Hossain, 2020, Rahman et al., 2020; Chougong et al., 2021; Sai Babu et al., 2020, 2021, 2023, 2024; Saha et al., 2023; Guo et al., 2023; Gurumurthy, 2024). The studies indicate that the sediments deposited by small rivers are of considerable importance as they are good indicators of weathering environment typical of their basins and help to constrain the nature of source rocks (Mahle, 2023). The sediment mineralogy and major element chemistry (mobile and easily leachable elements) have been used to deduce the weathering history (Cullers, 1994; Price and Velbel, 2003), while immobile trace elements, such as La, Zr, Sc, Cr, V, Th, Hf, and Yb during sediment transport and diagenesis provide valuable information on provenance (Cullers, 1994; Wronkiewicz and Condie,1989; Bhatia, 1983; Hayashi et al., 1997). In this study, we have investigated mineralogical and, major and trace element characteristics of sediments deposited at the lower reaches of the medium and minor rivers (Rao, 1975) along the west coast of India. These rivers drain the Western Ghats (WG) that comprise of two distinct geological formations all along its length and experience humid, tropical climate. The western slope of the WG is much steeper in the northern and southern part than in the central part. The basement rocks of the WG are covered by laterites, whose thickness decreases considerably from south to north. Several investigators reported the mineralogy and geochemistry of the suspended and/or bed sediments of the rivers and/or estuaries (Naidu et al., 1985; Subramanian et al., 1985; Ramesh et al., 1989; Singh and Rajamani, 2001; Das and Krishnaswamy, 2007; Sen Sarma et al., 2008; Sharma, 2013; Sai Babu et al., 2021, 2024; Shynu et al., 2011, 2013, 2017, Prajith et al., 2015, Kessarkar et al., 2003, 2015; Babechuk et al., 2014, 2015, 2022; Gurumurthy, 2024) or mineral composition of the sediments in the adjacent continental shelf (Rao and Rao, 1995; Kessarkar et al., 2003). The purpose of the study is to report clay minerals, major and trace element characteristics of sediments in rivers along the west coast of India and investigate the factors controlling sediment composition.
2. Geological Setting
Geomorphology: The present study is on the mineralogy, major and trace elements chemistry of sediments in 90 medium and minor rivers along the west coast of India (Figure 1). These rivers receive sediment load and waters from the Western Ghats (WG; mountain range), a linear geomorphic feature that runs parallel to the west coast of India (Figure 1; Krishnan, 1968). The Western Ghats starts near the border of Gujarat and Maharashtra, south of the Tapti River and runs ~1600 km through the states of Maharashtra, Goa, Karnataka, Kerala and Tamil Nadu and ends at Kanyakumari. The northern Western Ghats (Gujarat through Maharashtra up to Goa) with steep gradient are remarkably straight and lie at the edge of the Arabian Sea, also known as the Great Escarpment of India (Widdowson and Cox, 1996, Kale, 2009). Here, the Ghats exhibit rugged topography, steep cliffs, deep valleys and dense forests. The Ghats are further inland, 50 to 80 km away from the seashore between Bhatkal and Cochin in the central and southern part and, again located on the coast in the south Kerala and around Tiruvunanthapuram. The height of the Western Ghats is up to 2600 m, with an average elevation of ~1200 m and, their width varies between 50 and 80 km.
Geology: The Western Ghats comprise of two broad and predominant geological formations, the continental flood basalts (Deccan Traps) in the north and Archean-Proterozoic formations in the south (Figure 1; Krishnan, 1968). The flood basalts cover vast areas (>500,000 km2) for the Deccan and represent the extrusion of phenomenal volumes of lava. The thickness of the Deccan Traps varies considerably (200 m to 2 km) with its maximum in the plateau region. The thickness and number of discrete lava flows is greatest in the western parts and decreasing gradually towards east and south. The Deccan Trap basalts can be divided into 4 stratigraphic subdivisions. The lower basalts (the Bushe and Poladpur formations) are largest and show evidence of contamination with upper crustal material. The upper basalts (the Ambenali and Mahabaleshwar formations) show low contamination and/or mobilization of material from the mantle lithosphere (Lightfoot et al., 1990). The lateral transition from the Deccan basalts to Archean-Proterozoic formations (APF) occurs close to the border of Maharashtra and Goa (Figure 1). The APF can further be divided into granites and gneisses in the north and high-grade charnockites and khondalites in the south (Radhakrishna, 1983; Figure 1). The basement rocks of Goa and Karnataka belong to the Dharwar Super Group (Gokul et al., 1985) with green schists and gneisses. The iron and manganese ore deposits occur in Goa and are being mined by open cast method (Gokul et al., 1985, Mascarenhas and Kalavampara, 2009). The Mandovi and Zuari Rivers drain through these ore deposits and carry ore particulates in their suspended and bed loads (Shynu et al., 2011, 2013). Supergene Mn ore deposits formed on Late Archean rocks also occur in the northern Karnataka (Jean et al., 2020). Cryptomalene (K-rich, Mn-oxide) is a predominant mineral in the deposits. Limestones, dolomites, ultramafic rocks, orthoquartzites, argillite, banded magnetite/ hematite quartzites are minor rock types of Karnataka. Laterites cover extensively the basement rocks of the Western Ghats at different topographic levels between Kerala and Maharashtra. The thickness of the laterites is several tens of meters (up to 30 m) in Kerala, Karnataka and Goa and decreases to < 10 m in the Deccan Trap (Maharashtra) region (Kaotekwar et al., 2014). Bauxite deposits are reported at several locations in the Kerala.
Climate: Humid, tropical climate prevails all along the Western Ghats. Semi-arid climate is prevalent in the north of Narmada and Tapti Rivers and Gujarat (Krishnan 1968; Sreenath et al. 2022). The mountain ranges intercept the rain-bearing westerly winds during the southwest monsoon (June–September). Consequently, the western slopes of the Western Ghats receive far more rainfall (av. 250 cm/yr) than their eastern slopes (100 cm/yr). Precipitation is much heavier with an average rainfall of 300–400 cm/yr in the states of Maharashtra, Goa and northern Karnataka than the southern Karnataka and Kerala. Numerous medium and minor rivers draining the western slope of the Western Ghats (Figure 1) are fast-moving, owing to short distance travelled and steeper gradient and bring suspended and bed load of sediment into the Arabian Sea.
3. Materials and Methods
Numerous rivers drain the western slopes of the Western Ghats and bring sediments to the coastal Arabian Sea. For this study, sediments were collected at the lower reaches of 90 rivers from 5 states, between Neyyar River of Kerala and Bhogawa River of Gujarat (Figure 1), using Van Veen Grab. The sediments recovered were dried. The sediments from the rivers of Kerala, Karnataka and Goa are considered and derived from Archean- Proterozoic (A-P) terrain and those from Maharashtra and Gujarat are from Deccan Trap (DT) terrain. The sand, silt and clay fractions of sediments were separated in the laboratory, following Folk (1968). The < 62 µm fraction of the sediment was separated from the total sediment by wet sieving, using 230 (ASTM) mesh sieve. This fraction was collected in a measuring glass cylinder, made up to 1000 ml volume with distilled water and stirred vigorously for homogeneity. The <4 µm fraction (clay) was separated based on Stoke’s settling velocity and collected in a beaker, dried in an oven at 60° C and then powdered. This procedure was repeated several times and ensured that the clay fraction was removed completely from the <62 µm fraction of sediment in the cylinder. Then the remaining fraction was dried and powdered, as it represents silt fraction (>4 to 62 µm). The powdered sediment size fractions were used for geochemical analyses.
The major elements were determined on clay and silt fractions of sample powders by using X-ray Fluorescence spectrometer, ‘WD XRF’ Model Axios mAX4, P-Analytical, at CSIR-National Geophysical Research Institute (CSIR-NGRI), Hyderabad. A detailed procedure was given in Sai Babu et al. (2021). For trace and rare earth element analysis, the detailed procedure mentioned in Sai Babu et al. (2024) was used and also repeated below: A 50 mg of sample powders were taken in Savillex vessels to which 10 ml of acid mixture containing hydrofluoric acid (HF) and nitric acid (HNO3) in 7:3 ratio. These vials were tightly closed and were heated at 150° C for 48 hours. Following this step, these vials were opened and heated at 100° C to near dryness. The sample residue was further mixed with 10 ml of acid mixture containing nitric acid (HNO3) and Millipore water in 1:1 ratio and was heated at 80° C for 1 hour. To obtain the necessary TDS level, and to minimize the matrix effects, the obtained sample solution was diluted 50,000 times. Trace elements were determined by High-Resolution Inductively Coupled Plasma Mass Spectrometer (HR-ICP-MS, Attom), Nu Instruments at CSIR-NGRI, Hyderabad. The instrument drift was monitored and corrected using 103Rh as the internal standard. The within run RSD for all the analysed elements were under 3%. Certified reference material JSD-3 μg/g was repeatedly analysed as an unknown to monitor the accuracy and reproducibility of the obtained trace element data.
Table 1 shows the major element data of the clay and silt fractions of sediments and, data on weathering indices such as chemical index of alteration (CIA; Nesbitt and Young, 1996), plagioclase index of alteration (Fedo et al., 1995), Index of chemical variability (Cox et al., 1995) and mafic index of alteration (MIA: Babechuk et al., 2014) and index of laterization (IOL; Babechuk et al. 2022). Trace elements data for the clay and silt fractions of sediments are given in Table 2 and Table 3, respectively. Table 4 shows correlation matrix for the clay fraction of sediments, separately for Archean-Proterozoic terrain (APT) and Deccan Trap terrain (DTT).
Silt
|
State (No. of Rivers) |
SiO2 | Al2O3 | Fe2O3 | MnO | MgO | CaO | Na2O | K2O | TiO2 | P2O5 | SiO2/Al2O3 | Fe2O3/Al2O3 | Al2O3/TiO2 | CIA | PIA | ICV | MIA (O) | MIA (R) | IOL | |
| Kerala (21) | Range | 34.08-48.17 | 15.44-26.06 | 9.55-16.03 | 0.06-0.22 | 0.60-3.53 | 0.30-2.59 | 0.17-1.89 | 0.72-2.66 | 0.74-1.57 | 0.15-0.80 | 1.38- 2.21 |
0.37- 0.71 |
11.29- 34.19 |
76.13-94.19 | 67.23-91.28 | 0.57-1.14 | 75.61-93.55 | 50.39-67.10 | 34.69-54.21 |
| Avg., | 38.75 | 22.71 | 12.09 | 0.13 | 1.71 | 0.94 | 0.49 | 1.54 | 1.24 | 0.41 | 1.71 | 0.53 | 18.31 | 88.36 | 82.33 | 0.81 | 88.09 | 59.34 | 47.37 | |
| STD (±) | 3.96 | 2.25 | 1.94 | 0.04 | 0.75 | 0.52 | 0.36 | 0.55 | 0.22 | 0.14 | 0.35 | 0.10 | 4.64 | 4.25 | 5.95 | 0.16 | 4.20 | 4.94 | 4.02 | |
| Karnataka (20) | Range | 39.34-65.74 | 15.21-21.44 | 6.69-13.39 | 0.02-0.13 | 0.34-2.21 | 0.07-1.18 | 0.05-0.99 | 0.44-1.80 | 0.94-1.98 | 0.07-0.35 | 1.99- 4.32 |
0.32- 0.71 |
10.31- 19.97 |
81.23-96.24 | 72.89-94.17 | 0.50-1.02 | 81.34-96.47 | 52.86-71.74 | 26.29-44.13 |
| Avg., | 49.33 | 19.22 | 10.08 | 0.07 | 1.03 | 0.51 | 0.31 | 1.07 | 1.35 | 0.22 | 2.60 | 0.53 | 14.81 | 90.94 | 85.88 | 0.76 | 90.88 | 61.67 | 37.40 | |
| STD (±) | 5.38 | 1.64 | 1.85 | 0.03 | 0.48 | 0.29 | 0.24 | 0.37 | 0.33 | 0.08 | 0.48 | 0.10 | 2.71 | 3.49 | 4.90 | 0.14 | 3.48 | 5.17 | 3.88 | |
| Goa (11) | Range | 43.19-56.47 | 14.81-20.41 | 6.03-14.47 | 0.05-0.55 | 1.23-3.50 | 0.42-2.35 | 0.20-0.72 | 1.08-1.51 | 1.16-2.10 | 0.21-0.49 | 2.46- 3.15 |
0.31- 0.86 |
8.57- 14.90 |
80.13-90.81 | 74.00-84.87 | 0.60-1.32 | 78.79-91.41 | 47.05-67.95 | 31.34-42.56 |
| Avg., | 49.38 | 17.65 | 9.66 | 0.17 | 2.23 | 1.06 | 0.42 | 1.30 | 1.59 | 0.32 | 2.81 | 0.56 | 11.46 | 86.43 | 80.05 | 0.95 | 84.54 | 56.52 | 35.69 | |
| STD (±) | 4.23 | 1.72 | 2.64 | 0.18 | 0.75 | 0.54 | 0.14 | 0.13 | 0.36 | 0.08 | 0.23 | 0.19 | 2.12 | 3.12 | 3.49 | 0.22 | 3.84 | 6.65 | 3.26 | |
| Archean- Proterozoic Terrain (APT) | Range | 34.08-65.74 | 14.81-26.06 | 6.03-16.03 | 0.02-0.55 | 0.34-3.53 | 0.07-2.59 | 0.05-1.89 | 0.44-2.66 | 0.74-2.10 | 0.07-0.80 | 1.38-4.32 | 0.31-0.86 | 8.57-30.65 | 76.13-96.24 | 67.23-94.17 | 0.50-1.32 | 75.61-96.47 | 47.05-71.74 | 26.29-54.21 |
| Avg., | 45.07 | 20.30 | 10.80 | 0.12 | 1.56 | 0.80 | 0.41 | 1.31 | 1.36 | 0.32 | 2.29 | 0.54 | 15.76 | 88.57 | 82.75 | 0.84 | 87.83 | 59.17 | 40.15 | |
| STD (±) | 6.93 | 2.82 | 2.30 | 0.10 | 0.80 | 0.50 | 0.29 | 0.47 | 0.32 | 0.14 | 0.61 | 0.12 | 4.53 | 3.62 | 14.34 | 0.17 | 3.84 | 4.9 | 3.72 | |
| Maharashtra (21) | Range | 46.24-57.94 | 14.98-22.11 | 0.81-9.37 | 0.05-0.37 | 0.93-5.76 | 0.47-10.91 | 0.10-1.67 | 0.38-1.82 | 1.07-8.36 | 0.08-0.60 | 2.41- 3.72 |
0.04- 0.56 |
1.96- 15.77 |
55.08-92.99 | 52.15-91.00 | 0.39-1.45 | 56.03-89.80 | 44.10-85.37 | 22.98-31.62 |
| Avg., | 53.34 | 18.06 | 3.12 | 0.20 | 2.55 | 2.93 | 0.64 | 0.78 | 3.43 | 0.25 | 2.99 | 0.18 | 6.12 | 81.02 | 77.46 | 0.78 | 75.96 | 65.72 | 28.43 | |
| STD (±) | 3.46 | 2.11 | 2.45 | 0.08 | 1.20 | 2.25 | 0.40 | 0.32 | 1.49 | 0.11 | 0.38 | 0.15 | 2.67 | 8.77 | 8.73 | 0.27 | 9.41 | 10.54 | 2.60 | |
| Gujarat (17) | Range | 50.55-63.44 | 12.26-16.32 | 0.30-7.08 | 0.09-0.24 | 2.30-3.72 | 3.03-10.88 | 0.77-1.91 | 0.79-1.58 | 1.59-3.42 | 0.13-0.33 | 3.17- 4.75 |
0.02- 0.50 |
4.19- 8.81 |
46.56-77.56 | 41.06-73.78 | 0.97-1.87 | 48.67-75.85 | 37.37-57.14 | 18.73-30.73 |
| Avg., | 55.71 | 14.17 | 3.68 | 0.15 | 2.93 | 6.16 | 1.31 | 1.25 | 2.36 | 0.17 | 3.97 | 0.26 | 6.27 | 62.20 | 56.72 | 1.28 | 60.58 | 48.93 | 24.30 | |
| STD (±) | 3.36 | 1.46 | 1.62 | 0.04 | 0.41 | 1.86 | 0.32 | 0.26 | 0.53 | 0.05 | 0.50 | 0.12 | 1.35 | 7.54 | 8.09 | 0.27 | 6.24 | 6.17 | 3.12 | |
| Deccan Trap Terrain (DTT) | Range | 46.63-63.44 | 12.26-22.11 | 0.30-9.37 | 0.05-0.37 | 0.93-5.76 | 0.47-10.91 | 0.10-1.91 | 0.38-1.82 | 1.07-8.36 | 0.08-0.60 | 2.41-4.75 | 0.02-0.56 | 1.96-15.77 | 46.56-92.99 | 41.06-91.00 | 0.39-1.87 | 48.67-89.80 | 37.37-85.37 | 18.73-31.62 |
| Avg., | 54.40 | 16.32 | 3.37 | 0.17 | 2.72 | 4.37 | 0.94 | 0.99 | 2.95 | 0.22 | 3.43 | 0.22 | 6.19 | 71.61 | 67.09 | 1.03 | 68.27 | 57.32 | 26.36 | |
| STD (±) | 3.57 | 2.67 | 2.11 | 0.07 | 0.94 | 2.63 | 0.50 | 0.38 | 1.27 | 0.09 | 0.66 | 0.14 | 2.16 | 8.15 | 8.41 | 0.27 | 7.82 | 8.35 | 2.86 | |
| West Coast of India River Average Silt (WCIRAS) | Range | 34.08-65.74 | 12.26-26.06 | 0.30-16.03 | 0.34-5.76 | 0.07-10.91 | 0.05-1.91 | 0.38-2.66 | 0.74-8.36 | 0.02-0.55 | 0.07-0.80 | 1.61-4.75 |
0.02- 0.86 |
1.96-30.65 | 46.56-96.24 | 41.06-94.17 | 0.39-1.87 | 48.67-96.47 | 37.37-85.37 | 18.73-54.21 |
| Avg., |
49.30 |
18.62 | 7.66 | 2.14 | 2.58 | 0.67 | 1.17 | 2.03 | 0.14 | 0.27 |
2.81 |
0.41 |
1.96-30.65 |
81.79 |
76.86 | 0.89 | 80.24 | 59.03 | 34.63 | |
| STD (±) | 4.07 | 3.38 | 4.30 | 0.87 | 1.56 | 0.39 | 0.46 | 1.16 | 0.08 | 0.13 | 0.38 | 0.13 | 1.96-30.65 | 5.43 | 12.14 | 0.28 | 12.47 | 8.96 | 3.37 | |
| Reference Sediments | PAAS | 62.80 | 18.90 | 7.22 | 0.11 | 2.20 | 1.30 | 1.20 | 3.70 | 1.00 | 0.16 | 3.32 | 0.38 | 18.90 | 75.29 | - | - | 63.36 | 55.92 | 23.97 |
| UCC | 66.20 | 15.30 | 5.57 | 0.09 | 2.47 | 3.57 | 3.25 | 2.78 | 0.63 | 0.15 | 4.33 | 0.36 | 24.29 | 61.44 | - | - | 75.67 | 47.24 | 29.37 | |
| CIA: Chemical Index of Alteration (Nesbitt and Young 1982); PIA: Plagioclase Index of Alteration (Fedo et al. (1995, 1996); ICV: Index of Chemical Variability (Cox et al. 1995; Cullers 2000);MIA : Mafic Index of Alteration (Oxic) and MIA : Mafic Index of Alteration (Redox) (Babechuk and Fedo (O) (R) 2022); IOL: Index of Laterization (Babechuk and Fedo 2022); APT: Archean- Proterozoic Terrain (this study); DTT: Deccan Trap Terrain (this study); WCIRAC: West Coast of India River Average Clay (this study); WCIRAS: West Coast of India River Average Silt (this study); PASS: Post Archean average Australian Shale (Pourmand et al. 2012); UCC: Upper Continental Crust (Rudnick and Gao 2003). | ||||||||||||||||||||

Table 2.
Trace elements content (µg/g) of the clay fraction (<4 µm) of sediments in the rivers of West Coast of India.
Table 2.
Trace elements content (µg/g) of the clay fraction (<4 µm) of sediments in the rivers of West Coast of India.
| State (No. of Rivers) | Sc | V | Cr | Co | Ni | Cu | Zn | Ga | Rb | Sr | Nb | Cs | Ba | Hf | Th | U | Zr | Ta | Pb | Y | La | Ce | Yb | |
|---|---|---|---|---|---|---|---|---|---|---|---|---|---|---|---|---|---|---|---|---|---|---|---|---|
| Kerala (21) | Range | 20.635-32.939 | 111.228-247.004 | 108.934-286.565 | 18.621-41.839 | 42.601-101.548 | 29.208-111.952 | 29.812-155.052 | 24.975-37.808 | 36.921-91.318 | 45.695-160.748 | 10.997-21.144 | 2.399-6.017 | 169.206-805.442 | 3.647-6.870 | 7.098-24.337 | 1.542-5.112 | 106.617-220.885 | 0.738-1.285 | 12.152-55.830 | 16.558-32.174 | 29.485-95.765 | 63.296-179.624 | 1.864-3.336 |
| Avg., | 26.541 | 175.490 | 158.778 | 29.480 | 63.448 | 73.452 | 58.064 | 33.533 | 61.766 | 79.312 | 14.930 | 3.569 | 381.114 | 4.769 | 11.915 | 2.569 | 147.032 | 0.969 | 31.707 | 25.822 | 55.635 | 109.026 | 2.723 | |
| STD ± | 3.292 | 39.857 | 52.253 | 7.767 | 16.006 | 19.719 | 30.319 | 3.588 | 15.075 | 29.618 | 2.811 | 0.825 | 199.435 | 0.851 | 3.966 | 1.004 | 27.292 | 0.144 | 11.619 | 3.762 | 19.957 | 36.471 | 0.380 | |
| Karnataka (20) | Range | 14.307-36.603 | 136.105-347.618 | 82.778-897.427 | 11.395-55.126 | 46.310-129.463 | 76.344-231.775 | 53.654-195.438 | 24.545-39.110 | 31.908-88.767 | 29.474-71.719 | 11.333-26.539 | 3.222-6.995 | 104.126-288.198 | 4.027-10.586 | 7.939-25.704 | 1.629-6.168 | 136.561-393.665 | 1.040-2.388 | 17.312-51.190 | 8.572-27.410 | 8.035-42.580 | 29.500-86.723 | 1.238-2.966 |
| Avg., | 22.491 | 228.554 | 203.823 | 24.735 | 72.184 | 133.002 | 85.446 | 32.481 | 61.710 | 49.209 | 16.625 | 4.984 | 177.673 | 5.626 | 13.924 | 3.917 | 198.999 | 1.550 | 31.859 | 16.313 | 24.512 | 66.322 | 1.876 | |
| SD (±) | 7.090 | 64.939 | 168.245 | 11.363 | 18.098 | 48.957 | 32.997 | 4.005 | 17.035 | 10.621 | 3.600 | 1.285 | 49.698 | 1.665 | 4.884 | 1.133 | 66.097 | 0.373 | 9.974 | 4.828 | 9.141 | 15.286 | 0.479 | |
| Goa (11) | Range | 16.044-29.542 | 178.553-273.344 | 146.390-237.876 | 17.483-39.659 | 57.233-74.550 | 91.655-194.898 | 63.406-128.709 | 23.872-31.193 | 53.522-87.735 | 53.389-80.888 | 12.603-20.291 | 4.424-7.334 | 140.514-255.500 | 4.939-7.866 | 9.140-15.503 | 3.513-7.619 | 175.519-282.745 | 1.070-1.853 | 21.798-88.871 | 16.050-28.522 | 17.450-37.343 | 52.803-87.536 | 1.892-2.748 |
| Avg., | 24.123 | 222.571 | 187.975 | 30.539 | 63.886 | 121.412 | 84.618 | 27.003 | 74.508 | 70.698 | 15.604 | 5.931 | 185.070 | 6.142 | 12.544 | 4.939 | 220.424 | 1.425 | 34.096 | 22.733 | 28.772 | 71.293 | 2.333 | |
| SD (±) | 3.627 | 31.299 | 23.421 | 7.853 | 5.550 | 33.427 | 18.874 | 2.266 | 9.906 | 10.212 | 2.860 | 0.908 | 36.729 | 0.987 | 1.887 | 1.180 | 37.971 | 0.241 | 18.693 | 4.874 | 6.236 | 10.335 | 0.331 | |
| Archean- Proterozoic Terrain (APT) | Range | 14.307-36.603 | 111.228-347.618 | 82.778-897.427 | 11.395-55.126 | 42.601-129.463 | 29.208-231.775 | 29.812-195.438 | 23.872-39.110 | 31.908-91.318 | 29.474-160.748 | 10.997-26.539 | 2.399-7.334 | 104.126-805.442 | 3.647-10.586 | 7.098-25.704 | 1.542-7.619 | 106.617-393.665 | 0.738-2.388 | 12.152-88.871 | 8.572-32.174 | 8.035-95.765 | 29.500-179.624 | 1.238-3.336 |
| Avg., | 24.472 | 205.859 | 182.279 | 27.879 | 66.901 | 106.501 | 74.213 | 31.747 | 64.440 | 65.912 | 15.725 | 4.613 | 261.397 | 5.389 | 12.821 | 3.589 | 182.544 | 1.289 | 32.271 | 21.511 | 37.982 | 84.620 | 2.315 | |
| SD (±) | 5.374 | 55.028 | 110.183 | 9.503 | 15.695 | 45.140 | 31.878 | 4.291 | 15.627 | 24.388 | 3.180 | 1.386 | 163.369 | 1.345 | 4.072 | 1.418 | 56.012 | 0.380 | 12.627 | 6.121 | 20.315 | 32.318 | 0.555 | |
| Maharashtra (21) | Range | 26.371-58.580 | 194.681-465.372 | 86.186-267.990 | 27.035-70.839 | 53.673-104.417 | 133.713-275.273 | 64.061-192.930 | 23.349-45.456 | 26.920-92.183 | 42.265-217.870 | 9.002-18.219 | 1.670-7.822 | 128.836-362.785 | 4.319-9.142 | 5.400-18.302 | 1.000-5.902 | 158.734-321.440 | 0.904-1.712 | 8.604-39.252 | 20.649-54.546 | 20.087-46.223 | 45.041-127.803 | 2.053-3.924 |
| Avg., | 40.147 | 343.606 | 159.771 | 48.828 | 67.892 | 204.181 | 102.430 | 30.096 | 49.719 | 75.981 | 12.767 | 4.012 | 193.895 | 6.797 | 8.651 | 2.692 | 248.783 | 1.250 | 23.460 | 34.763 | 28.195 | 68.631 | 2.804 | |
| SD (±) | 8.210 | 75.765 | 46.991 | 12.268 | 12.018 | 47.942 | 32.047 | 4.772 | 19.262 | 38.998 | 2.940 | 1.816 | 59.513 | 1.230 | 3.331 | 1.377 | 45.455 | 0.249 | 8.440 | 8.949 | 6.895 | 19.883 | 0.471 | |
| Gujarat (17) | Range | 27.045-43.052 | 164.990-424.366 | 105.933-968.394 | 28.294-91.345 | 42.412-536.775 | 110.882-391.214 | 52.217-697.892 | 23.007-30.963 | 41.537-101.176 | 83.443-374.887 | 11.194-15.159 | 3.449-8.564 | 163.612-382.990 | 4.954-7.044 | 6.817-14.281 | 1.141-2.444 | 182.271-270.611 | 0.966-1.577 | 11.173-77.110 | 26.256-32.431 | 20.980-35.591 | 47.115-71.305 | 2.012-2.388 |
| Avg., | 36.241 | 264.236 | 172.995 | 40.262 | 75.466 | 165.342 | 117.304 | 25.963 | 65.382 | 129.261 | 13.054 | 5.016 | 225.596 | 5.902 | 8.731 | 1.583 | 221.234 | 1.225 | 21.669 | 29.637 | 26.779 | 57.510 | 2.235 | |
| SD (±) | 3.927 | 73.682 | 205.485 | 13.683 | 118.933 | 66.201 | 151.432 | 1.938 | 15.480 | 65.978 | 1.093 | 1.201 | 56.848 | 0.577 | 1.768 | 0.329 | 22.506 | 0.156 | 15.569 | 2.189 | 3.702 | 5.571 | 0.140 | |
| Deccan Trap Terrain (DTT) | Range | 26.371-58.580 | 164.990-465.372 | 86.186-968.394 | 27.035-91.345 | 42.412-536.775 | 110.882-391.214 | 52.217-697.892 | 23.007-45.456 | 26.920-101.176 | 42.265-374.887 | 9.002-18.219 | 1.670-8.564 | 128.836-382.990 | 4.319-9.142 | 5.400-18.302 | 1.000-5.902 | 158.734-321.440 | 0.904-1.712 | 8.604-77.110 | 20.649-54.546 | 20.087-46.223 | 45.041-127.803 | 2.012-3.924 |
| Avg., | 38.400 | 308.098 | 165.687 | 44.996 | 71.280 | 186.805 | 109.084 | 28.247 | 56.726 | 99.817 | 12.895 | 4.461 | 208.077 | 6.397 | 8.687 | 2.196 | 236.459 | 1.239 | 22.659 | 32.470 | 27.561 | 63.656 | 2.549 | |
| SD (±) | 6.854 | 83.965 | 139.632 | 13.451 | 78.800 | 59.335 | 102.605 | 4.274 | 19.144 | 58.526 | 2.283 | 1.632 | 59.726 | 1.079 | 2.711 | 1.177 | 39.097 | 0.210 | 12.006 | 7.214 | 5.669 | 16.079 | 0.459 | |
| West Coast of India River Average Clay (WCIRAC) | Range | 14.307-58.580 | 111.228-465.372 | 82.778-968.394 | 11.395-91.345 | 42.412-536.775 | 29.208-391.214 | 29.812-697.892 | 23.007-45.456 | 26.920-101.176 | 29.474-374.887 | 9.002-26.539 | 1.670-8.564 | 104.126-805.442 | 3.647-10.586 | 5.400-25.704 | 1.000-7.619 | 106.617-393.665 | 0.738-2.388 | 8.604-88.871 | 8.572-54.546 | 8.035-95.765 | 29.500-179.624 | 1.238-3.924 |
| Avg., | 30.353 | 249.027 | 175.274 | 35.106 | 68.750 | 140.407 | 88.936 | 30.269 | 61.183 | 80.227 | 14.530 | 4.549 | 238.884 | 5.814 | 11.076 | 3.001 | 205.308 | 1.268 | 28.212 | 26.138 | 33.582 | 75.768 | 2.414 | |
| SD (±) | 9.162 | 85.116 | 123.005 | 14.116 | 52.224 | 64.978 | 72.519 | 4.601 | 17.521 | 45.259 | 3.152 | 1.488 | 132.205 | 1.331 | 4.096 | 1.485 | 56.128 | 0.319 | 13.194 | 8.528 | 16.633 | 28.538 | 0.527 | |
| Reference Sediments | PAAS | 15.890 | 150.000 | 110.000 | 23.000 | 55.000 | 50.000 | 85.000 | 20.000 | 160.000 | 200.000 | 19.000 | 15.000 | 650.000 | 5.000 | 14.600 | 3.100 | 210.000 | 1.500 | 20.000 | 27.310 | 44.560 | 88.250 | 2.040 |
| UCC | 14.000 | 97.000 | 92.300 | 17.300 | 47.300 | 27.700 | 67.000 | 17.500 | 82.000 | 320.000 | 11.800 | 4.100 | 624.000 | 5.260 | 10.100 | 2.630 | 193.000 | 0.880 | 17.000 | 21.000 | 31.400 | 63.400 | 3.012 |
| State (No. of Rivers) | ∑TE | Th/Sc | Zr/Sc | Cr/V | Y/Ni | Co/Th | La/Sc | Zr/Co | La/Th | Th/Yb | Th/U | Rb/Sr | K2O/Rb | Cr/Th | Cr/Ni | V/Th | |
| Kerala (21) | Range | 991.581-1802.551 | 0.238-0.944 | 3.854-9.731 | 0.694-1.382 | 0.214-0.669 | 1.057-5.895 | 0.955-3.918 | 2.686-9.095 | 3.026-10.488 | 2.210-8.020 | 2.444-12.313 | 0.368-1.586 | 0.061-0.011 | 5.747-36.894 | 1.985-3.114 | 6.537-31.275 |
| Avg., | 1358.438 | 0.458 | 5.622 | 0.905 | 0.429 | 2.763 | 2.141 | 5.357 | 4.813 | 4.453 | 5.242 | 0.868 | 0.021 | 14.947 | 2.485 | 16.304 | |
| STD ± | 212.296 | 0.167 | 1.299 | 0.183 | 0.116 | 1.285 | 0.833 | 1.798 | 1.704 | 1.512 | 2.614 | 0.347 | 0.013 | 7.901 | 0.330 | 6.827 | |
| Karnataka (20) | Range | 1097.931-2027.128 | 0.222-1.473 | 4.235-1.288 | 0.426-3.350 | 0.099-0.350 | 0.443-4.207 | 0.281-2.388 | 3.576-23.381 | 0.751-2.515 | 3.562-20.755 | 1.937-7.176 | 0.725-2.038 | 0.015-0.022 | 3.220-110.234 | 1.787-6.932 | 5.747-33.781 |
| Avg., | 1368.793 | 0.694 | 9.327 | 0.907 | 0.234 | 1.967 | 1.230 | 9.450 | 1.773 | 8.061 | 3.685 | 1.281 | 0.018 | 17.981 | 2.633 | 18.567 | |
| STD ± | 218.062 | 0.345 | 3.215 | 0.619 | 0.071 | 1.021 | 0.633 | 5.100 | 0.370 | 4.177 | 1.178 | 0.373 | 0 | 22.360 | 1.070 | 8.419 | |
| Goa (11) | Range | 1269.836-1611.232 | 0.343-0.849 | 6.544-17.623 | 0.708-1.075 | 0.222-0.455 | 1.145-4.033 | 0.747-1.640 | 4.426-15.098 | 1.281-2.890 | 4.400-7.200 | 2.035-3.118 | 0.892-1.267 | 0.016-0.27 | 9.588-23.105 | 2.558-4.004 | 13.407-29.906 |
| Avg., | 1393.509 | 0.538 | 9.557 | 0.856 | 0.360 | 2.534 | 1.198 | 8.034 | 2.316 | 5.450 | 2.599 | 1.063 | 0.020 | 15.432 | 2.954 | 18.200 | |
| SD (±) | 92.542 | 0.150 | 3.345 | 0.138 | 0.087 | 0.899 | 0.224 | 3.709 | 0.483 | 0.988 | 0.366 | 0.129 | 0 | 3.643 | 0.405 | 4.533 | |
| Archean- Proterozoic Terrain (APT) | Range | 991.581-2027.128 | 0.222-1.473 | 3.854-17.623 | 0.426-3.350 | 0.099-0.669 | 0.443-5.895 | 0.281-3.918 | 2.686-23.381 | 0.751-10.488 | 2.210-20.755 | 1.937-12.313 | 0.368-2.038 | 0.015-0.27 | 3.220-110.234 | 1.787-6.932 | 5.747-33.781 |
| Avg., | 1369.840 | 0.566 | 7.879 | 0.896 | 0.339 | 2.409 | 1.591 | 7.498 | 3.116 | 6.052 | 4.084 | 1.068 | 0.02 | 16.217 | 2.641 | 17.576 | |
| SD (±) | 192.985 | 0.267 | 3.199 | 0.400 | 0.128 | 1.152 | 0.800 | 4.135 | 1.807 | 3.210 | 2.077 | 0.370 | 0 | 14.675 | 0.730 | 7.060 | |
| Maharashtra (21) | Range | 1360.433-1980.545 | 0.112-0.675 | 4.300-10.757 | 0.234-0.733 | 0.292-0.777 | 1.886-10.900 | 0.451-1.706 | 3.204-11.738 | 2.008-4.673 | 1.656-7.349 | 1.882-5.399 | 0.283-2.026 | 0.011-0.026 | 9.134-47.415 | 1.399-3.610 | 15.624-72.531 |
| Avg., | 1624.956 | 0.239 | 6.370 | 0.487 | 0.520 | 6.413 | 0.745 | 5.472 | 3.477 | 3.232 | 3.610 | 0.768 | 0.019 | 20.820 | 2.347 | 44.275 | |
| SD (±) | 164.494 | 0.153 | 1.521 | 0.164 | 0.130 | 2.809 | 0.312 | 2.127 | 0.873 | 1.567 | 1.054 | 0.481 | 0 | 10.617 | 0.513 | 16.835 | |
| Gujarat (17) | Range | 1248.288-3733.648 | 0.167-0.528 | 5.301-6.740 | 0.289-3.060 | 0.059-0.721 | 1.981-12.389 | 0.522-1.316 | 2.062-7.237 | 2.492-3.374 | 2.997-6.809 | 4.332-6.287 | 0.192-0.766 | 0.015-0.02 | 10.308-131.344 | 1.804-3.170 | 11.553-55.574 |
| Avg., | 1596.461 | 0.248 | 6.124 | 0.652 | 0.603 | 4.852 | 0.756 | 5.817 | 3.099 | 3.931 | 5.546 | 0.550 | 0.02 | 21.333 | 2.592 | 32.199 | |
| SD (±) | 565.617 | 0.083 | 0.423 | 0.634 | 0.159 | 2.166 | 0.187 | 1.099 | 0.234 | 0.918 | 0.493 | 0.139 | 0 | 28.535 | 0.285 | 13.035 | |
| Deccan Trap Terrain (DTT) | Range | 1248.288-3733.648 | 0.112-0.675 | 4.300-10.757 | 0.234-3.060 | 0.059-0.777 | 1.886-12.389 | 0.451-1.706 | 2.062-11.738 | 2.008-4.673 | 1.656-7.349 | 1.882-6.287 | 0.192-2.026 | 0.011-0.026 | 9.134-131.344 | 1.399-3.610 | 11.553-72.531 |
| Avg., | 1612.208 | 0.243 | 6.260 | 0.561 | 0.557 | 5.715 | 0.750 | 5.626 | 3.308 | 3.545 | 4.476 | 0.670 | 0.02 | 21.050 | 2.456 | 38.873 | |
| SD (±) | 391.379 | 0.125 | 1.159 | 0.442 | 0.148 | 2.629 | 0.260 | 1.732 | 0.687 | 1.348 | 1.287 | 0.382 | 0 | 20.325 | 0.439 | 16.239 | |
| West Coast of India River Average Clay (WCIRAC) | Range | 991.581-3734.378 | 0.112-1.473 | 3.854-17.623 | 0.234-3.350 | 0.059-0.777 | 0.443-12.389 | 0.281-3.918 | 2.062-23.381 | 0.751-10.488 | 1.656-20.755 | 1.882-12.313 | 0.192-2.038 | 0.011-0.061 | 3.220-131.344 | 1.399-6.932 | 5.747-72.531 |
| Avg., | 1473.054 | 0.429 | 7.196 | 0.754 | 0.431 | 3.805 | 1.236 | 6.707 | 3.197 | 4.993 | 4.249 | 0.900 | 0.019 | 18.257 | 2.563 | 26.568 | |
| SD (±) | 315.457 | 0.270 | 2.659 | 0.448 | 0.174 | 2.516 | 0.755 | 3.451 | 1.441 | 2.865 | 1.788 | 0.422 | 0.007 | 17.347 | 0.627 | 15.814 | |
| Reference Sediments | PAAS | 1807.090 | 0.919 | 13.216 | 0.733 | 0.497 | 1.575 | 2.804 | 9.130 | 3.052 | 7.157 | 4.710 | 0.800 | - | 7.534 | 2.000 | 10.274 |
| UCC | 1650.870 | 0.721 | 13.786 | 0.952 | 0.444 | 1.713 | 2.243 | 11.156 | 3.109 | 3.353 | 3.840 | 0.256 | - | 9.139 | 1.951 | 9.604 | |
| APT: Archean- Proterozoic Terrain (this study); DTT: Deccan Trap Terrain (this study); WCIRAC: West Coast of India River Average Clay (this study); PASS: Post Archean average Australian Shale (Pourmand et al. 2012); UCC: Upper Continental Crust (Rudnick and Gao 2003). | |||||||||||||||||
Table 3.
Trace elements content (µg/g) of the silt fraction (>4 to 63 µm) of sediments in the rivers of West Coast of India.
Table 3.
Trace elements content (µg/g) of the silt fraction (>4 to 63 µm) of sediments in the rivers of West Coast of India.
| State (No. of Rivers) | Sc | V | Cr | Co | Ni | Cu | Zn | Ga | Rb | Sr | Nb | Cs | Ba | Hf | Th | U | Zr | Ta | Pb | Y | La | Ce | Yb | |
|---|---|---|---|---|---|---|---|---|---|---|---|---|---|---|---|---|---|---|---|---|---|---|---|---|
| Kerala (21) | Range | 14.854-29.272 | 97.664-254.562 | 118.321-350.871 | 15.536-43.836 | 35.917-90.855 | 31.873-94.864 | 57.813-262.672 | 18.208-47.222 | 26.992-90.741 | 61.447-337.381 | 11.153-34.864 | 1.098-2.939 | 186.306-1503.009 | 5.498-65.310 | 6.937-116.474 | 1.260-14.628 | 188.075-2435.706 | 0.602-2.586 | 19.125-87.628 | 19.013-38.583 | 44.164-232.437 | 88.862-521.220 | 2.077-4.319 |
| Avg., | 24.274 | 181.089 | 174.381 | 29.602 | 56.458 | 68.216 | 148.772 | 33.527 | 59.268 | 155.883 | 20.47 | 2.197 | 642.236 | 18.707 | 30.731 | 3.924 | 646.91 | 1.278 | 41.001 | 30.508 | 105.36 | 201.265 | 3.102 | |
| STD ± | 3.966 | 45.163 | 76.903 | 7.459 | 15.724 | 17.486 | 67.617 | 6.186 | 20.956 | 79.156 | 6.357 | 0.491 | 401.360 | 15.033 | 27.443 | 3.266 | 538.363 | 0.515 | 18.694 | 5.379 | 56.695 | 111.539 | 0.542 | |
| Karnataka (20) | Range | 11.307-39.132 | 104.966-536.010 | 80.641-2350.397 | 10.733-35.554 | 35.120-146.151 | 50.123-185.463 | 44.007-98.212 | 11.628-39.139 | 15.114-79.790 | 36.624-101.549 | 10.205-23.313 | 1.663-4.702 | 98.824-290.563 | 5.396-27.486 | 6.273-28.434 | 1.958-7.147 | 194.577-1237.728 | 1.149-2.318 | 12.945-42.775 | 13.629-33.747 | 15.873-72.912 | 32.635-132.219 | 1.500-3.904 |
| Avg., | 22.533 | 228.920 | 296.124 | 21.222 | 63.728 | 106.649 | 67.097 | 29.130 | 40.539 | 61.829 | 16.905 | 2.966 | 194.489 | 10.917 | 14.313 | 4.144 | 426.758 | 1.724 | 25.186 | 21.573 | 32.060 | 68.186 | 2.400 | |
| SD (±) | 8.351 | 101.912 | 489.514 | 6.118 | 23.302 | 37.276 | 15.695 | 6.645 | 17.396 | 18.348 | 3.206 | 0.987 | 49.969 | 4.850 | 5.978 | 1.431 | 234.761 | 0.297 | 7.821 | 5.284 | 13.155 | 23.493 | 0.598 | |
| Goa (11) | Range | 18.965-28.718 | 183.738-348.378 | 185.497-245.622 | 16.628-39.026 | 44.343-68.937 | 85.387-166.157 | 51.774-73.844 | 16.935-26.490 | 28.959-58.617 | 52.106-107.487 | 13.638-25.627 | 2.449-5.297 | 102.865-274.009 | 6.269-13.274 | 4.339-16.796 | 4.006-7.936 | 229.788-502.269 | 1.355-4.114 | 19.446-57.531 | 18.004-31.954 | 16.758-39.641 | 31.783-89.493 | 2.109-3.339 |
| Avg., | 22.988 | 242.942 | 211.087 | 28.098 | 58.584 | 108.900 | 63.520 | 22.547 | 47.641 | 84.841 | 17.556 | 3.851 | 203.644 | 8.724 | 10.843 | 5.304 | 326.408 | 2.059 | 29.866 | 27.507 | 28.408 | 61.807 | 2.767 | |
| SD (±) | 2.904 | 49.259 | 18.595 | 7.025 | 6.884 | 28.239 | 7.531 | 2.669 | 9.228 | 17.140 | 3.831 | 0.982 | 50.619 | 2.255 | 3.268 | 1.273 | 88.031 | 0.811 | 11.116 | 4.796 | 6.400 | 16.244 | 0.343 | |
| Archean- Proterozoic Terrain (APT) | Range | 11.307-39.132 | 97.664-536.010 | 80.641-2350.397 | 10.733-43.836 | 35.120-146.151 | 31.873-185.463 | 44.007-262.672 | 11.628-47.222 | 15.114-90.741 | 36.624-337.381 | 10.205-34.864 | 1.098-5.297 | 98.824-1503.009 | 5.396-65.310 | 4.339-116.474 | 1.260-14.628 | 188.075-2435.706 | 0.602-4.114 | 12.945-87.628 | 13.629-38.583 | 15.873-232.437 | 31.783-521.220 | 1.500-4.319 |
| Avg., | 23.333 | 212.570 | 228.970 | 26.061 | 59.704 | 91.605 | 99.325 | 29.513 | 49.605 | 104.681 | 18.483 | 2.843 | 377.247 | 13.599 | 20.210 | 4.301 | 494.438 | 1.615 | 32.563 | 26.437 | 60.889 | 120.580 | 2.761 | |
| SD (±) | 5.869 | 76.530 | 307.772 | 7.790 | 17.875 | 34.241 | 59.887 | 7.072 | 19.318 | 67.266 | 5.034 | 1.022 | 336.330 | 10.820 | 19.720 | 2.356 | 391.371 | 0.600 | 15.372 | 6.528 | 51.970 | 98.176 | 0.609 | |
| Maharashtra (21) | Range | 18.191-54.444 | 179.812-1308.249 | 124.634-576.092 | 25.650-82.147 | 42.067-103.186 | 84.521-424.443 | 46.005-156.513 | 19.139-39.997 | 12.762-60.436 | 50.559-380.447 | 11.850-68.140 | 0.533-5.174 | 83.550-340.665 | 5.153-21.472 | 2.628-15.640 | 0.831-5.563 | 195.087-1119.754 | 0.900-7.484 | 7.031-38.443 | 21.641-40.056 | 12.698-40.812 | 29.291-98.563 | 2.264-3.656 |
| Avg., | 37.241 | 599.333 | 219.288 | 54.569 | 65.729 | 229.672 | 88.680 | 27.206 | 28.016 | 114.670 | 23.684 | 1.961 | 176.599 | 9.627 | 7.461 | 2.472 | 397.791 | 2.384 | 18.591 | 31.774 | 25.036 | 56.908 | 2.984 | |
| SD (±) | 10.175 | 276.646 | 125.908 | 13.816 | 11.951 | 91.615 | 30.578 | 6.011 | 13.303 | 68.844 | 12.209 | 1.222 | 70.630 | 3.974 | 3.612 | 1.421 | 222.874 | 1.410 | 8.286 | 4.977 | 6.928 | 17.660 | 0.464 | |
| Gujarat (17) | Range | 15.154-28.242 | 165.008-403.659 | 77.848-732.654 | 21.726-66.599 | 31.267-440.134 | 81.248-264.516 | 37.103-387.413 | 15.974-21.982 | 30.362-67.086 | 127.084-340.740 | 13.123-23.777 | 1.274-4.381 | 166.051-323.900 | 4.848-9.071 | 6.667-24.500 | 1.283-3.241 | 179.656-353.630 | 0.853-2.127 | 10.548-51.997 | 26.210-38.237 | 22.815-53.570 | 47.952-103.572 | 2.299-3.514 |
| Avg., | 20.393 | 280.239 | 153.228 | 34.949 | 62.746 | 130.616 | 72.733 | 18.324 | 45.902 | 189.427 | 18.446 | 2.602 | 238.464 | 6.713 | 11.423 | 1.965 | 250.858 | 1.559 | 17.292 | 31.146 | 32.941 | 67.287 | 2.821 | |
| SD (±) | 3.541 | 73.025 | 153.310 | 9.933 | 97.386 | 40.970 | 82.149 | 2.026 | 11.312 | 52.791 | 3.085 | 0.825 | 39.802 | 1.118 | 4.358 | 0.547 | 45.837 | 0.329 | 9.767 | 3.190 | 7.955 | 14.942 | 0.300 | |
| Deccan Trap Terrain (DTT) | Range | 15.154-54.444 | 165.008-1308.249 | 77.848-732.654 | 21.726-82.147 | 31.267-440.134 | 81.248-424.443 | 37.103-387.413 | 15.974-39.997 | 12.762-67.086 | 50.559-380.447 | 11.850-68.140 | 0.533-5.174 | 83.550-340.665 | 4.848-21.472 | 2.628-24.500 | 0.831-5.563 | 179.656-1119.754 | 0.853-7.484 | 7.031-51.997 | 21.641-40.056 | 12.698-53.570 | 29.291-103.572 | 2.264-3.656 |
| Avg., | 29.704 | 456.580 | 189.735 | 45.792 | 64.394 | 185.357 | 81.546 | 23.233 | 36.018 | 148.114 | 21.341 | 2.248 | 204.275 | 8.324 | 9.234 | 2.245 | 332.058 | 2.015 | 18.010 | 31.493 | 28.572 | 61.551 | 2.911 | |
| SD (±) | 11.552 | 263.683 | 140.858 | 15.607 | 64.658 | 88.058 | 59.061 | 6.430 | 15.239 | 72.014 | 9.574 | 1.098 | 65.980 | 3.352 | 4.388 | 1.134 | 182.320 | 1.137 | 8.876 | 4.230 | 8.317 | 17.102 | 0.403 | |
| West Coast of India River Average Silt (WCIRAS) | Range | 11.307-54.444 | 97.664-1308.249 | 77.848-2350.397 | 10.733-82.147 | 31.267-440.134 | 31.873-424.443 | 37.103-387.413 | 11.628-47.222 | 12.762-90.741 | 36.624-380.447 | 10.205-68.140 | 0.533-5.297 | 83.550-1503.009 | 4.848-65.310 | 2.628-116.474 | 0.931-14.628 | 179.656-1435.706 | 0.602-7.484 | 7.031-87.628 | 13.629-40.056 | 12.698-232.437 | 29.291-521.220 | 1.500-4.319 |
| Avg., | 26.023 | 315.597 | 212.404 | 34.392 | 61.684 | 131.189 | 91.818 | 26.862 | 43.868 | 123.019 | 19.689 | 2.591 | 304.215 | 11.372 | 15.575 | 3.433 | 425.877 | 1.784 | 26.418 | 28.572 | 47.245 | 95.657 | 2.824 | |
| SD (±) | 9.232 | 216.679 | 250.815 | 15.234 | 43.892 | 77.870 | 59.861 | 7.455 | 18.866 | 72.209 | 7.392 | 1.089 | 272.050 | 8.867 | 16.142 | 2.181 | 328.779 | 0.885 | 14.846 | 6.177 | 42.826 | 80.649 | 0.534 | |
| Reference Sediments | PAAS | 15.890 | 150.000 | 110.000 | 23.000 | 55.000 | 50.000 | 85.000 | 20.000 | 160.000 | 200.000 | 19.000 | 15.000 | 650.000 | 5.000 | 14.600 | 3.100 | 210.000 | 1.500 | 20.000 | 27.310 | 44.560 | 88.250 | 2.040 |
| UCC | 14.000 | 97.000 | 92.300 | 17.300 | 47.300 | 27.700 | 67.000 | 17.500 | 82.000 | 320.000 | 11.800 | 4.100 | 624.000 | 5.260 | 10.100 | 2.630 | 193.000 | 0.880 | 17.000 | 21.000 | 31.400 | 63.400 | 3.012 | |
| APT: Archean- Proterozoic Terrain (this study); DTT: Deccan Trap Terrain (this study); WCIRAS: West Coast of India River Average Silt (this study); PASS: Post Archean average Australian Shale (Pourmand et al. 2012); UCC: Upper Continental Crust (Rudnick and Gao 2003). | ||||||||||||||||||||||||
| State (No. of Rivers) | ∑TE | Th/Sc | Zr/Sc | Cr/V | Y/Ni | Co/Th | La/Sc | Zr/Co | La/Th | Th/Yb | Th/U | Rb/Sr | K2O/Rb | Cr/Th | Cr/Ni | V/Th | |
| Kerala (21) | Range | 1395.114-3848.586 | 0.237-5.317 | 8.226-111.194 | 0.716-1.486 | 0.273-0.929 | 0.201-6.296 | 1.509-10.611 | 5.993-103.999 | 1.999-6.759 | 1.807-31.859 | 2.761-18.264 | 0.188-1.357 | 0.017-0.037 | 1.016-46.171 | 2.037-4.897 | 1.083-36.290 |
| Avg., | 2338.935 | 1.266 | 26.650 | 0.963 | 0.540 | 0.963 | 4.340 | 21.853 | 3.428 | 9.907 | 7.830 | 0.380 | 0.027 | 5.674 | 3.089 | 5.893 | |
| STD ± | 601.675 | 1.313 | 26.082 | 0.228 | 0.182 | 1.655 | 2.666 | 27.469 | 1.562 | 7.533 | 4.794 | 0.312 | 0.000 | 11.988 | 0.687 | 9.802 | |
| Karnataka (20) | Range | 1148.902-3826.032 | 0.245-1.640 | 5.677-71.398 | 0.340-6.734 | 0.183-0.637 | 0.435-4.673 | 0.433-4.206 | 5.473-79.219 | 1.158-3.188 | 2.613-16.469 | 1.901-7.526 | 0.327-1.323 | 0.021-0.046 | 3.265-236.694 | 1.684-16.082 | 5.939-39.056 |
| Avg., | 1635.173 | 0.726 | 21.896 | 1.201 | 0.360 | 1.810 | 1.644 | 22.342 | 2.320 | 6.513 | 3.596 | 0.670 | 0.028 | 25.725 | 3.768 | 18.940 | |
| STD ± | 600.637 | 0.406 | 15.322 | 1.344 | 0.109 | 1.069 | 0.897 | 16.141 | 0.538 | 3.770 | 1.456 | 0.265 | 0.000 | 50.132 | 3.013 | 11.365 | |
| Goa (11) | Range | 1319.378-1753.873 | 0.205-0.676 | 9.674-21.269 | 0.599-1.114 | 0.299-0.594 | 1.260-8.085 | 0.792-1.787 | 6.925-23.738 | 1.945-3.862 | 1.855-5.206 | 1.043-3.160 | 0.398-0.706 | 0.021-0.037 | 12.991-53.113 | 3.045-4.921 | 15.717-62.361 |
| Avg., | 1499.403 | 0.477 | 14.446 | 0.895 | 0.476 | 3.041 | 1.238 | 12.713 | 2.742 | 3.901 | 2.063 | 0.568 | 0.028 | 22.019 | 3.660 | 25.559 | |
| SD (±) | 144.137 | 0.151 | 4.449 | 0.160 | 0.097 | 1.925 | 0.260 | 5.906 | 0.597 | 1.031 | 0.546 | 0.087 | 0.000 | 10.976 | 0.640 | 14.060 | |
| Archean- Proterozoic Terrain (APT) | Range | 1148.902-3848.586 | 0.205-5.317 | 5.677-111.194 | 0.340-6.734 | 0.183-0.929 | 0.201-8.085 | 0.433-10.611 | 5.473-103.999 | 1.158-6.759 | 1.807-31.859 | 1.043-18.264 | 0.188-1.357 | 0.017-0.046 | 1.016-236.694 | 1.684-16.082 | 1.083-62.361 |
| Avg., | 1890.664 | 0.930 | 22.863 | 1.034 | 0.473 | 2.101 | 2.728 | 21.722 | 3.243 | 7.172 | 5.217 | 0.569 | 0.027 | 19.265 | 3.455 | 17.318 | |
| SD (±) | 649.463 | 0.938 | 19.633 | 0.846 | 0.170 | 1.572 | 2.322 | 20.603 | 1.435 | 5.700 | 4.152 | 0.271 | 0.000 | 32.527 | 1.940 | 12.425 | |
| Maharashtra (21) | Range | 1483.292-3738.619 | 0.065-0.660 | 5.900-28.979 | 0.132-1.228 | 0.254-0.588 | 2.280-24.939 | 0.316-1.723 | 3.265-18.511 | 2.359-5.671 | 1.007-4.969 | 1.627-6.194 | 0.066-0.950 | 0.020-0.043 | 10.223-96.157 | 2.045-9.173 | 15.985-253.897 |
| Avg., | 2104.976 | 0.230 | 11.317 | 0.460 | 0.492 | 9.624 | 0.750 | 7.822 | 3.726 | 2.526 | 3.398 | 0.313 | 0.029 | 35.782 | 3.299 | 105.718 | |
| SD (±) | 483.883 | 0.164 | 6.685 | 0.345 | 0.077 | 5.865 | 0.375 | 4.775 | 0.951 | 1.199 | 1.326 | 0.242 | 0.000 | 23.824 | 1.681 | 75.202 | |
| Gujarat (17) | Range | 1081.086-2897.201 | 0.304-1.447 | 7.658-20.749 | 0.300-2.770 | 0.068-1.117 | 0.887-6.919 | 1.008-3.164 | 3.034-12.901 | 2.187-3.459 | 2.776-7.645 | 4.907-7.705 | 0.135-0.456 | 0.019-0.034 | 4.544-76.118 | 1.665-5.744 | 6.735-48.798 |
| Avg., | 1557.880 | 0.589 | 12.693 | 0.563 | 0.767 | 3.452 | 1.680 | 7.641 | 2.991 | 3.990 | 5.722 | 0.255 | 0.028 | 14.745 | 2.913 | 27.158 | |
| SD (±) | 381.926 | 0.291 | 3.432 | 0.576 | 0.224 | 1.448 | 0.582 | 2.327 | 0.329 | 1.205 | 0.708 | 0.082 | 0.000 | 16.133 | 0.859 | 10.031 | |
| Deccan Trap Terrain (DTT) | Range | 1081.086-3738.619 | 0.065-1.447 | 5.900-28.979 | 0.132-2.770 | 0.068-1.117 | 0.887-24.939 | 0.316-3.164 | 3.034-18.511 | 2.187-5.671 | 1.007-7.645 | 1.627-7.705 | 0.066-0.95 | 0.019-0.043 | 4.544-96.157 | 1.665-9.173 | 6.735-253.897 |
| Avg., | 1860.223 | 0.391 | 11.932 | 0.506 | 0.615 | 6.863 | 1.166 | 7.741 | 3.397 | 3.181 | 4.437 | 0.287 | 0.028 | 26.371 | 3.126 | 70.573 | |
| SD (±) | 515.404 | 0.290 | 5.453 | 0.459 | 0.210 | 5.401 | 0.665 | 3.831 | 0.820 | 1.396 | 1.593 | 0.188 | 0.000 | 23.059 | 1.373 | 68.319 | |
| West Coast of India River Average Silt (WCIRAS) | Range | 1082.666-3848.586 | 0.065-5.317 | 5.677-111.194 | 0.132-6.734 | 0.068-1.117 | 0.201-24.939 | 0.316-10.611 | 3.034-103.999 | 1.158-6.759 | 1.007-31.859 | 1.043-18.264 | 0.066-1.357 | 0.017-0.046 | 1.016-236.694 | 1.665-16.082 | 1.083-253.897 |
| Avg., | 1878.625 | 0.702 | 18.248 | 0.811 | 0.533 | 4.111 | 2.068 | 15.819 | 3.308 | 5.486 | 4.888 | 0.450 | 0.028 | 22.265 | 3.316 | 39.803 | |
| SD (±) | 593.281 | 0.782 | 16.209 | 0.753 | 0.200 | 4.375 | 1.969 | 17.250 | 1.211 | 4.833 | 3.329 | 0.277 | 0.005 | 28.979 | 1.722 | 52.236 | |
| Reference Sediments | PAAS | 1807.090 | 0.919 | 13.216 | 0.733 | 0.497 | 1.575 | 2.804 | 9.130 | 3.052 | 7.157 | 4.710 | 0.800 | - | 7.534 | 2.000 | 10.274 |
| UCC | 1650.870 | 0.721 | 13.786 | 0.952 | 0.444 | 1.713 | 2.243 | 11.156 | 3.109 | 3.353 | 3.840 | 0.256 | - | 9.139 | 1.951 | 9.604 | |
| APT: Archean- Proterozoic Terrain (this study); DTT: Deccan Trap Terrain (this study); WCIRAS: West Coast of India River Average Silt (this study); PASS: Post Archean average Australian Shale (Pourmand et al. 2012); UCC: Upper Continental Crust (Rudnick and Gao 2003). | |||||||||||||||||
Table 4.
Correlation matrix (APT- Archean- Proterozoic Terrain; DTT- Deccan Trap Terrain).
|
APT DTT |
SiO2 | Al2O3 | Fe2O3 | MnO | MgO | CaO | Na2O | K2O | TiO2 | P2O5 | ∑REE | Y | La | Ce | Yb | Zr | Hf | U | Th | Sc | V | Cr | Co | Ni | Cu | Zn | Ga | Rb | Sr | Nb | Cs | Ba | Ta | Pb |
|---|---|---|---|---|---|---|---|---|---|---|---|---|---|---|---|---|---|---|---|---|---|---|---|---|---|---|---|---|---|---|---|---|---|---|
| SiO2 | 1 | -0.27 | -0.57 | -0.07 | 0.18 | 0.43 | -0.58 | 0.08 | 0.06 | -0.38 | -0.50 | -0.15 | -0.41 | -0.50 | -0.45 | 0.03 | 0.01 | -0.61 | -0.28 | 0.01 | -0.20 | 0.01 | -0.15 | -0.01 | -0.37 | 0.01 | -0.37 | 0.04 | 0.26 | -0.11 | -0.04 | 0.14 | -0.26 | -0.20 |
| Al2O3 | -0.39 | 1 | -0.02 | -0.21 | -0.53 | -0.60 | -0.18 | -0.28 | 0.45 | 0.50 | 0.09 | -0.19 | -0.03 | 0.28 | 0.24 | 0.54 | 0.59 | 0.67 | 0.28 | -0.01 | 0.34 | -0.16 | -0.21 | -0.09 | 0.22 | -0.11 | 0.68 | -0.04 | -0.31 | 0.54 | 0.11 | -0.31 | 0.60 | 0.20 |
| Fe2O3 | -0.31 | -0.04 | 1 | 0.24 | -0.18 | -0.39 | 0.15 | 0.02 | -0.39 | 0.14 | 0.64 | 0.22 | 0.51 | 0.64 | 0.36 | -0.18 | -0.17 | 0.50 | 0.34 | 0.06 | 0.15 | 0.16 | 0.40 | 0.13 | 0.30 | 0.10 | 0.26 | 0.03 | -0.38 | -0.12 | 0.06 | 0.13 | 0.03 | 0.23 |
| MnO | -0.19 | -0.12 | 0.32 | 1 | -0.10 | -0.05 | -0.12 | -0.29 | -0.08 | 0.31 | 0.28 | 0.68 | 0.17 | 0.03 | 0.57 | -0.01 | -0.01 | -0.29 | -0.33 | 0.42 | 0.20 | 0.21 | 0.66 | 0.21 | 0.40 | 0.23 | -0.12 | -0.46 | -0.20 | -0.47 | -0.44 | 0.38 | -0.28 | 0.15 |
| MgO | -0.21 | -0.28 | 0.02 | 0.36 | 1 | 0.65 | -0.14 | 0.52 | -0.27 | -0.33 | -0.24 | -0.11 | -0.02 | -0.35 | -0.43 | -0.44 | -0.44 | -0.38 | -0.18 | -0.27 | -0.61 | -0.08 | -0.28 | -0.11 | -0.33 | -0.03 | -0.66 | 0.19 | 0.44 | -0.28 | 0.05 | -0.06 | -0.30 | -0.21 |
| CaO | -0.29 | -0.45 | -0.06 | 0.13 | 0.50 | 1 | -0.18 | 0.58 | -0.23 | -0.34 | -0.30 | -0.17 | -0.07 | -0.38 | -0.52 | -0.40 | -0.45 | -0.56 | -0.10 | -0.23 | -0.57 | -0.12 | -0.33 | -0.14 | -0.41 | -0.12 | -0.63 | 0.31 | 0.77 | -0.16 | 0.18 | 0.34 | -0.17 | -0.27 |
| Na2O | -0.20 | -0.50 | -0.28 | -0.15 | 0.17 | 0.71 | 1 | -0.06 | -0.11 | -0.10 | 0.13 | 0.10 | 0.14 | 0.09 | 0.23 | -0.12 | -0.14 | 0.12 | 0.00 | 0.08 | 0.08 | -0.06 | 0.02 | -0.05 | 0.12 | -0.09 | 0.10 | -0.05 | -0.12 | -0.06 | -0.05 | -0.17 | -0.09 | -0.11 |
| K2O | -0.10 | -0.63 | -0.24 | 0.11 | 0.53 | 0.62 | 0.75 | 1 | -0.35 | -0.12 | 0.12 | -0.40 | 0.33 | 0.19 | -0.52 | -0.45 | -0.47 | 0.09 | 0.50 | -0.58 | -0.74 | -0.25 | -0.47 | -0.25 | -0.36 | -0.17 | -0.28 | 0.83 | 0.47 | 0.31 | 0.72 | 0.14 | 0.26 | -0.01 |
| TiO2 | 0.37 | -0.05 | -0.05 | -0.25 | 0.00 | -0.14 | -0.08 | -0.02 | 1 | 0.33 | -0.30 | -0.06 | -0.42 | -0.20 | 0.15 | 0.70 | 0.70 | 0.06 | -0.18 | 0.22 | 0.61 | -0.11 | -0.13 | -0.05 | 0.07 | -0.08 | 0.50 | -0.36 | -0.43 | 0.44 | -0.24 | -0.19 | 0.38 | -0.05 |
| P2O5 | -0.67 | 0.34 | 0.15 | 0.23 | 0.17 | 0.11 | -0.05 | -0.04 | -0.16 | 1 | 0.24 | 0.17 | 0.18 | 0.25 | 0.40 | 0.20 | 0.25 | 0.36 | 0.23 | -0.03 | 0.18 | 0.18 | 0.21 | 0.24 | 0.61 | 0.30 | 0.28 | -0.08 | -0.34 | 0.27 | 0.01 | 0.13 | 0.41 | 0.58 |
| ∑REE | -0.64 | 0.43 | -0.02 | 0.23 | 0.06 | 0.15 | -0.02 | -0.02 | -0.15 | 0.79 | 1 | 0.35 | 0.92 | 0.91 | 0.46 | -0.33 | -0.32 | 0.51 | 0.57 | -0.06 | -0.01 | -0.05 | 0.21 | -0.09 | 0.11 | -0.09 | 0.23 | 0.16 | -0.26 | 0.09 | 0.10 | -0.02 | 0.25 | 0.12 |
| Y | -0.71 | 0.31 | 0.26 | 0.41 | 0.21 | 0.22 | -0.01 | 0.00 | -0.28 | 0.58 | 0.70 | 1 | 0.14 | -0.02 | 0.84 | 0.18 | 0.18 | -0.33 | -0.50 | 0.71 | 0.30 | 0.07 | 0.66 | 0.06 | 0.41 | 0.12 | -0.08 | -0.65 | -0.23 | -0.62 | -0.68 | -0.02 | -0.46 | -0.19 |
| La | -0.62 | 0.46 | -0.08 | 0.19 | 0.03 | 0.13 | -0.01 | -0.02 | -0.12 | 0.76 | 0.99 | 0.66 | 1 | 0.84 | 0.19 | -0.60 | -0.58 | 0.43 | 0.69 | -0.31 | -0.30 | -0.02 | 0.02 | -0.09 | -0.06 | -0.09 | 0.01 | 0.39 | -0.08 | 0.13 | 0.27 | 0.08 | 0.27 | 0.15 |
| Ce | -0.58 | 0.41 | -0.01 | 0.21 | 0.01 | 0.10 | -0.07 | -0.03 | -0.15 | 0.77 | 0.98 | 0.62 | 0.95 | 1 | 0.21 | -0.26 | -0.26 | 0.75 | 0.79 | -0.27 | 0.03 | -0.06 | 0.04 | -0.09 | 0.04 | -0.12 | 0.43 | 0.37 | -0.28 | 0.40 | 0.36 | -0.02 | 0.50 | 0.25 |
| Yb | -0.71 | 0.39 | 0.25 | 0.32 | 0.08 | 0.16 | 0.01 | -0.08 | -0.20 | 0.47 | 0.59 | 0.94 | 0.55 | 0.50 | 1 | 0.39 | 0.42 | 0.10 | -0.26 | 0.65 | 0.50 | 0.01 | 0.57 | 0.03 | 0.53 | 0.04 | 0.30 | -0.63 | -0.48 | -0.29 | -0.57 | -0.16 | -0.11 | -0.06 |
| Zr | 0.40 | -0.29 | 0.05 | -0.15 | 0.05 | -0.10 | -0.07 | 0.09 | 0.53 | -0.39 | -0.52 | -0.28 | -0.52 | -0.52 | -0.16 | 1 | 0.99 | 0.07 | -0.37 | 0.53 | 0.68 | -0.24 | 0.07 | -0.14 | 0.25 | -0.16 | 0.59 | -0.45 | -0.39 | 0.22 | -0.26 | -0.23 | 0.21 | -0.20 |
| Hf | 0.31 | -0.23 | 0.02 | -0.15 | 0.07 | -0.05 | -0.03 | 0.09 | 0.56 | -0.33 | -0.44 | -0.21 | -0.44 | -0.45 | -0.07 | 0.98 | 1 | 0.09 | -0.36 | 0.50 | 0.65 | -0.23 | 0.06 | -0.14 | 0.26 | -0.15 | 0.56 | -0.50 | -0.42 | 0.20 | -0.29 | -0.27 | 0.21 | -0.17 |
| U | 0.41 | -0.48 | 0.00 | -0.13 | 0.15 | -0.09 | 0.01 | 0.31 | 0.15 | -0.43 | -0.46 | -0.26 | -0.43 | -0.43 | -0.34 | 0.53 | 0.44 | 1 | 0.70 | -0.34 | 0.13 | -0.08 | -0.19 | -0.04 | 0.19 | -0.07 | 0.65 | 0.34 | -0.32 | 0.61 | 0.44 | -0.23 | 0.65 | 0.36 |
| Th | 0.20 | 0.03 | -0.13 | -0.07 | -0.23 | -0.21 | -0.17 | 0.00 | 0.27 | -0.04 | 0.18 | -0.16 | 0.25 | 0.25 | -0.23 | -0.01 | -0.05 | 0.31 | 1 | -0.67 | -0.28 | -0.09 | -0.35 | -0.11 | -0.15 | -0.13 | 0.25 | 0.77 | -0.05 | 0.70 | 0.74 | 0.13 | 0.72 | 0.36 |
| Sc | -0.33 | 0.15 | 0.27 | 0.18 | -0.01 | 0.11 | 0.06 | -0.15 | 0.14 | 0.06 | 0.15 | 0.46 | 0.11 | 0.07 | 0.62 | 0.01 | 0.11 | -0.45 | -0.38 | 1 | 0.60 | -0.06 | 0.44 | -0.05 | 0.30 | -0.06 | 0.29 | -0.74 | -0.26 | -0.51 | -0.69 | -0.06 | -0.44 | -0.40 |
| V | 0.23 | -0.33 | 0.50 | -0.04 | -0.21 | -0.06 | -0.03 | -0.10 | 0.40 | -0.32 | -0.43 | -0.16 | -0.50 | -0.40 | -0.01 | 0.55 | 0.54 | 0.05 | -0.19 | 0.48 | 1 | 0.11 | 0.41 | 0.12 | 0.35 | 0.04 | 0.66 | -0.63 | -0.60 | 0.07 | -0.45 | 0.03 | 0.09 | -0.01 |
| Cr | 0.21 | -0.13 | 0.10 | -0.08 | -0.13 | 0.04 | -0.02 | -0.18 | 0.09 | -0.22 | -0.25 | -0.08 | -0.32 | -0.21 | -0.01 | 0.03 | 0.09 | -0.16 | -0.27 | 0.37 | 0.34 | 1 | 0.67 | 0.98 | 0.56 | 0.94 | -0.17 | -0.16 | -0.13 | -0.19 | -0.13 | 0.17 | -0.22 | 0.73 |
| Co | -0.46 | -0.14 | 0.60 | 0.50 | 0.28 | 0.30 | 0.05 | 0.17 | -0.22 | 0.28 | 0.24 | 0.56 | 0.16 | 0.21 | 0.52 | -0.10 | -0.07 | -0.19 | -0.28 | 0.48 | 0.39 | -0.01 | 1 | 0.66 | 0.66 | 0.65 | -0.03 | -0.51 | -0.32 | -0.45 | -0.46 | 0.18 | -0.38 | 0.41 |
| Ni | 0.08 | -0.14 | 0.27 | -0.09 | -0.20 | 0.02 | -0.01 | -0.21 | 0.05 | -0.21 | -0.33 | -0.15 | -0.40 | -0.31 | -0.05 | 0.05 | 0.10 | -0.22 | -0.32 | 0.40 | 0.55 | 0.78 | 0.23 | 1 | 0.63 | 0.96 | -0.12 | -0.16 | -0.13 | -0.14 | -0.11 | 0.11 | -0.17 | 0.75 |
| Cu | 0.32 | -0.38 | 0.42 | -0.05 | -0.12 | -0.09 | -0.11 | -0.12 | 0.05 | -0.34 | -0.53 | -0.24 | -0.57 | -0.50 | -0.18 | 0.30 | 0.21 | 0.11 | -0.19 | 0.22 | 0.69 | 0.22 | 0.29 | 0.37 | 1 | 0.68 | 0.23 | -0.34 | -0.38 | -0.12 | -0.19 | 0.08 | -0.01 | 0.61 |
| Zn | 0.40 | -0.29 | -0.07 | -0.12 | -0.10 | -0.11 | 0.12 | 0.12 | -0.05 | -0.28 | -0.39 | -0.34 | -0.35 | -0.38 | -0.40 | -0.03 | -0.15 | 0.36 | 0.08 | -0.35 | -0.03 | 0.01 | -0.24 | -0.05 | 0.31 | 1 | -0.18 | -0.14 | -0.10 | -0.17 | -0.10 | 0.09 | -0.20 | 0.78 |
| Ga | -0.04 | 0.56 | -0.23 | -0.28 | -0.75 | -0.38 | -0.20 | -0.51 | 0.07 | 0.23 | 0.39 | 0.03 | 0.41 | 0.43 | 0.12 | -0.28 | -0.24 | -0.47 | 0.33 | 0.11 | -0.05 | 0.10 | -0.24 | 0.11 | -0.17 | -0.12 | 1 | -0.06 | -0.51 | 0.52 | 0.13 | -0.16 | 0.52 | 0.05 |
| Rb | -0.10 | -0.05 | 0.04 | 0.28 | 0.33 | -0.05 | -0.19 | 0.37 | -0.04 | 0.07 | 0.17 | 0.24 | 0.17 | 0.19 | 0.10 | 0.02 | -0.06 | 0.41 | 0.36 | -0.25 | -0.27 | -0.36 | 0.11 | -0.41 | -0.13 | 0.07 | -0.27 | 1 | 0.34 | 0.59 | 0.95 | 0.19 | 0.50 | 0.18 |
| Sr | -0.45 | 0.07 | -0.03 | 0.28 | 0.51 | 0.40 | 0.11 | 0.25 | 0.01 | 0.68 | 0.71 | 0.50 | 0.68 | 0.67 | 0.35 | -0.23 | -0.16 | -0.22 | -0.15 | 0.02 | -0.36 | -0.21 | 0.23 | -0.27 | -0.44 | -0.30 | -0.11 | 0.12 | 1 | -0.15 | 0.25 | 0.14 | -0.15 | -0.18 |
| Nb | 0.31 | -0.06 | -0.19 | -0.30 | -0.35 | -0.17 | -0.07 | -0.04 | 0.64 | -0.06 | 0.10 | -0.27 | 0.14 | 0.15 | -0.25 | 0.24 | 0.25 | 0.19 | 0.72 | -0.19 | 0.13 | -0.06 | -0.34 | -0.04 | -0.15 | -0.11 | 0.44 | 0.04 | -0.04 | 1 | 0.69 | -0.03 | 0.91 | 0.25 |
| Cs | 0.28 | -0.48 | 0.25 | 0.07 | 0.20 | -0.04 | -0.07 | 0.32 | 0.25 | -0.39 | -0.46 | -0.18 | -0.46 | -0.43 | -0.23 | 0.45 | 0.36 | 0.75 | 0.28 | -0.20 | 0.28 | -0.05 | 0.08 | 0.06 | 0.28 | 0.29 | -0.46 | 0.61 | 0.61 | 0.22 | 1 | 0.21 | 0.62 | 0.25 |
| Ba | -0.54 | 0.40 | 0.03 | 0.21 | 0.04 | 0.08 | -0.09 | -0.03 | -0.03 | 0.80 | 0.91 | 0.56 | 0.90 | 0.89 | 0.47 | -0.41 | -0.34 | -0.52 | 0.07 | 0.13 | -0.32 | -0.27 | 0.23 | -0.31 | -0.44 | -0.37 | 0.37 | 0.15 | 0.15 | 0.11 | -0.45 | 1 | 0.01 | 0.22 |
| Ta | 0.64 | -0.40 | -0.08 | -0.26 | -0.24 | -0.22 | -0.12 | 0.05 | 0.48 | -0.44 | -0.43 | -0.53 | -0.39 | -0.36 | -0.54 | 0.47 | 0.40 | 0.61 | 0.65 | -0.38 | 0.29 | 0.01 | -0.31 | 0.06 | 0.20 | 0.23 | 0.06 | 0.15 | 0.15 | 0.75 | 0.61 | -0.39 | 1 | 0.25 |
| Pb | -0.04 | 0.24 | 0.14 | 0.02 | -0.16 | -0.10 | -0.16 | -0.08 | -0.11 | 0.16 | 0.18 | 0.12 | 0.19 | 0.21 | 0.04 | -0.20 | -0.30 | 0.13 | 0.23 | -0.27 | -0.19 | -0.21 | 0.00 | -0.22 | 0.00 | 0.43 | 0.18 | 0.35 | 0.35 | -0.03 | 0.13 | 0.15 | -0.04 | 1 |
4. Results
4.1. Minerals in the Clay Fraction of Sediments
Kaolinite is the most dominant mineral, followed by minor illite, gibbsite and traces of goethite and quartz in the clay fraction of sediments from Kerala, Karnataka and Goa (Figure 2). The clay minerals on the continental shelf sediments off Goa, Karnataka and Kerala also showed abundant kaolinite followed by illite, gibbsite and goethite, with decreasing proportions of gibbsite as one moves from Kerala to Goa (Rao and Rao, 1995; Kessarkar et al., 2003). The clay minerals in the river sediments from Maharashtra and Gujarat showed predominant smectite, followed by kaolinite and chlorite and minor illite and quartz and, traces of feldspar (Figure 2). Very high proportions of smectite with minor kaolinite and illite were reported in the sediments from Narmada and Tapti Rivers (Naidu et al., 1985) and on the continental shelf off the Deccan Traps (Rao and Rao, 1995; Kessarkar et al., 2003).
4.2. Distribution of Major Elements
Figure 3 shows the Post Archean average Australian Shale (PAAS) -normalized distribution of major element oxides in river sediments from each state. In general, the sediments are depleted with SiO2, MgO, CaO, Na2O and K2O and enriched with Al2O3, Fe2O3, MnO, TiO2 and P2O5 relative to PAAS in both fractions. However, the relative enrichment / depletion of these oxides varies differently in river sediments of different states and terrains. The sediments weathered from the Archean-Proterozoic terrain (A-P terrain) are more enriched with Al2O3, Fe2O3 and P2O5, while those weathered from the Deccan Trap terrain (DT terrain) are enriched with MgO, CaO and TiO2 in both fractions (Table 1). The mean Al2O3 content gradually decreased for the sediments from Kerala (23.5%) to Gujarat (14.43%). The mean Fe2O3 content, however, increased for the clays from Kerala (11.8%) to Goa (13.2%), but low mean values are characteristic for Maharashtra (10.75%) and Gujarat (8.9%). The mean SiO2/Al2O3 ratio increased gradually from Kerala (1.45) to Gujarat (3.29) in the clay fraction of sediments (Table 1). Indeed, the mean ratio is much lower for the clays of Kerala (1.45), Karnataka (2.22) and Goa (2.24) than the Upper Continental Crust (UCC: 4.33) and PAAS (3.32). The mean ratio for the clay fraction of sediments was 2.64 for Maharashtra and 3.29 for Gujarat. The mean SiO2/Al2O3 ratio was 2.99±0.61 for the silt fraction of sediments from A-P terrain and 3.43±0.66 for DT terrain (Table 1). The mean Fe2O3/Al2O3 ratios gradually increased in the clay fraction of sediments from Kerala (0.5) to Karnataka (0.64) and then to Goa (0.74) of the A-P terrain, but remained at 0.64 in DT terrain. The mean ratios, however, were much higher than in UCC (0.36) and PAAS (0.38). Similarly, the mean Fe2O3/Al2O3 ratio for the silt fraction of sediments was higher for the A-P terrain (0.54) than DT terrain (0.22). The Al2O3/TiO2 ratio of the sediments gradually decreased from Kerala in the south to Gujarat in the north. For example, the mean ratio decreased from 21.22 to 13.71 for the clay and from 18.3 to 11.5 for silt fractions of sediments from the A-P terrain. Similarly, the mean ratio decreased from 11.98 to 10.39 for the clay and from 6.37 to 6.12 for silt fractions of sediments from the DT terrain. The Al2O3/TiO2 ratios for UCC and PAAS are 24.29 and 18.9, respectively (Table 1).
4.3. Weathering Indices
To better understand the degree of chemical weathering and extent of lateritisation, weathering indices such as chemical index of alteration (CIA), plagioclase index of alteration (PIA), index of chemical variability (ICV), mafic index of alteration (MIA) and intensity of lateritisation (IOL) are determined, using the oxides of major elements.
The chemical index of alteration (CIA) is determined by the equation of Nesbitt and Young (1982).
CIA = [Al2O3 / (Al2O3+CaO*+ Na2O + K2O)] X100
CIA values varied widely in both fractions of sediments. It ranged from 27 to 97 for the clay fractions and, from 47 to 96 for silt fractions of sediments (Table 1). Low CIA values in both fractions correspond to the sediments of Gujarat. The mean CIA values for the clay and silt fractions are 86 and 88 for sediments from the A-P terrain and, 80 and 72 for DT terrain, respectively. Figure 4A shows the plot of CIA values graphically in the A-CN-K diagram. The clay fractions of sediments from Kerala, Karnataka and Maharashtra plot close to Al2O3 pole indicating strong (intense) chemical weathering, while those from Goa and Gujarat plot in the intermediate to strong weathering region (Figure 4A). On the other hand, the silt fractions of sediments from Kerala and Karnataka exhibit strong weathering, while that of Goa and Maharashtra exhibit intermediate to strong weathering and, those from Gujarat exhibit weak to intermediate weathering (Figure 4A).
The plagioclase index of alteration (PIA) is widely used to quantify the degree of weathering of plagioclase feldspar. It is determined by the equation of Fedo et al. (1995, 1996).
where all elements are in molecular proportions.
PIA = (Al2O3-K2O) / (Al2O3+ CaO*+ Na2O- K2O) x 100
Fedo et al. (1995, 1996) reported that the sediments subjected to strong chemical weathering exhibit a PIA value of 100 and, PIA value of 50 represents unweathered plagioclase. In this study, the PIA values are in the range 21 to 94 for the clay fractions and 41 to 94 for the silt fractions of sediments (Table 1). The average PIA values for the clay fractions of sediments from A-P terrain and DT terrain are 86 and 80, respectively. Similarly, the average PIA values for the silt fraction of sediments from the A-P terrain and DT terrain are 88 and 71, respectively. The plot of major element oxides in the ternary diagram ((Al2O3– K2O)-CaO–Na2O) indicates that the sediments from Kerala, Karnataka, Goa and Maharashtra exhibit high degree of plagioclase weathering, while those from Gujarat exhibit low to moderate degree of plagioclase weathering (Figure 4B).
The index of chemical variability (ICV) is used as a proxy indicator to assess the role of mineralogical maturity of the sediments. It is determined by the equation of Cox et al. (1995).
ICV = (Fe2O3 + K2O + Na2O + CaO + MgO +MnO +TiO2)/Al2O3.
Typical rock forming minerals such as feldspars, amphiboles, and pyroxenes have ICV value >1, whereas the alteration products like kaolinite, illite, and muscovite have ICV value < 1 (Cox et al., 1995; Cullers, 2000). High ICV values imply compositionally immature sediments due to high content of non-clay silicate minerals, whereas low ICV values correspond to mature sediments deposited in areas of sediment recycling and intense chemical weathering. The ICV values varied widely in both fractions of sediments (Table 1). The mean ICV values of the clays from Kerala, Karnataka and Goa are 0.97, 0.87 and 1.21, respectively, with an overall mean of 1.02 for the A-P terrain. The mean ICV values of the clays from Maharashtra and Gujarat are 1.08 and 1.31, respectively, with an overall mean of 1.20 for the DT terrain. Similarly, the mean ICV values are <1 for the silts from Kerala, Karnataka, Goa and Maharashtra and, 1.28 (range: 0.97–1.87) for Gujarat. The plot of ICV vs. CIA (Figure 4C) indicates that the clays from Kerala, Karnataka and Maharashtra are intensely weathered and compositionally mature, whereas the clays from Goa and Gujarat are intensely weathered, with a few showing compositional immaturity (Figure 4C). On the other hand, most of the silt fractions of sediments from Kerala, Karnataka and Maharashtra are intensely weathered and mature. A few silt samples from Goa are immature but intensely weathered. Almost all silt samples from Gujarat are compositionally immature and weakly weathered (Figure 4C).
Babechuk et al. (2014) proposed Mafic Index of Alteration (MIA) to quantify the total loss of mobile elements relative to that of immobile elements. Subsequently, Babechuk and Fedo (2022) proposed MIA(O) and MIA(R), respectively for oxidative and reductive weathering, to separate the effects of feldspars (both plagioclase and K-feldspar) and mafic mineral weathering and, addition of labile elements during diagenesis / metasomatism. Following Babechuk and Fedo (2022),
MIA(O) = [(Al2O3+ Fe2O3(T)) / (Al2O3+ Fe2O3(T) +MgO+CaO+Na2O+ K2O)] x100
MIA(R) = [(Al2O3) / (Al2O3+ FeO(T) +MgO+CaO+Na2O+ K2O)] x100
Table 1 shows the values for MIA(O) and MIA(R). In general, the MIA(O) values are close to that of CIA. The mean MIA(O) values range from 82 to 91 for the clay and from 84 to 91 for silt fractions of sediments from the A-P terrain. It ranges from 74 to 84 for the clay and 62 to 75 for silt fractions of sediments from the DT terrain, with low values in both fractions corresponding to Gujarat. The MIA(R) values are much lower than MIA(O) in both size fractions. The mean MIA(R) values are 55 and 50 for the clay fractions and 50 and 57 for the silt fractions of sediments from A-P terrain and DT terrain, respectively.
Babechuk and Fedo (2022) used tetrahedral plots to better understand the processes preserved at different stages of weathering both in modern and ancient weathering profiles. They proposed AF-CN-K-M tetrahedral plot (Figure 4D), useful for oxidative weathering, where Fe is retained alongside Al across all stages of incipient to advanced weathering. One ternary diagram (AF-CN-M) of the AF-CN-K-M tetrahedron is integrated with MIA(o)–K weathering index (Figure 4D). The sediments from A-P terrain and Maharashtra of the DT terrain showed MIA(o) values >80 in both size fractions and plot very close to AF pole in AF-CN-M diagram indicating extreme leaching and net loss of Ca, Na, K and Mg, released from plagioclase and mafic minerals and Fe is retained via oxyhydroxide development (Babechuk and Fedo 2022). This agrees with the results from X-ray diffraction studies, where Al is retained as gibbsite and Fe as goethite (Figure 2) in the sediments from A-P terrain. The sediments from Gujarat plot slightly away from AF pole (with MIA(o) values 50 to 80 in both fractions) suggesting intermediate leaching of labile elements. However, in another ternary diagram (CN-K-M) of the tetrahedron, our samples plot in the central inner space designated for MIA(o) (Figure 4D), indicating strong leaching of labile elements and, subsequent diagenesis has not obscured the chemical weathering effects.
Babechuk and Fedo (2022) also proposed A-CN-K-FM tetrahedral plot (Figure 4E), useful to study reductive weathering, where Fe is lost and/or redistributed in the system. One ternary diagram (A-CN-FM) of the tetrahedron is integrated with MIA(R)-K weathering index (Figure 4E). Our samples plot slightly away from FM pole and slightly towards A pole in the A-CN-FM diagram, suggesting advanced weathering stage where Fe+Mg were lost. Since our sediment samples show high values of Fe and, some Fe may have retained as goethite. The average MIA(R) values for clay (55±7.1) and silt (59±4.9) fractions from A-P terrain may indicate only loss of Mg during advanced weathering of sediments. In another ternary diagram (CN-K-FM) of the tetrahedron (Figure 4E), our samples plot close to FM pole, but not in the inner space designated for MIA(R) reduction, implying subsequent diagenesis has not obscured the chemical weathering effects. The silt samples from Gujarat plot mid-way between AN and FM (Figure 4E) suggesting intermediate weathering has minimal effect on labile elements.
Babechuk et al. (2014) also proposed the equation to quantify the index of lateritisation (IOL) as
IOL = [(Al2O3+ Fe2O3) / (SiO2+ Al2O3+ Fe2O3)] x100
The mean IOL values for the clay and silt fractions of sediments are in the range from 45 to 40 for A-P terrain and, 35 to 26 for DT terrain (Table 1). Babechuk et al. (2014) reported IOL values <40 for unweathered mafic rocks and an IOL value of 35.7 for unweathered Deccan Trap Basalts. Following these authors, the samples from A-P terrain fall in the category of weakly lateritised, and those from DT terrain are non-lateritised. This agrees well with the mineralogy of the clay fraction contains, kaolinite, gibbsite and goethite indicating lateritised sediments from A-P terrain (Figure 2). Schellmann (1986) proposed triangular plot of SiO2 (S)- Al2O3 (A)- Fe2O3 (F) (S-A-F diagram) to identify whether the weathering residues are kaolinitised, lateritised or bauxitised. The clay fractions of all sediments plot in the region ‘weakly lateritized’ to ‘kaolinitised’, with samples from Kerala exhibiting weakly lateritised to samples from Gujarat kaolinitised. The silt fractions of sediments from Maharashtra and Gujarat are neither kaolinitised nor lateritized on S-A-F diagram (Figure 4F).
4.4. Distribution of Trace Elements
The PAAS-normalized distribution of trace elements in the sediments from different states (Figure 5) showed strong depletion of alkaline earth elements (Rb, Sr, Cs, Ba). The Th, U, La and Ce are enriched relative to PAAS in the sediments of Kerala and Karnataka, but depleted as one moves towards Goa, Maharashtra and Gujarat. The transition trace elements (TTE: Sc, V, Cr, Co, Ni) are enriched relative to that of PAAS in the sediments of all rivers (Figure 5). The TTE content of the sediments is higher in the silt fractions than in clay fractions. Moreover, the ƩTTE is higher in the sediments from DT terrain than in A-P terrain (Table 2 and Table 3). The distribution of Cu and Zn is same as that of TTE. The Ga content is enriched relative to that of PAAS, with higher values in the sediments from A-P terrain than in DT terrain (Table 2 and Table 3). Among the high-field strength elements (HFSE: Zr, Hf, Ta, Nb and Y), Nb is depleted relative to PAAS in the sediments of all rivers. In the clay fraction of sediments, the mean values of Zr, Hf, Ta and Y are lower for A-P terrain than DT terrain (Table 2). Moreover, the mean values of these elements from different states are close to that of UCC in the A-P terrain. In the silt fractions, the mean values of Zr, Hf and Ta are much higher and Y much lower for the sediments from A-P terrain than DT terrain (Figure 5A).
Total Trace elements (ƩTE) content: A total of 23 trace elements, excluding rare earth elements (REE), are considered in this study. Figure 6A shows the distribution of total-trace elements content (ƩTE) for the clay and silt fractions of sediments, separately. Sai Babu et al. (2024) reported REE distribution of these sediments. The distribution of trace elements along with a few REE (La, Ce, Yb, Y) are given in Table 2 and Table 3 and considered here for discussion. The ƩTE varied from 991.6 to 2027.1 µg/g in the clay fractions and, from 1081.1 to 3848.6 µg/g in silt fractions of sediments from different states. The mean ƩTE of the sediments was much lower in the clay fraction than their silt fractions in all states (Figure 6a). Within the clay fractions, the ƩTE of Maharashtra was high compared to other states (Table 2). The mean ƩTE of the clay fraction of sediments from all rivers (1473.05 µg/g) was lower than their silt fraction (1878.62 µg/g), UCC (1650.57 µg/g; Rudnick and Gao, 2003) and PAAS (1807.09 µg/g; Pourmand et al., 2012). The silt fractions of sediments showed broad peaks of high ƩTE corresponding to the rivers of Kerala and Maharashtra, and sharp peaks of high ƩTE for the sediments at the border rivers of Kerala - Karnataka and, Maharashtra -Gujarat (Figure 6a). The peaks of high ƩTE correspond to broad peaks of high ƩREE in the sediments of Kerala (Figure 6b), but in other states ƩREE distribution is significantly different from that of ƩTE (Figure 6a and b)
Trace element ratios: Figure 7A shows the distribution of Th/U ratio in the sediments of all rivers. The Th/U ratio of the clays are lower than in silts. The mean Th/U ratios for the clay and silt fractions of sediments from A-P terrain (4.08 and 5, 22, respectively) and DT terrain (4.47 and 4.44) are higher than in UCC (3.84; Table 2 and Table 3). The average Th/U ratios for the clay (5.2) and silt (7.8) fractions of sediments from Kerala are much higher than in UCC and PAAS (4.71; Table 2 and Table 3) and, peak high Th/U ratio broadly coincides with peak ƩTE (Figure 6c). The mean Th/U ratios for the clay and silt fractions of sediments from Karnataka (3.68 and 3.56, respectively) and Maharashtra (3.6 and 3.4) are close to that of UCC, but much lower for Goa (2.6 and 2.06) and higher for Gujarat (5.5 and 5.72) than UCC and PAAS (Table 2 and Table 3). The Th content and Th/U ratio of the sediments were plotted on the binary diagram of Gu et al. (2002). It showed significant positive correlation between the two in the sediments from A-P terrain and, weak correlation in clay fractions and, moderate positive correlation in the silt fraction of sediments from DT terrain (Figure 7B).
Figure 7C shows the distribution of Rb/Sr ratio in the sediments of all rivers. Unlike Th/U ratio, the Rb/Sr ratios are much higher in the clay fractions than their silt fractions, but both fractions showed similar trend in their distribution. The mean Rb/Sr ratios for the clay fractions of sediments from A-P terrain (1.07) and DT terrain (0.67) were much higher than in UCC (0.26; Table 2). The mean Rb/Sr ratios for the clay and silt fractions of sediments from Kerala (0.87 and 0.38, respectively), Karnataka (1.28 and 0.67), Goa (1.06 and 0.56), Maharashtra (0.77 and 0.31) and Gujarat (0.55 and 0.25) showed lower mean ratios for the silt fractions from DT terrain (Maharashtra and Gujarat) and these ratios were close to that of UCC. The binary plot of Rb/Sr ratio against Sr content of the sediments (Xu et al., 2010) shows strong negative correlation between the two in both fractions of sediments and from both terrains (Figure 7D).
4.5. Relationships of Major and Trace Elements
Table 4 is the correlation matrix of elements for the clay fraction of sediments, separately for A-P terrain and DT terrain. Figure 8 shows the important binary plots between the elements. Within the A-P terrain, Al2O3 showed negative correlation with CaO, Na2O, MgO and K2O (Figure 8a) and no correlation with other major elements (Table 4). The TiO2 showed strong correlation with Zr, Hf and Nb (Figure 8b), while P2O5 showed strong correlation with Sr, Ba and ∑REE (Figure 8c). Moderate to strong correlation exists among U, Th, Nb, Cs and Ta. The Fe2O3 and MnO showed strong correlation with V and Co (Figure 8d). On the other hand, the sediments from DT terrain, however, showed negative correlation of Al2O3 with CaO, MgO and Na2O and strong correlation with P2O5 (Figure 8e). The Al2O3 also showed moderate to strong correlation with Zr, Hf, U, Ga Nb and Ta. The Fe2O3 showed positive correlation with ∑REE (Figure 8f), U and Co. TiO2 showed strong correlation with Zr, Hf, V and Ga. Strong correlation exists among TTE (Sc, Co, Cr, Ni, Cu and Zn; Figure 8g) elements and TTE with Zr and Hf (Figure 8h).
5. Discussion
5.1. Mineralogy and Major Element Geochemistry—Stages of Weathering
The Western Ghats (WG) comprise of Archean-Proterozoic formations (A-P terrain) in Kerala, Karnataka and Goa and, continental flood (Deccan Trap) basalts (DT terrain) in Maharashtra and Gujarat, being weathered under humid tropical climatic conditions. Since the rivers are draining the WG, they obviously carry the weathering products of rocks subjected to chemical weathering, prevalent under tropical conditions. Kaolinite is a product of intense chemical weathering (Chamley, 1989). Occurrence of abundant kaolinite along with gibbsite in the sediments from A-P terrain (Figure 2) indicates that the hinterland rocks were subjected to intense chemical weathering and lateritisation and/or, the sediments are weathered from laterites. Babechuk and Fedo (2022) reported that the breaking down of 2:1 clays and formation of dominant 1:1 clay such as kaolinite, and Al- and Fe -(oxy)-(hydr)oxides such as gibbsite and goethite indicate that the sediments have undergone intense to extreme weathering conditions. Therefore, the clay minerals from A-P terrain (Figure 2) represent extreme chemical weathering and their derivation from laterites (see below). The increase in gibbsite content in the offshore sediments from Goa to Kerala was attributed to increase in lateritisation from Goa to Kerala (Rao and Rao, 1995).
Smectite is the dominant weathering product of Deccan Trap basalts under tropical conditions. Abundant smectite together with minor kaolinite, chlorite and illite in the sediments of Maharashtra and Gujarat (Figure 2) thus reflect dominant weathering products from basalts. The sediments with abundant smectite and minor kaolinite and chlorite indicate the abundant occurrence of 2:1 clay (smectite) and early stage of 1:1 clay (kaolinite) formation, suggesting advanced to intense stage of chemical weathering, according to the classification of Babechuk and Fedo (2020).
The depletion of labile elements such as Ca, Mg, Na and K relative to PAAS (Figure 3) indicates that they are leached and carried away as a solute during chemical weathering of source rocks. The extent of leaching of labile elements is much higher in the sediments from A-P terrain than in DT terrain. Weathering indices, such as CIA and PIA indeed point out that the clay fractions of sediments from Kerala, Karnataka and Maharashtra exhibit strong weathering or, high degree of plagioclase weathering (Figure 4), while those from Goa and Gujarat exhibit strong to intermediate weathering. A few silt samples from Kerala, Karnataka, Goa and Maharashtra exhibit intermediate weathering and all silts from Gujarat exhibit weak to intermediate weathering (Figure 4A and B). The MIA(O) values are close to that of CIA (Table 1) and point out extreme leaching and net loss of Ca, Na, K and Mg, released probably from plagioclase and mafic minerals. The MIA(R) values indicate only loss of Mg during advanced weathering of sediments and, chemical weathering effects are not obscured by subsequent diagenesis. The intensity of laterization simply point out kaolinite laterite for the sediments of Kerala and kaolinization in all other sediments (Figure 4F). In other words, lateritisation decreased from Kerala to Gujarat and sediments of Maharashtra and Gujarat exhibit no lateritisation and weathered due to advance chemical weathering.
5.2. Major Element Chemistry—Provenance
Major element data provide evidence regarding sedimentary provenance and effects of sedimentary processes such as weathering and sorting. The SiO2/Al2O3 ratio is close to that of UCC or higher for the sediment weathered from intense chemical weathering of source rocks and, much lower than in UCC for the sediment weathered from laterites. This ratio is <1.33 for laterites, 1.33–2.0 for lateritic soils and >2.0 for non-lateritic, chemically weathered tropical soils (Martin and Doyne, 1927; Narayanaswamy, 1992). The SiO2/Al2O3 ratio, however, can range from 1.33 to 2.2 in lateritic soils (Martin and Doyne, 1927). The mean SiO2/Al2O3 ratio for the clay fractions of sediments from Kerala (1.45), Karnataka (2.22) and Goa (2.24) and, silt fraction of sediments from Kerala (1.71) suggests that they resemble lateritic soils. The mean SiO2/Al2O3 ratio for the silts from Karnataka (2.6) and Goa (2.81) suggests dilution of lateritic soils by material weathered from the hinterland. The gradually decreasing Al2O3 content coinciding with increasing Fe2O3 content in the clay fraction of sediments from Kerala to Goa (Table 1) and, increasing mean Fe2O3/Al2O3 ratio from 0.5 in Kerala to 0.64 in Karnataka and then to 0.74 in Goa suggest increase in particulate iron, probably from Fe-Mn ore mines, located in north Karnataka and Goa (Gokul et al., 1985; Dhoundial et al., 1987; Naqvi, 2005; Desai et al., 2009). As rivers from northern Karnataka and Goa drain these open cast mines and weathered material from the ores together with lateritic material are transported as suspended and bed load and deposited in the lower reaches of rivers and estuaries. Several workers reported ore material -dominated sediments in the rivers and estuaries of northern Karnataka and Goa (Shynu et al., 2011, 2014; Prajith et al., 2015; Kessarkar et al., 2015; Suja et al., 2017). Therefore, the sediments of Karnataka and Goa are lateritic soils admixed with ore material. Sai Babu et al. (2024) reported MREE- and HREE-enriched REE patterns with positive Ce and Eu anomaly in the clay and silt fractions of sediments from the rivers of northern Karnataka and Goa and suggested that these sediments consist of weathered material from source rocks, Fe-Mn ores and laterites. On the other hand, the mean SiO2/Al2O3 ratios of the clay and silt fractions of sediments from Maharashtra (2.54 and 2.99, respectively) and Gujarat (3.29 and 3.97) suggest that the sediments are non-lateritic and chemically weathered soils. However, these sediments contain high Fe2O3 (mean: 9.93%) and TiO2 (mean: 1.48%) in the clay fractions. Moreover, the much lower mean Al2O3/TiO2 ratios for the clay (11.7) and silt (6.2) fractions of sediments from DT terrain than in UCC (24.29) point to Ti-enrichment. Furthermore, strong correlation of TiO2 with Zr, Hf, Nb, V and Ga (Figure 7; Table 4) suggests Ti association with heavy metal-enriched minerals, i.e., heavy minerals such as rutile and ilmenite. In other words, the sediments from DT terrain contain Fe- and Ti-enriched minerals, magnetite and ilmenite and rutile, abundantly reported from the Deccan Trap basalts.
5.3. Relationships among Major Elements and Trace Elements
Strong correlation among labile alkali and alkaline earth elements and their negative correlation with Al2O3, Fe2O3 and TiO2 in the sediments from both terrains (Table 4; Figure 8a)) may be related to chemical weathering of source rocks, wherein labile elements are transported as dissolved species, and immobile elements such as Al, Fe and Ti are enriched in solid detritus. The correlation of TiO2 with Zr, Hf and Nb in the sediments from both terrains (Table 4; Figure 8b) implies association of these elements with heavy minerals. Strong correlation of Fe2O3 and MnO with Co (Figure 8d) suggest Co adsorbed onto Fe-Mn oxy-(hydr) oxides. The moderate to strong correlation of P2O5, Fe2O3 and MnO with ƩREE in the clay fractions of sediments from A-P terrain (Figure 4; Figure 8C) suggests REEs released during weathering are bound to secondary mineral phases such as Fe-Mn oxy- (hydr)oxides and phosphate. Strong positive correlation of ƩREE with Fe2O3 (Figure 8F) and moderate correlation with Al2O3 (Table 4) in the sediments from DT terrain suggests that the clay minerals and Fe-oxy-(hydr)oxides are important host for REE. It appears that that the primary host for REE are secondary weathering products such as Fe-ocy hydroxides and phosphate in the A-P terrain and, clay minerals and Fe oxy-(hydr)oxides in the DT terrain. Pourret et al. (2013) and Du et al. (2021) suggested that REE are adsorbed onto Fe-Mn oxy- (hydr) oxides and phosphates abundantly. The correlation of Sr and Ba with P2O5 in both terrains indicates that they are associated with secondary mineral phases like phosphates. Strong correlation of Al2O3 with Ga in both terrains (Table 4) suggests its association with clay minerals. High Ga content in the A-P terrain than DT terrain may be due to preferential binding of Ga with kaolinite and gibbsite-rich sediments. Several workers reported association of high Ga content with laterites (Narayanaswamy 1992; Abedini et al., 2014). Positive correlation of Al2O3 with Zr, Hf, U, Ga, Nb, Ta (Table 4) implies that these elements are immobile during weathering and associated with the weathered detritus. Within the DT terrain, strong correlation exists among TTE (Figure 8G) and, TTE (Sc, Co, Cr, Ni, Cu and Zn) are negatively correlated with Rb, Cs and Nb (Table 4) may be because TTE are retained and alkaline earth elements are removed during chemical weathering. High TTE and Yb contents and strong correlation of Yb with TTE (Table 4) suggest that TTE and heavy rare earth elements (HREE) like Yb occur in higher proportions in basalts. Sai Babu et al. (2024) reported PAAS-normalized MREE and HREE-enriched and LREE-depleted patterns in the weathered products of basalts. Correlation of REE with U, Th and Ta (Table 4) indicates that some REE are associated with heavy metal associated minerals (i.e., heavy minerals). Positive correlation of Zr and Hf with Sc, V and Ga and, positive correlation of U and Th with Rb, Cs, Nb, Ta, Ga suggest a mixed source for these elements. It has been reported that the basalts are contaminated with crustal rocks away from Deccan Plateau and crustal rocks are exposed because of thin cover of Deccan basalts. Heavy monsoonal rains may have eroded these contaminated crustal rocks and released these metals to the sediments.
5.4. Factors Controlling ∑TE in the Sediments
Trace elements are usually associated with fine-grained sediments and heavy minerals. The low ∑TE or, ∑TE values close to that of UCC in the clay fractions and relatively high ∑TE in the silt fractions of sediments in rivers from different states (Figure 6A; Table 2 and Table 3) imply that the trace elements released during chemical weathering are largely transported away from source rocks. As these rivers drain the Western Ghats (WG) mountain ranges, the steep slopes of the WG and, chemical weathering associated with heavy monsoonal rains (>250 mm/yr) in short duration (within 4 months during southwest monsoon—June to September) may have facilitated quick erosion of dissolved and particulate material from the weathering site and transportation into the rivers, resulting in low ∑TE in the clay fraction.
The peaks of high ∑TE in the silt fraction correspond to the sediments from Kerala and Maharashtra (Figure 6A). Moreover, the type of trace elements associated with ∑TE are different in both states. For example, the peak high ∑TE in the sediments of Kerala is associated with peaks of high Th/U and peak high ∑REE (Figure 6A-C), low Co/La, Cr/Th and Co/Th ratios (Figure 6D-F), peak high Th/Sc (Figure 6G) and higher HFSE elements relative to PAAS (Figure 5). It implies high ∑TE is associated with Th- and La-enriched minerals such as monazite and apatite and, minerals that contain both high REE and heavy (HFSE) elements i.e., heavy minerals. Felsic granites are usually enriched with heavy metal enriched minerals (i.e., heavy minerals) and high REE (McLennan et al., 1993). The Western Ghats in south Kerala are associated with felsic granites and occur at the very proximity to the coast. Therefore, it is likely that the heavy monsoonal rains persuaded both physical and chemical weathering and quick erosion and transport of material by the rivers draining the Western Ghats and then deposition in the lower reaches of rivers and adjacent coastal region. This results in high heavy metal and high REE- enriched minerals in the silt fraction of sediments. Sai Babu et al. (2024) reported PASS-normalized LREE and MREE-enriched and HREE-depleted patterns in both clay and silt fractions of sediments from Kerala and suggested their derivation from felsic granites and laterites from hinterland. In other words, the peak high ∑TE of the silts from south Kerala is related to the source rock geology and relief of the Western Ghats (WG) and, intense chemical and physical weathering of the rocks. Heavy minerals (such as monazite, ilmenite, zircon) enriched sediments have been reported in the coastal region of south Kerala (Mallik et al., 1987).
The broad peaks of high ∑TE in the silts of Maharashtra coincide with peaks of high Co/La, Co/Th ratios (Figure 6D-E) and to some extent peak high Cr/Th ratios (Figure 6f), very low Th/Sc ratio (av. 0.2 compared to 0.9 of UCC; Figure 6G) and high transition trace elements (TTE; (Figure 5; Table 3) and Ti contents relative to PAAS (Figure 3; Table 1). In other words, high ∑TE in the silts of Maharashtra is enriched with TTE-dominant mafic minerals rather than felsic (La and Th) component associated minerals. Major elements data indicated Fe- and Ti-enriched minerals, such as magnetite, ilmenite and rutile. Moreover, the Western Ghats in this region exhibit steep gradient, known as the Great Escarpment of India, and consist of Deccan Trap volcanic rocks. Chemical weathering produces fine-grained detritus, whereas physical weathering and erosion produce coarser material. The peak of high ∑TE in the silt fraction of sediments is most probably related to physical or mechanical erosion and weathering of Deccan Trap material. The Deccan Traps are characteristically enriched with high concentrations of transition trace elements (TTE) and, Ti and Fe-rich minerals. The MREE- and HREE-enriched patterns are characteristic of both clay and silt fractions of sediments from Maharashtra, indicating their derivation from Deccan Trap basalts (Saibabu et al., 2024). Therefore, source rock composition, topography of the WG and associated physical and chemical weathering favoured peak high ∑TE in these sediments. Unlike Kerala, the peak high ∑TE of silts corresponds to low ∑REE in the sediments of Maharashtra (Figure 6A-B) implying basalts are enriched with TTE but not enriched with REE. In other words, peaks of high ∑TE in two different geographic domains associated with silt fractions of sediments are related to the combined influence of source rocks, climate and topography.
5.5. Factors Controlling Th/U and Rb/Sr Ratios—Lithology and Chemical Weathering
Th/U ratio: Trace elements (Th, U, Rb and Sr) content and ratios of Th/U and Rb/Sr can be used to measure the intensity of weathering in the source region. (McLennan et al., 1990; Armstrong et al., 2013; Sahoo et al., 2017; Viers et al., 2000; Nagarajan et al., 2007). Th is immobile in the sedimentary environment, whereas U is strongly mobile and the weathering and recycling are expected to result in oxidation of U to the soluble U6+ state (McLennan et al., 1993). The higher Th (mean: 12.8 µg/g) and U (mean: 3.5 µg/g) contents in the clay fraction of sediments from A-P Terrain than in UCC (Th: 10.1 µg/g; U: 2.63 µg/g; Table 2) indicate high Th and U contents from granitic source. The higher mean Th/U ratio (4.1) of the A-P terrain than in UCC (3.8) probably suggests oxidation of U to the soluble U6+ (McLennan et al., 1993) and thus the intensity of chemical weathering affected this ratio. Significant positive correlation between Th content and Th/U ratio in both fractions of sediments from A-P terrain (Figure 7B) suggests chemical weathering modified the Th/U ratio. Usually, the Th/U ratio increases with increasing degree of chemical weathering. However, in the sediments of Kerala, the peak high Th/U ratio (Figure 6c) coincides with peak high ƩTE (Figure 6a), suggesting lithology of the source rocks also affected this ratio. Felsic granite are major rock types in south and central Kerala and contain high Th-enriched minerals (Soman 2002). The adsorption of Th by clay minerals produced under strong degree of weathering results in high Th/U ratios (McLennan et al., 1993). Therefore, chemical weathering, lithology of source rocks and adsorption of Th onto clays affected the Th/U ratio in the sediments of Kerala. The mean Th and U contents increase and Th/U ratios decrease as one moves from Kerala to Karnataka and then to Goa in both fractions of sediments (Table 2 and Table 3). In other words, the sediments from Karnataka and Goa gained U and, as a result the Th/U ratios are lower than in UCC (Figure 7A) and do not fall on the weathering trend line shown in Figure 7B. Since the sediments from Karnataka and Goa contain particulates from Fe-Mn ores together with lateritic material, the Th and U contents are influenced by ore material, favouring gaining U, leading to decrease in Th/U ratio of the sediments.
The lower mean Th (8.6 µg/g), U (2.19 µg/g) contents and higher mean Th/U ratio (4.47) for the clay fractions of sediments from DT terrain than in UCC (Table 2 and Table 3) imply low Th and U contents in source rocks and strong oxidation of U due to weathering. Weak correlation between Th/U ratio and Th content (Figure 7B) in the clay fractions and moderate correlation in silt fractions of sediments negate that the intensity of weathering is a sole factor influencing Th/U ratio. Moreover, Figure 7B shows nearly all sediments from Gujarat and a few sediments from Maharashtra fall on the weathering trend line. A few sediment samples from Maharashtra gained U resulting in low Th/U ratios and plot below UCC (Figs. 7A and 7B), suggesting contaminated crust material could have affected this ratio. The strong correlation of U with Al2O3 and Fe2O3 (Table 4) indicate U associated with silicate, Fe-oxy-(hydr)oxides and, weathering of contaminated crustal material with basalts at the transition zone of Goa and Maharashtra may have provided U to the sediments, causing low Th/U ratio. A few sediments from Maharashtra fall within or close to the depleted mantle (Figure 7B), implying these sediments are weathered directly from basalts. In other words, the Th/U ratios of sediments from Maharashtra are affected by chemical weathering of basalts and contaminated crustal source material from hinterland. The Th/U ratios for the clay and silt fractions of sediments from Gujarat are higher than in UCC, and the values plot on the weathering trend line (Figure 7C) suggesting oxidation of U may have enhanced Th/U ratio. However, the sediments from Gujarat exhibit weak to intermediate weathering (Fig, 4A-B) and are compositionally immature (Figure 4C), implying high ratios may not be due to chemical weathering and, recycled sediments may have enhanced the Th/U ratio.
Rb/Sr ratio: Rubidium (Rb) tends to co-exists with K in silicate minerals such as K-feldspar, biotite and muscovite, whereas Sr prefers Ca-bearing minerals such as carbonates, plagioclase and pyroxenes (Liu et al., 2012). Moreover, K-bearing minerals are more stable than Ca-bearing minerals resulting in fractionation between Rb and Sr during weathering (Jin et al. 2005; Liu et al. 2007). The much lower mean Rb and Sr contents of the sediments (Table 2 and 3) than in UCC and PAAS from both terrains imply that some Sr and Rb are lost to solution during chemical weathering. Rubidium (Rb) is highly soluble and also adsorbs abundantly on to clay minerals (Blum and Erel, 1997). High Rb/Sr ratios in the clay fractions than silt fractions of all sediments (Figure 7C) suggest high degree of chemical weathering and very strong sorption capacity of Rb by clay minerals affected this ratio. Elevated concentrations of Rb have been reported in shale and mudstones (Wampler et al., 2012). Increasing Rb/Sr ratios indicate stronger chemical weathering (Yang et al., 2004). Significant negative correlation between Rb/Sr ratio and Sr content of the sediments from both terrains (Figure 7D) suggest that the Rb/Sr ratios are strongly affected by chemical weathering. However, very high Rb/Sr ratios in both fractions of sediments from south Kerala (Figure 7C) could be due to Rb-enriched rocks in the hinterland and chemical weathering. Soman (2002) reported khondalite–granulite–granite rocks intruded by large pegmatites in south and central Kerala and Archean schists and charnockites with mafic granulites in north Kerala. It is known that felsic granites and pegmatites contain Rb-enriched minerals (Soman 2002). Therefore, very high Rb/Sr ratios in south Kerala may have resulted from strong physical and chemical weathering of felsic granites and pegmatites. Relatively low Rb/Sr ratios in the north Kerala may be because of the increasing mafic component with high Sr in the hinterland rocks and more intense weathering.
Peninsular granites and gneisses are important source rocks in the hinterland of Karnataka and Goa. The Rb in metamorphic rocks is largely associated with K-bearing phyllosilicates such as biotite and muscovite (Liu et al. 2007). Rb also substitutes for K+ in mica (muscovite) and to a lesser extent in K-feldspars. On the other hand, Sr is the most easily be removed from the parent rocks during chemical weathering and carried away as a solute. Therefore, the ion exchange and differential adsorption mechanisms tend to concentrate Rb during weathering causing high Rb/Sr ratios in the clays of Karnataka and Goa. Therefore, high Rb/Sr ratios are related to the source rocks and intense chemical weathering.
High Rb/Sr ratios continued in the clay and silt fractions of sediments in a few rivers of southern Maharashtra (Figure 7C) appear anomalous because surficial rocks are basalts. Since basalts contain high Sr, one would expect low Rb/Sr ratios, as seen in northern Maharashtra. As mentioned in geology of the hinterland, the Proterozoic (peninsular granite and gneisses) rocks laterally change over to Deccan Traps at the border of Maharashtra and Goa (Figure 1). Since the Deccan Trap material is contaminated with crustal sediments at the transition zone of Maharashtra and Goa, high Rb/Sr ratios in the sediments of southern Maharashtra could be due to the weathering of subsurface rocks and their mixing with the products of Deccan Traps at the transition zone. Heavy monsoonal rains and steep slope may have favored exposure of subsurface rocks and their erosion. Sai Babu et al. (2024) reported positive Ce anomaly in the sediments of southern Maharashtra and its absence in the sediments of northern Maharashtra and attributed to the mixing of weathered products from Deccan basalts with crustal rocks at the transition zone.
The Deccan Trap basalts (basic rocks), prominent rock type in Maharashtra and Gujarat, contain high Sr. Mafic rocks weather 2 to 10 times faster than felsic rocks. As mentioned earlier, Sr is most easily be dissolved from the parent rocks during chemical weathering. Sr also substitutes for Ca in carbonates and clays. Despite the above, strong negative correlation between Rb/Sr ratio and Sr content (Figure 7D) suggest chemical weathering is the major process for modifying this ratio. Moreover, the silt fractions of sediments exhibit high Sr concentration and low Rb/Sr ratios (Figure 7C) close to that of UCC, implying source rock influence may have controlled the Rb/Sr ratio.
5.6. Dominance of Mafic/Felsic Source Component in the Sediments
Binary plots and major/trace element ratios: Major elements provide information on rock composition of the original provenance and the effects of sedimentary processes, such as weathering and sorting. Hayashi et al. (1997) reported Al2O3/TiO2 ratios for the mafic (3-8), intermediate (8-21) and felsic source (21-70)- dominated sediments. The mean Al2O3/TiO2 ratio of the clay (18.1) and silt fractions (15.76) from the A-P terrain and, clay fraction (11.27) from DT terrain (Table 1) indicate that these samples represent intermediate composition between felsic and mafic rock sources. However, the mean Al2O3/TiO2 ratio of silts from DT terrain (6.19) indicates the dominance of mafic component. Plot of these values in the binary plot (Figure 9A) of Al2O3 versus TiO2 (Bhatia, 1983) shows that most of the clay and silt fractions from A-P terrain fall in the intermediate region between felsic and mafic provenance, with a few samples falling in the felsic provenance. Within the DT terrain, the clays from Maharashtra fall in the intermediate zone between mafic and felsic, while those from Gujarat fall in the mafic provenance (Figure 9A). The silt fractions of sediments from DT terrain fall in the intermediate region between mafic and felsic provenance.
The mean Fe2O3 content was higher and, TiO2 and MgO contents were lower for the sediments from A-P terrain than in DT terrain. A plot of these values in the TiO2 versus Fe2O3+MgO diagram (Bhatia, 1983) indicates that the sediments from both terrains plot more towards basalts, suggesting dominance of mafic component in all samples (Figure 9B).
Hayashi et al. (1997) reported TiO2/Zr ratios for mafic igneous rocks (>200), intermediate rocks between mafic and felsic (<200- 55) and felsic igneous rocks (<55). The mean TiO2/Zr ratios for the clay fraction of sediments from A-P terrain (160) and, clay (99) and silt fractions (88) from DT terrain reveal intermediate composition between mafic and felsic sources (Table 2 and Table 3). However, the mean ratio for the silt fraction of sediments from A-P terrain (27.5) points out the dominance of felsic component. The plot of data in the TiO2 versus Zr diagram indicates that the sediments from A-P terrain plot in the intermediate region between felsic and mafic, with clay fractions more towards mafic region and silt samples more towards felsic region (Figure 9C). The sediments from DT terrain plot in the intermediate zone between mafic and felsic (Figure 9C).
Felsic rocks are enriched with Th, whereas the basic igneous rocks are enriched with Sc and, Th/Sc ratio can chemically differentiate the sediments. Taylor and McLennon (1985) and Bhatia and Crook (1986) reported Th/Sc ratios for the post-Archean (~1), granitic (>1) and Archean and basic rock (<1)-derived sediments. The mean Th/Sc ratios for the clay fractions of sediments (Table 2 and Table 3) from A-P terrain (0.566) and DT terrain (0.243) are much lower than PAAS (0.919) and UCC (0.721), suggesting predominant Archean and basic rocks-derived material. Accordingly, most of the clay fractions of sediments from both terrains fall in the mafic region with a few samples falling in the intermediate zone between mafic and felsic in the Th versus Sc plot (Figure 9D). However, the mean Th/Sc ratio of the silts from A-P terrain (0.93) is close to that of PAAS (0.919), but these silts extend from mafic to felsic region in the Th vs Sc plot (Figure 9D), with more samples from Kerala and Karnataka falling in the felsic region and samples from Goa falling in the intermediate zone between mafic and felsic region. The lower mean Th/Sc ratio of the silts from DT terrain (0.391) than UCC suggests the dominance of mafic component. However, these samples extend from mafic to felsic region, with more samples from Maharashtra falling in the mafic region and more samples from Gujarat falling in the felsic region.
The ratios of Cr/Th, Co/Th, Sc/Th and La/Sc relative to UCC have been used to estimate the dominance of mafic and felsic component in the sediments (McLennan et al. 1980). The much higher mean Cr/Th, Co/Th and Sc/Th ratios and, much lower La/Sc ratio than in UCC for the clay fractions of sediments from A-P terrain (Table 2) imply dominance of mafic component. However, in the silt fractions, the mean Cr/Th, Co/Th and La/Sc ratios are much higher and Sc/Th is lower than in UCC (Table 3). Low Sc/Th ratios in the silts could be due to Th-enriched heavy minerals recycled into the sediments. In the case of DT terrain, the much higher Cr/Th, Co/Th and Sc/Th ratios and much lower La/Sc ratios in the clay fractions of sediments than in UCC (Table 2) imply dominance of mafic component. The mean Sc/Th ratio for the silts of Gujarat (0.59; Table 3) is much lower than in UCC (1.39) implying Th-enriched heavy minerals in this fraction.
Ratio-ratio plots of trace elements: The ratio-ratio plots of immobile trace elements are frequently used to understand the dominance of source rock component and sedimentary processes. The ratio-ratio plot of trace element data in the Th/Sc vs. Zr/Sc diagram (Figure 9E) indicates that the clay samples from both terrains plot close to UCC and spread more towards andesite. High Zr concentrations in a few silt samples from Kerala and Karnataka (Table 3) indicate the presence of zircon, a heavy mineral. Moreover, these silt samples plot on the linear line in the Th/Sc vs. Zr/Sc (Figure 9E), representing zircon addition through sediment recycling process or hydrodynamic transportation process. The Th/Yb and La/Th ratios are also helpful to determine the dominant source components. The mean Th/Yb ratio is much higher and mean La/Th ratio is close to that of UCC for both fractions of sediments from the A-P terrain. The mean Th/Yb and La/Th ratios of both fractions of sediments from DT terrain are close to that of UCC. The ratio-ratio plot of La/Th vs. Th/Yb (Figure 9F) shows intermediate source between mafic and felsic for both clay and silt fractions. The data points from Kerala extend more towards felsic source pointing to dominance of felsic component.
Ternary diagrams: Ternary diagrams using trace metals are helpful to distinguish the dominant trend of the source components in the sediments. In the La-Th-Sc diagram (Bhatia and Crook, 1986; Jahn and Condie, 1995) the clay and silt fractions from A-P terrain extend from granite to basalt, with samples from Kerala are more towards granite, while those from Karnataka plot more towards basalts (Figure 10A). The clay and silt samples from Goa plot in the granodiorite region (Figure 10A). The sediments from DT terrain fall within the region between granodiorite and basalts (Figure 10A).
Figure 10B shows the plot of V, Ni and Thx10 data in the ternary diagram. Sediments from A-P terrain fall in the region between felsic and mafic rocks, with clay fractions plotting more towards mafic source. Some silt samples fall within felsic region and others plot linearly between felsic and mafic region. The clay fractions of sediments from DT terrain plot close to mafic rocks while silt samples plot parallel to V-Thx10 axes and more towards apex V.
Figure 10C shows the plot of Zr, Cr and Ga data in the ternary diagram. All sediment samples plot parallel to the Cr-Zr axes. The major difference between clay and silt samples from A-P terrain is, silt fractions extend from acidic and metamorphic rocks (Zr apex) to the basic rocks, while clay fractions extend from sedimentary rocks to basic rocks and more towards Cr. Similarly, the clay and silt fractions of sediments from DT terrain extend from sedimentary to basic rocks region (Figure 10C). A few silts from DT terrain also fall in the region representing acidic and metamorphic rocks.
The provenance of river sediments from Figure 9 and Figure 10 may be summarized as follows. The sediments from A-P terrain represent an intermediate provenance between felsic and mafic source. However, the clay fractions from A-P terrain trend more towards mafic composition (Figs. 9B, 9C, 9D, 10B and 10C). A few silt fractions exhibit distinct felsic provenance (9D, 10A, 10B and 10C). Since these silts contain heavy minerals, they may have recycled or transported into the rivers. Similarly, the provenance of sediments from DT terrain is intermediate between felsic and mafic source, with both fractions from Maharashtra and clays from Gujarat trending more towards mafic (9D, 10B and 10C) source. The silts from Gujarat are dominated by felsic source (Figure 9D). Sai Babu et al. (2024) reported mafic component-dominated rare earth elements from the sediments of both terrains. Two implications can be drawn from the provenance of sediments. (a) One would expect the clays from the granitic terrain (A-P terrain) to be more felsic, but mafic component-dominated in the river sediments of Goa, Karnataka and Kerala; it implies crystalline felsic components weathered from granitic terrain may perhaps be deposited more closure to the source and finer mafic component is transported farther from source. The sediments from A-P terrain thus show size sorting during transportation. (b) A curious point one should realize is that the clay fractions from both terrains are more mafic, despite source rocks in the hinterland are different (granitic and basaltic terrains). The sediments from the inner continental shelf all along the west coast of India and Arabian Sea are abundantly clayey (Rao and Wagle, 1997). Since the rivers from the west coast of India are transporting mafic-component dominated clays into the Arabian Sea, it would be a great challenge to identify the exact source of clays weathered from granitic rocks, using trace element chemistry, in the Arabian Sea sediments.
5.7. Summary and Conclusions
Several rivers along the west coast of India drain through the Western Ghats (WG), that comprise of Deccan Trap (DT) terrain in the north and Archean-Proterozoic (A-P) terrain in the south, being weathered under humid, tropical conditions. The basement rocks of the WG are covered by laterites, whose thickness decreases significantly from Kerala (up to 30 m) to Maharashtra (<10 m). The mineralogy and, major and trace elements chemistry of the sediments deposited at the lower reaches of 90 medium and minor rivers from 5 states along the west coast of India were determined to understand the influence of source rocks, intensity of chemical weathering, tectonics and transport processes. Kaolinite is the predominant mineral followed by minor illite and gibbsite and goethite in the sediments from A-P terrain and, smectite followed by kaolinite, chlorite and illite in the sediments from DT terrain. The sediments were depleted with Si, Ca, Mg, Na and K and enriched with Al, Fe, P and Ti relative to that of Post Archean average Australian Shale (PAAS). The sediments from A-P terrain exhibit high Al, Fe and P, while those from DT terrain exhibit high Mg, Ca and Ti. The mean SiO2/Al2O3 ratio (1.45 to 3.29) of sediments from different states suggests that the sediments from A-P terrain resemble lateritic soils, while those from DT terrain are non-lateritic, chemically weathered soils. The weathering indices such as chemical index of alteration (CIA), plagioclase index of alteration (PIA), index of chemical variability (ICV) and mafic index of alteration (MIA) suggest intensely weathered and compositionally mature sediments for Kerala, Karnataka and Maharashtra. The clay and silt fractions of sediments from Goa and clays from Gujarat exhibit intermediate to strong weathering, while the silts from Gujarat are compositionally immature and weakly weathered. Trace elements such as Rb, Sr, Cs and Ba were strongly depleted relative to PAAS in all sediments. The sediments from A-P terrain showed high Th, U, La, Zr and Hf, while those from DT terrain showed high Sc, Cr, Co, Ni, V and Ga compared to PAAS. The mean total trace element content (∑TE) was lower for the clay fraction than their silt fractions of sediments, upper continental crust (UCC) and PAAS. The ∑TE of silt fraction exhibits peak high values for Kerala and Maharashtra. The Th/U and Rb/Sr ratios of the sediments are controlled by the lithology of the source rocks and intensity of chemical weathering. The binary plots (Al2O3 vs. TiO2, TiO2 vs. Fe2O3+ MgO, TiO2 vs. Zr, Th vs. Sc), ratio-ratio plots (Th/Sc vs. Zr/Sc and Th/Yb vs. La/Th) and, ternary diagrams (La-Th-Sc, Zr-Cr-Ga, and V-Ni-Thx10) reveal that the sediments from A-P terrain exhibit intermediate provenance between felsic and mafic source, with clay fractions trending more towards mafic source. Similarly, the sediments from DT terrain represent a provenance intermediate between granodiorite and basalts, with both fractions trending more towards mafic source. The clay fractions exhibiting more of mafic signature from granitic terrain is anomalous and suggest size sorting during transport. Moreover, it would be challenging to identify the source of sediments from the granitic terrain in the Oceans by using trace element chemistry.
Acknowledgments
The authors thank the Vice-chancellor, VFSTR, Vignan’s University and Director CSIR-NGRI for their encouragement. This work was carried out under the project ‘INSA-Senior Scientist’ to VP Rao from the Indian National Science Academy, New Delhi and during Assistant Professor position of Sk. Sai Babu at Vignan’s University. We acknowledge these organizations for their financial support.
References
- Abedini, A.; Calagari, A.A.; and Mikaeili, K. Geochemical characteristics of laterites: The Ailibaltalu Deposit, Iran; Bull. Miner. Res. Explor. 2014, 148, 69–84. [Google Scholar] [CrossRef]
- Absar, N.; Sreenivas, B. Petrology and geochemistry of greywackes of the 1.6 Ga Middle Aravalli Supergroup, northwest India: Evidence for active margin processes. Int. Geol. Rev. 2015, 57, 134–158. [Google Scholar] [CrossRef]
- Amajor, L.C. Major and trace element geochemistry of Albian and Turonian shales from the Southern Benue trough, Nigeria. J. African Earth Sci. 1987, 6, 633–641. [Google Scholar] [CrossRef]
- Armstrong-Altrin, J.S.; Nagarajan, R.; Madhavaraju, J.; RosalezHoz, L.; Yong, I.L.L.; Balaram, V.; Cruz-Martınez, A.; AvilaRamırez, G. Geochemistry of the Jurassic and Upper Cretaceous shales from the Molango Region, Hidalgo, eastern Mexico: Implications for source-area weathering, provenance, and tectonic setting. C. R. Geosci. 2013, 345, 185–202. [Google Scholar] [CrossRef]
- Armstrong-Altrin, J.S.; Madhavaraju, J.; Vega-Bautista, F.; Ramos-V’azquez, M.A.; P’erez- Alvarado, B.Y.; Kasper-Zubillaga, J.J.; Bessa, A.Z.E. Mineralogy and geochemistry of Tecolutla and Coatzacoalcos beach sediments, SW Gulf of Mexico. Appl. Geochem. 2021, 134, 105103. [Google Scholar] [CrossRef]
- Babechuk, M.G.; Widdowson, M.; Kamber, B.S. Quantifying chemical weathering intensity and trace element release from two contrast ing basalt profiles, Deccan traps, India. Chem Geo. 2014, 363, 56–75. [Google Scholar] [CrossRef]
- Babechuk, M.G.; Widdowson, M.; Murphy, M.; Kamber, B.S. A combined Y/Ho, high field strength element (HFSE) and isotope perspective on basalt weathering, Deccan traps, India. Chem Geol. 2015. [Google Scholar] [CrossRef]
- Babechuk, M.; Fedo, C. Analysis of chemical weathering trends across three compositional dimensions: applications to modern and ancient mafic-rock weathering profiles. Can J Earth Sci. 2022. [Google Scholar] [CrossRef]
- Balasubramaniam, K. S, Surendra, M.; Kumar, T.V. Genesis of certain bauxite profiles from India. Chem. Geol. 1987, 60, 227–235. [Google Scholar] [CrossRef]
- Bayon, G.; Toucanne, S.; Skonieczny, C.; Andre, L.; Bermell, S.; Cheron, S.; Dennielou, B.; Etoubleau, J.; Freslon, N.; Gauchery, T.; Germain, Y.; Jorry, S.J.; Menot, G.; Monin, L.; Ponzevera, E.; Rouget, M.L.; Tachikawa, K.; Barrat, J.A. Rare earth elements and neodymium isotopes in world river sediments revisited. Geochim. Cosmochim. Acta. 2015, 170, 17–38. [Google Scholar] [CrossRef]
- Berner, R.A.; Berner, E.K. Silicate weathering and climate. In Tectonic Uplift and Climate Change; Ruddiman, W.F., Ed.; Plenum Press: New York, 1997; pp. 354–365. [Google Scholar]
- Bhatia, M.R. Plate tectonics and geochemical composition of sandstones. Journal of Geology 1983, 91, 611–627. [Google Scholar] [CrossRef]
- Bhatia, M.R.; Crook, K.A.W. Trace element characteristics of graywackes and tectonic setting discrimination of sedimentary basin. Contributions to Mineralogy and Petrology 1986, 92, 181–193. [Google Scholar] [CrossRef]
- Bhuiyan, M.A.H.; Rahman, M.J.J.; Dampare, S.B.; Suzuki, S. Provenance, tectonics and source weathering of modern fluvial sediments of the Brahmaputra-Jamuna River, Bangladesh: Inference from geochemistry. J. Geochem. Explor. 2011, 111, 113–137. [Google Scholar] [CrossRef]
- Blum, J.D.; Erel, Y. Rb-Sr isotope systematics of a granitic soil chronosequence: the importance of biotite weathering. Geochim. Cosmochim. Acta. 1997, 61, 3193–3204. [Google Scholar] [CrossRef]
- Borges, J.B.; Huh, Y.; Moon, S.; Noh, H. Provenance and weathering control on river bed sediments of the eastern Tibetan Plateau and the Russian Far East. Chem. Geol. 2008, 254, 52–72. [Google Scholar] [CrossRef]
- Boruah, R.; Laskar, J.J. Geochemical characteristics of Neogene sandstones of the East and West Siang Districts of Arunachal Pradesh, NE India: implications for source-area weathering, provenance, and tectonic setting. Geochim. Cosmochim. Acta. 2022, 41, 100–120. [Google Scholar] [CrossRef]
- Bracciali, L.; Marroni, M.; Pandol, B.L.; Rocchi, S.; Arribas, J.; Critelli, S.; Johnsson, M.J. Geochemistry and petrography of Western Tethys Cretaceous sedimentary covers (Corsica and Northern Apennines): From source areas to configuration of margins. Geol. Soc. Am. Spec. Paper. 2007, 420, 73–93. [Google Scholar]
- Chamley, H. Clay mineralogy; Clay mineralogy: Germany, 1989; Volume 623. [Google Scholar]
- Chougong, D.T.; Bessa, Z.E.; Ntyam, S.C.; Yongue, R.F.; Ngueutchoua, G.; Armstrong-Altrin, J.S. Mineralogy and geochemistry of Lob´ e River sediments, SW Cameroon: Implications for provenance and weathering. Journal of African Earth Sciences. 2021, 183, 104320. [Google Scholar] [CrossRef]
- Condie, K.C. Chemical composition and evolution of the upper continental crust: Contrasting results from surface samples and shales. Chemical Geology 1993, 104, 1–37. [Google Scholar] [CrossRef]
- Cox, R.; Lowe, D.R.; Cullers, R.L. The influence of sediment recycling and basement composition on evolution of mudrock chemistry in the southwestern United States. Geochim. Cosmochim. Acta. 1995, 59, 2919–2940. [Google Scholar] [CrossRef]
- Cullers, R.L. The controls on the major and trace element variation of shales, siltstones, and sandstones of Pennsylvanian-Permian age from uplifted continental blocks in Colorado to platform sediment in Kansas, USA. Geochimica et Cosmochimica Acta. 1994, 58, 4955–4972. [Google Scholar] [CrossRef]
- Cullers, R. The geochemistry of shales, siltstones and sandstones of Pennsylvanian–Permian age, Colorado, USA: Implications for provenance and metamorphic studies. Lithos. 2000, 51, 181–203. [Google Scholar] [CrossRef]
- Cullers, R.L. Implications of elemental concentrations for provenance, redox conditions, and metamorphic studies of shales and limestones near Pueblo, Co, USA; Chem. Geol. 2002, 191, 305–327. [Google Scholar]
- Desai, A.G; Arolkar, D.B.; French, D.; Viegas, A.; Vishwanath, T.A. Petrogenesis of the Bondla layered mafic-ultramafic complex Usgaon, Goa. J Geo Soc India. 2009, 73, 697–714. [Google Scholar] [CrossRef]
- Dhoundial, D.P.; Paul, D.K.; Sarkar, A.; Trivedi, J.R.; Gopalan, K.; Potts, P.J. Geochronology and geochemistry of the precambrian granitic r ocks of Goa, SW India. J Precam Res. 1987, 36, 287–302. [Google Scholar] [CrossRef]
- Du, D.D.; Chen, L.Q.; Bai, Y.H.; Hu, H.P. Variations in rare earth elements with environmental factors in lake surface sediments from 17 lakes in western China. J Mt Sci. 2021, 18, 7. [Google Scholar] [CrossRef]
- Fedo, C.M.; Wayne Nesbitt, H.; Young, G.M. Unraveling the effects of potassium metasomatism in sedimentary rocks and paleosols, with implications for paleoweathering conditions and provenance. Geology. 1995, 23, 921–924. [Google Scholar] [CrossRef]
- Fedo, C.M.; Eriksson, K.A.; Krogstad, E.J. Geochemistry of shales from the Archaean (*3.0 Ga) Buhwa greenstone belt, Zimbabwe: Implications for provenance and sourcearea weathering. Geochim. Cosmochim. Acta. 1996, 60, 1751–1763. [Google Scholar] [CrossRef]
- Folk, R.L. Petrology of the sedimentary rocks; Hemphills: Austin, TX, 1968; Volume 170. [Google Scholar]
- Garzanti, E.; Resentini, A. Provenance control on chemical indices of weathering (Taiwan river sands). Sed. Geol. 2016, 336, 81–95. [Google Scholar] [CrossRef]
- Gokul, A.R.; Srinivasan, M.D.; Gopalakrishnan, K.; Viswanathan, L.S. Stratig raphy and structure of Goa. Seminar volume on Earth resources for Goa’s development. Geo Surv of India 1985, 1–13. [Google Scholar]
- Gu, X.X.; Liu, J.M.; Zheng, M.H.; Tang, J.X.; Qt, L. Provenance and tectonic setting of the Proterozoic turbidites in Hunan, South China: Geochemical Evidence. J. Sedim. Res. 2002, 72, 393–407. [Google Scholar] [CrossRef]
- Guo, L.; Zhang, H.; Peng, X. Geochemistry and sedimentology of sediments in a short fluvial system, NW China: implications to the provenance and tectonic setting. Journal of Oceanology and Limnology. 2023, 41, 5–1706. [Google Scholar] [CrossRef]
- Gurumurthy, G.P. Geochemical split among the suspended and mud sediments in the Nethravati River: insights to compositional similarity of peninsular gneiss and the Deccan Basalt Derived sediments, and its implications on tracing the provenance in the Indian Ocean. Geochem Geophys Geosyst, 2024, 25, e2024GC011642. [Google Scholar] [CrossRef]
- Hayashi, K.I.; Fujisawa, H.; Holland, H.D.; Ohmoto, H. Geochemistry of~ 1.9 Ga sedimentary rocks from northeastern Labrador, Canada. Geochim. Cosmochim. Acta. 1997, 61, 4115–4137. [Google Scholar] [CrossRef]
- He, J.; Garzanti, E.; Dinis, P.; Yang, S.; Wang, H. Provenance versus weathering control on sediment composition in tropical monsoonal climate (South China) - 1. Geochemistry and clay mineralogy. Chem. Geol. 2020, 558, 119860. [Google Scholar] [CrossRef]
- Hossain, H.M.; Hasna Hossain, Q.; Kamei, A.; Araoka, D. Compositional variations, chemical weathering, and provenance of sands from the Cox’s Bazar and Kuakata beach areas, Bangladesh. Arabian J. Geosci. 2018, 11, 1–17. [Google Scholar] [CrossRef]
- Hossain, H.M. Major, trace, and REE geochemistry of the Meghna River sediments, Bangladesh: Constraints on weathering and provenance. Geological Journal. 2020, 55. [Google Scholar] [CrossRef]
- Jean, A.; Beauvais, A.; Chordon, D.; Arnaud, N.; Jayananda, M.; Mathe, P.E. Weathering history and landscape evolution of western ghats (India) from 40Ar/39Ar dating of supergene K–Mn oxides. J. Geol Soc. 2020, 177, 523–536. [Google Scholar] [CrossRef]
- Jin, W.; Cao, J.; Wu, J.; Wang, S. A Rb/Sr record of catchment weathering response to Holocene climate change in Inner Mongolia. Earth Surface Processes and Landforms 2005. [Google Scholar] [CrossRef]
- Kale, V. The Western Ghat: The Great Escarpment of India. 2009. [CrossRef]
- Kaotekwar, A.B.; Rajkumar, R.; Satyanarayana, M.; Keshav Krishna, A.; Charan, S.N. Structures, Petrography and Geochemistr y of Deccan Basalts at Anantagiri Hills, Andhra Pradesh. J Geol Soc India. 2014, 84, 675–685. [Google Scholar] [CrossRef]
- Kessarkar, P.M.; Rao, V.P.; Ahmad, S.M.; Babu, G.A. Clay minerals and Sr–Nd isotopes of sediments along the western margin of India and their implication for sediment provenance. Mar. Geol. 2003, 202, 55–69. [Google Scholar] [CrossRef]
- Kessarkar, P.M.; Suja, S.; Sudheesh, V. Iron ore pollution in Mandovi and Zuari estuarine sediments and its fate after mining ban. Envi ron Monit Assess. 2015, 187, 572. [Google Scholar] [CrossRef] [PubMed]
- Krishnan, M.S. Geology of India and Burma; Higgin Bothoms: Madras, 1968; Volume 536. [Google Scholar]
- Kump, L.R.; Brantley, S.L.; Arthur, M.A. Chemical weathering, atmospheric CO2 and climate. Annu. Rev. Earth Planet. Sci. 2000, 28, 611–667. [Google Scholar] [CrossRef]
- Lightfoot, P.C.; Hawkesworth, C.J.; Devey, C.W.; Rogers, N.W.; van Calsteren, P.W.C. Source and di¡erentia tion of Deccan Trap lavas: imp lications of geochemical and mineral chemical variations. J Petrol. 1990, 31, 1165–1200. [Google Scholar] [CrossRef]
- Liu, L.; Yu, K.; Li, A.; Zhang, C.; Wang, L.; Liu, X.; Lan, J. Weathering Intensity Response to Climate Change on Decadal Scales: A Record of Rb/Sr Ratios from Chaonaqiu Lake Sediments, Western Chinese Loess Plateau. Water 2007, 15, 10. [Google Scholar] [CrossRef]
- Liu, S.; Zhang, J.; Li, Q.; Zhang, L.; Wang, W.; Yang, P. Geochemistry and U-Pb zircon ages of metamorphic volcanic rocks of the Paleoproterozoic Lüliang Complex and constraints on the evolution of the Trans-North China Orogen, North China Craton. Precambr. Res. 2012, 222, 173–190. [Google Scholar] [CrossRef]
- Lupker, M.; France-Lanord, C.; Galy, V.; Lav´ e, J.; Kudrass, H. Increasing chemical weathering in the Himalayan system since the Last Glacial Maximum. Earth Planet. Sci. Lett. 2013, 365, 243–252. [Google Scholar] [CrossRef]
- Maharana, C.; Srivastava, D.; Tripathi, J.K. Geochemistry of sediments of the Peninsular rivers of the Ganga basin and its implication to weathering, sedimentary processes and provenance. Chem. Geol. 2018, 483, 1–20. [Google Scholar] [CrossRef]
- Mallik, T.K.; Vasudevan, V.; Verghese, P.A.; Machado, T. The black sand placer deposits of Kerala, Southwest India. Mar Geol. 1987, 77, 129–150. [Google Scholar] [CrossRef]
- Martin, F.J.; Doyne, H.C. Laterite and lateritic soils in Sierra Leone. J Agr Sci. 1927, 17, 530–547. [Google Scholar] [CrossRef]
- Mascarenhas, A.; Kalavampara, G. Natural resources of Goa: a geological perspective. Geological Society of Goa, Miramar 2009, 213. [Google Scholar]
- McLennan, S.M.; Taylor, S.R. Th and U in sedimentary rocks: Crustal evolution and sedimentary recycling. Nature. 1980, 285, 621–624. [Google Scholar] [CrossRef]
- McLennan, S.M. Rare earth elements in sedimentary rocks: Influence of provenance and sedimentary processes. Reviews in Mineralogy. 1989, 21, 169–200. [Google Scholar]
- McLennan, S.M.; Taylor, S.R.; McCulloch, M.T.; Maynard, J.B. Geochemistry and Nd–Sr isotopic composition of deepsea turbidites: crustal evolution and plate tectonic associations. Geochim. Cosmochim. Acta. 1990, 54, 2014–2050. [Google Scholar] [CrossRef]
- McLennan, S.M.; Hemming, S.; McDaniel, D.K.; Hanson, G.N. Geochemical approaches to sedimentation, prove nance and tectonics. In: Johnsson JM, Basu A (eds) Processes controlling the composition of clastic sediments. Geol Soc Am, USA 1993, 284, 1–21. [Google Scholar]
- Naidu, A.S.; Mowatt, T.C.; Somayajulu, B.L.K.; Sreeramachandra Rao, K. Characteristics of clay minerals in the bed loads of major rivers of India. In: Degens, E.T., Kempe, S., Herrera, R. (Eds.), Transport of Carbon and Minerals in Major World Rivers, Pt.3. Mitt. Geol.-Paläont Inst. Univ., Scope/Unep Sonderbd, Hamburg. 1985, 58, 559–568. [Google Scholar]
- Naqvi, S.M. Geology and evolution of the Indian plate (from Hadean to Holocene 4 Ga to 4 Ka); Capital Publishing Company: New Delhi, 2005; Volume 450. [Google Scholar]
- Narayanaswamy, S. Geochemistry and genesis of laterite in parts of Cannanore District, North Kerala. PhD Thesis, Cochin University of Science and Technology, 1992. [Google Scholar]
- Nesbitt, H.w.; Young, G.M. Early Proterozoic climates and plate motions inferred from major element chemistry of lutites. Nature 1982, 299, 715–717. [Google Scholar] [CrossRef]
- Nesbitt, H.W.; Young, G.M. Petrogenesis of sediments in the absence of chemical weathering: effects of abrasion and sorting on bulk composition and mineralogy. Sediment 1996, 43, 341–358. [Google Scholar] [CrossRef]
- Nesbitt, H.W.; Markovics, G. Weathering of granodiorite crust, long-term storage of elements in weathering profiles, and petrogenesis of siliciclastic sediments. Geochim Cosmochim Acta. 1997, 6, 1653–1670. [Google Scholar] [CrossRef]
- Pourmand, A.; Dauphas, N.; Ireland, T.J. A novel extraction chromatography and MC–ICP–MS technique for rapid analysis of REE, sc and Y: revising CI-chondrite and post-archean Australian Shale (PAAS) abundances. Chem Geol. 2012, 291, 38–54. [Google Scholar] [CrossRef]
- Prajith, A.; Rao, V.P.; Kessarkar, P.M. Controls on the distri bution and fractionation of yttrium and rare earth elements in core sedimen ts from the Mandovi estuary, western India. Cont Shelf Res. 2015, 92, 59–71. [Google Scholar] [CrossRef]
- Price, J.R.; Velbel, M.A. Chemical weathering indices applied to weathering profiles developed on heterogeneous felsic metamorphic parent rocks. Chemical Geology 2003, 202, 397–416. [Google Scholar] [CrossRef]
- Pourret, O.; Davranche, M. Rare earth element sorption onto hydrous manganese oxide: a modeling study. J Colloid Interface Sci. 2013, 395, 18–23. [Google Scholar] [CrossRef]
- Radhakrishna, B.P. Archaean granite-greenstone terrain of south Indian shield. In: Naqvi SM, Rogers JJW (eds) Precambrian of South India, Geol Soc India Memoir, 1983, 4, 1–46. [Google Scholar]
- Rahman, Md.A.; Das, S.C.; Pownceby,M. I.; Alam, Md.S.; Zaman, M.N. Geochemistry of Recent Brahmaputra River Sediments: Provenance, Tectonics, Source Area Weathering and Depositional Environment. Minerals 2020, 10, 813. [Google Scholar] [CrossRef]
- Ramesh, R.; Subramanian, V.; Van Grieken, R.; Van’t Dack, L. The elemental chemistry of sediments in the Krishna River basin, India. Chem. Geol. 1989, 74, 331–341. [Google Scholar] [CrossRef]
- Rao, K.L. India’s water wealth. Orient Longman Ltd., New Delhi, 1975; 255. [Google Scholar]
- Rao, V.P.; Rao, B.R. Provenance and distribution of clay minerals in the continental shelf and slope sediments of the west coast of India; Cont. Shelf Res. 1995, 15 1757–1771.
- Rao, V.P.; Wagle, B.G. Geomorphology and surBcial geology of the western continental shelf and slope of India: A review. Curr. Sci. 1997, 73, 330–350. [Google Scholar]
- Roser, B.P. Whole-rock geochemical studies of clastic sedimentary suites. Memoirs of the Geological Society of Japan 2000, 57. [Google Scholar]
- Roser, B.P.; Korsch, R.J. Determination of tectonic setting of sandstone-mudstone suites using SiO2 content and K2O/Na2O ratio. J. Geol. 1986, 94, 635–650. [Google Scholar] [CrossRef]
- Roser, B.P.; Korsch, R.J. Provenance signatures of sandstone-mudstone suites determined using discriminant function analysis of major-element data. Chem. Geol. 1988, 67, 119–139. [Google Scholar] [CrossRef]
- Roy, D.K.; Roser, B.P. Geochemical evolution of the Tertiary succession of the NW shelf, Bengal basin, Bangladesh: Implications for provenance, paleoweathering and Himalayan erosion. J. Asian Earth Sci. 2013, 78, 248–262. [Google Scholar] [CrossRef]
- Rudnick, R.L.; Gao, S.; Holland, H.D.; Turekian, K.K. Composition of the continental crust. The Crust. 2003, 3, 1–64. [Google Scholar]
- Saha, A.; Roy, D.K.; Idris, A.M.; Khan, R.; Biswas, P.K.; Ornee. T.I.; Tami. Provenance, weathering, climate and tectonic setting of Padma River sediments, Bangladesh: A geo chemical approach. Catena. 2023, 233, 107485. [Google Scholar] [CrossRef]
- Sahoo, P.K.; Guimar, J.T.F.; Souza-Filho, P.W.M.; Sousa da Silva, M.; Nascimento, W.; Powell, M.A., Jr.; Reis, L.S.; Pessenda, L.C.R.; Rodrigues, T.M.; Fonseca da, Silva, D. ; Eliodoro Costa, V.Geochemical characterization of the largest upland lake of the Brazilian Amazonia: Impact of provenance and processes. J. South Am. Earth Sci. 2017, 80, 541–558. [Google Scholar] [CrossRef]
- Sai Babu, Sk.; Ramana, R.V.; Rao, V.P.; Rammohan, M.; Krishna, A.K.; Sawant, S.; Satyasree, N.; Krishna, A.K. Composition of the peninsular India rivers average clay (PIRAC): a reference sediment composition for the upper crust from peninsular India. J. Earth Syst. Sci. 2020, 129, 39. [Google Scholar] [CrossRef]
- Sai Babu, Sk.; Prajith, A.; Rao, V.P.; Rammohan, M.; Ramana, R.V.; Satyasree, N.S. Composition of river sediments from Kerala, southwest India: Inferences on lateritic weathering. J Earth Syst Sci. 2023, 132, 150. [Google Scholar] [CrossRef]
- Saibabu, Sk.; Rao, V.P.; Satyasree, N.; Ramana, R. V.; Rammohan, M.; and Sawant, S. Mineralogy and geochemistry of the sediments in rivers along the east coast of India: Inferences on weathering and provenance. J. Earth Syst. Sci. [CrossRef]
- Sai Babu, Sk.; Rao, V.P.; Rammohan, M. Controls on the distribution and fractionation of rare earth elements in recent sediments from the rivers along the west coast of India. Environmental Earth Sci. 2024, 83, 547. [Google Scholar] [CrossRef]
- Selvaraj, K.; Chen, C.T.A. Moderate chemical weathering of subtropical Taiwan: constraints from solid-phase geochemistry of sediments and sedimentary rocks. J. Geol. 2006, 114, 101–116. [Google Scholar] [CrossRef]
- Sensarma, S.; Rajamani, V.; Tripathi, J.K. Petrography and geochemical characteristics of the sediments of the small River Hemavati, Southern India: implication for provenance and weathering processes. Sed. Geol. 2008, 205, 111–125. [Google Scholar] [CrossRef]
- Sharma, A.; Rajamani, V. Weathering of charnockite and sediment production in the catchment area of the Cauvery River, southern India. Sed. Geol. 2001, 143, 169–184. [Google Scholar] [CrossRef]
- Sharma, A.; Sensarma, S.; Kumar, K.; Khanna, P.P.; Saini, N.K. Mineralogy and geochemistry of the Mahi River sediments in tectonically active western India: implications for Deccan large igneous province source, weathering and mobility of elements in a semi-arid climate. Geochim Cosmochim Acta. 2013, 104, 63–83. [Google Scholar] [CrossRef]
- Schellmann, W. A new definition of laterites. Geol. Surv. India Memoir 1986, 120, 1–7. [Google Scholar]
- Shynu, R.; Rao, V.P.; Kessarkar, P.M.; Rao, T.G. Rare earth elements in suspended and bottom sediments of the Mandovi estuary, central west coast of India: influence of mining. Estu Coast Shelf Sci. 2011, 94, 355–368. [Google Scholar] [CrossRef]
- Shynu, R.; Rao, V.P.; Parthiban, G.; Balakrishnan, S.; Narvekar, T.; Kessarkar, P.M. REE in suspended particulate matter and sediment of the Zuari estuary and adjacent shelf, western India: influence of mining and estuarine turbidity. Mar Geol. 2013, 346, 326–342. [Google Scholar] [CrossRef]
- Shynu, R.; Rao, V.P.; Kessarkar, P.M. Major and trace metals in suspended and bottom sediments of the Mandovi and Zuari estuaries: d istribution, source and pollution. Environ Sci Pollut Res. 2017. [Google Scholar] [CrossRef]
- Singh, P.; Rajamani, V. REE geochemistry of recent clastic sediments from the Kaveri Flood plains, southern India: implication to so urce area weathering and sedimentary processes. Geochim Cosmochim Acta. 2001, 65, 3093–3108. [Google Scholar] [CrossRef]
- Viers, J.; Dupré, B.; Raun, J.J.; Deberdt, S.; Angeletti, B.; Ngoupa, J.N.; Michard, A. Major and trace element abundances, and strontium isotopes in the Nyong basin rivers (Cameroon): constraints on chemical weathering processes and elements transport mechanisms in humid tropical environments. Chem. Geol. 2000, 169, 1–241. [Google Scholar] [CrossRef]
- Soman, K. Geology of Kerala, 2nd edn; Geological Society of India: Bangalore, 2002; Volume 335. [Google Scholar]
- Sreenath, A.V.; Abhilash, S.; Vijaykumar, P. West coast of India’s rainfall is becoming more convective. J. Clim Atmos Sci. 2022, 5. [Google Scholar] [CrossRef]
- Suja, S.; Lina, F.; Rao, V.P. Distribution and fractionation of rare earth elements and Yttrium in suspended and bottom sediments of the Kali estuary, western India. Environ Earth Sci. 2017, 76, 174. [Google Scholar] [CrossRef]
- Subramanian, V.; Van’t Dack, L.; Van Grieken, R. Chemical composition of river sediments from the Indian subcontinent. Chem. Geol. 1985, 48, 271–279. [Google Scholar] [CrossRef]
- Taylor, S.R.; McLennan, S.M. The continental crust: Its composition and evolution. Blackwell Scientific Publications, Palo Alto, CA, USA, Malden, 1985; 312. [Google Scholar]
- Wampler, J.W.; Krogstad, E.J.; Elliott, W.C.; Kahn, B.; Kaplan, D.J. Long-term selective retention of natural Cs and Rb by highly weathered coastal plain soils. Environm. Sci. Tech. 2012, 46, 3837–3843. [Google Scholar] [CrossRef] [PubMed]
- Widdowson, M.; Cox, K.G. Uplift and erosion history of the Deccan traps, India: evidence from laterites and drainage patterns of the western ghats and Konkan Coast. Earth Planet Sci Lett. 1996, 137, 57–69. [Google Scholar] [CrossRef]
- Wronkiewicz, D.J.; Condie, K.C. Geochemistry and provenance of sediments from the Pongola Supergroup, South Africa: evidence for a 3.0-Ga-old continental craton. Geochimica et Cosmochimica Acta. 1989, 53, 1537–1549. [Google Scholar] [CrossRef]
- Xu, H.; Liu, B.; Wu, F. Spatial and temporal variations of Rb/Sr ratios of the bulk surface sediments in Lake Qinghai. Geochemical Transactions. 2010, 11–3. [Google Scholar] [CrossRef]
- Yang, S.Y.; Jung, H.S.; Li, C.X. Two unique weathering regimes in the Changjiang and Huanghe drainage basins: geochemical evidence from river sediments. Sedimentary Geology 2004, 164, 19–34. [Google Scholar] [CrossRef]
Figure 1.
Map of the West Coast of India. Rivers investigated in this study are numbered. Dots mark the sample location in each river. Location of the Western Ghats along the coast and basic geology of western India are also shown in the map. States and state boundaries are marked. Major rivers (Narmada and Tapi) are also shown.
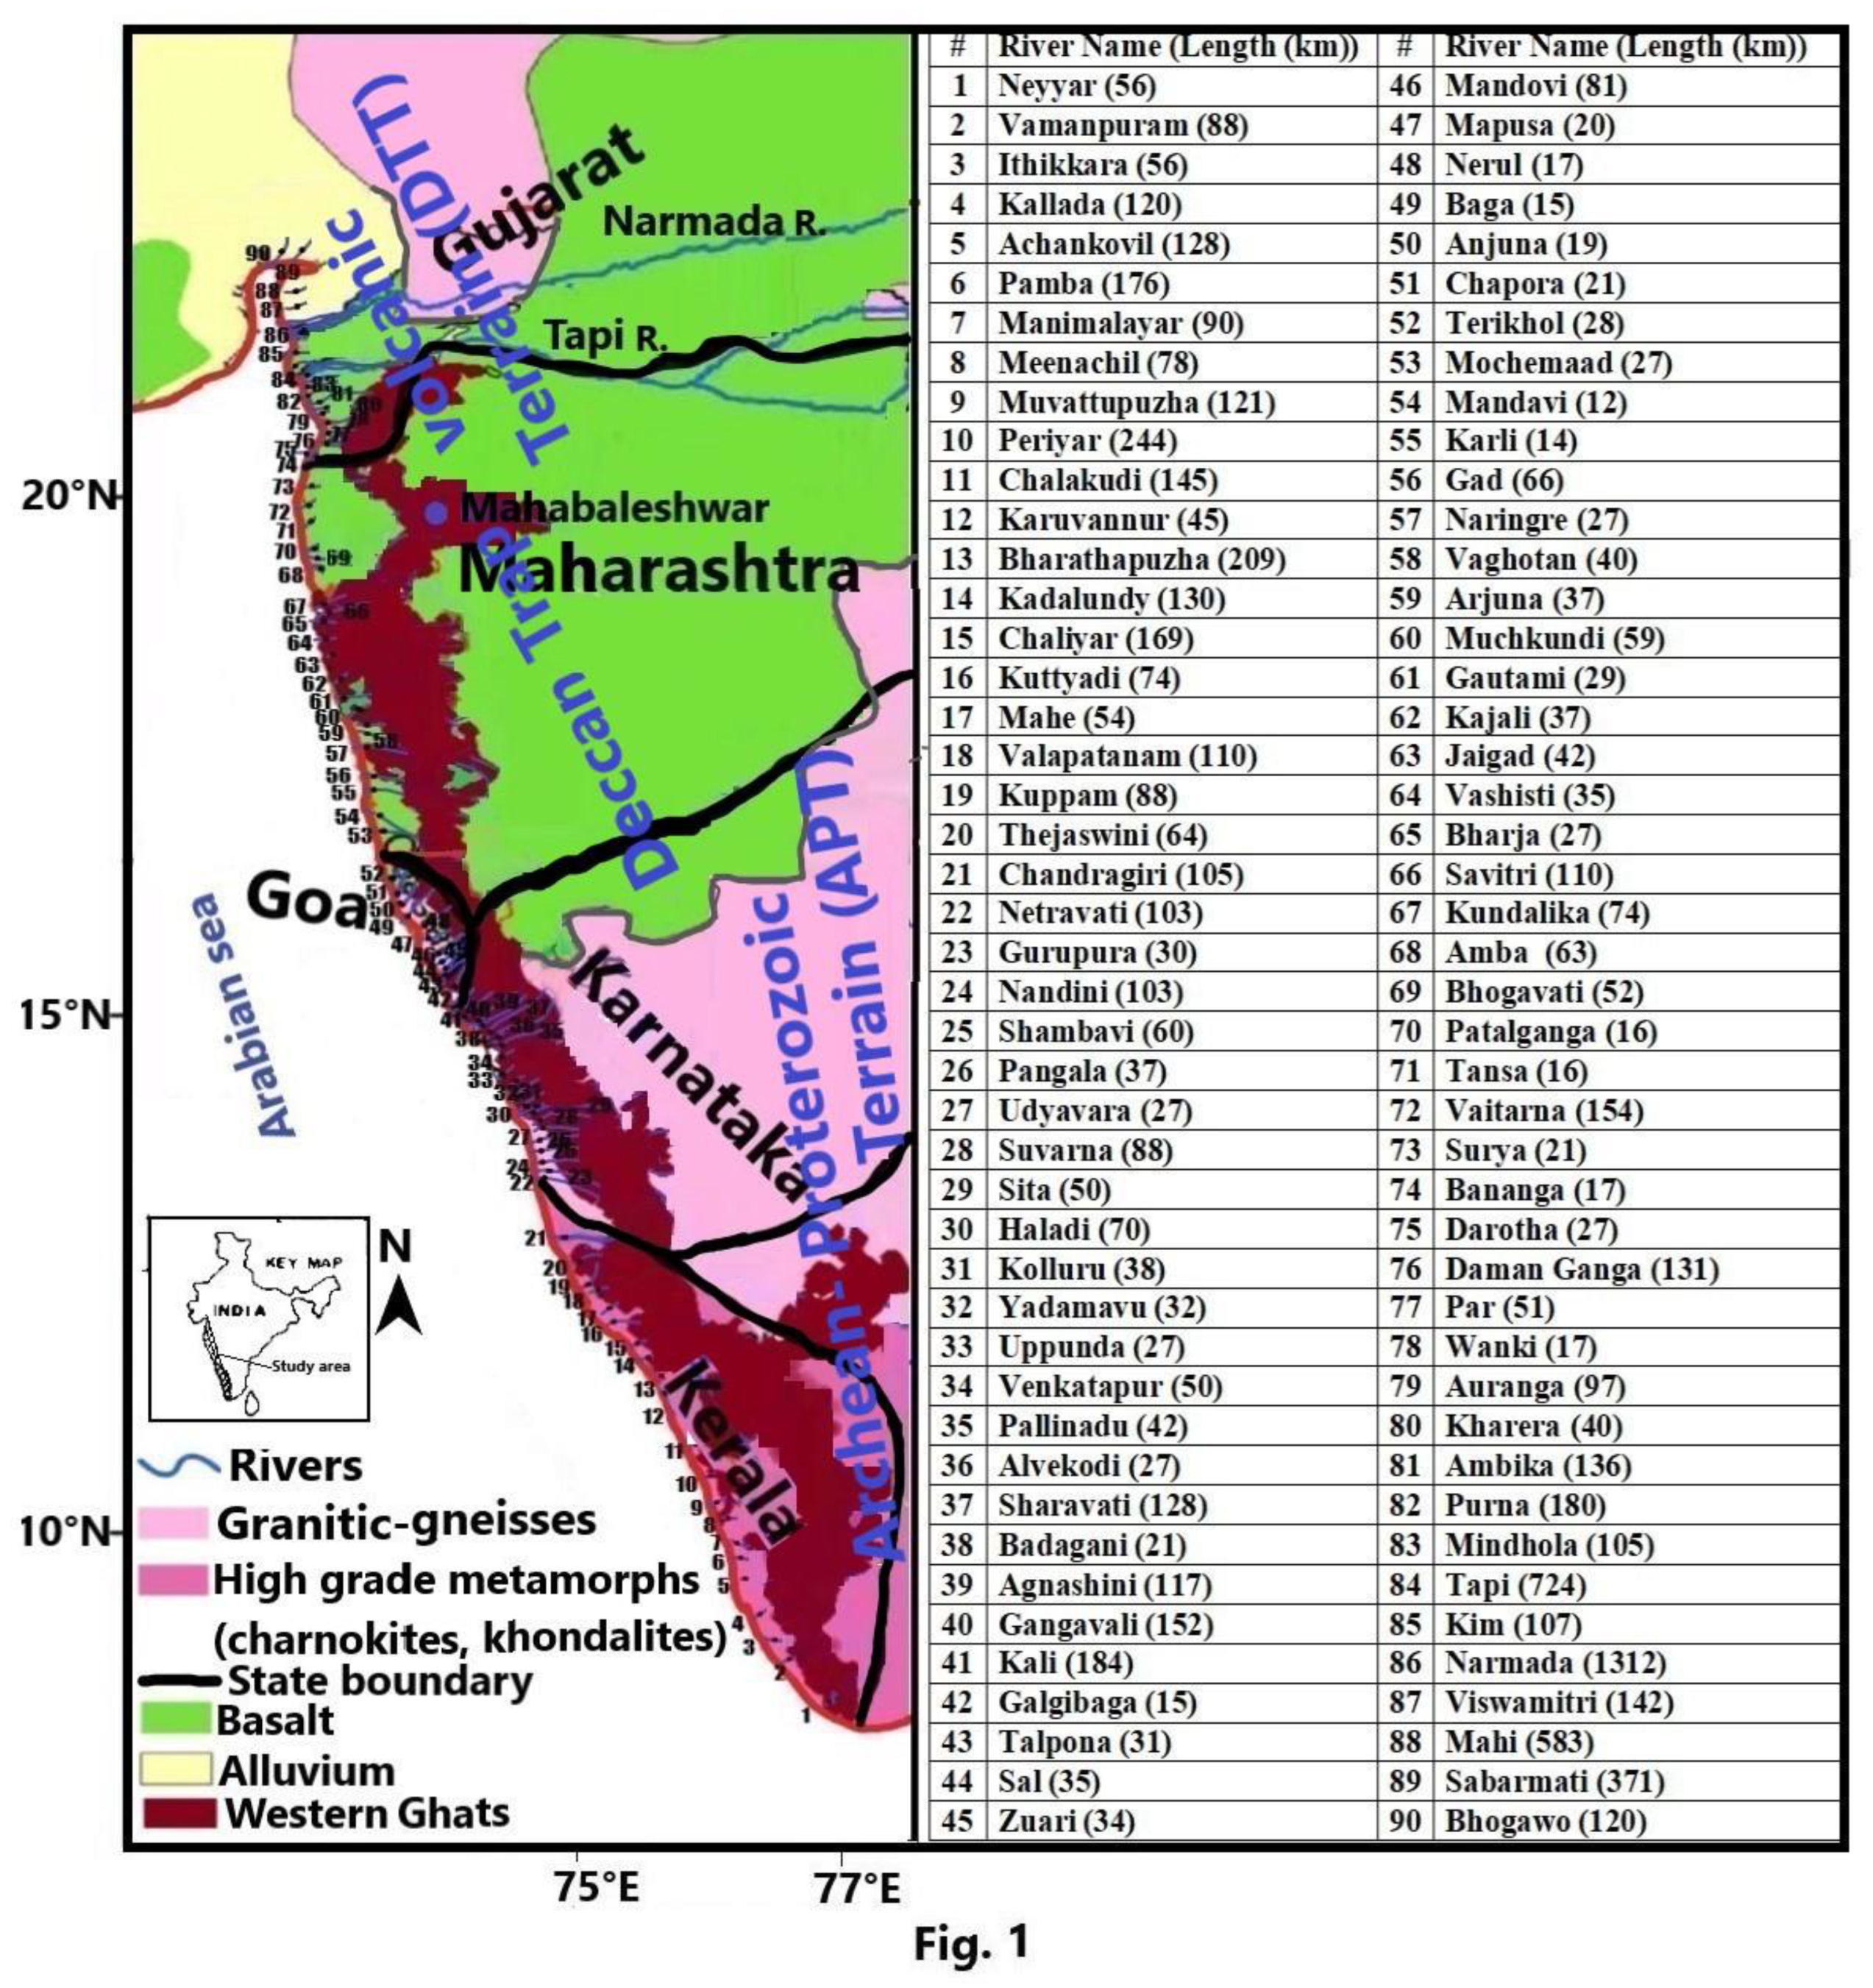
Figure 2.
Selected X-ray diffractograms of the clay fraction of sediments. S—smectite, K—kaolinite, I—illite, C—chlorite, Gi—gibbsite, Go—goethite, Q—quartz and F—feldspar.
Figure 2.
Selected X-ray diffractograms of the clay fraction of sediments. S—smectite, K—kaolinite, I—illite, C—chlorite, Gi—gibbsite, Go—goethite, Q—quartz and F—feldspar.
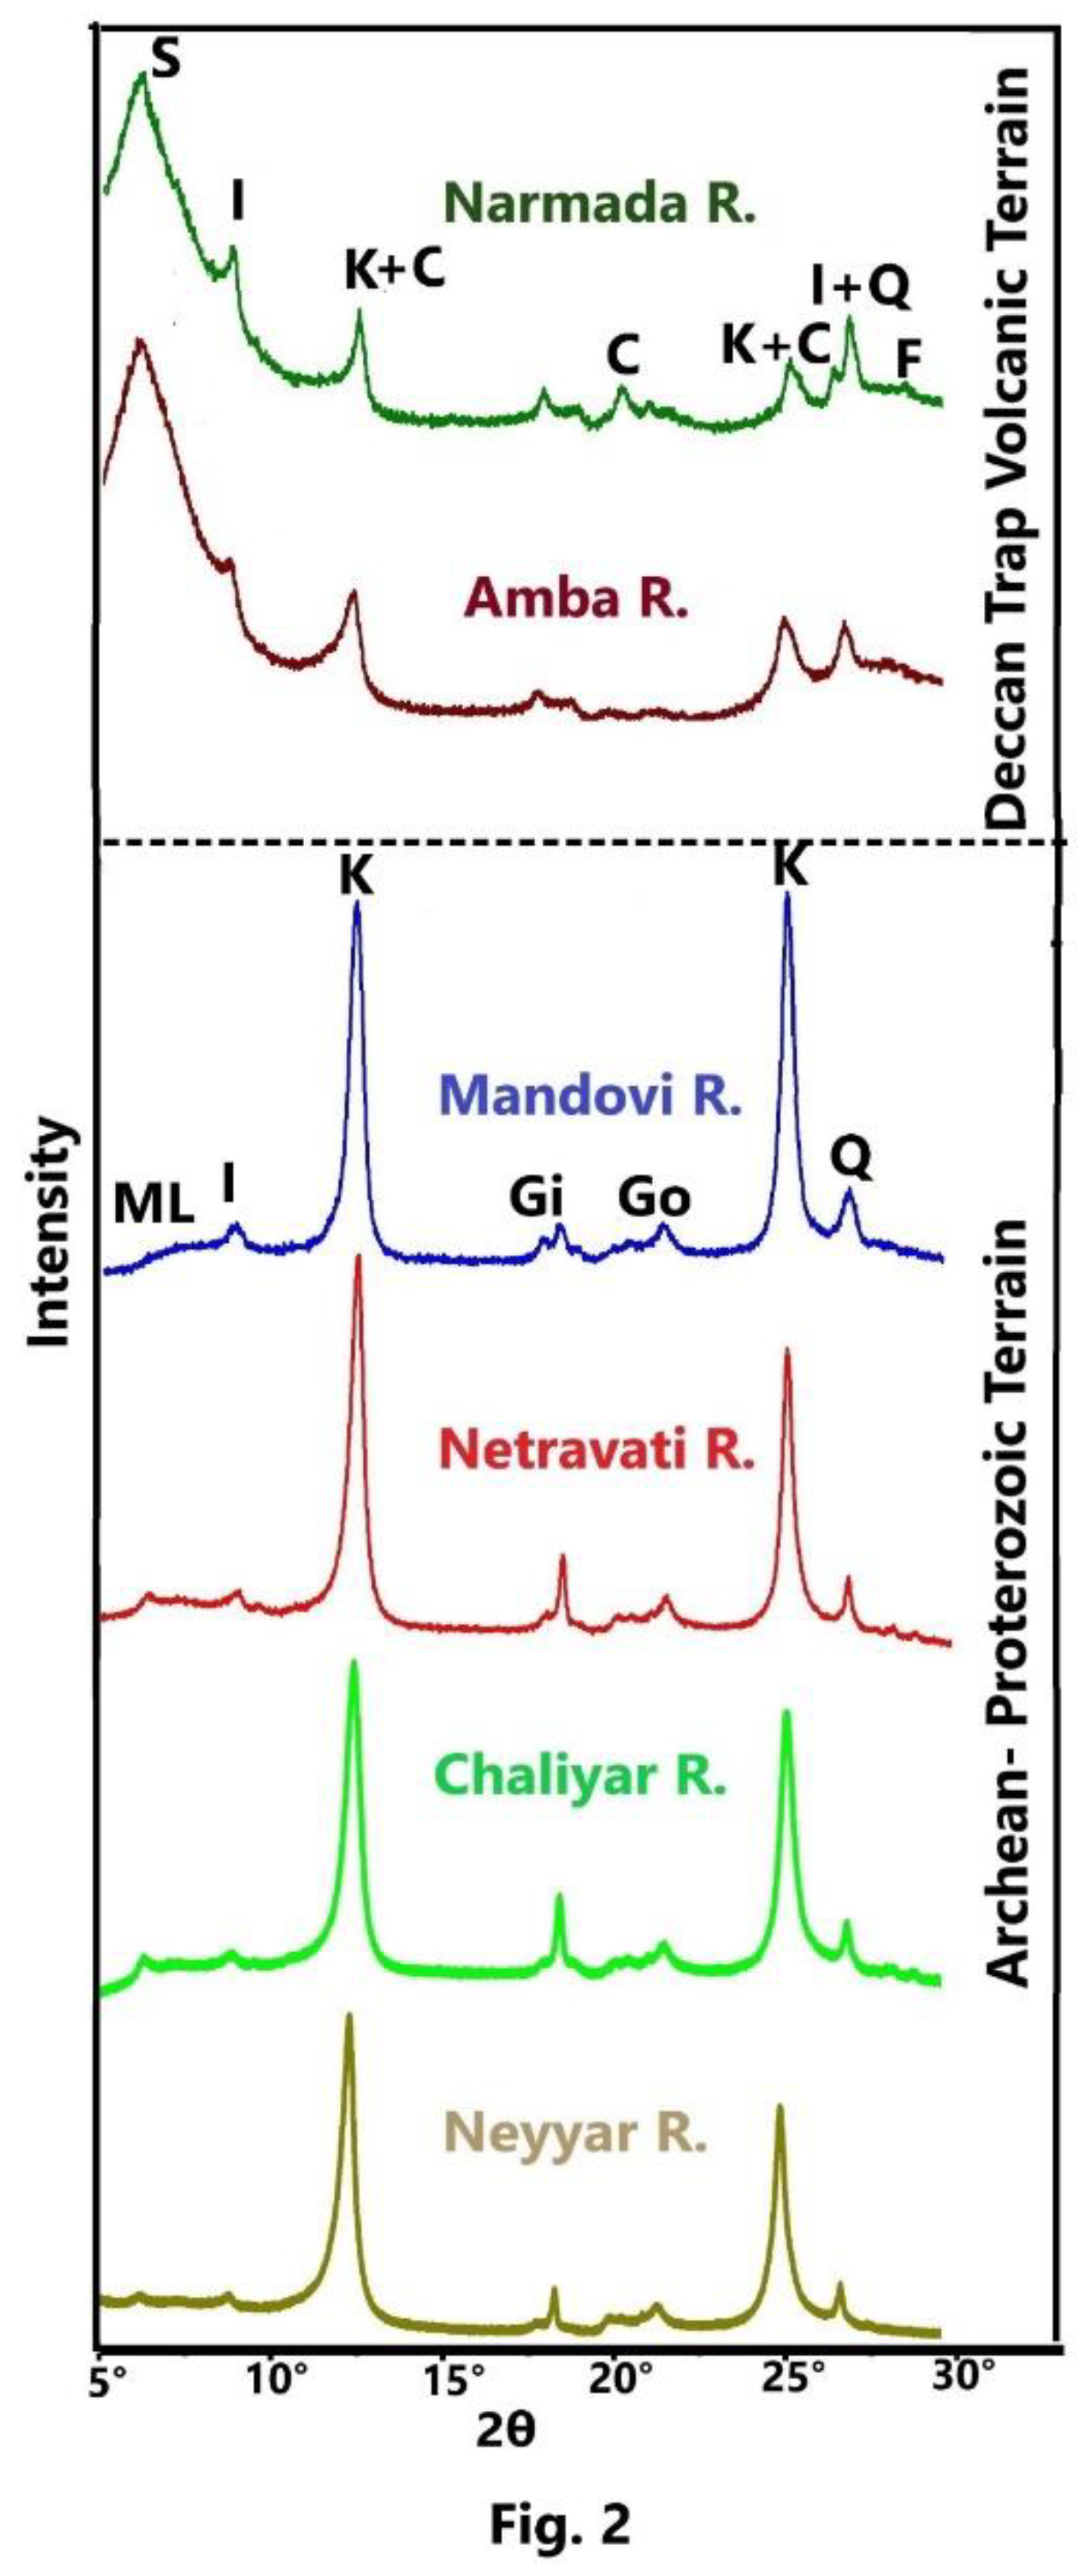
Figure 3.
Post Archean average Australian Shale (PAAS) – normalized distribution of major element oxides in the clay and silt fractions of sediments in the rivers from each state.
Figure 3.
Post Archean average Australian Shale (PAAS) – normalized distribution of major element oxides in the clay and silt fractions of sediments in the rivers from each state.
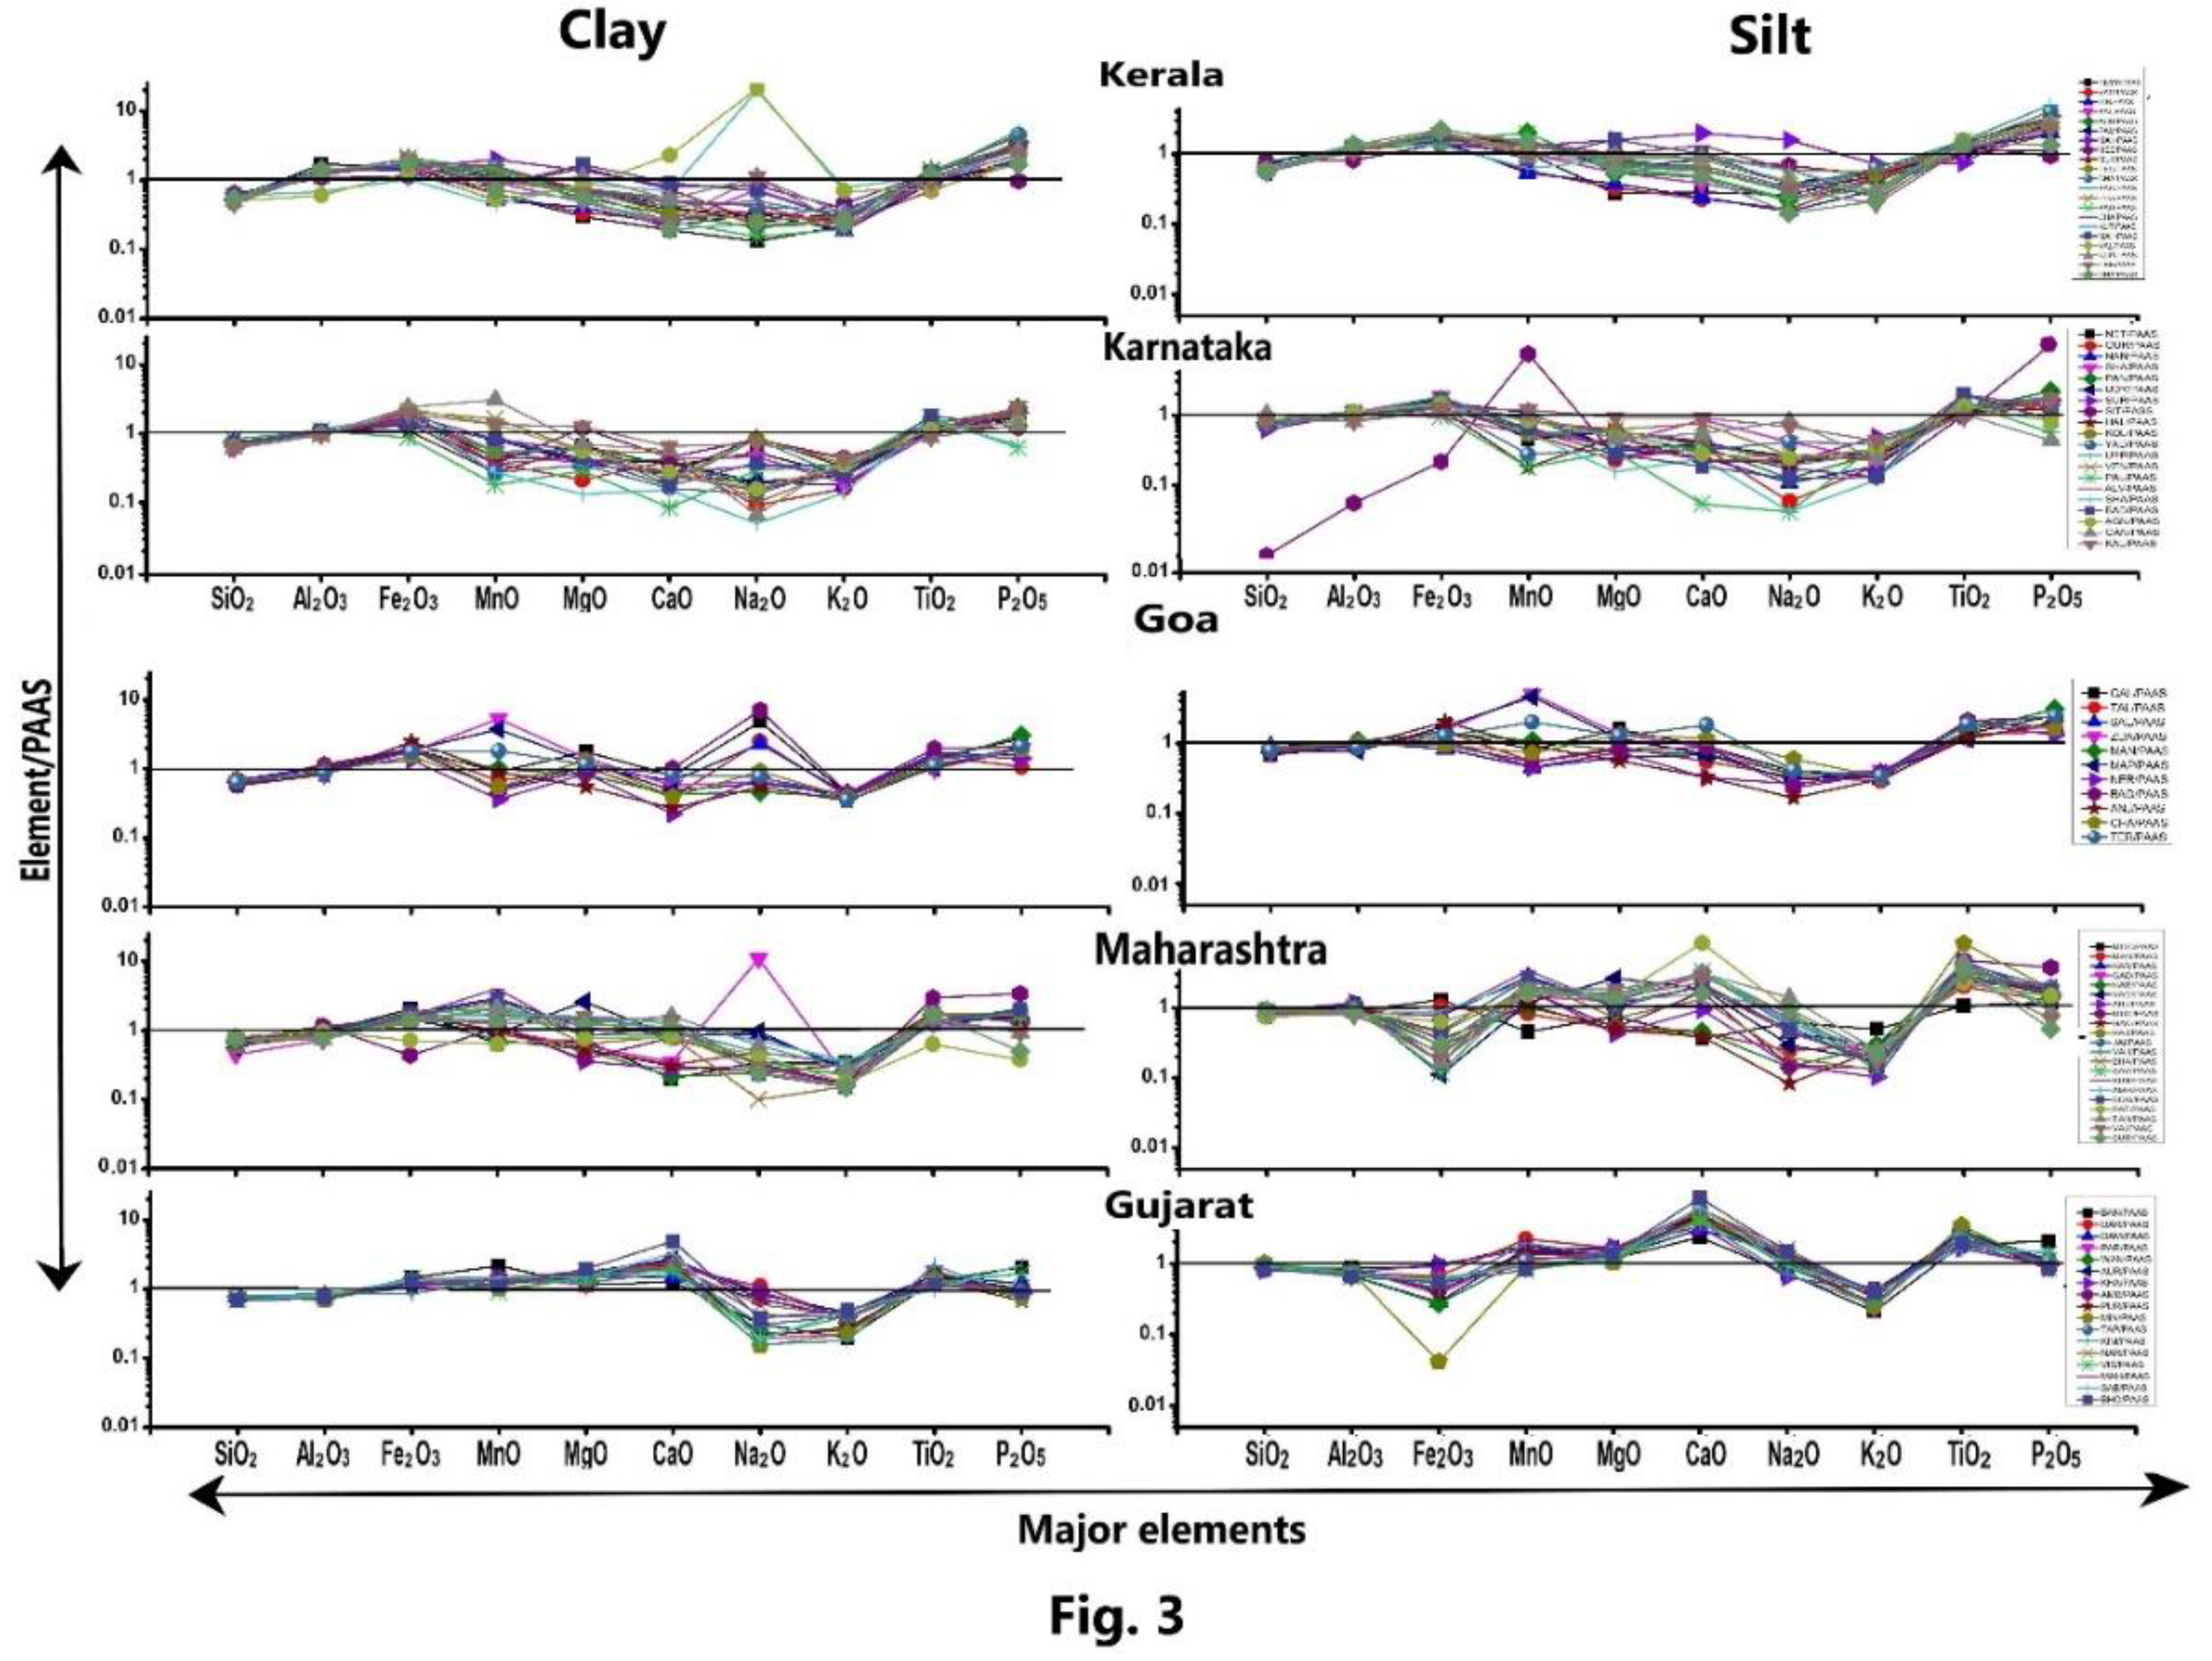
Figure 4.
Ternary diagrams showing (A) the plots of Al2O3–(CaO+Na2O)–K2O along with chemical index of alteration (CIA) (after Nesbitt and Young, 1982) and (B) (Al2O3– K2O)-CaO-Na2O along with plagioclase index of alteration (PIA) (after Fedo et al., 1995, 1996). (C) Plot of chemical index of alteration (CIA) vs index of chemical variability (ICV) (after Cox et al., 1995), (D) Tetrahedral plot of AF–CN–K–M ((Al2O3+Fe2O3)–(CaO+Na2O)–(K2O)–(MgO)) (modified after Babechuk and Fedo, 2022), (E) Tetrahedral plot of A–CN–K–FM ((Al2O3)–(CaO+Na2O)–(K2O)–(FeO+MgO)) (modified after Babechuk and Fedo, 2022). (F) Ternary plot of S–A–F (SiO2– Al2O3–Fe2O3) showing the degree of lateritisation and Index of lateritisation (IOL) (modified after Schellmann, 1986; Babechuk et al., 2014).
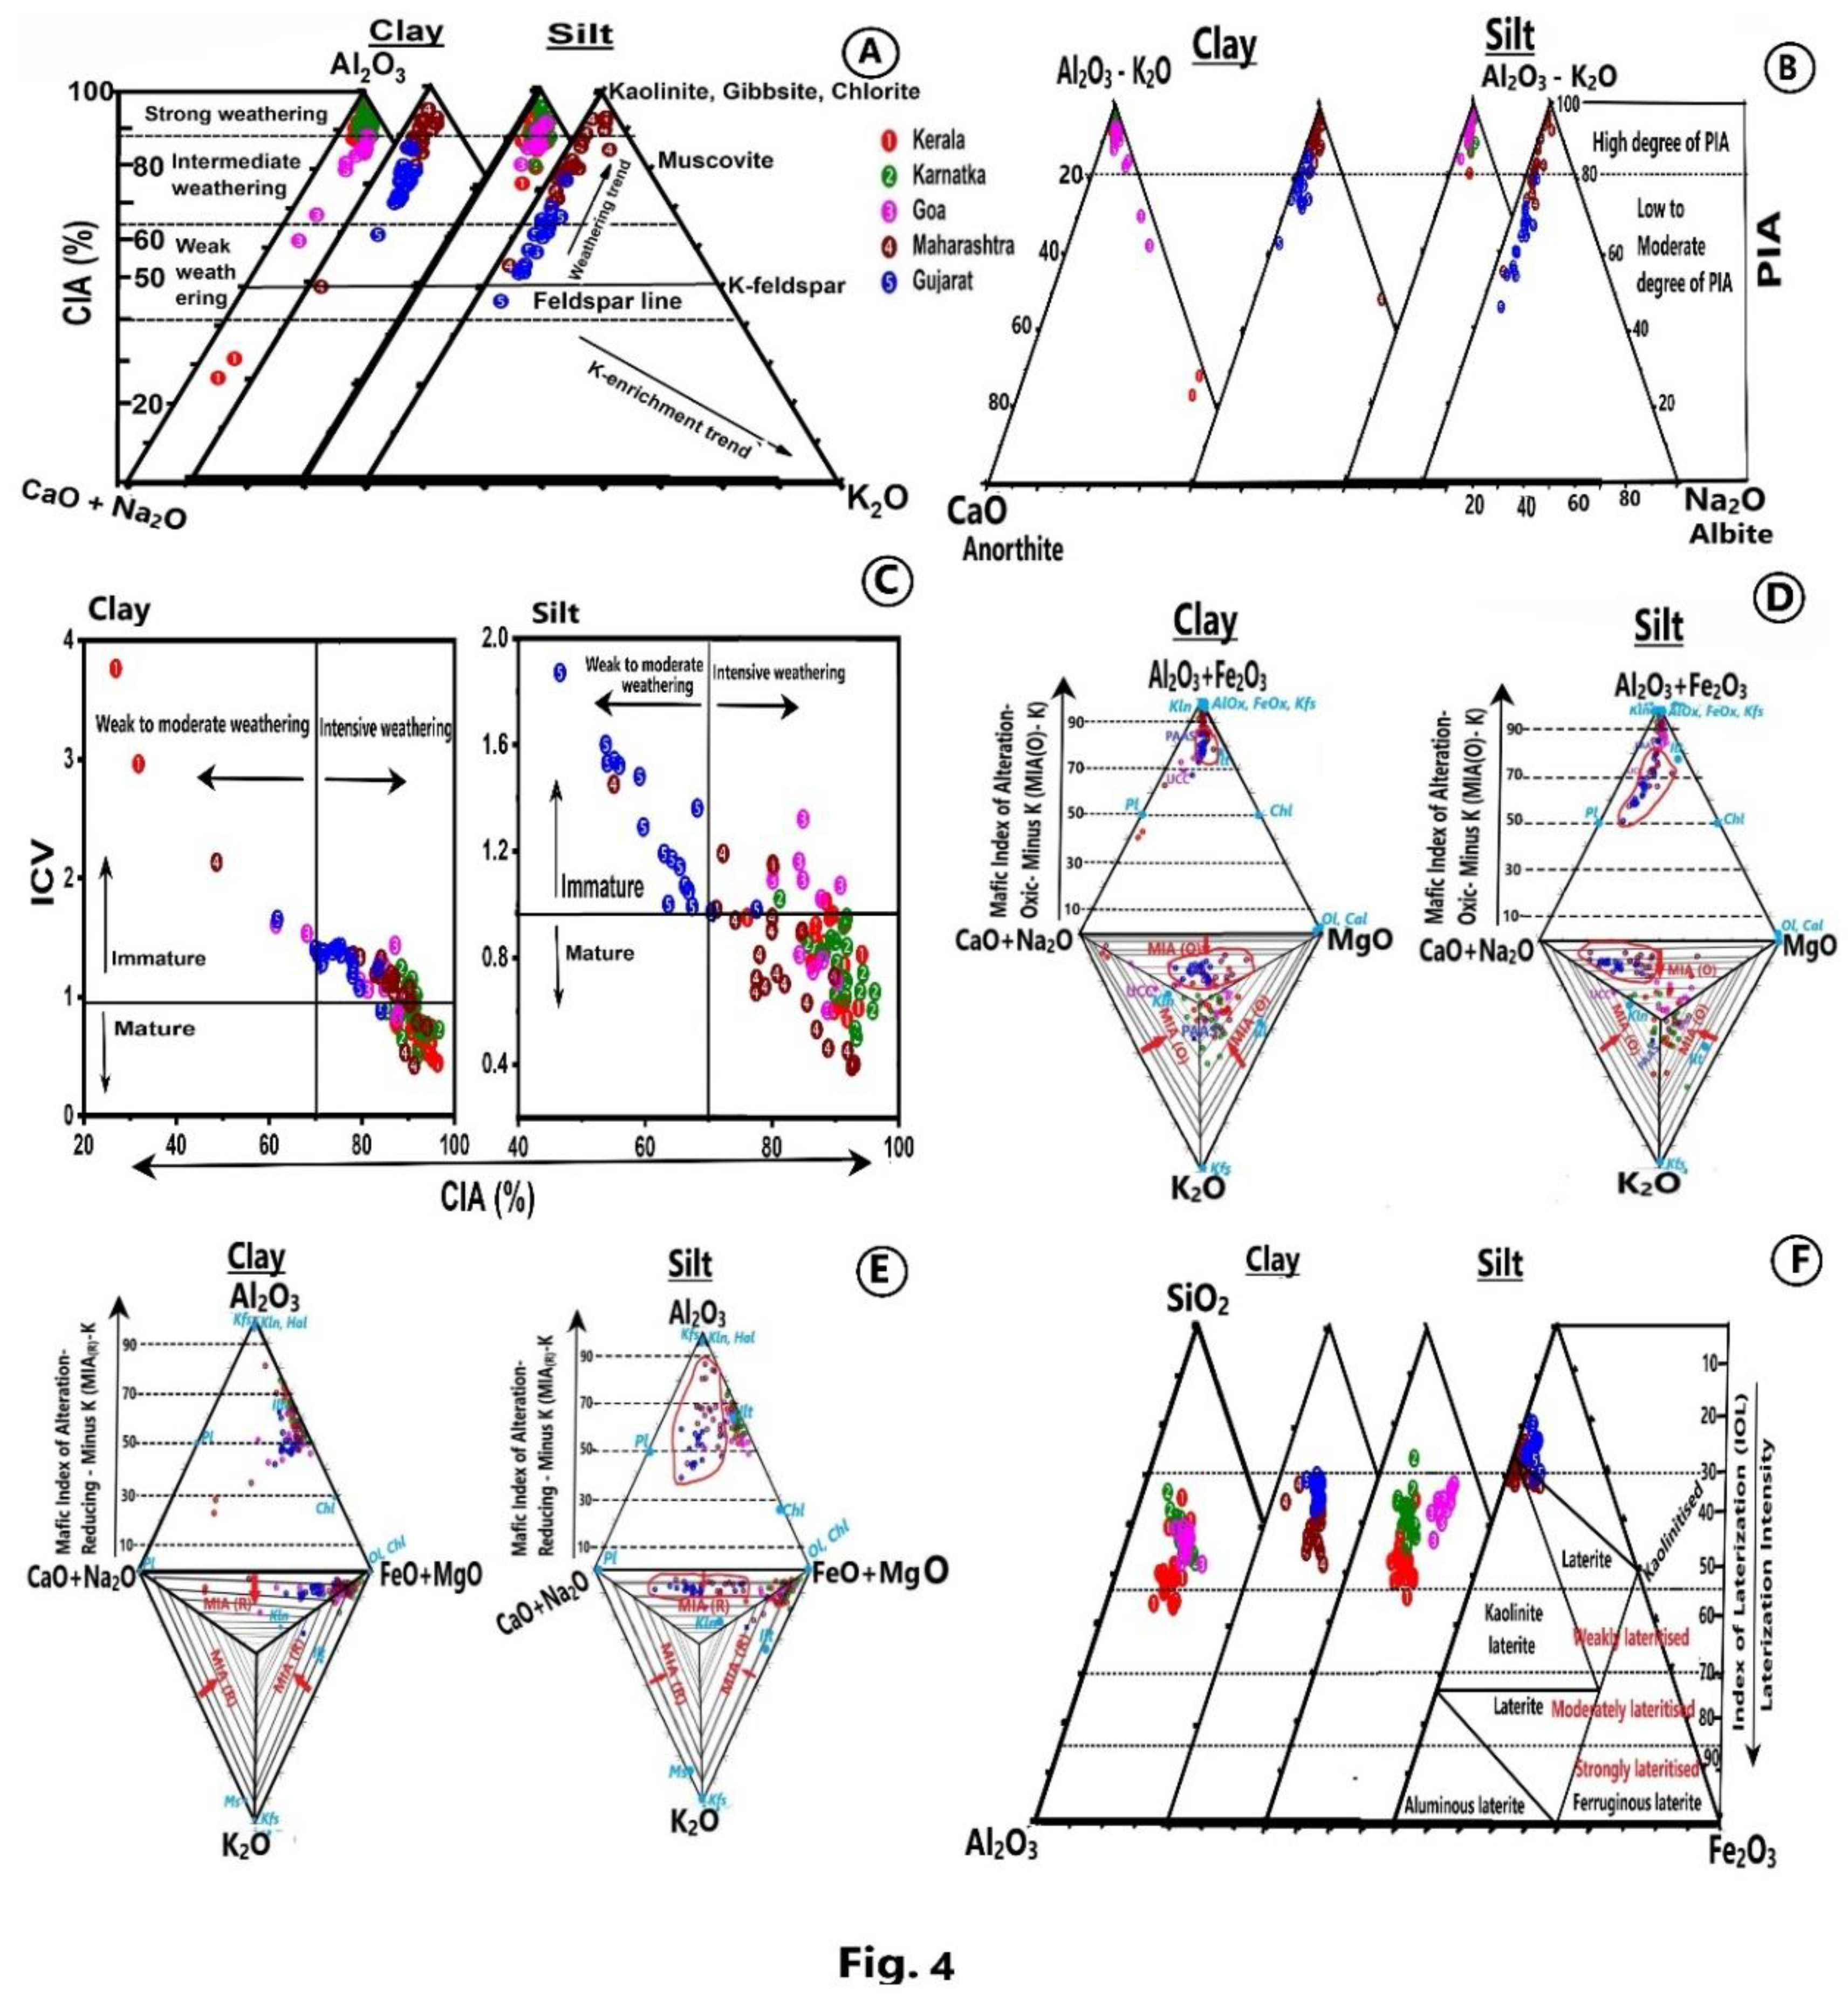
Figure 5.
Post Archean average Australian Shale (PAAS) – normalized distribution of trace elements in the clay and silt fractions of sediments in the rivers from each state.
Figure 5.
Post Archean average Australian Shale (PAAS) – normalized distribution of trace elements in the clay and silt fractions of sediments in the rivers from each state.

Figure 6.
(A) The total trace element content (∑TE) and (B) total rare earth element content (∑REE), (C) Th/U, (D) Co/La, (E) Cr/Th, (F) Co/Th and (G) Th/Sc ratios in the clay and silt fractions of sediments in the rivers along the west coast of India.
Figure 6.
(A) The total trace element content (∑TE) and (B) total rare earth element content (∑REE), (C) Th/U, (D) Co/La, (E) Cr/Th, (F) Co/Th and (G) Th/Sc ratios in the clay and silt fractions of sediments in the rivers along the west coast of India.
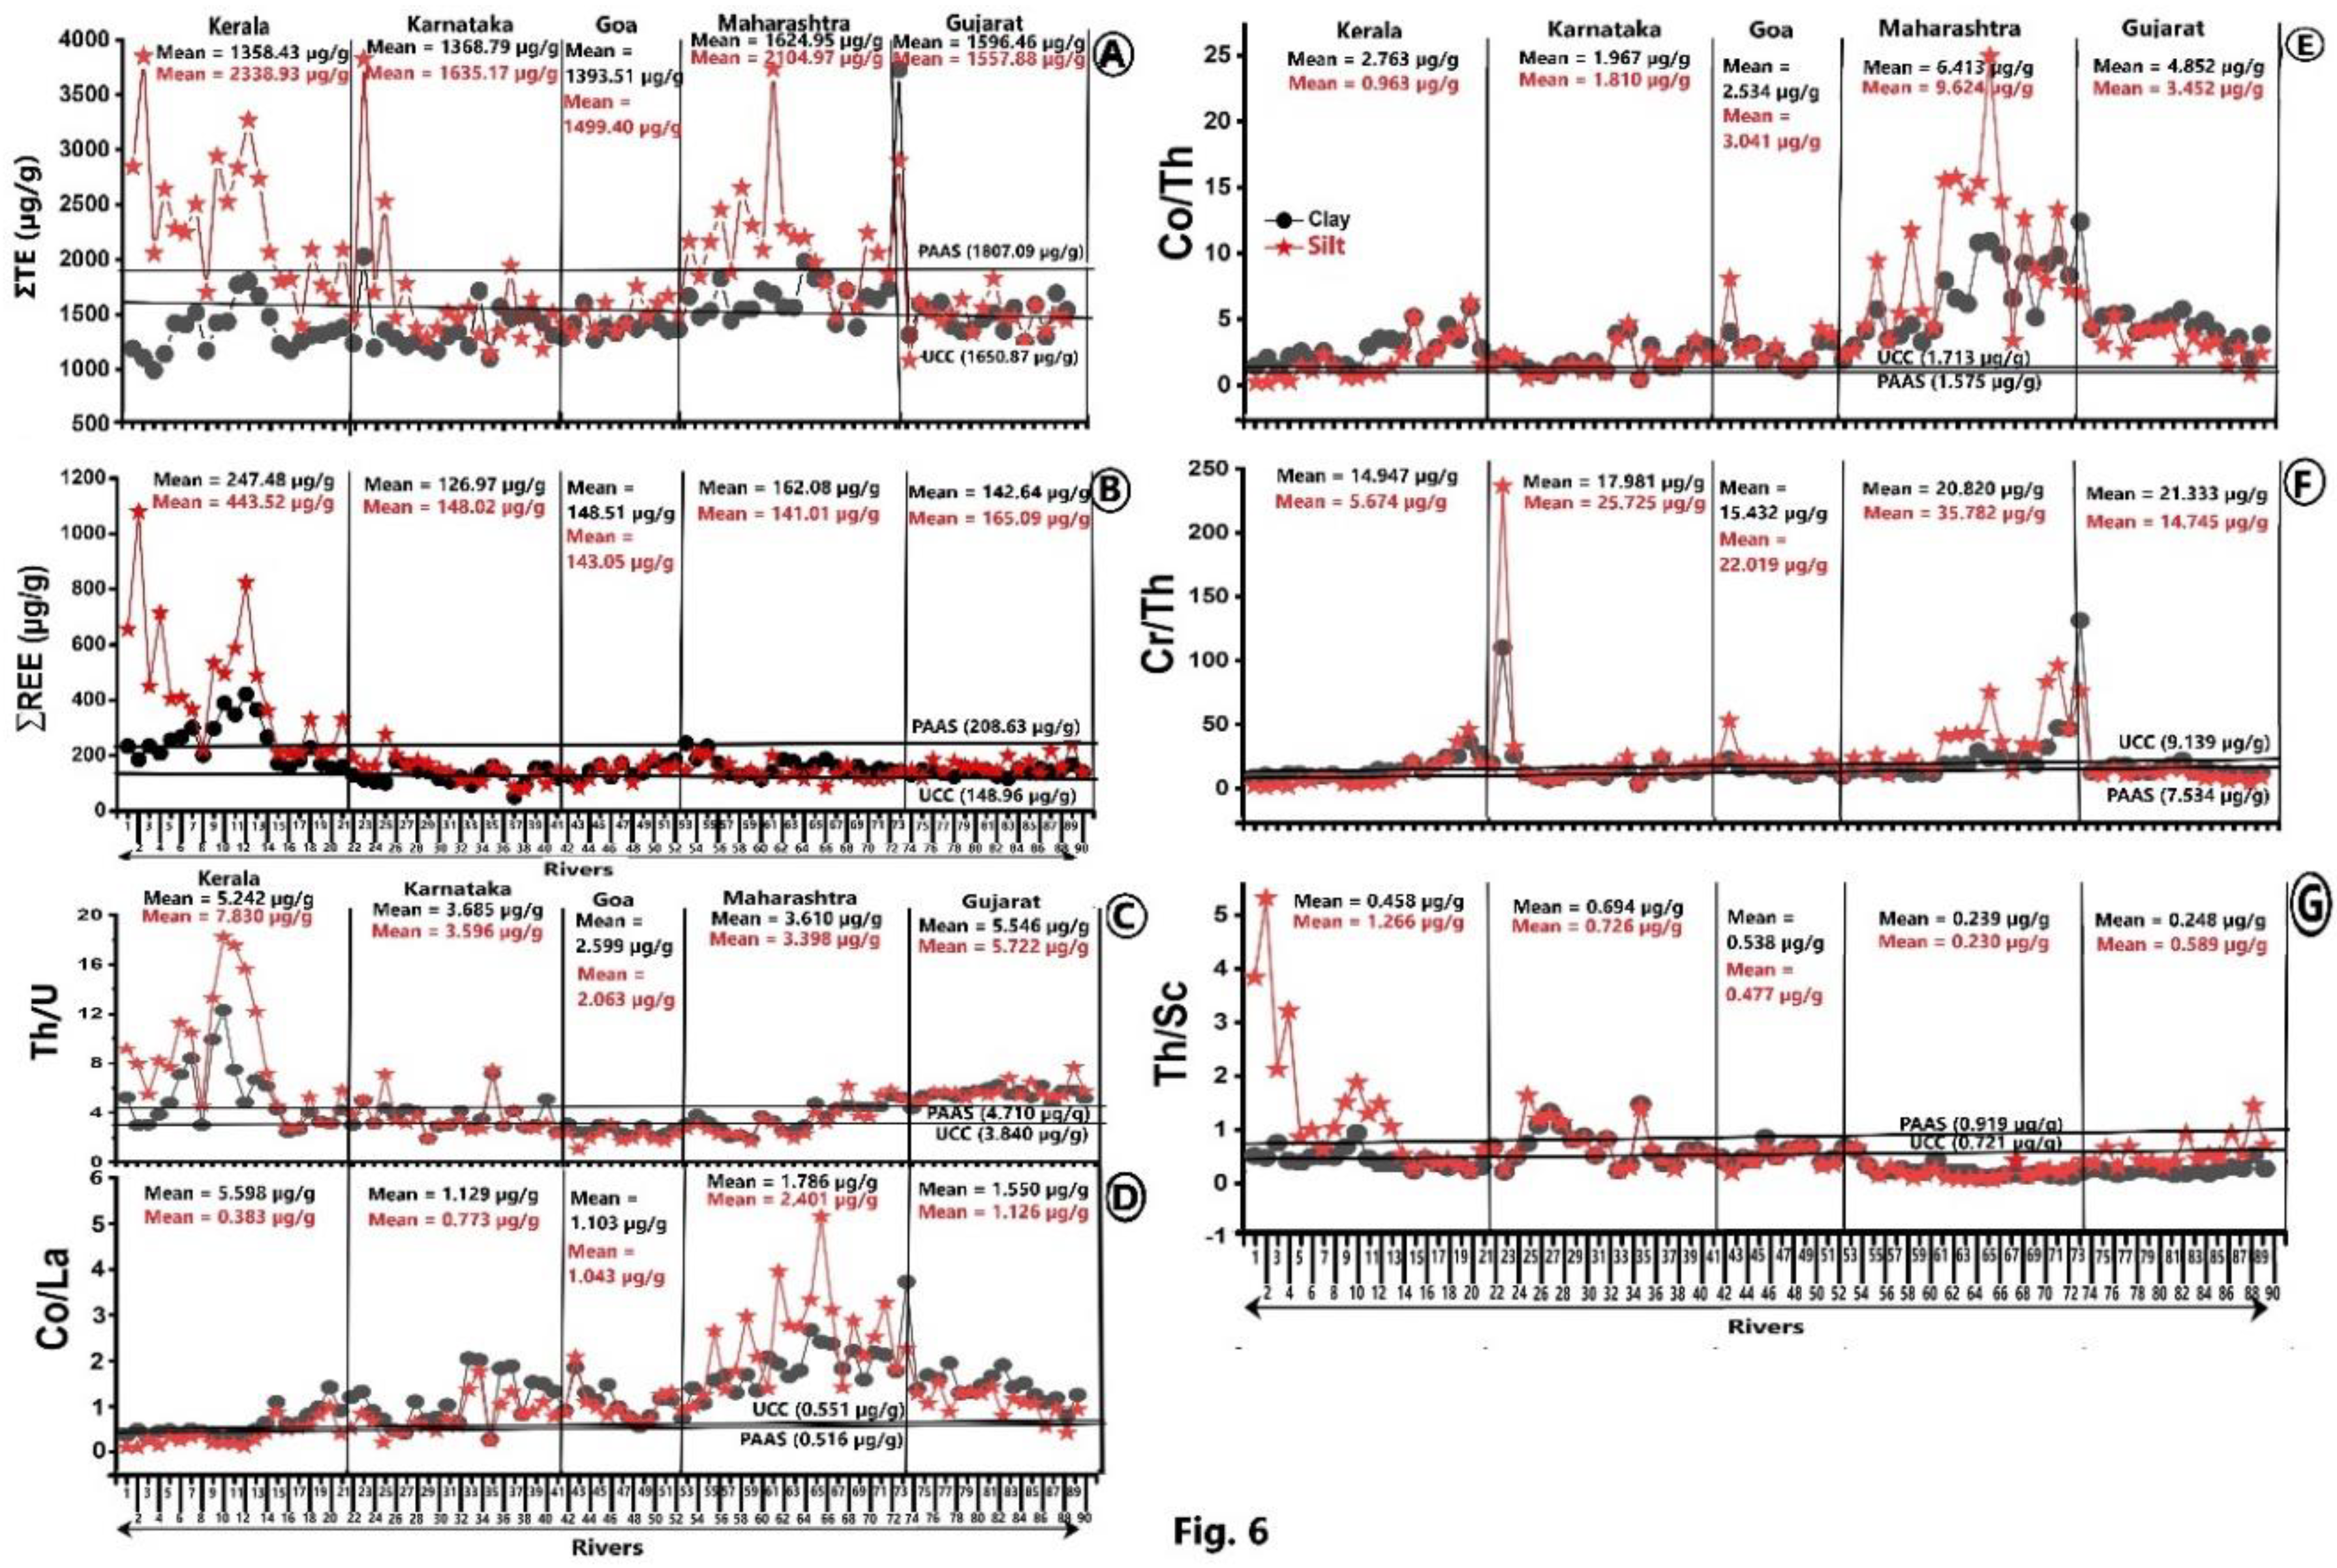
Figure 7.
(A) Variations in the Th/U ratio, (B) binary plot of Th content versus Th/U ratio (Fields and trends from Gu et al. 2002), (C) Variations in the Rb/Sr ratio and (D) binary plot of Rb/Sr versus Sr content (Xu et al., 2010) in the clay and silt fractions of sediments in the rivers of western India.

Figure 8.
Selective correlation plots in the clay fraction of sediments: Correlation (A) between Al2O3 and CaO, (B) TiO2 and Zr, (C) P2O5 and ∑REE and (D) Fe2O3 and Co from the sediment of A-P terrain. Correlation (E) between Al2O3 and P2O5, (F) Fe2O3 and ∑REE, (G) Sc and Cr and (H) Sc vs Hf from the sediments of DT terrain.
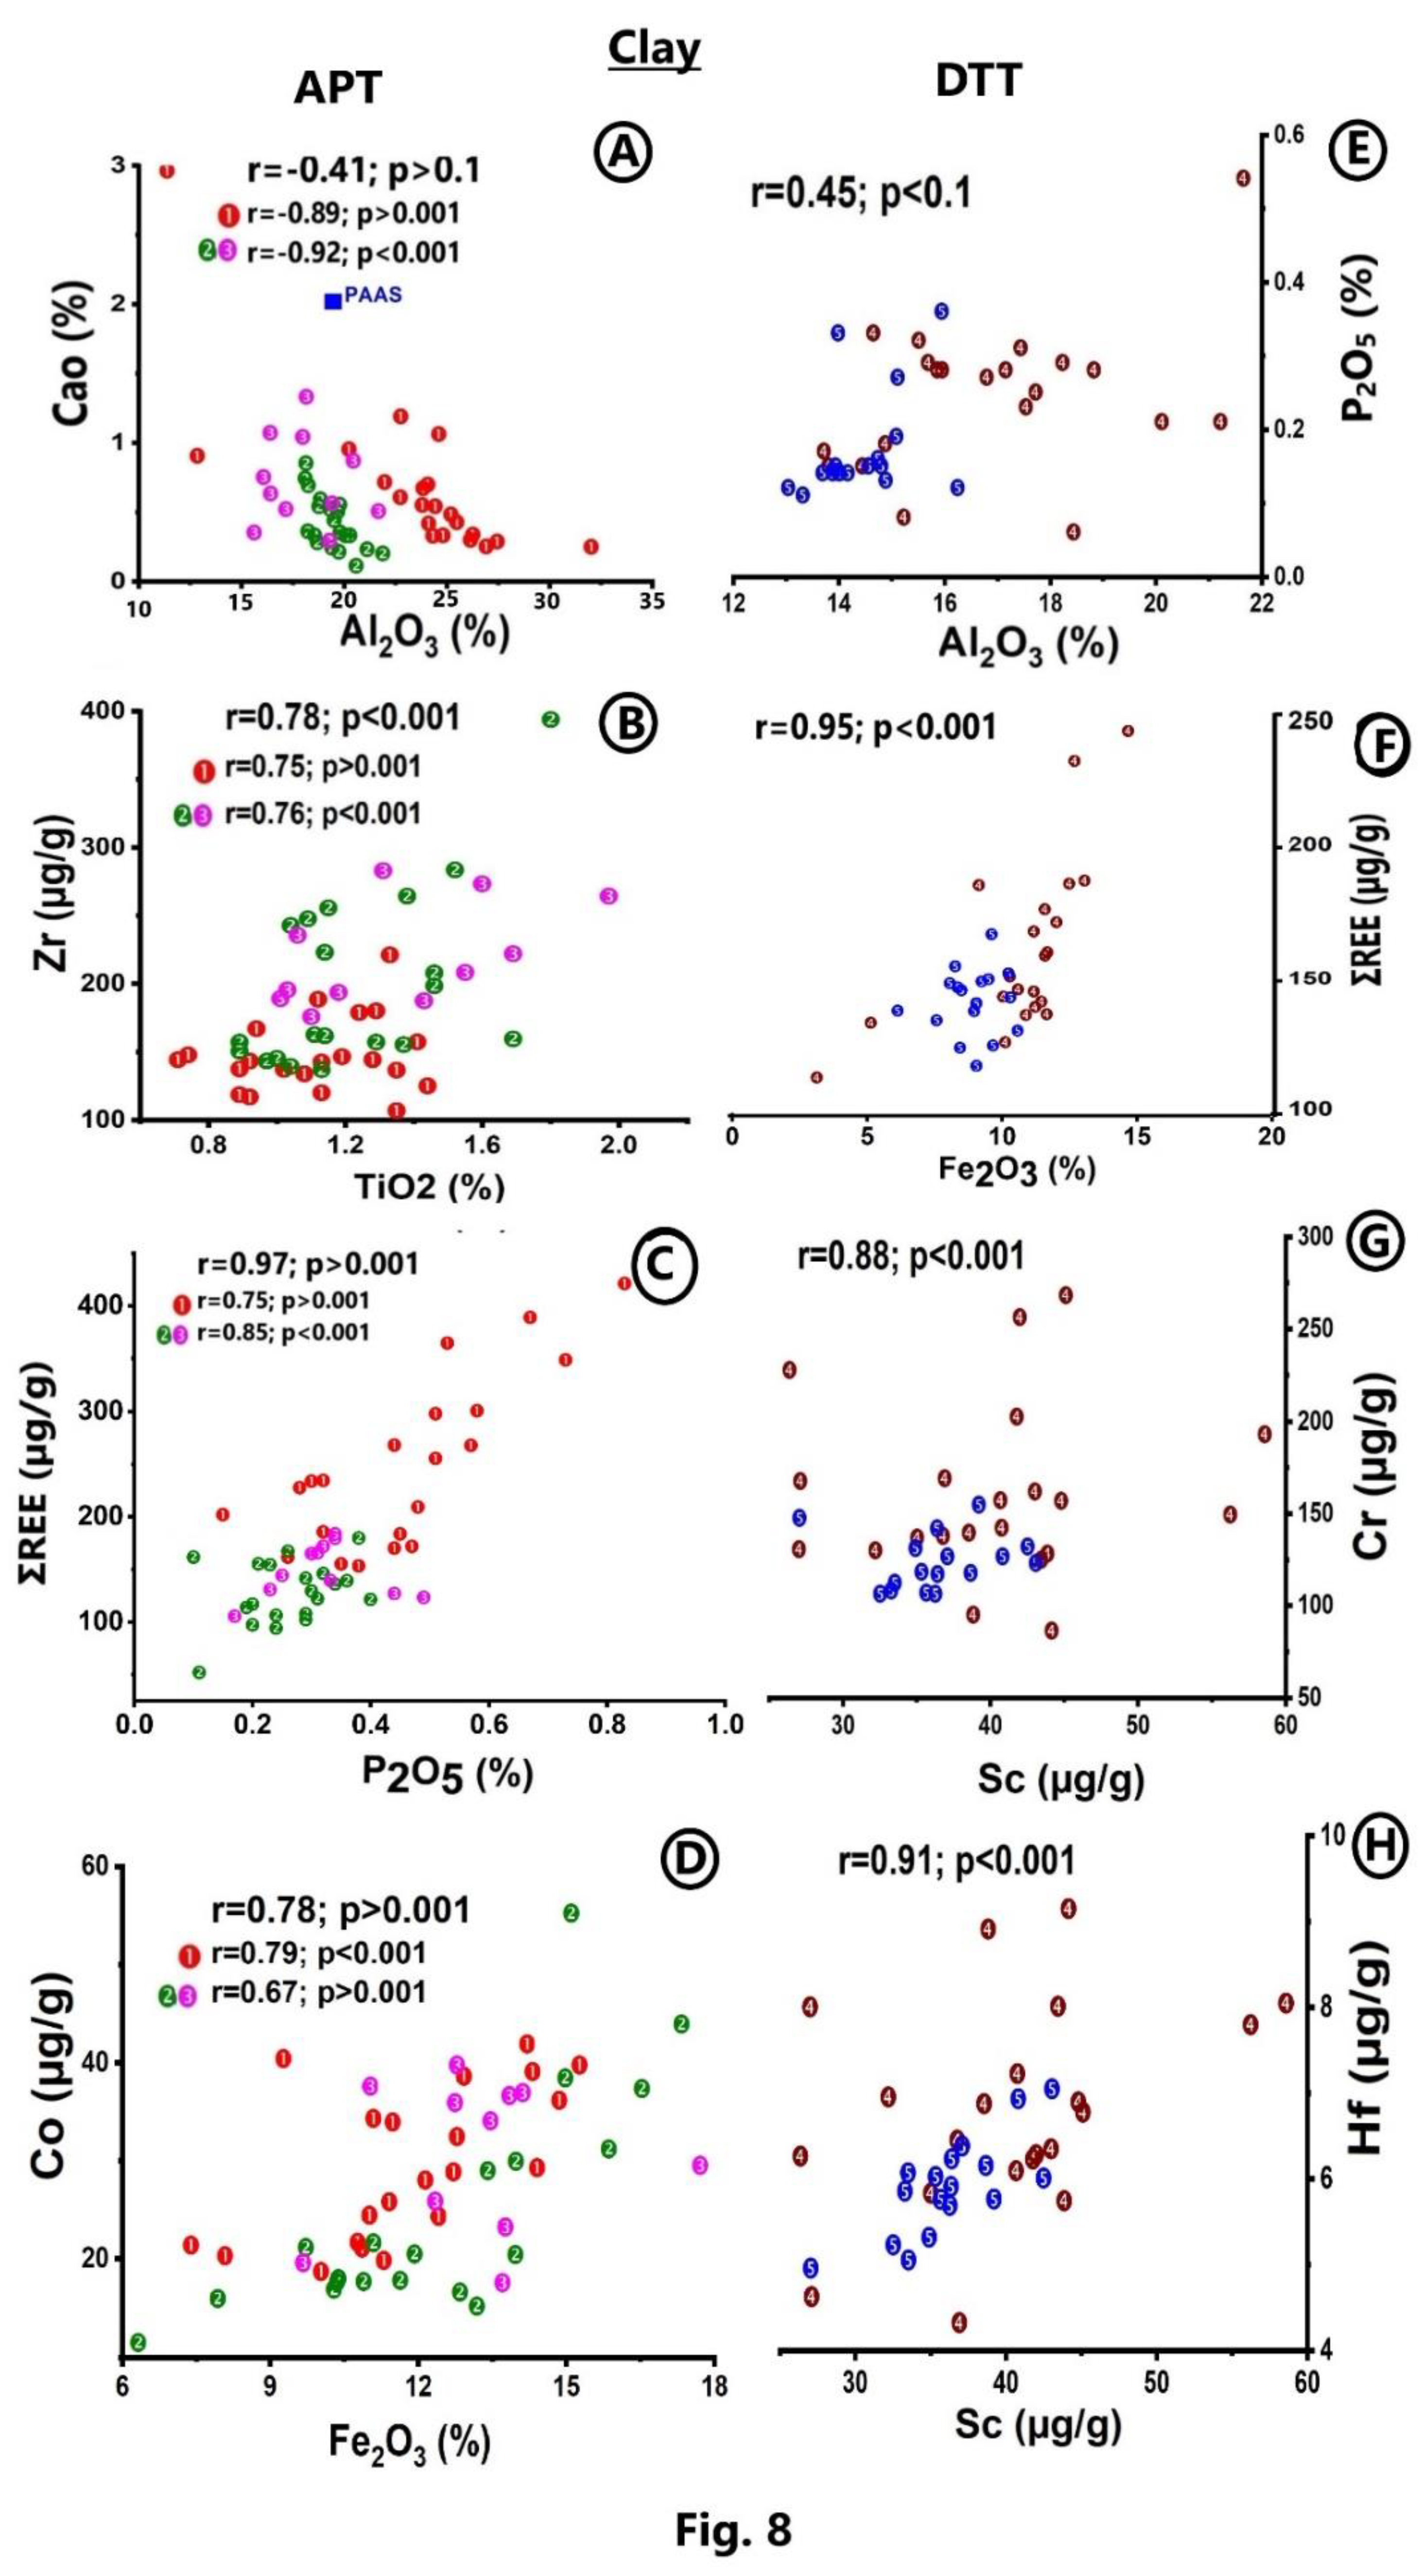
Figure 9.
(A) Element-based provenance discrimination diagrams for the clay and silt fraction of river sediments. (A) Al2O3 vs. TiO2; discrimination lines for the felsic, intermediate and mafic provenances are adopted from Bhatia (1983) and Absar and Sreenivas (2015). (B) Fe2O3+MgO vs. TiO2 (after Bhatia, 1983); relationships of (C) Zr vs. TiO2, discrimination lines are after Absar and Sreenivas (2015) and Hayashi et al.(1997) and (D) Th vs Sc (adopted from Cullers, 2002); ratio-ratio plots of (D) Zr/Sc vs. Th/Sc (after from Condie, 1993 and Roser, 2000) and (E) Th/Yb vs. La/Th (adopted from Mongelli et al., 2006).
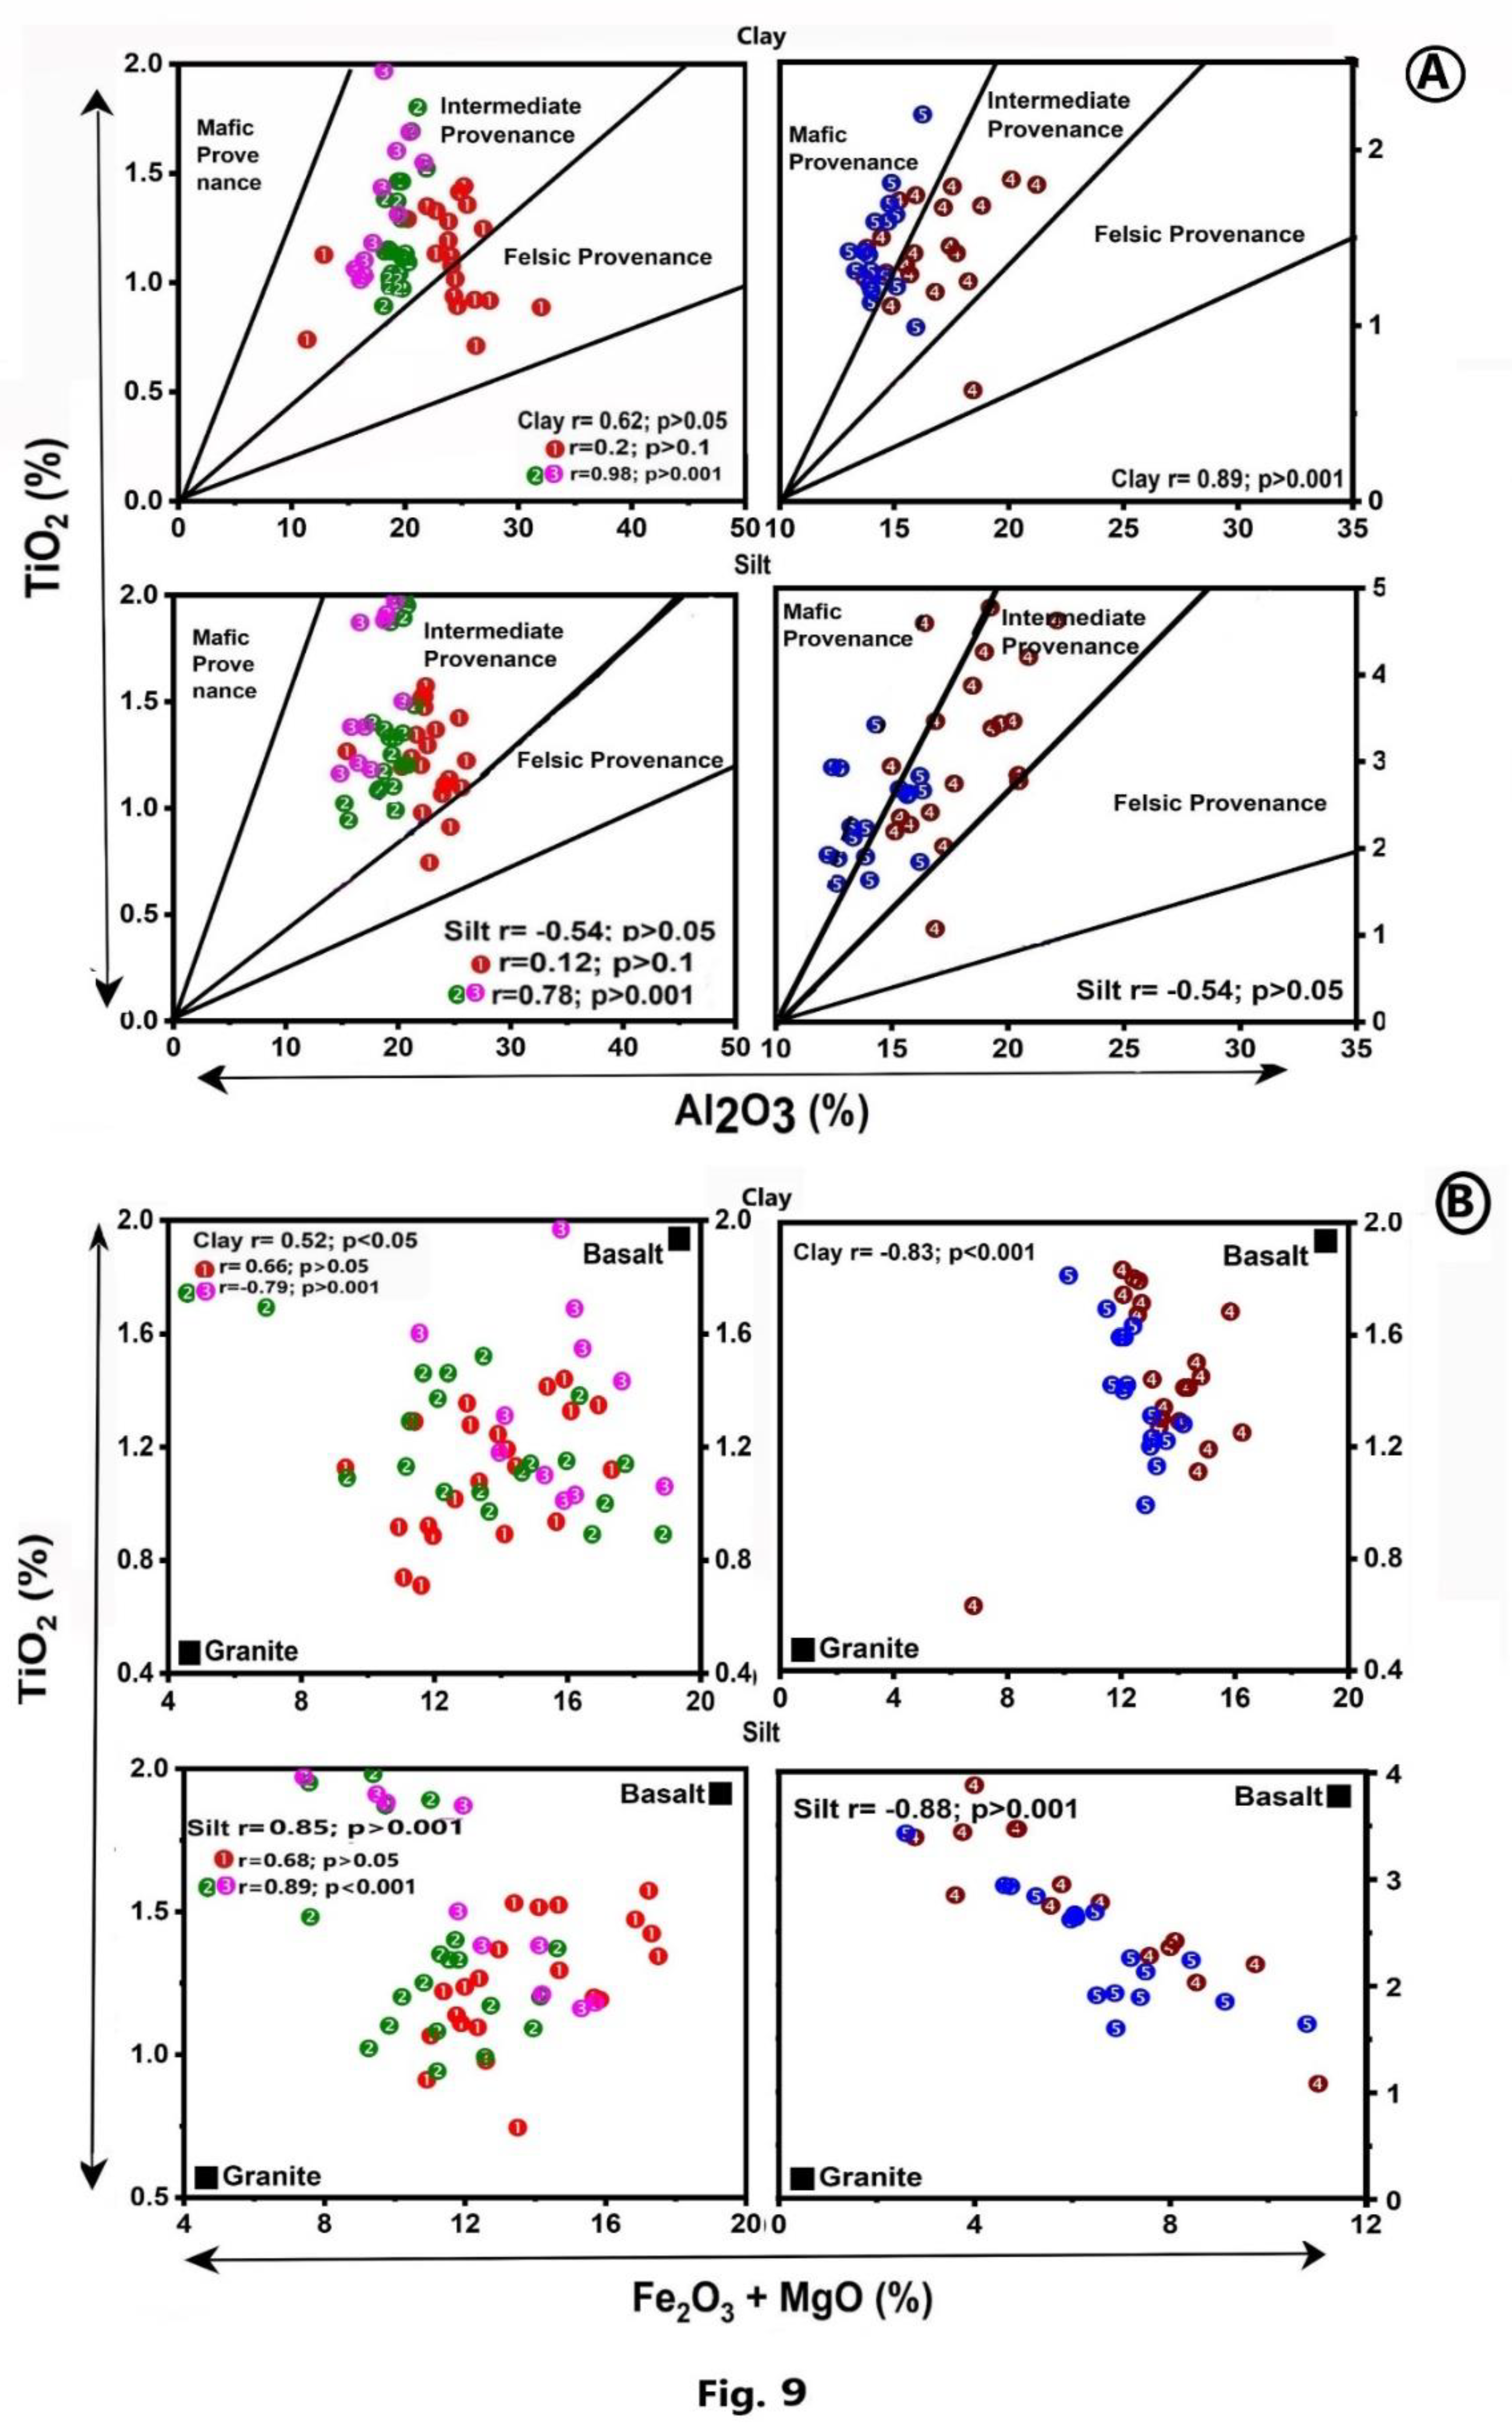
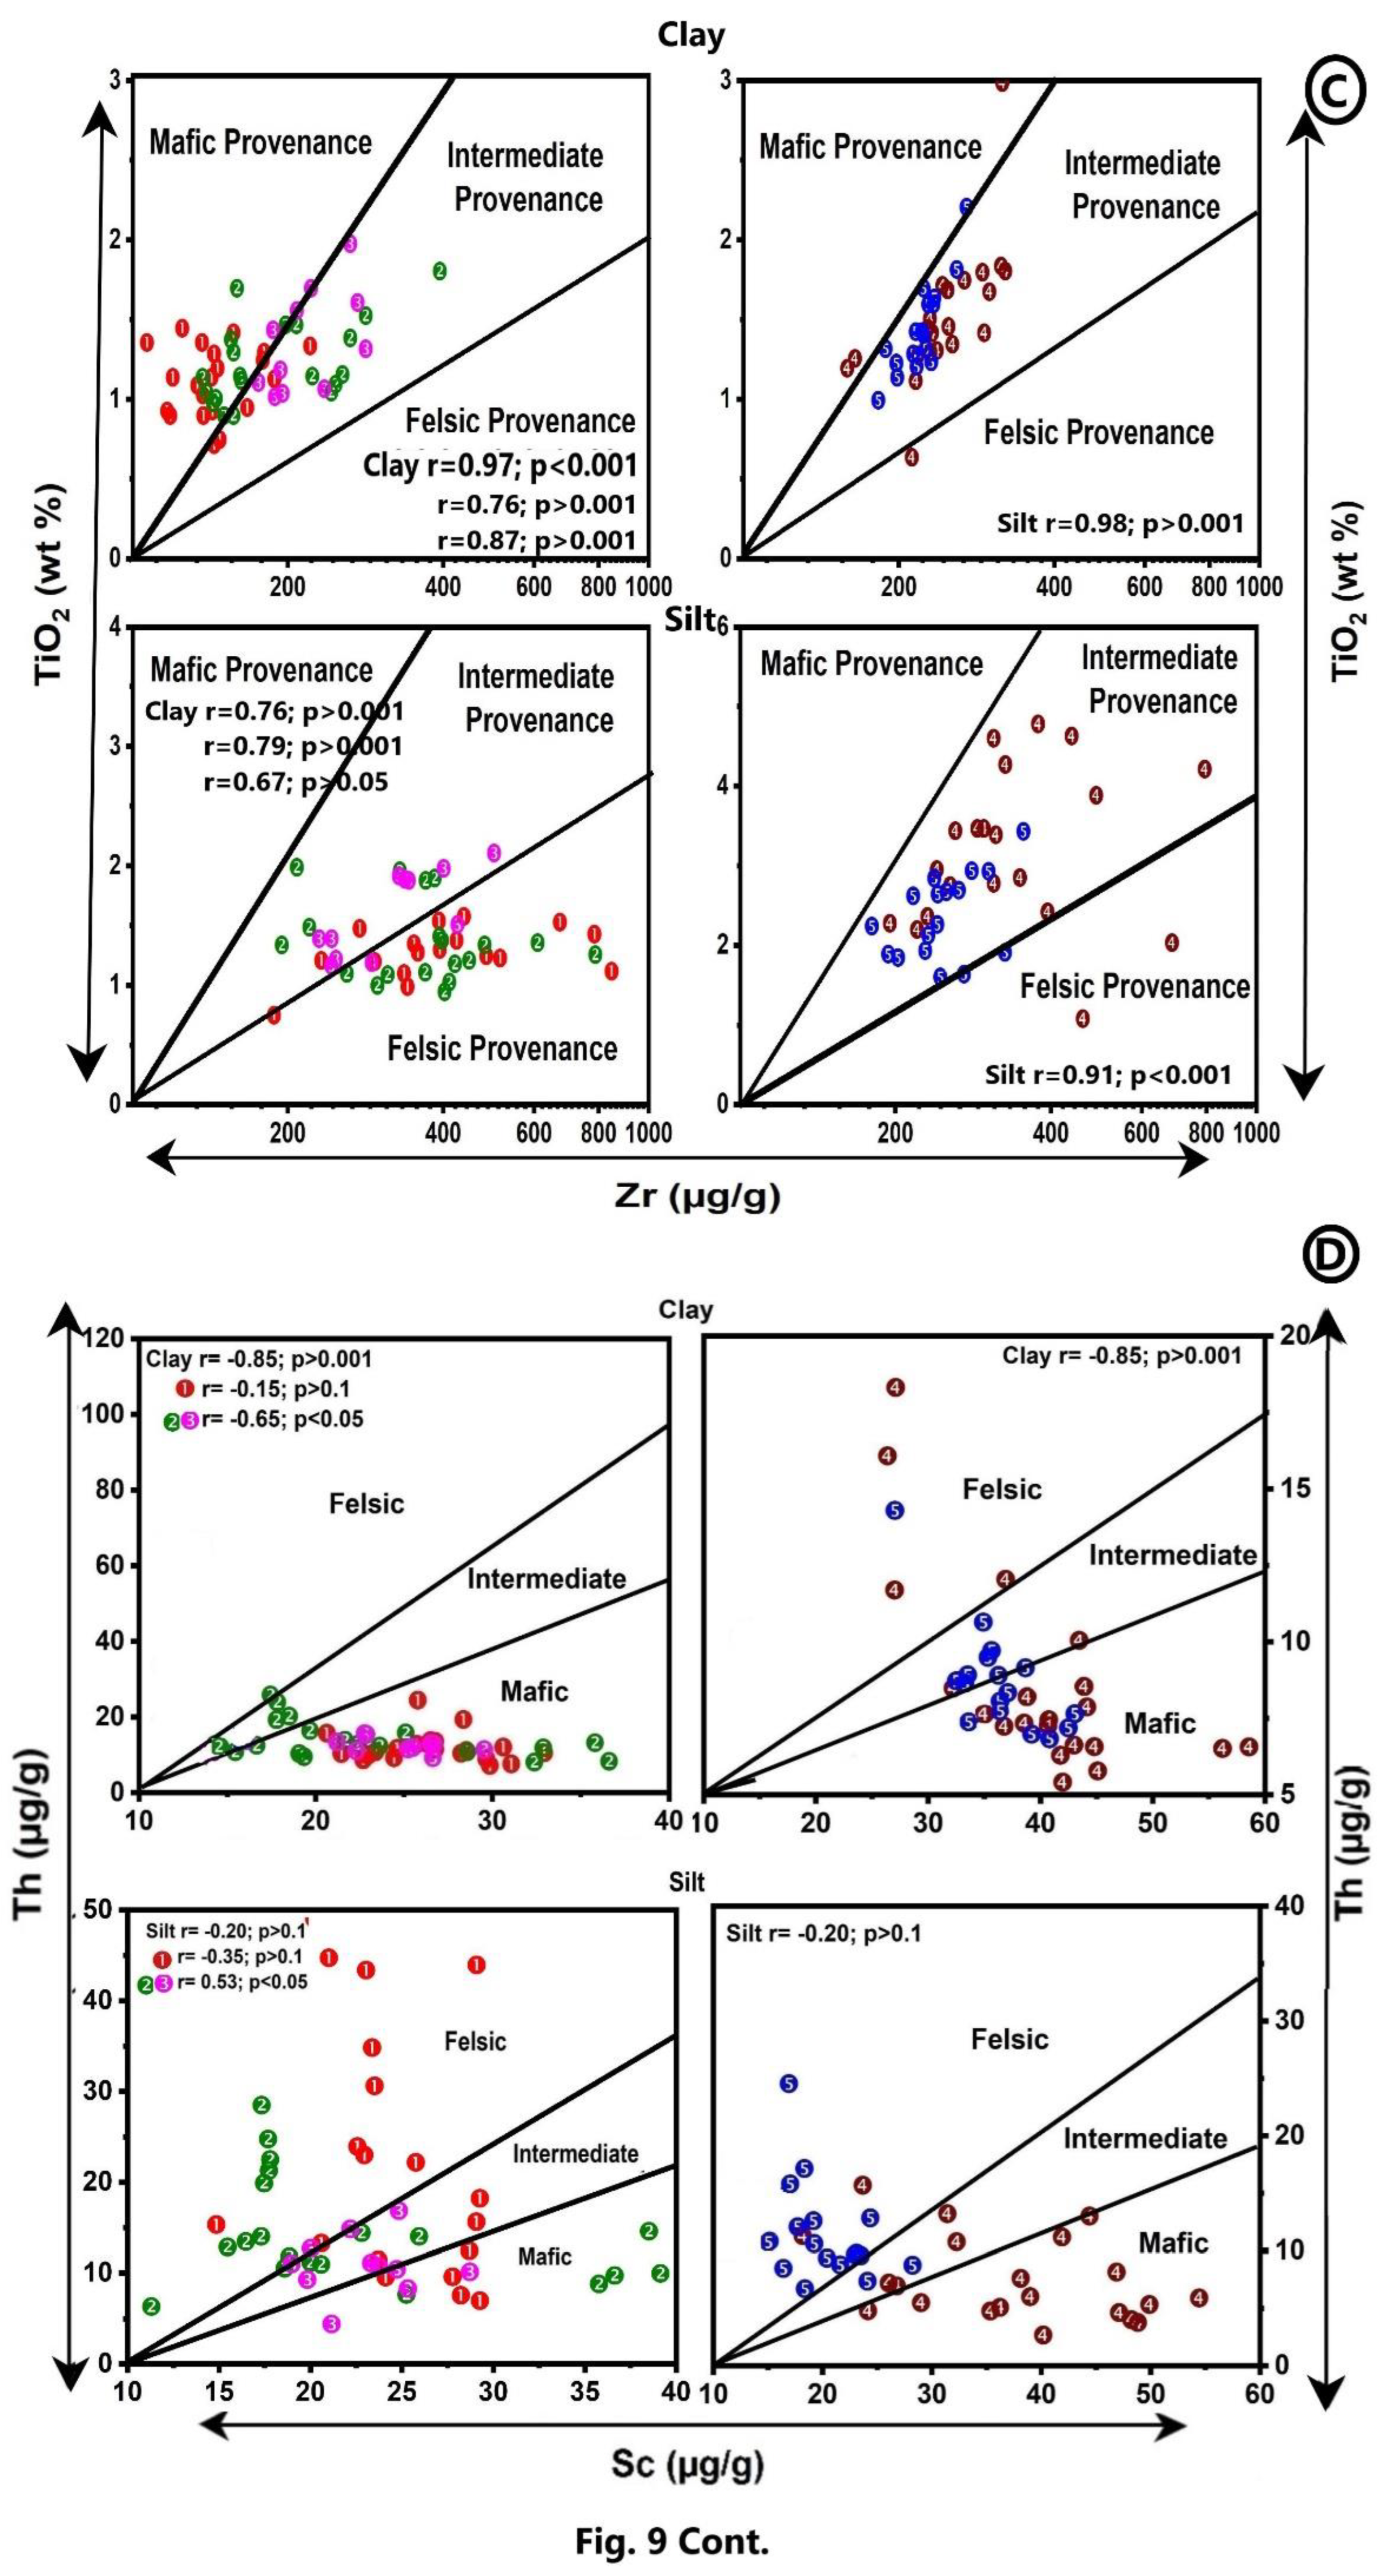
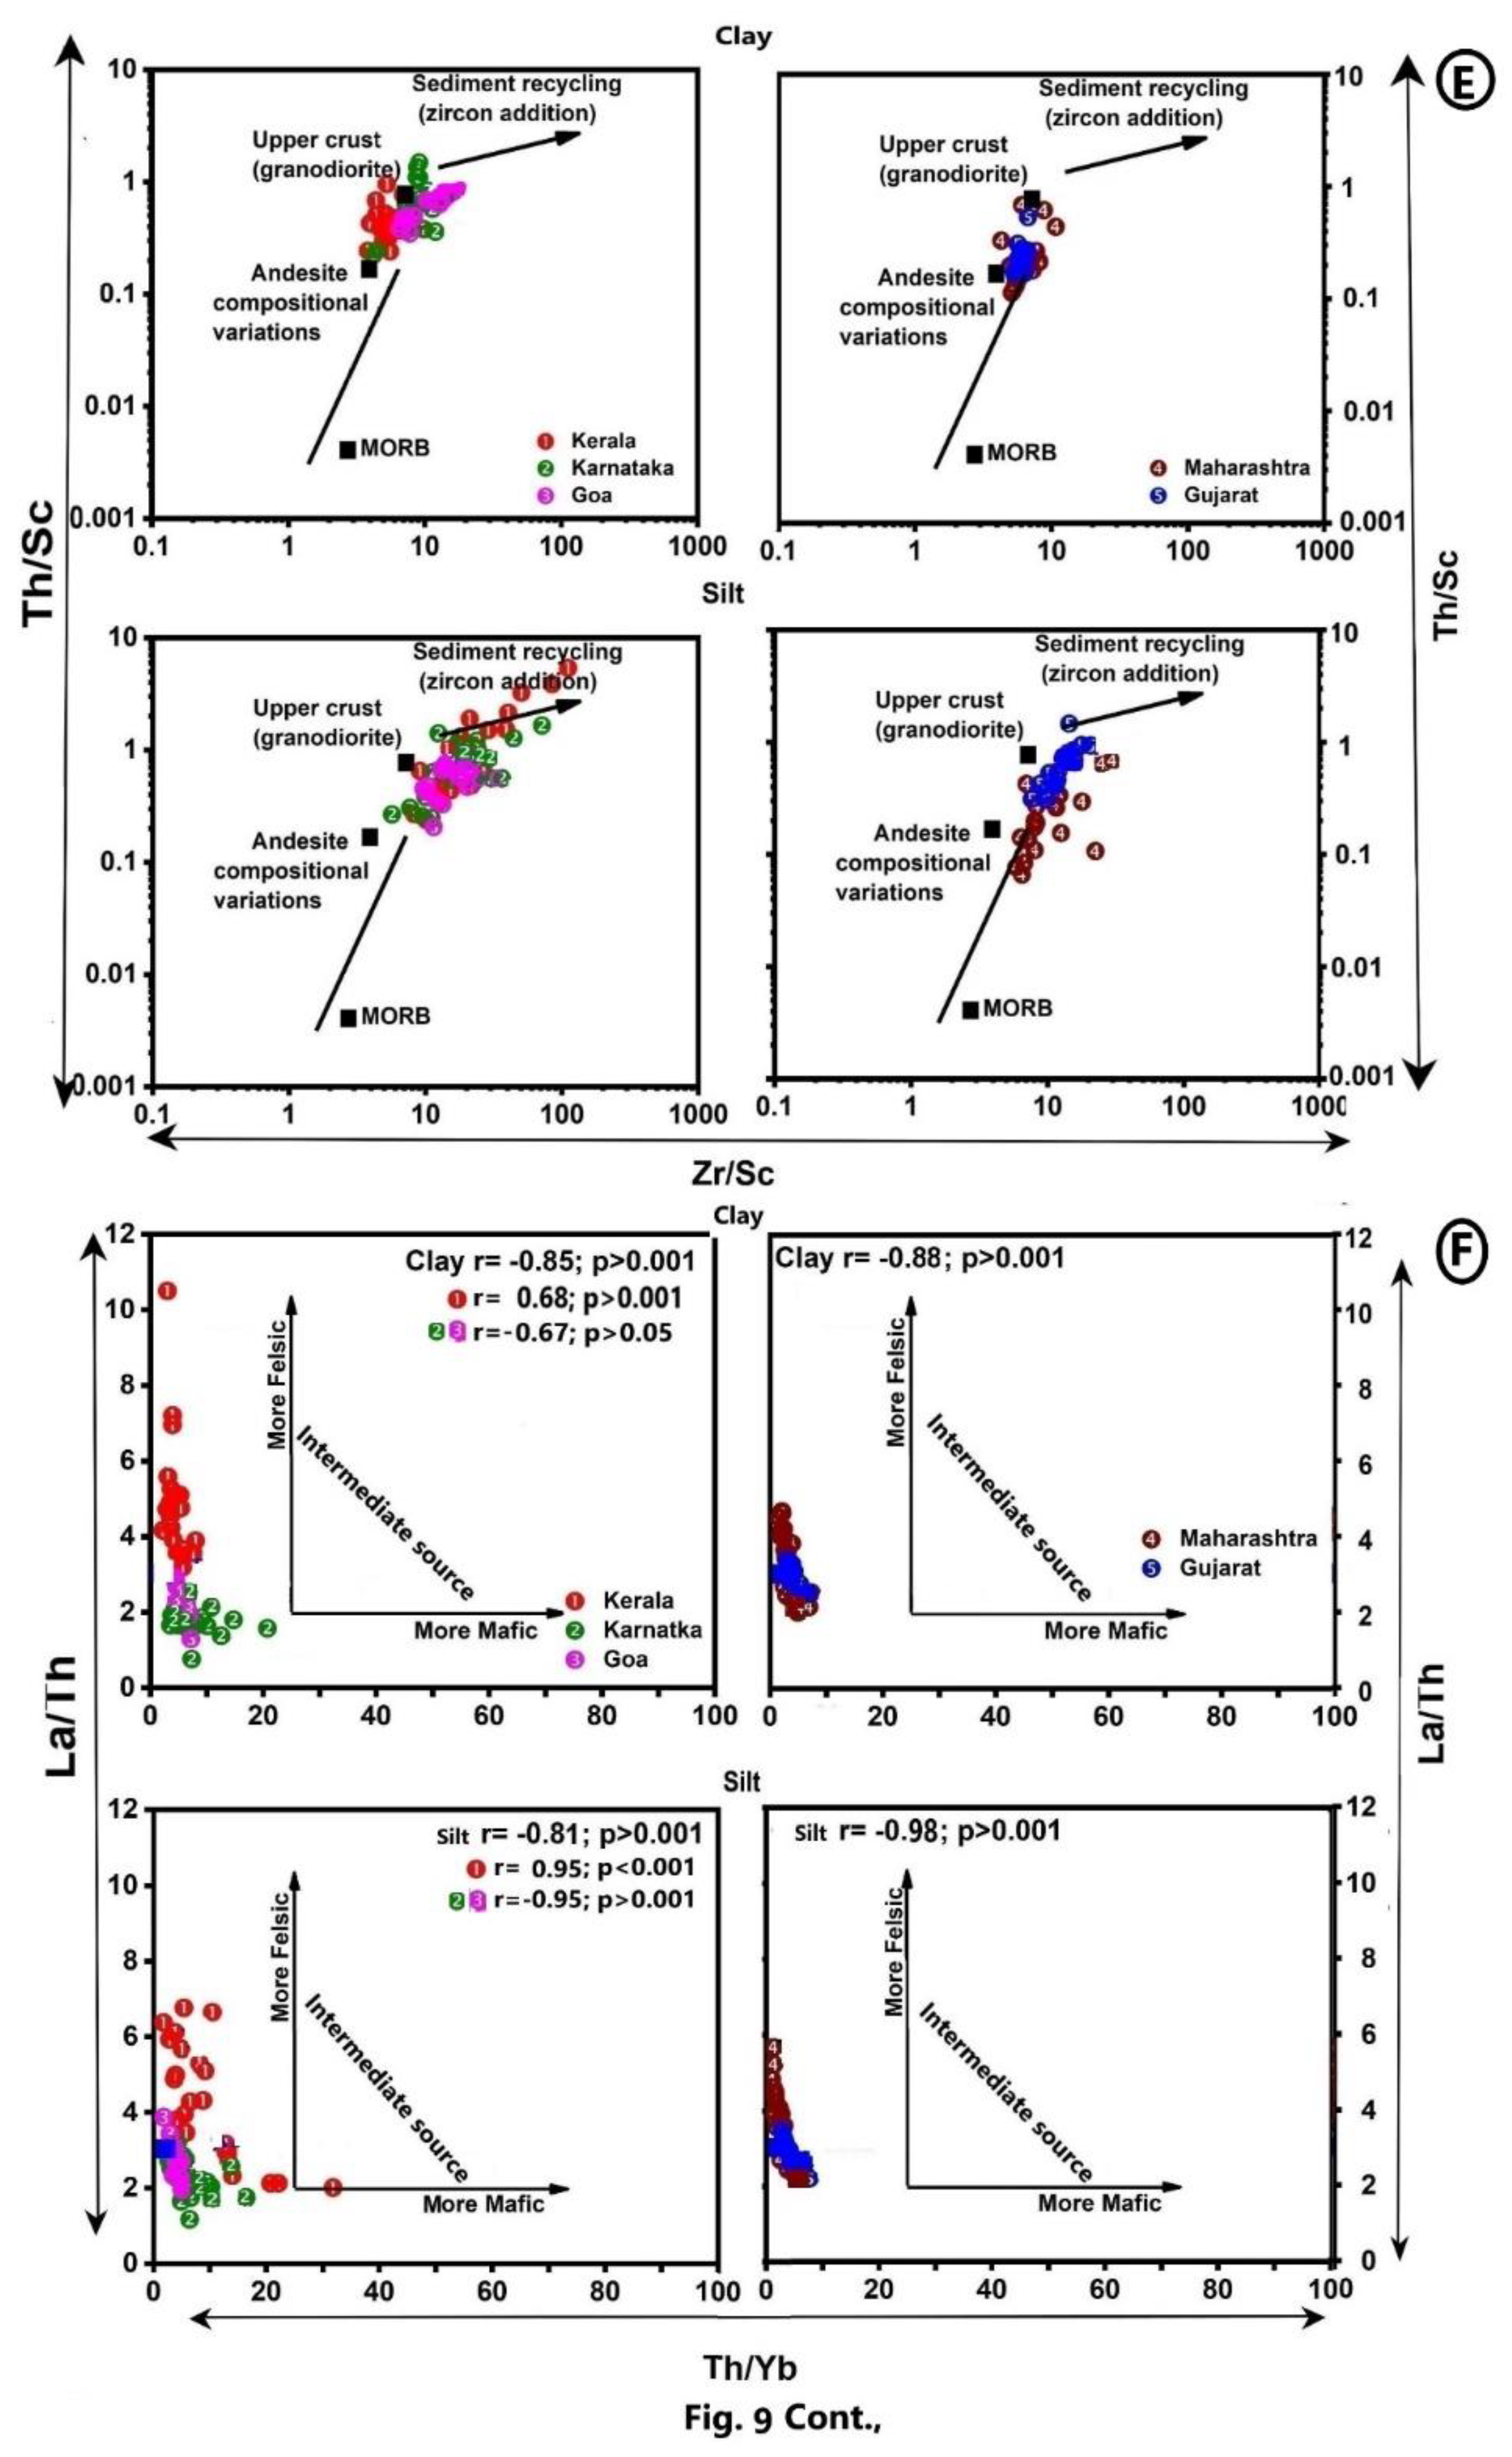
Figure 10.
Ternary diagrams using trace elements to demarcate the provenance (A) La–Th–Sc (adopted from Bhatia and Crook, 1986; Bracciali et al., 2007) and (B) V-Ni-Thx10 (adopted from Bracciali et al., 2007) and (C) Zr–Cr–Ga (adopted from Balasubramaniam et al. 1987).
Figure 10.
Ternary diagrams using trace elements to demarcate the provenance (A) La–Th–Sc (adopted from Bhatia and Crook, 1986; Bracciali et al., 2007) and (B) V-Ni-Thx10 (adopted from Bracciali et al., 2007) and (C) Zr–Cr–Ga (adopted from Balasubramaniam et al. 1987).
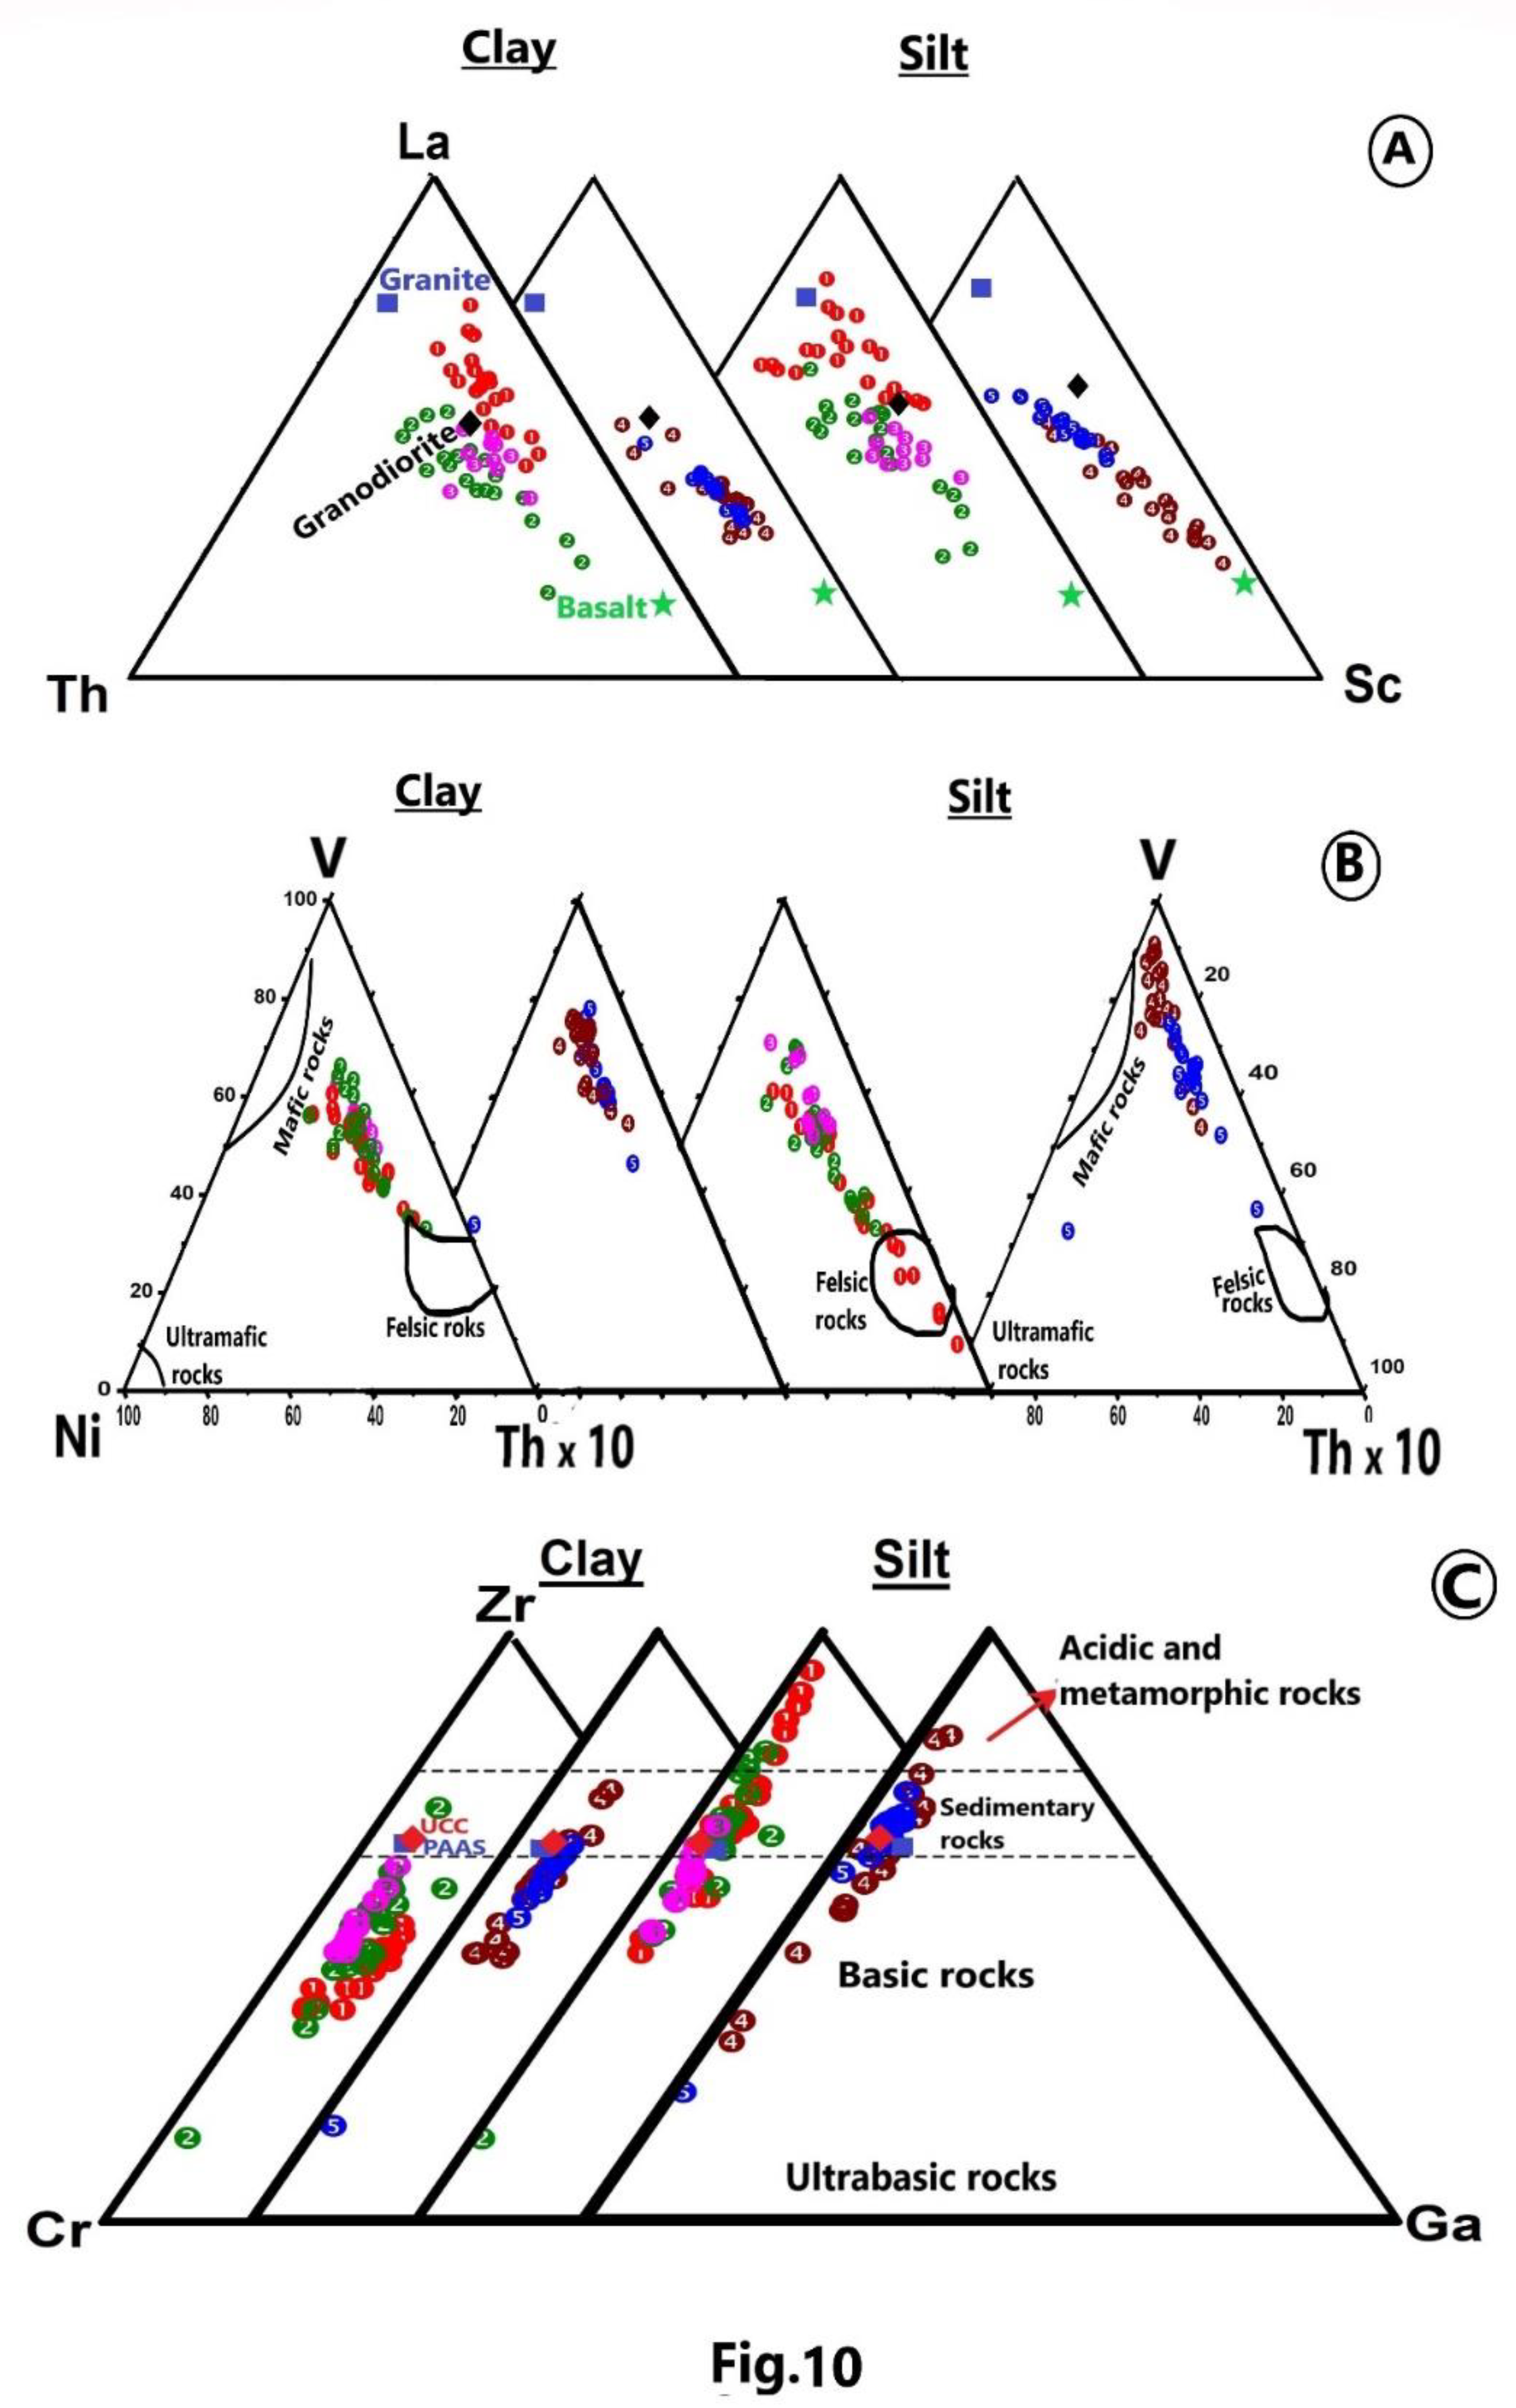
Table 1.
Major elements content (%) of the clay (<4 µm) and silt (>4 to 63 µm) fraction of sediments in the rivers of West coast of India.
Table 1.
Major elements content (%) of the clay (<4 µm) and silt (>4 to 63 µm) fraction of sediments in the rivers of West coast of India.
| State (No. of Rivers) |
SiO2 | Al2O3 | Fe2O3 | MnO | MgO | CaO | Na2O | K2O | TiO2 | P2O5 | SiO2/Al2O3 | Fe2O3/Al2O3 | Al2O3/TiO2 | CIA | PIA | ICV | MIA (O) | MIA (R) | IOL | |
|---|---|---|---|---|---|---|---|---|---|---|---|---|---|---|---|---|---|---|---|---|
| Kerala (21) | Range | 29.01-40.66 | 11.37-32.01 | 7.39-15.27 | 0.05-0.22 | 0.65-3.70 | 0.25-2.96 | 0.16-25.28 | 0.68-2.88 | 0.71-1.44 | 0.15-0.83 | 1.05- 2.91 |
0.35- 0.82 |
11.42- 37.04 |
26.95- 96.35 |
20.82-93.92 | 0.44-3.76 | 38.75-95.87 | 21.72- 72.67 |
35.12- 57.04 |
| Avg., | 34.24 | 23.59 | 11.84 | 0.12 | 1.69 | 0.68 | 2.82 | 1.18 | 1.11 | 0.45 | 1.45 | 0.50 | 21.22 | 86.10 | 79.69 | 0.97 | 85.84 | 58.07 | 50.57 | |
| STD (±) | 2.94 | 4.48 | 2.12 | 0.05 | 0.81 | 0.59 | 7.22 | 0.57 | 0.22 | 0.16 | 0.48 | 0.11 | 6.72 | 19.04 | 20.61 | 0.78 | 15.74 | 12.61 | 5.61 | |
| Karnataka (20) | Range | 37.88-52.33 | 18.09-21.88 | 6.32-17.33 | 0.02-0.34 | 0.29-2.76 | 0.11-0.85 | 0.06-1.04 | 0.51-1.64 | 0.89-1.80 | 0.10-0.40 | 1.91- 2.54 |
0.31- 0.95 |
11.73- 20.38 |
84.49-96.60 | 76.90-94.35 | 0.51-1.24 | 83.14-97.07 | 48.16-71.78 | 33.94-48.13 |
| Avg., | 43.12 | 19.43 | 12.39 | 0.08 | 1.18 | 0.42 | 0.44 | 1.09 | 1.23 | 0.26 | 2.22 | 0.64 | 16.35 | 90.87 | 85.76 | 0.87 | 91.08 | 58.00 | 42.52 | |
| STD (±) | 3.86 | 1.03 | 2.86 | 0.07 | 0.61 | 0.20 | 0.35 | 0.33 | 0.26 | 0.08 | 0.14 | 0.17 | 2.79 | 2.86 | 4.22 | 0.19 | 3.27 | 6.13 | 3.66 | |
| Goa (11) | Range | 36.14-43.11 | 15.61-21.66 | 9.67-17.71 | 0.04-0.58 | 1.21-3.87 | 0.29-1.33 | 0.56-8.40 | 1.28-1.63 | 1.01-1.97 | 0.17-0.49 | 1.82- 2.57 |
0.50- 1.13 |
9.23- 15.94 |
61.49-88.35 | 55.96-81.79 | 0.83-1.61 | 70.30-90.49 | 41.30-59.13 | 40.61-47.97 |
| Avg., | 40.06 | 18.05 | 13.20 | 0.16 | 2.45 | 0.72 | 2.33 | 1.49 | 1.36 | 0.32 | 2.24 | 0.74 | 13.71 | 80.97 | 74.25 | 1.21 | 82.19 | 49.21 | 43.81 | |
| STD (±) | 2.27 | 1.95 | 2.01 | 0.17 | 0.73 | 0.33 | 2.57 | 0.12 | 0.32 | 0.09 | 0.22 | 0.16 | 2.03 | 8.52 | 7.99 | 0.24 | 6.06 | 5.43 | 2.68 | |
| Archean- Proterozoic Terrain (APT) | Range | 29.01-52.33 | 11.37-32.01 | 6.32-17.71 | 0.04-0.58 | 0.65-3.87 | 0.11-2.96 | 0.06-25.28 | 0.51-2.88 | 0.71-1.97 | 0.10-0.83 | 1.05-2.91 | 0.31-1.13 | 9.23-37.04 | 26.95-96.60 | 20.82-94.35 | 0.44-3.76 | 38.75-97.07 | 21.72-72.67 | 33.94-57.04 |
| Avg., | 38.89 | 20.82 | 12.34 | 0.11 | 1.65 | 0.59 | 1.80 | 1.21 | 1.21 | 0.35 | 1.95 | 0.61 | 18.10 | 85.98 | 79.90 | 1.01 | 86.37 | 55.09 | 45.63 | |
| STD (±) | 5.11 | 3.82 | 2.42 | 0.10 | 0.85 | 0.44 | 4.79 | 0.44 | 0.27 | 0.15 | 0.47 | 0.17 | 5.77 | 10.14 | 10.94 | 0.40 | 8.35 | 7.10 | 5.97 | |
| Maharashtra (21) | Range | 28.32-51.21 | 13.71-21.65 | 3.13-14.67 | 0.07-0.44 | 0.79-5.72 | 0.26-2.10 | 0.12-13.22 | 0.55-1.34 | 0.63-2.98 | 0.06-0.54 | 1.87- 3.32 |
0.14- 0.88 |
7.27- 29.27 |
48.67-94.06 | 45.86-91.36 | 0.42-2.13 | 61.96-93.91 | 34.01-79.08 | 31.52-47.59 |
| Avg., | 42.28 | 16.90 | 10.75 | 0.18 | 2.23 | 1.07 | 1.09 | 0.91 | 1.51 | 0.25 | 2.54 | 0.65 | 11.98 | 85.19 | 80.59 | 1.08 | 84.23 | 53.51 | 39.66 | |
| STD (±) | 4.74 | 2.28 | 2.51 | 0.10 | 1.20 | 0.53 | 2.79 | 0.29 | 0.44 | 0.10 | 0.42 | 0.18 | 4.33 | 9.25 | 9.28 | 0.34 | 7.09 | 9.06 | 4.13 | |
| Gujarat (17) | Range | 42.88-50.36 | 13.04-16.24 | 6.13-10.57 | 0.10-0.24 | 2.51-4.29 | 1.65-6.38 | 0.18-1.31 | 0.66-1.83 | 0.99-2.20 | 0.11-0.36 | 2.71- 3.77 |
0.38- 0.76 |
7.38- 16.10 |
61.78-84.19 | 53.70-80.76 | 0.87-1.65 | 63.94-82.35 | 39.99-58.96 | 30.16-37.18 |
| Avg., | 47.35 | 14.43 | 8.91 | 0.15 | 3.39 | 3.05 | 0.54 | 1.29 | 1.44 | 0.17 | 3.29 | 0.62 | 10.39 | 75.02 | 68.39 | 1.31 | 74.02 | 47.15 | 33.05 | |
| STD (±) | 2.49 | 0.85 | 1.09 | 0.030 | 0.48 | 1.05 | 0.36 | 0.37 | 0.29 | 0.07 | 0.29 | 0.09 | 2.05 | 5.42 | 6.70 | 0.17 | 4.32 | 4.10 | 2.10 | |
| Deccan Trap Terrain (DTT) | Range | 28.32-51.21 | 13.04-21.65 | 3.13-14.67 | 0.07-0.44 | 0.79-5.72 | 0.26-6.38 | 0.12-13.22 | 0.55-1.83 | 0.63-2.98 | 0.06-0.54 | 1.87-3.77 | 0.14-0.88 | 7.27-29.27 | 48.67-94.06 | 45.86-91.36 | 0.42-2.13 | 61.96-93.91 | 34.01-79.08 | 30.16-47.59 |
| Avg., | 44.55 | 15.79 | 9.93 | 0.17 | 2.75 | 1.96 | 0.84 | 1.08 | 1.48 | 0.21 | 2.88 | 0.64 | 11.27 | 80.10 | 74.49 | 1.19 | 79.12 | 50.33 | 36.35 | |
| STD (±) | 4.63 | 2.16 | 2.19 | 0.08 | 1.11 | 1.28 | 2.08 | 0.38 | 0.38 | 0.10 | 0.53 | 0.14 | 3.55 | 7.33 | 7.99 | 0.25 | 5.70 | 5.12 | 3.11 | |
| West Coast of India River Average Clay (WCIRAC) | Range | 28.32-52.33 | 11.37-32.01 | 3.13-17.71 | 0.65-5.72 | 0.11-6.38 | 0.06-25.28 | 0.51-2.88 | 0.01-2.98 | 0.04-0.58 | 0.06-0.83 | 1.05-3.77 |
0.14- 1.13 |
7.26-37.05 | 26.95-96.60 | 20.82-94.35 | 0.42-3.76 | 38.75-97.07 | 21.72-79.08 | 30.16-48.13 |
| Avg., | 41.41 | 18.69 | 11.32 | 2.20 | 1.27 | 1.32 | 1.15 | 1.32 | 0.13 | 0.29 |
2.34 |
0.63 |
15.21 |
83.63 |
78.98 | 1.06 | 83.94 | 54.12 | 41.92 | |
| STD (±) | 3.26 | 4.06 | 2.60 | 0.98 | 0.86 | 3.43 | 0.42 | 0.34 | 0.09 | 0.14 |
0.31 |
0.14 |
5.98 |
9.01 |
12.87 | 0.47 | 10.40 | 9.51 | 2.63 |
Disclaimer/Publisher’s Note: The statements, opinions and data contained in all publications are solely those of the individual author(s) and contributor(s) and not of MDPI and/or the editor(s). MDPI and/or the editor(s) disclaim responsibility for any injury to people or property resulting from any ideas, methods, instructions or products referred to in the content. |
© 2024 by the authors. Licensee MDPI, Basel, Switzerland. This article is an open access article distributed under the terms and conditions of the Creative Commons Attribution (CC BY) license (http://creativecommons.org/licenses/by/4.0/).
Copyright: This open access article is published under a Creative Commons CC BY 4.0 license, which permit the free download, distribution, and reuse, provided that the author and preprint are cited in any reuse.


