Submitted:
09 October 2024
Posted:
10 October 2024
You are already at the latest version
Abstract
Environmental pollution indicated by the presence of PM2.5 particulate matter varies based on prevailing atmospheric conditions described by certain meteorological variables. Consequently, it is important to understand atmospheric behavior in areas such as the Aburrá Valley, which experiences recurrent pollution events twice a year. This study examines the behavior of specific meteorological variables and PM2.5 particulate matter in the Aburrá Valley. By using statistical analysis tools such as correlation coefficients, principal component analysis (PCA), and multiple linear regression models, the research identifies relationships between PM2.5 and daily cycles of temperature, rainfall, radiation, and wind speed and direction. Data sets were analyzed considering periods before and after the COVID-19 lockdown (pre-pandemic and pandemic, respectively), and specific pollution events were also analyzed. Furthermore, this work considers the relationships between PM2.5 and meteorological variables, contrasting the pre-pandemic and pandemic periods. This study characterizes diurnal cycles of meteorological variables and their relationship with PM2.5. There are consistent patterns among temperature, atmospheric boundary layer (ABL) height, and solar radiation, whereas precipitation and relative humidity show opposite behavior. PM2.5 exhibits similar relative frequency functions during both daytime and nighttime, regardless of rainfall. An inverse relationship is noted between PM2.5 levels and ABL height at different times of the day. Moreover, the PCA results show that the first principal component explains around 60% of the total variance of the hydrometeorological data. The second PC explains 10%, and the rest of the variance is distributed among the other three to eight PCs. In this sense, there is no significant difference between the two PCA analyses with hydrometeorological data from a pre-pandemic period and a COVID-19 pandemic. Multiple regression analysis indicates a significant and consistent dependence of PM2.5 on temperature and solar radiation across both analyzed periods. This work presents new insights that enhance the diagnosis, understanding, and modeling of environmental pollution, thereby supporting informed decision-making and strengthening management efforts.
Keywords:
diurnal cycle
; precipitation
; pollution
; air quality
; particulate matter PM2.5
; tropical meteorology
; correlation coefficients
; principal component analysis (PCA)
; multiple linear regression (MLR)
1. Introduction
Air pollution is a major problem in cities, and it is important to understand its causes and effects to develop effective solutions [1]. The main sources of air pollution in cities include vehicle, industrial, and household emissions. are tiny airborne particles that are 2.5 micrometers, approximately 1 ten-thousandth of an inch, or less in diameter) is significantly affected by human activities, especially factory and automobile exhaust emissions [2]. Air pollution can have several harmful effects on human health; by using 30,652 distinct data sources, a six-step analytical methodology, and all the available data in the information systems around the world, the Institute of Health Metric and Evaluation estimated that between 1990 and 2019 [3], ambient air pollution is the fourth cause of death, attributed to 6.7 million deaths, and the second leading cause of morbidity due to the increased risks of respiratory infections, cardiovascular disease, and premature death [4]. The WHO Global Air Quality Guidelines (AQGs) guide thresholds and limits for key air pollutants that pose health risks. The recommended 2021 WHO air quality guideline level for is 5 g/ for annual averaging and 15 for 24-hour exposure [5]. In 2019, almost all (99%) of the world’s population was exposed to unhealthy levels of fine PM. Globally, the annual average population-weighted concentration of fine PM in urban areas was 33 g/ (UI: 32–34 g/) in 2019, over six times the recommended level for protecting public health [6]. Seasonal trends and the root causal mechanisms of pollution are also fundamental research topics with different approaches, such as in [7]. The diurnal cycle of air pollution in cities refers to how air pollution levels change over a day, typically being highest in the morning and evening and lowest during the day, influenced by factors such as traffic emissions, solar radiation, and wind speed [8]. Notwithstanding, the diurnal cycle of air pollution can vary depending on the city and the time of year [9,10]. In particular, PM10 and are of special interest in areas of high pollution where seasonal events occur, such as narrow valleys and cities with large population concentrations [11].
The work by [12] analyzes the diurnal precipitation patterns in the tropical Andes of Colombia. It identified several key findings, with the following among them: (i) precipitation exhibits both a 24-hour and 12-hour cycle; (ii) the minimum daily precipitation occurs in the morning hours; (iii) a prominent peak in precipitation is observed in the afternoon over northeastern and western Colombia; (iv) over the western flank of the central Andes, precipitation peaks near midnight or in the afternoon or both; and stations on the eastern flank of the central mountain range experience maximum precipitation near midnight. Additionally, the authors of [13] discuss the diurnal precipitation cycle in the Aburra Valley, noting it is bimodal on a regional scale. From October to April, precipitation peaks in the afternoon (13:00-16:00 LST), whereas from May to September, the peak shifts to midnight (22:00-02:00 LST). Moreover, in their research, the authors asserted that the Caribbean [14], Chocó [15,16], and the Orinoco [17,18] low-level jets (LLJs) play a significant role in elucidating the seasonal variation of the diurnal cycle. Previous studies have underscored the importance of atmospheric variables in comprehending the dynamics of pollutants. The authors of [11,19] specifically address the impact of precipitation on particulate matter concentration in narrow valleys, notably in the case of the Aburrá Valley (Colombia).
The study conducted by [12], focused on analyzing the diurnal precipitation patterns in the tropical Andes of Colombia. It identified several key findings: precipitation exhibits both a 24-hour and 12-hour cycle; the minimum daily precipitation occurs in the morning hours; a prominent peak in precipitation is observed in the afternoon over northeastern and western Colombia; on the western flank of the central Andes, precipitation peaks near midnight or in the afternoon, or both; and stations on the eastern flank of the central mountain range experience maximum precipitation near midnight. Additionally, [13] discusses the diurnal precipitation cycle in the Aburra Valley, noting it is bimodal on a regional scale. From October to April, precipitation peaks in the afternoon (13:00-16:00 LST), while from May to September, the peak shifts to midnight (22:00-02:00 LST). Moreover, in their research, the authors asserted that the Caribbean [14], Chocó [15,16], and the Orinoco [17,18] Low-level jets (LLJ) play a significant role in elucidating the seasonal variation of the diurnal cycle. Previous studies have underscored the importance of atmospheric variables in comprehending the dynamics of pollutants. [11,19] specifically addresses the impact of precipitation on particulate matter concentration in narrow valleys, notably in the case of the Aburrá Valley (Colombia). They concluded that stable atmospheric conditions prevail during nighttime and early morning, with precipitation leading to reduced particulate matter concentrations through below-cloud scavenging. Conversely, unstable conditions dominate in the afternoon, facilitating vertical aerosol dispersion; precipitation during this period stabilizes the atmosphere, promoting early stabilization. The motivation for this study is to understand the relationship between the particulate matter present in the lower part of the troposphere and some meteorological variables. This understanding is crucial for defining territorial management and public health measures on a short-term scale (from hours to days) that should be implemented in cities where the effect of pollutants from local anthropogenic activity and other pollution sources could be conditioned by atmospheric connections, as in the case of the Aburrá Valley, where Colombia’s second-largest city Medellín is located. To address this study, we analyze the relationships between meteorological variables and particulate matter in the Aburrá Valley, addressing the following objectives: to establish possible relationships between meteorological variables and particulate matter levels; to apply multiple statistical techniques, including principal component analysis (PCA) and multiple regression analysis, to understand these relationships; to analyze the potential differences in the hydrometeorological dataset and levels for two periods: pre-pandemic and pandemic; to confirm the dynamics of levels dependent on weather conditions and to highlight the necessity of adequate planning to reduce emissions and human exposure to pollutants, especially in vulnerable groups. These objectives aim to deepen the understanding of how meteorological conditions influence air quality and to inform strategies for mitigating pollution and protecting public health. To tackle these goals, we characterize the diurnal cycles of meteorological variables and also quantify the relationship between and meteorological variables using principal component analysis and multiple linear regression models.
This work is organized as follows: Section 2 describes the region of study and datasets. Section 3.1 presents the general methodology. The results and discussions are presented in Section 4. Conclusions are drawn in Section 6. The main revised references are listed in Section .
2. Study Region and Data
The Aburrá Valley lies in the western region of Colombia (Figure 1) and is located on the central mountain range within the department of Antioquia (central Andes mountains). It spans over an area of approximately 1,326 and is located between latitudes 6°0’0”N - 6°35’0”N and longitudes 75°10’0”W - 75°40’0”W. The valley boasts an uneven topography with slopes that vary and altitudes ranging from 1,500 to 2,500 meters above sea level. Furthermore, this valley is constituted by 10 municipalities (Medellín, Caldas, La Estrella, Sabaneta, Itaguí, Envigado, Bello, Copacabana, Girardota, and Barbosa), which have a combined population of around 4,055,296 inhabitants (2020), according to the National Administrative Department of Statistics (Departamento Administrativo Nacional de Estadística; DANE; https://www.dane.gov.co/). Figure 1 shows the location of the Aburrá Valley in the local, regional, and continental context.
2.1. Meteorological Variables
Initially, we considered data associated with meteorological variables for the period 1 January 2019 to 16 August 2022 (2 years and 2 months) on a daily time scale. In particular, we used data from precipitation, temperature, radiation, wind speed (direction and magnitude), and the height of the boundary layer calculated from the ceilometer backscattering. The variables finally considered for each section of the study were chosen according to the representativeness of the quantity and quality of the data for each specific variable (this explains the non-homogeneity that is present in some cases in the results shown). Data were considered suitable for inclusion in the statistical analyses when at least 80% of the hourly data were present for a particular day and their magnitudes were within the expected ranges for each variable.
2.2. Particulate Matter Data
The breathable particulate matter present in the atmosphere of populated centers can be studied according to its size and can be classified: one of the smallest respirable fractions is called particulate matter . This group is made up of those particles with a diameter less than or equal to 2.5 micrometers. The Aburra Valley Early Warning System, also known as SIATA (according to its acronym in Spanish), project operates a set of particulate matter monitoring devices, which makes all its monitoring networks available to the public (https://siata.gov.co).
Both the measurement of particulate matter and the measurement of meteorological variables come from devices located at the MED-BEME station (station located at the Pedro Justo Berrio Educational Institution in the Belen Las Mercedes, west sector of Medellín. The measurement of the height of the atmospheric boundary layer was carried out using the ceilometer located at the National University of Colombia, also in the western sector of Medellín.
3. Methods
3.1. Definitions
The terms "wet season" and "dry season" are defined based on the patterns of accumulated rainfall observed at the project station. The wet and dry seasons correspond to periods of higher and lower humidity, respectively, with more or less accumulated rainfall. The wet season is characterized by higher accumulated rainfall. According to the data, the months of April and November are identified as part of the wet season, which coincides with the conventional periods of higher rainfall for the region. During this time, the intensity of rainfall is greater than 2 mm/hour, which significantly influences the concentration of , especially at night. The washout effect, where rainfall helps to remove particulate matter from the atmosphere, is more pronounced during the wet season at night. The dry season, on the other hand, is characterized by lower accumulated rainfall. The months of December and January are identified as part of the dry season, representing periods with the lowest accumulated rainfall. During this time, rainfall intensity is less than 2 mm/hour, and the effects of rainfall on concentration differ. The washout effect is less significant during the day but still notable at night.
3.2. Methodological Description
Data from two remote sensors on the ground, the ceilometers and the radiometer are used. Ceilometers measure the backscattering of the atmosphere and allow estimation of the height of the boundary layer. The radiometer measures the temperature and density of water vapor in the air column up to 10 km, allowing the estimation of several parameters. Both sensors belong to the SIATA project (SIATA has implemented an extensive network of sensors and predictive models that include monitoring of air quality, precipitation, seismic activity, and other atmospheric phenomena [20].
3.2.1. Principal Component Analysis (PCA)
We used principal component analysis (PCA), which is a statistical procedure that uses an orthogonal transformation to convert a set of observations of possibly correlated variables into a set of values of linearly uncorrelated variables called principal components. This statistical technique is widely used for dimensionality reduction, feature extraction, and data visualization. It is often used in machine learning, data mining, and other areas of science and engineering [21,22]. PCA is based on the diagonalization of the covariance matrix of the data, which involves the solution of an eigenvalue problem. The eigenvectors of the covariance matrix provide the directions of the principal components, while the associated eigenvalues indicate the amount of variance explained by each component [23]. In particular, in this work, we use PCA to quantify the importance of the set of meteorological variables and for the period of analysis (01/04/2019 to 16/08/2022). Moreover, we separate the time series considering two periods: Pre-pandemic (01/04/2019 to 31/03/2020) and Pandemic (01/04/2020 to 16/08/2022) to quantify possible differences in the set of variables in terms of their PCAs.
3.2.2. Multiple Linear Regression Model
In order to explore the influence of different meteorological variables on the behavior of , the variables temperature, solar radiation, wind direction, wind speed, and precipitation were selected to perform a multiple linear regression model with as the dependent variable [2]. In order to establish the effect of each variable, the regression coefficients were compared. In order to reduce the influence of the magnitude of the data, all variables were min-max normalized [24]. Two regression models of the same form are presented, each for the pre-pandemic and pandemic periods. The regression model is of the following form:
where b is the intercept, k1 to k5 are the slope coefficients, TempOut is temperature, WinDir is wind direction, and SolarRad is solar radiation.
4. Results
4.1. Temperature, Radiation, and Humidity
Figure 2 shows the diurnal cycle of , precipitation (ppt), temperature, solar radiation, the atmospheric boundary layer (ABL) height, and the relative humidity. In general, solar radiation, temperature, and the ABL height show similar behavior, whereas and relative humidity exhibit an opposite diurnal cycle. It should be noted that the maximum solar radiation and ABL height occur around noon, approximately 2 hours before the maximum temperature, because the effect of radiation is not immediate. Relative humidity and decrease (increase) when solar radiation, temperature, and ABL height increase (decrease) at noon (in the evening). peaks around 06:00 and 08:00. The height of the ABL for the diurnal cycle shows behavior strongly marked by its similarity with solar radiation, which is its main influence. When the height boundary layer is low, the accumulation of contamination on the surface is favored. In contrast, when the height of the boundary layer is high, dispersion by convection is favored; this is the main mechanism for cleaning the atmosphere in the Aburrá Valley [11,19].
The observations show how the high concentrations of occur at the same time as the lowest temperatures, although moderate concentrations also occur at higher temperatures. It is also identified that the highest concentrations of are observed at temperatures of around 20°C.
Table 1 shows the correlation coefficients for temperature and , both using the Pearson and Spearman methods with four different time lags. Pearson’s coefficient assumes that the relationship between the two variables is linear and requires normally distributed data. Spearman’s coefficient is a rank-based coefficient that is appropriate for linear or nonlinear relationships and does not require normally distributed data. The results obtained are all negative, which indicates that there is an inverse relationship between these two variables. The maximum value in magnitude is 0.4898, a moderately high value that indicates a relationship between both variables. It should be noted that this maximum correlation value in the Spearman process occurs with a lag of 2 hours since the temperature does not generate immediate effects on and must first cause convection phenomena. An increase in the magnitude of the correlation coefficients between approximately 3 y 4 % with respect to previous analysis campaigns stands out. This may be due to the availability of longer time series for both variables.
4.2. Precipitation
The diurnal cycle of hourly accumulated rainfall shows the lowest accumulated values from 03:00 to 14:00, a time slot where there is generally constant radiation due to the beginning of the day. The highest accumulated values occur between 15:00 and 02:00 due to the convective rain systems generated at midday and the advective systems arriving from the east, with maximum values at 15:00 followed by 01:00.
A relationship between precipitation and measurements that does not correspond to a linear order is identified from the observations. An inverse relationship can be suggested, where higher values of accumulated precipitation are associated with lower values of concentration. The presence of precipitation systems favors the removal of particulate matter suspended in the air but also favors atmospheric stability that is unfavorable for the circulation of pollutants [19]. Therefore, the occurrence of rainfall events affects concentration that differs depending on whether they occur at night or during the day. It is also clear that the net effect of precipitation during night hours on is removal. It is represented by a trend towards lower values when rainfall intensity is greater than 2 mm/hour (wet conditions), with a median of 14.47 g/, which is in contrast to values of less than 2 mm/hour (dry conditions) and a median of 19.22 g/. Since rain stabilizes the atmosphere during the day, this reduces dispersion and contributes to accumulation near the surface (Roldán-Henao et al., 2020). The effect of washout is not observed, with very similar values for the median of the wet period (14.73 g/) and the dry period (15.05 g/). This result is explicable if it is taken into account that, during diurnal rain events, anthropogenic emissions (traffic mainly) do not cease and are also higher than nocturnal emissions, even when there are restrictive mobility measures.
The rain time series is separated into the characteristic periods of the local climatology: two (2) periods of higher humidity with more accumulated rainfall and two (2) drier periods with less precipitation, always in intercalated cycles during the year. In the annual cycle of accumulated precipitation defined from data at the project station, it can be seen that the dry and wet periods represented by the months with the lowest (December and January) and highest (April and November) accumulated rainfall, respectively, coincide with the conventional ones for the region.
Figure 3 shows the behavior of according to dry and wet periods and during the day and night. While there is a visible washout effect at night during the rainy season, it is almost nil during the day, indicating that daytime rain events in the wet season do not have a significant effect on pollution concentrations. In the dry season, during the daytime, there is also minimal washout, but at night, the effect is more significant. It is concluded that atmospheric scrubbing is very effective during the nights of dry periods and more so during rainy periods. However, precipitation tends to promote the stability and accumulation of during daytime hours.
4.3. Wind Speed and Direction
For the periods of daytime (06:00 to 17:59) and nighttime (18:00 to 05:59) from April 2019 to February 2022, it is observed that calm winds predominate (wind speed magnitudes below 0.5 m/s). Regarding the wind direction, for the night period, about 50% of the data correspond to winds coming from the north, while the other directions present lower frequencies. In the daytime period, winds from the north are also predominant, although with a lower percentage, close to 25%. In contrast to the night period, in the daytime period, winds from the west and northeast are present, with percentages close to 10%. Finally, it should be noted that in the daytime period, despite the higher frequency of wind speed in the calm periods, multiple wind speed magnitudes of greater than 1 m/s (dark green) and 1.5 m/s (black) were also recorded.
For the daytime and nighttime periods defined previously, it is also observed that when the wind comes from directions between southwest and northwest (sparsely urbanized or rural areas of the valley), both daytime and nighttime concentrations are predominantly low, with values below 15 g/ but mostly below 10 g/. While the highest concentrations tend to occur when the wind comes from other directions (urban area of the valley). Moreover, it is observed that for wind speeds with magnitudes lower than 1 m/s (calms), there is a higher frequency of , higher than 15 g/. On the contrary, when speeds are higher than 1 m/s, these magnitudes are infrequent.
Furthermore, it has been noted that there exists an implied inverse correlation between wind speed and levels, although this relationship is not strictly linear. Elevated concentrations of tend to occur predominantly at low wind speeds, yet this pattern is not exclusive. Conversely, low wind speeds can also coincide with low concentrations, underscoring that while wind plays a crucial role in dispersing pollutants, it is not the sole determinant influencing this process.
Table 2 shows the negative values of the correlation coefficients, confirming the inverse relationship. Again, the values do not indicate a linear or monotonic relationship. The highest value in magnitude is presented with a lag of one (1 hour), again supporting the time-lagged effects over the immediate effects. There is an increase in the magnitude of the correlation coefficients between 3% and 4% (approximately) with respect to previous analysis campaigns. This may be due to the provision of longer time series for both variables.
4.4. Boundary Layer Height
The height of the atmospheric boundary layer was estimated using ceilometers in collaboration with the SIATA project. These devices are active remote sensors that emit light beams into the atmosphere and measure the backscattering they experience. With this information, the height of the mixing layer or atmospheric boundary layer can be estimated. Data from the SIATA tower station were used since this tower is the most geographically central station and has the largest amount of data available. The aim was to strengthen the analysis of meteorological conditions in the area and increase our ability to understand the phenomena that take place over time along with pollution events. Boundary layer changes are daily-scale phenomena that change rapidly in a matter of minutes or hours. The analysis of this phenomenon is performed at the diurnal cycle level.
The boundary layer shows very similar behavior over the 4 years of available data. The height fluctuates between 594 meters in 2019 at 05:00 and 1,017 meters in 2020 at 11:00. Table 3 shows the basic statistical data for each year.
By using ceilometer data, the values were identified differently for the Aburrá Valley Metropolitan Area (AMVA), using episode management periods (PGEs are the Spanish initials). These periods are the times of the year when the environmental authority declares special measures to deal with pollution. The PGE periods have slightly higher peak heights in the boundary layer than the non-PGE periods, marked by visibly exceeding 1,000 meters. The contamination levels show significant differences. In the initial periods of the year, both PGE and Non-PGE showed higher pollution concentrations. In the second half of the year, PGE and non-PGE are lower. This is consistent with the data, indicating that the first rainy season of the year generates greater affectations than the second in the Aburrá Valley. This stands out because the first PGE period of the year 2020 showed significantly higher levels than the other periods, indicating strong external pollution events that enhanced the episodes during this time. In general, in the four periods, the boundary layer decreases its height in the afternoon around 18:00. However, in the morning, there is a difference of approximately between 1 and 2 hours when it begins to increase its height between the non-PGE (before) and PGE (after) periods. This implies that in the PGE periods, the boundary layer takes longer to increase its height in the morning, which may cause a greater accumulation of pollutants.
The same analysis was performed for 2021. For this year, Figure 4 shows that pollution levels were much more similar to those of the previous year. In 2020, regional intrusion events were recorded for out-of-the-normal biomass burning and Saharan dust transport. The year 2021 shows with less variability, maintaining its maximum values around 30 g/. Again, the behavior of the boundary layer presents a time lag of approximately 1 or 2 hours in the morning to begin its ascent in the PGE concerning the non-PGE, indicating a delayed dispersion of pollutants in time at the beginning of the day.
Correlation coefficients were estimated for the values and height in the boundary layer series. The boundary layer series was reordered since it was at a resolution of approximately 16 seconds and was transformed to hourly values to coincide with the variable. Table 4 shows the Pearson and Spearman coefficients for these two series. All values have a negative sign, indicating their inverse relationship. The highest magnitude was obtained with a lag of 2 hours for the Spearman process, with a value of -0.2677. This indicates that despite the opposite behavior between these variables, there is no total linear or monotonic relationship between them. Numerous additional variables influence the atmospheric dynamics of and the boundary layer.
Regarding the relationships among the boundary layer heights, values, and other meteorological variables, the authors of [25,26,27,28,29] assert that persistent cloud cover over the Aburrá Valley and the mountainous region of Antioquia has a substantial impact on surface energy balances and local rainfall patterns. Consequently, it also influences the diurnal variation of the boundary layer height throughout the year. Some of this humidity is conveyed by the trade winds originating from the lowlands of the Caribbean, the Orinoco, and the Amazon, as well as from the Colombian Pacific coast via the Chocó jet. These factors warrant consideration when endeavoring to develop a climatological description of the Aburrá Valley.
4.5. Correlations between Meteorological Data and
4.5.1. Principal Component Analysis (PCA)
To characterize the main attributes of the hydrometeorological variables, we carried out a PCA on the following variables: wind direction, wind speed, rain, low temperature, high temperature, outside humidity, and the height of the boundary layer. For this analysis, we separated the time series considering two periods: pre-pandemic (01/04/2019 to 31/03/2020) and pandemic (01/04/2020 to 16/08/2022). Furthermore, the available data for each of those datasets correspond to 54.5 % and 63.18 % of the total hours for such periods, respectively. As our objective is to quantify possible differences in the set of variables including using PCA, we look for hours in which data and hydrometeorological time series have observational records.
Figure 5(a) shows the percentage of the total variance explained by each principal component. Our results indicate that pre-pandemic and pandemic explain around 52.9% and 58.7%, respectively. For both cases, the first principal component (PC1) explains the highest percentage of the total variance of hydrometeorological data. Subsequently, the second principal component (PC2) for pre-pandemic and pandemic explains around 11.9% and 12.21%, respectively. As could be expected, hydrometeorological attributes do not show notorious differences in terms of their principal components.
In the same line of work, six pollution events declared by the local environmental authority were identified, occurring before and during the pandemic. The same PCA analysis was performed (see Table 5), both individually and for the whole continuous set of data.
At the scale of events, work was carried out on those events with sufficient data over periods from one to three diary cycles. Figure 5(b) shows similar results to those found for the analysis of continuous data in the pre-pandemic and pandemic periods. In the case of the event analysis, the first principal component is able to explain most of the total variance in the data of event 1 (62.9%), but it does not do so conclusively. For the remaining contamination events, the values of CP1 drop to 48.7% (event ev4). Moreover, for the analysis at the level of declared contamination events, and similar to what was found for the analysis of data during the pre-pandemic and pandemic periods, the results (even though fewer input variables were considered in the first case) in reference to the hydrometeorological attributes do not present notable differences in their principal components such that allow us to assert that a specific component significantly explains the high values of variance.
The scatter diagrams and associated ellipse plots depict the scores obtained from a linear combination of reduced variables. The relationships between principal components are shown in Figure 6. At this level of analysis, no significant trend can be conclusively defined. However, a more discernible relationship can be observed between the components that account for a greater proportion of the data variance (CP1 vs. CP2), which becomes less distinct when components that vary in their explanatory power (CP1 vs. CP5) are considered.
4.5.2. Multiple Linear Regression Model Results
Before performing the multiple linear regression model, the correlations between the variables for both periods of analysis were explored. Figure 7 shows the Spearman correlation matrix between the variables wind speed, precipitation, temperature, wind direction, solar radiation, and for both studied periods, where only the coefficients with a significance level of less than 0.05 are displayed. As can be observed, temperature is strongly positively correlated with solar radiation and wind speeds, whereas is negatively correlated with temperature and, consequently, solar radiation. Furthermore, these results are consistent with the characterization shown in Figure 2.
The regression coefficients for the multiple linear regression model for both periods are shown in Table 6, along with their P-values, which indicate the statistical significance of each coefficient. A lower p-value suggests that the corresponding coefficient is statistically significant, meaning that there is strong evidence to reject the null hypothesis. Alternatively, P-value reflects the confidence in the estimated coefficient. The variable shows a significant negative dependence on temperature in both periods and a positive dependence on solar radiation. The findings reinforce the conclusion that there is no statistically significant relationship between rainfall depth and levels.
During the pandemic, a one unit increase in wind speed was associated with a significant 8.57 unit decrease in , suggesting that wind had a greater dispersing effect on particulate pollutants during this period. Although the coefficients for rainfall are negative in both periods, indicating a possible reduction in with more rainfall, the P-values indicate that these results are not statistically significant, so it cannot be concluded with confidence that rainfall has a significant effect on . Temperature showed a negative and significant relationship with in both periods. This suggests that an increase in temperature is consistently associated with a decrease in concentrations of , probably because higher temperatures favour the dispersion or degradation of suspended particles. Solar radiation had a positive and significant effect on in both periods, suggesting that an increase in solar radiation is associated with an increase in concentrations. This may be because solar radiation promotes photochemical reactions that produce secondary aerosols, thereby increasing the amount of particulate matter in the air [30,31,32]. In Figure 8, we present a graphical summary of the regression model by isolating the relationship between and an explanatory variable of temperature and solar radiation while holding all other variables constant, following [33].
These figures exemplify the graphical summary made for the rest of the variables. The figures are presented only for temperature and solar radiation since these are the variables where there is a significant relationship in both periods. As can be seen, although the relationship is significant, the value of the slope for temperature in both periods remains within the same order of magnitude. The same result is obtained for solar radiation. This reveals that the period of pandemia or pre-pandemia does not have a major influence on the relationship between temperature and PM 2.5 and solar radiation. The same result was obtained for the rest of the variables.
5. Discussion
The findings of this study highlight the complex interactions between particulate matter and various meteorological variables in the Aburrá Valley. Works as [34,35] constitute partial contributions to the study of the subject at the local level. Our analysis revealed some correlations between concentrations and factors such as temperature, solar radiation, and atmospheric boundary layer (ABL) height, which vary diurnally and seasonally.
5.1. Meteorological Influence on
5.1.1. Temperature and Solar Radiation
The diurnal cycles of temperature and solar radiation show a strong positive correlation, with peaks observed around mid-morning to early afternoon (10:00 to 13:00 CLT). levels were found to be inversely related to these variables, suggesting that higher temperatures and increased solar radiation facilitate the dispersion of particulate matter by enhancing atmospheric mixing and increasing the boundary layer height. This relationship remained consistent across both pre-pandemic and pandemic periods, indicating that the overall impact of these meteorological factors on levels is stable regardless of changes in anthropogenic activity. Several factors may explain the difference between the Spearman correlation and the multiple linear regression results for and radiation. First, the Spearman correlation measures the relationship between two variables without taking into account the influence of other variables that could act as interferences. In contrast, the multiple linear regression model estimates the effect of solar radiation on while controlling for other meteorological factors such as temperature, wind speed and precipitation. This means that the negative relationship observed in the Spearman correlation could be influenced by other variables not taken into account, such as temperature, which could drive the negative correlation. In addition, the regression model assumes a linear relationship, whereas Spearman’s method can capture non-linear monotonic relationships. If the relationship between solar radiation and is non-linear or involves interactions with other variables, the regression model may show a different direction of effect. Therefore, the contradictory results are not necessarily inconsistent but rather reflect the complexity of the underlying relationships between these variables when different statistical methods are applied. It is also important to note that the behavior of solar radiation and temperature is not always directly proportional, and there are several reasons for this: differential absorption and emission, albedo and Reflection, current atmospheric conditions, greenhouse effect, and diurnal and seasonal cycles, among others.
5.1.2. Precipitation and Relative Humidity
Precipitation events generally result in a reduction in levels through wet scavenging. However, the timing of these events is crucial. Precipitation occurring during stable atmospheric conditions (nighttime and early morning) is more effective at reducing particulate concentrations compared to events during unstable conditions (afternoon), which may lead to the earlier stabilization of the atmosphere and limit the dispersion of pollutants. This relationship can be attributed to the scavenging effect, where rain droplets capture and remove particulate matter from the atmosphere, effectively "cleaning" the air [36]. This washout effect has been widely observed in various studies, showing that rainfall can significantly reduce airborne particulate matter [37]. However, the study also reveals the complexity of this relationship. The timing and intensity of precipitation play a critical role in determining its effectiveness in reducing levels. For instance, precipitation during the night is more effective in lowering PM2.5 concentrations due to the stable atmospheric conditions that limit pollutant dispersion and enhance the scavenging effect [38]. Conversely, during the daytime, when the atmosphere is more unstable, rainfall may not significantly impact levels, as the mixing of air can disperse pollutants more effectively before they are removed by rain [39]. Additionally, the study notes that during periods of lower precipitation intensity (less than 2 mm/hour), the reduction in is less pronounced, particularly during the day. This suggests that light rain may not be sufficient to significantly alter concentrations, especially when ongoing emissions continue to contribute to pollutant levels. This observation is consistent with other research that highlights the varying impact of precipitation on air quality, depending on factors such as rain intensity, duration, and the presence of other meteorological conditions like wind and temperature [40].
5.1.3. Wind Speed and Direction
Wind dynamics also play a pivotal role in the dispersion of . Higher wind speeds were associated with lower concentrations, as increased airflow aids in the dispersal of pollutants. However, the wind direction can modulate this effect, especially in a topographically constrained environment such as the Aburrá Valley, where valley winds can either trap or disperse pollutants depending on their direction and strength. Based on previous research, the relationship between wind speed, wind direction, and concentrations in the Aburrá Valley, Colombia, highlights significant insights into how these meteorological factors influence air quality. Studies have consistently shown that there is a generally inverse correlation between wind speed and levels, where lower wind speeds are associated with higher concentrations of particulate matter. This pattern is attributed to the reduced horizontal and vertical mixing of the atmosphere during calm conditions, leading to the accumulation of pollutants near the surface [41]. The direction of the wind is also a crucial factor in determining concentrations. For instance, winds from rural areas tend to bring cleaner air, resulting in lower levels, whereas winds from urbanized areas often carry higher concentrations of particulate matter due to the density of emission sources[2]. This observation aligns with findings in other urban valleys where topography plays a significant role in modulating wind patterns and pollutant dispersion [42]. Moreover, the complexity of interactions between wind dynamics and concentrations has been highlighted in various studies. Although higher wind speeds generally lead to the dispersion of pollutants, resulting in lower levels, there are instances where low wind speeds do not necessarily lead to high particulate concentrations, emphasizing the need to consider other meteorological factors such as temperature, solar radiation, and atmospheric boundary layer (ABL) height [4]. In summary, the relationship between wind speed, wind direction, and in the Aburrá Valley is characterized by an inverse correlation between wind speed and particulate matter levels, with wind direction significantly influencing this effect. These findings are crucial for understanding the atmospheric processes that govern air quality in urbanized valleys and for developing targeted air quality management strategies that account for the complex interplay of meteorological variables[7].
5.2. Impact of the COVID-19 Pandemic
The study also investigated the impact of the COVID-19 pandemic on the relationship between meteorological variables and . The findings indicate that while the absolute levels of might have been influenced by reduced human activities during the pandemic, the fundamental relationships between and meteorological variables remained unchanged. This suggests that meteorological conditions consistently play a dominant role in determining levels, regardless of variations in anthropogenic emissions. This suggests that while anthropogenic activities significantly contribute to PM2.5 concentrations, meteorological conditions play a dominant role in modulating these levels. For instance, previous studies have demonstrated that during periods of reduced human activity, such as during the COVID-19 lockdowns, there was a marked decrease in air pollution, particularly PM2.5, due to lower emissions from traffic and industrial activities [43]. However, even with reduced emissions, PM2.5 levels still showed a strong correlation with meteorological variables like temperature and wind speed, reinforcing the idea that natural factors significantly influence air pollution dynamics [44]. The study observed that, despite lower overall PM2.5 levels during the pandemic, the diurnal and seasonal patterns of PM2.5 concentration remained similar to those observed in the pre-pandemic period. This indicates that meteorological conditions such as solar radiation, wind patterns, and temperature continue to dictate the dispersion and concentration of particulate matter in the atmosphere [45]. Interestingly, the study found that the relationship between PM2.5 and solar radiation, which influences the atmospheric boundary layer’s height, was consistent across both periods. This finding is consistent with other research showing that the dispersion of pollutants is heavily dependent on the boundary layer’s dynamics, which are influenced by solar radiation [46]. Additionally, the study’s multiple linear regression analysis highlighted that while human activities were curtailed during the pandemic, the meteorological drivers of PM2.5 remained consistent, indicating a robust relationship that is relatively unaffected by short-term changes in emission patterns [47].
5.3. Principal Component Analysis and Multiple Regression Models
Principal component analysis (PCA) and multiple linear regression (MLR) models were employed to quantify the relationships between and meteorological variables. PCA revealed that the first principal component accounted for a significant portion of the variance (around 60%), with subsequent components explaining progressively less. This indicates that a few key meteorological variables predominantly drive variability. MLR models further underscored the significant negative dependence of on temperature and positive dependence on solar radiation, reinforcing the findings from the correlation analysis. The consistent relationships observed across different periods highlight the critical role of atmospheric conditions in modulating air quality. These insights are crucial for developing targeted air quality management strategies, particularly in urban areas with complex topographies such as the Aburrá Valley. Future research should focus on finer temporal scales and consider additional variables such as traffic patterns and industrial activities to further elucidate the dynamics of air pollution in this region. The concentration of particulate matter in the Aburrá Valley is significantly influenced by a range of meteorological factors, including temperature, topography, and atmospheric boundary layer (ABL) height. Understanding these relationships is crucial for developing effective pollution management strategies, especially given the public health implications of , which include respiratory and cardiovascular diseases. Solar radiation plays a pivotal role in the diurnal cycle of concentrations. The study indicates that solar radiation and temperature exhibit similar diurnal patterns, with peaks around midday. This is due to the delayed effect of radiation heating the surface, which subsequently raises the temperature. As solar radiation increases, the temperature rises, leading to the expansion of the ABL. A higher ABL allows for greater dispersion of pollutants, thereby reducing surface concentrations. Conversely, during periods of low solar radiation, such as early morning or late evening, the ABL is lower, and pollutants accumulate closer to the surface, resulting in higher levels. The topography of the Aburrá Valley, characterized by its narrow structure and surrounding mountainous terrain, significantly influences local wind patterns and atmospheric stability. The valley’s topography restricts airflow, which can lead to the trapping of pollutants. During nighttime and early morning, the valley experiences stable atmospheric conditions, which further restrict vertical mixing and promote the accumulation of near the ground. In contrast, daytime heating can induce convective currents, enhancing vertical mixing and dispersion of pollutants.
5.3.1. Principal Component Analysis (PCA)
PCA conducted on hydrometeorological variables and concentrations in the Aburrá Valley offers insights into the complex interactions among the variables that influence the air quality in the region. In this sense, we highlight the key findings in terms of the explained variance, consistency of results, event-based analysis, and correlation patterns as follows: Explained variance: The first principal component (PC1) explained about 60% of the total variance in the hydrometeorological data for both the pre-pandemic and pandemic periods. This indicates that a single principal component captures an important part of the variability of the dataset. Subsequently, the principal components (PC2, PC3, and PC4) each explained about 10% of the variance and the remaining portion is explained by the other four PCs. The dimension of the whole set of meteorological data can be reduced from 8 to 4, highlighting that even if the dimension is reduced, not all the variables in the hydroclimatological data are redundant in terms of variance. Consistent results for different periods: The PCA results showed no significant differences between the pre-pandemic and pandemic periods, indicating that the primary hydrometeorological drivers of concentrations remained consistent despite changes in human activity. This suggests a robust underlying meteorological influence that is relatively unaffected by temporal changes in anthropogenic emissions. Event-based analysis: PCA was also applied to six specific pollution events. For the most significant event (Event 1), PC1 explained 62.9% of the variance, whereas for other events, the explained variance of PC1 ranged from 48.7% to 60%. This consistency reinforces the dominant role of certain meteorological conditions in driving levels during pollution events. The results for individual pollution events mirrored those found in the continuous data analysis, confirming the stability of the identified principal components. Correlation patterns: The analysis revealed strong correlations between temperature, solar radiation, and wind speed with concentrations. Specifically, levels were negatively correlated with temperature and solar radiation, indicating that higher temperatures and more intense solar radiation contribute to a higher atmospheric boundary layer (ABL), which promotes the dispersion of pollutants. In contrast, the levels were positively correlated with relative humidity, suggesting that more humid conditions are associated with higher pollutant concentrations, likely due to reduced dispersion and increased secondary aerosol formation.
5.3.2. Multiple Linear Regression (MLR)
MRL was conducted on the dataset and provided detailed insights into the relationships between the concentrations and various meteorological variables in the Aburrá Valley. In this sense, we highlight the key significant predictors: Temperature: The MLR analysis reveals a significant negative relationship between temperature and concentrations. This indicates that higher temperatures are associated with lower levels of , likely due to enhanced atmospheric mixing and dispersion. Solar radiation: There is a significant positive correlation between solar radiation and concentrations. This somewhat counterintuitive finding may be explained by the role of solar radiation in photochemical reactions that generate secondary aerosols. Wind speed: Wind speed negatively correlates with , suggesting that higher wind speeds facilitate the dispersion of particulate matter, reducing concentrations at the surface. Wind direction: The impact of wind direction on concentrations is less pronounced, with significant effects observed in some cases but not others. This variability may be due to the complex topography of the valley, which influences local wind patterns. Precipitation: Contrary to common assumptions, the study found no significant relationship between rainfall and concentrations. This finding should be supported in the future by different analyses of the Aburrá Valley data. Temporal consistency: The relationships between and the meteorological variables remained consistent across the pre-pandemic and pandemic periods. This consistency suggests that the underlying meteorological drivers of concentrations are stable over time, regardless of variations in human activities. Diurnal patterns: The diurnal cycle analysis shows that concentrations peak in the early morning hours (around 06:00 to 08:00), corresponding with low temperatures and high relative humidity. These conditions limit atmospheric mixing and facilitate the accumulation of pollutants near the surface. The atmospheric boundary layer (ABL) height, solar radiation, and temperature exhibit peaks around midday. Higher ABL heights during the day promote the dispersion of , leading to lower concentrations. Implications for environmental management: Targeted mitigation strategies: The strong negative correlation between wind speed and suggests that enhancing urban ventilation could be an effective strategy to reduce pollution levels. This could involve urban planning measures such as increasing green spaces and designing buildings to optimize airflow. Given the positive correlation with solar radiation, strategies to mitigate secondary aerosol formation might be necessary, particularly during periods of high solar radiation.
5.4. Atmospheric Dynamics
Regarding the diurnal dynamics of in the Aburrá Valley, Colombia, this reveals significant interactions with various meteorological variables. Here is a detailed description based on the study.
Diurnal cycle and concentrations: Morning peaks: concentrations are highest in the early morning hours (06:00 to 08:00). This is due to the lower atmospheric boundary layer (ABL) height during these hours, which restricts the vertical dispersion of pollutants. Additionally, this period coincides with increased traffic emissions, further contributing to higher levels. Midday lows: As the day progresses, solar radiation increases, which leads to a rise in the ABL height. The higher ABL enhances the dispersion of pollutants, resulting in the lowest concentrations around midday. Evening increase: In the evening, as solar radiation decreases, the ABL height lowers again, leading to an increase in concentrations. This period also sees another peak in traffic emissions, contributing to higher levels.
Temperature and solar radiation: There is an inverse relationship between temperature, solar radiation, and concentrations. Higher temperatures and solar radiation typically result in a higher ABL, promoting better dispersion of pollutants and, thus, lower levels. Conversely, lower temperatures and reduced solar radiation (common in the early morning and evening) contribute to higher concentrations due to a lower ABL height.
Wind speed and direction: Wind speed is inversely related to concentrations. Lower wind speeds (below 1 m/s) are associated with higher levels due to reduced horizontal dispersion. The direction of the wind also impacts concentrations. Winds coming from less urbanized areas (southwest to northwest) are associated with lower levels, whereas winds from urban areas lead to higher concentrations.
Atmospheric boundary layer (ABL): ABL height plays a crucial role in the diurnal cycle of . During nighttime and early morning, the ABL is lower, leading to higher concentrations due to limited vertical dispersion. During the daytime, especially in the afternoon, ABL height increases significantly, which enhances the vertical mixing and dispersion of pollutants, resulting in lower levels. The concentration of particulate matter in the Aburrá Valley is significantly influenced by a range of meteorological factors, including solar radiation, topography, and atmospheric boundary layer (ABL) height. Understanding these relationships is crucial for developing effective pollution management strategies, especially given the public health implications of , which include respiratory and cardiovascular diseases. Solar radiation plays a pivotal role in the diurnal cycle of concentrations. The study indicates that solar radiation and temperature exhibit similar diurnal patterns, with peaks around midday. This is due to the delayed effect of radiation heating the surface, which subsequently raises the temperature. As solar radiation increases, the temperature rises, leading to the expansion of the ABL. A higher ABL allows for greater dispersion of pollutants, thereby reducing surface concentrations. Conversely, during periods of low solar radiation, such as the early morning or late evening, the ABL is lower, and pollutants accumulate closer to the surface, resulting in higher levels. The topography of the Aburrá Valley, characterized by its narrow structure and surrounding mountainous terrain, significantly influences local wind patterns and atmospheric stability. The valley’s topography restricts airflow, which can lead to the trapping of pollutants. During nighttime and early morning, the valley experiences stable atmospheric conditions, which further restrict vertical mixing and promote the accumulation of near the ground. In contrast, daytime heating can induce convective currents, enhancing vertical mixing and the dispersion of pollutants.
Some of the aspects of discussion related to the role of aerosol transport due to winds are the following: The valley’s topography channels wind flow, which can enhance wind speed in certain areas. These winds are crucial in the transport of aerosols, both horizontally and vertically. Horizontal transport: Daytime winds: During the daytime, the valley experiences up-valley winds driven by thermal differences between the valley floor and surrounding highlands. These winds can transport pollutants from urban areas to less populated regions, potentially affecting air quality over a broader area nighttime winds: At night, the cooling of the valley slopes leads to down-valley winds. These winds can concentrate pollutants in lower areas, particularly urban centers, exacerbating pollution levels during early morning hours. Vertical mixing: Strong winds and turbulence: Strong winds enhance vertical mixing in the atmosphere. Increased turbulence promotes the dispersion of aerosols through a deeper atmospheric layer, temporarily reducing surface-level concentrations. The study indicates that higher wind speeds are associated with lower levels due to enhanced dispersion. Calm conditions: During periods of low wind speeds, vertical mixing is limited, leading to the accumulation of pollutants near the surface. This is particularly evident during stable atmospheric conditions in the early morning and late evening when concentrations are highest. Impact on concentrations: Correlation with wind speed: The study shows a negative correlation between wind speed and concentrations. Higher wind speeds generally correlate with lower levels due to better dispersion. However, this relationship is not strictly linear, as other factors, such as wind direction and local emissions, also play a role.
6. Conclusions
The study on in the lower troposphere and its link to meteorological variables is crucial for informing future territorial management and short-term public health measures in cities significantly affected by local or transported anthropogenic activity. Such is the case of the Valle de Aburra, where Medellin, Colombia’s second city, is located.
This research characterizes the diurnal cycles of meteorological variables in the Aburra Valley (Colombia) and their relationship with particulate matter . Additionally, this research calculates the correlations between various meteorological variables and using classical statistical data analysis tools, including probability mass functions, principal component analysis (PCA), and multiple linear regression models. In general, this work presents a high level of complexity associated with the behavior of each hydrometeorological variable due to conditioning factors such as tropical hydrometeorology and the orographic conditions of the region of the study site, which causes a surface wind regime tied to the narrow valley conditions. Furthermore, the homogeneity, consistency, and record length of time series are critical aspects to consider prior to any quantification.
This approach also characterizes the diurnal cycles of meteorological variables in the Aburrá Valley (Colombia) and their relationship with particulate matter . The findings indicate a consistent pattern among temperature, atmospheric boundary layer (ABL) height, and solar radiation, with peaks around 10:00 and 13:00 CLT. Conversely, precipitation, relative humidity, and show opposite behaviors. The key results include the following: Correlation consistency: Temperature and solar radiation maintain a significant but stable relationship with during both the pre-pandemic and pandemic periods. Peaks: concentrations peak at around 7:00 CLT, preceding the ABL height peaks for both PGE and non-PGE events. Implications for public health: The study highlights the need for the effective planning of daily activities to reduce emissions and exposure, especially for vulnerable groups. Short-term exposure to air pollutants can cause significant respiratory and cardiovascular issues. These results underline the importance of considering local weather conditions in managing air quality and protecting public health in urban environments such as Medellín.
Regarding the diurnal cycle, there is consistency among temperature, ABL height, and solar radiation, which show peaks at around 10:00 and 13:00 CLT. Furthermore, the precipitation, relative humidity, and exhibit opposite behavior to those variables previously mentioned. Moreover, the diurnal cycle analysis for the episode management periods (PGE) and non-PGE reveals that peaks (at around 7:00 CLT) lead ABL height for the PGE and non-PGE events. This behavior is consistent for all events analyzed.
The analysis of relative frequency functions considering rainless and rainy periods indicates that the relative frequency functions exhibit similar behavior for daytime and for nighttime. Likewise, the relative frequency functions show differences of less than 5%. Then, although some authors state that rainfall is a process that facilitates atmospheric cleaning [11,19], our findings do not show a strong relationship between rainfall and the presence of particulate matter.
From the graphical analysis, in the daily cycle, it can also be observed that inverse behavior in certain moments of the day between the presence of particulate matter and the atmospheric boundary layer ABL height occur, both for periods of management of environmental pollution episodes (PGE) and for non-PGE periods. During the period from 3:00 CTL to 8:00 CLT, when ABL is low, the values are at higher levels. In particular, the behavior of the boundary layer presents a time lag of approximately 1 or 2 hours in the morning to begin its ascent in the PGE with respect to the non-PGE, indicating a delayed dispersion of pollutants overtime at the beginning of the day.
The main objective of this work, described as establishing possible relationships between meteorological variables and , lends itself to multiple statistical techniques, among which it is suggested to continue working with principal component analysis. Its objective is to transform a set of correlated variables into a new set of uncorrelated variables that best represent them. This technique seeks to reduce the dimensionality in which the original set of variables is expressed.
Regarding principal component analysis (PCA), we analyzed possible differences in the hydrometeorological dataset, including data for two periods: pre-pandemic (01/04/2019 to 31/03/2020) and pandemic (01/04/2020 to 16/08/2022), separately. In this analysis, we include the continuous time series in the mentioned periods. The objective is to quantify if there is a significant difference in the variance explained by the principal components (PCs) in such cases. Our results showed that the first PC explained around 60% of the variance in the set of variables, and the second PC (and so on) explained less than 10% for both the analyzed cases. In this sense, there is no significant difference between both PCA analyses. Moreover, we carried out an analogous PCA but selected (from the time series) the most predominant particulate matter events based on the historical PGE information for the available record length. Multiple regression analysis was another tool used to establish the statistical relationship between the meteorological variables of temperature, solar radiation, wind speed, wind direction, and precipitation and the variable. Although the dependence of on temperature and solar radiation is significant, it remained in the same order of magnitude for both periods, which implies that the pandemic and post-pandemic periods did not change the statistical relationship between these meteorological variables and . The findings of our research confirm that the dynamics of levels are dependent on the weather conditions of the city; they also confirm the need to carry out the adequate planning of daily activities with the objectives of reducing emissions associated with transportation and exposure associated with human activity schedules, mainly in vulnerable groups. Although hourly exposure to air pollutants has not been studied with much intensity, it is recognized that these short periods produce important physiological alterations in the respiratory system that can trigger medical emergencies in people with underlying diseases such as asthma or cardiovascular disease. These must be taken into account in the institutional planning of massive programs to promote outdoor physical activity in people over 60 years of age and physical education in groups of children under 5 years of age in schools [48,49,50].
Author Contributions
Juan C. Parra, Miriam Gómez, Hernán D. Salas, and Blanca A. Botero have contributed to the study conception and design. Material preparation and data collection were performed by Jaime Tavera and María P. Velásquez. Data processing and analysis were performed by Juan C. Parra, Miryam Gómez, Hernán D. Salas, Blanca A. Botero, Jaime Tavera, and María P. Velásquez. Miriam Gómez and Juan G. Piñeros contributed to project administration and revision. The first draft of the manuscript was written by Juan C. Parra, Miryam Gómez, Hernán D. Salas, Blanca A. Botero, Jaime Tavera, María P. Velásquez, and Juan G. Piñeros. All authors read and approved the final manuscript. All authors have read and agreed to the published version of the manuscript "Linking meteorological variables and particulate matter in the Aburrá Valley, Colombia"
Acknowledgments
The work carried out by J.C. Parra and M. Gómez was supported by the Politécnico Colombiano Jaime Isaza Cadavid. The work carried out by Blanca A. Botero was supported by the University of Medellin. The work carried out by H. D. Salas was supported by the Instituto Tecnológico Metropolitano. The work carried out by Juan G. Piñeros was supported by the University of Antioquia. We also thank the research program Development Of A Knowledge Management Program On Atmospheric Pollution And Its Health Effects In The Valley Of Aburrá Of Antioquia 2021–2024 (BPIN 2020000100410), financed by the Sistema General de Regalías (SGR) of the Republic of Colombia, and executed by the Politécnico Colombiano Jaime Isaza Cadavid.
References
- Ramírez, O.; Mura, I.; Franco, J.F. How Do People Understand Urban Air Pollution? Exploring Citizens’ Perception on Air Quality, Its Causes and Impacts in Colombian Cities. Open Journal of Air Pollution 2017, 06, 1–17. [Google Scholar] [CrossRef]
- Jin, H.; Chen, X.; Zhong, R.; Liu, M. Influence and prediction of PM2.5 through multiple environmental variables in China. Science of the Total Environment 2022, 849, 1–16. [Google Scholar] [CrossRef] [PubMed]
- Collaborators, G. .R.F. GBD 2019 Risk Factors Collaborators. Global burden of 87 risk factors in 204 countries and territories, 1990-2019: a systematic analysis for the Global Burden of Disease Study 2019. The Lancet 2020, 396, 1223–1249. [Google Scholar] [CrossRef]
- Molina, M.J.; Molina, L.T. Megacities and Atmospheric Pollution. Journal of the Air & Waste Management Association 2004, 54, 644–680. [Google Scholar] [CrossRef]
- Organization, W.H. WHO Global air quality guidelines (AQG)- Particulate matter (PM2.5 and PM10), ozone, nitrogen dioxide, sulfur dioxide and carbon monoxide 2021. Available online: https://iris.who.int/handle/10665/345329.
- Organization, W.H. World health statistics 2024 Monitoring health for the SDGs, Sustainable Development Goals 2024. Available online: https://www.who.int/publications/i/item/9789240074323.
- Parya Broomandi, Xueyu Geng, W. G.A.P.D.T.; Kim, J.R. Dynamic Complex Network Analysis of PM2.5 Concentrations in the UK, Using Hierarchical Directed Graphs (V1.0.0). Sustainability 2021, 13. [Google Scholar] [CrossRef]
- Handbook of Atmospheric Science: Principles and Applications. Reference Reviews 2004, 18, 48–49. [CrossRef]
- Panday, A.K.; Prinn, R.G.; Schär, C. Diurnal cycle of air pollution in the Kathmandu Valley, Nepal: 2. Modeling results. Journal of Geophysical Research 2009, 114, D21308. [Google Scholar] [CrossRef]
- Kong, D.; Ning, G.; Wang, S.; Cong, J.; Luo, M.; Ni, X.; Ma, M. Clustering diurnal cycles of day-to-day temperature change to understand their impacts on air quality forecasting in mountain-basin areas. Atmospheric Chemistry and Physics 2021, 21, 14493–14505. [Google Scholar] [CrossRef]
- Hoyos, C.D.; Herrera-Mejía, L.; Roldán-Henao, N.; Isaza, A. Effects of fireworks on particulate matter concentration in a narrow valley: the case of the Medellín metropolitan area. Environmental Monitoring and Assessment 2020, 192, 6. [Google Scholar] [CrossRef]
- Poveda, G.; Mesa, O.J.; Salazar, L.F.; Arias, P.A.; Moreno, H.A.; Vieira, S.C.; Agudelo, P.A.; Toro, V.G.; Alvarez, J.F. The Diurnal Cycle of Precipitation in the Tropical Andes of Colombia. Monthly Weather Review 2005, 133, 228–240. [Google Scholar] [CrossRef]
- Bedoya-Soto, J.M.; Aristizábal, E.; Carmona, A.M.; Poveda, G. Seasonal Shift of the Diurnal Cycle of Rainfall Over Medellin’s Valley, Central Andes of Colombia (1998–2005). Frontiers in Earth Science 2019, 7. [Google Scholar] [CrossRef]
- Wang, C. Variability of the Caribbean Low-Level Jet and its relations to climate. Climate Dynamics 2007. [Google Scholar] [CrossRef]
- Poveda, G.; Mesa, O.J. On the existence of Lloró (the rainiest locality on Earth): Enhanced ocean-land-atmosphere interaction by a low-level jet. Geophysical Research Letters 2000, 27, 1675–1678. [Google Scholar] [CrossRef]
- Yepes, J.; Poveda, G.; Mejía, J.F.; Moreno, L.; Rueda, C. CHOCO-JEX: A Research Experiment Focused on the Chocó Low-Level Jet over the Far Eastern Pacific and Western Colombia. Bulletin of the American Meteorological Society 2019, 100, 779–796. [Google Scholar] [CrossRef]
- Jiménez-Sánchez, G.; Markowski, P.M.; Jewtoukoff, V.; Young, G.S.; Stensrud, D.J. The Orinoco Low-Level Jet: An Investigation of Its Characteristics and Evolution Using the WRF Model. Journal of Geophysical Research: Atmospheres 2019, 124, 10696–10711. [Google Scholar] [CrossRef]
- Builes-Jaramillo, A.; Yepes, J.; Salas, H.D. The Orinoco Low-Level Jet and its association with the hydroclimatology of northern South America. Journal of Hydrometeorology 2021. [Google Scholar] [CrossRef]
- Roldán-Henao, N.; Hoyos, C.D.; Herrera-Mejía, L.; Isaza, A. An Investigation of the Precipitation Net Effect on the Particulate Matter Concentration in a Narrow Valley: Role of Lower-Troposphere Stability. Journal of Applied Meteorology and Climatology 2020, 59, 401–426. [Google Scholar] [CrossRef]
- Government of Medellín, EPM and ISAGEN. SIATA: Early Warning System for Medellin and the Aburrá Valley 2013. Awarded the FRIDA prize in Development category.
- Principal Component Analysis; Springer Series in Statistics, Springer-Verlag: New York, 2002. [CrossRef]
- Statistical Methods in the Atmospheric Sciences; Elsevier, 2019. [CrossRef]
- Jolliffe, I.T. Principal Component Analysis, 2nd ed.; Springer Series in Statistics; Springer-Verlag: New York, 2002. [Google Scholar] [CrossRef]
- Hao, X.; Hu, X.; Liu, T.; Wang, C.; Wang, L. Estimating urban PM2.5 concentration: An analysis on the nonlinear effects of explanatory variables based on gradient boosted regression tree. Urban Climate 2022, 44. [Google Scholar] [CrossRef]
- Jiménez Mejía, J.F. Altura de la Capa de Mezcla en un área urbana, montañosa y tropical. Caso de estudio: Valle de Aburrá (Colombia). Ph.D. Thesis, Universidad de Antioquia, 2016. Available online: https://hdl.handle.net/10495/5738.
- Jiménez, J.F.; others. The nocturnal boundary layer of Aburra’s valley, a tropical urban area with complex topography. Atmospheric Environment 2017, 153, 204–214. [Google Scholar] [CrossRef]
- Jiménez, J.F.; others. Spatio-temporal variability of the Atmospheric Boundary Layer in the Aburrá Valley. Atmospheric Research 2018, 209, 124–134. [Google Scholar] [CrossRef]
- Jiménez, J.F.; others. Urban Mixing Height in Mountainous Terrain: An ARW Simulation for Aburrá Valley (Colombia). Boundary-Layer Meteorology 2019, 170, 1–18. [Google Scholar]
- Jiménez, J.F.; others. Characterization of the Atmospheric Boundary Layer in a Narrow Tropical Valley Using Remote Sensing and Radiosonde Observations, and the WRF Model: The Aburrá Valley Case Study. Journal of Applied Meteorology and Climatology 2020, 59, 857–872. [Google Scholar]
- Claeys, M.; Graham, B.; Vas, G.; Wang, W.; Vermeylen, R.; Pashynska, V.; Cafmeyer, J.; Guyon, P.; Andreae, M.O.; Artaxo, P.; Maenhaut, W. Formation of Secondary Organic Aerosols Through Photooxidation of Isoprene. Science 2004, 303, 1173–1176. [Google Scholar] [CrossRef]
- Ehn, M.; Thornton, J.A.; Kleist, E.; others. A large source of low-volatility secondary organic aerosol. Nature 2014, 506, 476–479. [Google Scholar] [CrossRef]
- Finlayson-Pitts, B.J.; Pitts, J.N. Chemistry of the upper and lower atmosphere: Theory, experiments, and applications; Elsevier, 2000.
- Breheny, P.; Burchett, W. Visualization of Regression Models Using visreg. The R Journal 2017, 9, 56–71. [Google Scholar] [CrossRef]
- Pérez-Carrasquilla, J. S., M. P.A.S.J.M.H.K.S.; Ramírez, M. Forecasting 24 h averaged PM2.5 concentration in the Aburrá Valley using tree-based machine learning models, global forecasts, and satellite information. Advances in Statistical Climatology, Meteorology and Oceanography 2023, 9, 121–135. [Google Scholar] [CrossRef]
- Herrera-Mejía, L.; Hoyos, C.D. Impact analysis of meteorological variables on PM2.5 pollution in the Aburrá Valley. Science of the Total Environment 2019, 690, 1188–1200. [Google Scholar] [CrossRef]
- Chen, J.; Zhang, H.; Smith, K. The scavenging effect of precipitation on particulate matter and its influence on air quality. Atmospheric Environment 2017, 152, 49–58. [Google Scholar] [CrossRef]
- Wang, L.; Li, X. Effect of Rainfall Intensity on Airborne Particulate Matter Concentrations: A Case Study in a Suburban Area. Journal of Environmental Sciences 2018, 72, 41–49. [Google Scholar] [CrossRef]
- Liu, Y.; He, K. Precipitation and PM2.5 Concentrations: The Role of Atmospheric Stability. Environmental Pollution 2016, 214, 101–109. [Google Scholar] [CrossRef]
- Zhang, Z.; Huang, X. Impact of Light Rain on PM2.5 Concentrations in Urban Areas. Environmental Science and Pollution Research 2019, 26, 112–120. [Google Scholar]
- Singh, A.; Kumar, R. Precipitation, Air Quality, and Public Health: Evaluating the Impact of Rain on Urban Pollution Levels. Urban Climate 2020, 33, 100621. [Google Scholar]
- Ramírez, O.; Mura, I.; Franco, J. How Do People Understand Urban Air Pollution? Exploring Citizens’ Perception on Air Quality, Its Causes and Impacts in Colombian Cities. Open Journal of Air Pollution 2017, 6, 1–17. [Google Scholar] [CrossRef]
- Panday, A. Dynamic Complex Network Analysis of PM2.5 Concentrations in the UK, Using Hierarchical Directed Graphs (V1.0.0). Sustainability 2021, 13, 2201. [Google Scholar] [CrossRef]
- Zangari, S.; Hill, D.; Charette, A.; Mirowsky, J. Air quality changes in New York City during the COVID-19 pandemic. Science of The Total Environment 2020, 742, 140496. [Google Scholar] [CrossRef]
- Venter, Z.; Aunan, K.; Chowdhury, S.; Lelieveld, J. Impact of COVID-19 lockdown on NO2 pollution in megacities in China, the USA, and Italy. Science of the Total Environment 2020, 742, 140496. [Google Scholar] [CrossRef]
- Dantas, G.; Siciliano, B.; França, B.; Da Silva, C.; Arbilla, G. The impact of COVID-19 partial lockdown on the air quality of the city of Rio de Janeiro, Brazil. Science of the Total Environment 2020, 729, 139085. [Google Scholar] [CrossRef]
- Li, L.; Li, Q.; Huang, L.; Wang, Q.; Zhu, A. Variations in PM2.5 concentrations in relation to meteorological conditions during COVID-19 lockdown in India. Atmospheric Pollution Research 2021, 12, 122–128. [Google Scholar] [CrossRef]
- Rodriguez-Urrego, D.; Rodriguez-Urrego, L. Air quality during the COVID-19: PM2.5 analysis in the 50 most polluted capital cities in the world. Environmental Pollution 2020, 266, 115042. [Google Scholar] [CrossRef]
- J, C.; S, T.; H, S.; Z. , X. Association between sub-daily exposure to ambient air pollution and risk of asthma exacerbations in Australian children. Environ Res. 2022, 212. [Google Scholar] [CrossRef]
- Li Y, Z.L.; Y, W.; Z, T.; Y, H.; Y, W.; J, Z.; Y, Z. Emergency Department Visits in Children Associated with Exposure to Ambient PM1 within Several Hours. Int J Environ Res Public Health 2023. [Google Scholar] [CrossRef] [PubMed]
- J, C.; S, T.; H, S.; Z, X. Hourly air pollution exposure and emergency department visit for acute myocardial infarction: Vulnerable populations and susceptible time windows. Environ Pollut 2021. [Google Scholar] [CrossRef]
Figure 1.
Location of the MED-BEME gauge station at Pedro Justo Berrío School (Valle de Aburrá, Colombia).
Figure 1.
Location of the MED-BEME gauge station at Pedro Justo Berrío School (Valle de Aburrá, Colombia).
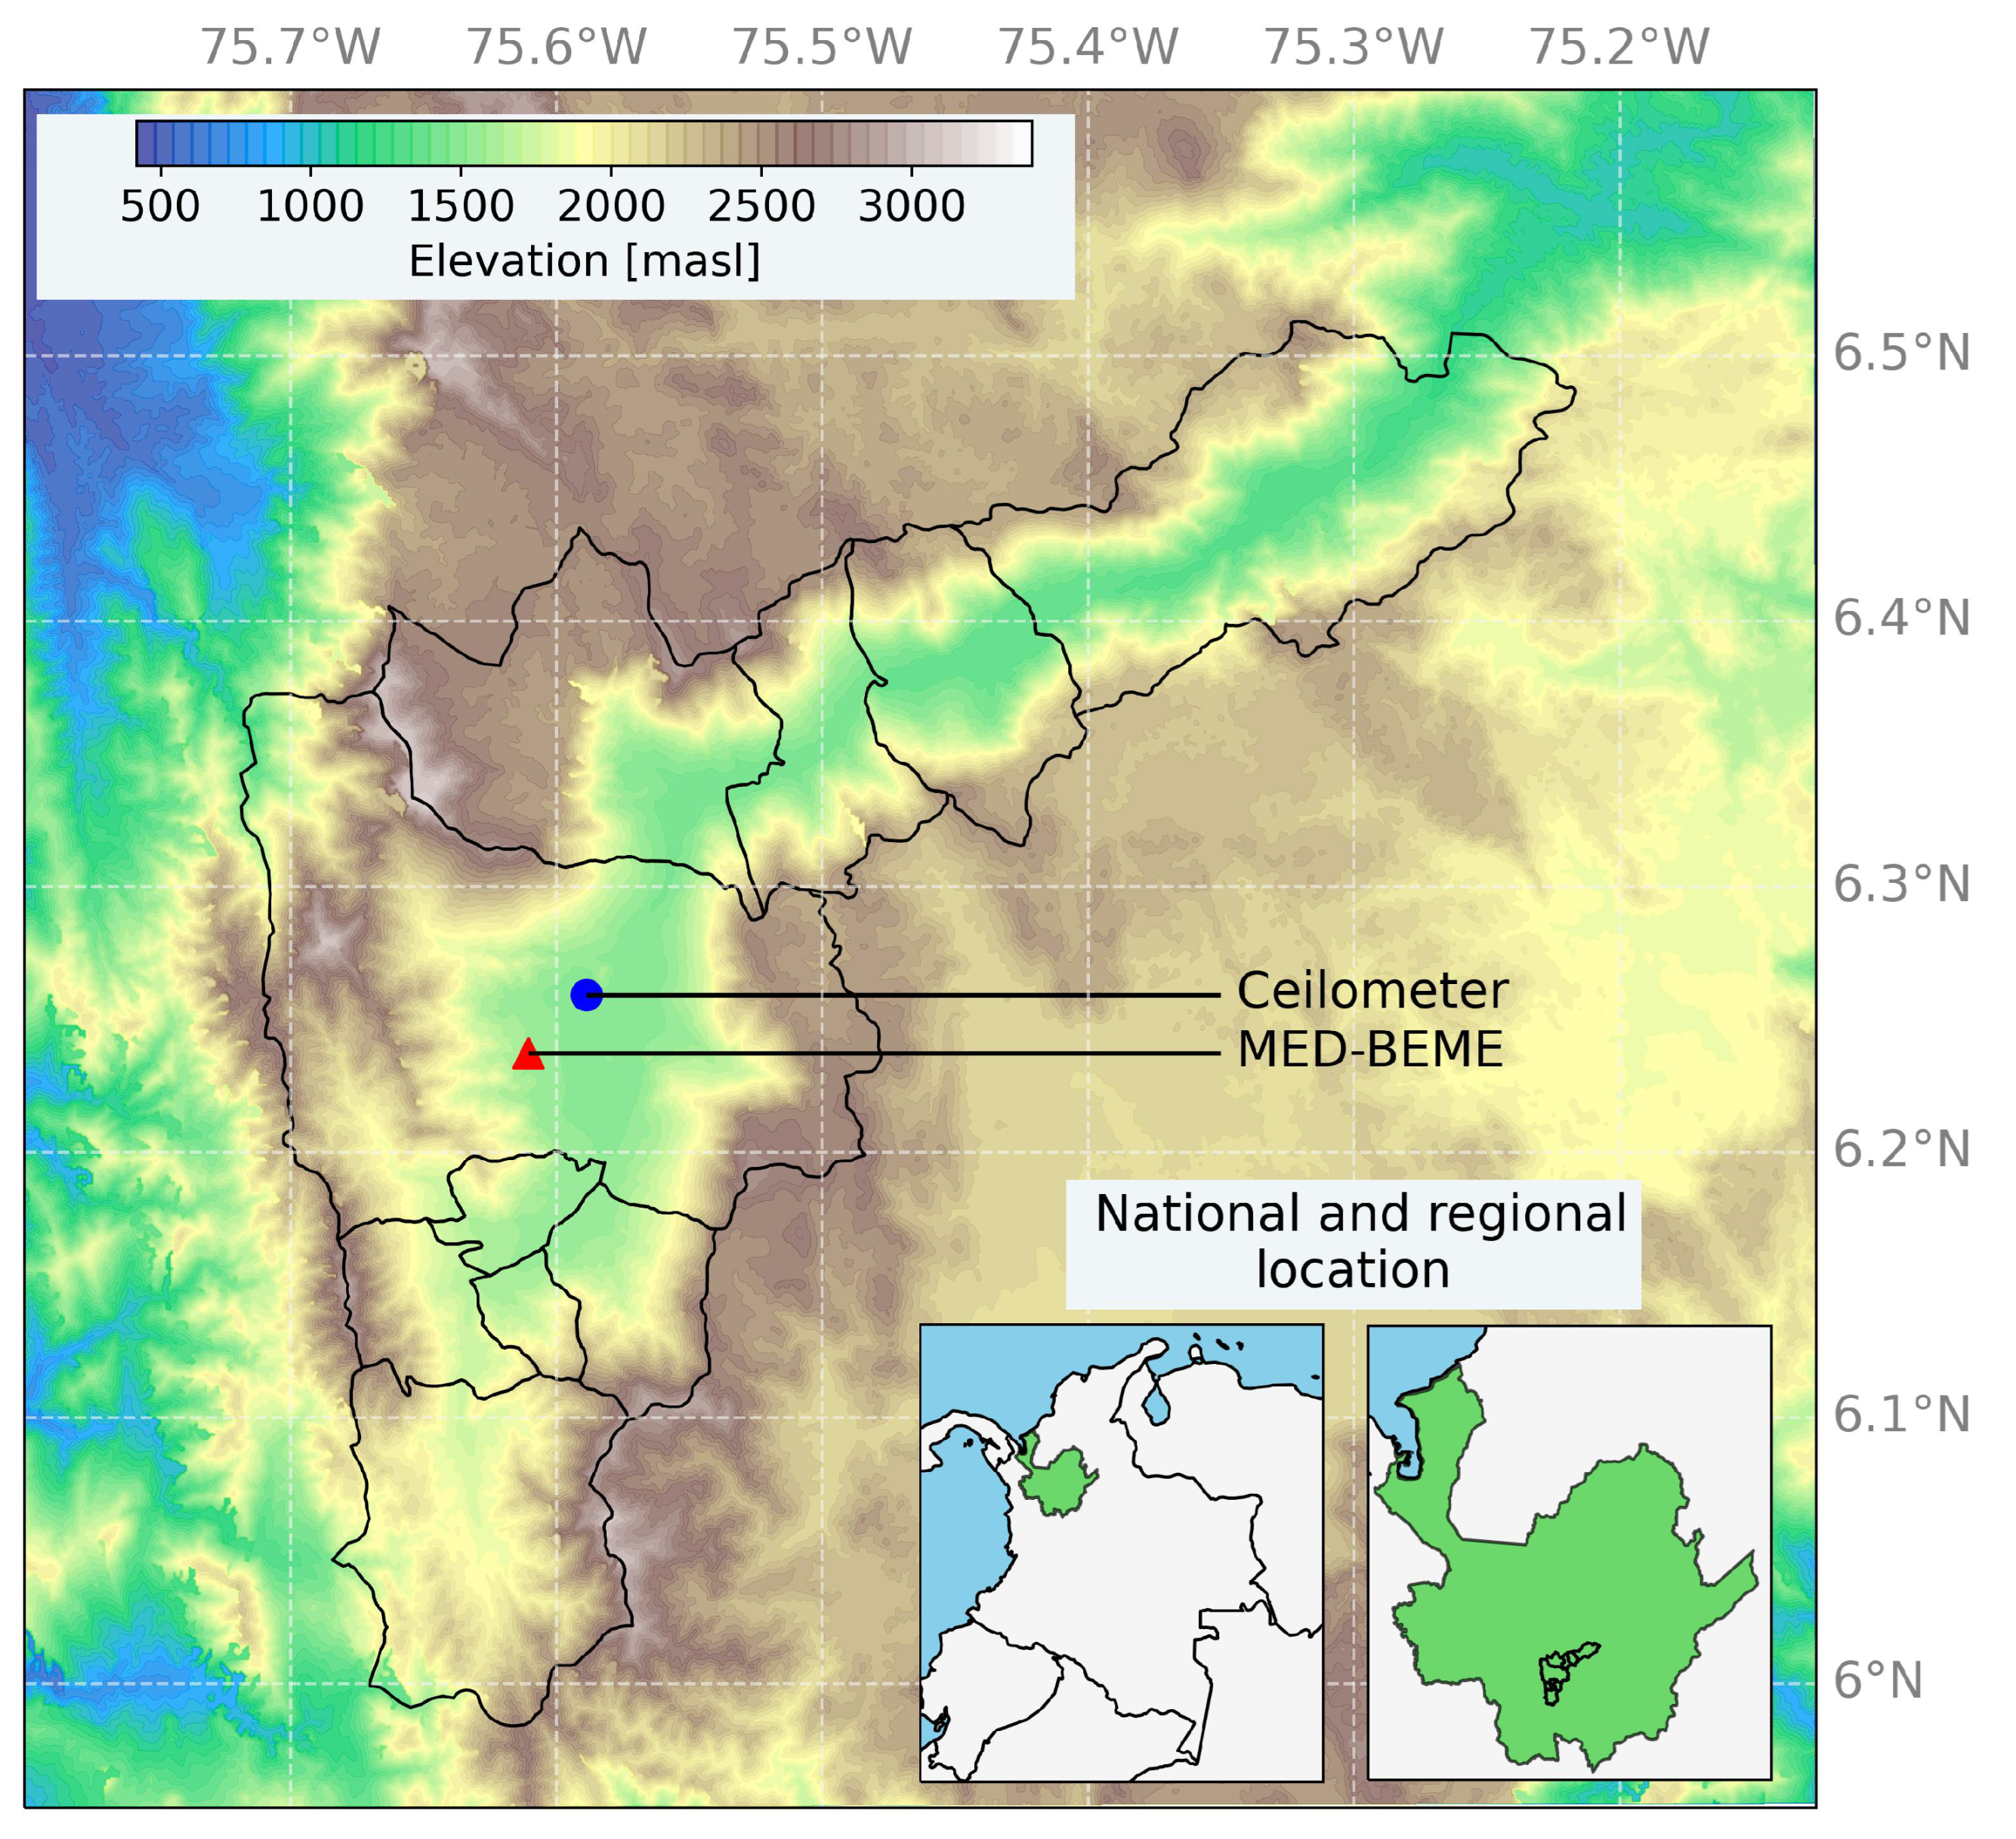
Figure 2.
Diurnal cycles of , solar radiation, temperature, humidity, and atmospheric boundary layer height. April 2019 to August 2022.
Figure 2.
Diurnal cycles of , solar radiation, temperature, humidity, and atmospheric boundary layer height. April 2019 to August 2022.
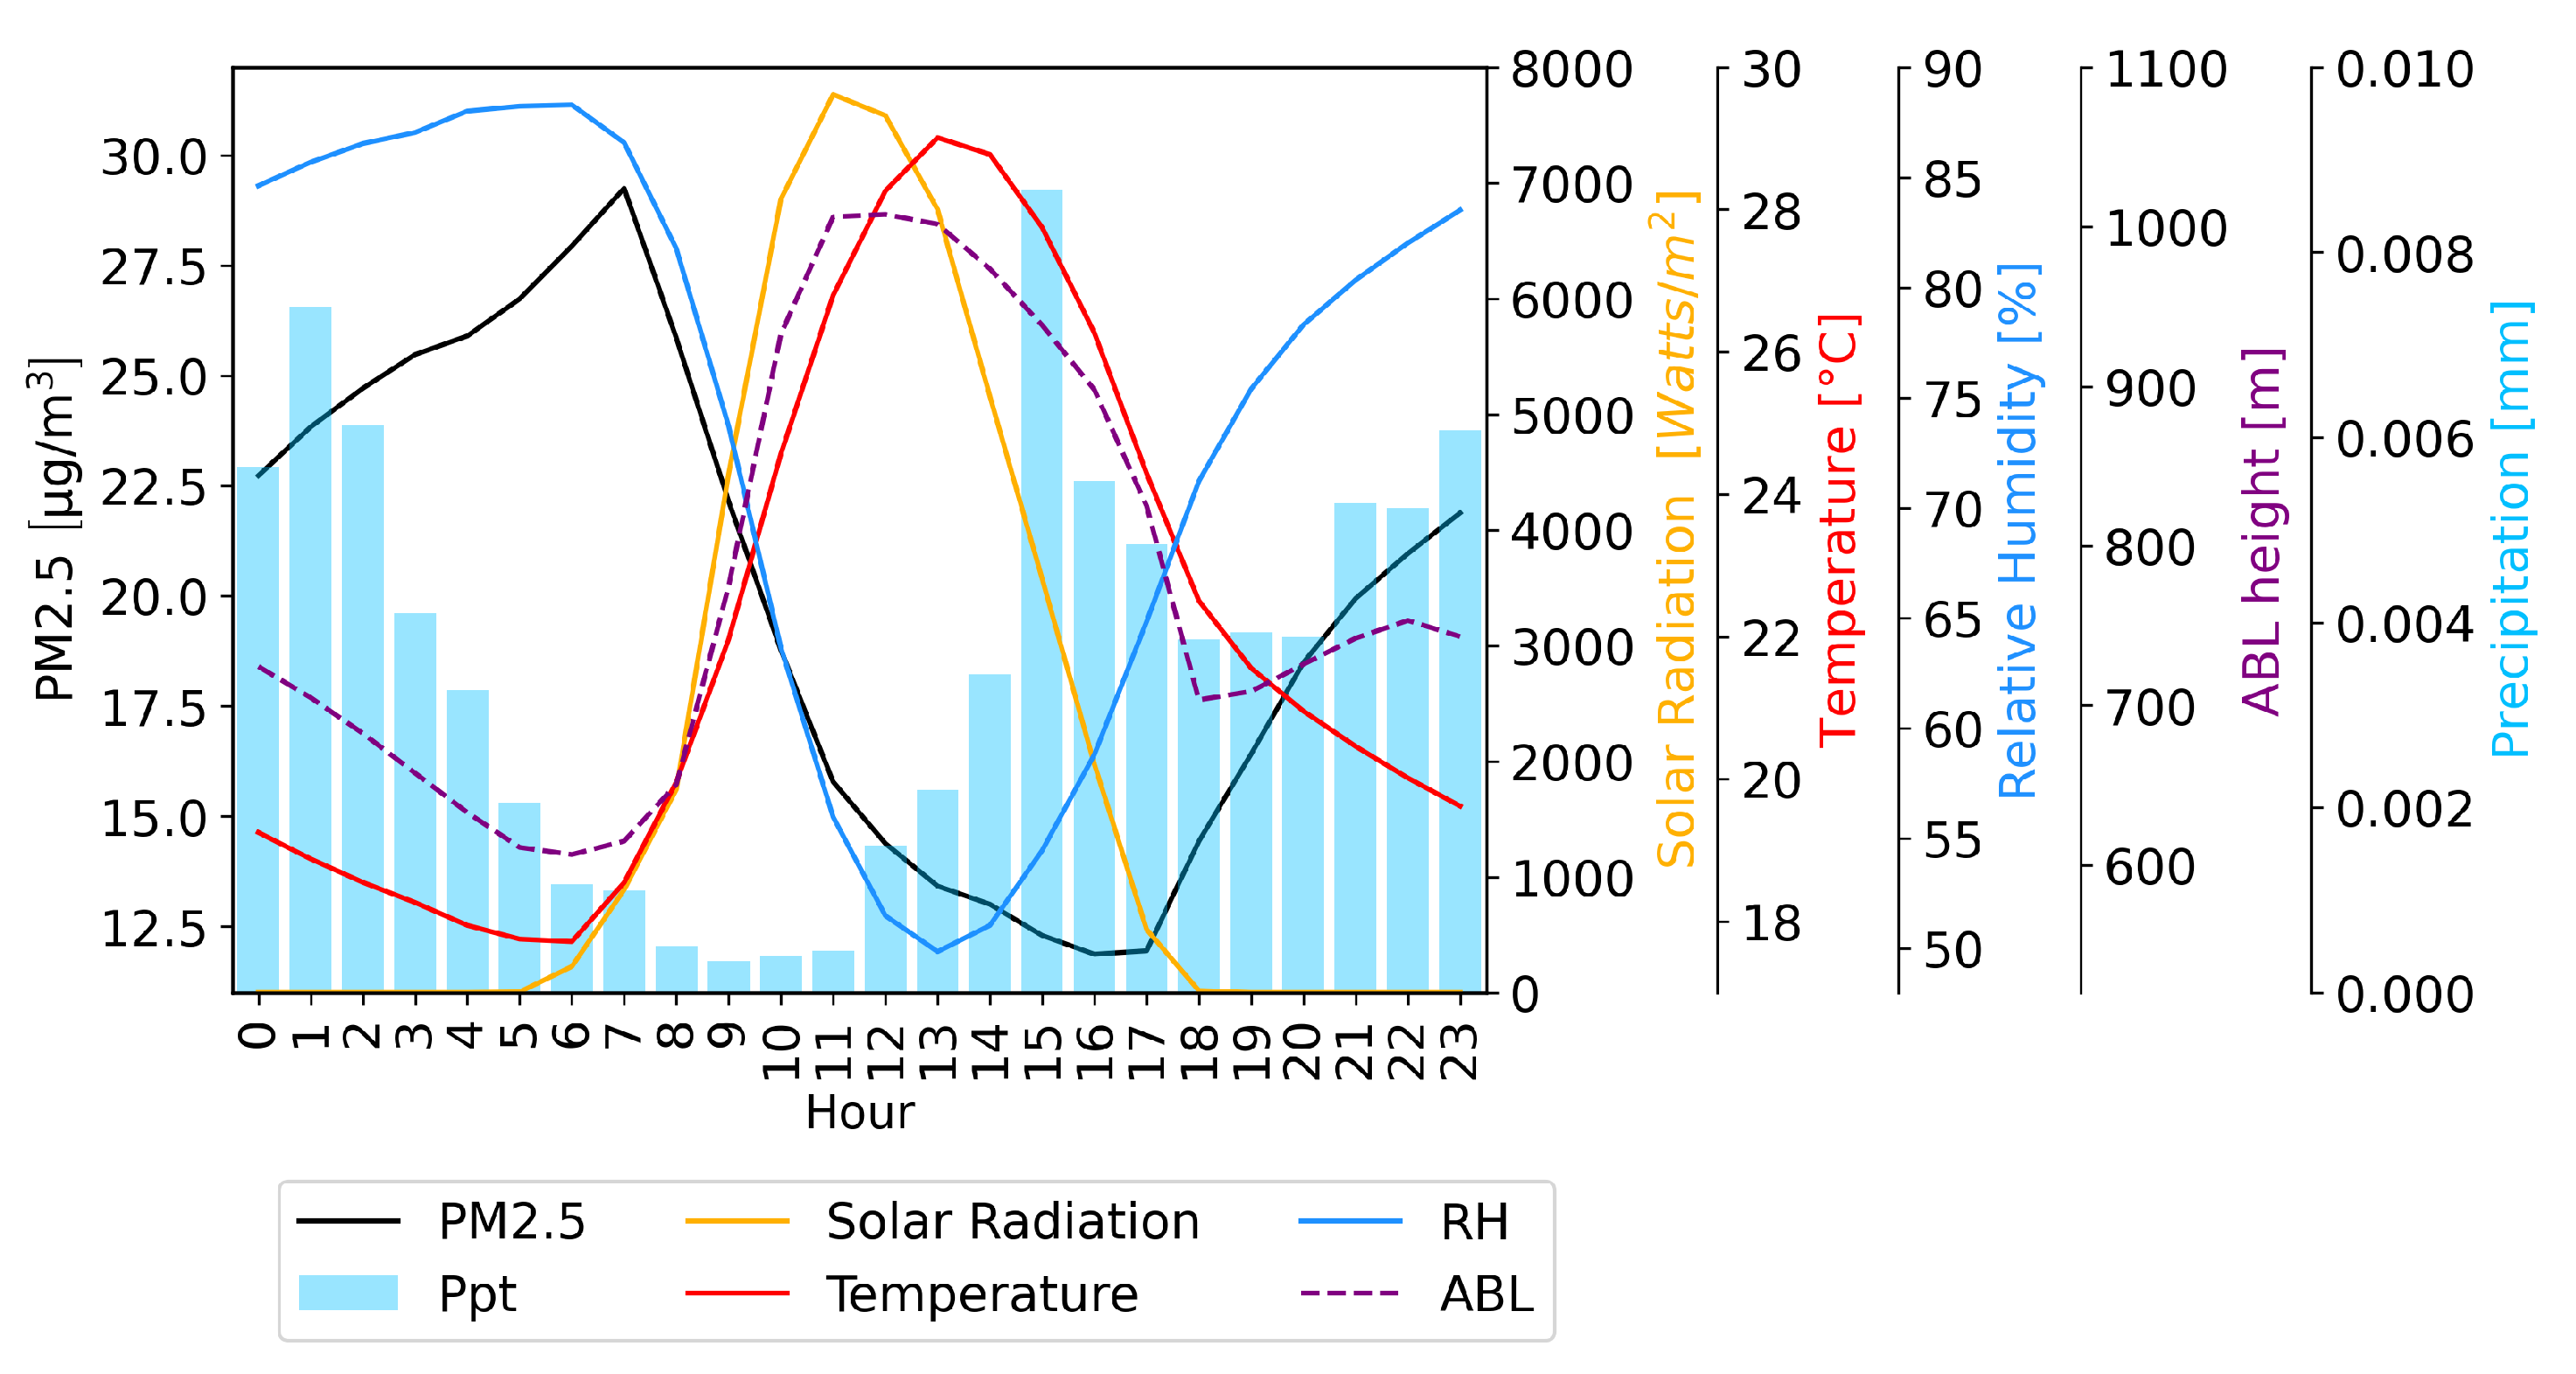
Figure 3.
Relative frequency functions of for (a) dry and (b) humid conditions. Diurnal hours (left) and nightly hours (right). April 2019 to August 2022.
Figure 3.
Relative frequency functions of for (a) dry and (b) humid conditions. Diurnal hours (left) and nightly hours (right). April 2019 to August 2022.
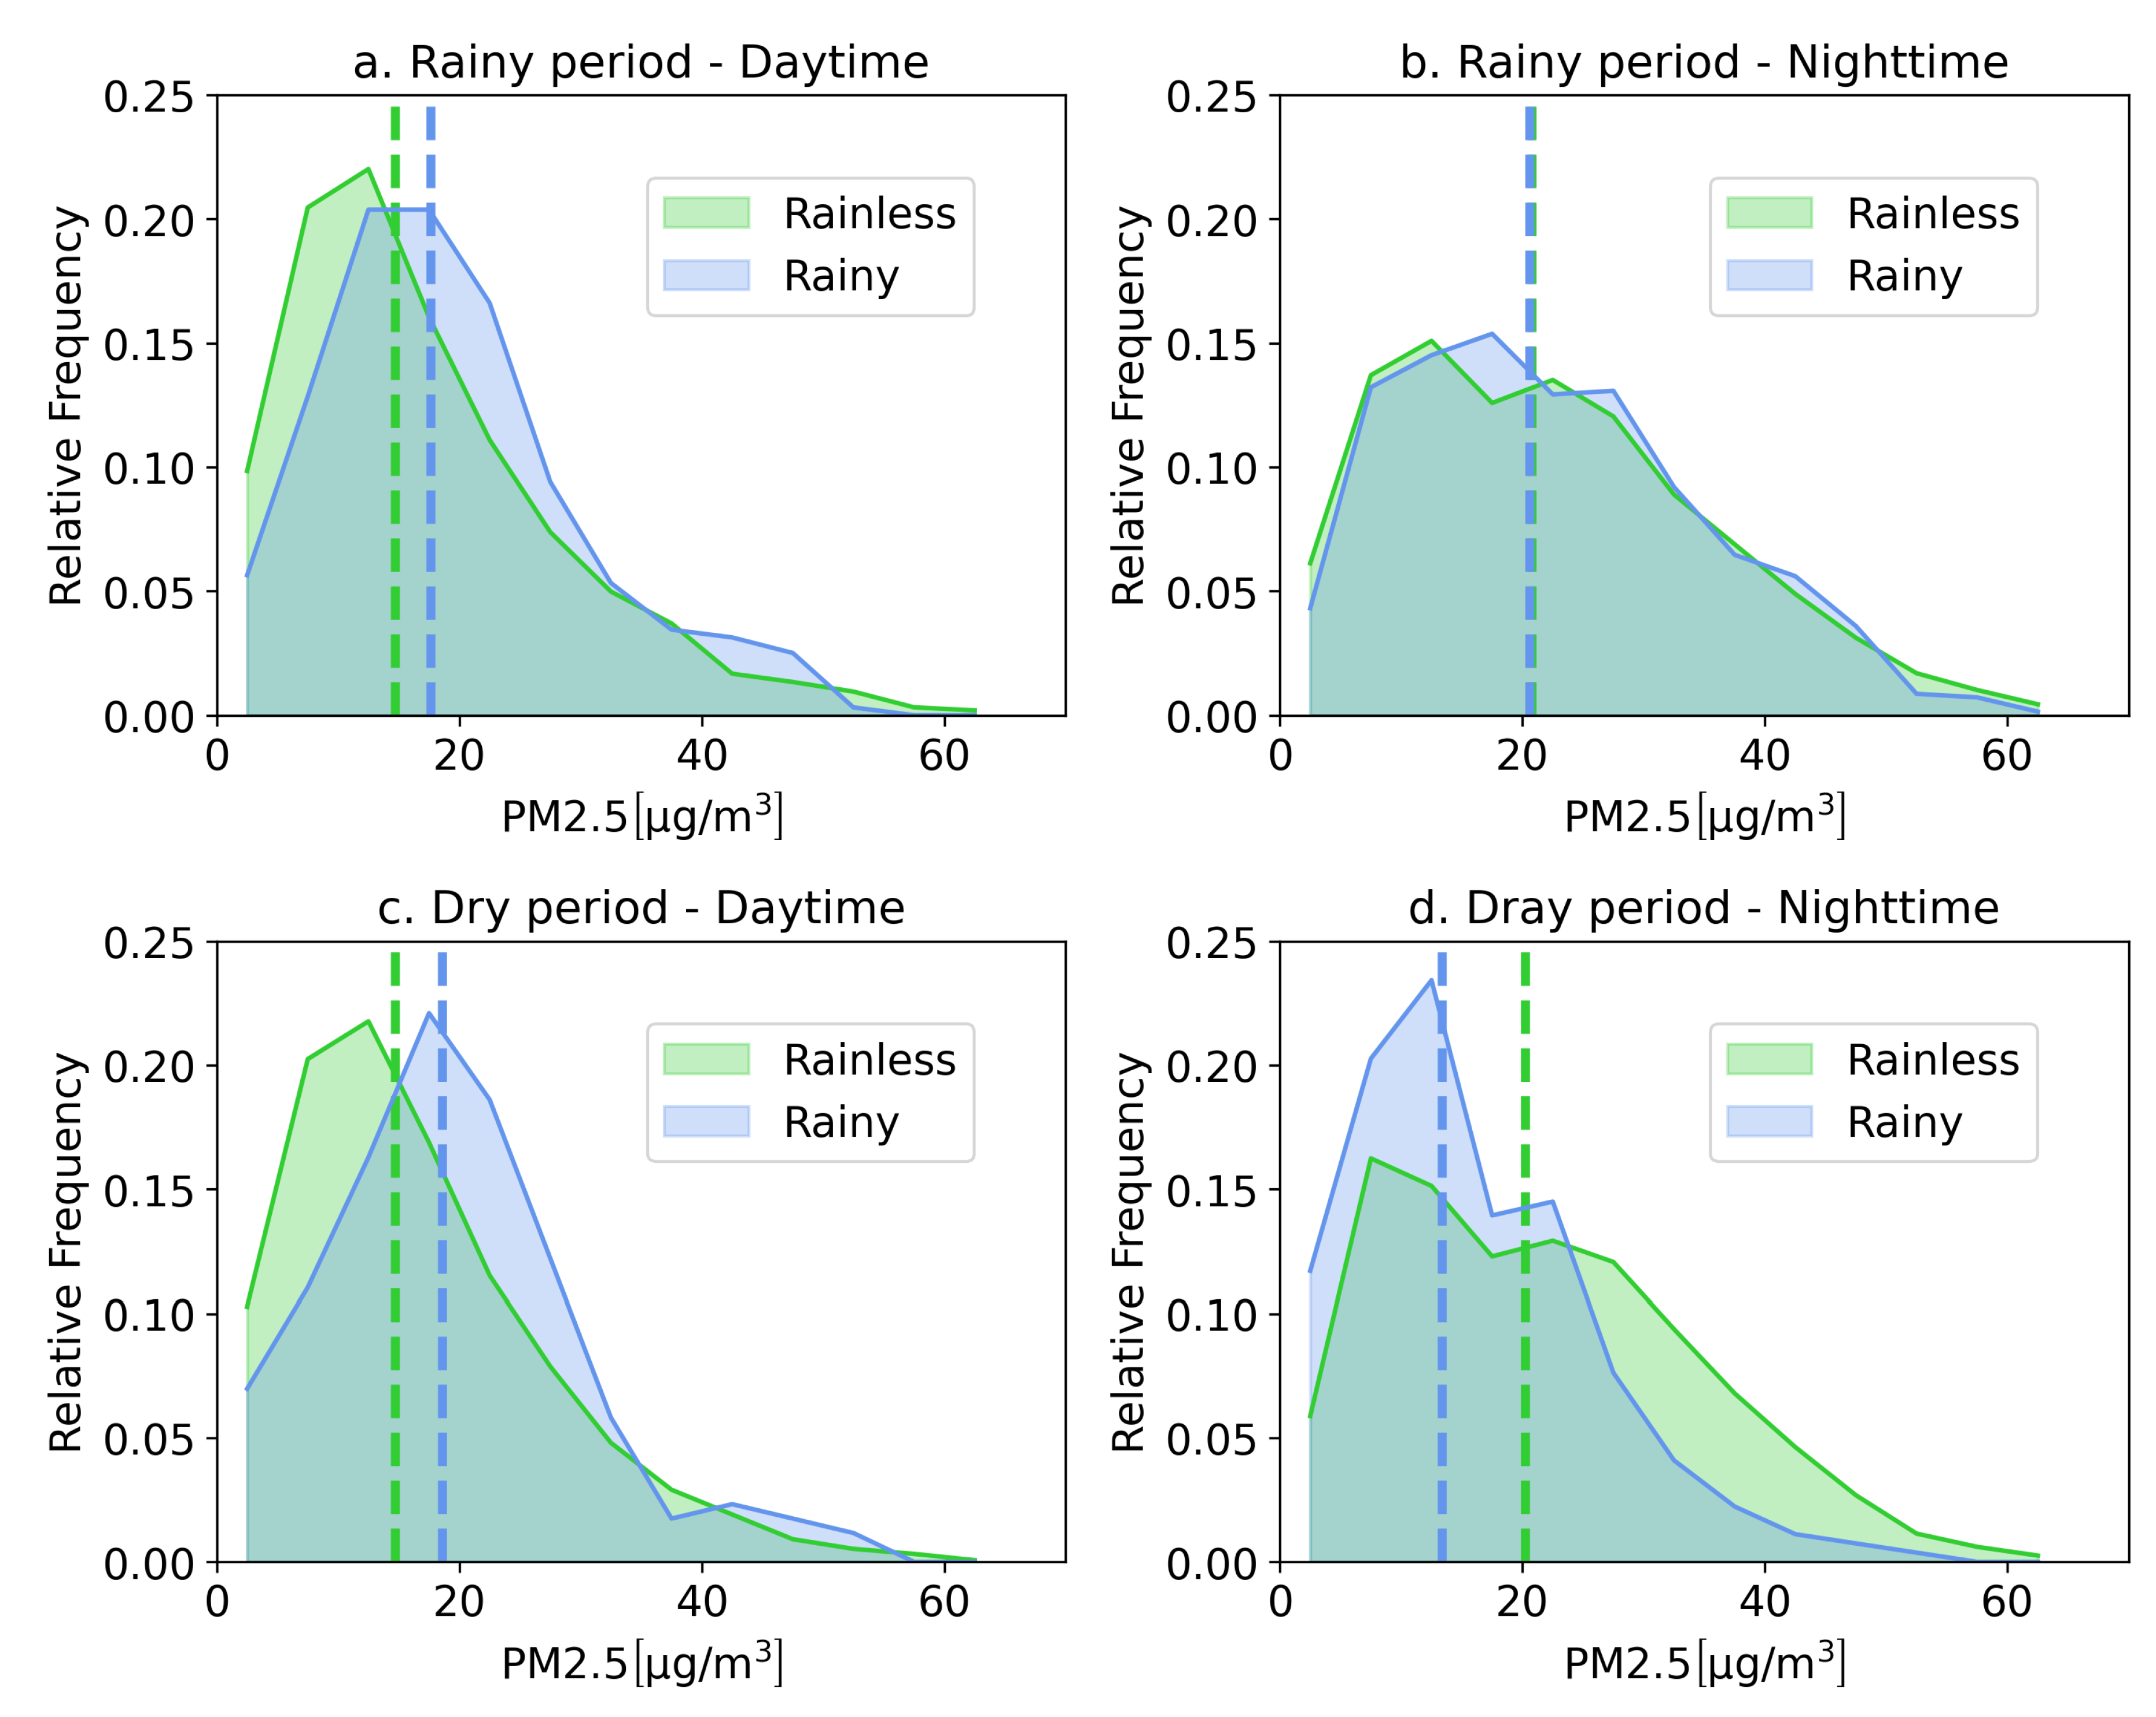
Figure 4.
Average boundary layer height for PGE and non-PGE periods in contrast with values for the same periods (November 2019 to October 2020). Data were obtained from the Aburra Valley Metropolitan Area (AMVA) and SIATA project.
Figure 4.
Average boundary layer height for PGE and non-PGE periods in contrast with values for the same periods (November 2019 to October 2020). Data were obtained from the Aburra Valley Metropolitan Area (AMVA) and SIATA project.
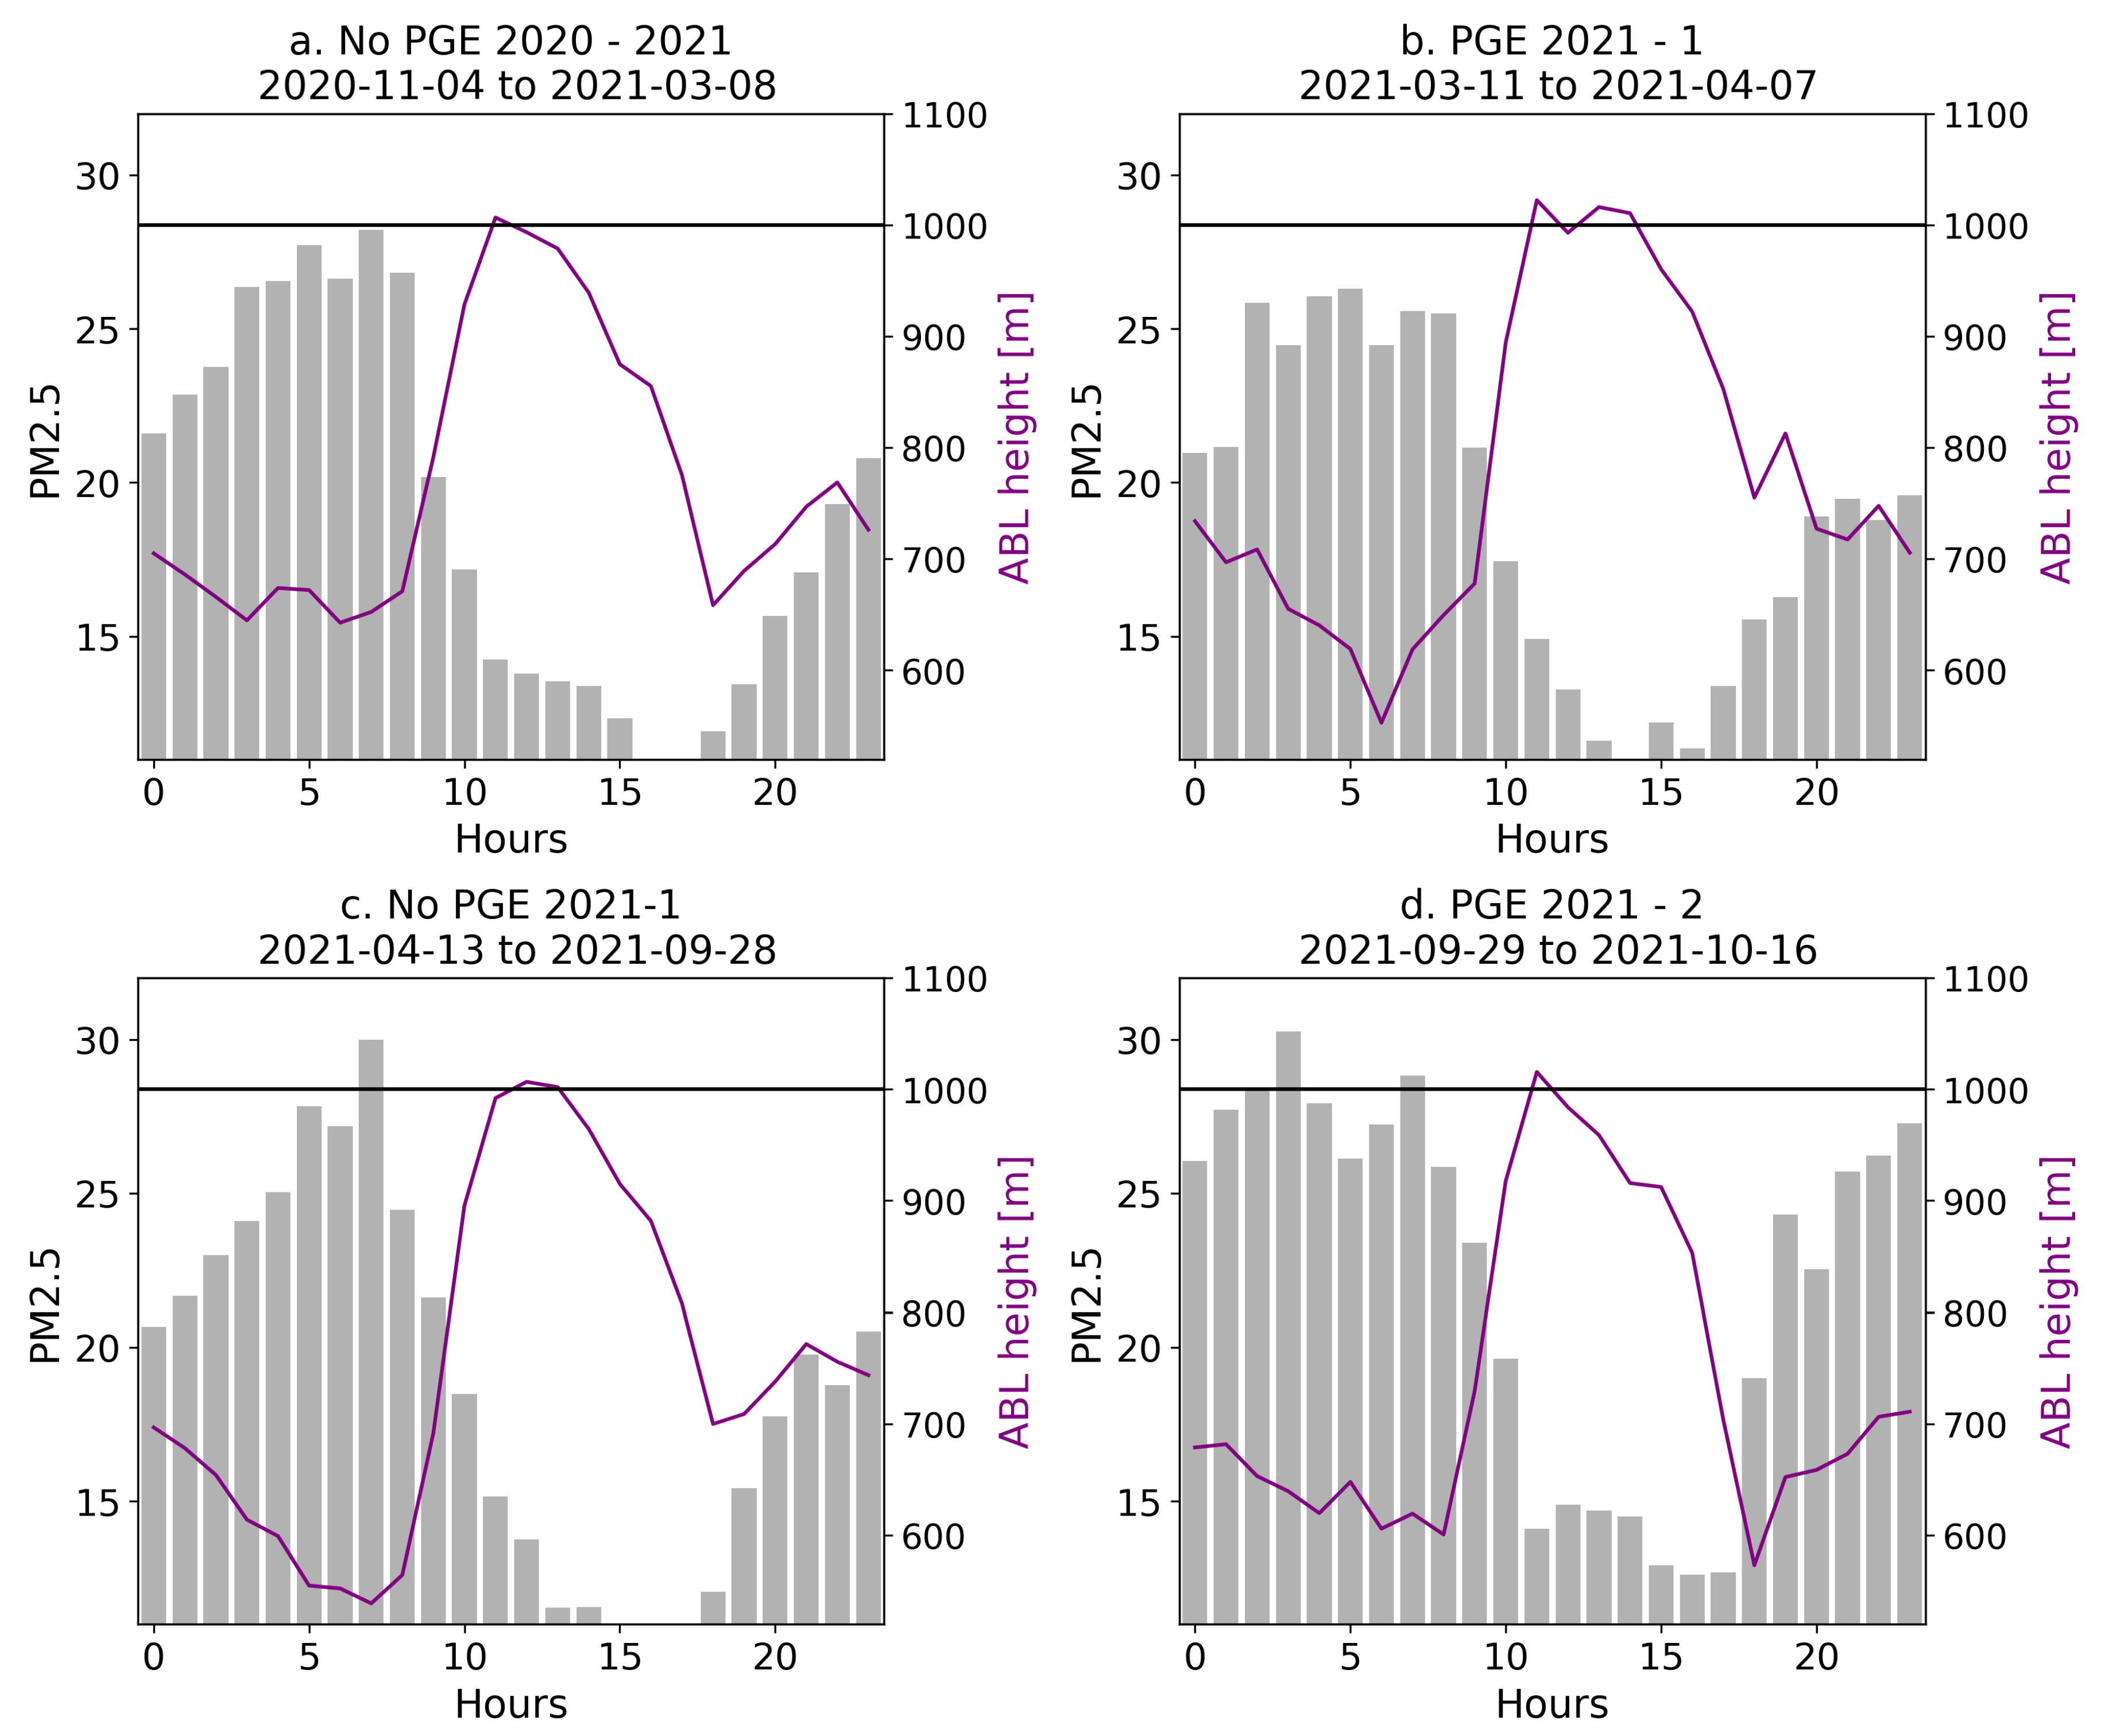
Figure 5.
Principal component analysis of hydrometeorological variables.
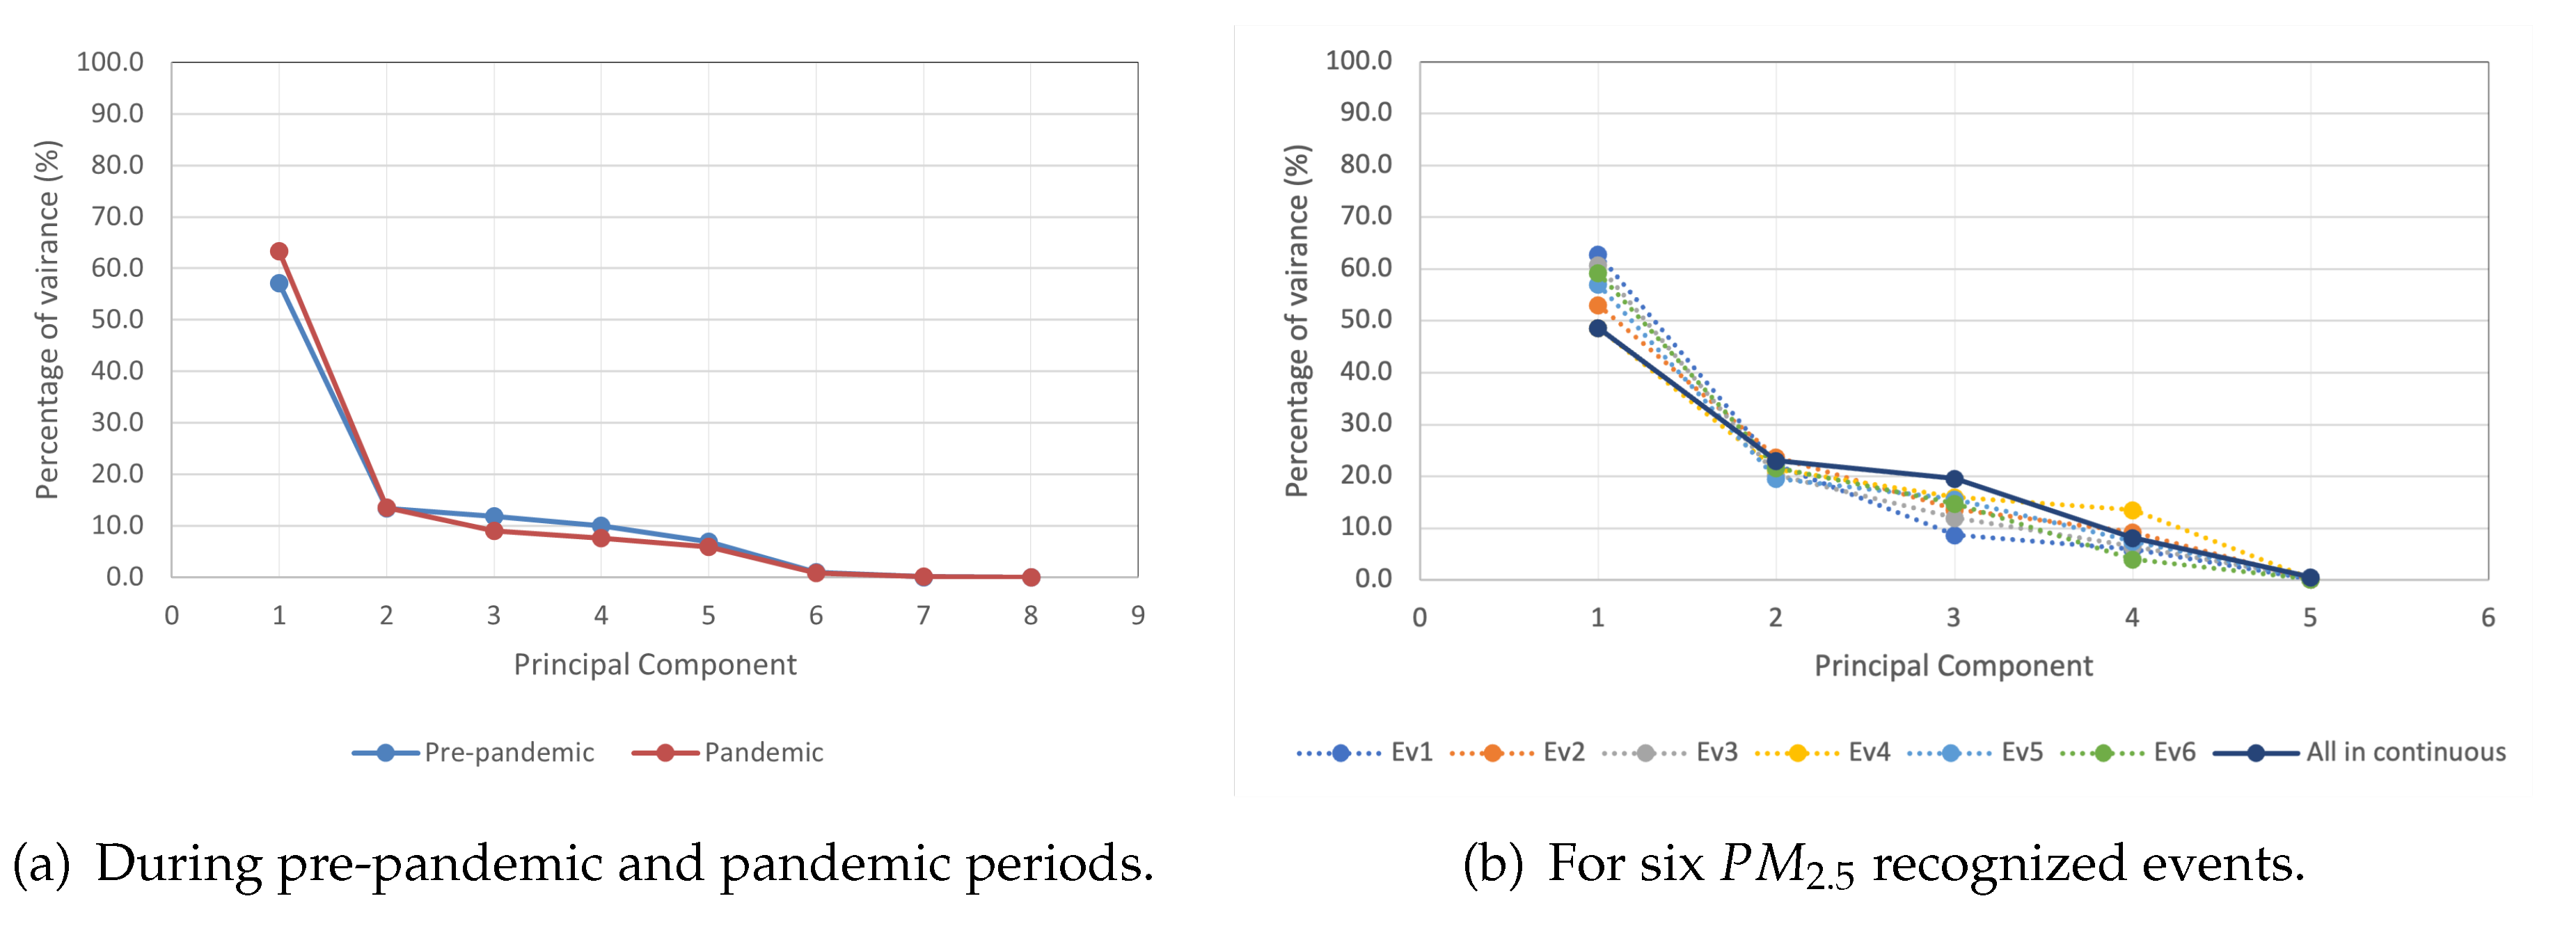
Figure 6.
Scatter diagrams and tendency ellipses for scores between couples of PCs.
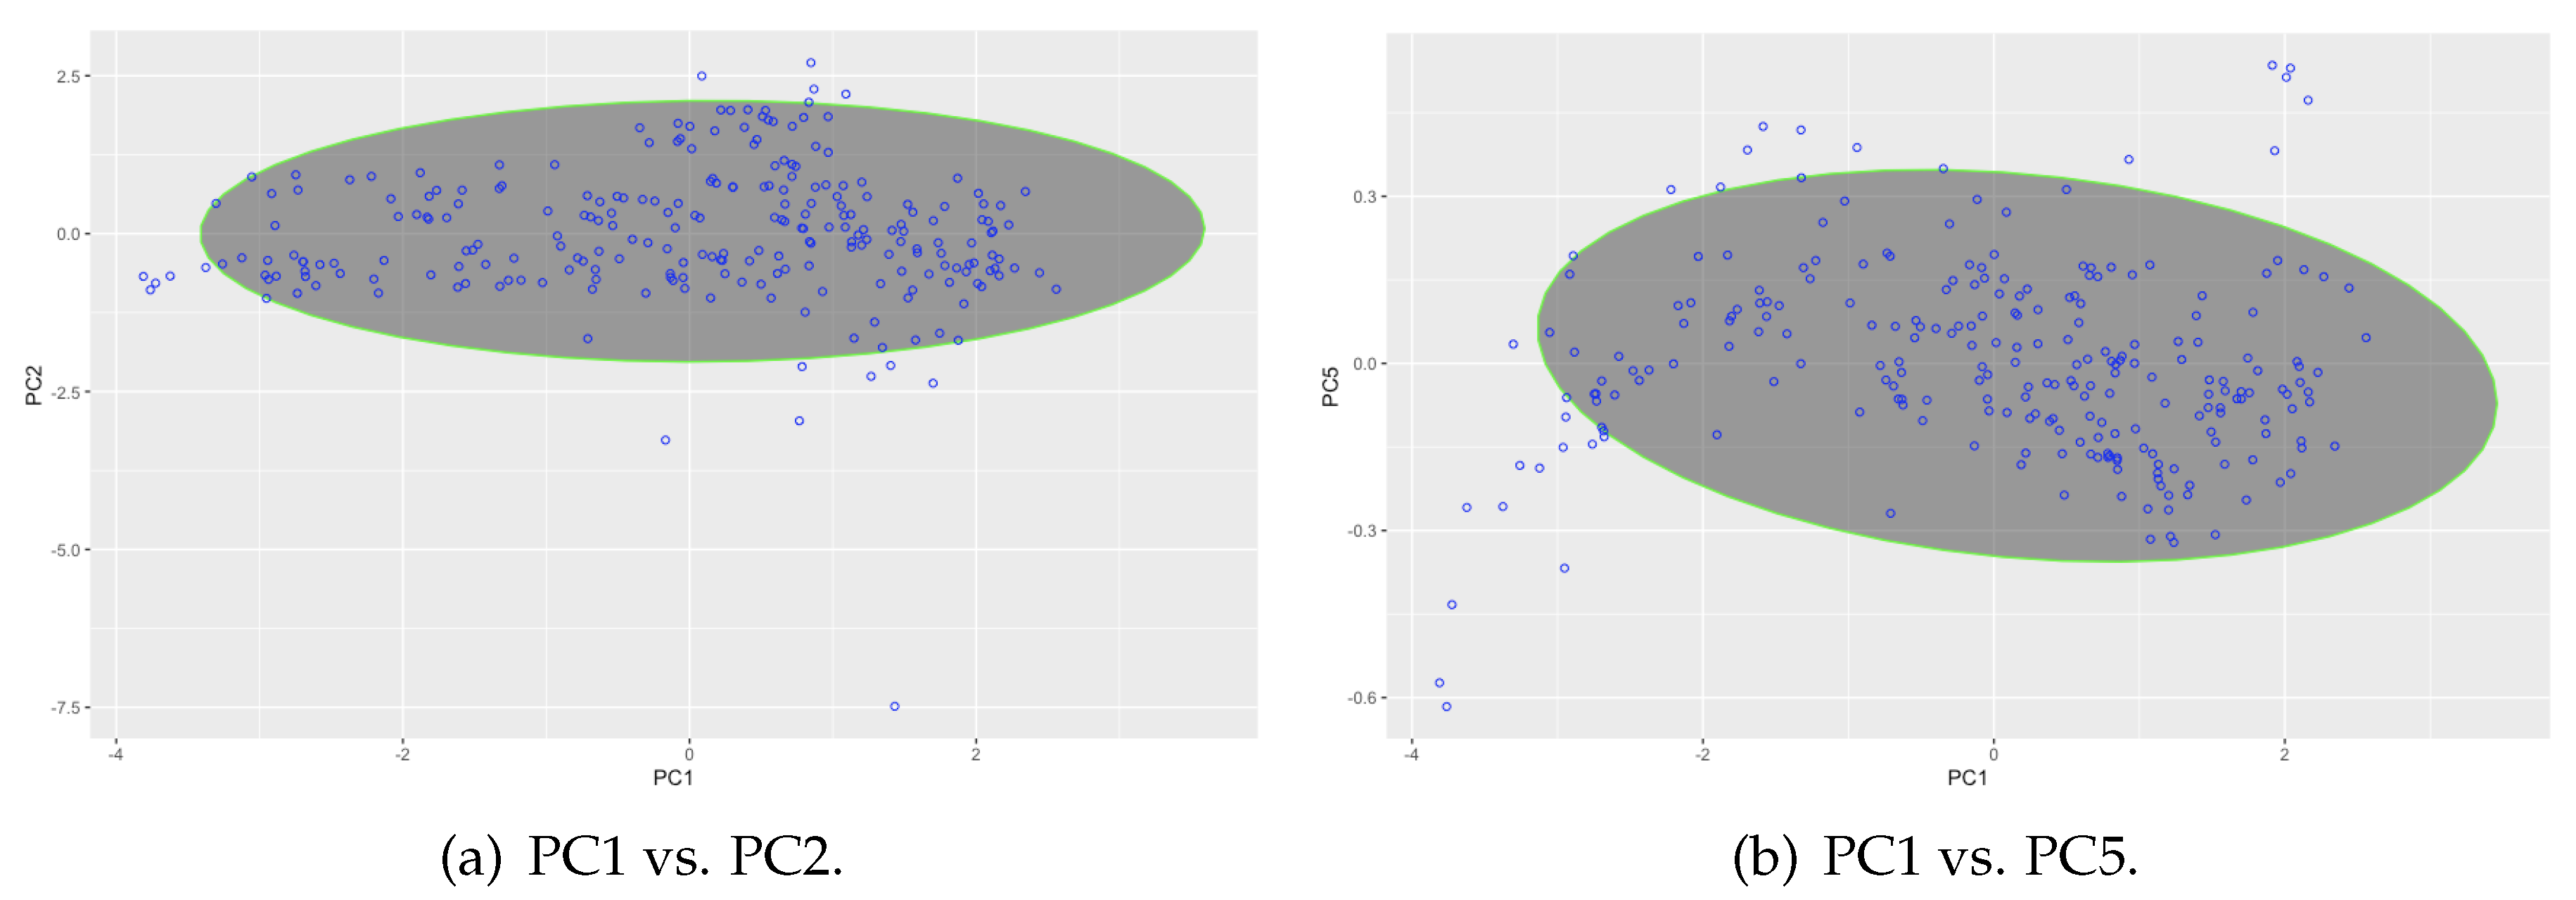
Figure 7.
Correlation matrix for climatological variables and in the pre-pandemic (panel a) and pandemic periods (panel b). Values in white have a significance level of greater than 0.05.
Figure 7.
Correlation matrix for climatological variables and in the pre-pandemic (panel a) and pandemic periods (panel b). Values in white have a significance level of greater than 0.05.
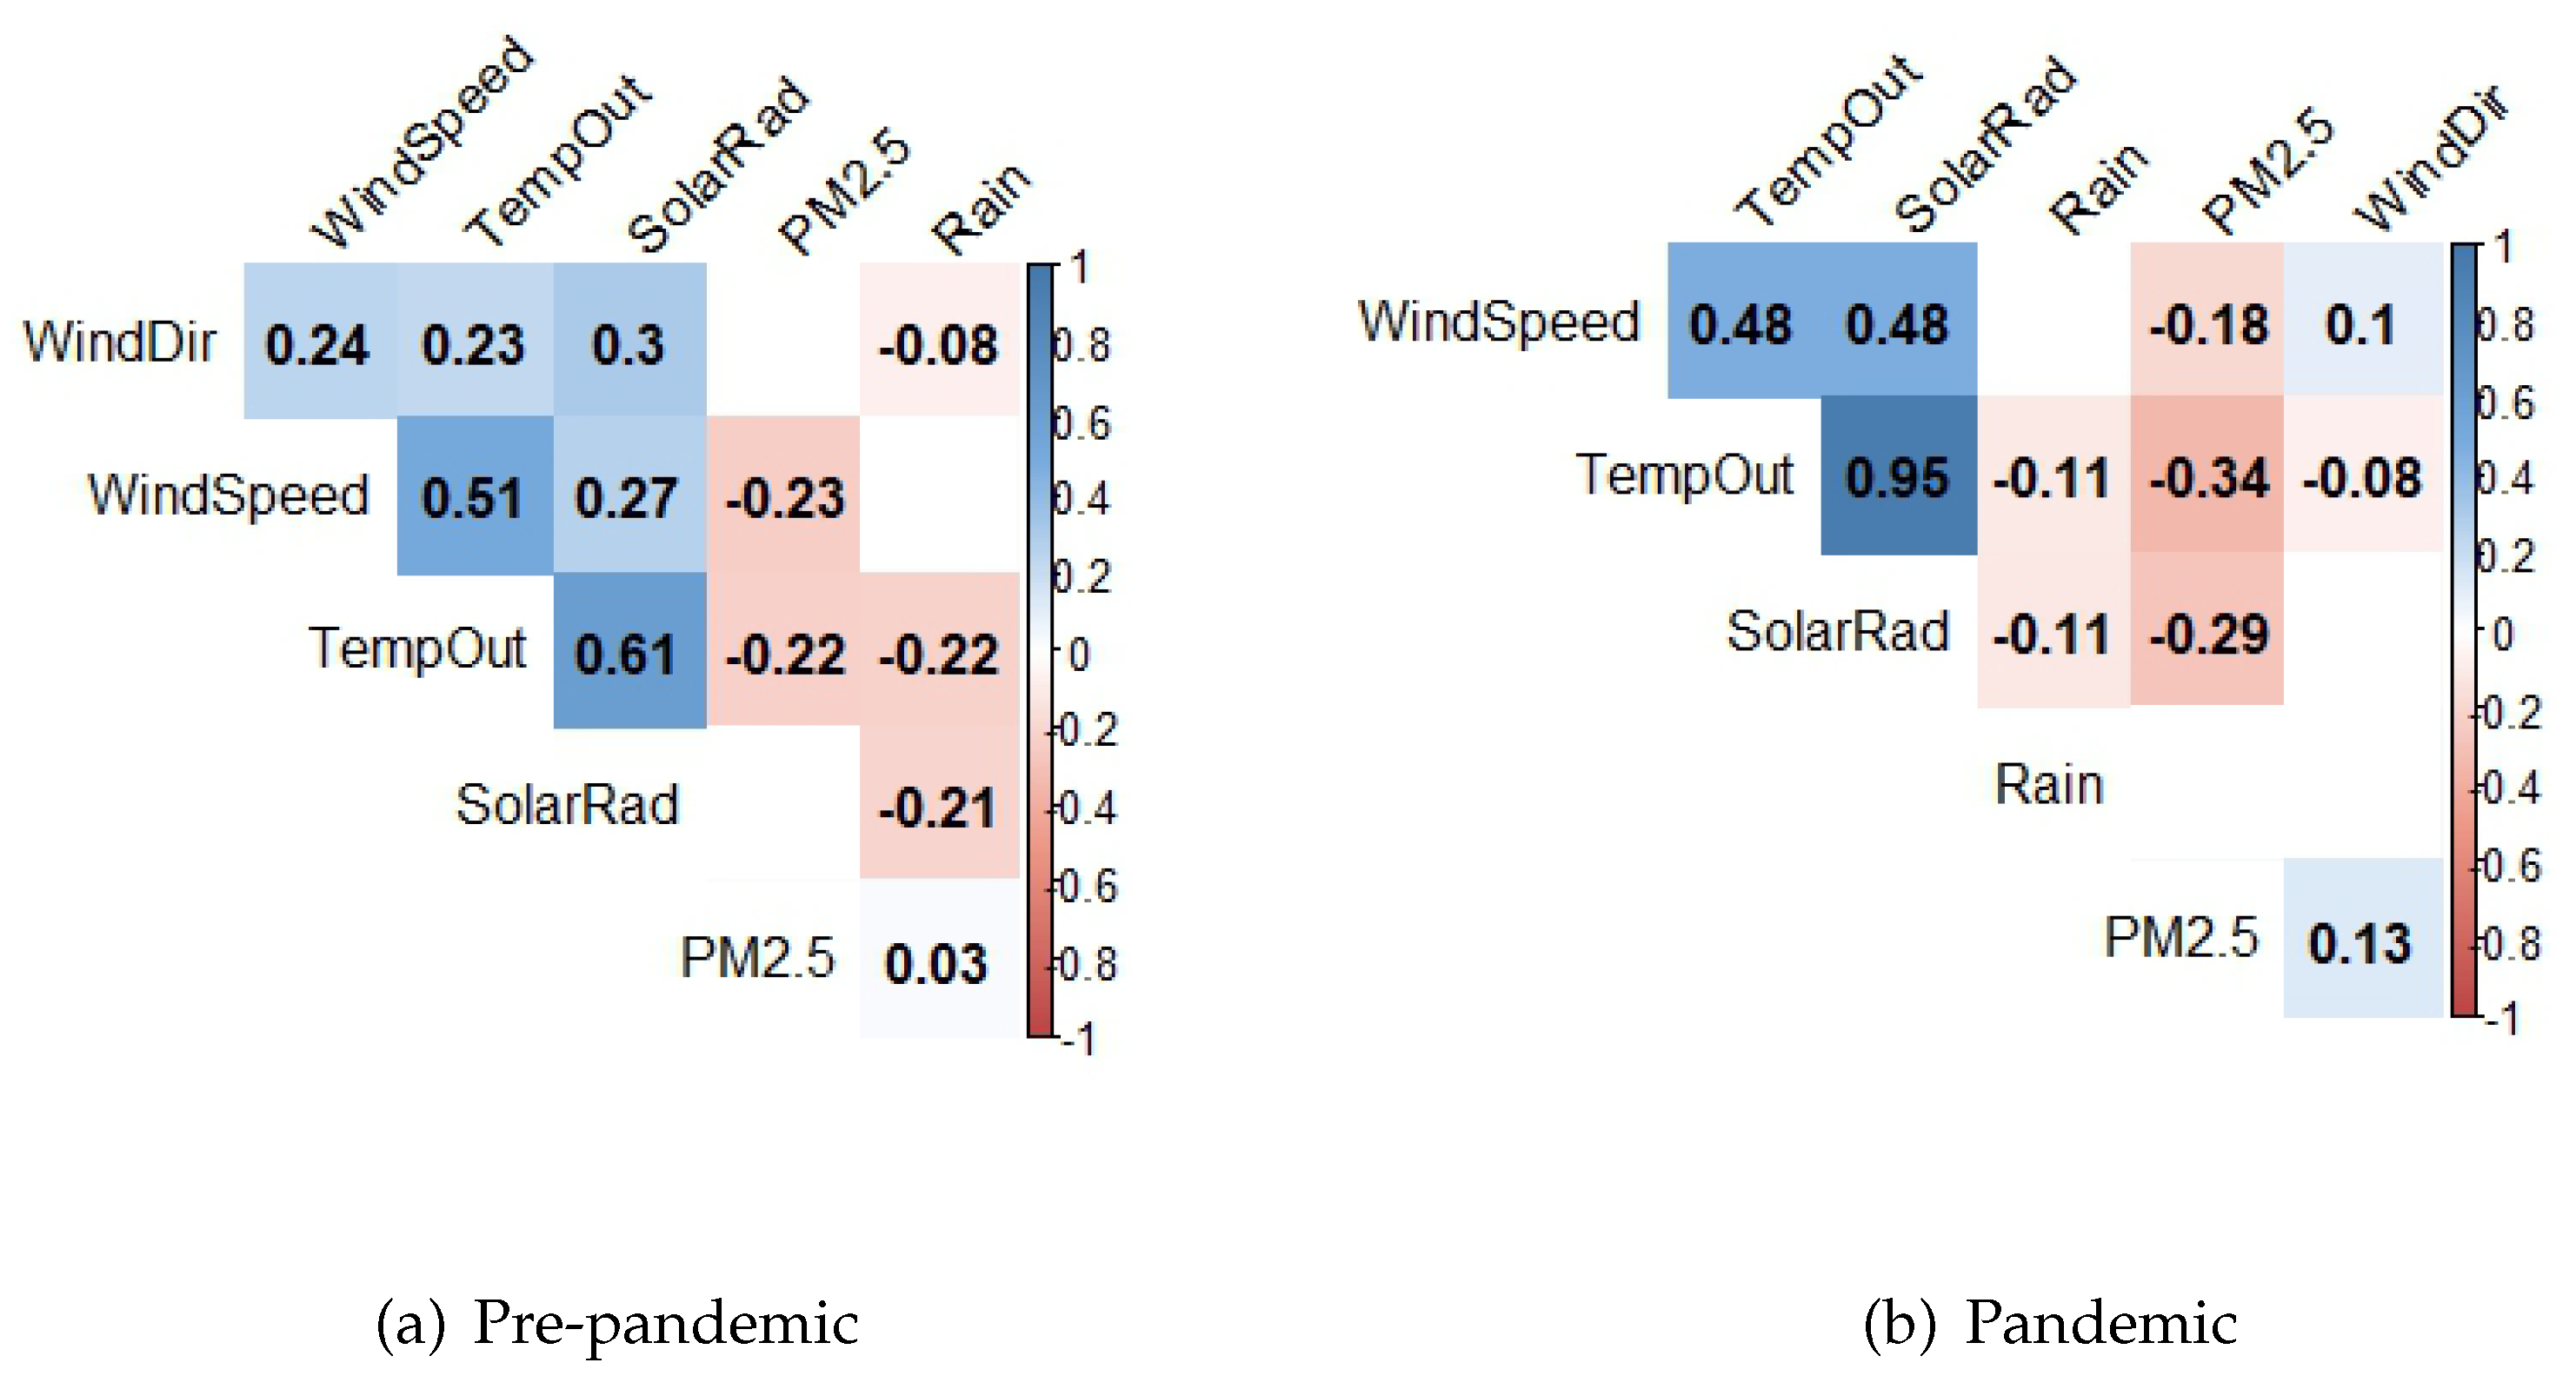
Figure 8.
Isolated relationship between PM 2.5 temperature and solar radiation, keeping all other variables constant for both periods.
Figure 8.
Isolated relationship between PM 2.5 temperature and solar radiation, keeping all other variables constant for both periods.
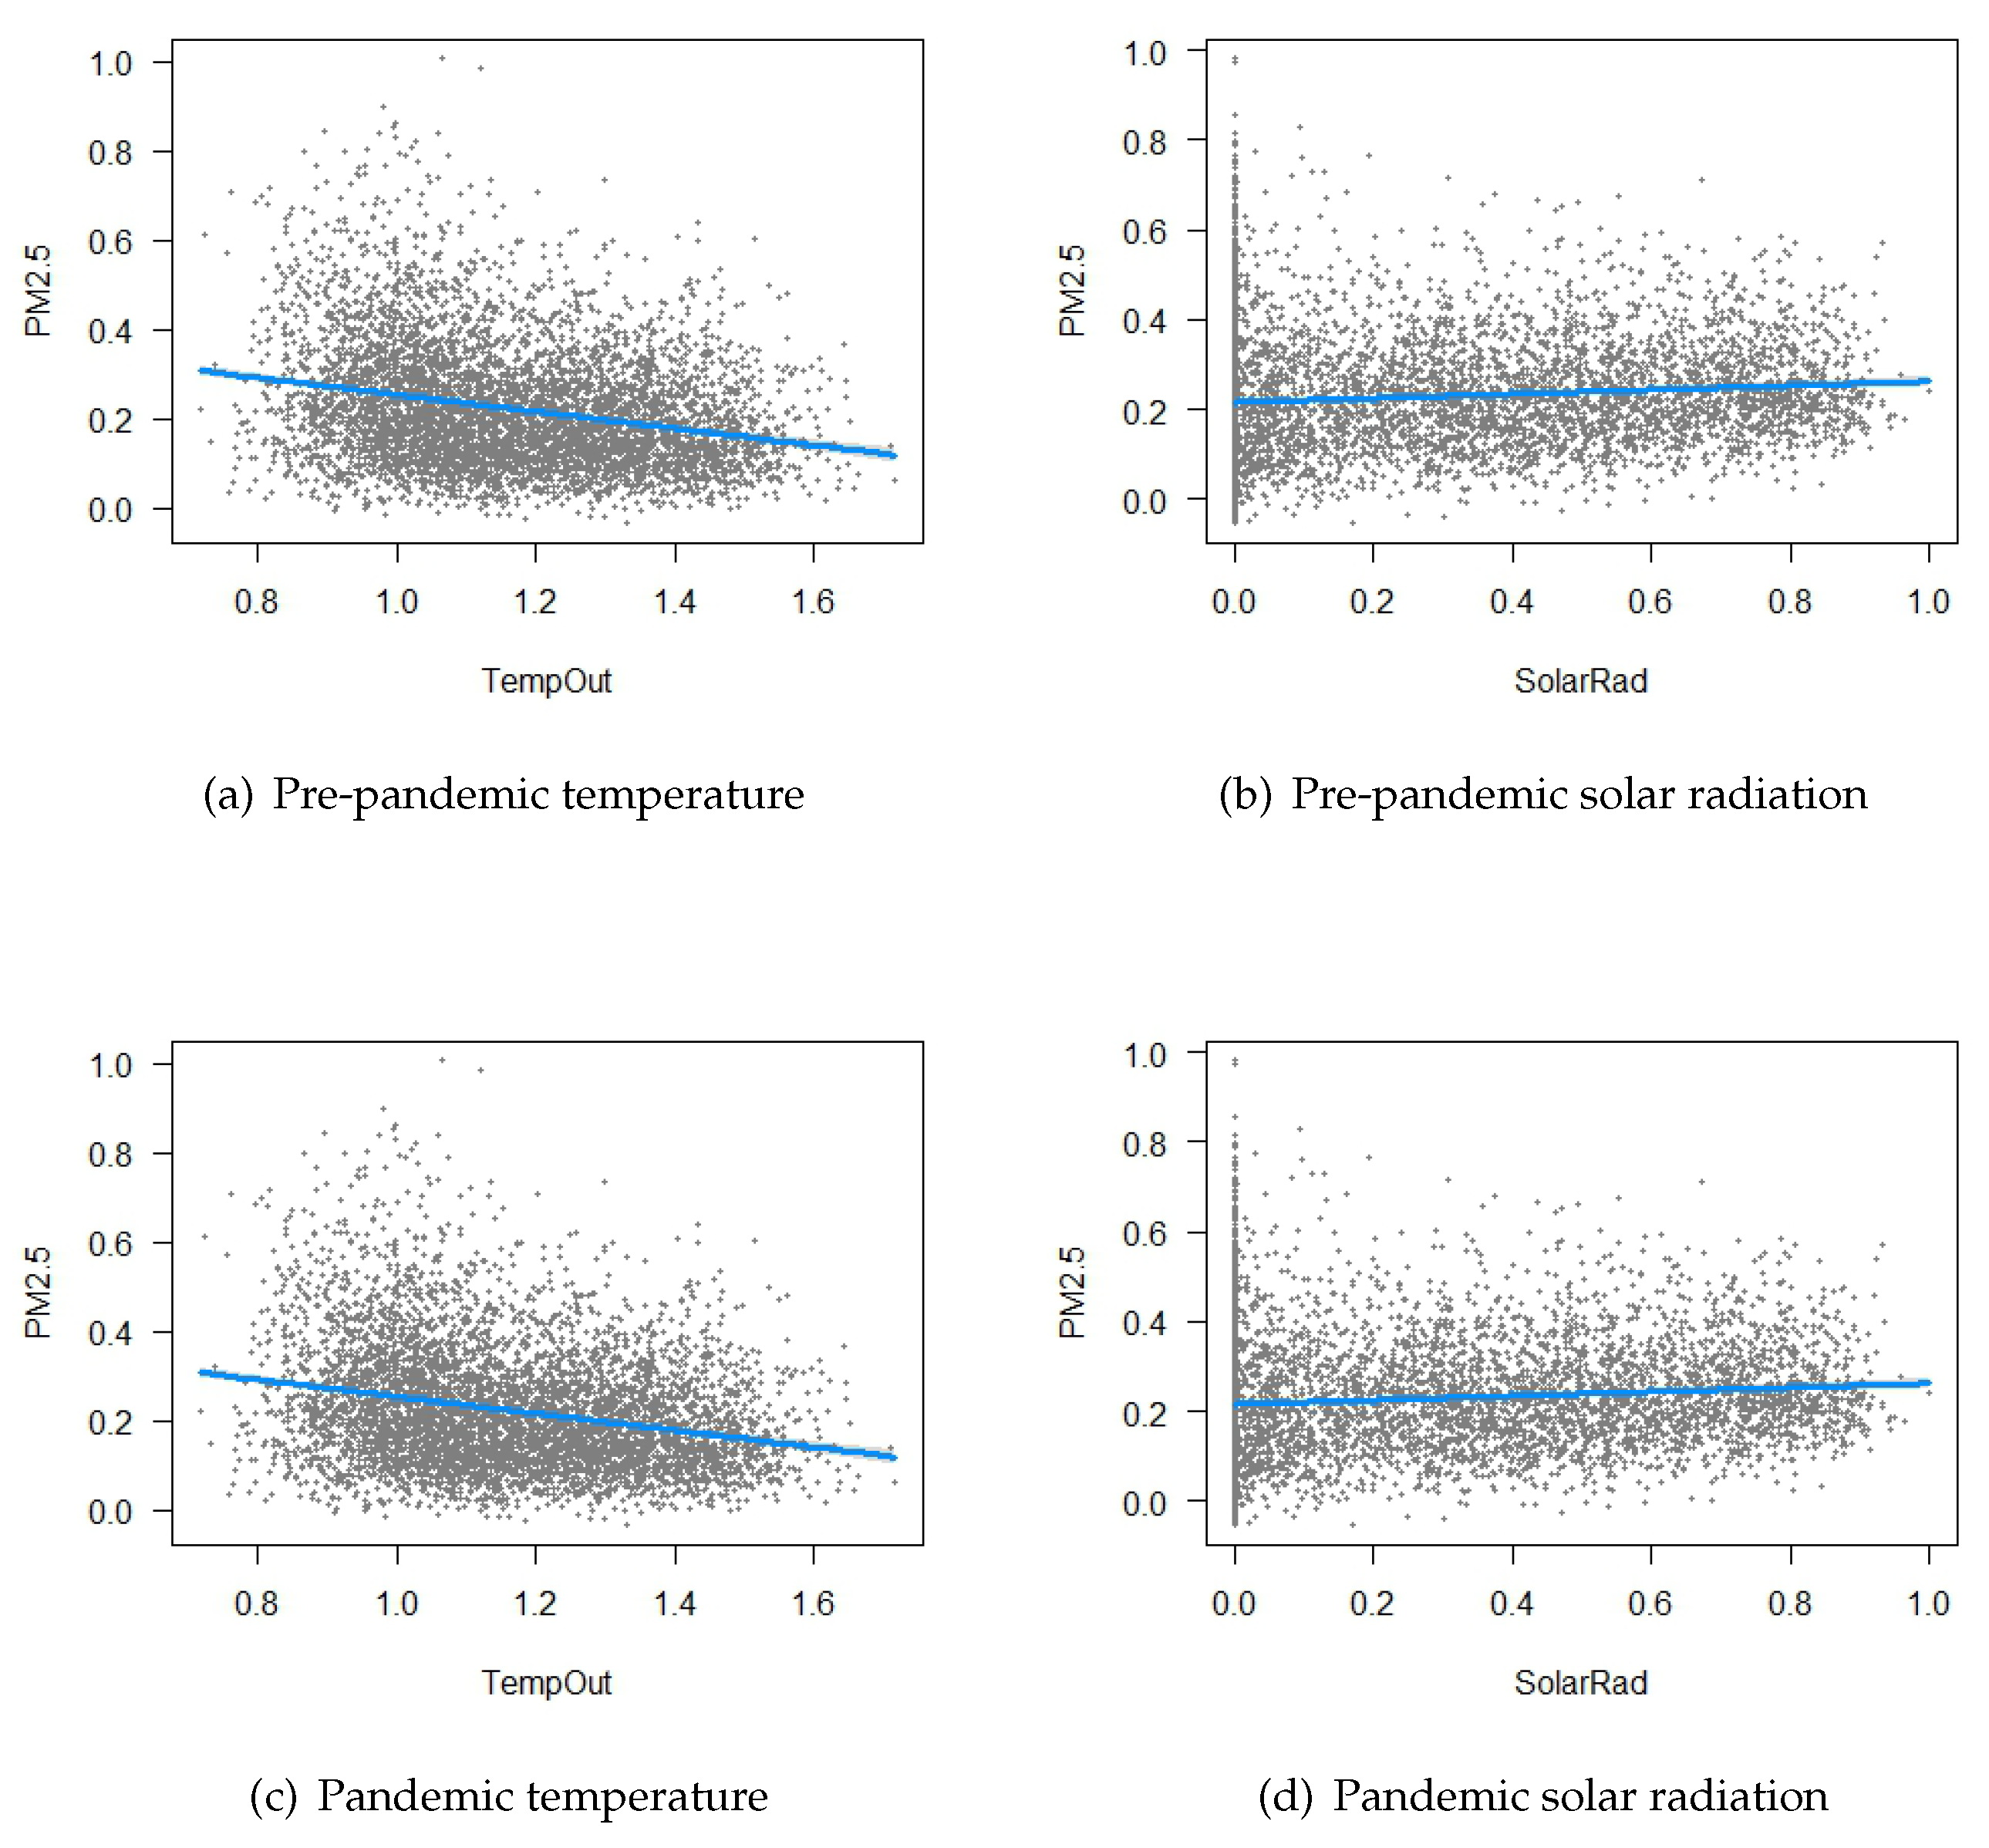

Table 1.
Correlation between concentration and temperature (April 2019 to August 2022).
| Lag [hours] | Pearson’s correlation coefficient | Spearman’s correlation coefficient |
|---|---|---|
| 0 | -0.4146 | -0.4336, p = 0 |
| 1 | -0.4480 | -0.4646, p = 0 |
| 2 | -0.4585 | -0.4898, p = 0 |
| 3 | -0.4336 | -0.4601, p = 0 |
Table 2.
Correlation between and wind velocity (data from April 2019 to August 2022).
| Lag [hours] | Pearson correlation coefficient | Spearman correlation coefficient |
|---|---|---|
| 0 | -0.2998 | -0.3732, p = 0 |
| 1 | -0.3446 | -0.4564, p = 0 |
| 2 | -0.3266 | -0.4417, p = 0 |
Table 3.
Statistical representative values of the annual boundary layer height (m) for the period 2019 to 2022.
Table 3.
Statistical representative values of the annual boundary layer height (m) for the period 2019 to 2022.
| Year | Mean | Standard deviation | Minimum | Maximum |
|---|---|---|---|---|
| 2019 | 777.054 | 145.366 | 594.032 | 1014.719 |
| 2020 | 786.106 | 136.796 | 613.769 | 1017.922 |
| 2021 | 763.208 | 131.544 | 605.362 | 995.341 |
| 2022 | 777.059 | 133.053 | 611.178 | 1009.027 |
Table 4.
Correlation between concentration and boundary layer height.
| Lag [hours] | Correlation coefficient Pearson | Spearman correlation coefficient |
|---|---|---|
| 0 | -0.2109 | -0.2276, p = 0 |
| 1 | -0.2401 | -0.2677, p = 0 |
| 2 | -0.2336 | -0.2687, p = 0 |
| 3 | -0.1981 | -0.2372, p = 0 |
Table 5.
events considered for PCA analysis.
| Event | From (D/M/Y) | To (D/M/Y) |
|---|---|---|
| Ev1 | 08/04/2019 | 10/04/2019 |
| Ev2 | 11/04/2019 | 13/04/2019 |
| Ev3 | 03/10/2019 | 04/10/2019 |
| Ev4 | 07/03/2020 | 08/03/2020 |
| Ev5 | 19/03/2020 | 20/03/2020 |
| Ev6 | 26/06/2020 | 27/06/2020 |
Table 6.
Regression coefficients.
| Pre-pandemic | Pandemic | |||
|---|---|---|---|---|
| Variable | K Estimate | P-Value | K Estimate | P-Value |
| Wind Speed | -2.539 | 0.38808 | -8.57 | < 2e-16 |
| Rain | -13.135 | 0.22076 | -1.017 | 0.309 |
| Temp | -23.95 | < 2e-16 | -14.509 | < 2e-16 |
| Wind Dir | 8.41 | 4.20E-13 | 0.133 | 0.894 |
| Solar Rad | 9.533 | 0.00147 | 6.112 | 1.05E-09 |
Disclaimer/Publisher’s Note: The statements, opinions and data contained in all publications are solely those of the individual author(s) and contributor(s) and not of MDPI and/or the editor(s). MDPI and/or the editor(s) disclaim responsibility for any injury to people or property resulting from any ideas, methods, instructions or products referred to in the content. |
© 2024 by the authors. Licensee MDPI, Basel, Switzerland. This article is an open access article distributed under the terms and conditions of the Creative Commons Attribution (CC BY) license (http://creativecommons.org/licenses/by/4.0/).
Copyright: This open access article is published under a Creative Commons CC BY 4.0 license, which permit the free download, distribution, and reuse, provided that the author and preprint are cited in any reuse.


