
Submitted:
08 October 2024
Posted:
09 October 2024
You are already at the latest version
Abstract
COP21 represented a starting point for several nations to develop and implement energy transition strategies to face and mitigate climate change, making the electrical power sector crucial in achieving the established goals and commitments. This research presents a 7-step methodology to improve decision-making in energy transition strategies for the power sector by integrating an economic dispatch optimization model based on linear programming to determine vulnerable aspects of power generation and transmission in strategic planning scenarios that could jeopardize the country’s energy transition. The application of the methodology is implemented under the open-source platform Python Optimization Modelling (PYOMO) and illustrated through a case study of the Mexican Electrical Power System (SEN) during the year 2025. The case study shows that the reserve margin fluctuated due to the variable renewable energy installed despite having a vast installed capacity to supply the country’s total demand. In addition, the results showed that most of the transmission lines had a congestion frequency higher than 90% of their capacity during most of the year. Two regions were identified as the best options for reducing greenhouse gas emissions by installing new power plants. Finally, most technologies reflected an under-generation, suggesting a high dependence on some fuels to supply the Mexican demand. The model’s programming is freely available in GitHub.
Keywords:
Power systems
; multi-time scenarios
; economic dispatch
; multi region scenarios
; optimization models
1. Introduction
Climate change, a phenomenon that demands the collective attention of all governments, has seen the mean land surface air temperature rise by 1.53 °C from the period 1850-1900 to 2006-2015 [1]. This collective concern has spurred the study of various adaptation policies and programs, a collaborative effort aimed at reducing the exposure and vulnerability of natural and human systems to potential changes in different regions and sectors [2,3,4,5,6]. This collaborative spirit also drives the search for strategies to adapt to the new climatological and environmental conditions [7,8,9,10].
Some policies seek to mitigate climate change by increasing carbon dioxide sinks or reducing emissions. In the case of the latter, COP21 represented a starting point for several nations to develop an energy transition program and define specific goals for the year 2030 [11,12,13,14,15]. However, achieving the transition has become a complicated problem to address as strategies have yet to be deployed as expected due to unforeseen situations with global repercussions such as the COVID-19 pandemic or the recent conflict between Ukraine and Russia [16,17,18,19]. These facts have led governments worldwide to constantly search for strategies that contemplate possible geopolitical, economic, energy, and climate changes in the short, medium, and long term [20,21,22,23].
Mexico is one of the countries that seek to reduce its greenhouse gas emissions in the short, medium, and long term, committing to reduce its emissions by 22% by 2030, equivalent to 211 million tons of CO2, during the Paris climate conference [24]. To achieve this objective, it was considered that the electricity and transportation sectors should have the most significant contribution to emissions reduction since together they generate approximately 50% of the country’s total emissions, according to the National Emissions Inventory 2015 prepared by the National Institute of Ecology and Climate Change (INECC) [25]. The main action to reduce emissions in the transport sector is to increase the use of electric cars, which transfers their emissions to the electric power sector. Hence, developing strategies to decarbonize the latter provides a double benefit in achieving the energy transition and face climate change. In addition, the Mexican government has other national climate commitments that strengthen the need to carry out the country’s energy transition, such as the National Law on Climate Change that establish a 50% reduction in total national emissions by 2050 concerning emissions in 2000 [26] or the Energy Transition Law that includes as a goal a minimum annual clean energy generation contribution of 35% by 2024 [27]. In turn, with the publication of the Electricity Industry Law, the Mexican Ministry of Energy (SENER) obtained the power to lead the planning process of the National Power System (SEN), preparing the National Electric System Development Program (PRODESEN) as the main planning instrument of the SEN regarding generation, transmission and distribution activities [28]. Among the most relevant information contained in this document is the Indicative Program for the Installation and Retirement of Power Plants (PIIRCE), the regional annual generation of previous years, and fuel price forecasts, making it very attractive to study the strategies that the Mexican government has contemplated to address the energy transition or the increase in energy demand. However, it is essential to consider what is mentioned by Gu et al. [29], who examine the factors influencing the Southeast Asian power systems through a SWOT analysis. The study shows that the transition to low-carbon power infrastructure faces many constraints, such as the lack of ambitious renewable energy goals, abundant fossil fuels, underdeveloped grid infrastructure, an uncompetitive power regime, high fossil fuel subsidies, insufficient financial support, and low environmental standards for the power sector.
There is a wide variety of research proposing concrete actions for the decarbonization of the SEN. Vera et al. [30] identify the consequences of the growing natural gas share in Mexican electricity production, as well as the policy alternatives to change the current trend towards dependence on natural gas for electricity production. Diezmartínez [31] uses a comparative policy analysis to study the regulatory frameworks and policy strategies pursued in Mexico, the US, and Germany to advance the deployment of energy storage. Lüpke [32] apply concepts of climate policy integration to analyze whether integration between the policy subsystems of energy and climate change occurred in Mexico in terms of political discourse and negotiation, policy goals and instruments, and implementation; as well as the factors at work that lead to climate policy integration. Castrejon-Campos [33] describes the evolution of clean energy technologies in Mexico using a multi-perspective analytical framework. Serrano-Arévalo et al. [34] propose an approach for sustainable power sector transition planning by developing deep learning models (LSTM and GRU) for energy demand forecasting and a mathematical formulation for meeting demand over a planning horizon based on a set of conventional and clean installed power plants as well as new technologies that need to be installed in the future. Bonacloche et al. [35] assess Mexico’s green investments for the period 2018-2030 in terms of value-added, employment, materials, land use, water, and CO2eq emissions in a multiregional input-output framework and compare the results with the IRENA proposal. Mercado et al. [36] employ a bottom-up model of the electric power system to identify critical geographic areas of investment for installed capacity and transmission that are robust across a set of Integrated Assessment Models-derived climate mitigation pathways. Vidal-Amaro et al. [37] use the Minimum Total Mix Capacity methodology to investigate the potential for renewable energy sources integration into the SEN by constructing three scenarios to achieve the 2024 target and analyze the systems’s response to varying contributions of wind and solar power production to the scenarios.
Due to the depth of the effects of implementing these strategies, it is common to consider some simplifications and to encourage further research using more detailed information through mathematical and computational models. Some examples link models to address some of these challenges. Almalaq et al. [38] propose a stochastic power system planning model to increase the hosting capacity of networks and satisfy future load demands. The model is formulated to consider a significant number and size of installed generation and transmission expansion projects rather than the investment cost without violating operating and reliability constraints. Zhou et al. [39] propose a new capacity expansion planning method for wind power and energy storage, considering power systems’ actual multistage operation process. In particular, the hourly robust transmission constrained unit commitment and economic dispatch are involved in this planning method, and thus, it could accurately evaluate the operational cost under certain planning decisions. He et al. [40] propose an economic dispatch model for multi-area integrated electricity and natural gas systems considering tie-line congestion, maximum allowable emission bounds, and hourly spinning reserve constraints. Deng et al. [41] point out that focusing on short-term system operations in the planning models integrating variable renewables is increasingly important, especially the constraints of flexible generation, interregional transmission, energy storage, and demand side response.
Based on the information provided, it is important to emphasize that there are numerous opportunities to achieve the country’s energy supply and decarbonization objectives. Therefore, it is essential to conduct further research to evaluate the strategies and scenarios for the energy transition in the SEN. This evaluation should include meticulous details to support decision-making, enhance existing studies, and broaden the information covered by PRODESEN.
A scope for development lies in the thorough technical, economic, and environmental evaluation of the different scenarios outlined in PRODESEN. The present scenarios are based on medium-term study horizons and utilize annual, non-regionalized data. However, these simplifications do not provide specific details, such as regional hourly energy shortage due to the increasing presence of intermittent renewable plants, transmission network congestion hours, regional reserve margin performance, key locations for power plant installation that could significantly impact reducing emissions, and technologies with higher/lower capacity factors.
Modifying and programming mathematical models to incorporate a large number of variables and sets is necessary to develop scenarios with more precise input information and results. Additionally, proper management of output information is crucial for conducting detailed analysis.
This article introduces a robust methodology integrating an economic dispatch optimization model based on linear programming. The primary objective of this methodology is to determine the level of energy shortage, congestion of transmission networks, and regions for installing new power plants. However, its unique strength is identifying the most vulnerable points in generating and transmitting electricity. By leveraging the base information of two planning scenarios proposed in the PRODESEN, this methodology considers several factors such as generation-consumption regions, maximum transmission capacity, hourly availability factors, and annual regional demand by hour.
The significant contributions of this paper are listed below.
- The proposed methodology integrates elements for obtaining energy shortage, congestion in transmission network, regional reserve margin performance, power plant installation regions that could significantly impact emissions reduction, and technologies with higher/lower plant factors.
- Disaggregated data is included for different parameters such as generation cost, availability factors, or regional transmission capacity.
- The case studies, which are a crucial part of this research, demonstrate the importance of disaggregating data for the identification of vulnerabilities in decarbonization scenarios of a Power Electrical System.
- The general economic dispatch model is extended to contemplate the characteristics of the SEN using four different sets of variables and parameters (technologies, generation regions, consumption regions, and time steps).
- The model’s programming runs under the open-source platform Python Optimization Modelling (PYOMO), which is freely available in the repository https://github.com/IhanKaydarin/Multi-regional-time-step-and-technology-economic-dispatch
The remainder of the paper is structured as follows: Section 2 contains the problem statement and presents the methodology to analyze an economic dispatch optimization model; Section 3 applies the methodology for the SEN. Finally, Section 4 provides this study’s conclusions, limitations, and future works.
2. Problem Statement and Methodology
The problem addressed encompasses improving decision-making in energy transition strategies by determining the regional hourly energy shortage, the hours of congestion in the power grid, the performance of the reserve margin, the regions where power plants are installed that could have the most significant impact on reducing emissions and technologies with the highest/lowest capacity factor in the scenarios developed by SENER through a methodology that integrates a model that simulates the hourly economic dispatch in the different control regions of the country. The methodology proposed consists of 7 steps, which are shown below:
- Characterization of electrical power system
- Mathematical modeling
- Data collection
- Model programming
- Input/output templates
- Results
- Identification of vulnerabilities
2.1. Characterization of Electrical Power System
The first step in characterizing the electrical power system is to select and determine the parameters necessary to simulate the economic dispatch. The amount of parameters corresponds to the extension of the model to be developed, the information available, and the computing power since the number of parameters required is proportional to the number of combinations among the generation and consumption regions, technologies, and time steps considered. When modeling annual economic dispatch, time steps of 1 hour, 24 hours, or 168 hours can be chosen. It is essential to note that smaller time steps will determine vulnerabilities more precisely.
2.2. Mathematical Modeling
Mathematical modeling of the electrical power system is fundamental to obtaining the desired results, that is, to determine the vulnerabilities of an energy transition scenario. A model based on linear programming is proposed to simulate the economic dispatch [42,43,44]. Describing the assumptions considered in the model’s development that support understanding the model’s scope and possible improvements is essential.
2.2.1. Assumptions
The first step in building the mathematical model is to determine the assumptions that must be considered, such as availability factors, maximum power capacity, transmission lines, start-up time, fuel cost, operation and maintenance cost.
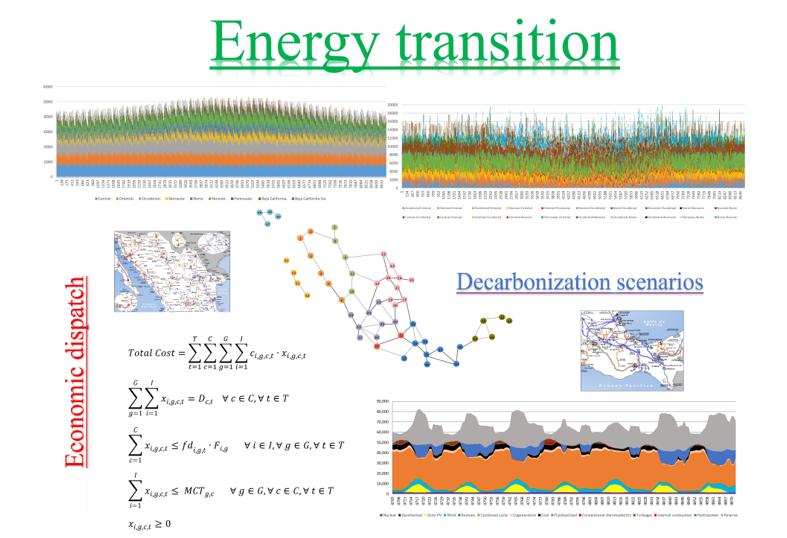
2.2.2. Objective Function
The model’s objective function seeks to minimize the total cost of dispatching the energy requested by the different consumption regions in each time step. The total price is calculated by summing the result of the multiplication between the decision variable , and the parameter through the different sets, as shown in eq.(1).
Where Total Cost ($USD) is the total cost of energy dispatch for the SEN during one year, (MWh) represents the energy that technology i installed in generation region g sends to consumption region c during hour t. The parameter ($USD/MWh) is the generation cost of technology i installed in generation region g to send electricity to consumption region c during hour t.
2.2.3. Restrictions
The first restriction is shown in eq. (2), which represents the balance of energy production and demand. The summation of the variable (MWh) through the sets I and G denotes the total energy produced in each region of the SEN for each hour. The parameter (Mwh) is the energy demand in each region of the SEN for each hour.
The second restriction is illustrated in Equation (3), which denotes the maximum amount of energy that each technology can produce based on its installed capacity, its type of technology, and the region to which it belongs. In this case, the summation of the variable (MWh) through the set C expresses the total energy generated by each technology in each region for each hour, the parameter (fraction) represents the availability factor of each technology in each generation region for each hour. The parameter (MW) is the installed capacity of each technology in each generation region.
Equation (4) delimits the maximum transmission capacity between the different regions. The sum of the variables (MWh) through the set I indicates the electricity produced by each generation region transmitted to each consumption region during each hour. This result must be less than or equal to the value of the parameter (MWh), which represents the maximum capacity that each link can transmit between each region.
Finally, Equation (5) represents the results of the energy generation variable (MWh) in exclusively positive values.
2.3. Data Collection
This step is one of the most complicated, mainly due to the divergence of values between the information that can be accessed from different sources for specific parameters. Obtaining data is an element that determines the electrical power system’s modeling and the results’ precision. It is recommended that official reports be used to provide greater precision of values.
2.4. Model Programming
Once the mathematical model has been developed and the data for the different parameters are available, the model must be programmed. To do this, it is necessary to use an optimization program that uses advanced algorithms with the capacity to handle large numbers of equations, decision variables, and values. Different software such as General Algebraic Modeling System (DAMS), Python Optimization Modeling Objects (PYOMO), GUROBI, or MATLAB can be used. Each software has advantages and disadvantages that must be considered to make the best choice.
2.5. Input/Output Templates
An essential element for solving the program and analyzing the results is developing templates that organize the input and output information. Due to the nature of the dispatch problem and the amount of data/variables considered, extreme caution must be taken to avoid incorrect results or the program not compiling properly.
2.6. Results
The analysis of results consists of analyzing the meaning of the values obtained for the aspects shown below:
- Hourly energy shortage: It can be determined if any restrictions are unmet. There are diverse reasons why this situation could occur, such as the low availability of intermittent technologies, congestion or limited transmission capacity, or the region’s lack of self-supply capacity. Nevertheless, it is possible to overcome this inconvenience by proposing an extra technology with the highest generation cost so that when it is dispatched, the quantity, hours, and region of missing energy can be known.
-
Hours of congestion on transmission lines: This aspect is obtained by counting the hours in which the energy transmitted from one region to another is equal to or greater than 90% of the link capacity. This calculation is shown in equations 6 and 7.Those links with the highest number of hours of congestion represent the regions with the most significant external power dependence, high potential to increase the national transmission network, and areas of opportunity to reduce generation costs.
- Regional reserve margin performance: This factor identifies the regions vulnerable to changes in the generation availability of the power units installed in the region. In addition, those regions that meet the indicative values established in the reliability policy are identified. The regional reserve margin is determined through Equation (8):
- Regions where power plants are installed that could significantly impact reducing emissions must be identified: The plants with the highest emission factor and the highest generation must be identified. Nevertheless, it is essential to remember that proposing to install a new plant with a low emission factor requires a more exhaustive analysis than described in this research.
- Technologies with higher/lower capacity factor: This parameter provides valuable information regarding the units essential for energy supply and the underutilized plants.
The proposed methodology is presented in Figure 1.
The following chapter presents a case study with the SEN where the methodology described above is applied.
3. Case Studies and Assumptions
3.1. Characterization of SEN
For the SEN case, 13 different technologies of power plants were considered: thermoelectric, combined cycle, coal-fired, turbogas, internal combustion, fluidized bed, hydroelectric, wind, geothermal, solar, bioenergy, cogeneration, and nuclear. Regarding regionalization and transmission lines, information from PRODESEN was used (Figure 2), where nine generation regions and nine consumption regions were considered, having the exact location and name, which are Central, Oriental, Occidental, Noroeste, Norte, Noreste, Peninsular, Baja California (BC) and Baja California Sur (BCS). Likewise, regions 1 to 7 are interconnected according to their geographic location. However, regions 9 and 9 were isolated. Finally, time steps of 1 hour were used, totaling 8760 for the annual scenario.
3.2. Mathematical Modeling
3.2.1. Assumptions for SEN 2025
For the SEN 2025 scenario, the following assumptions were taken into account:
- International interconnections are not considered.
- Availability factors are averaged for thermoelectric, combined cycle, coal-fired, turbogas, internal combustion, fluidized bed, geothermal, bioenergy, cogeneration, and nuclear technologies.
- The total installed capacity for each technology in each region was used.
- The generation cost considers the levelized fuel cost, the regional increase in fuel costs, and the operation and maintenance cost.
- Availability factors for thermal technologies are annual averages.
- Seasons of unavailability due to preventive maintenance of the plants are not considered.
3.2.2. Objective Function of SEN 2025
The objective function for optimizing the SEN dispatch cost with 13technologies, 9 generation regions, 9 consumption regions, and 8760-time steps is as follows:
3.2.3. Restrictions of SEN 2025
Below are the respective restrictions of the SEN 2025 case:
- Supply hourly demand by consumption region and time step:
- Maximum power generation by technology, generation region and time step:
- Maximum power grid capacity:
- No negativity:
3.3. Data Collection
The information provided by the following official documents and platforms of the Mexican government was used: PRODESEN 2018-2032, PRODESEN 2019-2033, PRODESEN 2020-2034, PRODESEN 2021-2035, PRODESEN 2022-2036, Costos y Parámetros de Referencia 2021 (COPAR 2021), Programa de Ampliación y Modernización de la Red Nacional de Transmisión (PAMRNT), y Sistema de Información Energética (SIE-SENER). Information from various studies developed by the Faculty of Engineering of the National Autonomous University of Mexico (FI-UNAM) was also used.
Table 1 shows the sets contemplated by each parameter and decision variable considered in the SEN dispatch model and the number of data required and obtained in simulating the annual scenario.
Figure 3 shows the regional hourly demand values used to dispatch the SEN 2025 scenario. The hour of lowest coincident demand is number 8565 of the year, i.e., 9:00 pm on December 22. On the other hand, the hour of highest coincident demand is number 4064, corresponding to 8:00 am on June 18.
3.4. Model Programming
The mathematical equations were programmed using the Python programming language through the PYOMO tool for mathematical modeling. PYOMO’s goal is to provide a platform for specifying optimization models that embodies central ideas found in modern algebraic modeling language within a framework that promotes flexibility, extensibility, portability, openness, and maintainability [26].
The main advantage of using PYOMO is the simplicity of programming the definition of sets, parameters, decision variables, objective function, and constraints. In addition, it is flexible enough to easily incorporate the use of different solvers. In this sense, the solver included in PYOMO by default is "GLPK." However, to solve the economic dispatch model for the SEN, the solver "CPLEX" was used. The code that includes the economic dispatch model was shared in the GitHub repository.
3.5. Input/Output Templates for SEN 2025
In the SEN 2025 case, first, a template organized the information on the parameters was used for data entry in PYOMO. Subsequently, a second template was created that saved the values of the results obtained based on the technologies, generation regions, and consumption regions. In this case, it was necessary to reorganize the results obtained in various ways to visualize better the aspects to be analyzed.
3.6. Results of SEN 2025
This section shows the results obtained by the SEN 2024 scenario for determining key aspects.
3.6.1. Hourly Energy Shortage
Figure 4 shows the hourly energy dispatch by technology in the SEN, in which there were no hours of energy shortage. The minimum and maximum reserve capacities are 4634 and 48461 MW, respectively.
3.6.2. Hours of Congestion on Transmission Lines
Figure 5 illustrates the power transmitted between the different regions at each hour of the year for the SEN 2025 scenario, where the links with the highest energy exchanges and the flow direction can be observed, with the first name being the emitting region and the second the receiving region. In addition, this figure supports us in locating the regions with a higher and lower concentration of technologies with low generation costs. It should be noted that the extensive use of a transmission line does not mean that the extensive use of a transmission line does not mean that the receiving region is not self-sufficient, e.g., when analyzing the Noreste-Oriental link, we can observe that it maintains energy exchanges throughout the year, which could indicate that the Oriental region does not have sufficient self-supply capacity. Nevertheless, the Oriental-Central and Oriental-Peninsular links are also in constant use, with the Oriental region being the energy-emitting region. This situation is because the aim is to carry out dispatch at minimum cost, so it concluded that the Oriental region has technologies with lower generation costs than those installed in the Peninsular and Central regions. However, it needs more installed capacity to supply its demand at minimum costs than those installed in the Peninsular and Central regions. However, it needs more installed capacity to supply its demand at minimum cost, so importing energy from the Noreste region is necessary.
On the other hand, the regions with the greatest dependence on the RNT for the SEN 2025 scenario are Central and Occidental, which import around 48% and 55% of their annual demand, respectively.
To complement the information obtained from the results of the SEN 2025 scenario, Figure 6 illustrates the number of hours of congestion on each of the modeled transmission lines. In this case, the links with the highest frequency of congestion are Noreste-Este, Norte-Occidental, Noroeste-Occidental, and Noreste-Occidental, which indicates which links could be an option to increase their transmission capacity.
Likewise, it is interesting to analyze the Noreste-Norte link since it is one of the few links that presents bidirectional energy exchanges throughout the year, as illustrated in Figure 7. The change in flow direction in this link is due to the variation in wind energy generation in the Noreste region, which is exported to the Oriental region. In the event of a reduction in wind energy, this export is compensated by combined cycle technology.
3.6.3. Regional Reserve Margin Performance
The reserve margin results obtained in the SEN 2025 scenario shown in Figure 8 show that it maintains a value greater than 25% for most of the year. However, this methodology’s importance lies in analyzing the most critical hours when the power supply may be compromised due to a low reserve margin, as shown in Figure 9 and Figure 10.
In this case, the reduction in the total available capacity margin is due to the coincidence of the low availability factor between solar, wind, and hydroelectric technologies, which reflects a significant dependence on climate conditions in some regions to ensure their power supply, which is why the increase in intermittent plants in these regions should be conditioned.
3.6.4. Regions Where Power Plants Are Installed That Could Significantly Impact Reducing Emissions Must be Identified
Using the emission factor values for each technology in Mexico, hourly emission by region can be determined, as shown in Figure 11. It can be observed that there is an increase in emissions during the middle of the year, which is predictable since, during that season, there is greater demand and, therefore, greater power generation. Nevertheless, due to the disparity of power by region, these emissions must be normalized to identify the regions with the most significant concentrations of emissions per unit of energy generated, as shown in Figure 12.
By analyzing week 32 of the SEN 2025 scenario, we can identify the regions that mainly use technologies with a high emission factor to produce their power. Similarly, Figure 13 and Figure 14 show the contrast between the percentage contribution of hourly emissions produced and the percentage contribution to the hourly emission factor.
3.6.5. Technologies with Higher/Lower Capacity Factor
In the SEN 2025 scenario, as mentioned above, the objective of the optimization is to minimize the dispatch cost so that the technologies with the lowest generation cost and highest availability factor will have a higher capacity factor, as in the case of bioenergy and nuclear technologies. On the other hand, some technologies are used as backup or primary generation based on the conditions of each region. For example, unlike the other regions, the Baja California Sur region has extensive generation through thermoelectric and turbogas technologies.
When observing the results obtained in the SEN 2025 scenario (Figure 15, Figure 16, Figure 17 and Figure 18), we can mention that by using highly disaggregated information, it was possible to detect areas of opportunity to carry out correct planning of the SEN for the coming years, e.g., although the installed capacity may seem considerably large to supply the total demand of the country throughout the year, there are hours with a minimum reserve margin to respond to situations of unexpected failure by power technologies, with the central region being the most vulnerable. In addition, by regionalizing the SEN and analyzing the transmission lines, it was possible to contemplate the areas of opportunity for the expansion of the RNT or the diversification of installed capacity. On the other hand, it was possible to contemplate that the regions with the most significant potential to reduce emissions in the SEN are highly related to the technologies installed within the region itself and the interconnections with other regions. Finally, it was possible to know the plants in each region that have subgeneration, which is an opportunity to develop strategies to improve decision-making on the issue of installing new power plants.
4. Conclusions
This article develops a 7-step methodology to improve decision-making in energy transition strategies for the power sector by determining the regional hourly power shortage, the hours of congestion in transmission lines, the performance of the reserve margin, the regions of installation of power plants with the most significant impact on the reduction of emissions and the capacity factor of the different modeled technologies. The methodology adopts a power dispatch optimization model with one objective function and four restrictions, which was applied to the SEN, where the dispatch of the different technologies installed and planned to start operation in 2025 was simulated. Based on the results, it was concluded that in that year, there was no power shortage during any hour. The minimum reserve margin recorded in an hour was 8% of the total available capacity concerning the demand during that period, which could seem adequate. Nevertheless, not considering the maintenance periods or other types of unavailability could be essential to improve for the coming years. On the other hand, the links with the highest frequency of congestion were Noreste-Oriental, Norte-Occidental, Noroeste-Occidental, and Noreste-Occidental with more than 5000 hours during this year, which may be an area of opportunity to develop new research that supports determine the technical and economic feasibility of expanding the RNT, as well as the need to diversity the areas of installation of power plants, thus promoting the reduction of greenhouse gas emissions. In this sense, the scenario showed that the regions with the highest amount of emissions and the highest contribution to the global emission factor of the SEN were the Central and Noreste regions due to the large installed capacity of technologies with a high emission factor and demand. Finally, the technologies with the highest plan factor were combined cycle, bioenergy, geothermal, and nuclear, equal to or greater than 75%.
The results presented are subject to many uncertainties associated with the assumptions and information used to determine demand forecasts, availability factors of intermittent technologies, generation costs, and fuel prices. Nevertheless, this paper contributes to the development of a methodology for evaluating vulnerabilities in the generation and transmission of power that could jeopardize a power system’s energy transition.
As future work, it is proposed to complement the dispatch optimization model to consider the installation and removal of power plants in such a way that the capacity, location, year, and type of technology to be installed in case of energy shortage can be known, as well as to determine the variation in hours of congestion in links, total production emissions, and capacity factors, and the value of the shadow price. Finally, using a multi-criteria decision method to evaluate the results obtained contributes to the sensibility analysis by comparing different scenarios with a global rating.
Author Contributions
Conceptualization, U.H.-U. and J.C.S.-T.-M.; methodology, U.H.-U., J.M.-M. and J.C.S.-T.-M.; validation, U.H.-U., J.C.S.-T.-M. and C.M.-d.-C.; formal analysis, U.H.-U., C.M.-d.-C. and N.H.-R.; investigation, U.H.-U., J.C.S.-T.-M. and J.M.-M.; resources, N.H.-R. and C.M.-d.-C.; writing—original draft preparation, U.H.-U., J.C.S.-T.-M. and J.M.-M.; writing—review and editing, N.H.-R. and C.M.-d.-C.; visualization, U.H.-U., J.C.S.-T.-M. and N.H.-R.; supervision, J.C.S.-T.-M., J.M.-M. and C.M.-d.-C.; funding acquisition, J.C.S.-T.-M. All authors have read and agreed to the published version of the manuscript.
Funding
The National Council for Humanities, Sciences, and Technology (CONAHCYT) provided a scholarship to Ulises A. Hernandez-Hurtado as a Postdoctoral researcher of the Autonomous University of the State of Hidalgo (UAEH) and financial support with project number F003-320109. Special thanks to the team researches of the UPE for the support in providing the data required to simulate the scenario.
Institutional Review Board Statement
Not applicable.
Informed Consent Statement
Not applicable.
Data Availability Statement
The model’s programming runs under the open-source platform Python Optimization Modelling (PYOMO), which is freely available in the repository https://github.com/IhanKaydarin/Multi-regional-time-step-and-technology-economic-dispatch (accessed on 30 September 2024).
Conflicts of Interest
The authors declare that they have no known competing financial interest or personal relationships that could have appeared to influence the work reported in this paper.
References
- Shukla, P.R.; Skeg, J.; Buendia, E.C.; Masson-Delmotte, V.; Pörtner, H.O.; Roberts, D.; Zhai, P.; Slade, R.; Connors, S.; Van Diemen, S.; others. Climate Change and Land: an IPCC special report on climate change, desertification, land degradation, sustainable land management, food security, and greenhouse gas fluxes in terrestrial ecosystems 2019.
- Intergovernmental Panel on Climate Change (IPCC). Climate Change 2021: The Physical Science Basis, 2021. Accessed: 2024-09-10.
- Intergovernmental Panel on Climate Change (IPCC). Climate Change 2022: Impacts, Adaptation and Vulnerability, 2022. Accessed: 2024-09-10.
- Advani, N.K. Assessing species vulnerability to climate change, and implementing practical solutions. Biological Conservation 2023, 286, 110284. [Google Scholar] [CrossRef]
- Kim, M.J.; Hong, J.B.; Han, I.S.; Lee, J.S.; Kim, D.H. Vulnerability assessment of Korean fisheries to climate change. Marine Policy 2023, 155, 105735. [Google Scholar] [CrossRef]
- Lewis, P.G.T.; Chiu, W.A.; Nasser, E.; Proville, J.; Barone, A.; Danforth, C.; Kim, B.; Prozzi, J.; Craft, E. Characterizing vulnerabilities to climate change across the United States. Environment international 2023, 172, 107772. [Google Scholar] [CrossRef]
- Adeagbo, O.; Bamire, A.; Akinola, A.; Adeagbo, A.; Oluwole, T.; Ojedokun, O.; Ojo, T.; Kassem, H.; Emenike, C. The level of adoption of multiple climate change adaptation strategies: Evidence from smallholder maize farmers in Southwest Nigeria. Scientific African 2023, 22, e01971. [Google Scholar] [CrossRef]
- Rathnayaka, B.; Robert, D.; Siriwardana, C.; Adikariwattage, V.; Pasindu, H.; Setunge, S.; Amaratunga, D. Identifying and prioritizing climate change adaptation measures in the context of electricity, transportation and water infrastructure: A case study. International Journal of Disaster Risk Reduction 2023, 99, 104093. [Google Scholar] [CrossRef]
- Sedtha, S.; Pramanik, M.; Szabo, S.; Wilson, K.; Park, K.S. Climate change perception and adaptation strategies to multiple climatic hazards: Evidence from the northeast of Thailand. Environmental Development 2023, 48, 100906. [Google Scholar] [CrossRef]
- Muzammil, M.; Zahid, A.; Farooq, U.; Saddique, N.; Breuer, L. Climate change adaptation strategies for sustainable water management in the Indus basin of Pakistan. Science of The Total Environment 2023, 878, 163143. [Google Scholar] [CrossRef]
- United Nations Framework Convention on Climate Change (UNFCCC). Adoption of the Paris Agreement, 2015. Accessed: 2024-09-10.
- Bashir, M.F.; Benjiang, M.; Hussain, H.I.; Shahbaz, M.; Koca, K.; Shahzadi, I. Evaluating environmental commitments to COP21 and the role of economic complexity, renewable energy, financial development, urbanization, and energy innovation: empirical evidence from the RCEP countries. Renewable Energy 2022, 184, 541–550. [Google Scholar] [CrossRef]
- Singh, K.; Meena, R.S.; Kumar, S.; Dhyani, S.; Sheoran, S.; Singh, H.M.; Pathak, V.V.; Khalid, Z.; Singh, A.; Chopra, K.; others. India’s renewable energy research and policies to phase down coal: Success after Paris agreement and possibilities post-Glasgow Climate Pact. Biomass and Bioenergy 2023, 177, 106944. [Google Scholar] [CrossRef]
- Balibar, S. Energy transitions after COP21 and 22. Comptes Rendus. Physique 2017, 18, 479–487. [Google Scholar] [CrossRef]
- Umar, M.; Ji, X.; Kirikkaleli, D.; Xu, Q. COP21 Roadmap: Do innovation, financial development, and transportation infrastructure matter for environmental sustainability in China? Journal of environmental management 2020, 271, 111026. [Google Scholar] [CrossRef]
- Crnčec, D.; Penca, J.; Lovec, M. The COVID-19 pandemic and the EU: From a sustainable energy transition to a green transition? Energy Policy 2023, 175, 113453. [Google Scholar] [CrossRef]
- Tian, J.; Yu, L.; Xue, R.; Zhuang, S.; Shan, Y. Global low-carbon energy transition in the post-COVID-19 era. Applied energy 2022, 307, 118205. [Google Scholar] [CrossRef]
- Mišík, M.; Nosko, A. Post-pandemic lessons for EU energy and climate policy after the Russian invasion of Ukraine: Introduction to a special issue on EU green recovery in the post-Covid-19 period. Energy Policy 2023, 177, 113546. [Google Scholar] [CrossRef]
- Żuk, P.; Żuk, P. National energy security or acceleration of transition? Energy policy after the war in Ukraine. Joule 2022, 6, 709–712. [Google Scholar] [CrossRef]
- Xin, B.; Zhang, M. Evolutionary game on international energy trade under the Russia-Ukraine conflict. Energy Economics 2023, 125, 106827. [Google Scholar] [CrossRef]
- Ślusarczyk, B.; Chłąd, M.; Michałek, J.; Dacko-Pikiewicz, Z.; Androniceanu, A. Strategies for supplying enterprises with energy in the context of changing coal prices on the Polish market-The effect of the war in Ukraine. Resources Policy 2023, 85, 104028. [Google Scholar] [CrossRef]
- Liu, W.; Chen, X.; Zhang, J. The Russia-Ukraine conflict and the automotive energy transition: Empirical evidence from China. Energy 2023, 284, 128562. [Google Scholar] [CrossRef]
- Cui, L.; Yue, S.; Nghiem, X.H.; Duan, M. Exploring the risk and economic vulnerability of global energy supply chain interruption in the context of Russo-Ukrainian war. Resources Policy 2023, 81, 103373. [Google Scholar] [CrossRef]
- de México, G. Contribución Prevista y Determinada a Nivel Nacional (INDC) de México, 2015. Accedido el: 11 de septiembre de 2024.
- de México Instituto Nacional de Ecología y Cambio Climático (INECC), G. Inventario Nacional de Emisiones de Gases y Compuestos de Efecto Invernadero, 2024. Accedido el: 11 de septiembre de 2024.
- de Protección al Ambiente (PROFEPA), P.F. Ley General de Cambio Climático, 2024. Accedido el: 11 de septiembre de 2024.
- de la Federación (DOF), D.O. Decreto por el que se expide la Ley de Transición Energética, 2015. Accedido el: 11 de septiembre de 2024.
- de Energía (SENER), S. Programa de Desarrollo del Sistema Eléctrico Nacional 2024-2038, 2024. Accedido el: 11 de septiembre de 2024.
- Gu, B.; Zhai, H.; An, Y.; Khanh, N.Q.; Ding, Z. Low-carbon transition of Southeast Asian power systems–A SWOT analysis. Sustainable Energy Technologies and Assessments 2023, 58, 103361. [Google Scholar] [CrossRef]
- Vera, M.S.; Manrique, L.G.; Peña, I.R.; Navarro, A.D.L.V. Drivers of electricity GHG emissions and the role of natural gas in mexican energy transition. Energy Policy 2023, 173, 113316. [Google Scholar] [CrossRef]
- Diezmartínez, C. Clean energy transition in Mexico: Policy recommendations for the deployment of energy storage technologies. Renewable and Sustainable Energy Reviews 2021, 135, 110407. [Google Scholar] [CrossRef]
- Von Lüpke, H.; Well, M. Analyzing climate and energy policy integration: the case of the Mexican energy transition. Climate Policy 2020, 20, 832–845. [Google Scholar] [CrossRef]
- Castrejon-Campos, O. Evolution of clean energy technologies in Mexico: A multi-perspective analysis. Energy for Sustainable Development 2022, 67, 29–53. [Google Scholar] [CrossRef]
- Serrano-Arévalo, T.I.; López-Flores, F.J.; Raya-Tapia, A.Y.; Ramírez-Márquez, C.; Ponce-Ortega, J.M. Optimal expansion for a clean power sector transition in Mexico based on predicted electricity demand using deep learning scheme. Applied Energy 2023, 348, 121597. [Google Scholar] [CrossRef]
- Banacloche, S.; Cadarso, M.A.; Monsalve, F.; Lechon, Y. Assessment of the sustainability of Mexico green investments in the road to Paris. Energy Policy 2020, 141, 111458. [Google Scholar] [CrossRef]
- Fernandez, R.M.; Baker, E.; Galicia, J.H. Regional Power Planning Robust to Multiple Models: Meeting Mexico’s 2050 Climate Goals. Energy and Climate Change 2022, 3, 100076. [Google Scholar] [CrossRef]
- Vidal-Amaro, J.J.; Østergaard, P.A.; Sheinbaum-Pardo, C. Optimal energy mix for transitioning from fossil fuels to renewable energy sources–The case of the Mexican electricity system. Applied Energy 2015, 150, 80–96. [Google Scholar] [CrossRef]
- Almalaq, A.; Alqunun, K.; Refaat, M.M.; Farah, A.; Benabdallah, F.; Ali, Z.M.; Aleem, S.H.A. Towards increasing hosting capacity of modern power systems through generation and transmission expansion planning. Sustainability 2022, 14, 2998. [Google Scholar] [CrossRef]
- Zhou, Y.; Zhai, Q.; Yuan, W.; Wu, J. Capacity expansion planning for wind power and energy storage considering hourly robust transmission constrained unit commitment. Applied Energy 2021, 302, 117570. [Google Scholar] [CrossRef]
- He, L.; Lu, Z.; Zhang, J.; Geng, L.; Cai, Y.; Li, X. Economic dispatch of multi-area integrated electricity and natural gas systems considering emission and hourly spinning reserve constraints. International Journal of Electrical Power & Energy Systems 2021, 132, 107177. [Google Scholar] [CrossRef]
- Deng, X.; Lv, T. Power system planning with increasing variable renewable energy: A review of optimization models. Journal of Cleaner Production 2020, 246, 118962. [Google Scholar] [CrossRef]
Figure 1.
Overview of the proposed methodology.
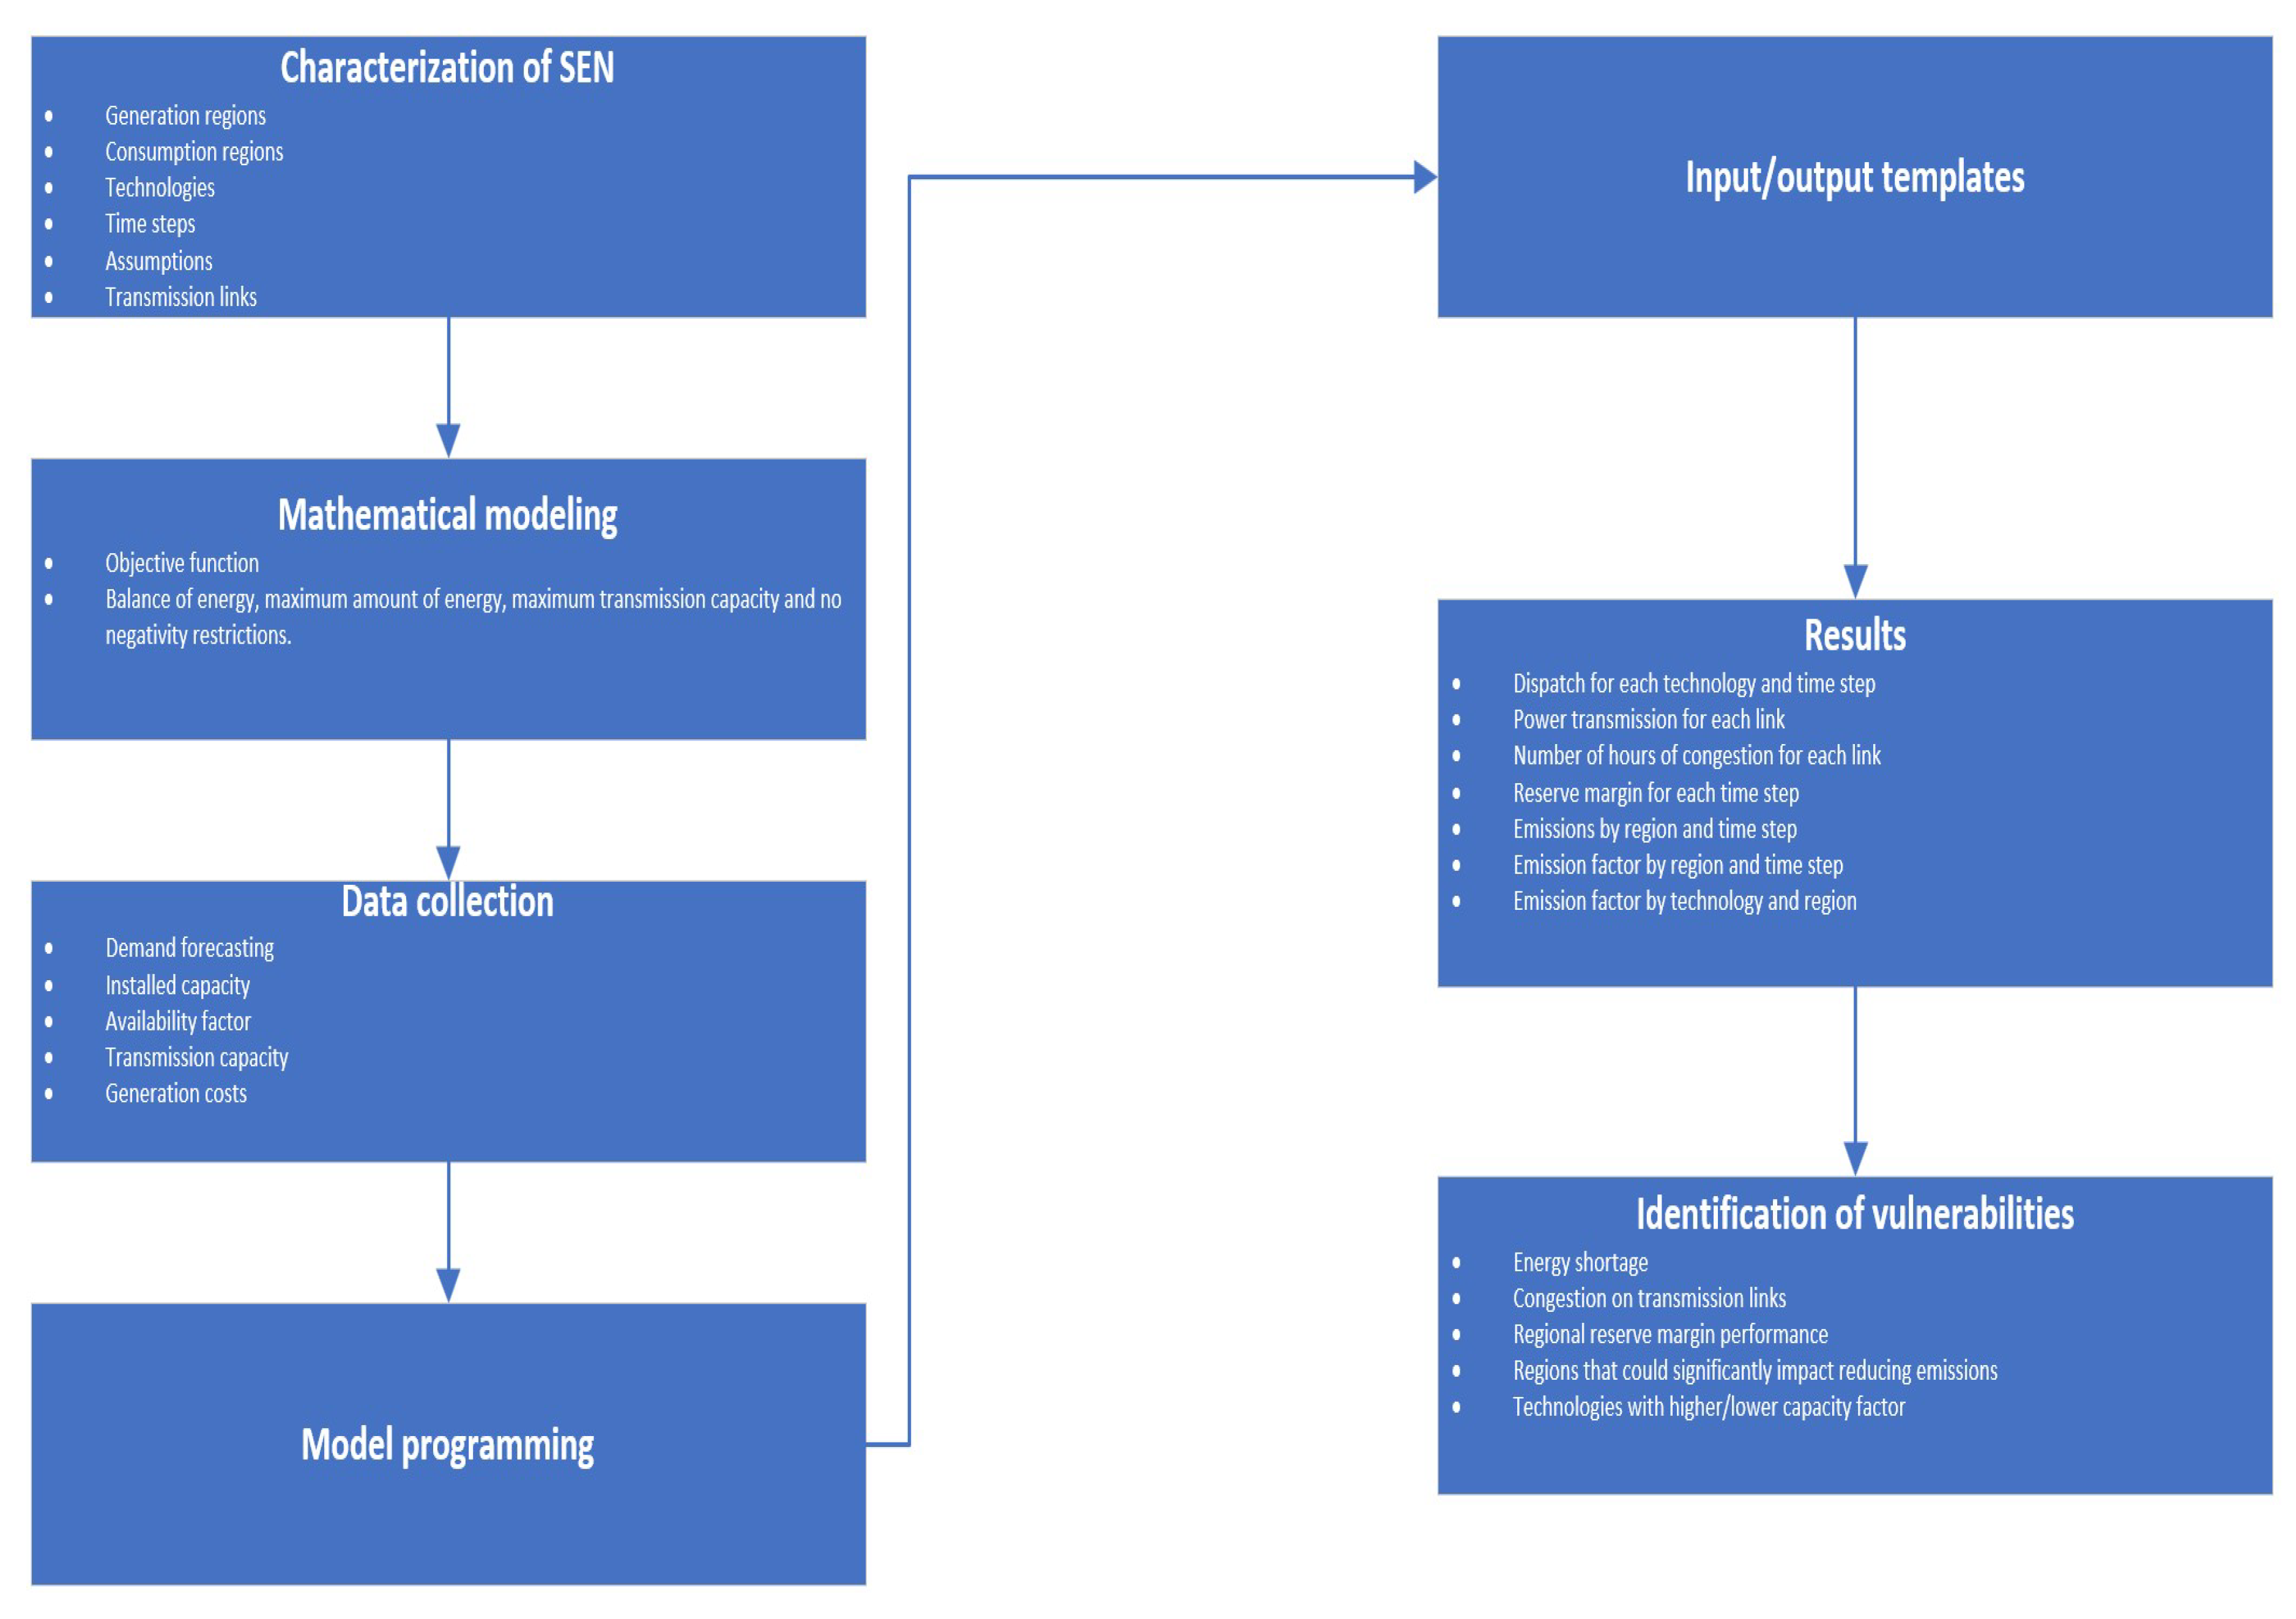
Figure 2.
Capacity of the 9 transmission lines (MW) between the SEN’s different generation and consumption regions.
Figure 2.
Capacity of the 9 transmission lines (MW) between the SEN’s different generation and consumption regions.
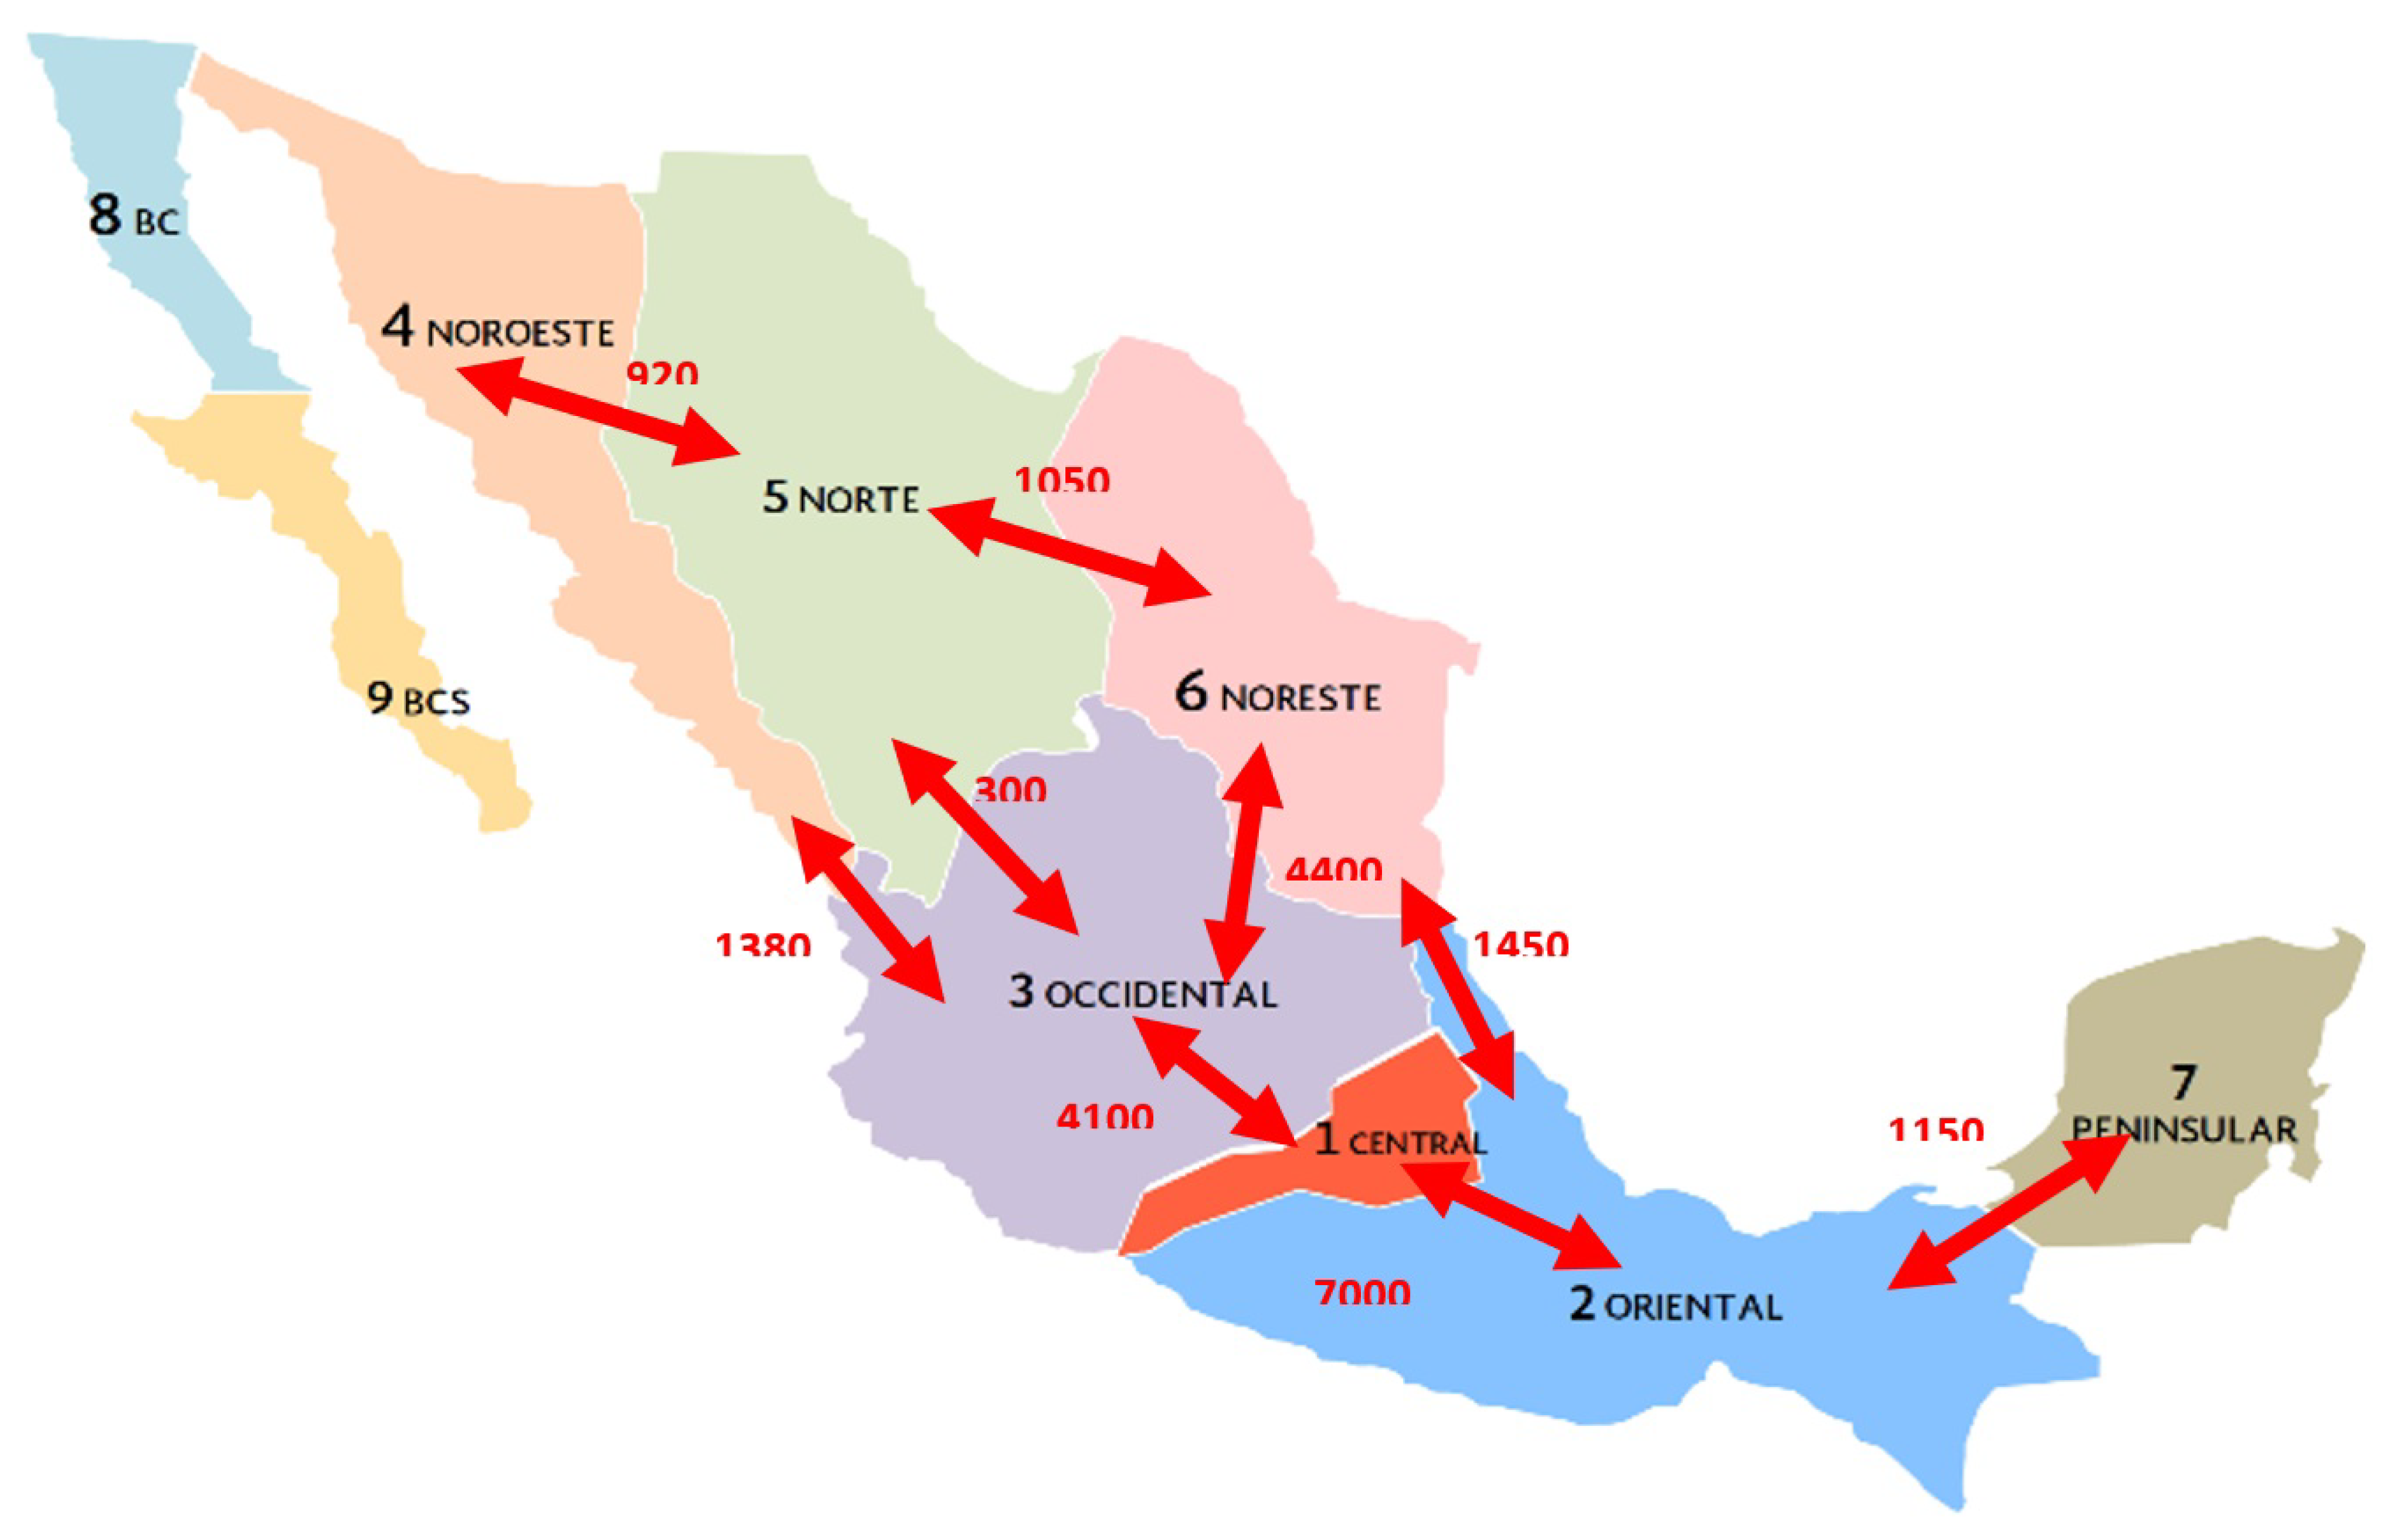
Figure 3.
Regional hourly demand forecast for the SEN 2025 scenario.
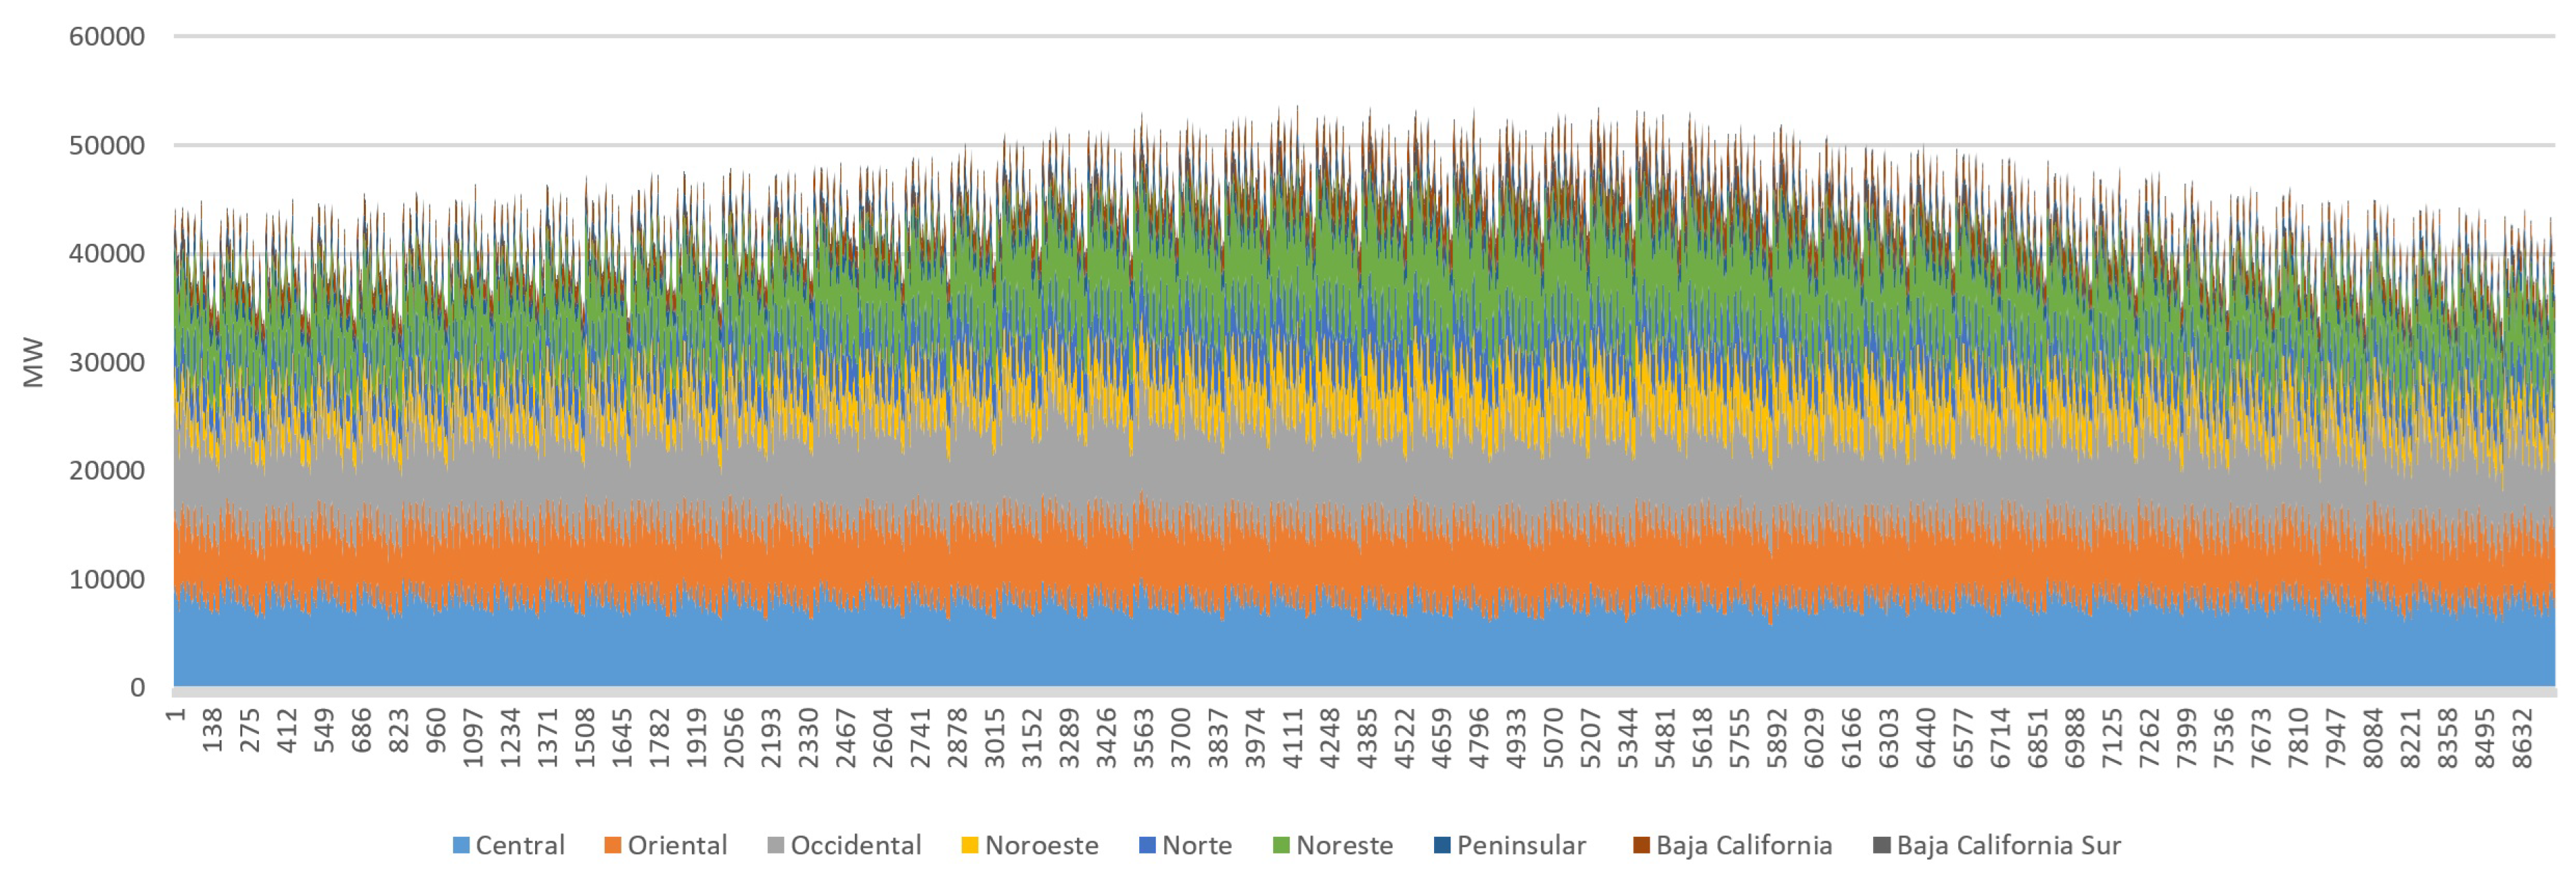
Figure 4.
Simulation results of hourly dispatch by type of technology (MW) in the SEN for the SEN 2025 scenario.
Figure 4.
Simulation results of hourly dispatch by type of technology (MW) in the SEN for the SEN 2025 scenario.
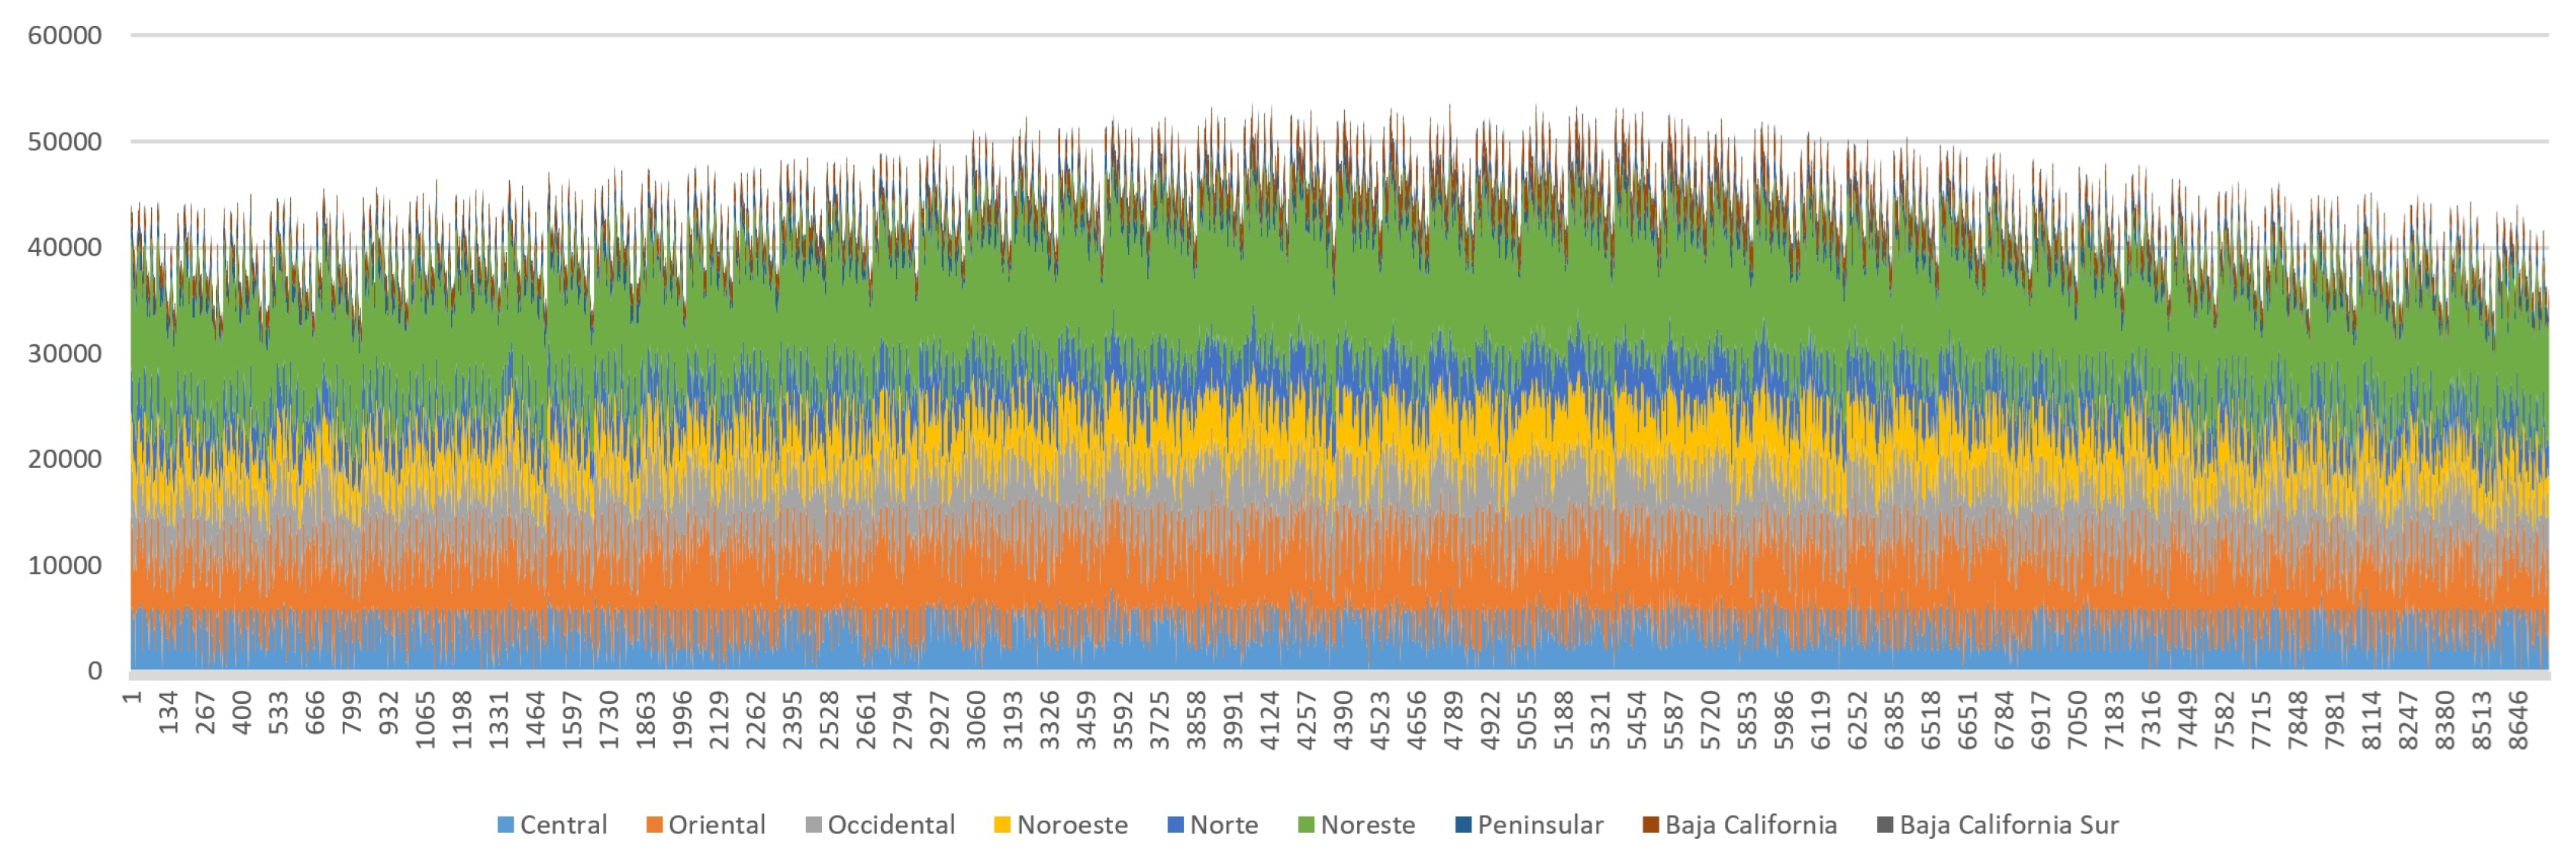
Figure 5.
Transmitted power (MW) for each transmission line for the SEN 2025 scenario.
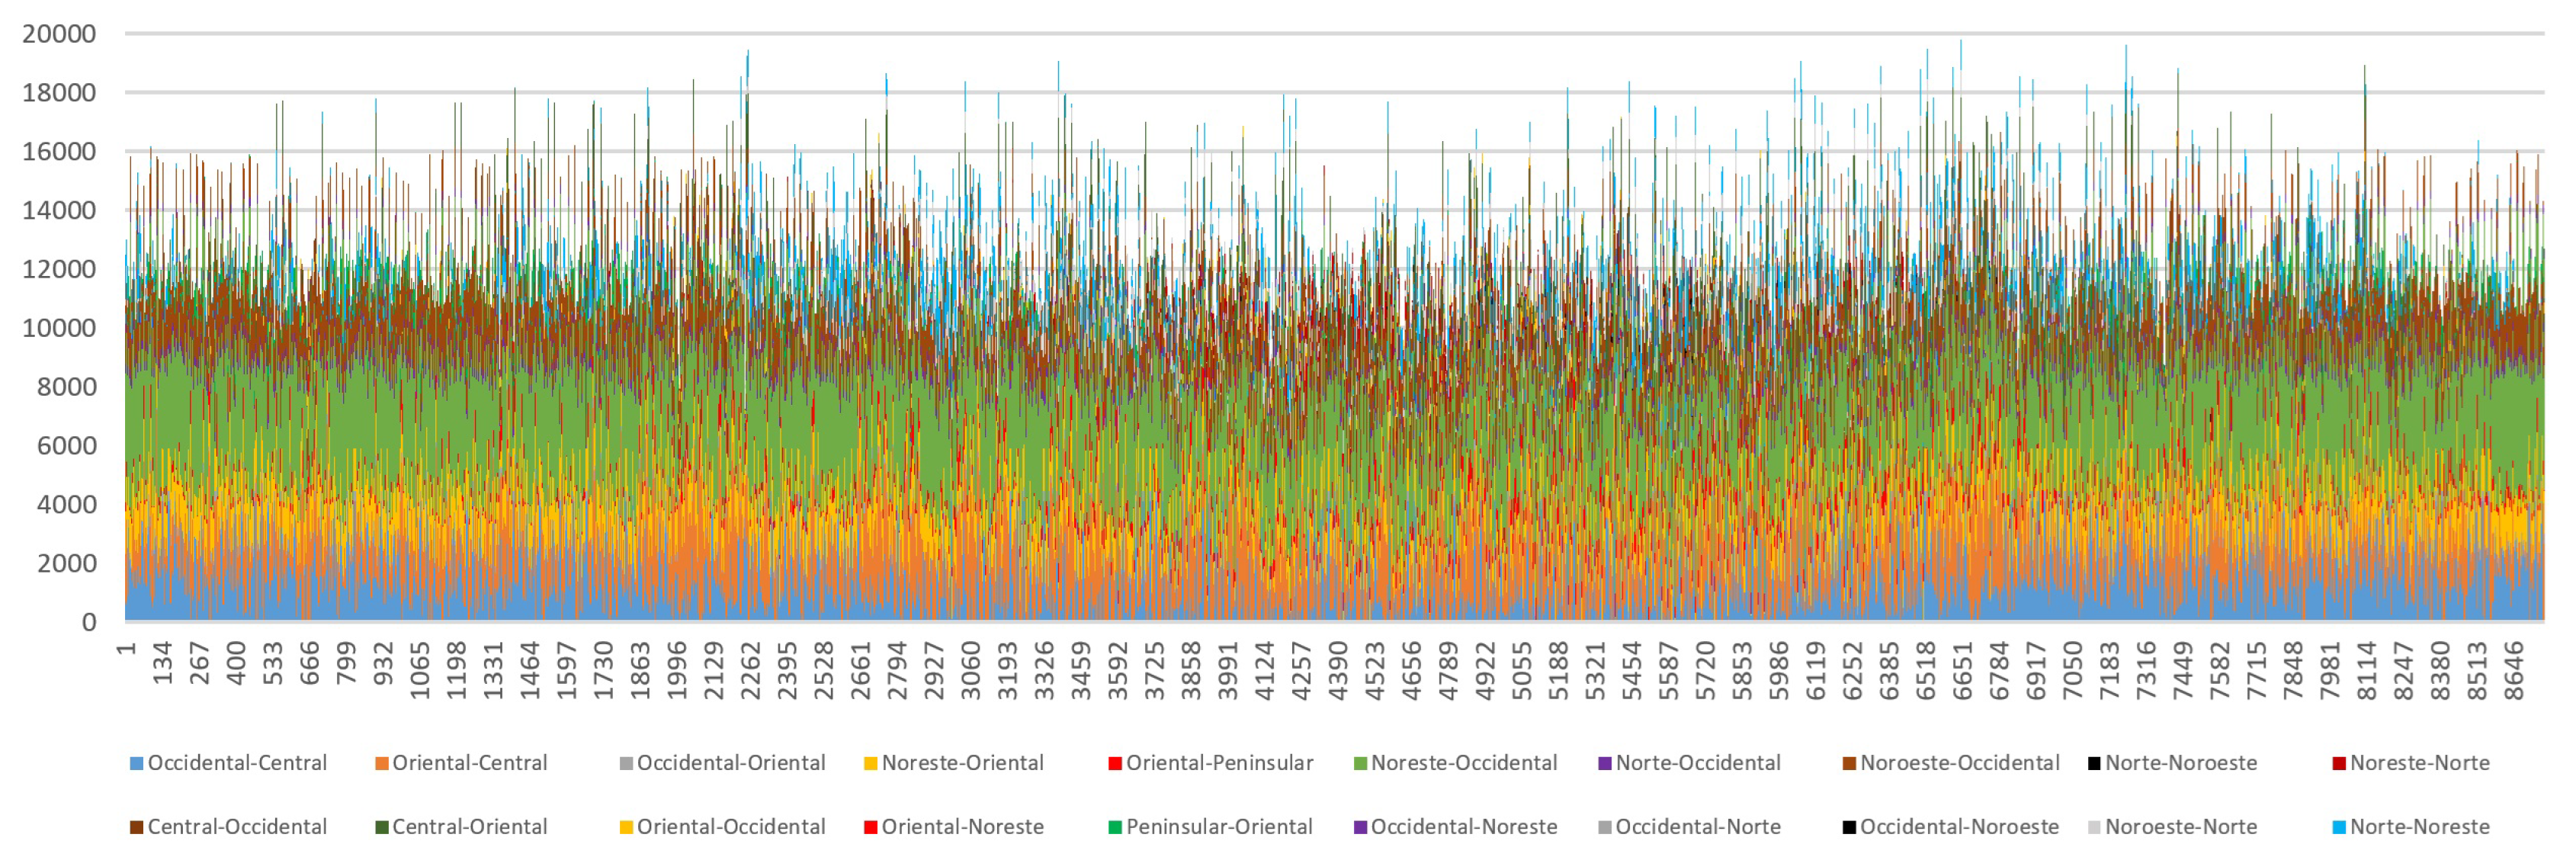
Figure 6.
Number of hours of congestion in the different transmission lines of the SEN 2025 scenario.
Figure 6.
Number of hours of congestion in the different transmission lines of the SEN 2025 scenario.
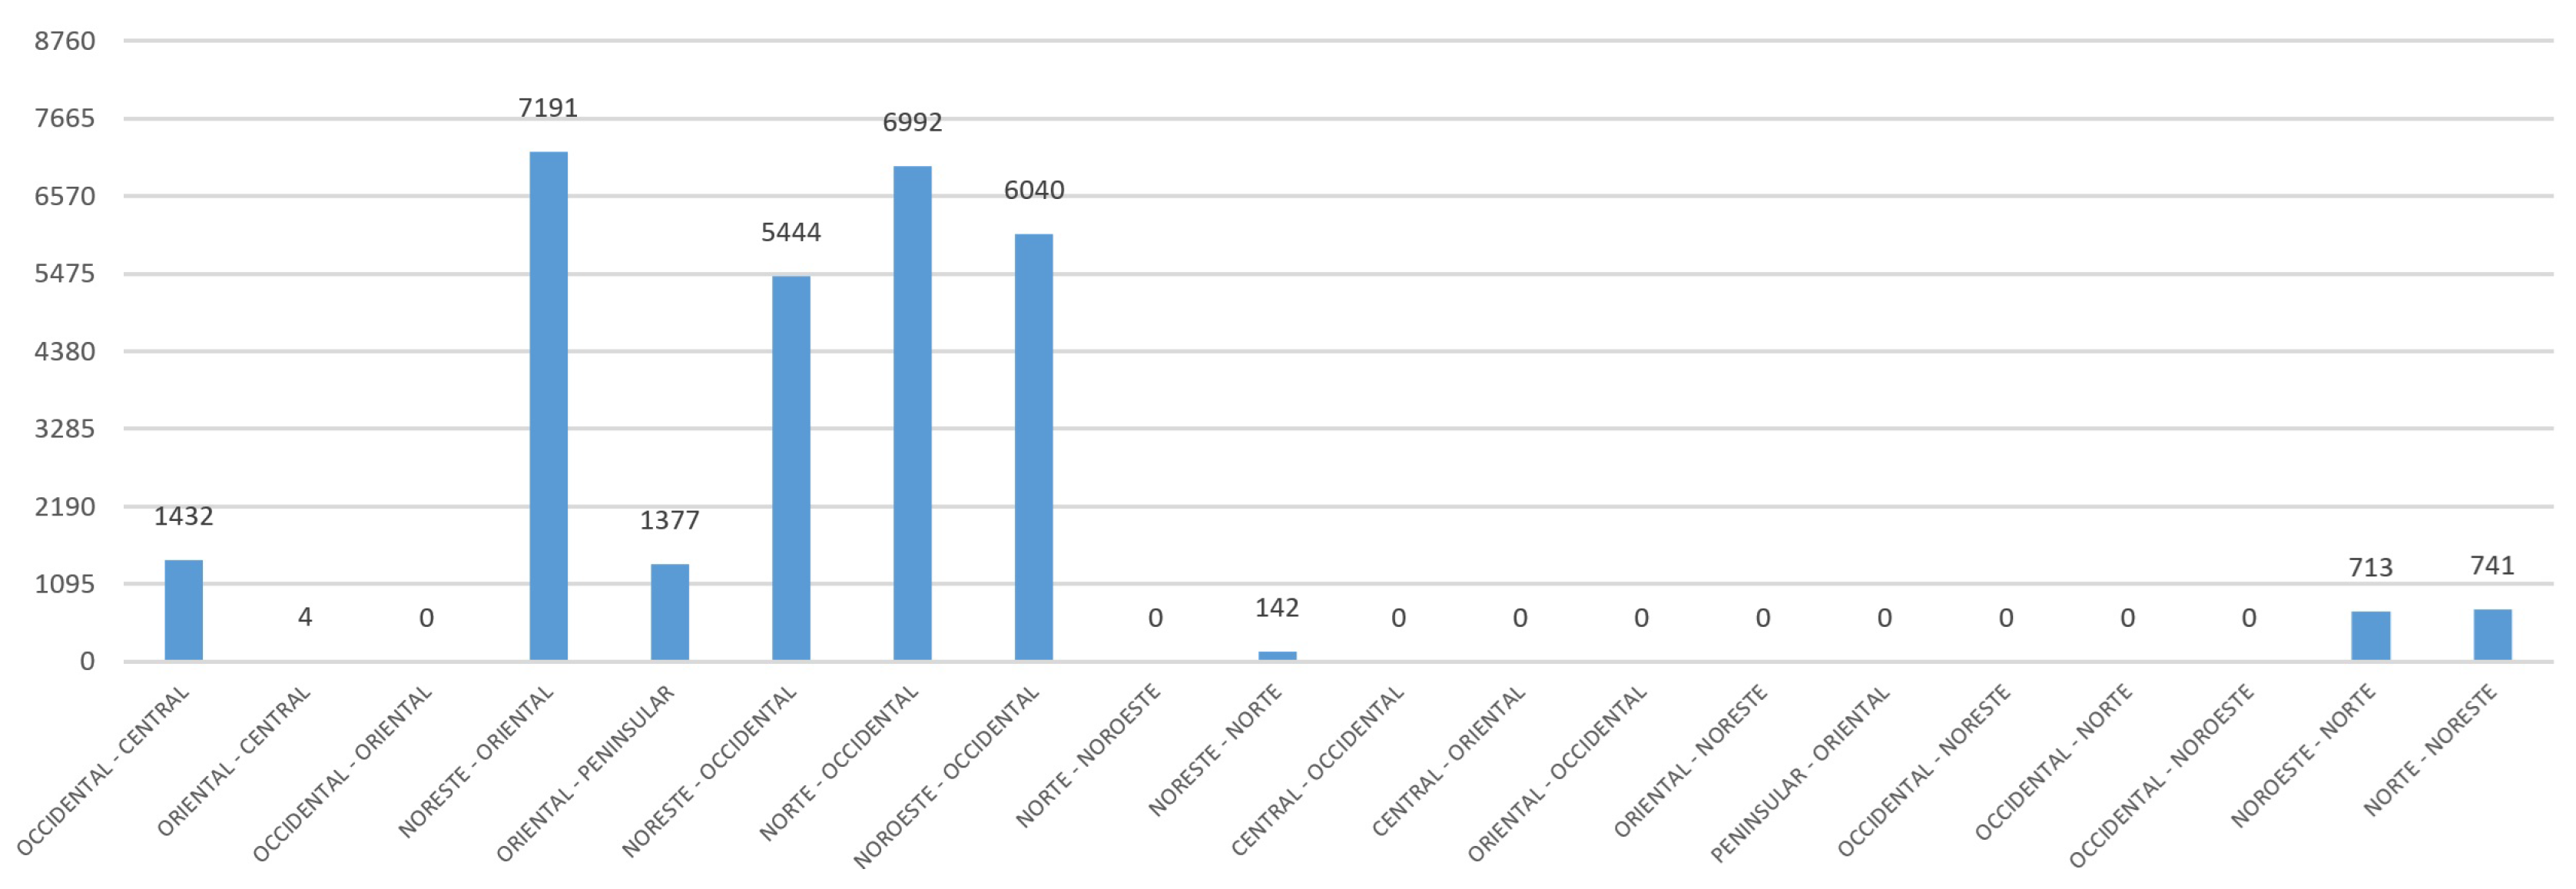
Figure 7.
Power transmitted between the Noreste and Norte regions during the year for the SEN 2025 scenario.
Figure 7.
Power transmitted between the Noreste and Norte regions during the year for the SEN 2025 scenario.
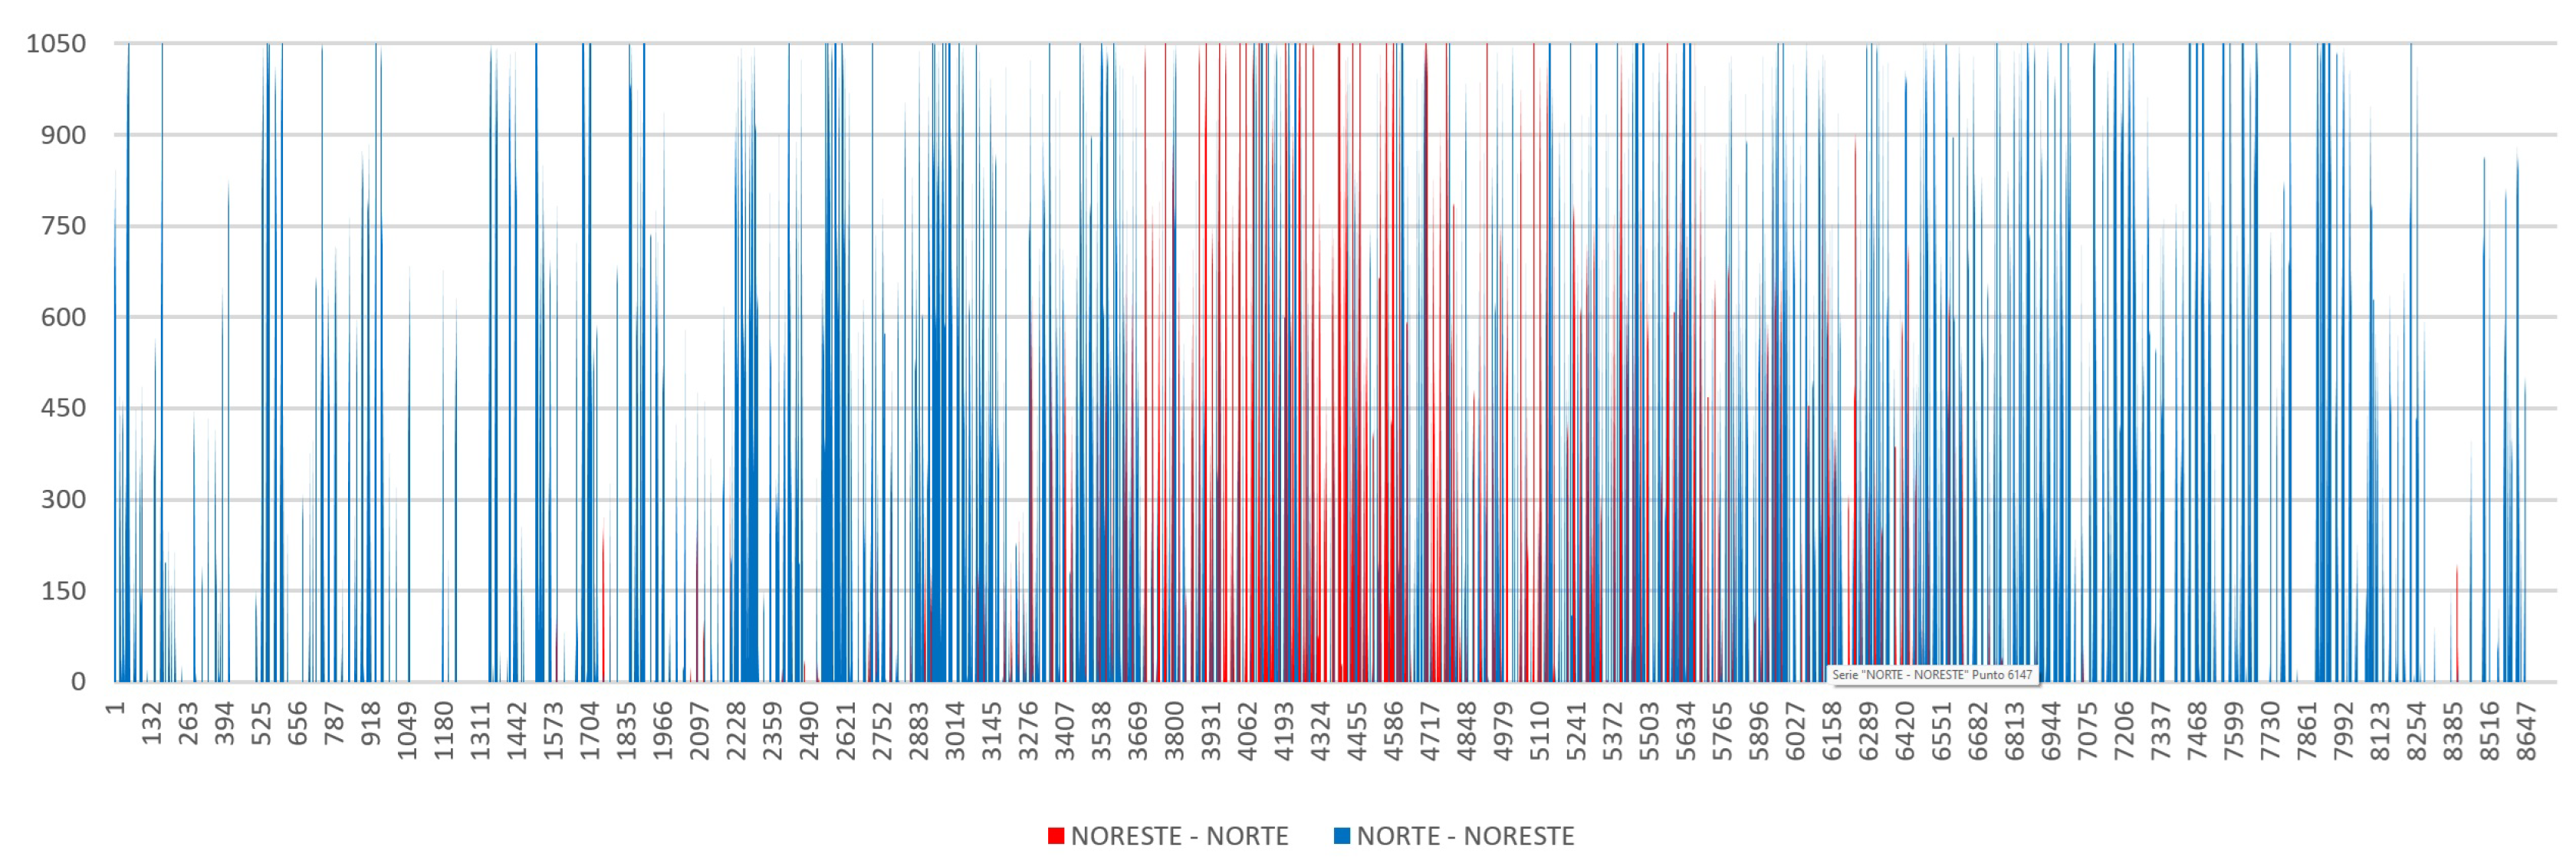
Figure 8.
Hourly reservation margin (%) for the SEN 2025 scenario.
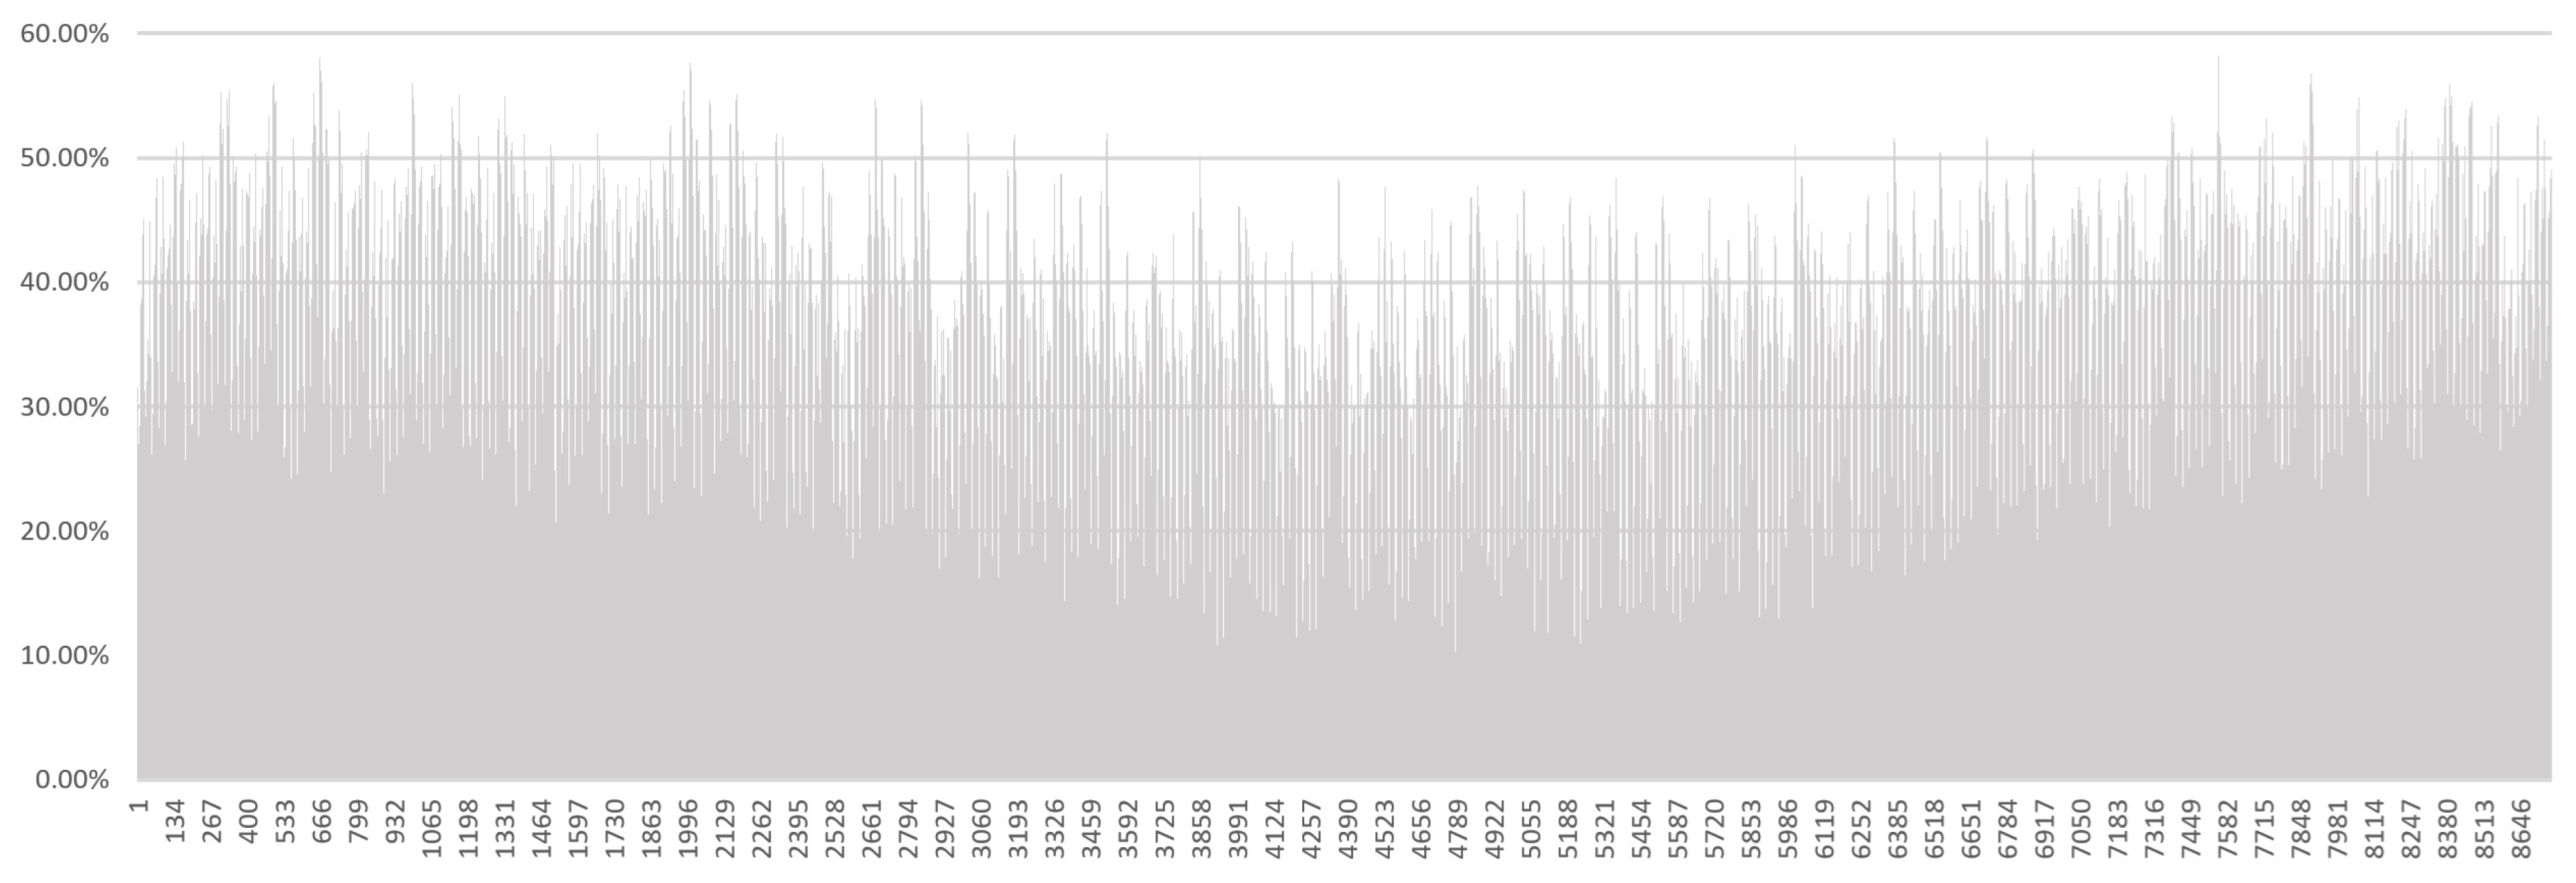
Figure 9.
Results of the simulation of hourly dispatch by technology (MW) in the SEN for week 29 of the SEN 2025 scenario.
Figure 9.
Results of the simulation of hourly dispatch by technology (MW) in the SEN for week 29 of the SEN 2025 scenario.
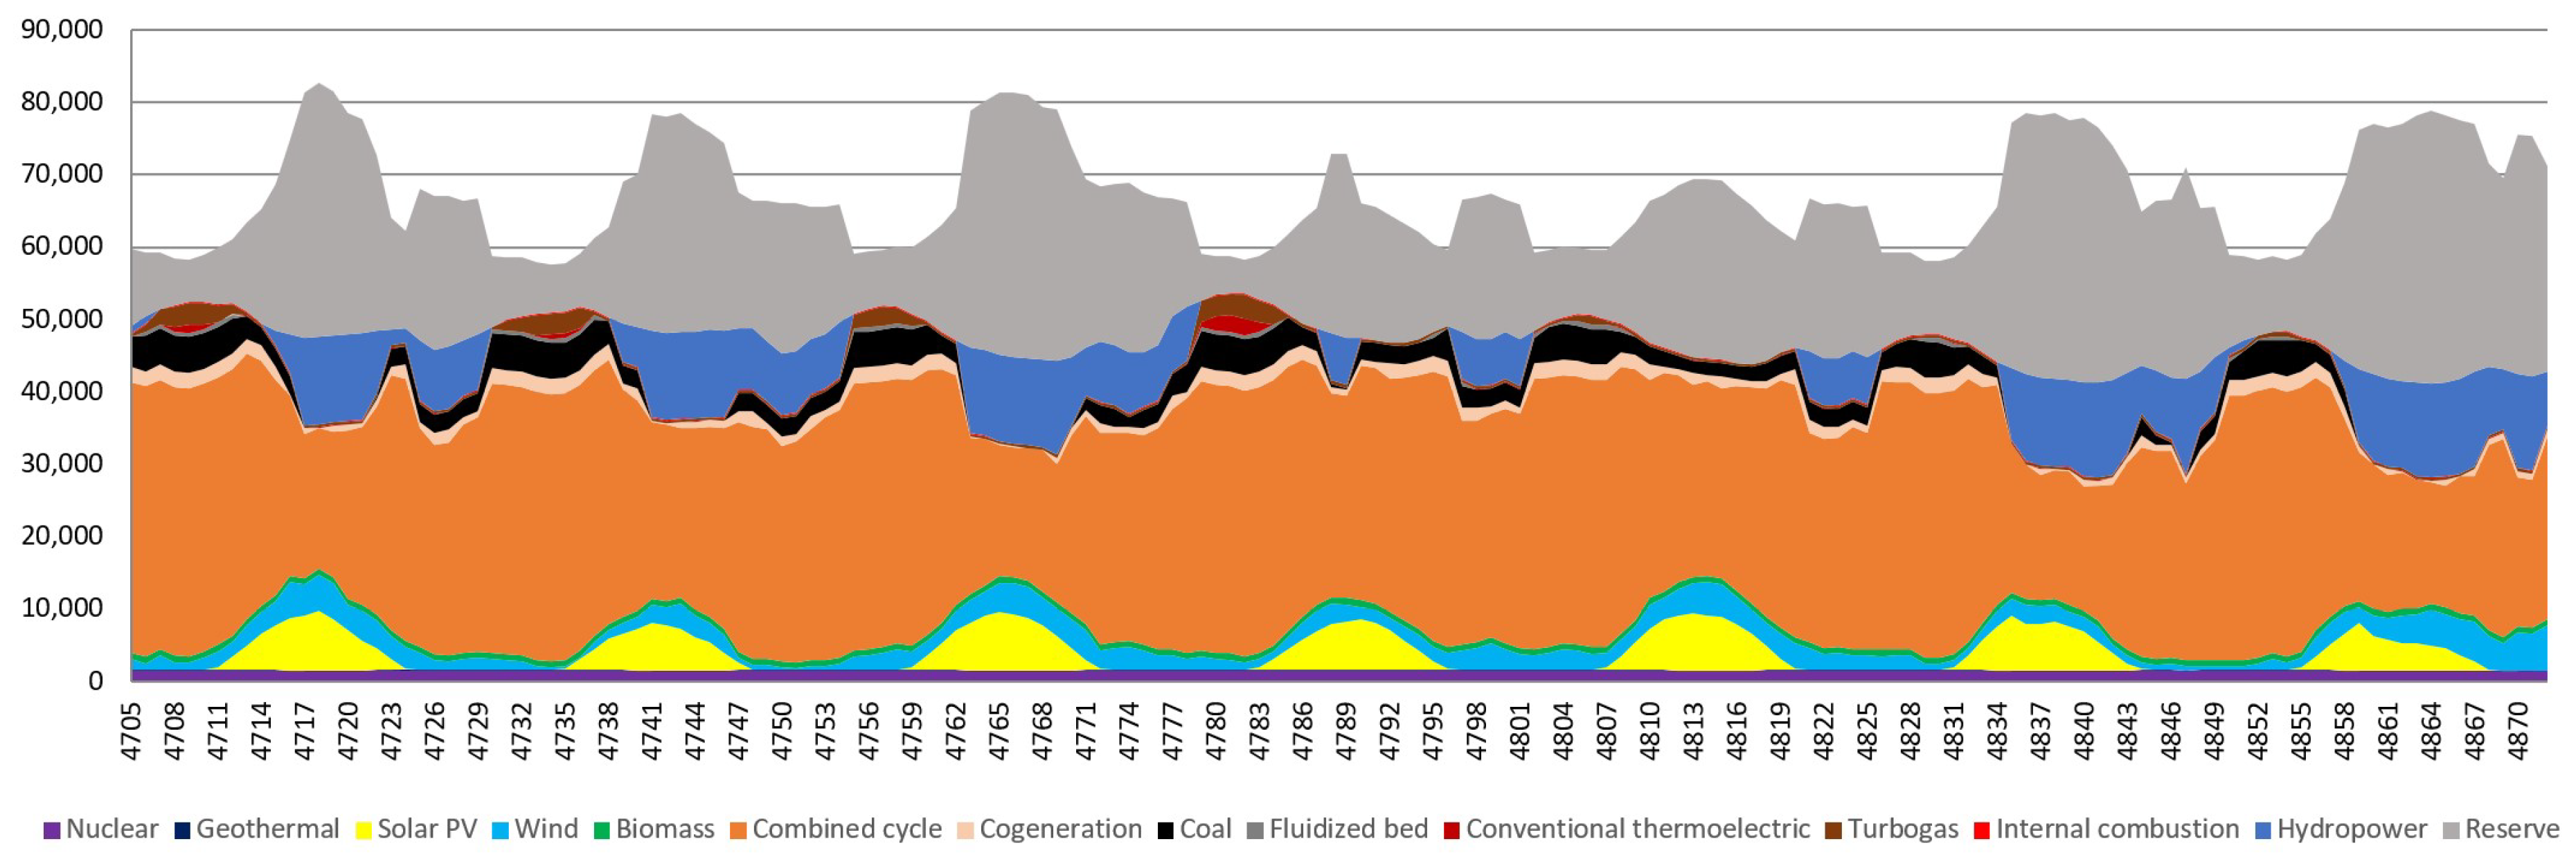
Figure 10.
Results of the simulation of hourly dispatch by type of technology (MW) in the SEN for the week 29 of the SEN 2025 scenario.
Figure 10.
Results of the simulation of hourly dispatch by type of technology (MW) in the SEN for the week 29 of the SEN 2025 scenario.
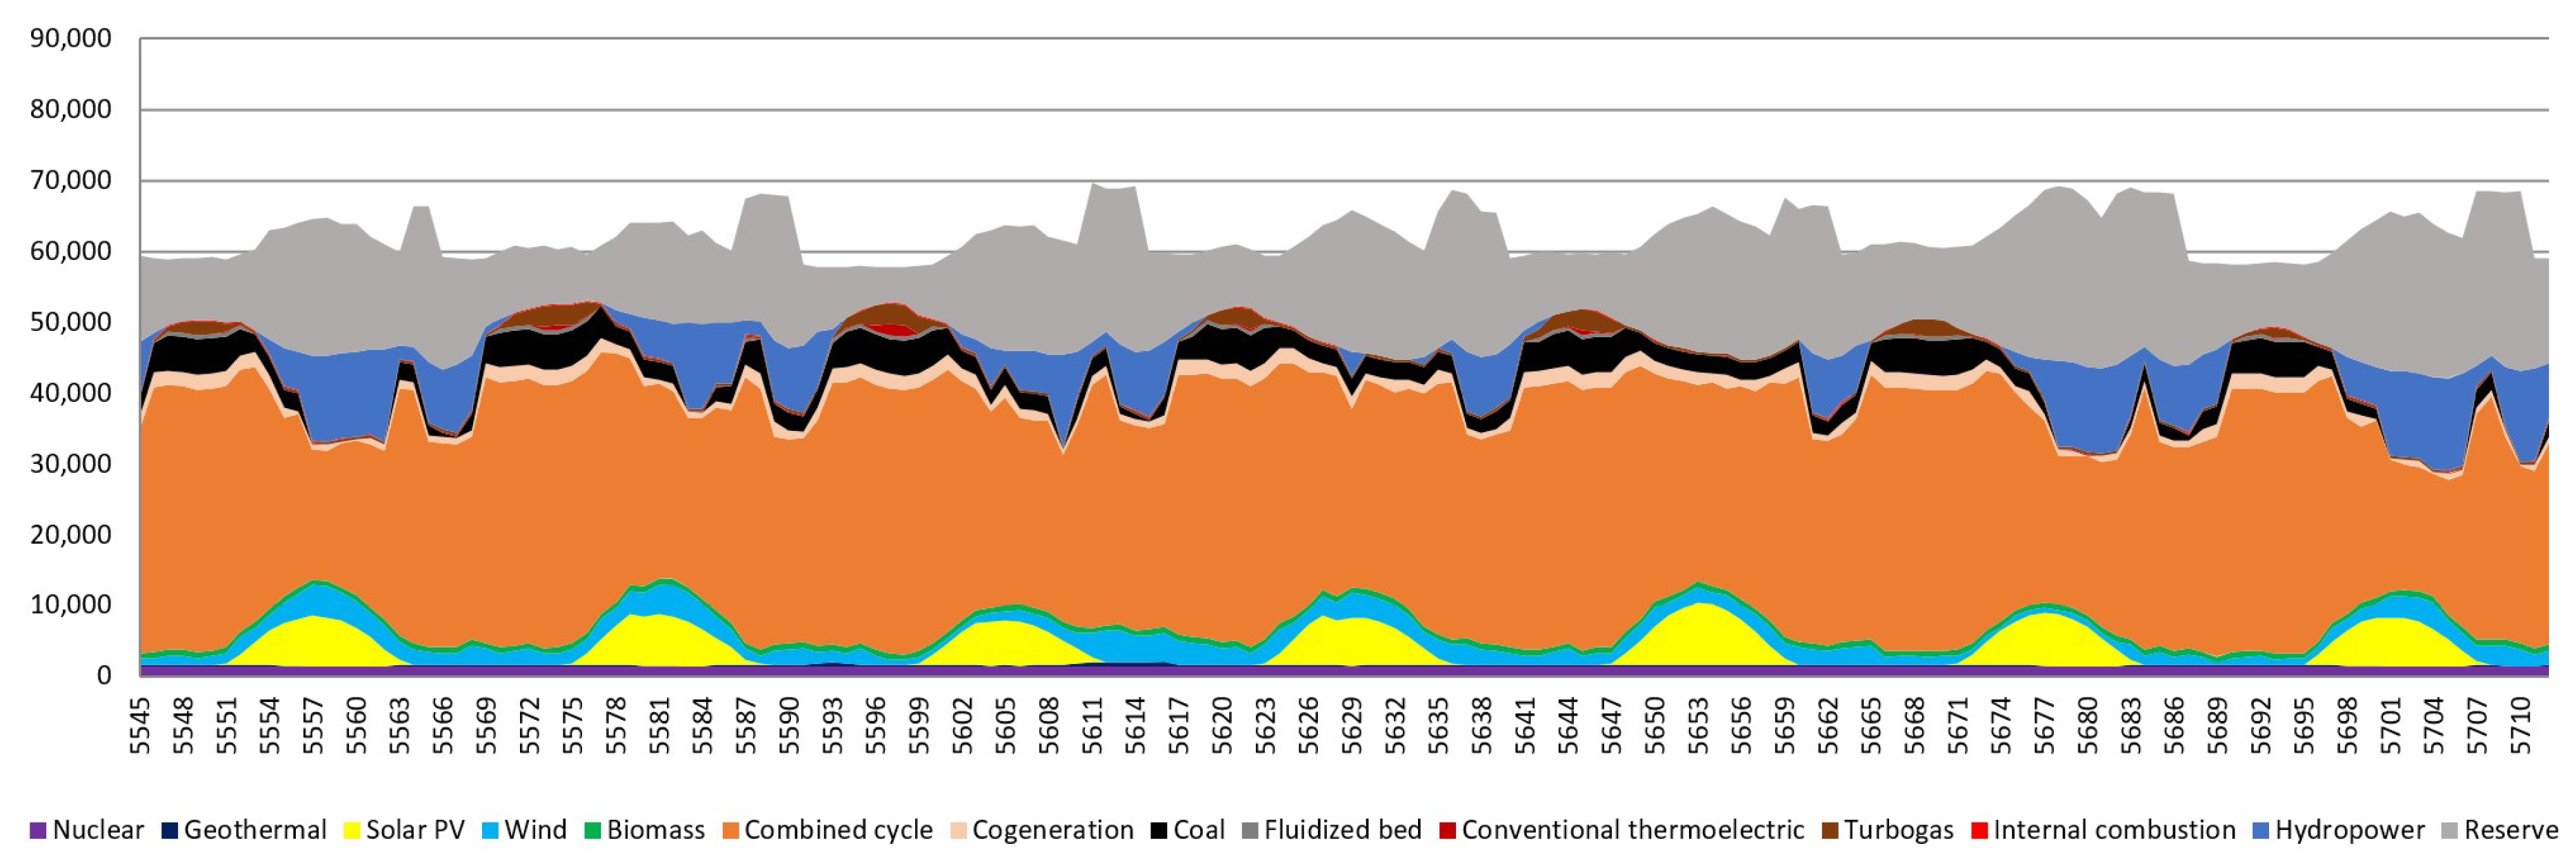
Figure 11.
Hourly emissions generated by region (TonCO2eq) in the SEN 2025 scenario.
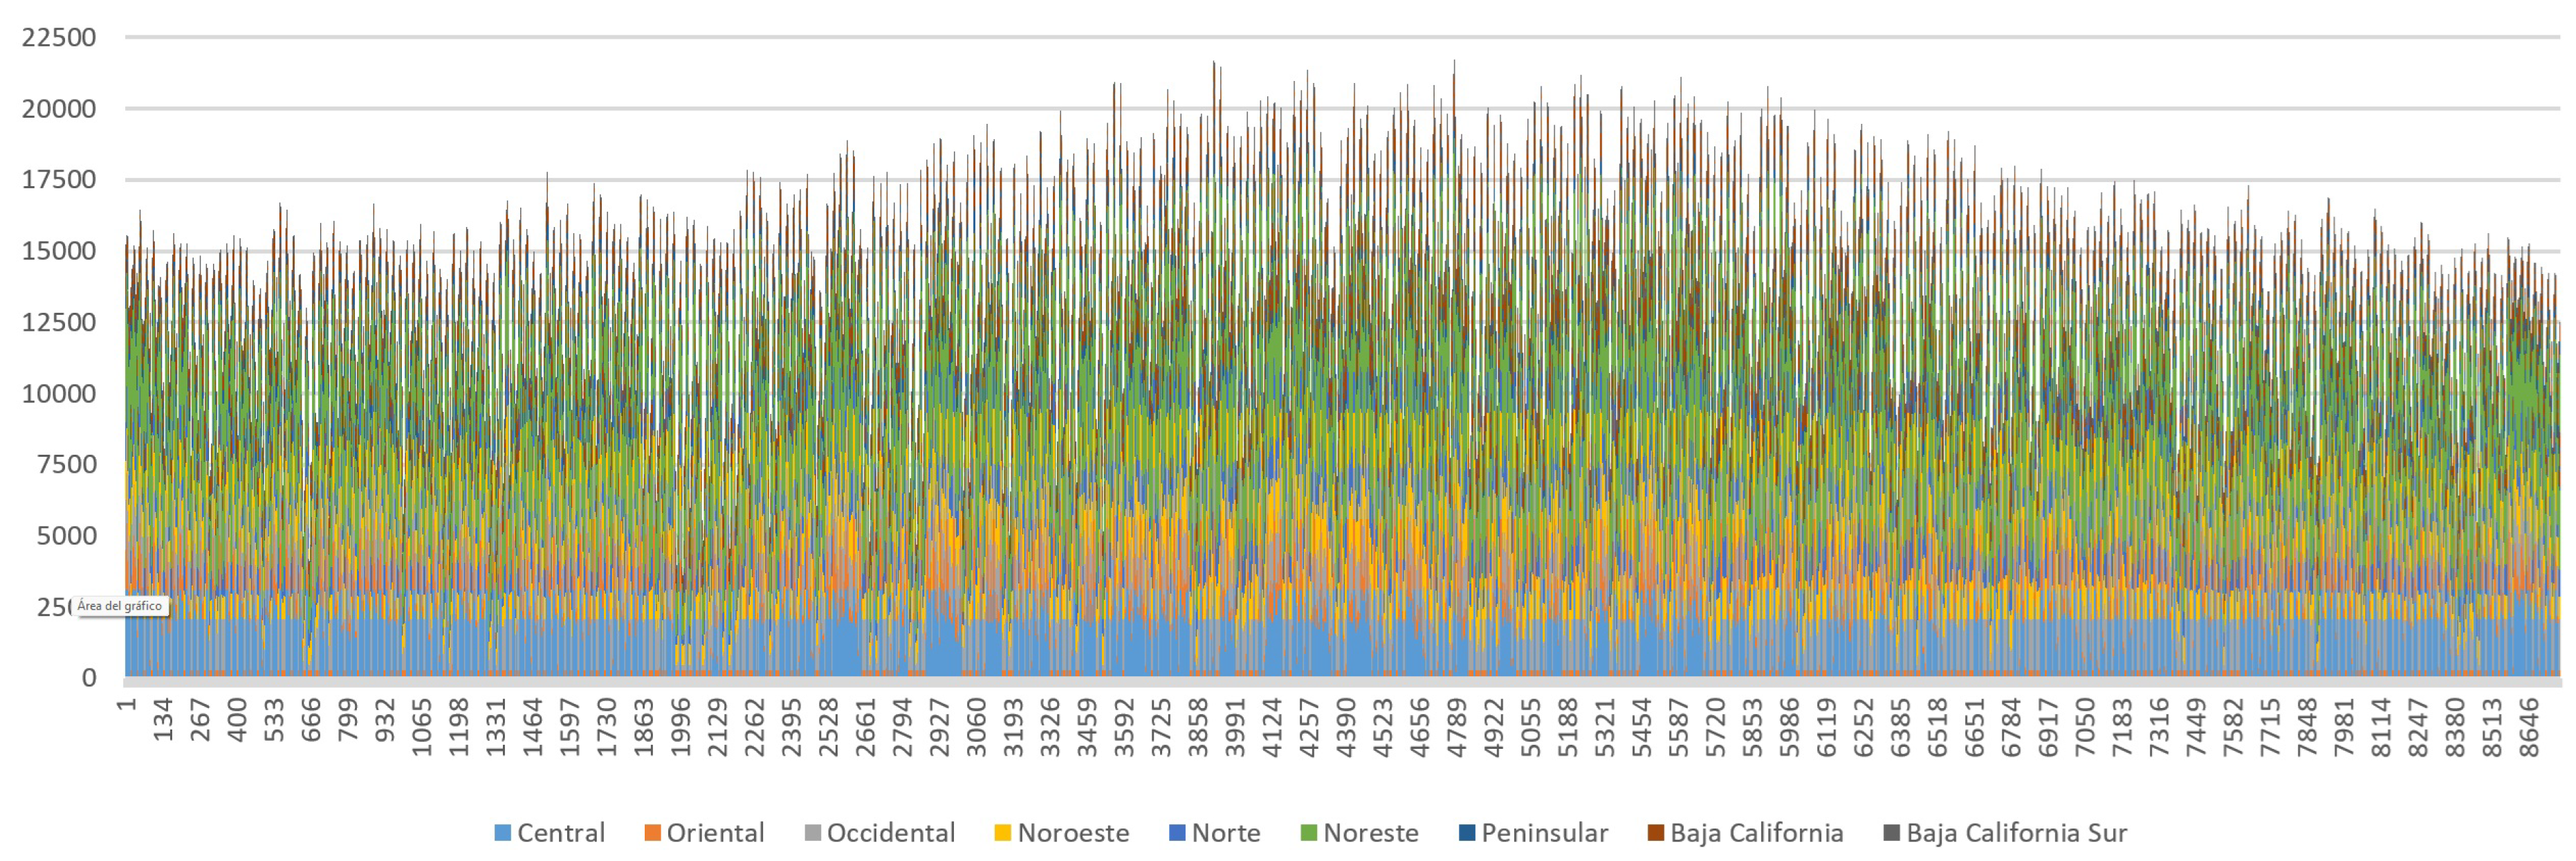
Figure 12.
Regional contribution to the average hourly emission factor (%) in the SEN 2025 scenario.
Figure 12.
Regional contribution to the average hourly emission factor (%) in the SEN 2025 scenario.
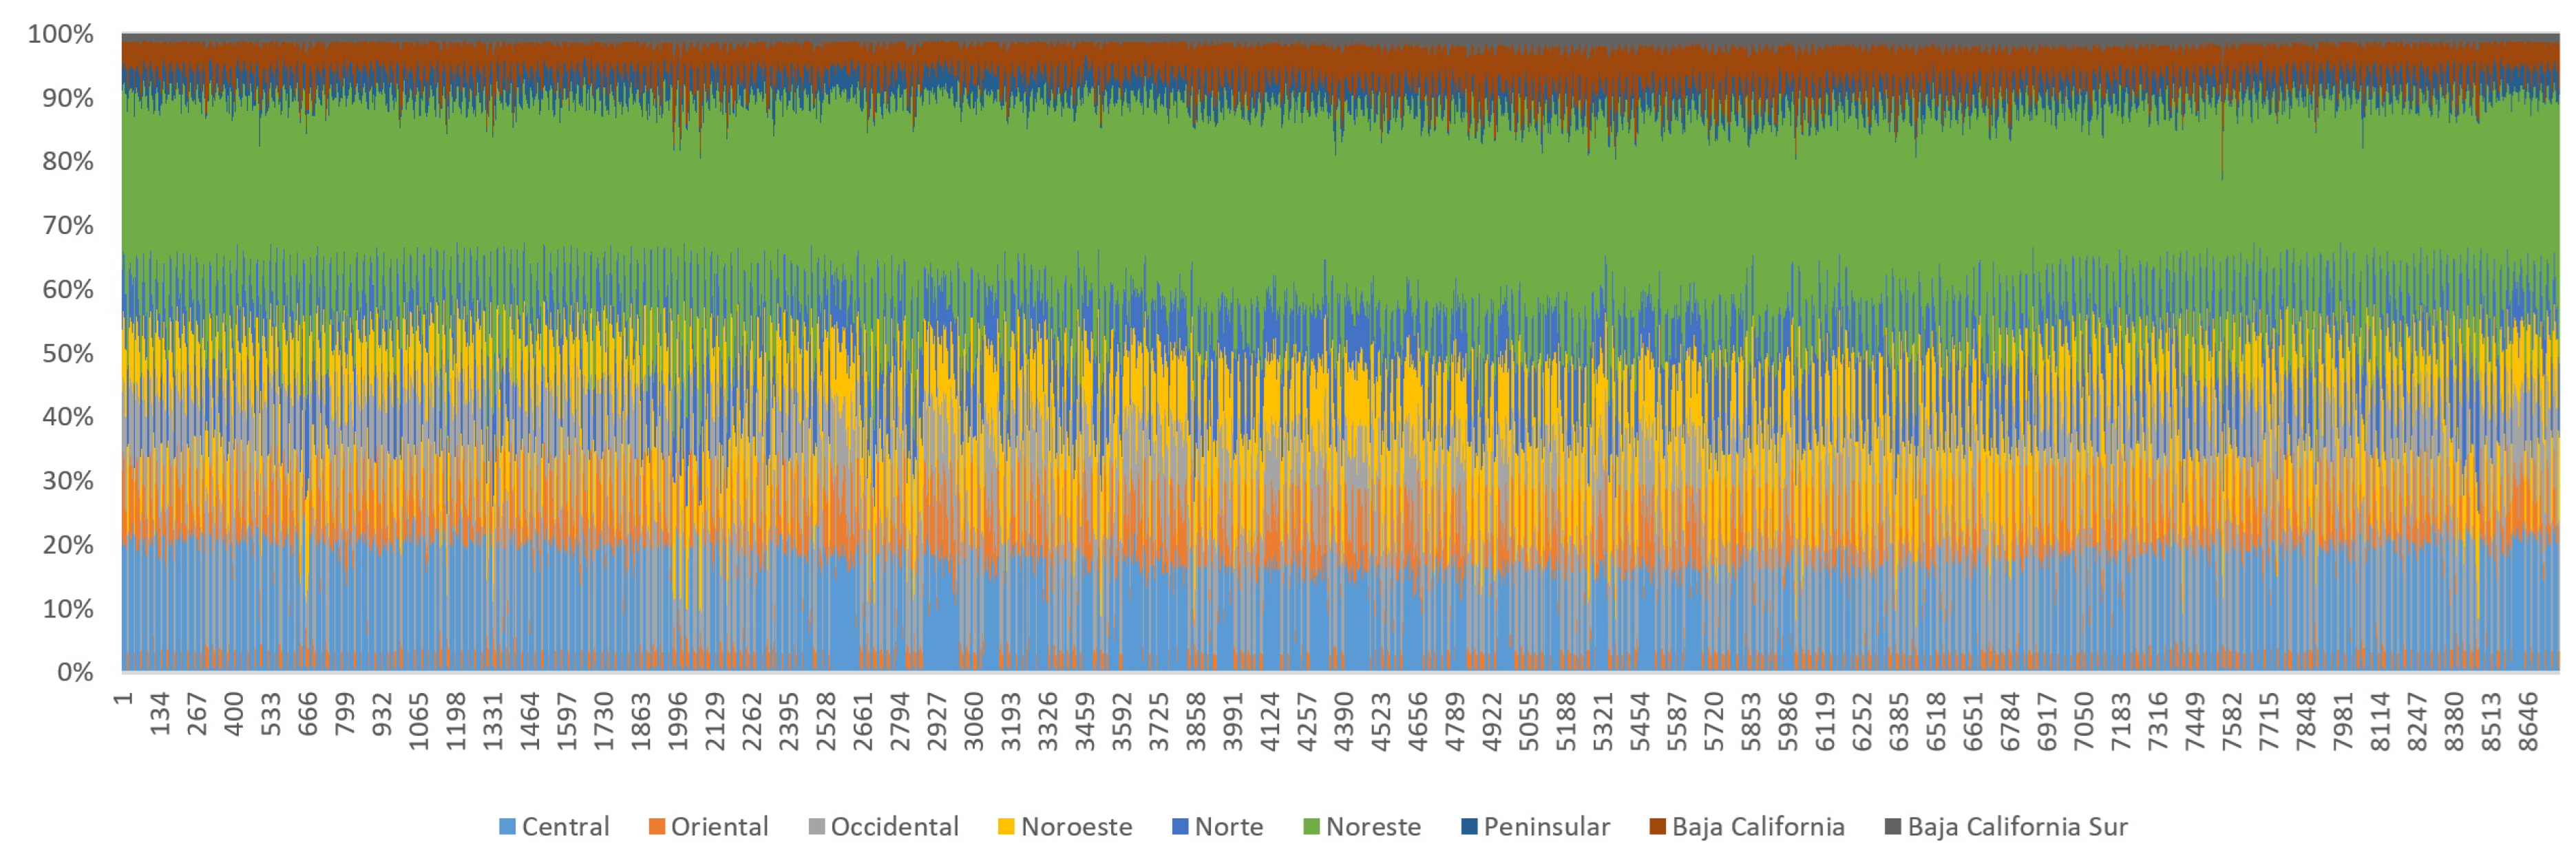
Figure 13.
% of hourly emissions produced by region (TonCO2eq) during week 32 in the SEN 2025 scenario.
Figure 13.
% of hourly emissions produced by region (TonCO2eq) during week 32 in the SEN 2025 scenario.
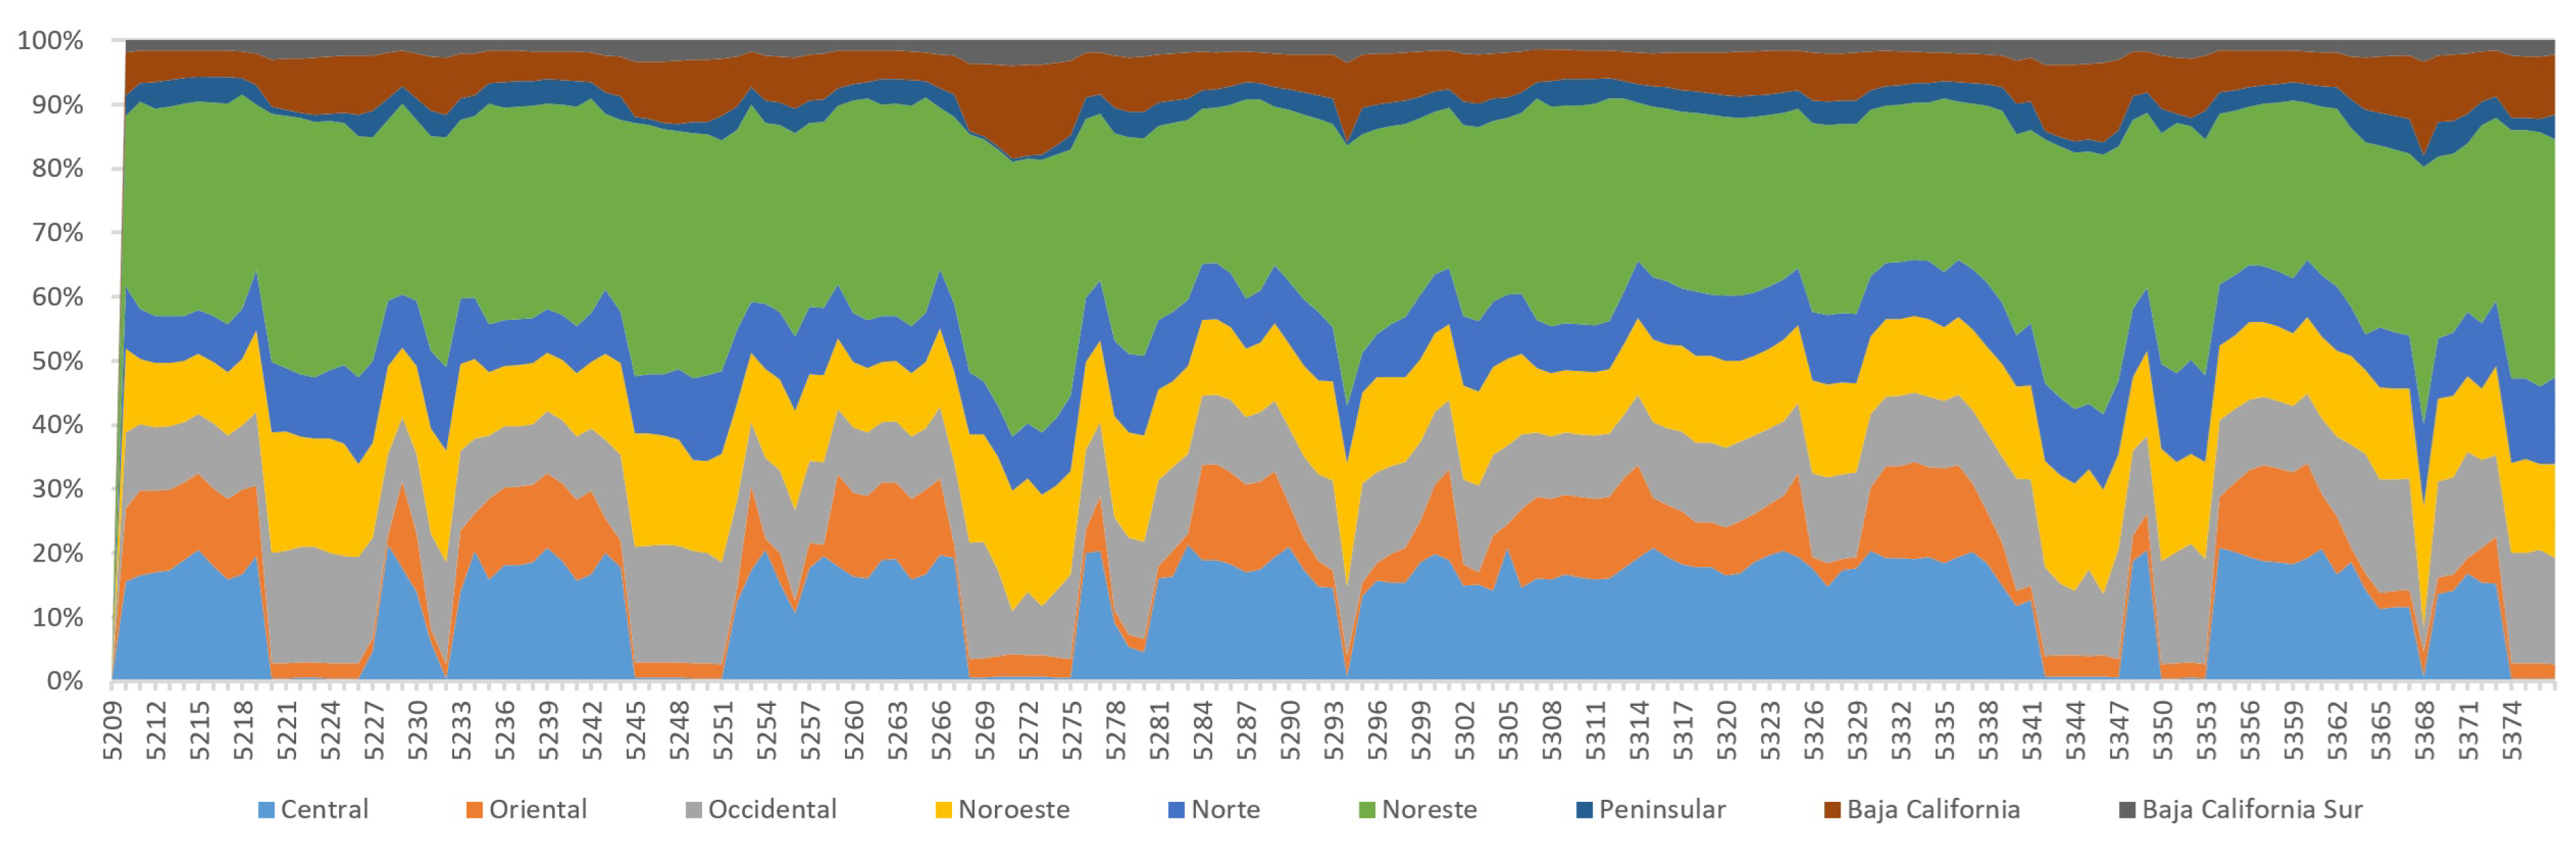
Figure 14.
% regional contribution to the average hourly emission factor (%) during week 32 in the SEN 2025 scenario.
Figure 14.
% regional contribution to the average hourly emission factor (%) during week 32 in the SEN 2025 scenario.
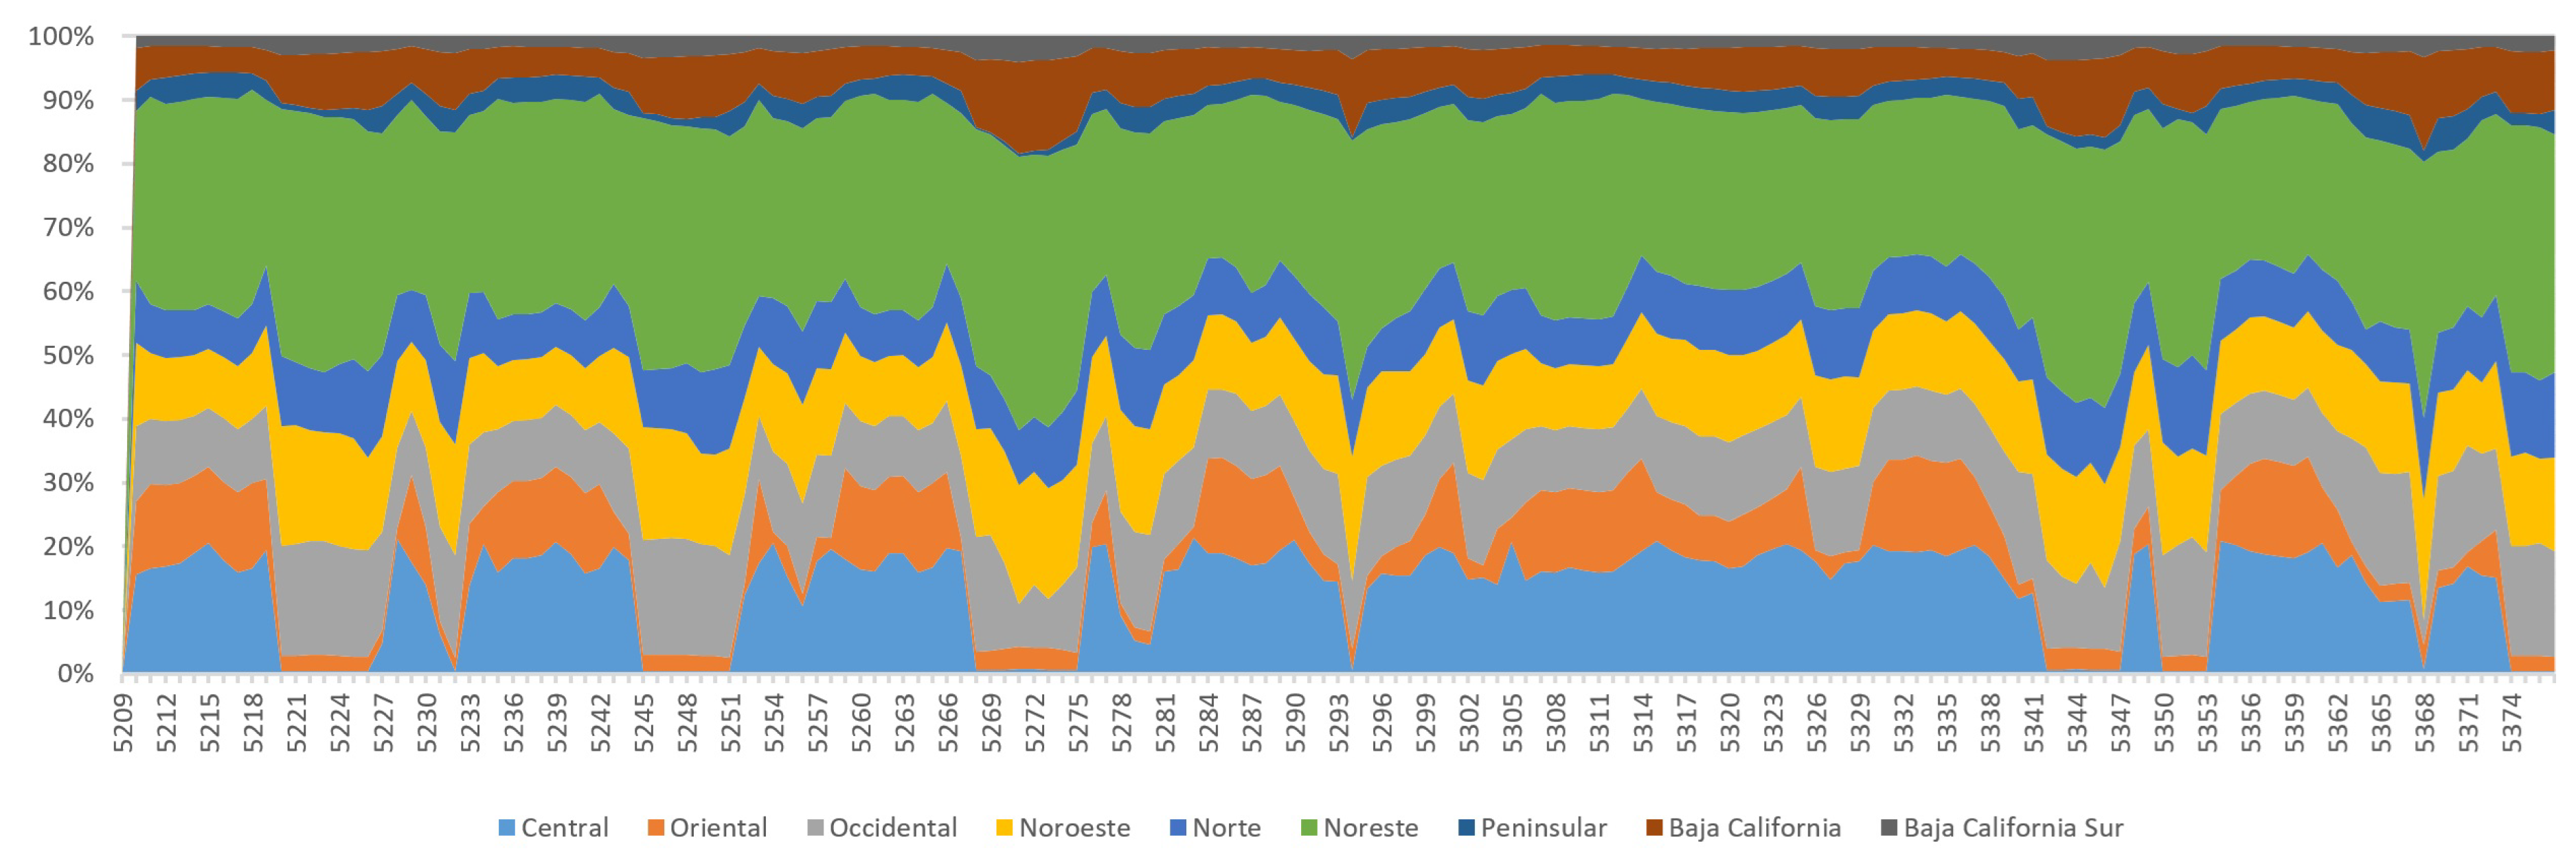
Figure 15.
The capacity factor of thermoelectric, combined cycle, and coal-fired technologies in the SEN 2025 scenario.
Figure 15.
The capacity factor of thermoelectric, combined cycle, and coal-fired technologies in the SEN 2025 scenario.
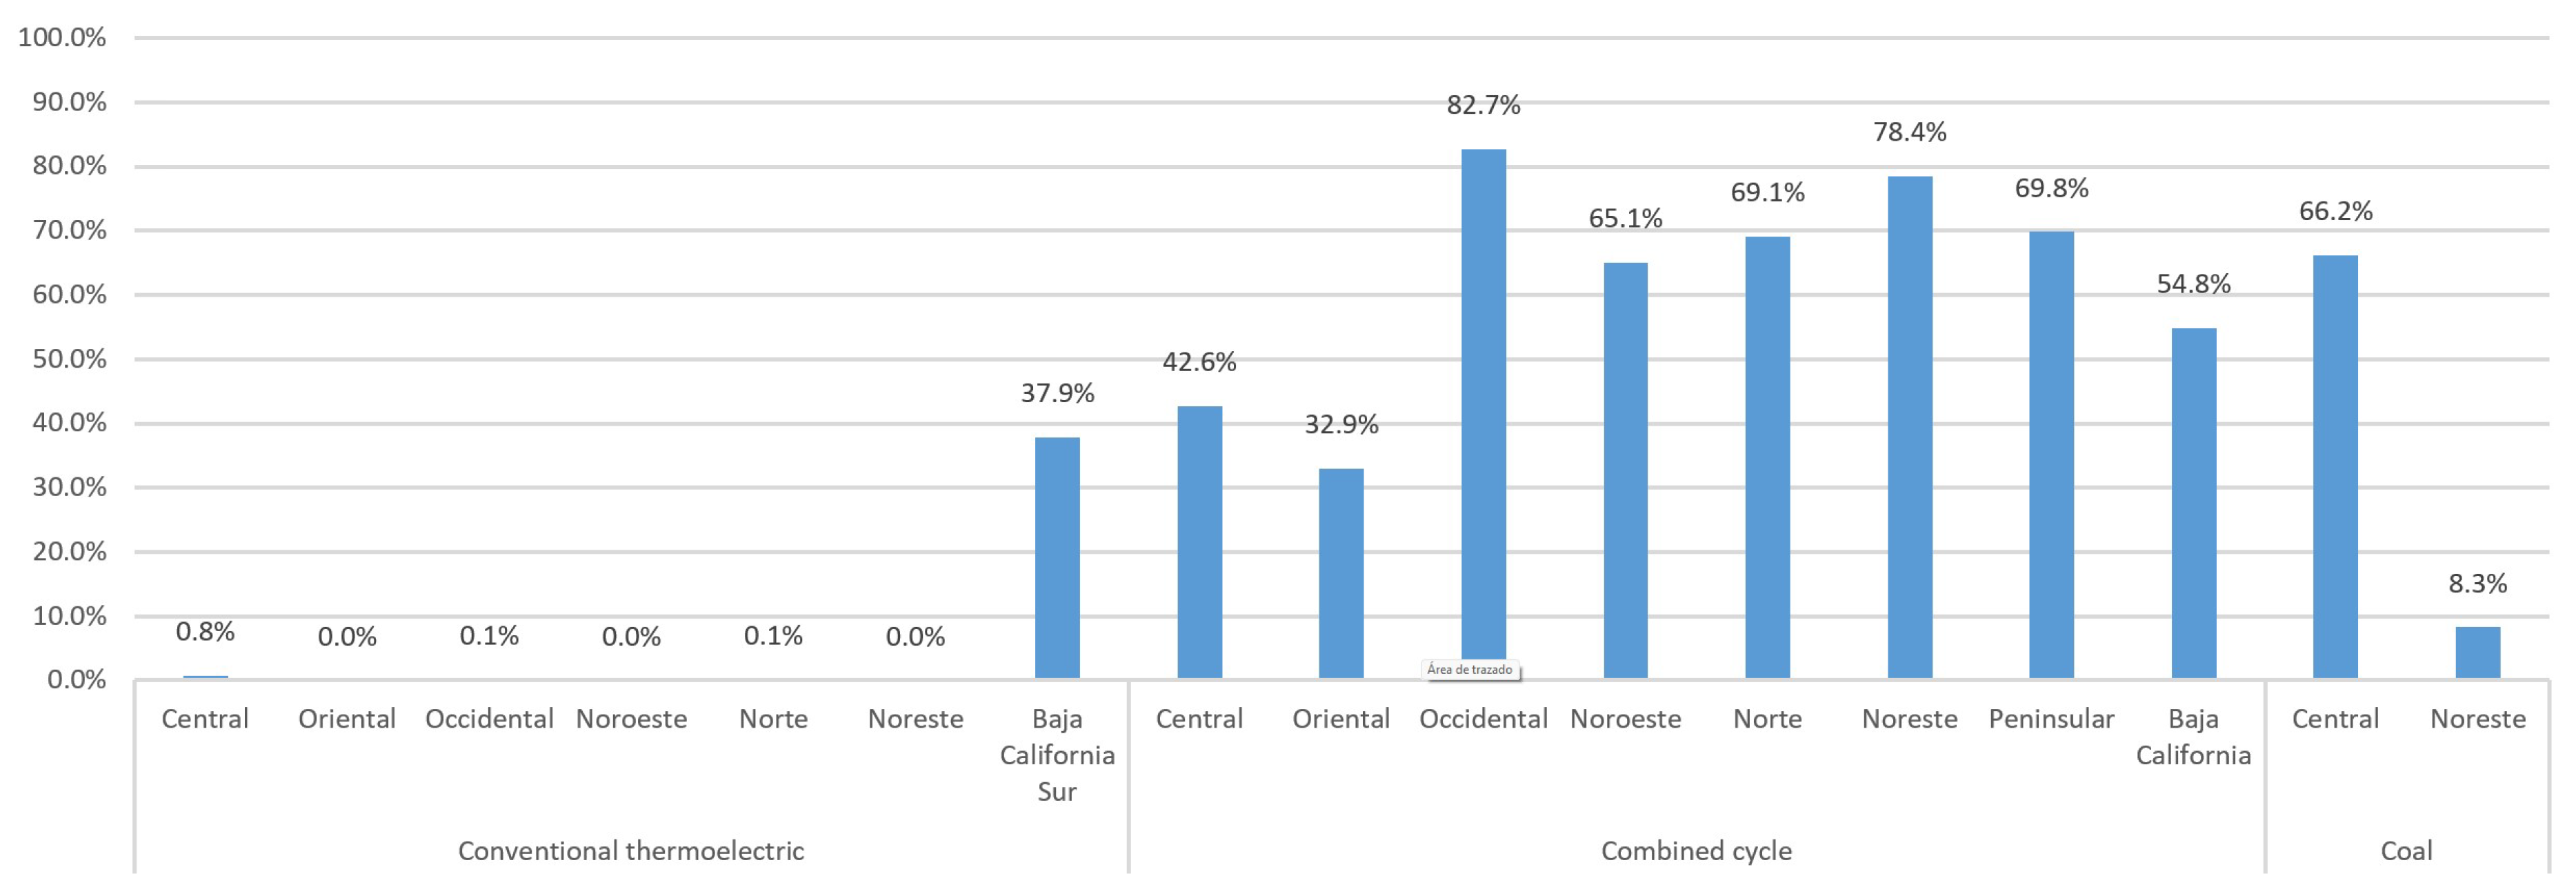
Figure 16.
Capacity factor of turbogas, internal combustion, and fluidized bed technologies in the SEN 2025 scenario.
Figure 16.
Capacity factor of turbogas, internal combustion, and fluidized bed technologies in the SEN 2025 scenario.
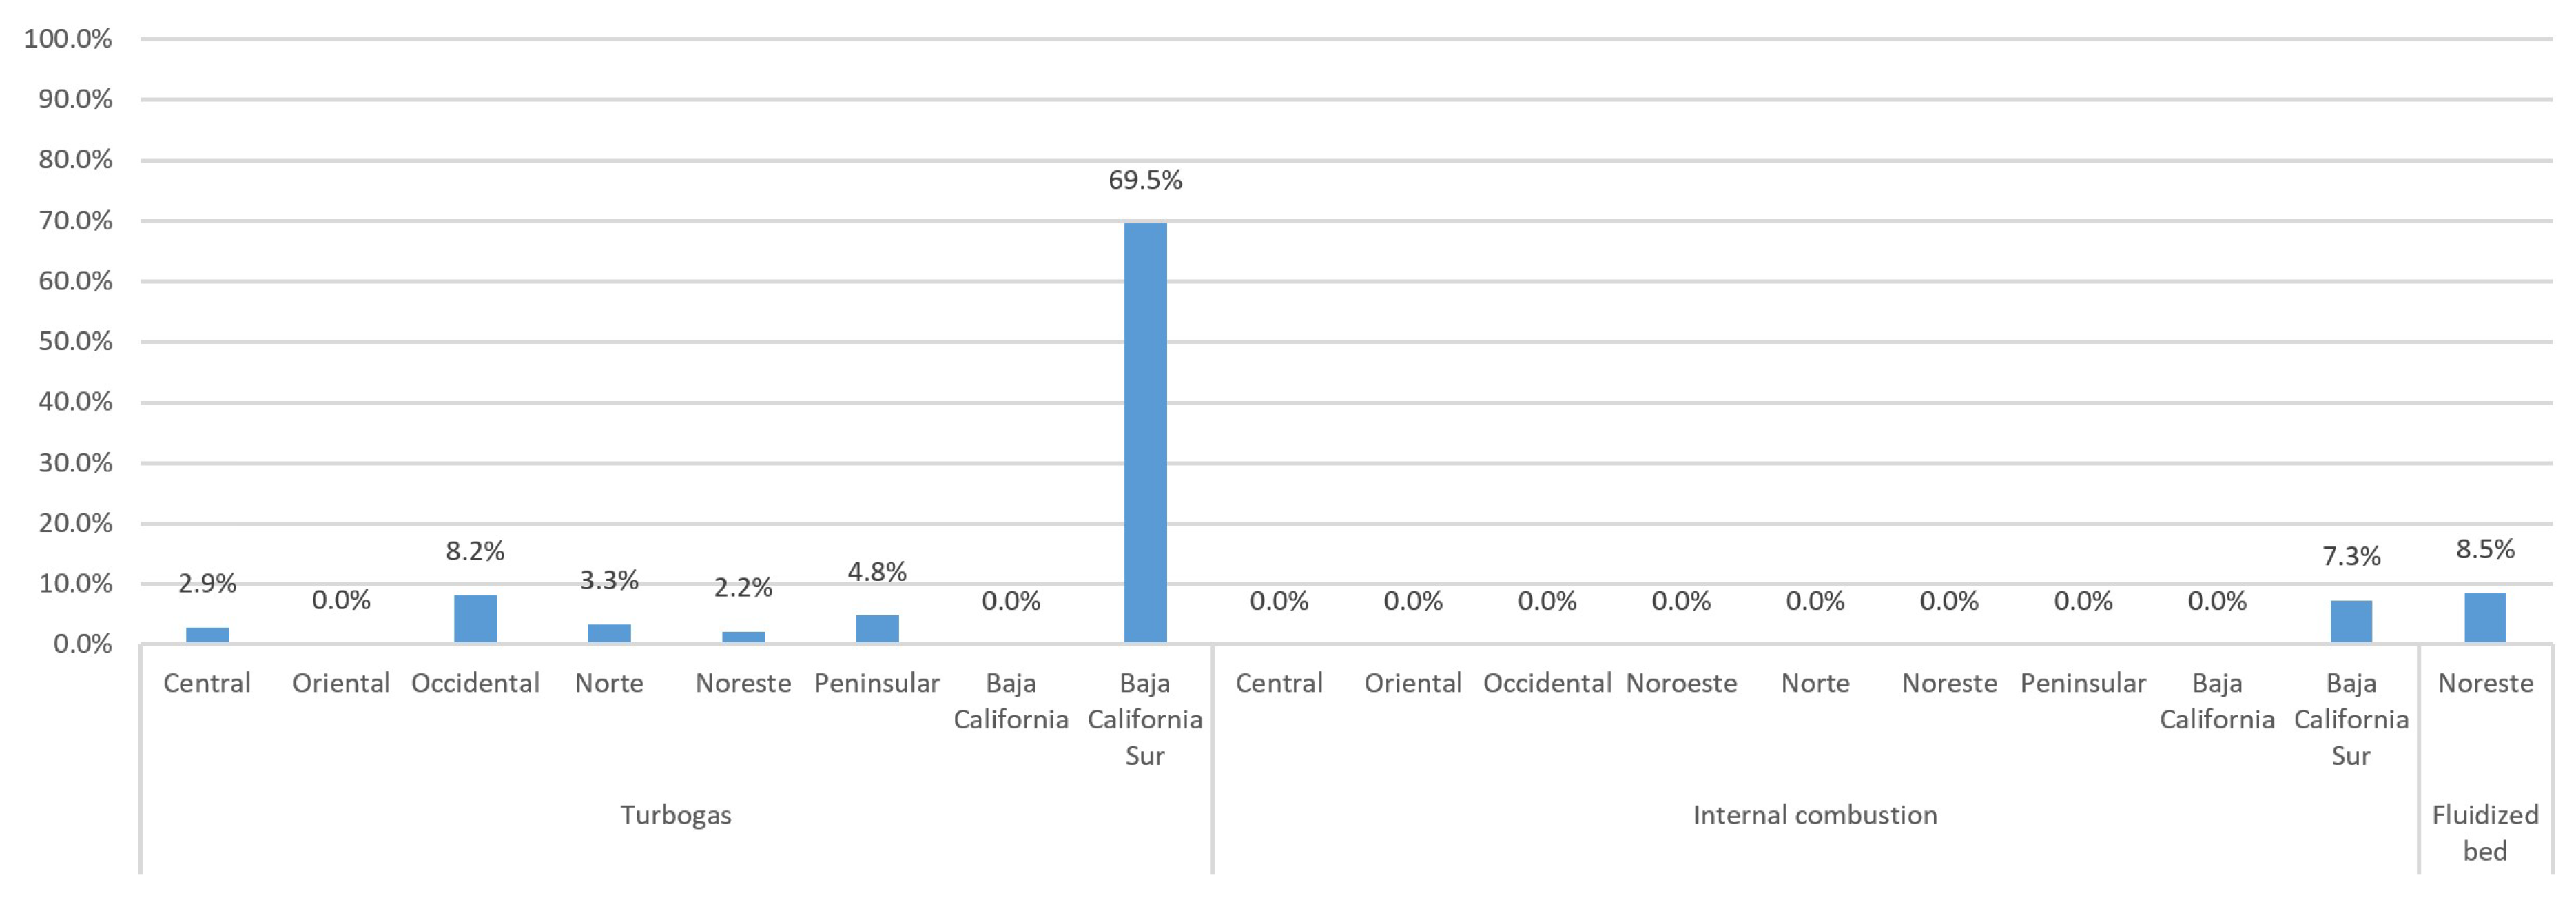
Figure 17.
Capacity factor of hydroelectric, wind, and geothermal technologies in the SEN 2025 scenario.
Figure 17.
Capacity factor of hydroelectric, wind, and geothermal technologies in the SEN 2025 scenario.
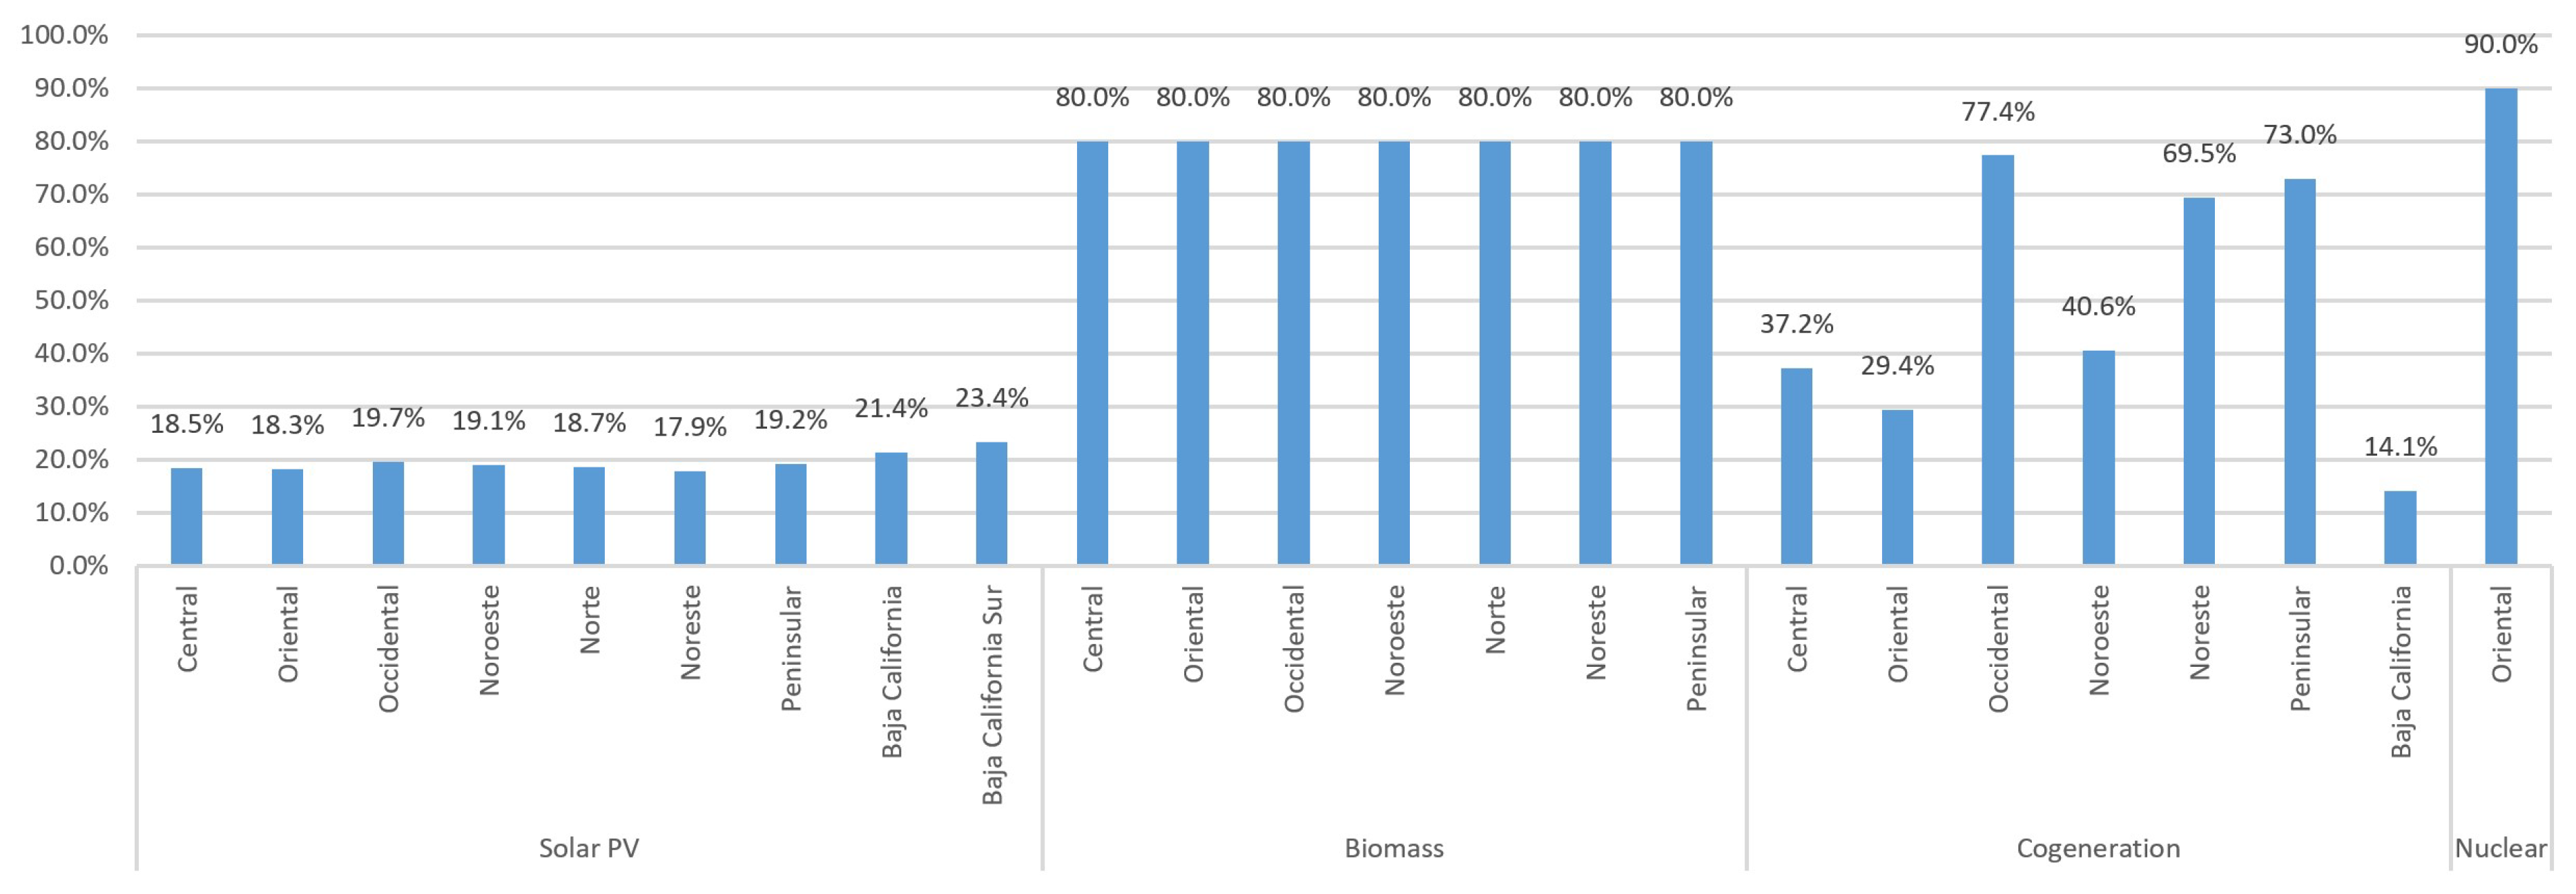
Figure 18.
Capacity factor of solar, bioenergy, cogeneration, and nuclear power technologies in the SEN 2025 scenario.
Figure 18.
Capacity factor of solar, bioenergy, cogeneration, and nuclear power technologies in the SEN 2025 scenario.
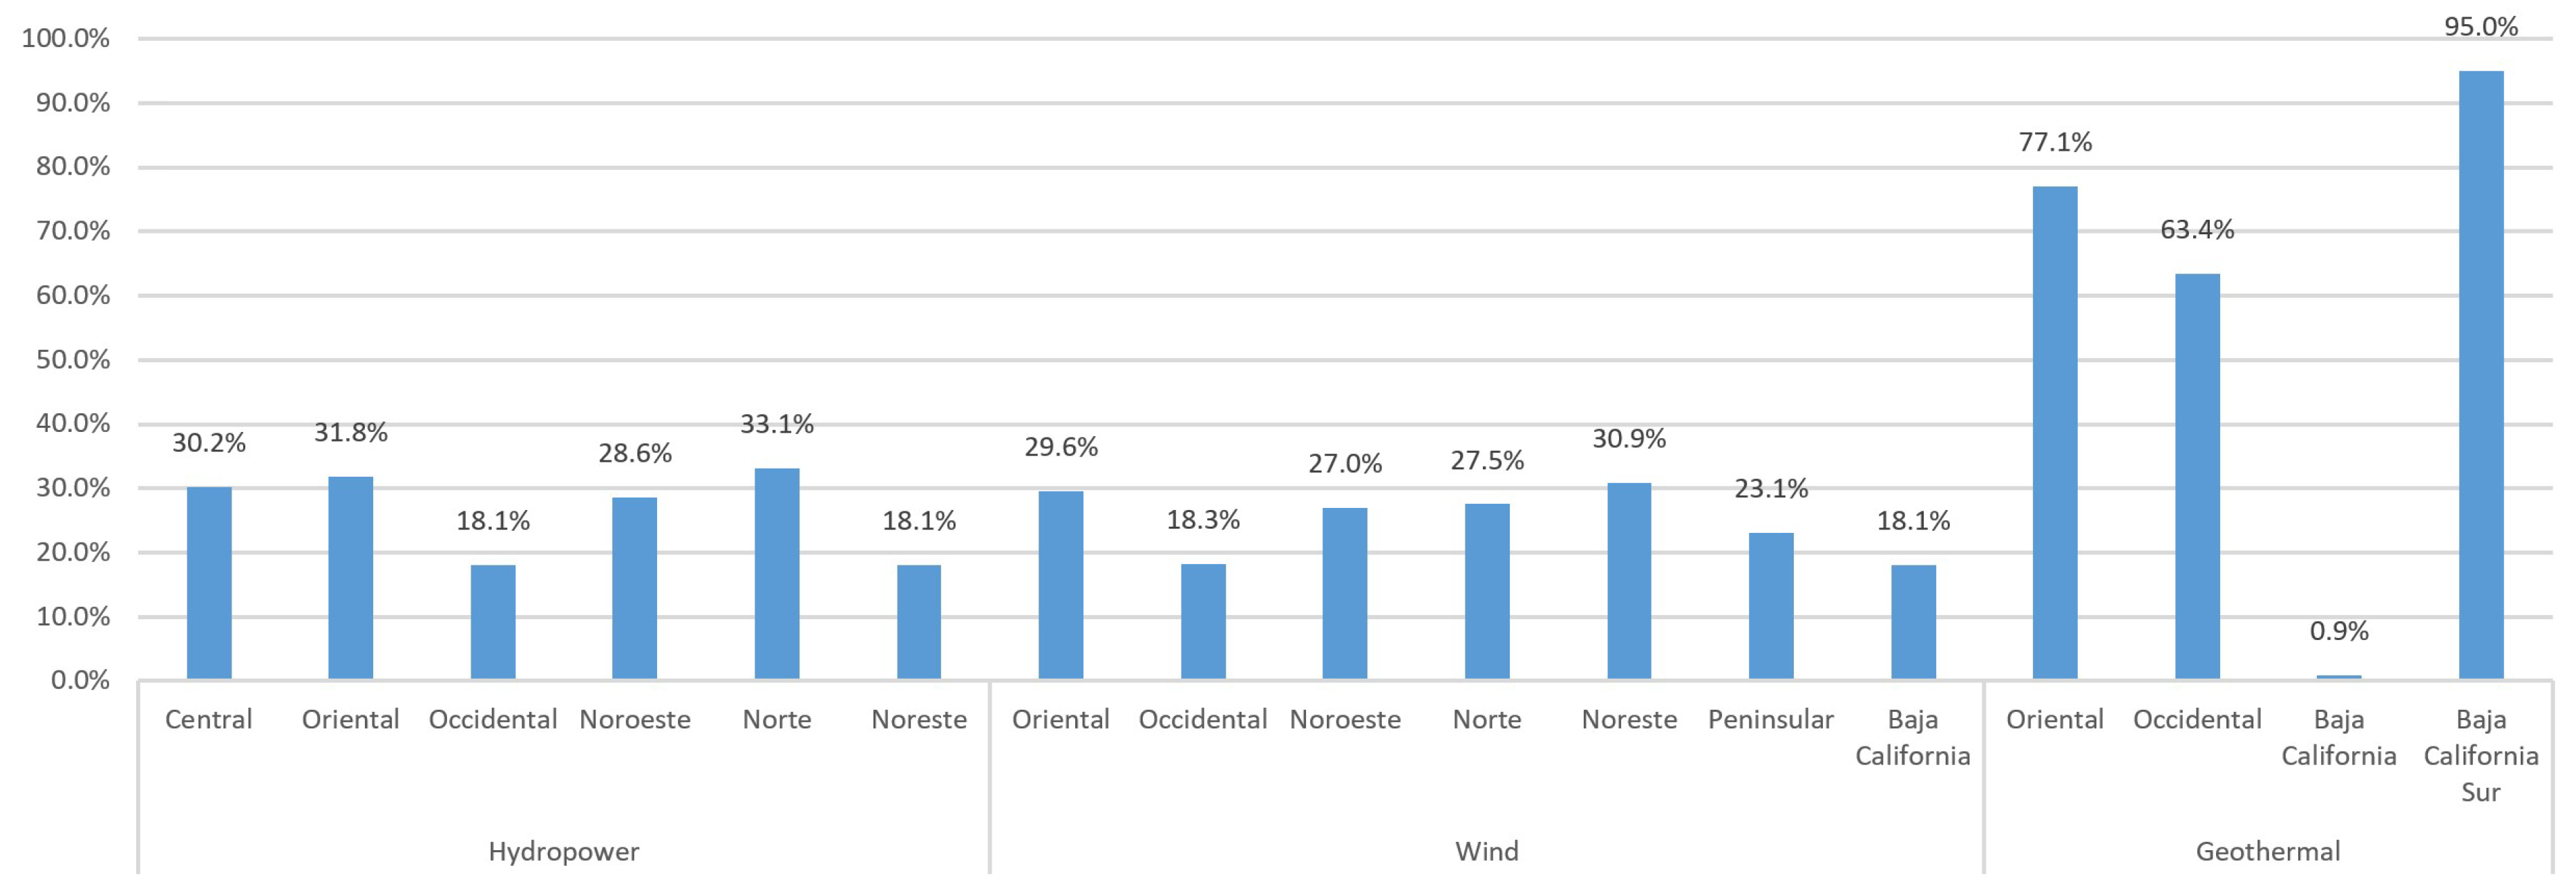

Table 1.
Sets corresponding to each parameter/variable and number of values required or generated in the SEN 2025 scenario.
Table 1.
Sets corresponding to each parameter/variable and number of values required or generated in the SEN 2025 scenario.
| Parameter/Variable | Sets | Number of values | |||
|---|---|---|---|---|---|
| Technologies (13) |
Generation region (9) |
Consumption region (9) |
Time steps (8760) |
||
| Cost | X | X | X | X | 9224280 |
| Demand | X | X | 78840 | ||
| Availability factor | X | X | X | 1024920 | |
| Installed capacity | X | X | X | 1024920 | |
| Transmission capacity | X | X | X | 709560 | |
| Energy dispatch | X | X | X | X | 9224280 |
Disclaimer/Publisher’s Note: The statements, opinions and data contained in all publications are solely those of the individual author(s) and contributor(s) and not of MDPI and/or the editor(s). MDPI and/or the editor(s) disclaim responsibility for any injury to people or property resulting from any ideas, methods, instructions or products referred to in the content. |
© 2024 by the authors. Licensee MDPI, Basel, Switzerland. This article is an open access article distributed under the terms and conditions of the Creative Commons Attribution (CC BY) license (http://creativecommons.org/licenses/by/4.0/).
Copyright: This open access article is published under a Creative Commons CC BY 4.0 license, which permit the free download, distribution, and reuse, provided that the author and preprint are cited in any reuse.


