Submitted:
07 October 2024
Posted:
07 October 2024
You are already at the latest version
Abstract
Objectives: The aim was to analyze clinical targets for lacosamide (LCM) blood levels in patients with focal epilepsy. Referring to the LCM optimal range will motivate us to think about the importance and usefulness of measuring its blood levels. Methods: A total of 101 patients (45 females, 56 males) were treated with LCM. Blood sampling was done 1 month after the start of oral medication (the levels reached steady state) if the LCM treatment had been continued and then 6 and 12 months after. The efficacy of LCM was evaluated by the reduction in the epileptic seizure rate (RR) at the time of blood sampling. The patients were classified as effective cases (seizure reduction rate ≥ 50%) and ineffective cases (< 50%). The actual level, the calculated peak/trough levels, and the levels for each type of seizure were investigated. Statistical analysis was performed using Spearman’s rank correlation coefficient and the Wilcoxon signed-rank test. Results: A positive correlation was seen between blood levels and dosage (r = 0.446). However, the blood levels and RR showed no correlation. The blood levels were higher in effective cases than in ineffective cases at all time points (measurement P < 0.001, peak P = 0.013, trough P = 0.001). Because the range was set so that the effective and ineffective groups did not overlap, the optimal range of LCM was found to be 8.0–10.5 µg/mL. Conclusions: Measuring and calculating blood levels of LCM and adjusting the dosage to reach the optimal range are recommended. Moreover, the optimal range for LCM was determined as a therapeutic target.
Keywords:
blood level
; lacosamide
; optimal range
; reduction in epileptic seizure rate
; therapeutic drug monitoring
1. Introduction
Lacosamide (LCM) is a functional amino acid synthesized as a candidate antiseizure medication (ASM) based on the program of the National Institute of Neurological Disorders and Stroke (NINDS) in the United States, and it has been shown to be effective in multiple epilepsy animal models [1,2,3]. LCM slowly promotes sodium channel inactivation. LCM decreases neuronal hyperexcitability due to shifting the resting membrane potential further toward hyperpolarization and decreasing the fraction of available sodium channels [2]. LCM was approved in the United States and Europe in 2008 as a combination therapy for adults with focal epilepsy including secondary generalized seizures. In Japan, LCM received approval for manufacturing and marketing in 2016, and additional approval for children aged 4 years and older in 2019.
In Japan, there are many oral ASMs, but the therapeutic blood levels of recently approved drugs have generally not been established, because it is not believed that their efficacy and safety are related to blood levels [4,5,6]. There is no standard maintenance dose of LCM, because the dose of LCM can be gradually increased until patients’ convulsions are decreased or disappear. Thus, we would like to understand the pharmacokinetics of LCM for efficacy assessment, when two patients of the same weight may take different doses. However, Cawello reported that the trough concentration produces half the maximum seizure frequency reduction [7]. In clinical practice, there is some need for objective indicators to evaluate the effectiveness of LCM. Therefore, highly accurate blood levels based on strict administration management and reliable efficacy reports from patients or guardians were sought, and the correlations between oral dose and blood level and between blood level and reduction in the epileptic seizure rate were investigated. From the perspective of therapeutic drug monitoring (TDM), the peak/trough levels calculated by computer software were also examined.
2. Materials and Methods
2.1. Study Design and Ethical considerations
This was a prospective cohort study performed according to the principles of the declaration of helsinki. The objective of the study and the therapeutic efficacy and safety of lcm were explained to the patients and their parents, who provided informed consent prior to enrolment. This study was approved by the bioethics committee of st. Marianna university school of medicine (approval number: no. 6066). All experiments were performed according to the approved protocol.
2.2. Patient Selection and Treatment
This study included 101 randomly selected patients with focal epilepsy (45 females, 56 males; age range, 4.1 - 26.3 years) treated with LCM in the pediatric department of Kawasaki Municipal Tama Hospital and St. Marianna University School of Medicine from April 2020 to September 2022. All patients and their parents were informed about the procedure and the purpose of the study, and they all agreed to participate. The patients included 26 with focal aware seizure (FAS), 48 with focal impaired awareness seizure (FIAS), and 74 with focal to bilateral tonic–clonic seizure (FBTCS). In this study, a patient could have multiple seizure types. Details categorized by seizure type and the timing of sampling are shown in Table 1.
Eligible patients were diagnosed based on “the International League Against Epilepsy (ILAE) Commission for Classification and Terminology, 2017” [8,9] by their clinical seizure type, electroencephalogram, and either cranial computed tomography or magnetic resonance imaging. Children with other systemic (cardiac, respiratory, hepatic, renal, or endocrinological) diseases were excluded.
Before starting LCM treatment, patients received the same kinds and dosages of ASMs for 4 more weeks, but the drugs were insufficiently effective. The dose of LCM was started at 1-2 mg/kg/day. If the patient showed seizures, the dose was increased by 2 mg/kg/day every 2 weeks. The maintenance dose was increased to 12 mg/kg/day for patients weighing less than 30 kg, and to 8 mg/kg/day for patients weighing 30-50 kg. We considered that the dose sufficient to eliminate seizures was the maintenance dose for each patient. For patients weighing more than 50 kg, the maximum dose was set to 400 mg/day. When LCM was added to therapy, all patients were on treatment with multiple ASMs (range, 1-3). Furthermore, the discontinuation criteria for this study were: no routine sampling of blood levels; no measurement of body weight at sampling time; poor adherence; and discontinuation of treatment due to serious side effects. Nine cases experienced side effects, but since their symptoms were only temporary drowsiness and resolved without intervention, they were able to continue in the study.
2.3. Sample Collection and Evaluation
Blood levels of LCM were measured regularly. Blood was sampled at the pediatric outpatient clinic and measured by liquid chromatography-tandem mass spectrometry (LC-MS/MS) in an external laboratory (LSI Medience Corporation, Tokyo, Japan). A minimum sample of 0.1 mL of serum was frozen at -30 °C and saved. Blood samples for LCM level measurements were obtained at any time and were measured 1, 6, and 12 months after reaching steady state.
The total number of blood sampling opportunities was 215. The timing of sample collection was arbitrary, so peak and trough levels were estimated individually using simulation software (PEDA VB ver.1.0.0.58).
The efficacy of LCM was evaluated by the reduction in the epileptic seizure rate (RR) at the time of blood sampling. RR at each evaluation was calculated as follows.
Overall, a reduction in seizure frequency of greater than 50% was defined as “effective”.
2.4. Statistical Analysis
The correlations between parameters (LCM dose, LCM blood level, and RR) were analyzed. Statistical analysis was performed using Spearman’s rank correlation coefficient to verify the correlation and Wilcoxon’s signed-rank test for comparisons between two groups. IBM SPSS Statistics Ver. 28.0.0.0 (190) (IBM Japan, Ltd., Tokyo, Japan) was used for all analyses.
3. Results
3.1. Details of Patients’ Age Ranges, Doses, and Blood Levels by Timing of Sampling and Seizure Type
Patients’ background characteristics are shown in Table 1. The LCM dose of all cases was 5.1 ± 2.2 mg/kg/day (mean ± SD, range: 1.0-10.3 mg/kg/day), and the mean blood level was 7.1 ± 3.5 µg/mL (range: 0.5-16.0 µg/mL). There were significant differences in the LCM blood levels after steady state was reached. Compared to the level 1 month after (6.1 ± 3.2 µg/mL), it was 8.2 ± 3.5 µg/mL 6 months after (P = 0.006) and 8.1 ± 3.3 µg/mL (P = 0.027) 12 months after. Since the blood level was relatively high, it was expected that there would be a difference in effectiveness. However, there were no significant differences. The RR was 70.8 ± 35.8% 1 month after, 75.6 ± 33.5% 6 months after (P = 0.539), and 73.8 ± 26.4% 12 months after (P = 0.145). Fortunately, only a few patients experienced side effects, including temporary drowsiness, and their symptoms improved spontaneously without them having to withdraw from this study.
3.2. Relationship Between Dose and Blood Level
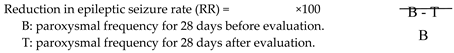
Figure 1 shows the relationship between the LCM dose (mg/day) and the blood level at all sampling time points. In this study, the LCM dose (mg/day) and its blood level had a positive correlation, and the regression line was “y = 0.02x + 2.58”. However, the correlation coefficient was low (r = 0.406). When the dose was corrected by body weight, the correlation coefficient increased slightly (r = 0.446), and the regression line changed to “y = 1.14x + 1.52” (Figure 2). Moreover, the correlations between the peak/trough levels calculated by PEDA VB and the dose were also examined. The peak blood levels and doses had positive correlations (peak r = 0.479, corrected r = 0.478), and the regression lines were “y = 0.02x + 2.54” and “y = 1.18x + 1.67” (Figure 3). For the trough level, there was a positive correlation only between the trough level and the dose corrected by body weight (Figure 4) (r = 0.372, y = 0.8x + 1.27).
3.3. Relationship between the Blood Level and RR
The relationships between the LCM blood level and RR at each timing based on TDM are shown in Figure 5. The blood levels, including actual levels, calculated peak levels, and calculated trough levels, did not correlate with RR. There were outliers. There were effective cases with low blood levels (# in Figure 5) and cases whose RR was low with a high dose ($ in Figure 5) .
3.4. Comparisons of the LCM blood Level between the Effective and Ineffective Cases and Identification of the Optimal Range
The LCM blood level was compared between effective cases and ineffective cases at points based on TDM (Figure 7). There was a significant difference between the two groups at all time points, and the blood levels of effective cases were significantly higher than those of ineffective cases (P < 0.04). The actual level in effective cases was 8.26 ± 3.70 μg/mL (mean ± SD), with a range of 2.2-17.0 µg/mL. Moreover, the optimal range was set to be the range in which the blood levels of the effective cases and the ineffective cases did not overlap. In the actual level that had a markedly significant difference, the optimal range was 8.0–10.5 µg/mL based on the average, standard deviation, and upper limit of the 95% confidence interval (# in Figure 7). In the same way, the optimal range of the trough level was 6.5–8.0 µg/mL ($ in Figure 7). In addition, the optimal range of the peak level was narrow, and because it overlapped with the range of the actual level, the optimal range could not be determined.
In patients with FAS and FIAS, there was no significant difference between effective and ineffective cases. Comparisons of the LCM blood levels between effective and ineffective cases with FBTCS are shown in Figure 8. In patients with FBTCS, the blood levels were significantly higher in effective cases than in ineffective cases (P < 0.005). The optimal ranges of the peak/trough levels could also not be set, because they overlapped almost with the range of the actual level.
4. Discussion
There have been many reports of the efficacy of LCM for pediatric patients [10,11,12]. Kohn suggested that measuring serum concentrations of LCM in pediatric patients on treatment might not be necessary [4]. Another reason for not measuring them may be the lack of pharmacokinetic interactions observed between LCM and other ASMs [7,13,14]. TDM is important for effective and safe treatment using oral ASMs. In our view, TDM can be helpful because of the report about CYP2C19 polymorphisms that affect the serum concentration of LCM [15].
LCM is a drug with a unique mechanism of action, slowly promoting sodium channel inactivation [2,3]. LCM has another mechanism involving modulation of CRMP-2 activity [16,17,18]. Thus, it has been considered a promising candidate with a broad spectrum of action, including epilepsy, neuropathic pain, and other indications, and it has been adopted not only in Japan, but also in many other countries.
Though studies of LCM pharmacokinetics in pediatric patients with epilepsy have been reported [4,6,19], the therapeutic range of the blood level has not been established. There are also reports that there is no relationship between the blood level of LCM and its effectiveness [4]. Therefore, the correlations between oral dosage and blood level and between blood level and RR were investigated to try to set the therapeutic range of LCM. Unfortunately, setting the therapeutic range of LCM blood levels was difficult based on the results, because the blood level and efficacy showed no positive correlation, regardless of duration or seizure type (Figure 5 and Figure 6). However, it seemed possible to set the optimal range for the therapeutic target, because there was a significant difference between effective and ineffective cases with LCM treatment.
First, there were significant differences in LCM blood levels after steady state was reached in the present study (Table 1). The blood level immediately after reaching steady state was compared with those 6 months after and 12 months after. Whereas blood levels were significantly higher 6 and 12 months after, there were no differences in effectiveness. The reasons for significant increases in doses may be due to seizure recurrence or weight gain. Whether the dose was increased without seizures decreasing, or the blood level decreased due to the patient’s growth, the RR of effectiveness seemed difficult to increase [20]. In particular, since there were many cases in which low doses of LCM were effective (# in Figure 5) [21], it was predicted that increasing the dose would be less effective in refractory cases in which seizures occurred after steady state ($ in Figure 5). These appeared to be the reasons for the lack of correlations. No reports of the effect of LCM depending on the seizure type could be identified, but the effectiveness of LCM for generalized tonic-clonic seizures was reported [22]. Therefore, we hypothesized that its effect and the required dose may differ by seizure type, and they were compared by classifying them into three types. However, there were no significant differences in their blood levels. Thus, the hypothesis was not confirmed (Table 1). Furthermore, a correlation between blood level and RR for each seizure type was also sought, but this too could not be confirmed (Figure 6). Because it was not possible to change the oral dose or set the therapeutic range depending on the seizure type, the optimal range of LCM treatment for focal seizure was investigated.
Next, LCM doses and blood levels had a positive correlation in the present study, as in previous reports [4,6,7,23]. Both the correlation coefficient of the daily dose (Figure 1) and that of the dose corrected by body weight (Figure 2) were relatively low (r = 0.406, 0.446, respectively). Based on TDM, it was considered reasonable that the corrected dose was slightly higher than the daily dose. In order to set the optimal range, it was essential to demonstrate the correlation between dose and blood level. Furthermore, the peak (Figure 3) and trough levels (Figure 4) were simulated using computer software, and the correlation with dose was examined. It was found that the correlation of the peak level was slightly high, and the correlation of the trough level was low. Generally, it is thought that the peak level is more reproducible and stable than actual values, and the trough level must be more so. We thought that the sampling timing of blood caused the trough level to be scattered. It was not believed that factors such as incorrect reporting of medication times and sudden forgetting to take medication have large effects on the trough level. Most of the collected samples were taken 2-4 hours after the morning dose. These are times close to the peak level, and it appeared that even the simulated peak levels were more accurate than the trough levels.
There was no correlation between the blood level and RR in each timing based on TDM (Figure 5). In Figure 6, there were no relationships in each seizure type. This could be because there were effective cases even when blood levels were low (# in Figure 5 and Figure 6), and another reason was that the RR did not increase unexpectedly, because the LCM dose was increased due to insufficient efficacy ($ in Figure 5 and Figure 6). The reason why cases with low blood levels had high efficacy was unknown, but it is a positive feature preventing dose-dependent side effects that a low dose of LCM is effective. Therefore, it is justified to start with a low initial dosage, since a low blood level is associated with sufficient efficacy. There is also a report that LCM treatment is effective, particularly at higher doses [19]. In the present cases, if the efficacy was inadequate at the high dose, then sufficient efficacy might not be obtained if the dose was increased to the maximum (12 mg/kg/day).
The current study showed significant differences between effective cases and ineffective cases in patients receiving LCM (P < 0.001, P = 0.013, P = 0.001; Figure 7). The optimal range was set to include the range in which the blood levels of the effective cases and the ineffective cases did not overlap based on the average, standard deviation, and upper limit of the 95% confidence interval. Therefore, it was suggested that the optimal range of the actual level is 8.0–10.5 µg/mL (# in Figure 7), and the optimal range of the trough level is 6.5–8.0 µg/mL ($ in Figure 7). The minimum of the ranges was established to avoid overlap with the level in ineffective cases. Because the correlation between the trough level and the dose was insufficient (r=0.372) in the present study, the optimal recommended range is 8.0–10.5 µg/mL.
LCM has been shown to be effective in the treatment of partial seizures in patients from 4 years of age [24,25]. LCM seems to be particularly effective for tonic-clonic seizures [22]. In the present study, a significant difference was found between effective and ineffective cases of FBTCS in epilepsies with tonic-clonic seizures (Figure 8). The target range in FBTCS was slightly higher than the optimal range mentioned above. It was expected that the dosage would be adjusted proactively because the patients and their families want the seizures to be completely suppressed, because the seizures in FBTCS are easily identified by the families and have large impacts on daily life. Therefore, doctors would likely make frequent and sensitive adjustments to the LCM dose based on parental reports of detailed seizures. We thought that the optimal ranges in FBTCS would be higher than the optimal range of all cases, and there would be less overlap between the effective group and the other group. The target range of the results in the present study was lower than existing reports [7,19,26,27,28]. There have been very few reports that advocated a range lower than the optimal range of the present study [21]. As mentioned above, there were cases in which low LCM blood levels were effective (# in Figure 5 and Figure 6), and we thought that the presence of these cases was one of the reasons. Furthermore, it was also considered that these cases were more numerous than the ineffective cases with higher LCM levels ($ in Figure 5 and Figure 6). This study was also conducted to determine the relationship between seizure type and LCM dose based on its blood levels [29,30], and a correlation between the LCM dose and blood level was demonstrated. However, no correlation was observed between the blood concentration and the seizure reduction rate in FAS, FIAS, and FBTCS, because there were many cases in which low doses of LCM were effective, or even high doses were insufficiently effective. Similar to the comparison of blood levels between the LCM effective group and the other groups in the whole population, the two groups were compared for each seizure type; no significant differences were observed, except for FBTCS. This might be due to inadequate medication in FAS and FIAS compared with FBTCS, due to a tendency to overlook seizures. Therefore, comparisons of the optimal ranges for each type of seizure were impossible, and the required oral dose for each type could not be stated.
5. Conclusions
The present study demonstrated the efficacy of LCM and the usefulness of LCM blood level measurement. There was a positive correlation between the oral dose of LCM and its blood levels, and LCM blood levels were higher in effective cases than in ineffective cases. Therefore, the optimal range was established to be 8.0–10.5 μg/mL. Furthermore, in focal epilepsy with FBTCS, the optimal range may be expanded. Monitoring of plasma LCM levels may help physicians optimize the drug dose schedule in individual patients and lead to easy use of LCM.
Author Contributions
Conceptualization, T.I. and H.Y.; methodology, T.I.; software, T.I. and T.K.; validation, T.I. and Y.M.; formal analysis, T.I.; investigation, T.I., T.I and S.K.; resources, T.I.; data curation, T.I.; writing—original draft preparation, T.I..; writing—review and editing, T.I. and N.U.; visualization, T.I.; supervision, N.S.; project administration, T.I. All authors have read and agreed to the published version of the manuscript.
Funding
This study received no external funding.
Institutional Review Board Statement
The study was conducted in accordance with the Declaration of Helsinki and was approved by the Institutional Review Board (or Ethics Committee) of St. Marianna University School of Medicine (protocol code 6066 and date of approval, 12 July 2023).
Informed Consent Statement
Informed consent was obtained from all participants in the study.
Data Availability Statement
The data supporting the study findings are available upon reasonable request from the corresponding author in accordance with the data policies.
Acknowledgments
The abstract of this paper will be presented in part at the 57th Annual Congress of the Japan Epilepsy Society in Fukuoka, Japan, September 2024, and the 67th Annual Meeting of the Japanese Society of Child Neurology in Yonago, Japan, June 2025. The authors would like to thank Dr. Luba Wolchuk of FORTE Science Communications (https://www.forte-science.co.jp/) for English language editing.
Conflicts of Interest
The authors declare no conflicts of interest.
References
- Errington, A.C.; Coyne, L.; Stöhr, T.; Selve, N.; Lees, G. Seeking a mechanism of action for the novel anticonvulsant lacosamide. Neuropharmacology 2006, 50(8), 1016-1029. [CrossRef]
- Errington, A.C.; Stöhr, T.; Heers, C.; Lees, G. The investigational anticonvulsant lacosamide selectively enhances slow inactivation of voltage-gated sodium channels. Mol Pharmacol 2008, 73(1), 157–169. [CrossRef]
- Niespodziany, I.; Leclère, N.; Vandenplas, C.; Foerch, P.; Wolff, C. Comparative study of lacosamide and classical sodium channel blocking antiepileptic drugs on sodium channel slow inactivation. J Neurosci Res, 2013, 91(3), 436-443. [CrossRef]
- Kohn, E.; Lezinger, M.; Daniel, S.; Masarwi, M;, Brandriss, N.; Bar-Chaim, A.: Berkovitch, M.; Heyman, E.; Komargodski, R. Therapeutic drug monitoring of lacosamide among children: is it helpful? Front Pharmacol 2023 Jul 6, 14, 1164902. [CrossRef]
- Steinhoff, B.J.; Hübers, E.; Kurth, C.; Jürges, Kehl-Kork.U. Plasma concentration and clinical effects of perampanel-The Kork experience. Seizure 2019 Apr, 67, 18-22. [CrossRef]
- Giroux, PC.; Salas-Prato, M.; Théorêt, Y.; Carmant, L. Levetiracetam in children with refractory epilepsy: lack of correlation between plasma concentration and efficacy. Seizure 2009 Oct, 18(8), 559-563. [CrossRef]
- Cawello, W. Clinical pharmacokinetic and pharmacodynamic profile of lacosamide. Clin Pharmacokinet. 2015 Sep, 54(9), 901-914. [CrossRef]
- Scheffer, I.E.; Berkovic, S.; Capovilla, G.; Connolly, MB.; French, J.; Guilhoto, L.; Hirsch, E.; Jain, S.; Mathern, G.W.; Moshé, S.L.; Nordli, D.R.; Perucca, E.; Tomson, T.; Wiebe, S.; Zhang, Y-H.; Zuberi, S.M. ILAE classification of the epilepsies: Position paper of the ILAE Commission for Classification and Terminology. Epilepsia. 2017 Apr, 58(4), 512-521. [CrossRef]
- Fisher, R.S.; Cross, J.H.; French, J.A.; Higurashi, N.; Hirsch, E.; Jansen, F.E.; Lagae, L.; Moshé, S.L.; Peltola, J.; Perez, E.R.; Scheffer, I.E.; Zuberi, S.M. Operational classification of seizure types by the International League Against Epilepsy: Position Paper of the ILAE Commission for Classification and Terminology. Epilepsia. 2017 Apr, 58(4), 522-530. [CrossRef]
- Casas-Fernández, C.; Martínez-Bermejo, A.; Rufo-Campos, M.; Smeyers-Durá, P.; Herranz-Fernández, J.L.; Ibáñez-Micó, S.; Campistol-Plana, J.; Alarcón-Martínez, H.; Campos-Castelló, J. Efficacy and tolerability of lacosamide in the concomitant treatment of 130 patients under 16 years of age with refractory epilepsy: a prospective, open-label, observational, multicenter study in Spain. Drugs R D. 2012 Dec 1, 12(4), 187-197. [CrossRef]
- Gavatha, M.; Ioannou, I.; Papavasiliou, A.S. Efficacy and tolerability of oral lacosamide as adjunctive therapy in pediatric patients with pharmacoresistant focal epilepsyy. Epilepsy Behav. 2011 Apr, 20(4), 691-693. [CrossRef]
- Yorns, W.R. Jr.; Khurana, D.S.; Carvalho, K.S.; Hardison, H.H.; Legido, A.; Valencia, I. Efficacy of lacosamide as adjunctive therapy in children with refractory epilepsy. J Child Neurol. 2014 Jan, 29(1), 23-27. [CrossRef]
- Cawello, W.; Nickel, B.; Eggert-Formella, A. No pharmacokinetic interaction between lacosamide and carbamazepine in healthy volunteers. J Clin Pharmacol. 2010 Apr, 50(4), 459-471. [CrossRef]
- Cawello, W.; Bonn, R. No pharmacokinetic interaction between lacosamide and valproic acid in healthy volunteers. J Clin Pharmacol. 2012 Nov, 52(11), 1739-48. [CrossRef]
- Ahn, S.J.; Oh, J.; Kim, D.Y.; Son, H.; Hwang, S.; Shin, H.R.; Kim, E.Y.; Lee, H.S.; Lee, W.J.; Moon, J.; Lee, S.T.; Jung, K.H.; Park, K.I.; Jung, K.Y.; Lee, S.; Yu, K.S.; Chu, K.; Lee, S.K. Effects of CYP2C19 genetic polymorphisms on the pharmacokinetics of lacosamide in Korean patients with epilepsy. Epilepsia. 2022 Nov, 63(11), 2958-2969. [CrossRef]
- Beyreuther, B.K.; Freitag, J.; Heers, C.; Krebsfänger, N.; Scharfenecker, U.; Stöhr, T. Lacosamide: a review of preclinical properties. CNS Drug Rev. 2007 Spring, 13(1), 21-42. [CrossRef]
- Wolff, C.; Carrington, B.; Varrin-Doyer, M.; Vandendriessche, A.; Van der Perren, C.; Famelart, M.; Gillard, M.; Foerch, P.; Rogemond, V.; Honnorat, J.; Lawson, A.; Miller, K. Drug binding assays do not reveal specific binding of lacosamide to collapsin response mediator protein 2 (CRMP-2). CNS Neurosci Ther. 2012 Jun, 18(6), 493-500. [CrossRef]
- Shiloh-Malawsky, Y.; Fan, Z.; Greenwood, R.; Tennison, M. Successful treatment of childhood prolonged refractory status epilepticus with lacosamide. Seizure. 2011 Sep, 20(7), 586-588. [CrossRef]
- Ishikawa, N.; Eguchi, Y.; Izumo, H.; Tateishi, Y.; Tani, H.; Kobayashi, Y.; Okada, S. Clinical impact of the dose and blood concentration of lacosamide in Japanese pediatric patients with epilepsy: A cohort study. Epilepsy Behav. 2022 Apr, 129, 108614. [CrossRef]
- Zhao, T.; Yu, L.H.; Zhang, HL.; Yu, J.; Feng, J.; Wang, T.T.; Sun, Y.; Li, H.J. Long-term effectiveness and safety of lacosamide as adjunctive therapy in children and adolescents with refractory epilepsy: a real-world study. BMC Pediatr. 2023 May 20, 23(1), 249. [CrossRef]
- Hiemke, C.; Baumann, P.; Bergemann, N.; Conca, A.; Dietmaier, O.; Egberts, K.; Fric, M.; Gerlach, M.; Greiner, C.; Gründer, G.; Haen, E.; Havemann-Reinecke, U.; Jaquenoud Sirot, E.; Kirchherr, H.; Laux, G.; Lutz, U.C.; Messer, T.; Müller, M.J.; Pfuhlmann, B.; Rambeck, B.; Riederer, P.; Schoppek, B.; Stingl, J.; Uhr, M.; Ulrich, S.; Waschgler, R.; Zernig, G. AGNP consensus guidelines for therapeutic drug monitoring in psychiatry: Update 2011. Pharmacopsychiatry. 2011 Sep, 44(6), 195-235.
- Vossler, DG.; Knake, S.; O'Brien, T.J.; Watanabe, M.; Brock, M.; Steiniger-Brach, B.; Williams, P.; Roebling, R.; SP0982 co-investigators. Efficacy and safety of adjunctive lacosamide in the treatment of primary generalised tonic-clonic seizures: a double-blind, randomised, placebo-controlled trial. J Neurol Neurosurg Psychiatry. 2020 Oct, 91(10), 1067-1075. [CrossRef]
- Li, Y.; Guo, HL.; Zhang, Y.Y.; Dong, N.; Hu, Y.H.; Chen, J.; Lu, XP.; Chen, F. Plasma lacosamide monitoring in children with epilepsy: Focus on reference therapeutic range and influencing factors. Front Pediatr. 2022 Sep 7, 10, 949783. [CrossRef]
- Terada, K.; Yamamoto, T.; Yokoyama, T.; Ikeda, K.; Hoshii, N. Long-term Efficacy and Safety of Conversion to Lacosamide Monotherapy in Japanese Adults with Partial-onset Seizures: A Multicenter, Open-label, Phase 3 Trial. Shinryo to Shinyaku. 2019, 56(1), 1-10. (in Japanese).
- Inoue, Y.; Osakabe, T.; Hirano, K.; Shimizu, S. Tolerability of adjunctive therapy with lacosamide, a novel antiepileptic drug, in adult epilepsy patiens: Secondary analysis of data from a double-blind comparative trial and an ongoing long-term open trial. Jpn. J. Clin. Psychophaemacol. 2017, 20(4), 439-453. (in Japanese).
- Aícua-Rapún, I.; André, P.; Rossetti, A.O.; Ryvlin, P.; Hottinger, AF.; Decosterd, L.A.; Buclin, T.; Novy, J. Therapeutic Drug Monitoring of Newer Antiepileptic Drugs: A Randomized Trial for Dosage Adjustment. Ann Neurol. 2020 Jan, 87(1), 22-29. [CrossRef]
- Patsalos, P.N.; Spencer, E.P.; Berry, D.J. Therapeutic Drug Monitoring of Antiepileptic Drugs in Epilepsy: A 2018 Update. Ther Drug Monit. 2018 Oct, 40(5), 526-548. [CrossRef]
- Jacob, S.; Nair, AB.; An Updated Overview on Therapeutic Drug Monitoring of Recent Antiepileptic Drugs. Drugs R D. 2016 Dec, 16(4), 303-316. [CrossRef]
- Asadi-Pooya AA, Farazdaghi M. Idiopathic generalized epilepsies: Which seizure type is more difficult to control? J Clin Neurosci. 2023 Aug; 114: 93-96. [CrossRef]
- Duy PQ, Krauss GL, Crone NE, Ma M, Johnson EL. Antiepileptic drug withdrawal and seizure severity in the epilepsy monitoring unit. Epilepsy Behav. 2020 Aug: 109: 107128. [CrossRef]
Figure 1.
Relationship between the dose and the blood level of LCM. The daily dose (mg/day) and its blood level have a positive correlation at all sampling time points (r=0.406). The regression line is “y = 0.02x + 2.58”.
Figure 1.
Relationship between the dose and the blood level of LCM. The daily dose (mg/day) and its blood level have a positive correlation at all sampling time points (r=0.406). The regression line is “y = 0.02x + 2.58”.
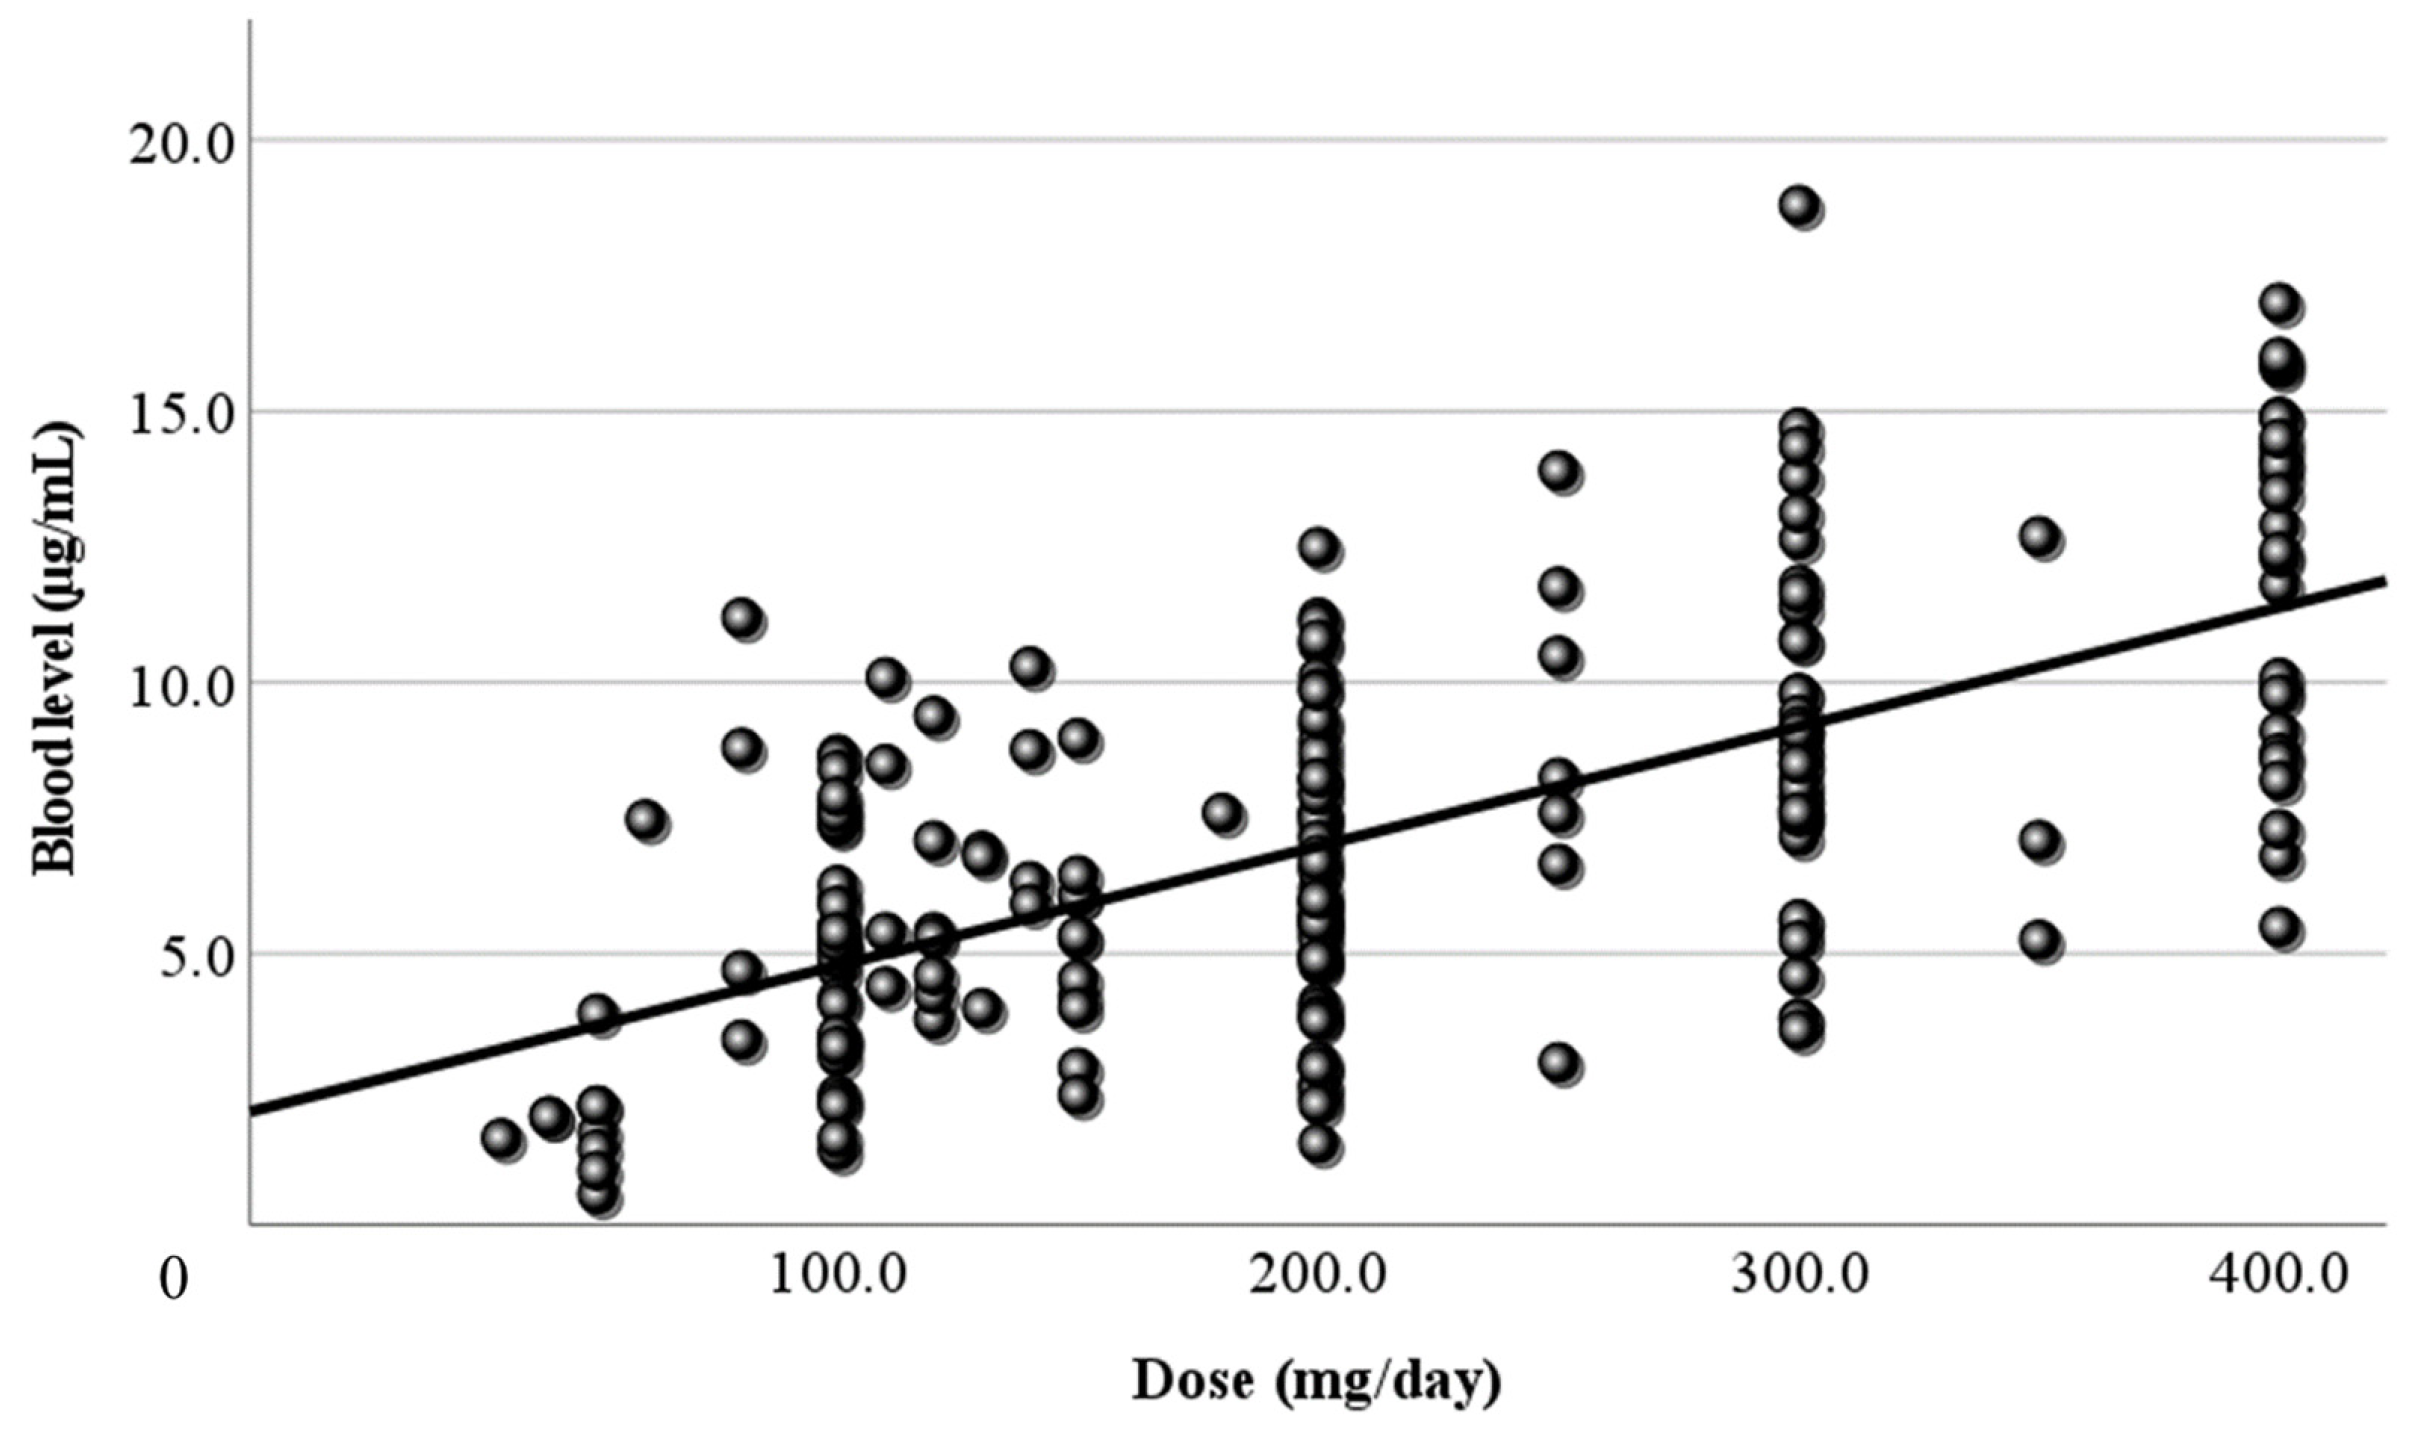
Figure 2.
Figure 2. Relationship between the corrected dose and the blood level of LCM. The dose corrected by body weight (mg/kg/day) and the blood level have a positive correlation. The correlation coefficient is 0.446, slightly higher than the coefficient for the daily dose. The regression line is “y = 1.14x + 1.52”.
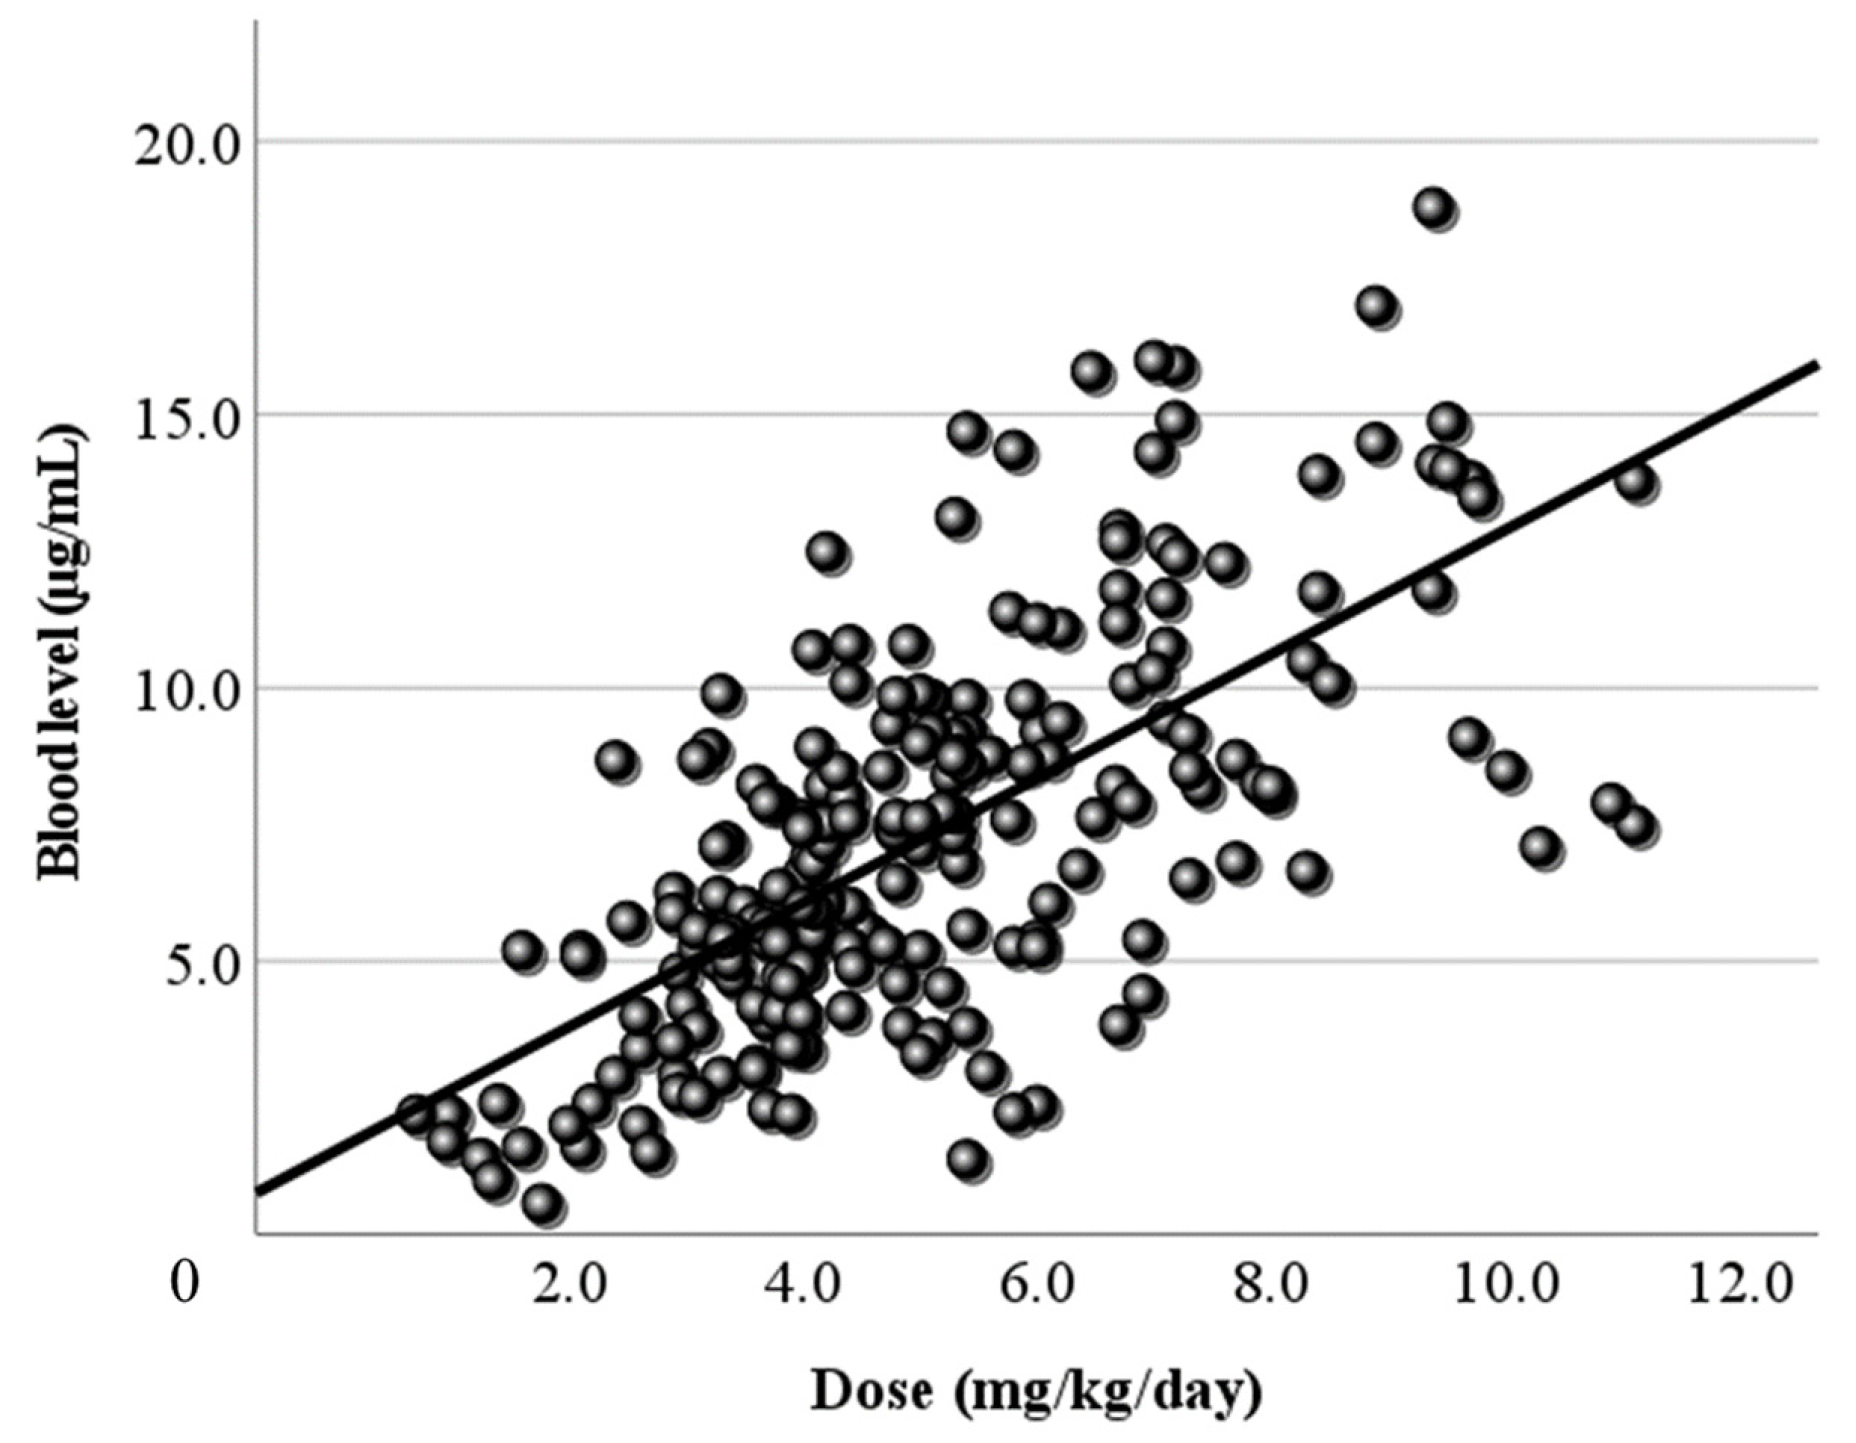
Figure 3.
Relationship between the dose and the peak blood level of LCM. (a) The calculated peak blood level and the daily dose (mg/day) have a positive correlation (r = 0.479). (b) The peak blood level and the corrected dose (mg/kg/day) also have a positive correlation (r=0.478). The regression lines are “y = 0.02x + 2.54” and “y = 1.18x + 1.67”, respectively.
Figure 4.
Relationship between the dose and the trough blood level of LCM. (a) The calculated trough blood level and the daily dose (mg/day) have no correlation. (b) The trough blood level and the corrected dose (mg/kg/day) have a subtle positive correlation (r = 0.372), and the regression line is “y = 0.8x + 1.27”.
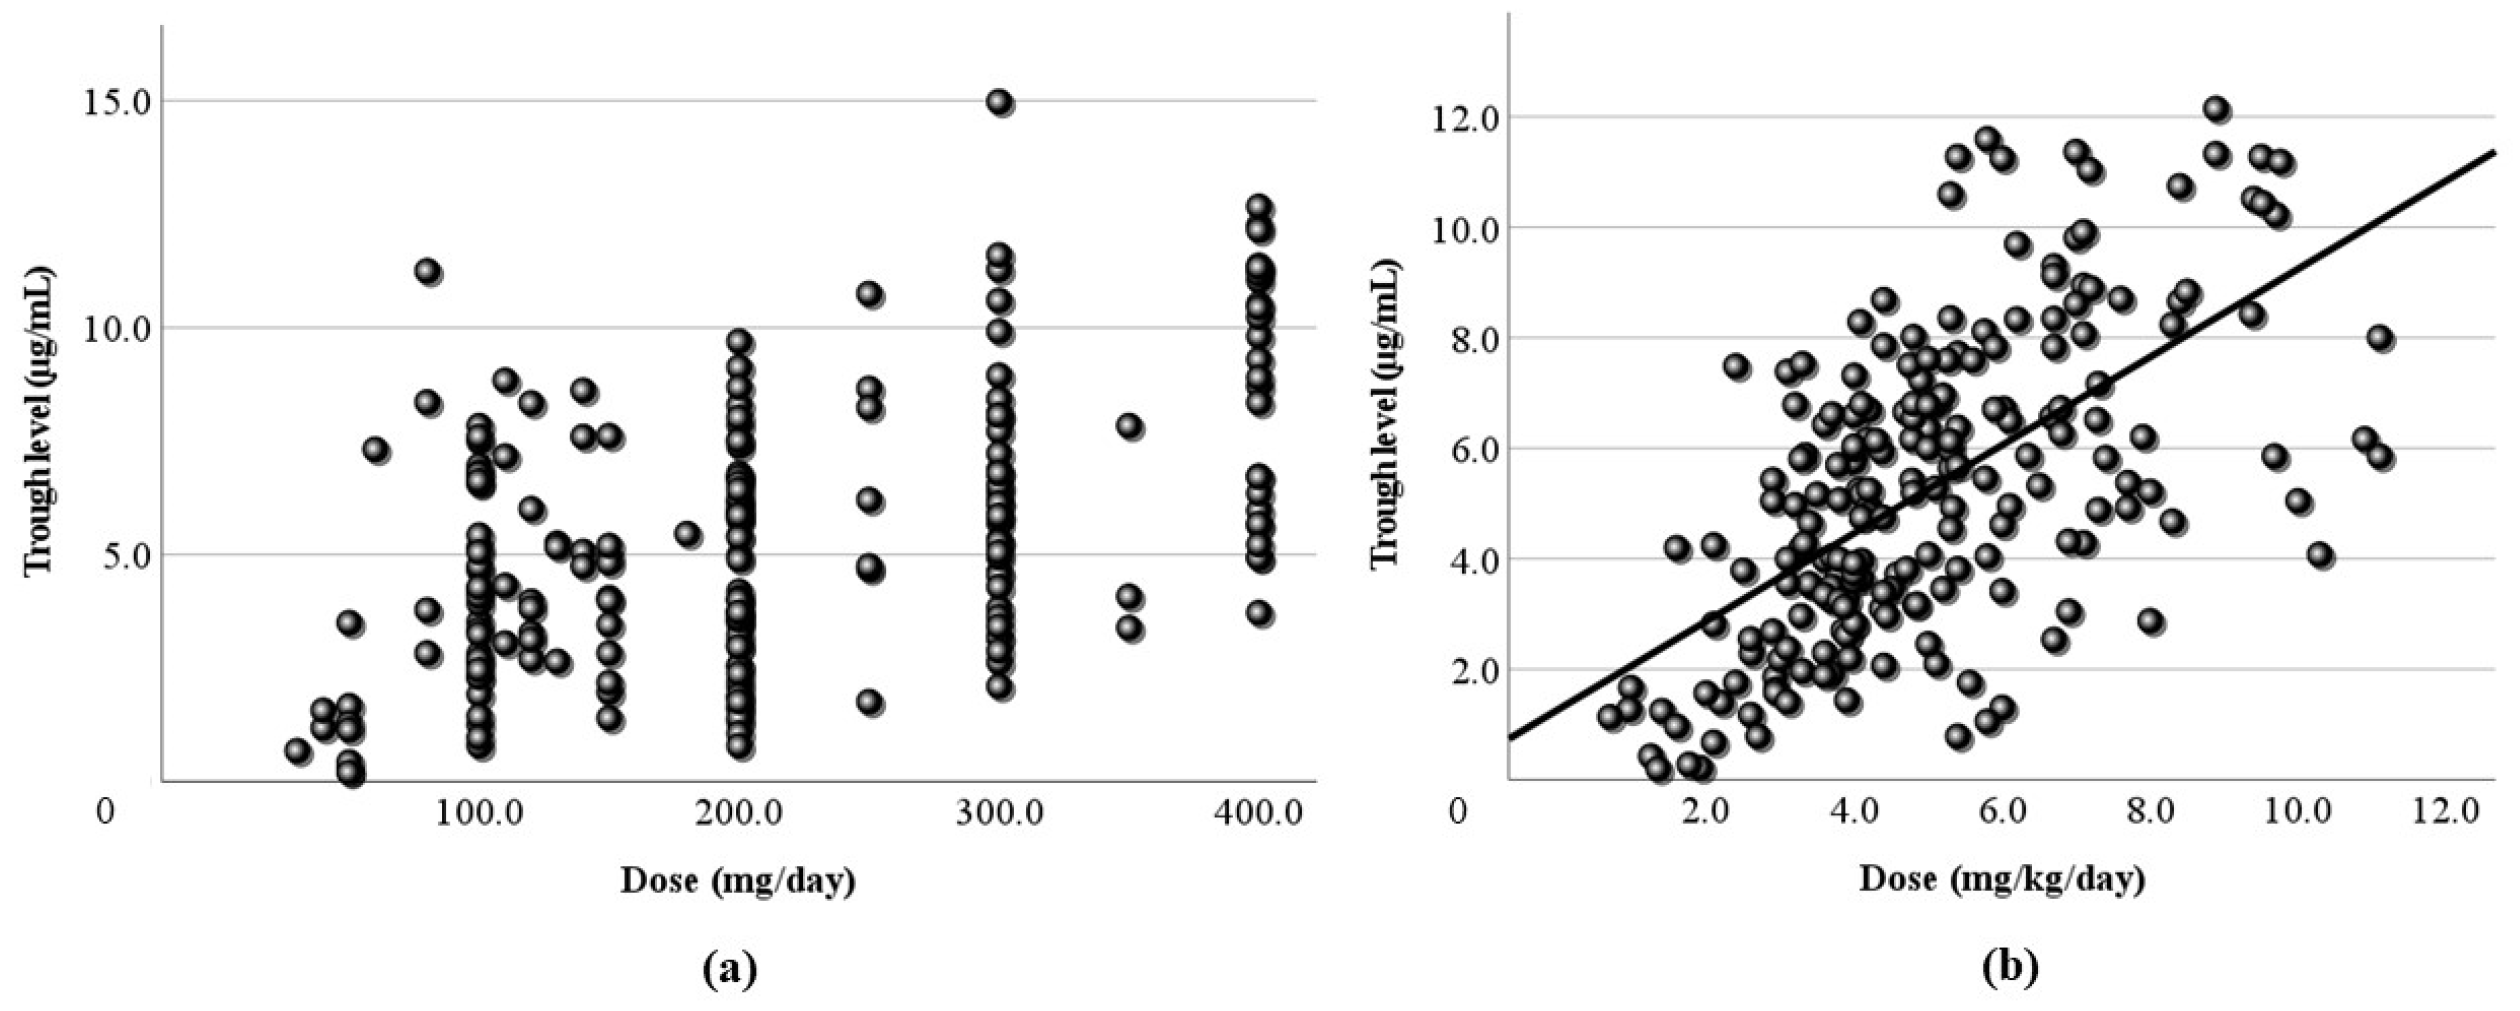
Figure 5.
Relationship between LCM blood levels and RR. (a) There is no correlation between the actual LCM blood level and RR. (b,c) The calculated peak and trough levels do not correlate with RR. (#) This area includes effective cases with low blood levels, ($) another area includes the cases whose RR was not sufficient to increase with a high dose.
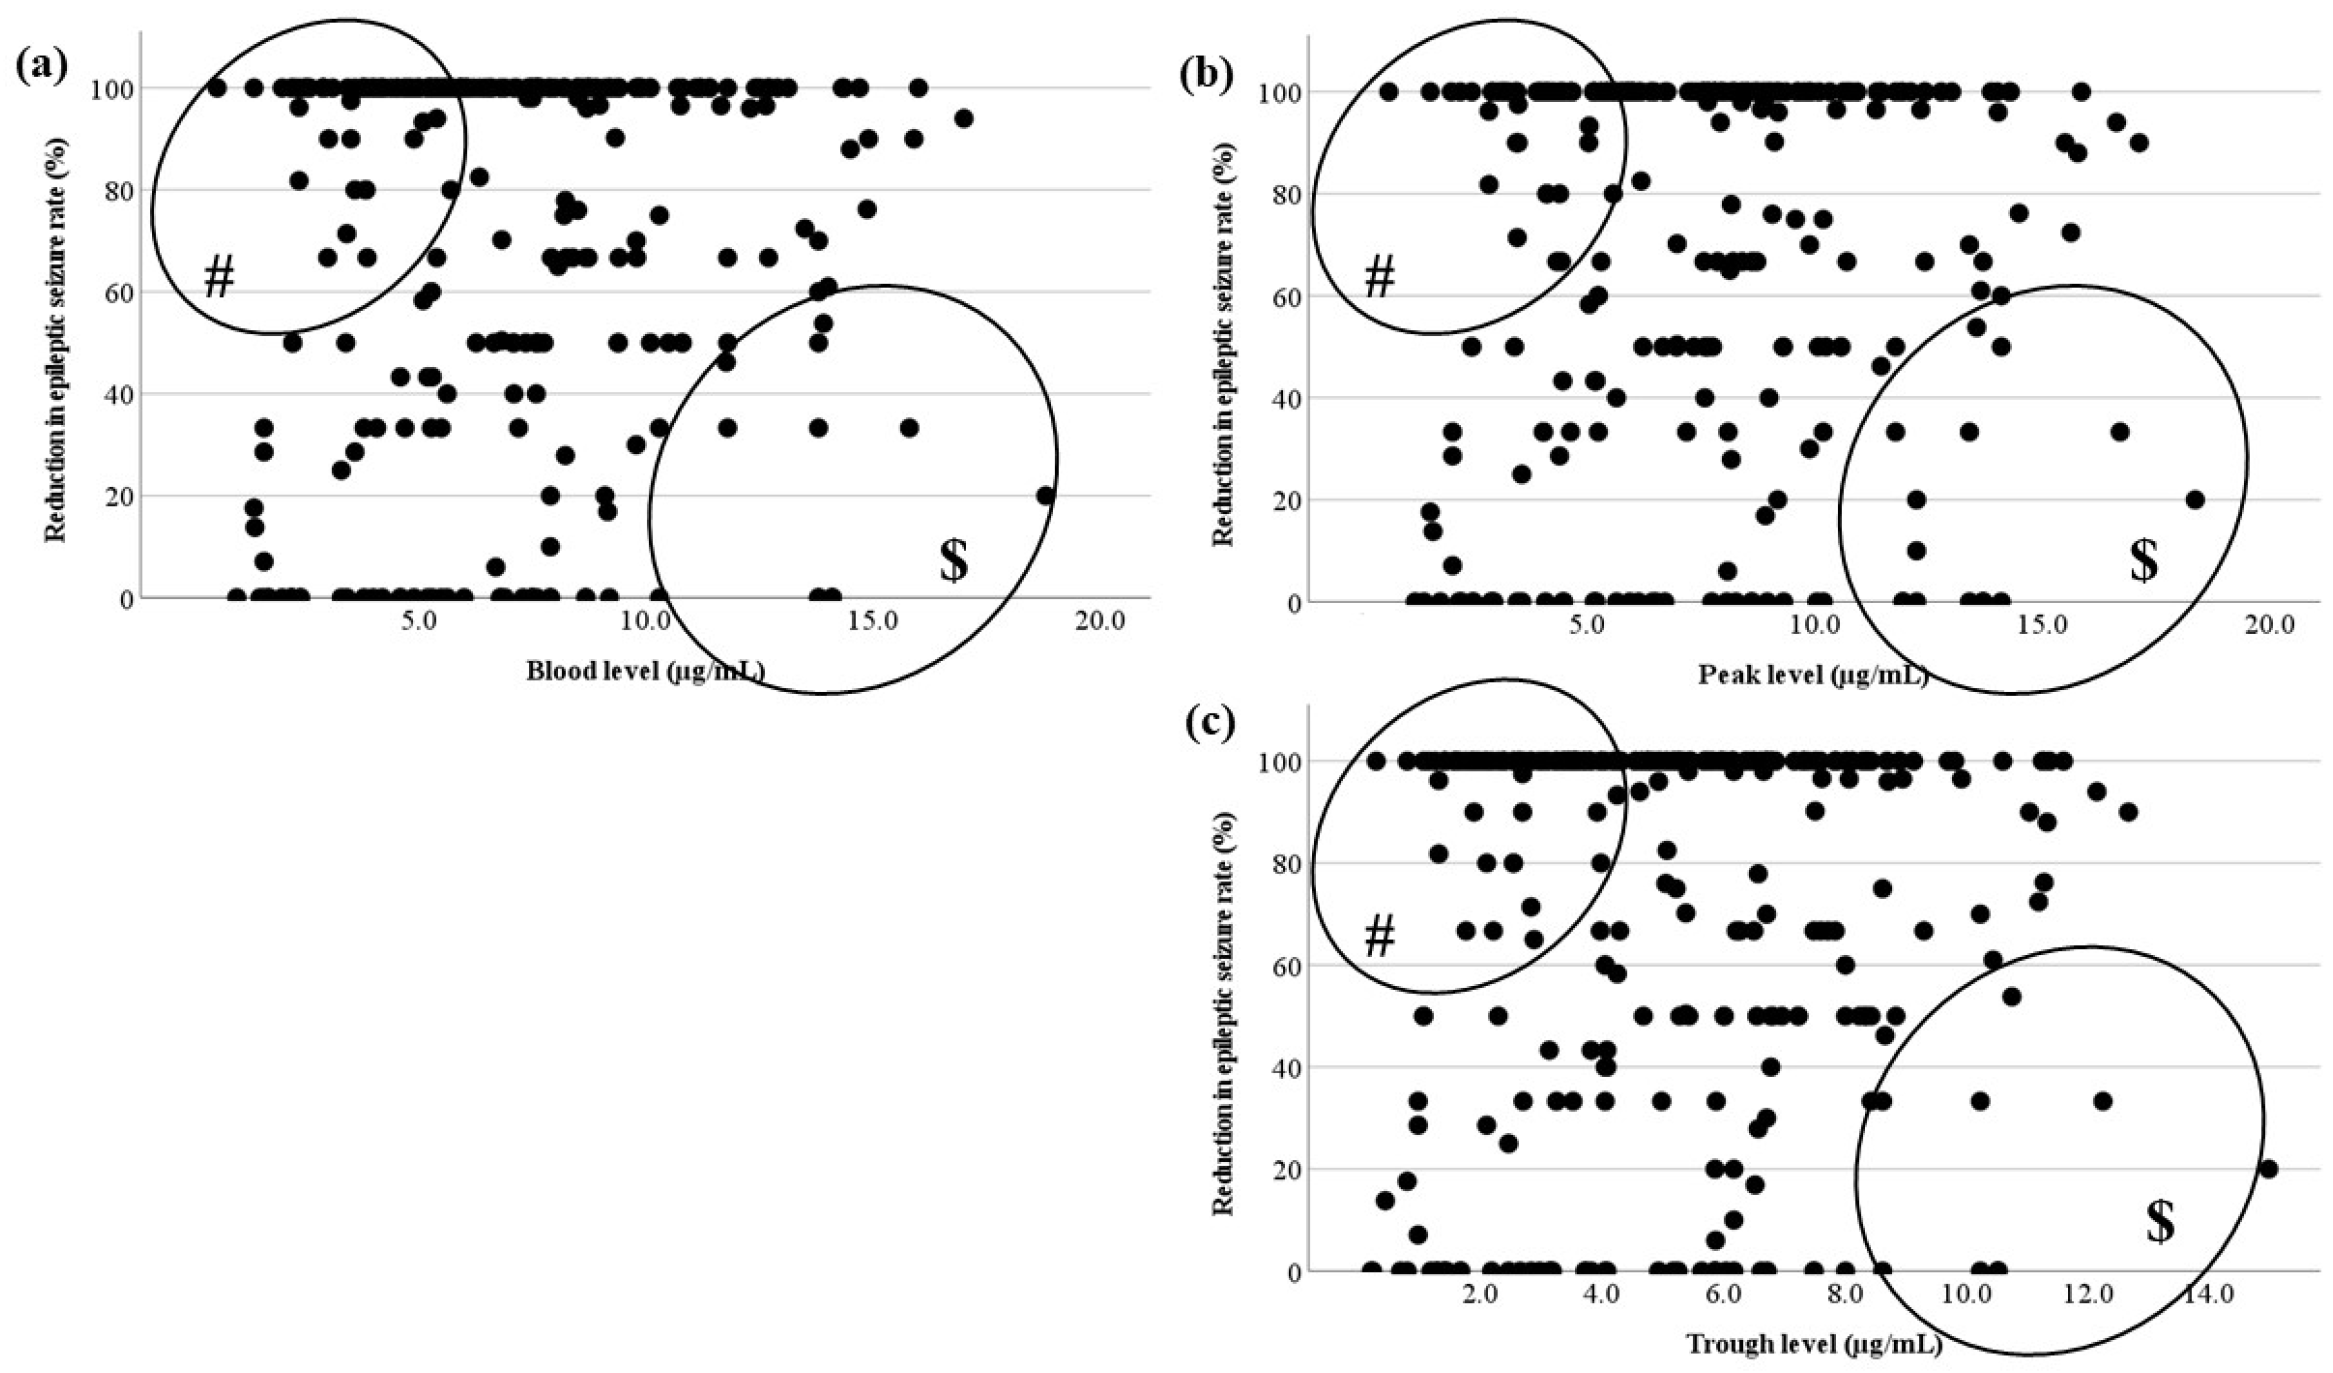
Figure 6.
Relationship between LCM blood levels and RR for each seizure type. There is no correlation between the actual LCM blood level and RR of (a) FAS, (b) FIAS, (c) and FBTCS. There are effective cases whose LCM blood levels are low (#). There are low RR cases with an increased LCM dose ($).
Figure 6.
Relationship between LCM blood levels and RR for each seizure type. There is no correlation between the actual LCM blood level and RR of (a) FAS, (b) FIAS, (c) and FBTCS. There are effective cases whose LCM blood levels are low (#). There are low RR cases with an increased LCM dose ($).
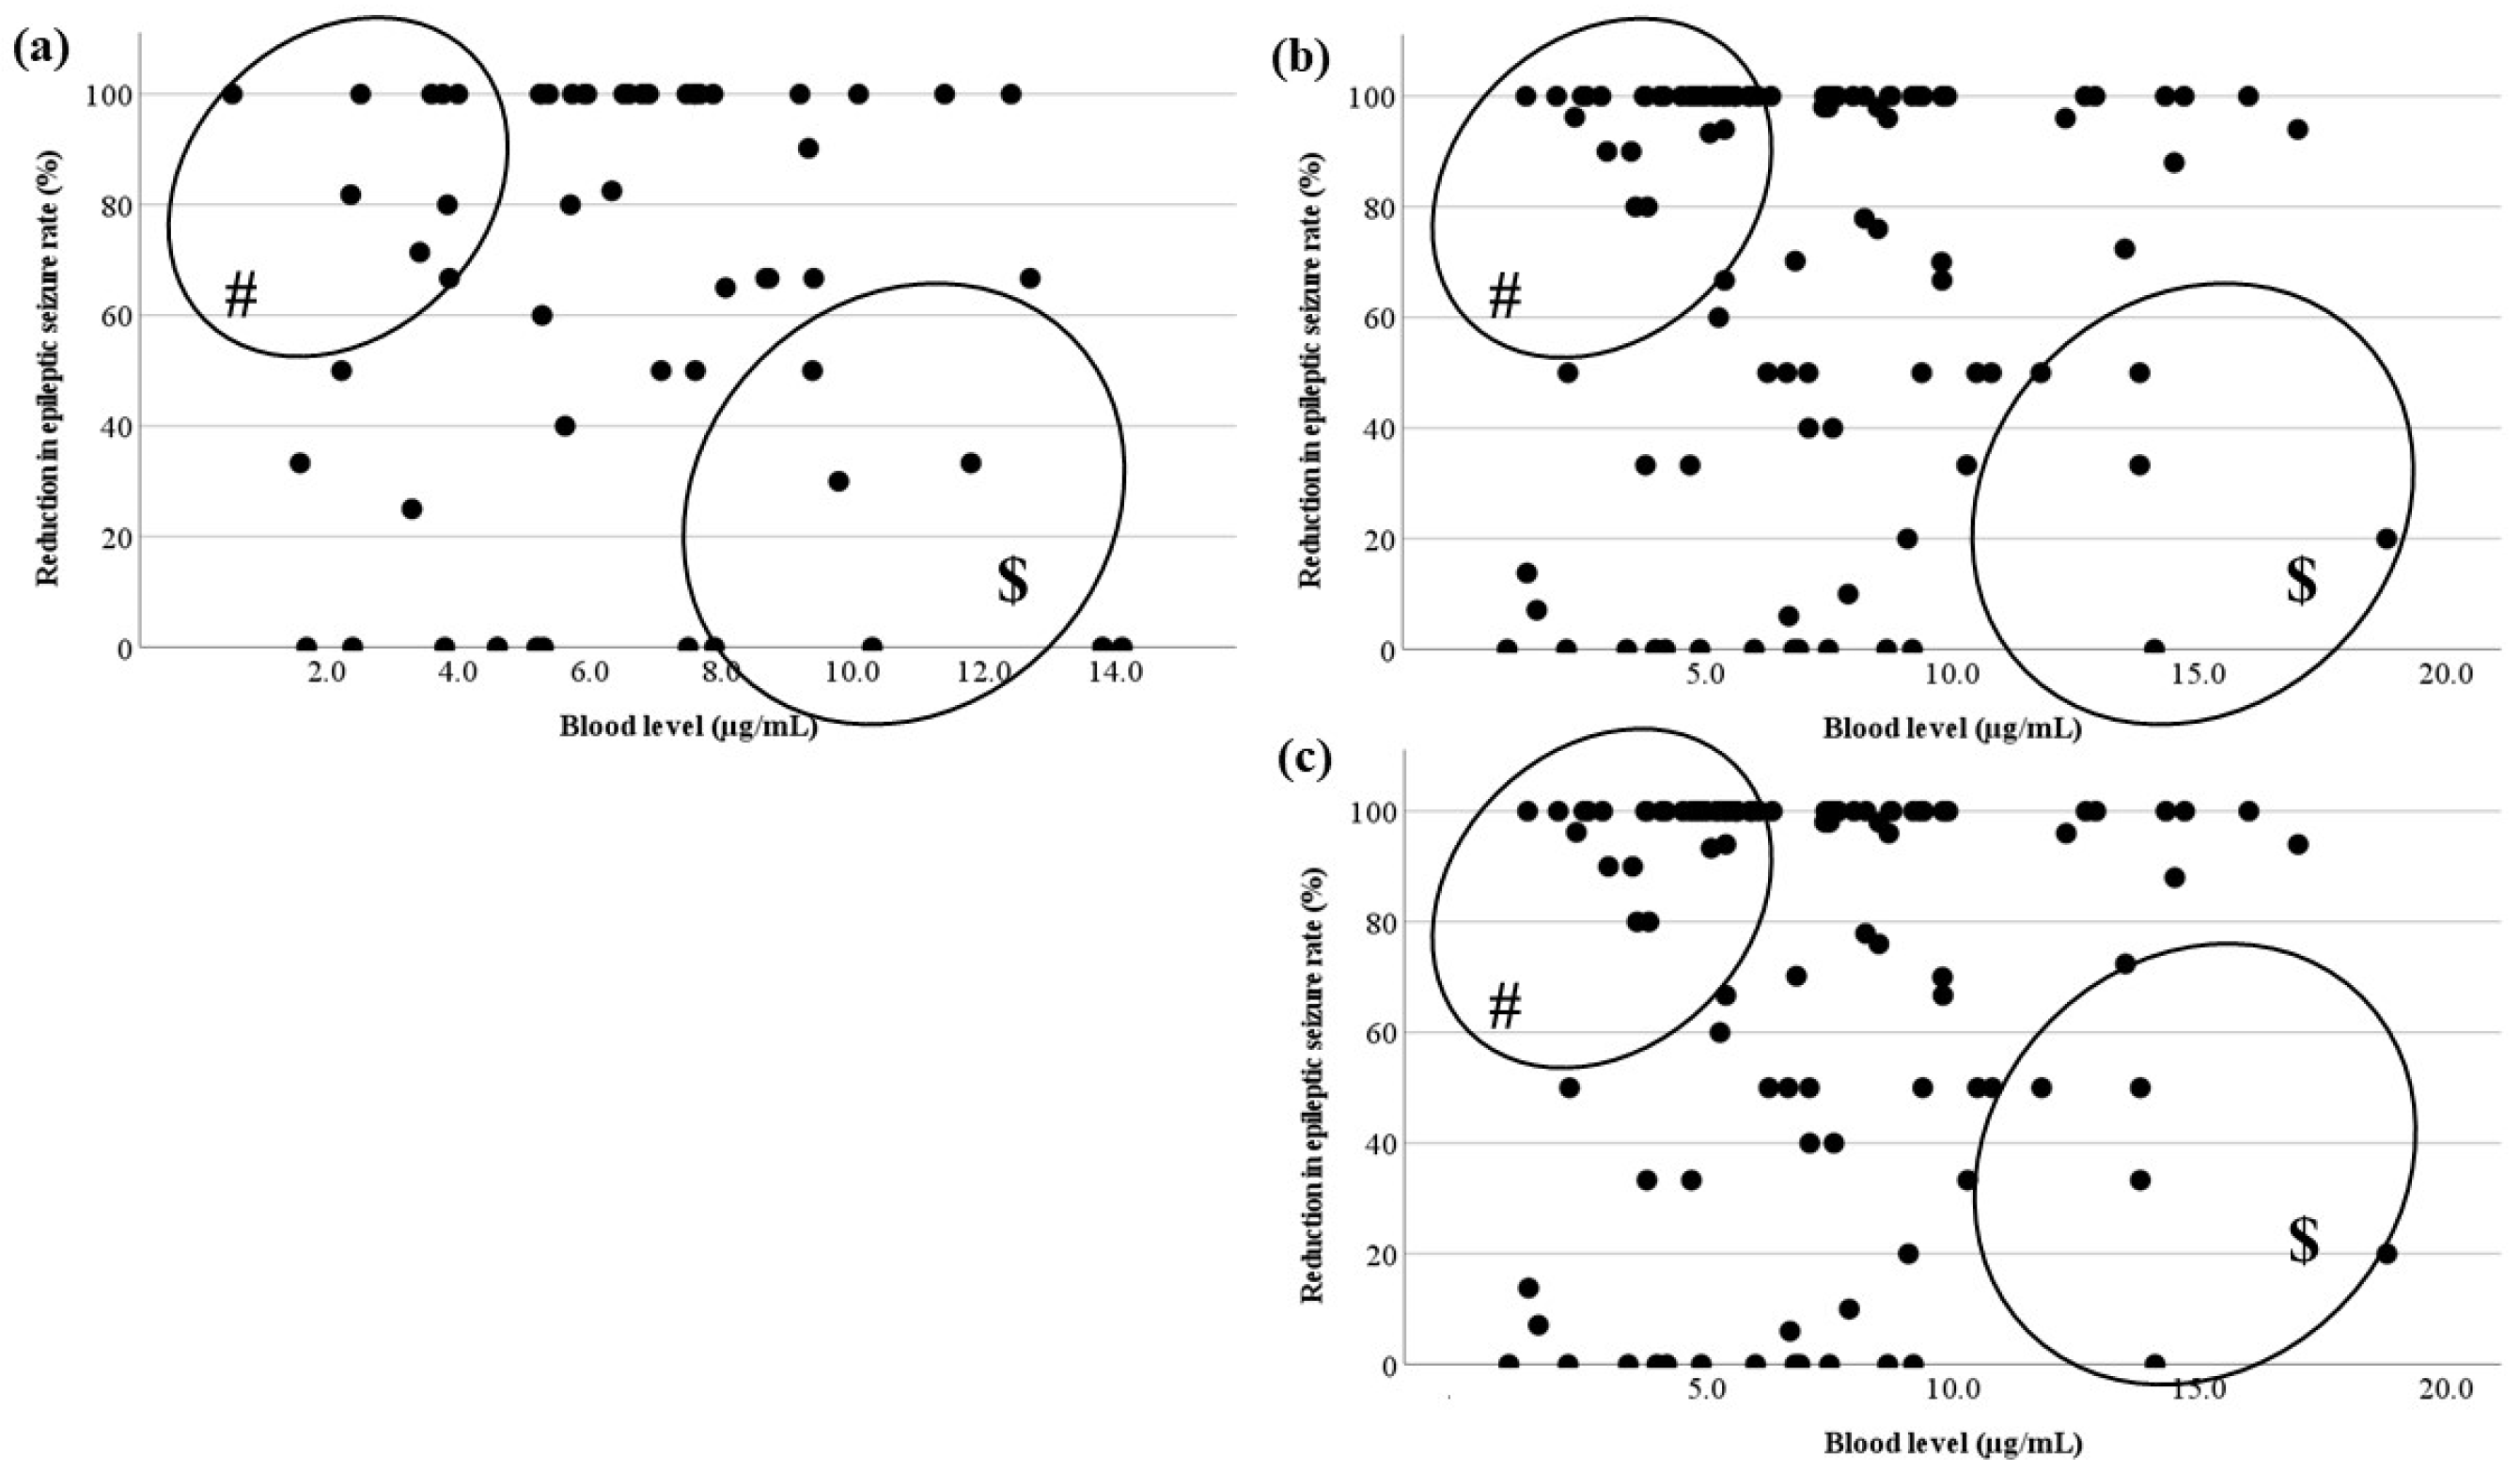
Figure 7.
Comparisons of LCM blood levels between the effective and ineffective cases. There is a significant difference between effective and ineffective cases at all points. The optimal range encompasses the range in which the blood levels of the effective cases and the ineffective cases do not overlap. (#) For the actual level, the optimal range is 8.0–10.5 µg/mL. ($) The optimal range of the trough level is 6.5–8.0 µg/mL.
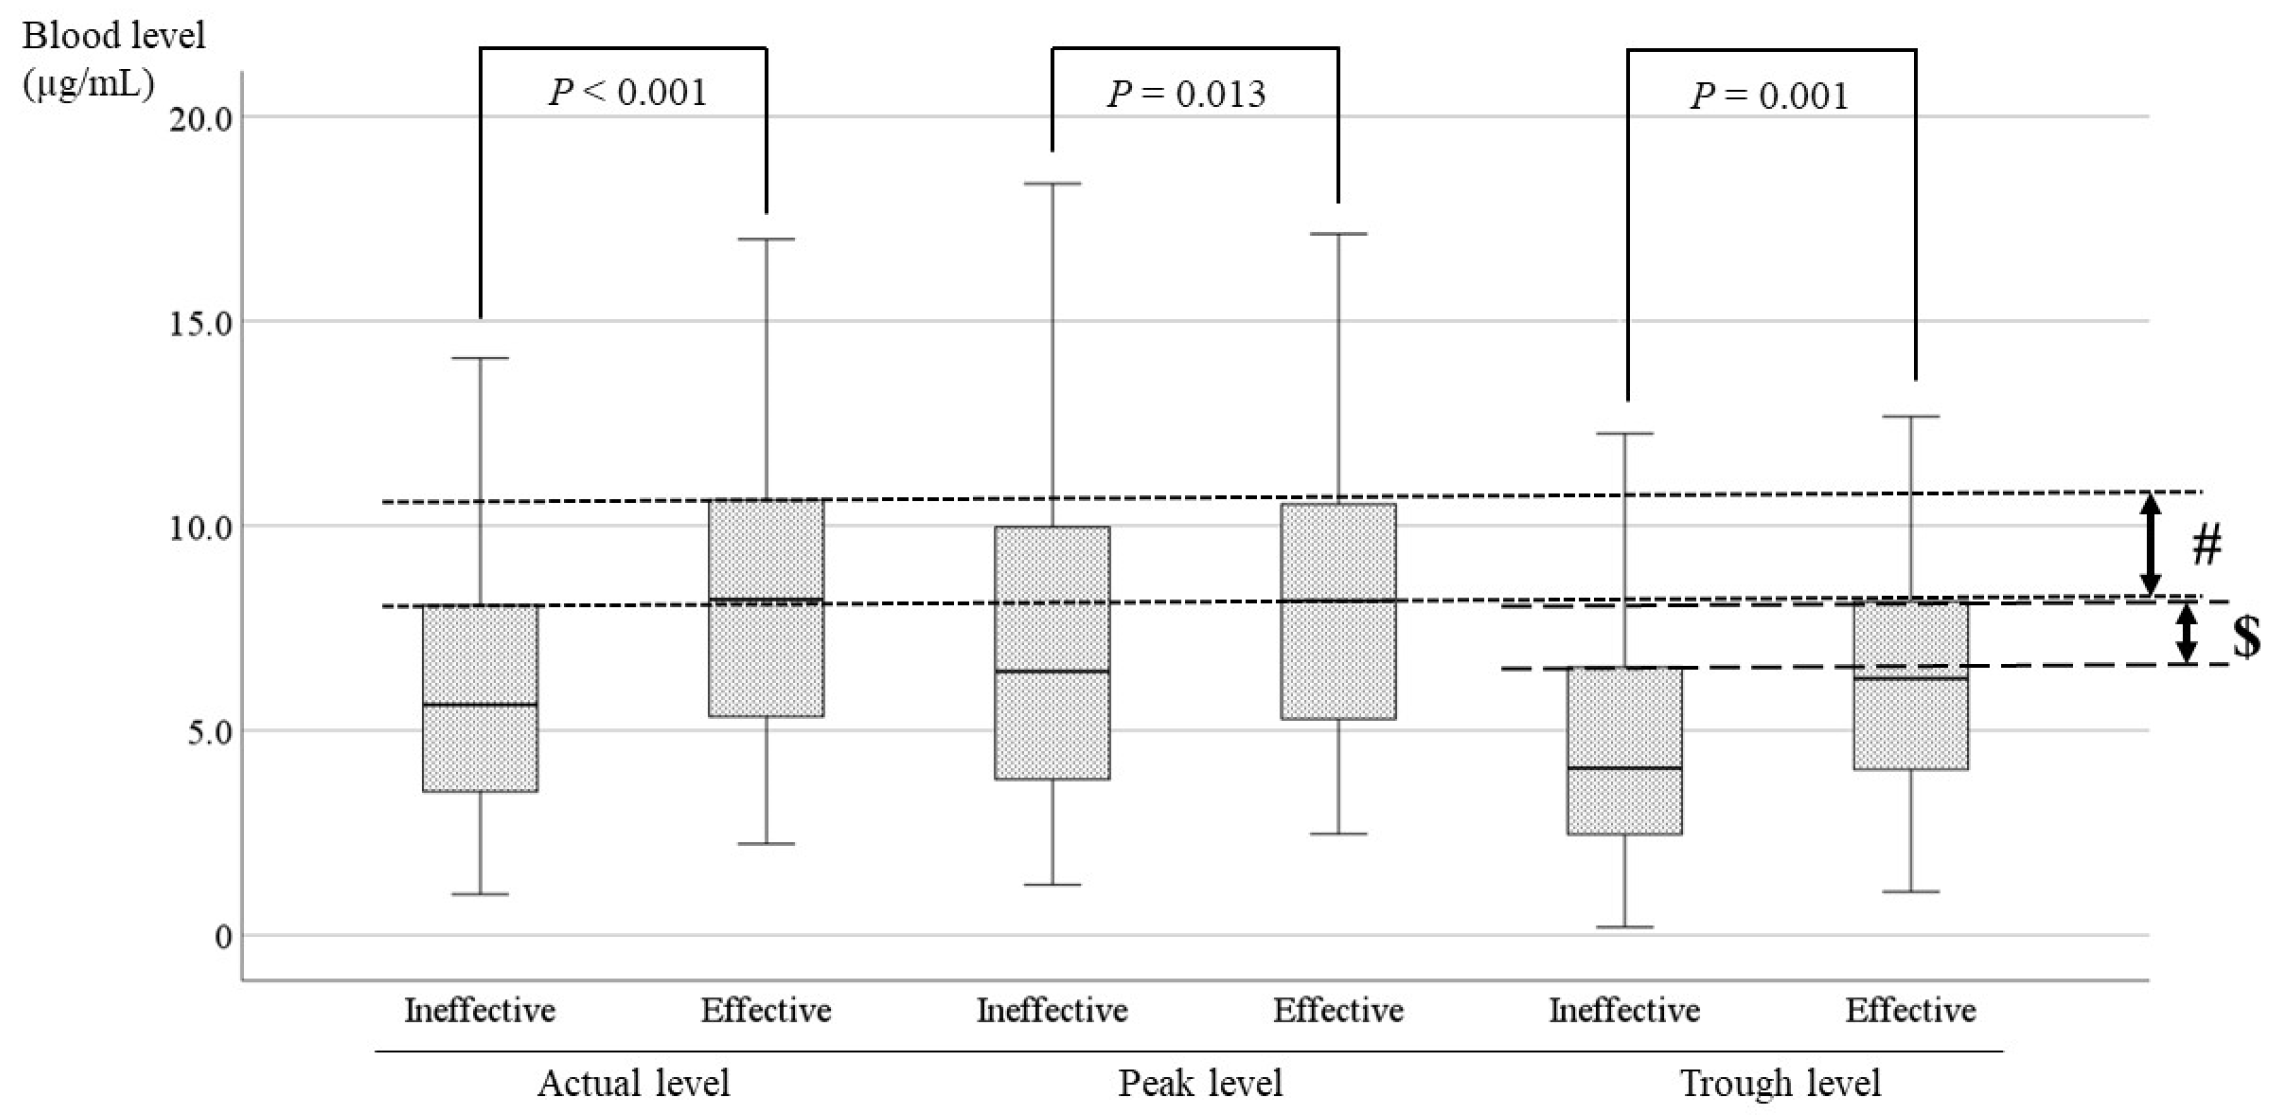
Figure 8.
Comparisons of LCM blood levels between the effective and ineffective cases with FBTCS. The blood levels at all points of the effective cases are significantly higher than the blood levels of ineffective cases. (#) In the actual level, its optimal range is 7.5–12.0 µg/mL.
Figure 8.
Comparisons of LCM blood levels between the effective and ineffective cases with FBTCS. The blood levels at all points of the effective cases are significantly higher than the blood levels of ineffective cases. (#) In the actual level, its optimal range is 7.5–12.0 µg/mL.
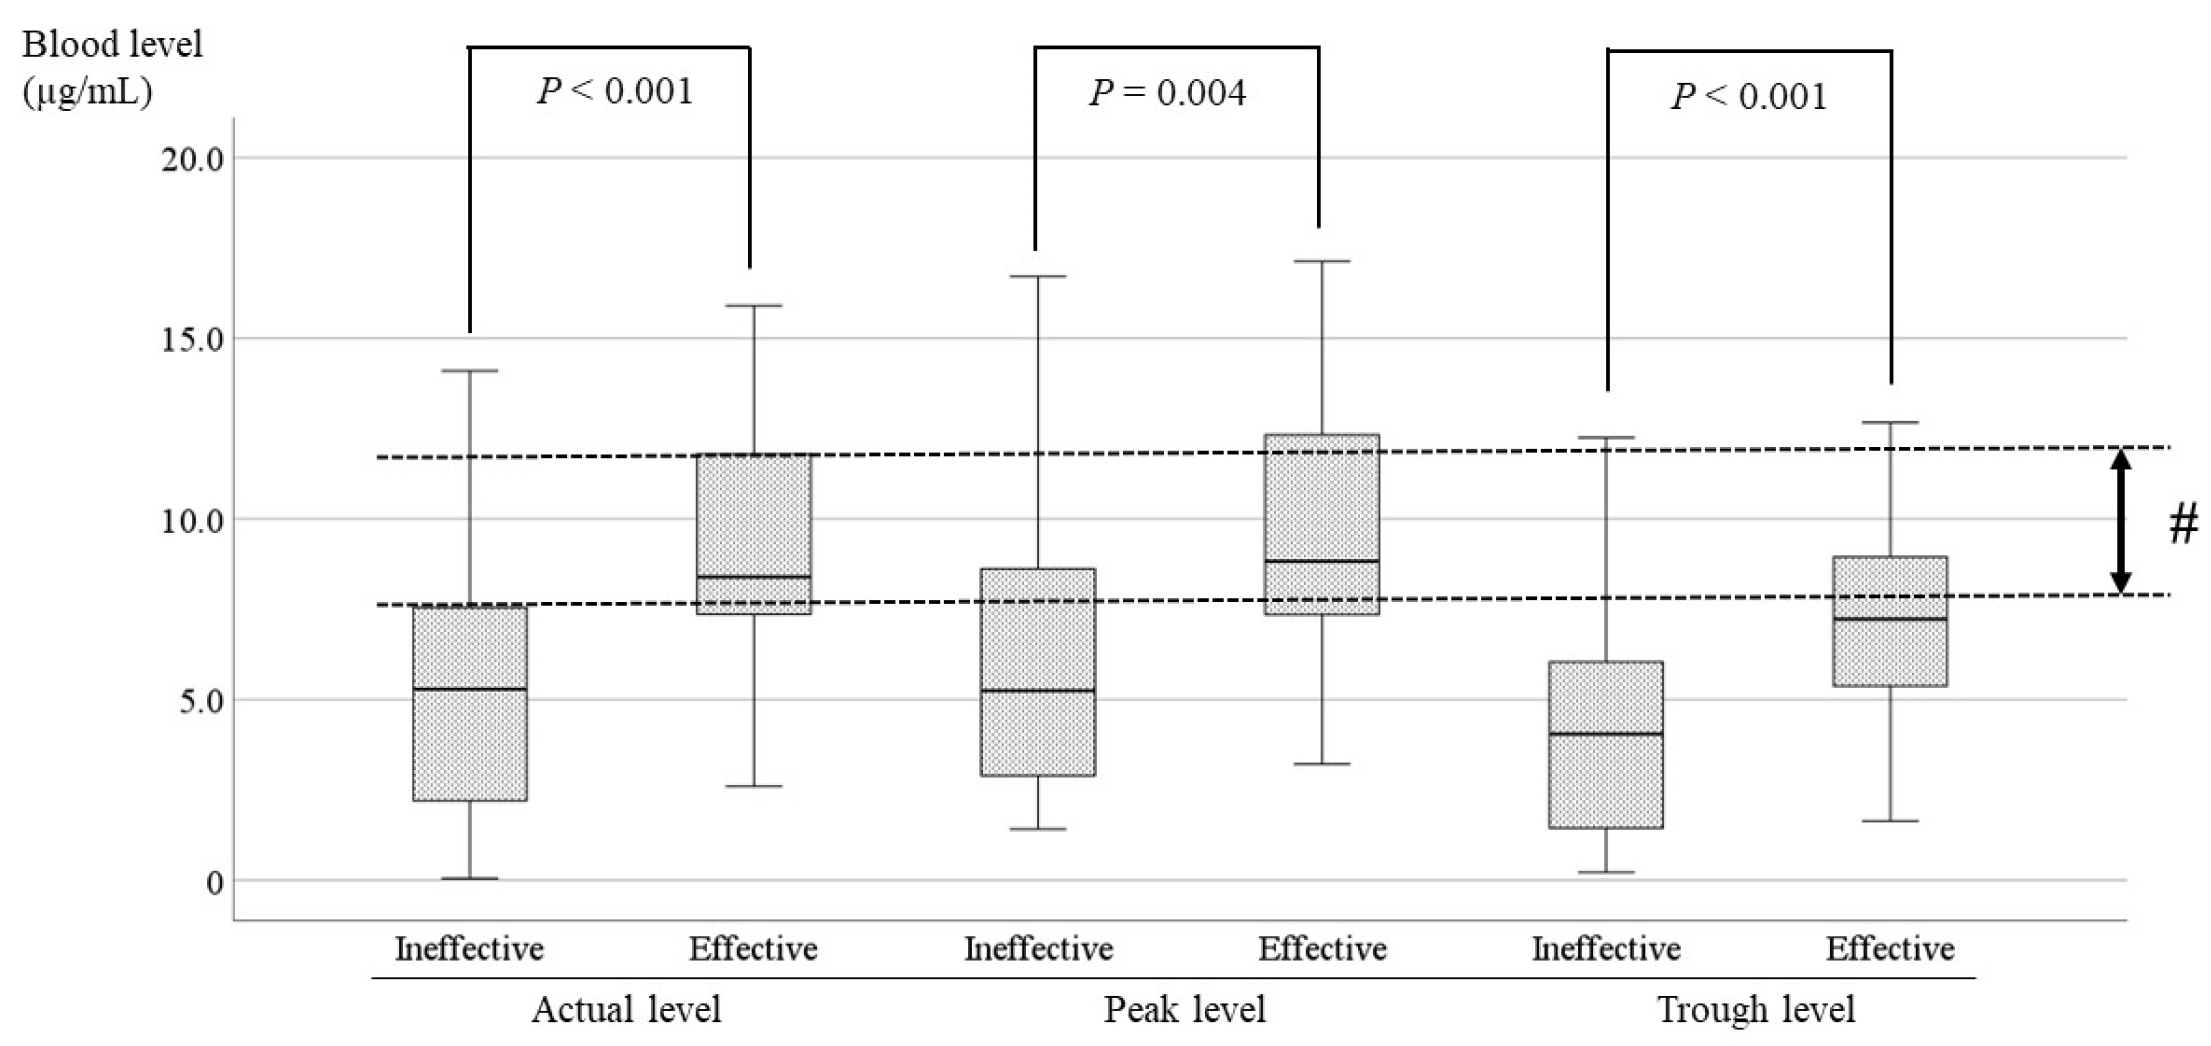

Table 1.
Details of patients on LCM treatment.
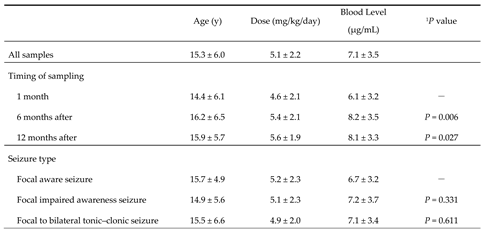 |
Data are mean ± SD values, 1Wilcoxon signed-rank test. LCM, lacosamide.
Disclaimer/Publisher’s Note: The statements, opinions and data contained in all publications are solely those of the individual author(s) and contributor(s) and not of MDPI and/or the editor(s). MDPI and/or the editor(s) disclaim responsibility for any injury to people or property resulting from any ideas, methods, instructions or products referred to in the content. |
© 2024 by the authors. Licensee MDPI, Basel, Switzerland. This article is an open access article distributed under the terms and conditions of the Creative Commons Attribution (CC BY) license (http://creativecommons.org/licenses/by/4.0/).
Copyright: This open access article is published under a Creative Commons CC BY 4.0 license, which permit the free download, distribution, and reuse, provided that the author and preprint are cited in any reuse.


