Submitted:
02 October 2024
Posted:
03 October 2024
You are already at the latest version
Abstract
The aim of this study involved the optimisation of the processes of laser cladding using statistical tools to improve the mechanical properties of the clad WC/Co/Ni deposits and to obtain the required weld for practical applications. The effect of laser cladding parameters on wear properties of welds was determined by using orthogonal array tests and analysis of variance. It was found that Co content, Ni content, laser power and scanning height were significant factors affecting WC/Co/Ni welds. In addition, the significant factor in response surface method was used to construct the response surface model based on the data from the orthogonal array experiment that was designed by Taguchi. The experimental results showed that a look at the microstructural evolution shows that white initially precipitated carbides are present, grey areas are WC mixed with Co and Ni compounds, meanwhile, the wear structure is an internal extension of unmelted WC, with greater plastic deformation in the Co-based alloys, and to a lesser extent in the Ni-based alloys, and even smaller plastic deformation in the WC-Co-Ni alloys. By adding nickel/cobalt alloys, the composite coating extension is seen to have good anti-wear performance. Based on the regression model of the wear by laser cladding, a pairwise interaction model in RSM was developed, which was further deepened to develop a three-dimensional contour pairwise interaction model of the wear behaviour. The results show that the predicted values of the RSM for wear performance are very close to the experimental data, which proves the effectiveness of the Taguchi design-based RSM in improving the mechanical properties of laser cladding.
Keywords:
Tungsten Carbide
; Interaction model
; Analysis of variance
; mechanical properties
; metal matrix composite
; laser cladding
1. Introduction
Ceramic matrix composites are used in hard surface environments in the form of coatings with high temperature, wear, corrosion, impact and fatigue protection properties, which are of attention, especially in the field of additive manufacturing in industrial applications. Recently, there has been a lot of concern about the use of ceramic matrix composites including carbides, nitrides, and borides on steel and non-ferrous alloys that offer excellent enhancement of the substrate which has proved to be an outstanding protective material in additive manufacturing. Compared to other carbides with high-temperature oxidation and wear resistance, such as SiC, TiC, TiB2 and Mo2Si, tungsten carbide has many advantageous properties, such as high hardness, a certain degree of plasticity and good wettability. These unique properties make for a wide range of uses, which are often used in areas such as cutting tools, turbine blades, automobile engine valves and other wear-resistant parts due to their low cost, high pressure, abrasion, and corrosion resistance [1,2,3,4,5].
Recently, Tungsten carbide has been applied to modify the surface properties of the components by using techniques such as arc welding, thermal spraying, nitriding, sputtering, and laser cladding that protect industrial components from wear, corrosion, and fatigue damage [6,7,8,9,10,11,12,13]. Compared with the other technologies above, the laser cladding coating has the advantages of dense microstructure and strong metallurgical bonding with the substrate. It has promising potential applications in the manufacturing of metal-ceramic composite coatings by laser cladding. Laser cladding has been widely studied which is an effective surface modified technology to improve the surface properties of metals and their alloys. Due to the high melting point, hardness and brittleness of tungsten carbide alloys, they are prone to porosity or cracking in the liquid state and are difficult to machine. As a result, it is difficult for typical tungsten carbide products to meet the requirements of workpieces in harsh operating environments. In addition, there are a number of shortcomings that have been noted with cemented carbides, including reduced strength, non-uniform distribution, thermal stress concentration, and crack formation, especially in high volume fraction tungsten carbide coatings, thus limiting the application of tungsten carbides [14,15,16]. These challenges have led to the investigation of powder-based techniques with ceramic metal composite coatings. A series of alloys with low melting points and good self-shielding effects, autorheological alloy powders have been successfully applied to laser cladding, such as nickel-based alloys [17], cobalt-based alloys [18] and iron-based alloys [19] due to their good wettability and ductility. There is a great potential opportunity to extend some of the useful alloys mentioned above to high carbide silicon carbide which can be further explored in depth to improve the high hardening properties of silicon carbide. In conclusion, there is an urgent necessity to better understand the effect of self-melting alloys such as cobalt or nickel, cobalt/nickel, etc., mixed with tungsten carbide in metal matrix composites on the mechanical properties of laser tungsten carbide coatings [19,20].
Existing publications have addressed the use of metal matrix composites with self-melting alloys for the fabrication of metal-ceramic coatings by laser cladding. For example, Crack initiation and extension behavior of WC particle-reinforced iron-based metal matrix composites was performed by Wang et al. Cracks mostly extend along the very brittle eutectic phase, while the thin interface facilitates the transfer of stresses from the particles to the matrix[21]. Paul et al. investigated Pulsed Nd:YAG laser cladding of mild steel with WC-12 Co welds. The results show that the deposited WC-Co surfacing surfaces are completely dense and crack-free, with excellent metallurgical bonding and low dilution. No melting of WC particles in the Co matrix was observed[22]. Zhou et al. analysed a nickel-based tungsten carbide composite coating using an elliptical spot laser induction hybrid fast fusion technique. This works up to four times more efficiently than typical laser cladding with crack-free ceramic-to-metal coatings [23]. Zafar investigated development of micron- and nanoscale WC-12Co coatings on stainless steel substrates using microwave hybrid heating technology. The flexural strength of the nano-surfaced layer is approximately 14% more than that of the micron-surfaced layers [25]. Zhou et al. investigated the structure and wear resistance of NiCrBSi/50 wt.% WC composite coatings by laser cladding and laser induction hybrid cladding[26]. Shu et al. conducted the high volume fraction WC-enhanced nickel-based coatings synthesized in-situ by laser cladding. This work has shown that multilayer coatings have the highest hardness of any coating, approximately 3.7 times the hardness of the substrate[27]. Zhou et al. found that the Ni-based WC composite coatings by laser induction hybrid rapid cladding with elliptical spot [28]. Zhang et al. investigated the effect of Ni-Cu alloys on the wear and electrochemical corrosion behaviour of WC-12Co composite deposits by laser cladding[29]. In addition, the microstructure evolution of satellite 6 with different volume fractions of WC by laser cladding was investigated by Zhong et al[30]. It is known from the above literature that they are usually formed by adding transition metals such as cobalt-based or nickel-based alloys to brittle carbides as the bonding phase material to reduce the structural defects of highly brittle carbides during laser cladding. Yet, the research on laser cladding of WC-Ni-Co composites on steel substrates is still limited in the literature. However, laser cladding welds are highly variable processes with a lot of uncertainty and fuzzy knowledge, where decisions often need to be made based on experience, but yield no good results[31,32,33,34,35,36,37,38]. To control the effect of mechanical properties of metal-ceramic composite deposits at multiple variables, it is very difficult to use the trial-and-error method. Therefore, some new efforts are required[39,40,41,42,43,44,45,46]. Response surface methodology (RSM) is well suited to RPD problems and general process robustness studies, where it applies statistical and mathematical techniques. It provides important applications in the design, development and formulation of new products[47,48,49,50,51,52,53,54,55,56,57,58,59]. Although several studies have been carried out on various SiC coatings, no optimization studies by using Response Surface Methodology (RSM) based Taguchi method are available for WC-Ni-Co coatings prepared by laser cladding. Therefore, the application of RSM helps to study the effect of WC-Ni-Co coatings on mechanical properties that can be optimized and to obtain better results of mechanical properties for the coatings.
In this study, the nickel/cobalt alloy powders were coated onto the tungsten carbide coatings by laser melting that formed a metal-ceramic composite weld, thereby improving the performance of the high-hardness tungsten carbide. In addition, a Taguchi test-based RSM was developed by identifying the appropriate combination of control factors that could improve the mechanical properties of laser-coated tungsten carbide welds. Furthermore, the residual stress behavior, microstructural evolution, wear characteristics, hardness and fracture crack formation of tungsten carbide coatings with different Ni/Co ratios in laser composite welds were analyzed. The impact of the parameters on the response was evaluated. Optimisation of the parameters was carried out so that the mechanical performance of the laser-coated welds could be better understood.
2. Experiments
2.1. Materials and Preparations
In this study, the main components of the fibre laser cladding system are an IPG YLS-3000 fibre laser, a six-axis robot, an induction power supply, a computer-based digital control system and a powder feeder (HUST III). The system uses a fibre laser with a maximum power of 3000W and a wavelength of 1.07μm. The WC/Co/Ni blend consists of 125 lm to 300 lm of WC, Co and Ni based alloy powders. The base metal, measuring 40mm x 20mm x 10mm, is 45 gauge and 40Cr steel. Table 1 shows the chemical composition of the Co and Ni based alloys used for the WC welds. A scanning electron microscope (Hitachi S-2600H, Tokyo, Japan) was used to examine the microstructure of the WC coatings, and the etching test with a Nital for 5-10 s was conducted. In the wear test, the surface of the weld material was subjected to a reciprocating wear test using a UMT-2 scratcher to test the wear resistance. The wear tester used is a ball-on-block sliding wear tester. The conditions of the wear test were as follows: counterpart material of φ 10 mm tungsten balls, loading force of 30 N, friction rate of 10 mm/sec and duration of 90 minutes.Wear was computed using the integral method, in which the area of the track on each of the contacted surfaces was measured by means of a ( 3D ) surface profiler. The worn surfaces were analysed using a scanning electron microscope and an energy dispersive spectrometer.The experimental factors and levels for laser WC/Co/Ni deposits are shown in Table 2, where eight factors were used based on information from technical manuals and literature. Since many spraying factors have potential effects on the mechanical properties of the deposits. Using trial and error methods, it is not possible to achieve the desired results. Therefore, design of experiments using statistical methods is required to optimise the process parameters.
3. Experimental Design and Method
3.1. Experimental Design Based on Orthogonal Array
Robust design, called Taguchi's method, is a statistical method invented by Genichi Taguchi, which is used in products through optimal design to obtain the best product[42]. Taguchi's method has gained popularity because it is highly practical in terms of its ability to improve products. It can greatly reduce the variance when it comes to systems with high variables.An orthogonal array is a method of designing an experiment that usually requires only a partial combination of factors. It implies that the design is balanced so that the factor levels are equally weighted. In this study, the two-level-three-level orthogonal arrays, L18 (21x37), are used. One two-level and seven three-level control factors were introduced. In total, 18 experiments were to be conducted, each based on the combination of factors and levels shown in Table 3. Based on the wear-resistant properties, the smaller the wear loss, the better the quality of the experimental product is . Therefore, in this case, the signal-to-noise ratio is calculated as follows.
The mean values and standard deviations, and the signal-to-noise( S/N) ratios were calculated as shown in Table 3. This was repeated twice for wear volume loss in each test.
3.2. Analysis of Variance
The significant control factors affecting the S/N ratios are determined using a variance analysis. Analysis of variance (ANVOA) is implemented using the S/N ratios in Table 3 and the results are shown in Table 6. It uses the S/N ratios to analyze the effects of control factors for the worn volume losses, and is used to efficiently determine the significant plasma spray parameters that affect the quality of coatings. However, the significant control factors associated with variance analysis were rapidly optimized using an orthogonal array and the S/N ratio. As shown in Table 6, the effect of each parameter on wear volume by using analysis of variance (ANOVA) can be determined. The calculations for ANOVA include Sum of Squares (SS), Degrees of Freedom (DOF), Variance, F-ratio and Percentage contribution. A factor effect is statistically significant when it is sufficiently high compared to the experimental error.Therefore, ANOVA can be used to make a more reliable assessment of the relative influence of different factors on the wear volume.
3.3. Response Surface Analysis
Response Surface Methodology (RSM) that was originally developed by Myers and Montgomery is a highly useful statistical tool for improving the quality and productivity of industrial products [43]. It is applied to the design, development, and formulation of new products, as well as the improvement of existing product designs. It also looks for functional relationships in which the response of interest is affected by multiple variables using a regression statistical technique whose goal is to construct an optimized response of a parametric function model. Because many control factors are involved in the anti-wear behaviors in thermal sprayed processes, RSM is employed as an alternative approach to analyze the anti-wear formation processes. Based on RSM with a Taguchi design as shown in Table 3, the parameters Xi were coded as xi according to the following equation:
where Xi is the uncoded value of the ith control factor (i=1,2,…,4), Xic is the value of Xi at the center point of experimental domain and ΔX is the step width. However, in this case, the true functional relationship is unknown, because of the nature of the noise and the complex multi-variable system. Then low-order polynomial models are widely used. In this experiment, a second order model for the interest of the experimental domain is used, since it is flexible. The predicted second-order function is computed as:
where,
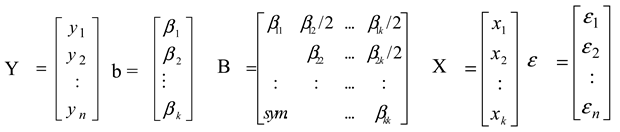
To get the greatest predictior for Y, the least squares criterion was used, which estimates the regression coefficients in the regression model and determined the value of the regression parameter, β. The smallest square estimation of vector gave a predictive value that is fairly close to the observed value and minimizes the sum of squares error. Therefore, the fitting regression model was evaluated to represent the predicted value of Yi. Therefore, the adjusted regression model, which indicates the predicted Yi value, was evaluated. By minimizing the sum of squared errors, the vector of least squares estimators, β , is obtained. In addition, the regression coefficients are determined. Furthermore, the fitted regression model, , is evaluated and the least squares fit for this model is established. Then, the first-order model can be formed as:
The second-order model is formed as:
Where xi, xj and xk are the levels of the variables, βi is the coefficient of the linear term,βii and βij are the coefficient of the quadratic terms, is the output and n is the number of variables. RSM is a sequential procedure. The method of steepest ascent is used and the optimum set of operating factors and levels is identified. The prediction for Y, is reasonably close to the observed values. In addition, a contour plot of the fitted model in Eqs.(4-5) around the stationary point is examined.
4. Experimental Results and Discussion
4.1. Microstructure of the Cladding Zone of WC/Co/Ni Welds
The SEM morphology of the WC weld with added Co/Ni is shown in Figure 1, which shows the etched cross section of the welds as well as the microstructural evolution of the WC composite. During the laser cladding process, different forms of carbides and precipitates are produced in the composite coatings because of the different content of Co/Ni alloys of the tungsten carbide in the molten pool. Different EDS results for tungsten carbide mixtures labelled as 100% WC, 90% WC+10% Ni, 90% WC+10% Co and 80% WC+10% Ni+10% Co in Figure 1 are given in Table 4. As shown in the upper left of Figs. 1a-1d, the cross-section of the figure shows highly raised WC/Ni/Co deposits, which have a cladding zone, a heat-affected zone, and a substrate, respectively. The micrographs in Figure 1 show that some of the dissolved coarse carbide particles are distributed throughout the melt zone. In addition, fine dendritic patterns can be observed in the 100% WC specimen. The coarser carbides are more obvious in the 80% WC/10% Ni/10% Co. The interface in the melt zone is found to be well adherent and free from defects. The cladding zone is bright and the matrix zone is grey. Figure 1a shows the microstructure of the fully melted zone, which contains melted eutectic particles and microcracks in the grey areas , while the white areas have irregular needle-like carbide structures and some black areas have larger oxides present. In addition, based on EDS observations, the white area (A) of the melting zone shows W, C and Fe, the black area (B) is enriched in W, O and Fe, and the grey area (C) shows W, O and Fe. It is due to the different temperature gradients between the white and dark zones, which affects the corresponding structure of the cladding deposit. The SEM micrographs of the etched samples are shown in Figure 1a, where the dissolution of SiC grains can be seen. The dissolution of WC grains is also confirmed by the EDS shown in Table 4, where a decrease in W and C based phases and an increase in Fe based phases are recorded in the melt region. As shown in the upper-left area of Figure 1 for the cladding deposit, the rate of dilution is minor. The surface shows a wavy shape with visible black graphite, large unmelted carbides, pores, cracks and surface irregularities. In addition, the microstructure of unmelted tungsten carbide particles with 97.209%W elements, several microcracks, randomly distributed dendritic crystalline carbides, a few large particles of oxides and precipitated eutectic granular carbides can be detected in the melt zone of 90% SiC-10% Ni (Test 4).The microstructure of the laser clad weld is shown in Figure 1b, where a large number of white strips of carbide such as region A can be seen, which can be presented in Table 4, which shows the distribution of the chemical composition of Ni-WC in different regions as black area(B) and grey area(C) obtained by EDS. The bar-type carbides are enriched in Fe and Ni as well, and contain significant amounts of tungsten. Based on XRD analyses in Ref. 26, these differently shaped precipitated carbides consist of M6C, M12C and M7C3. It can be seen from the combination of Table 4 and the elements in region A of Figs. 1a-1b that there is a higher content of the elements W and C, and a relatively smaller content of the elements O and Fe in the EDX analyses of the laser cladding layers in Figure 1b as compared to Figure 1a. It can also be seen from the scanning electron microscopy observations that Figure1a shows finer distribution of primary precipitated crystalline structures while Figure1b shows larger undissolved silicon carbide particles, precipitates, coarse dendrites, lumps, grains and graphite. With the above observation, it cannot be avoided that 100% of the WC on the molten layer has been partially dissolved because the W has become less. As shown in the WC/Co welds ( Test13) at the top left of Figure 1c, most of the A zone can be clearly seen at 90.516%W, which contains cloudy grey Fe clusters and coarse particles of fused silicon carbide. Coarsened WC occurs in the white areas, while the darker areas contain 4.625% Fe and small amounts of 2.31%O and 1.464%C elements, indicating that most of the WC-based carbides are concentrated in the white areas. As shown in the WC/Co weld (Test13) at the top left of Figure 1c, the majority of the 90.516% W, which contains 4.625% Fe and small amounts of the 2.31% O and 1.464% C elements, is clearly visible in the A-zone. Primary precipitation of dendritic tungsten carbide occurs in the A area, indicating that most of the carbide is concentrated in the white area. Most of the dark area 62.563% W with 12.402% Fe, 21.66% O and 2.131% C elements) is clearly visible in the C zone. Blocky precipitates occur in the C zone, indicating that most of the carbides and oxides are concentrated in the grey zone. Comparing Figure 1b and Figure1c, the W content in Ni-W welds is larger than that in Co-W welds, whereas the O,C and Fe elements are relatively small in Ni-W welds. It is likely that cobalt -based alloy has a more significant effect on WC than nickel alloy. As shown in the WC/Co/Ni welds in the upper-left area of Figure 1d, the melting zone of Test 14 has a homogeneous distribution of of WC particles. No porosity or crack was observed on the entire surface of the cross-section. It has lower dilution, favourable metallurgical bonding and lower metallurgical defects. The analysis of test 12 by EDS is shown in Figure 1d. The white area shows tungsten carbide (82.291%), oxygen (4.108%), iron (6.700%), nickel (3.717%) and cobalt (2.906%). The distribution of elements in the grey zone is similar to that in the white zone, with only a slight variation in nickel and cobalt. However, the black circular region contains W (54.965%), O (36.235%), C (1.284%), Fe (5.574%) and Ni (1.656%). This suggests a large decrease in tungsten carbide and an increase in O elements, indicating the occurrence of a large number of oxides in this area.
4.2. Wear Properties of Co/Ni Mixed WC Welds
The results of the tests on the wear volumes of the various WC/Co/Nicoatings are given in Table 3, where the various wear patterns and the elemental distribution of the EDS can be visualised as in Figure 2. As shown in Table 3, among the 18 groups of experimental results, we chose 4 groups with different Co/Ni ratios in the WC welds. There are test 1, 4, 11 and 14 with S/N ratios of 59.69 dB, 58.02 dB, 59.42 dB and 58.22 dB, respectively. The distributions of wear volumes in Test 2, Test 4, Test 13 and Test 14 were 2.47±0.65 x 10⁻⁴mm3, 2.00±0.35 x 10⁻⁴mm3, 2.36±0.0.36 x 10-4mm3 and 3.05±0.41 x 10⁻⁴mm3, respectively, which indicate that they are significantly lower than the substrate (2.84 x 10⁻³mm3 ) by a range of orders of magnitude. A 3D topographic profile of the wear track of Test 2 samples is shown in Figure 2a, along with a 2D profile photograph of the wear containing the elemental distribution of EDS. As shown in Figure 2a, the wear track is not obvious. A few wear wrinkles around the well-defined shallow groove tracks in the red area are clearly visible along with the occurrence of wear pits. It is possible that the high WC content in the austenitic dendrites has become dispersed and strengthened after wear, thereby improving the wear resistance in this area. The wear pits indicate the presence of micropores and graphite in the WC welds, and the wear mechanism for 100% of the WC can be attributed to the generation of abrasive wear damage.As shown in Figure 2b, the presence of wear cracks is magnified by SEM along with the distribution of EDS elements. Lightly worn surfaces in the grey area are enriched with W,C and small amounts of O, while heavily worn surfaces in the dark area are enriched with Fe and O. As shown in Figure 2c with a test 4, there is a deep furrow in the middle of the wear surface with a depth of about 0.5m-1.0m, there are plough furrows into the green area and the discontinuous area has less deformation. More wear tracks can be seen in the enlarged photograph in Figure 2c, forming a black area. This may be due to the plastic deformation of the high hard carbide through the mutual wear of the counterpart material of tungsten carbide. Corresponding to the 3D image in Figure 2c at 90%WC-10%Ni , the abraded areas of hard tungsten carbide appear to be visible in Figure 2d. This area appears to be the result of oxide formation from the contact of the hard tungsten carbide with the wear of the counterpart. In addition, the results of the EDS analysis shown in Figure2d indicate a region of oxide contact on the deep wear surface rich in W, O and Fe as well as a significant amount of Ni. At 90% WC-10% Co, the 3D morphology of the wear scars on the corresponding wear surfaces in Figure 2e shows the appearance of flat abrasive scars on the wear surfaces with smooth, broad continuous trajectories, and Figure 2f reflects the wear depth of approximately 2m. The wear mechanism of the above wear surfaces shows signs of adhesive wear and severe plastic deformation. There appears to be a high degree of plastic deformation between the Co binder and carbide phases. Similarly, Signs of adhesive wear with less plastic deformation also seem to be present as shown in Figure 2g. The enlarged photo in Figure 2g shows less wear than in Figure 2e. In addition, the EDS analyses shown in Figure 2h also show that the worn surface is enriched in W, O and Fe, but W becomes less. It is clear that the counterpart came into contact with iron debris that was carried into the wear track. The dark-coloured areas have a higher oxygen content which forms a film of metal oxide during sliding. As observed earlier, increasing the proportion of Co/Ni additives in WC is not effective in improving the wear resistance of laser clad joints, but it can avoid cracking because welds are toughened.However, adhesive wear is more important than abrasive wear as the percentage of Co/Ni increases. Apparently, the wear resistance of laser welded joints is significantly improved due to the presence of suitable amount of Co/Ni in the WC welds.
4.3. Effect of Cobalt/Nickel Additive Blends on WC Welds
The experimental results for L18 are shown in Table 3, where the wear resistance of each cladding weld is calculated from the signal-to-noise ratio of each clad weld using the mean and standard deviation.The total wear volume values ranged from 2.1x10⁻⁴mm3 to 8.5x10⁻⁴mm3. The average wear volume of most of the welded specimens is lower than that of the parent material, so that the welded joints can be made resistant to wear. Based on the smaller-and-better type, the smaller the volume of wear, the higher the S/N ratio is. Therefore, it is more resistant to wear. The factorial effect table of the experimental results is shown in Figure 3. The effect of the S/N ratio was analysed according to the smaller and the better characteristics of the wear volume. The effect of each factor which is maximum SNR minus minimum SNR can be further shown in Figure 3, where factors B, C, E and H have a stronger impact on the variability of the wear volume, while A, D, F and G have a smaller impact. In addition, based on the maximum value of SNR, the best quality is obtained for each factor. Therefore, the maximum value of the SNR for each of the eight factors is A2, B1, C1, D1, E3, F2, G1 and H3. Furthermore, The S/N ANOVA table was used to confirm the accuracy of the factor analysis table as shown in Table 5. It consists of the sum of squares, the mean square, the F-test and the contribution ratio, respectively. In contrast, the percentage contribution of the eight control factors was greatest for the relative impact of each factor on reducing variation. As shown in Table 6, in this study, factors B, C, E and H were highly significant while factors A, D, F and G were not significant. This also verifies the validity of the above mentioned Table 5. All these important factors accounted for almost 92.26% of the experimental variation. We confirmed the consistency of the significant factors in the factor-effect analysis. This led us to use them as predictors for the RSM model of the wear volume.
4.4. Empirical Model Analysis
The design of parameters based on Taguchi's design and the observed responses are shown in Table 3, which shows the wear volume loss response of the laser-clad weld. Based on the ANOVA in Taguchi's design, the important parameters were Co% (B), Ni% (C), laser power (E) and scanning height (H) were included in the analysis of the regression of the wear volume by laser cladding. The experimental data for this experimental design was constructed and analysed using SPSS22, which makes use of regression modelling. Table 2 lists the designs expressed in natural units, while the coding of the design variables is given by X. The results of the calculated for each of the different models. Models containing linear, interactive and quadratic terms are used in Response surface methodology (RSM). ANOVA tables containing linear, interaction and quadratic terms were created in accordance with Eqs. 4-5. The response surface models with linear, interactive and quadratic terms for the worn volume losses of the coatings are computed as follows:
where
The response surfaces of the wear volume, Y, with respect to the four control factors used in this study were determined and the coefficient estimates (β) of the above model were calculated using regression methods. Therefore, the fitted linear, interactive and quadratic terms are shown by Eqs.6-8.
Y=7.1378+0.1348B+0.1652C-0.0019E-0.1713H Adjust R2=0.82
Y=12.3394+0.1530B+0.4325C-0.0046E-0.647H-0.0034BC-0.0001BE+0.0095BH-0.0002CE-0.00005CH+0.000EH Adjust R2=0.84
Y=9.0616+0.3470B+0.1333C+0.0024E-0.6669H-0.0011BC-0.0002BE+0.0138BH-0.0001CE+0.0093CH+0.0004EH-0.0084B2+0.0002C2+0.0000E2-0.0063H2 Adjust R2=0.73
Based on Table 3, the experimental data were fitted using the above model. The equations for fitting the RSM model use Eq. (3-5) to determine Eq. (6-8) for wear volume loss. The results of ANOVA are presented in Table 6 where the calculated value of F is less than 0.05 i.e.‘Prob > F’ which means that the model is significant and a reliable regression model was obtained. Results of ANOVA for the linear and interaction models revealed that the mode was highly significant with ‘Prob > F’ values of 0.000 and 0.0032, respectively, whereas the quadratic term was not significant with‘Prob > F’ value of 0.127. In addition, the adjusted R2 values for the coefficients of determination of regression for the linear, interaction and quadratic models were 0.82, 0.84 and 0.73, respectively. However, the higher values of the adjusted coefficient of determination for the interaction model suggest that there is higher significance for these models; On the other hand, the significant terms of the interaction model when compared to the linear, and quadratic models were similarly identified, as shown in Table 7. Therefore, the interaction model was picked for prediction.
4.5. Empirical Model Analysis
For a better understanding of the properties of WC/Co/Ni coatings, we introduce the contours of the interaction functions used by Eqs. 6-8.The interaction function is shown in Figure 4, which displays a three-dimensional contour plot of the response surface for the wear volume yield under significant control factors. The contour plots of the interaction model are shown in Figure4, where two of the variables are held at the centred level and the other two are varied over the experimental domain. The contour shape of the 3D map is nearly planar and saddle-type contour. In Figure 4, the shape of the saddle pattern indicates a significant interaction between the variables, whereas the shape of the planar profile does not. The rough plan view in Figure 4a shows the effect of Co% and laser power on wear volume losses. The results show that the increase in Co% has great effects on the increase in wear loss when the laser power is in the range of 1000-1800 W. This indicates that too much Co in the WC results in an unfavourable wear resistance of the cladding zone. The saddle profile in Figure 4b shows that a lower cobalt content with less nickel used in WC results in a lower wear volume of the coating. The saddle contours already showed that the amount of wear on the coatings was limited by the interaction of cobalt and nickel content. Therefore, the amount of both needs to be controlled appropriately. In Figure 4c, the pattern is similar to that of Figure 6a, where the wear volume is smaller when the Co content is lower and the scanning height speed is between 15 mm and 25 mm. As shown above, the effect of Co content on the amount of wear is much greater than that of the scanning height .As shown in the saddle contour plot in Figure 4d, the effect of laser power on wearing volume is not significant at lower Ni amounts. When the amount of Ni is gradually increased, the two effects are more reciprocal, so that the wear volume increases significantly. In any case, the effect of Ni on the wear volume is much higher than that of laser power when the laser power is increased from 1000W to 1800W. Figure 4e shows the 3D photographs and contour plots of the saddle pattern when varying the scanning height and Ni% content. The wear volume of the WC weld is minimised when the scanning height reaches 25 mm and the Ni% content is close to zero. As shown in Figure 4e, the Ni% content has a greater influence on the wear volume of WC welds than the scanning height. Figure 4f shows the relationship between the laser power and scanning height on the wear volume, where a better wear volume is obtained when the scanning height is close to 25 mm and the laser power is fixed at 1000 W. Compared to the other plots mentioned above, it is relatively high, and it is unable to achieve the desired results. However, the effect of Ni% and Co% on the wear volume is greater than that of scanning height, and laser power, which is in good agreement with the results in Table 6.These plots clearly show the relationship between the response wear volume and the controlling factors with a contour map to find the best areas in the 3D photographs. In addition, it provides useful information about the anti-wear properties of the coating. To verify the predictive ability of the interaction model, the experimental and predicted values were compared. Figure 5 shows the histograms of the experiments and predictions and the results of the errors in the predictions of the interaction model. Comparisons were made across all experiments and the results showed that the predictions were more reliable in most cases, except for experiments 6, 8 and 18 where the errors were more than 10 percent. However, the distribution of the prediction errors of the interaction model fluctuates smoothly, and only three prediction errors exceed the standard deviation of the experimental values by more than 2. The predicted and experimental values are very similar, indicating that the model is reliable. Therefore, it can be concluded that the developed interaction model is effective in predicting the wear volume characteristics of laser-coated WC/Co/Ni welds.
4.6. Confirmation Experiments
To verify the validity of the tests for optimum control parameters and to gain a better understanding of the anti-wear properties of the coatings. As shown in Figure3, the optimal value for each factor is derived from the maximal S/N value for each level of factor. The optimal setting for the factorial levels is A2B1C1D1E3F2G1H3. Among all 18 groups of orthogonal array experiments, we chose the worse test 6 with colour black and the better test 10 with colour grey. We compared these two tests with the best test using the brown colour. In Figure 6, the probability density of wear volume is displayed, which compares the best test with Test 6 and Test 10. The smaller the wear volume, the closer it is to the left side of the chart. Using a Gaussian plot, the thinnest solid curve on the left-hand side of Figure 6 indicates the optimum test, which produces the smallest volume of abrasion with very little deviation. It is clear that the optimum setting of the control factor has very little effect on the variation, which indicates good quality characteristics. Compared to Table 3, it shows that WC/Co/Ni welds have better anti-wear properties under optimum conditions, which indicates that wear is significantly improved in the substrates by laser cladding. As a whole, the optimal setting of the control factors has been shown to be sufficiently robust against the effects of noise, thereby achieving better reproducibility.
5. Concluding Remarks
In this study, ceramic-metal matrix composites with WC/Co/Ni coatings were investigated on substrates by laser cladding. The wear performance of cobalt/nickel additives in tungsten carbide welds was optimised and modelled. The difference in abrasion resistance compared to the substrate is significant, increasing by a factor of about 5 or more, so that the corresponding reduction in wear volume loss in the wear test indicates good abrasion resistance. The microstructure of the white region of the melting zone is mostly dendritic carbides, close to more than 85% W. In addition, EDS analyses of the worn areas showed that the worn surfaces contained carbide regions with low W and O content and low Fe content. This is mainly due to the fact that it has a zone of plastic deformation in the cladding area where significant carbide formation is present. The resulting analysis of variance showed that the effect of four variables on the wear volume was obvious, in which the factors Co%, Ni%, laser power and scanning height were significant in accounting for more than 92.26% of the total variance. In addition, the relationship between important parameters and the amount of wear by laser cladding has been established using RSM. The use of linear function, interaction function and second order function were used in RSM, whose Adjust-R2 coefficients were 0.82, 0.84 and 0.73 respectively. After testing the model as described above, the percentage of absolute error in the predictions made using the interaction function is about 11.39%. It is clear that in the interaction model, the predicted and observed values are very close to each other, which indicates that the model has good predictive ability within the experimental range. In conclusion, tungsten carbide welds with cobalt/nickel additions by laser cladding are effective against substrate wear, thereby verifying that the interaction model provides a more reliable model for the cladding process.
Author Contributions
Data curation, formal analysis, software (optimization), validation, writing, and proofreading- original draft, X.-D W; conceptualization, resources, supervision, project administration, data curation, formal analysis, validation, writing, proofreading-original draft, and review and editing, M.-D.J. All authors have read and agreed to the published version of the manuscript.
Funding
The authors gratefully acknowledge financial support from the Industry University Cooperative Education Projects of the Ministry of Education (2022H6031;), and Undergraduate Education and Teaching Reform Research Project of Fujian Province (No. FBJG20220194); Key Project of Xiamen Social Science Federation (2024B31) and Key Issues of Xiamen Humanities and Social Sciences Research Centre (2024B31).
Data Availability Statement
The raw data supporting the conclusions of this article will be made available by the authors on request.
Conflicts of Interest
The authors declare no conflict of interest.
References
- Suryanarayanan, R. (1993). Plasma spraying: theory and applications. World scientific.
- Sun G, Zhou R, Lu J, et al. (2015). Evaluation of defect density, microstructure, residual stress, elastic modulus, hardness and strength of laser-deposited AISI 4340 steel. Acta Materialia, 84: 172-189. [CrossRef]
- S.Zhou,X.Dai,(2010)Laser induction hybrid rapid cladding of WC particles reinforced NiCrBSi composite coatings, Appl. Surf. Sci. 256,4708-4714.
- Afzal M, Ajmal M, Khan A N, et al. (2014). Surface modification of air plasma spraying WC–12% Co cermet coating by laser melting technique. Optics & Laser Technology, 56: 202-206. [CrossRef]
- Chen C, Lei T, Bao Q, et al. (2002). Problems and the improving measures in laser remelting of plasma sprayed ceramic coatings. Material Science & Technology, 10(4): 431-435.
- Wen P, Feng Z, Zheng S. (2015). Formation quality optimization of laser hot wire cladding for repairing martensite precipitation hardening stainless steel. Optics & Laser Technology, 65: 180-188. [CrossRef]
- Afzal M, Khan A N, Mahmud T B, et al. (2015). Effect of laser melting on plasma sprayed WC-12 wt.% Co coatings. Surface and Coatings Technology, 266: 22-30.
- Zhang J, Lei J, Gu Z, et al. (2020). Effect of WC-12Co content on wear and electrochemical corrosion properties of Ni-Cu/WC-12Co composite coatings deposited by laser cladding. Surface and Coatings Technology, 393: 125807. [CrossRef]
- Tehrani H M, Shoja-Razavi R, Erfanmanesh M, et al. (2020). Evaluation of the mechanical properties of WC-Ni composite coating on an AISI 321 steel substrate. Optics & Laser Technology, 127: 106138. [CrossRef]
- Hao E, Zhao X, An Y, et al. (2019). WC-Co reinforced NiCoCrAlYTa composite coating: Effect of the proportion on microstructure and tribological properties. International Journal of Refractory Metals and Hard Materials, 84: 104978. [CrossRef]
- Yamaguchi T, Hagino H. (2021). Effects of the ambient oxygen concentration on WC-12Co cermet coatings fabricated by laser cladding. Optics & Laser Technology, 139: 106922. [CrossRef]
- Da Shu, Zhuguo Li, Ke Zhang, Chengwu Yao, Dayong Li, Zhenbang Dai. (2010). In situ synthesized high volume fraction WC reinforced Ni-based coating by laser cladding. Materials Letters 195 (2017) 178–181. [CrossRef]
- Richter J, Harabas K. (2019). Micro-abrasion investigations of conventional and experimental supercoarse WC-(Ni, Co, Mo) composites. International Journal of Refractory Metals and Hard Materials, 83: 104986. [CrossRef]
- Cao Q, Fan L, Chen H, et al. (2022). Wear behavior of laser cladded WC-reinforced Ni-based coatings under low temperature. Tribology International, 176: 107939. [CrossRef]
- Paul C P, Alemohammad H, Toyserkani E, et al. (2007). Cladding of WC–12 Co on low carbon steel using a pulsed Nd: YAG laser. Materials Science and Engineering: A, 464(1-2): 170-176. [CrossRef]
- P.H. Chong, H.C. P.H. Chong, H.C. Man, T.M. Yue, Microstructure and wear properties of laser surface-cladded Mo–WC MMC on AA6061 aluminum alloy, Surf. Coat. Technol. 145 (1) (2001) 51–59. [CrossRef]
- P. Wu, H.M. P. Wu, H.M. Du, X.L. Chen, Z.Q. Li, H.L. Bai, E.Y. Jiang, Influence of WC particlebehavior on the wear resistance properties of Ni-WC composite coatings,Wear 257 (1-2) (2004) 142-147.
- Anjani Kumar, Anil Kumar Das. Evolution of microstructure and mechanical properties of Co-SiC tungsten inert gas cladded coating on 304 stainless steel. Engineering Science and Technology, an International Journal, 24(3), 2021, P 591-604.
- Jiandong Wang, Liqun Li, Wang Tao. Crack initiation and propagation behavior of WC particles reinforced Fe-based metal matrix composite produced by laser melting deposition.Optics & Laser Technology 82 (2016) 170-182. [CrossRef]
- S. Zhou, X. Zeng, Q. Hu, et al., Analysis of crack behavior for Ni-based WC composite coatings by laser cladding and crack-free realization, Appl. Surf. Sci. 255 (2008) 1646-1653. [CrossRef]
- P. Farahmand, R. P. Farahmand, R. Kovacevic, Laser cladding assisted with an induction heater (LCAIH) of Ni-60%WC, Coat. J. Mater. Process. Tech. 222 (2015) 244-258.
- C.P. Paul, H. C.P. Paul, H. Alemohammad, E. Toyserkani, A. Khajepour, S. Corbin.Cladding of WC-12 Co on low carbon steel using a pulsed Nd:YAG laser.Materials Science and Engineering A 464 (2007) 170–176. [CrossRef]
- Shengfeng Zhou, Yongjun Huang, Xiaoyan Zeng. A study of Ni-based WC composite coatings by laser induction hybrid rapid cladding with elliptical spot. Applied Surface Science 254 (2008) 3110-3119. [CrossRef]
- F. Kretz, Z. F. Kretz, Z. Gácsi, J. Kovács, T. Pieczonka. The electroless deposition of nickel on SiC particles for aluminum matrix composites. Surf. Coat. Technol., 180-181 (2004), pp. 575-579.
- Sunny Zafar, Apurbba Kumar Sharma.Investigations on flexural performance and residual stresses in nanometric WC-12Co microwave clads. Surface & Coatings Technology 291 (2016) 413-422. [CrossRef]
- S.F. Zhou, J.B. S.F. Zhou, J.B. Lei, X.Q. Dai, J.B. Guo, Z.J. Gu, H.B. Pan. A comparative study of the structure and wear resistance of NiCrBSi/50 wt.% WC composite coatings by laser cladding and laser induction hybrid cladding. Int. Journal of Refractory Metals and Hard Materials 60 (2016) 17–27. [CrossRef]
- Da Shu, Zhuguo Li, Ke Zhang, Chengwu Yao, Dayong Li, Zhenbang Dai. In situ synthesized high volume fraction WC reinforced Ni-based coating by laser cladding.Materials Letters 195 (2017) 178–181. [CrossRef]
- S. Zhou, Y. Huang, X. Zeng, A study of Ni-based WC composite coatings by laserinduction hybrid rapid cladding with elliptical spot, Appl. Surf. Sci. 254 (10)(2008) 3110–3119.
- Shu D, Li Z, Zhang K, et al. (2017). In situ synthesized high volume fraction WC reinforced Ni-based coating by laser cladding. Materials Letters, 195: 178-181. [CrossRef]
- Zhang J, Lei J, Gu Z, et al. (2020). Effect of WC-12Co content on wear and electrochemical corrosion properties of Ni-Cu/WC-12Co composite coatings deposited by laser cladding. Surface and Coatings Technology, 393: 125807. [CrossRef]
- Zhong M, Liu W, Yao K, et al. (2002). Microstructural evolution in high power laser cladding of Stellite 6+WC layers. Surface and Coatings Technology, 157(2-3): 128-137. [CrossRef]
- S. Zhou, X. S. Zhou, X. Dai, H. Zheng, Microstructure and wear resistance of Fe-based WCcoating by multi-track overlapping laser induction hybrid rapid cladding, Opt.Laser Technol. 44 (1) (2012) 190–197.
- Wang Y, Li Y, Han K, et al. (2020). Microstructure and mechanical properties of sol-enhanced nanostructured Ni–Al2O3 composite coatings and the applications in WC-Co/steel joints under ultrasound. Materials Science and Engineering: A, 775: 138977. [CrossRef]
- P. Wu, H.M. P. Wu, H.M. Du, X.L. Chen, Z.Q. Li, H.L. Bai, E.Y. Jiang, Influence of WC particle behavior on the wear resistance properties of Ni-WC composite coatings,Wear 257 (1-2) (2004) 142-147. [CrossRef]
- A. Noviyanto et al. Metal oxide additives for the sintering of silicon carbide: reactivity and densification. Current Applied Physics. 13(1) 2013, 287-292. [CrossRef]
- S.P. Lee et al. Fabrication of liquid phase sintered SiC materials and their characterization.Fusion Engineering and Design. 81( 8-14) 2006, Pages 963-967. [CrossRef]
- Neng Li;Yi Xiong;Huaping Xiong;Gongqi Shi;Jon Blackburn;Wei Liu; Renyao Qin. Microstructure, formation mechanism and property characterization of Ti+SiC laser cladded coatings on Ti6Al4V alloy. Materials Characterization. 2019, 148,43-51. [CrossRef]
- S.Xu,et al., Microstructure and sliding wear resistance of laser cladded WC/Ni composite coatings with different contents of WC particle, J. Mater. Eng. Perform. 21,(2012) 1904-1911.
- Farahmand P, Kovacevic R. (2015). Laser cladding assisted with an induction heater (LCAIH) of Ni–60% WC coating. Journal of Materials Processing Technology, 222: 244-258. [CrossRef]
- Luo W, Selvadurai U, Tillmann W. (2016). Effect of residual stress on the wear resistance of thermal spray coatings. Journal of Thermal Spray Technology, 25(1): 321-330. [CrossRef]
- Zoei M S, Sadeghi M H, Salehi M. (2016). Effect of grinding parameters on the wear resistance and residual stress of HVOF-deposited WC-10Co-4Cr coating. Surface and Coatings Technology, 307: 886-891. [CrossRef]
- Wu, Y. W., Wu, A.,(2000). Taguchi method for Robust Design, The American Society of Mechanical Engineers, 97-177.
- Myers, R. H., Montgomery, D.C.,(2006.). Response surface methodology: Process and product optimization using design experiments, John-Wiley & Sons, USA.
- Lin, B.T. , Jean,M.D., Chou,J.H., 2007. Using response surface methodology for optimizing deposited partially stabilized zirconia in plasma spraying. Applied Surface Science 253,3254–32. [CrossRef]
- Guilemany J M, Dosta S, Miguel J R. (2006). The enhancement of the properties of WC-Co HVOF coatings through the use of nanostructured and microstructured feedstock powders. Surface and Coatings Technology, 201(3-4): 1180-1190. [CrossRef]
- Long J, Zhang W, Wang Y, et al. (2017). A new type of WC-Co-Ni-Al cemented carbide: Grain size and morphology of γ ́-strengthened composite binder phase. Scripta Materialia, 126: 33-36. [CrossRef]
- C.Y. Zhang, S.Y. Chen , L.G. Xie , Echo Yang , Tong Bu , Ivan Cheung , M.D. Jean. Multi-objective Optimization of Laser Welds with Mixed WC/Co/Ni Experiments Using Simplex-centroid Design. Materials science 29(4):2023.445-455.
- C. W. Liu, M. D. Jean,1 Q. T. Wang, and B. S. Chen. Optimization of residual stresses in laser-mixed WC (Co, Ni) coatings. Strength of Materials, 51(1), 2019. 95-101.
- D.S. Nagesh, G.L. Datta. Prediction of weld bead geometry and penetration in shielded metal-arc welding using artificial neural networks. Journal of Materials Processing Technology. 123( 2) 2002, 303-312. [CrossRef]
- C.R.Wang, Z.Q. Zhong and M. D. Jean. Effect of ingredients proportions on mechanical properties in lasercoated WC-blend welds. Phys. Scr. 99 (2024), 1-12. [CrossRef]
- Meng Liu; Chunzheng Duan; Guohe Li; Yujun Cai; Feng Wang; Lei Li. Multi-response optimization of Ni-based laser cladding via principal component analysis and grey relational analysis. Optik-International Journal for Light and Electron Optics. 2023.287. [CrossRef]
- Zhou, Zhijie; Du, Yanbin; He, Guohua; Xu, Lei; Shu, Linsen. Optimization and Characterization of Laser Cladding of 15-5PH Coating on 20Cr13 Stainless Steel. Journal of Materials Engineering and Performance. 2023, 32 (3) 962-977. [CrossRef]
- Gao, Jiali;Wang, Chi;Hao, Yunbo;Liang, Xudong;Zhao, Kai. Prediction of TC11 single-track geometry in laser metal deposition based on back propagation neural network and random forest. Journal of Mechanical Science and Technology. 2022, 36 (3)1417-1425. [CrossRef]
- Liaoyuan Chen, Tianbiao Yu, Xin Chen, Yu Zhao, Chuang Guan. Process optimization, microstructure and microhardness of coaxial laser cladding TiC reinforced Ni-based composite coatings. Optics & Laser Technology, 152, 2022, 108129. [CrossRef]
- Rasool Saeedi , Reza Shoja Razavi, Saeed Reza Bakhshi, Mohammad Erfanmanesh, Ahmad Ahmadi Bani. Optimization and characterization of laser cladding of NiCr and NiCr-TiC composite coatings on AISI 420 stainless steel. Ceramics International. 47( 3), 2021, 4097-4110.
- Lan-Ling Fu; Jin-Shui Yang; Shuang Li; Hao Luo; Jian-Hao Wu. Artificial neural network-based damage detection of composite material using laser ultrasonic technology. Measurement.2023,220,113435. [CrossRef]
- Muhammad Arif Mahmood, Andrei C. Popescu, Mihai Oane , Asma Channa, Sabin Mihai, Carmen Ristoscu, Ion N. Mihailescu. Bridging the analytical and artificial neural network models for keyhole formation with experimental verification in laser melting deposition: Anovel approach. Results in Physics. 26, 2021, 104440.
- S. Chowdhury, S. Anand. Artificial neural network based geometric compensation for thermal deformation in additive manufacturing processes. Int. Manuf. Sci. Eng. Conf, Blacksburg, VA, USA (2016).
- W. Sudnik, D. Radaj, W. Erofeew. Computerized simulation of laser beam welding, modelling and verification. J Phys D Appl Phys, 29 (11) 1996, 2811-2817. [CrossRef]
- Yuhang Zhang, Yifei Xu, Yaoning Sun and Wangjun Cheng. Surface quality optimization of laser cladding based on surface response and genetic neural network model. Surface Topography: Metrology and Properties, 10( 4)2022, 10 044007. [CrossRef]
- S. Genna , E. Menna , G. Rubino, F. Trovalusci. Laser machining of silicon carbide: Experimental analysis and multiobjective optimization. Ceramics International 49(7), 2023,10682-10691. [CrossRef]
Figure 1.
SEM microstructures of various tests with a WC/Co/Ni deposits by laser cladding including (a) trial2 of 100%SiC;( b) trial6 of 90%WC-10%Ni; (c) trial12 of 90%WC-10%Co; (d) trial13 of 90%WC-10%Co-10%Ni.
Figure 1.
SEM microstructures of various tests with a WC/Co/Ni deposits by laser cladding including (a) trial2 of 100%SiC;( b) trial6 of 90%WC-10%Ni; (c) trial12 of 90%WC-10%Co; (d) trial13 of 90%WC-10%Co-10%Ni.
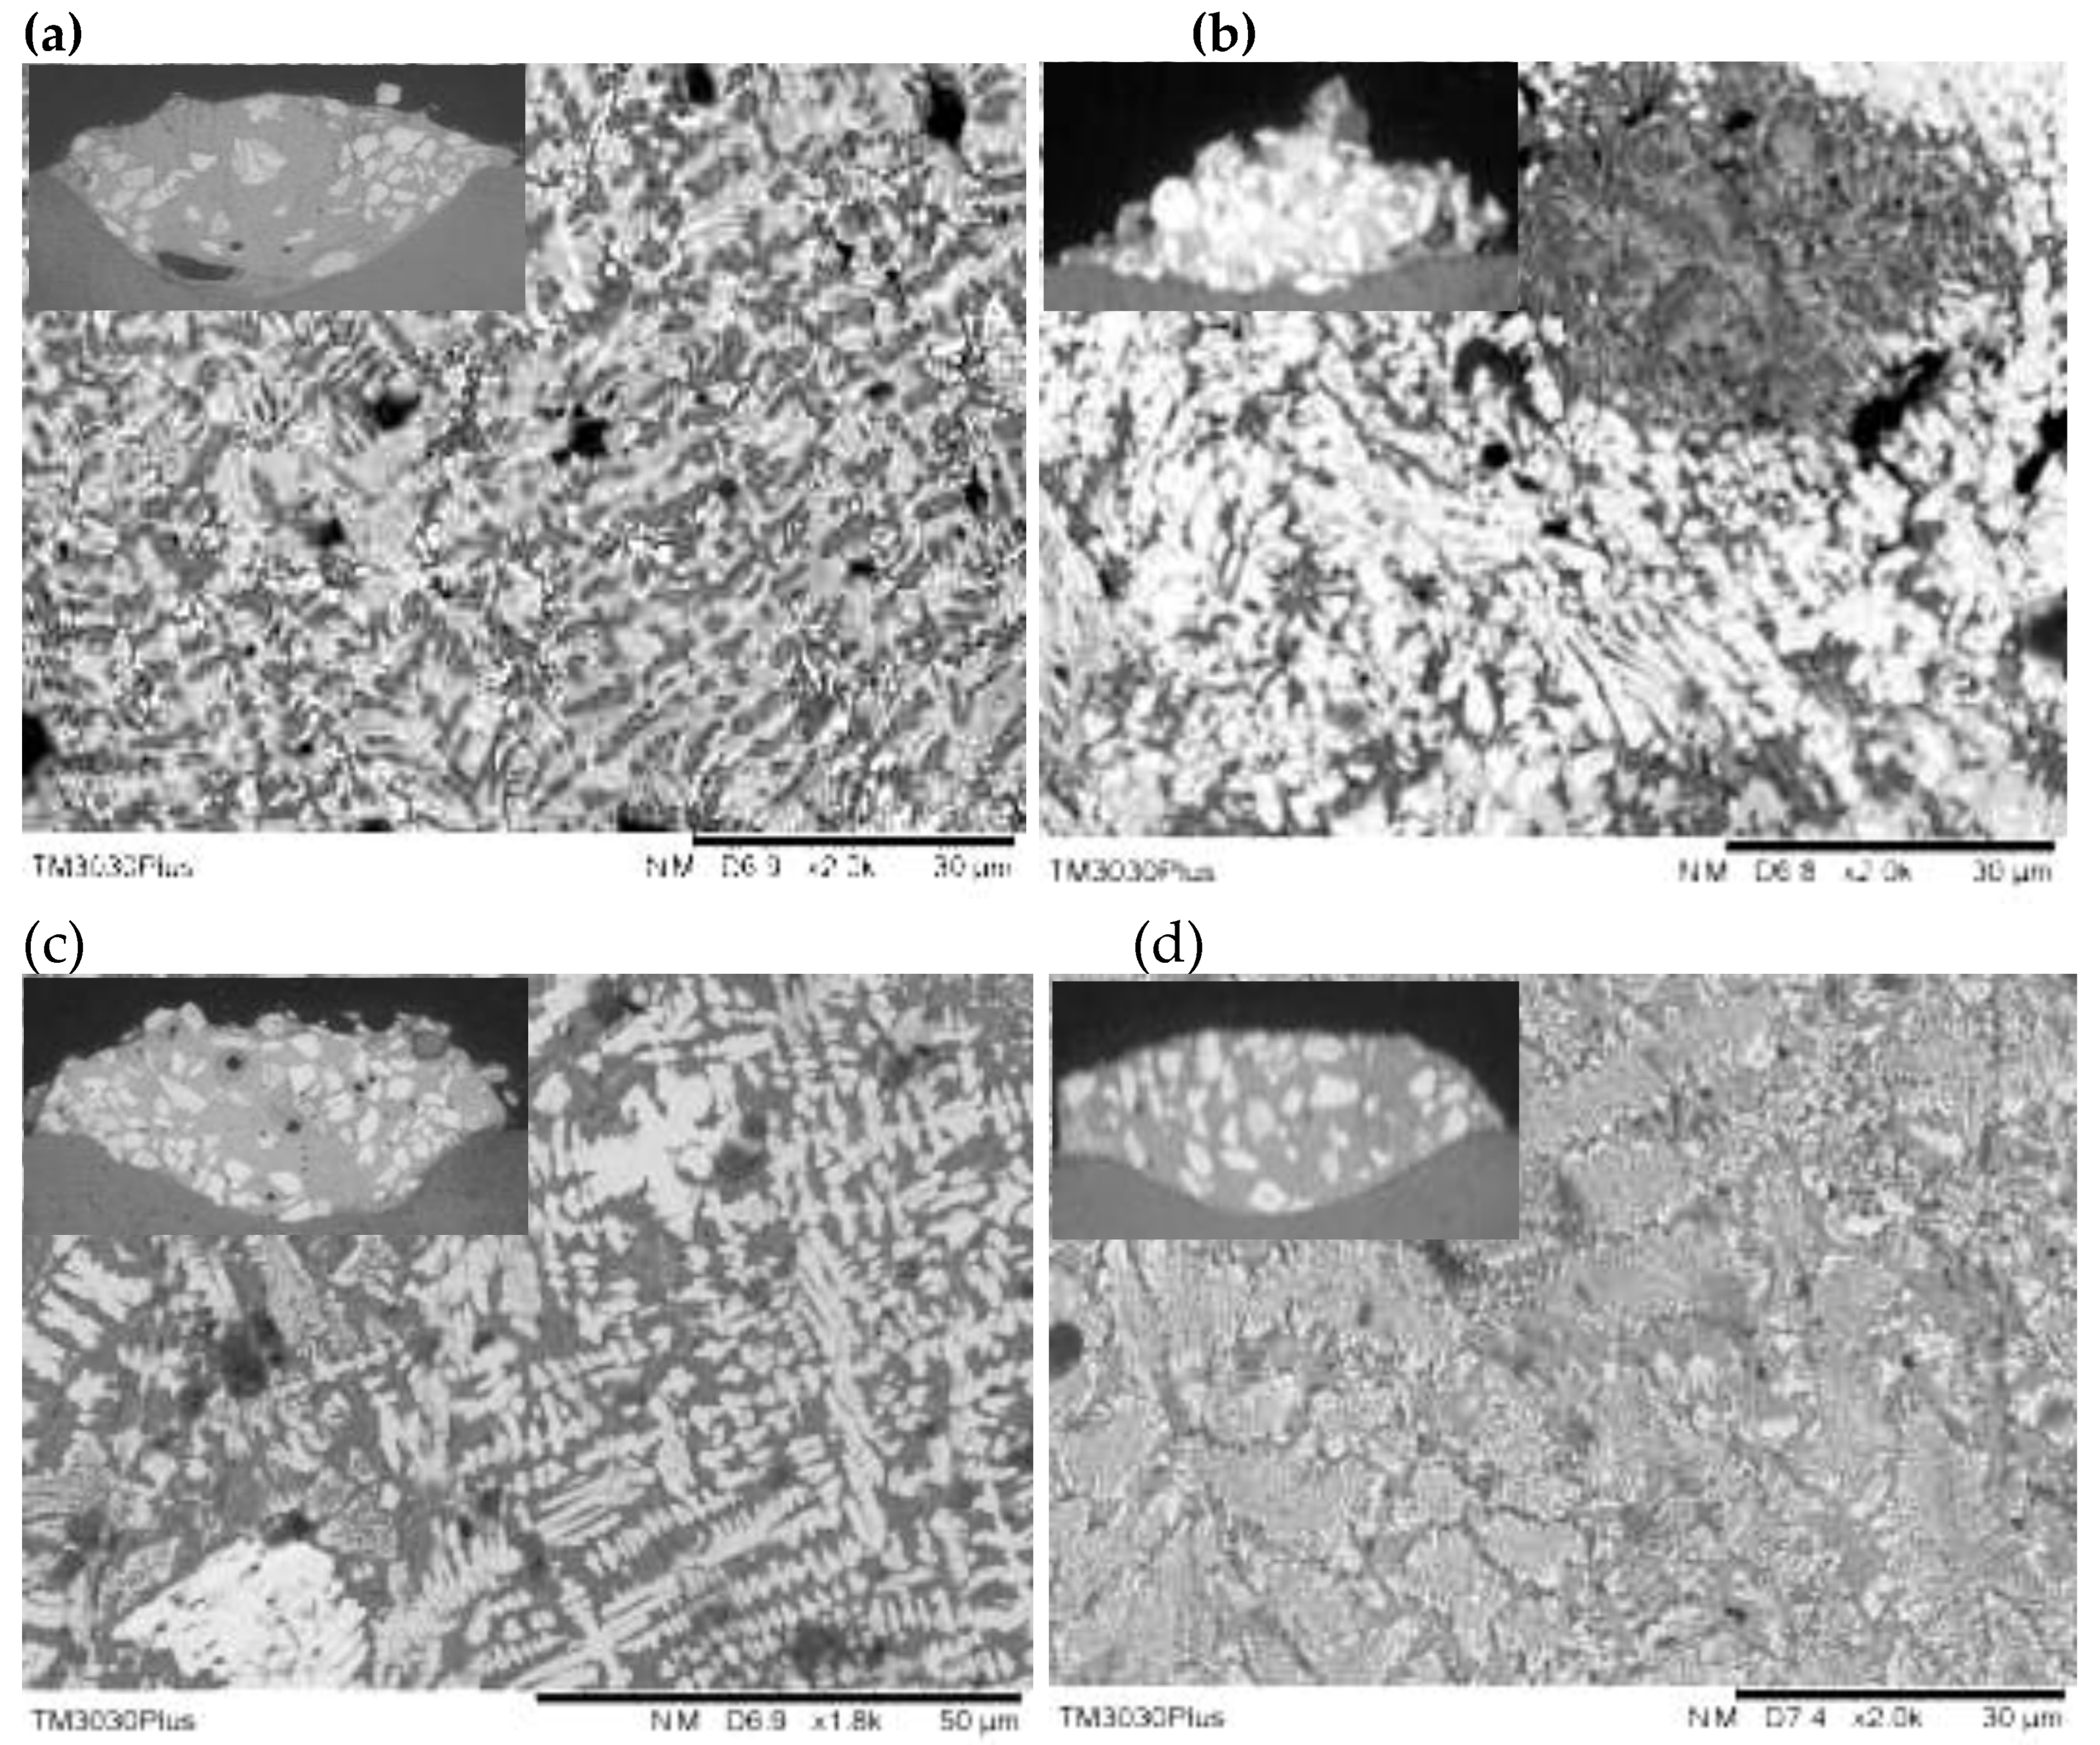
Figure 2.
The 3-D topographs of the wear track (a-d) by wear test with the cross-sectional profile with a WC/Co/Ni deposits by laser cladding including (a) trial1 of 100%SiC;( b) trial4 of 90%WC-10%Ni; (c) trial11 of 90%WC-10%Co; (d) trial14 of 80%WC-10Co-10Ni.
Figure 2.
The 3-D topographs of the wear track (a-d) by wear test with the cross-sectional profile with a WC/Co/Ni deposits by laser cladding including (a) trial1 of 100%SiC;( b) trial4 of 90%WC-10%Ni; (c) trial11 of 90%WC-10%Co; (d) trial14 of 80%WC-10Co-10Ni.
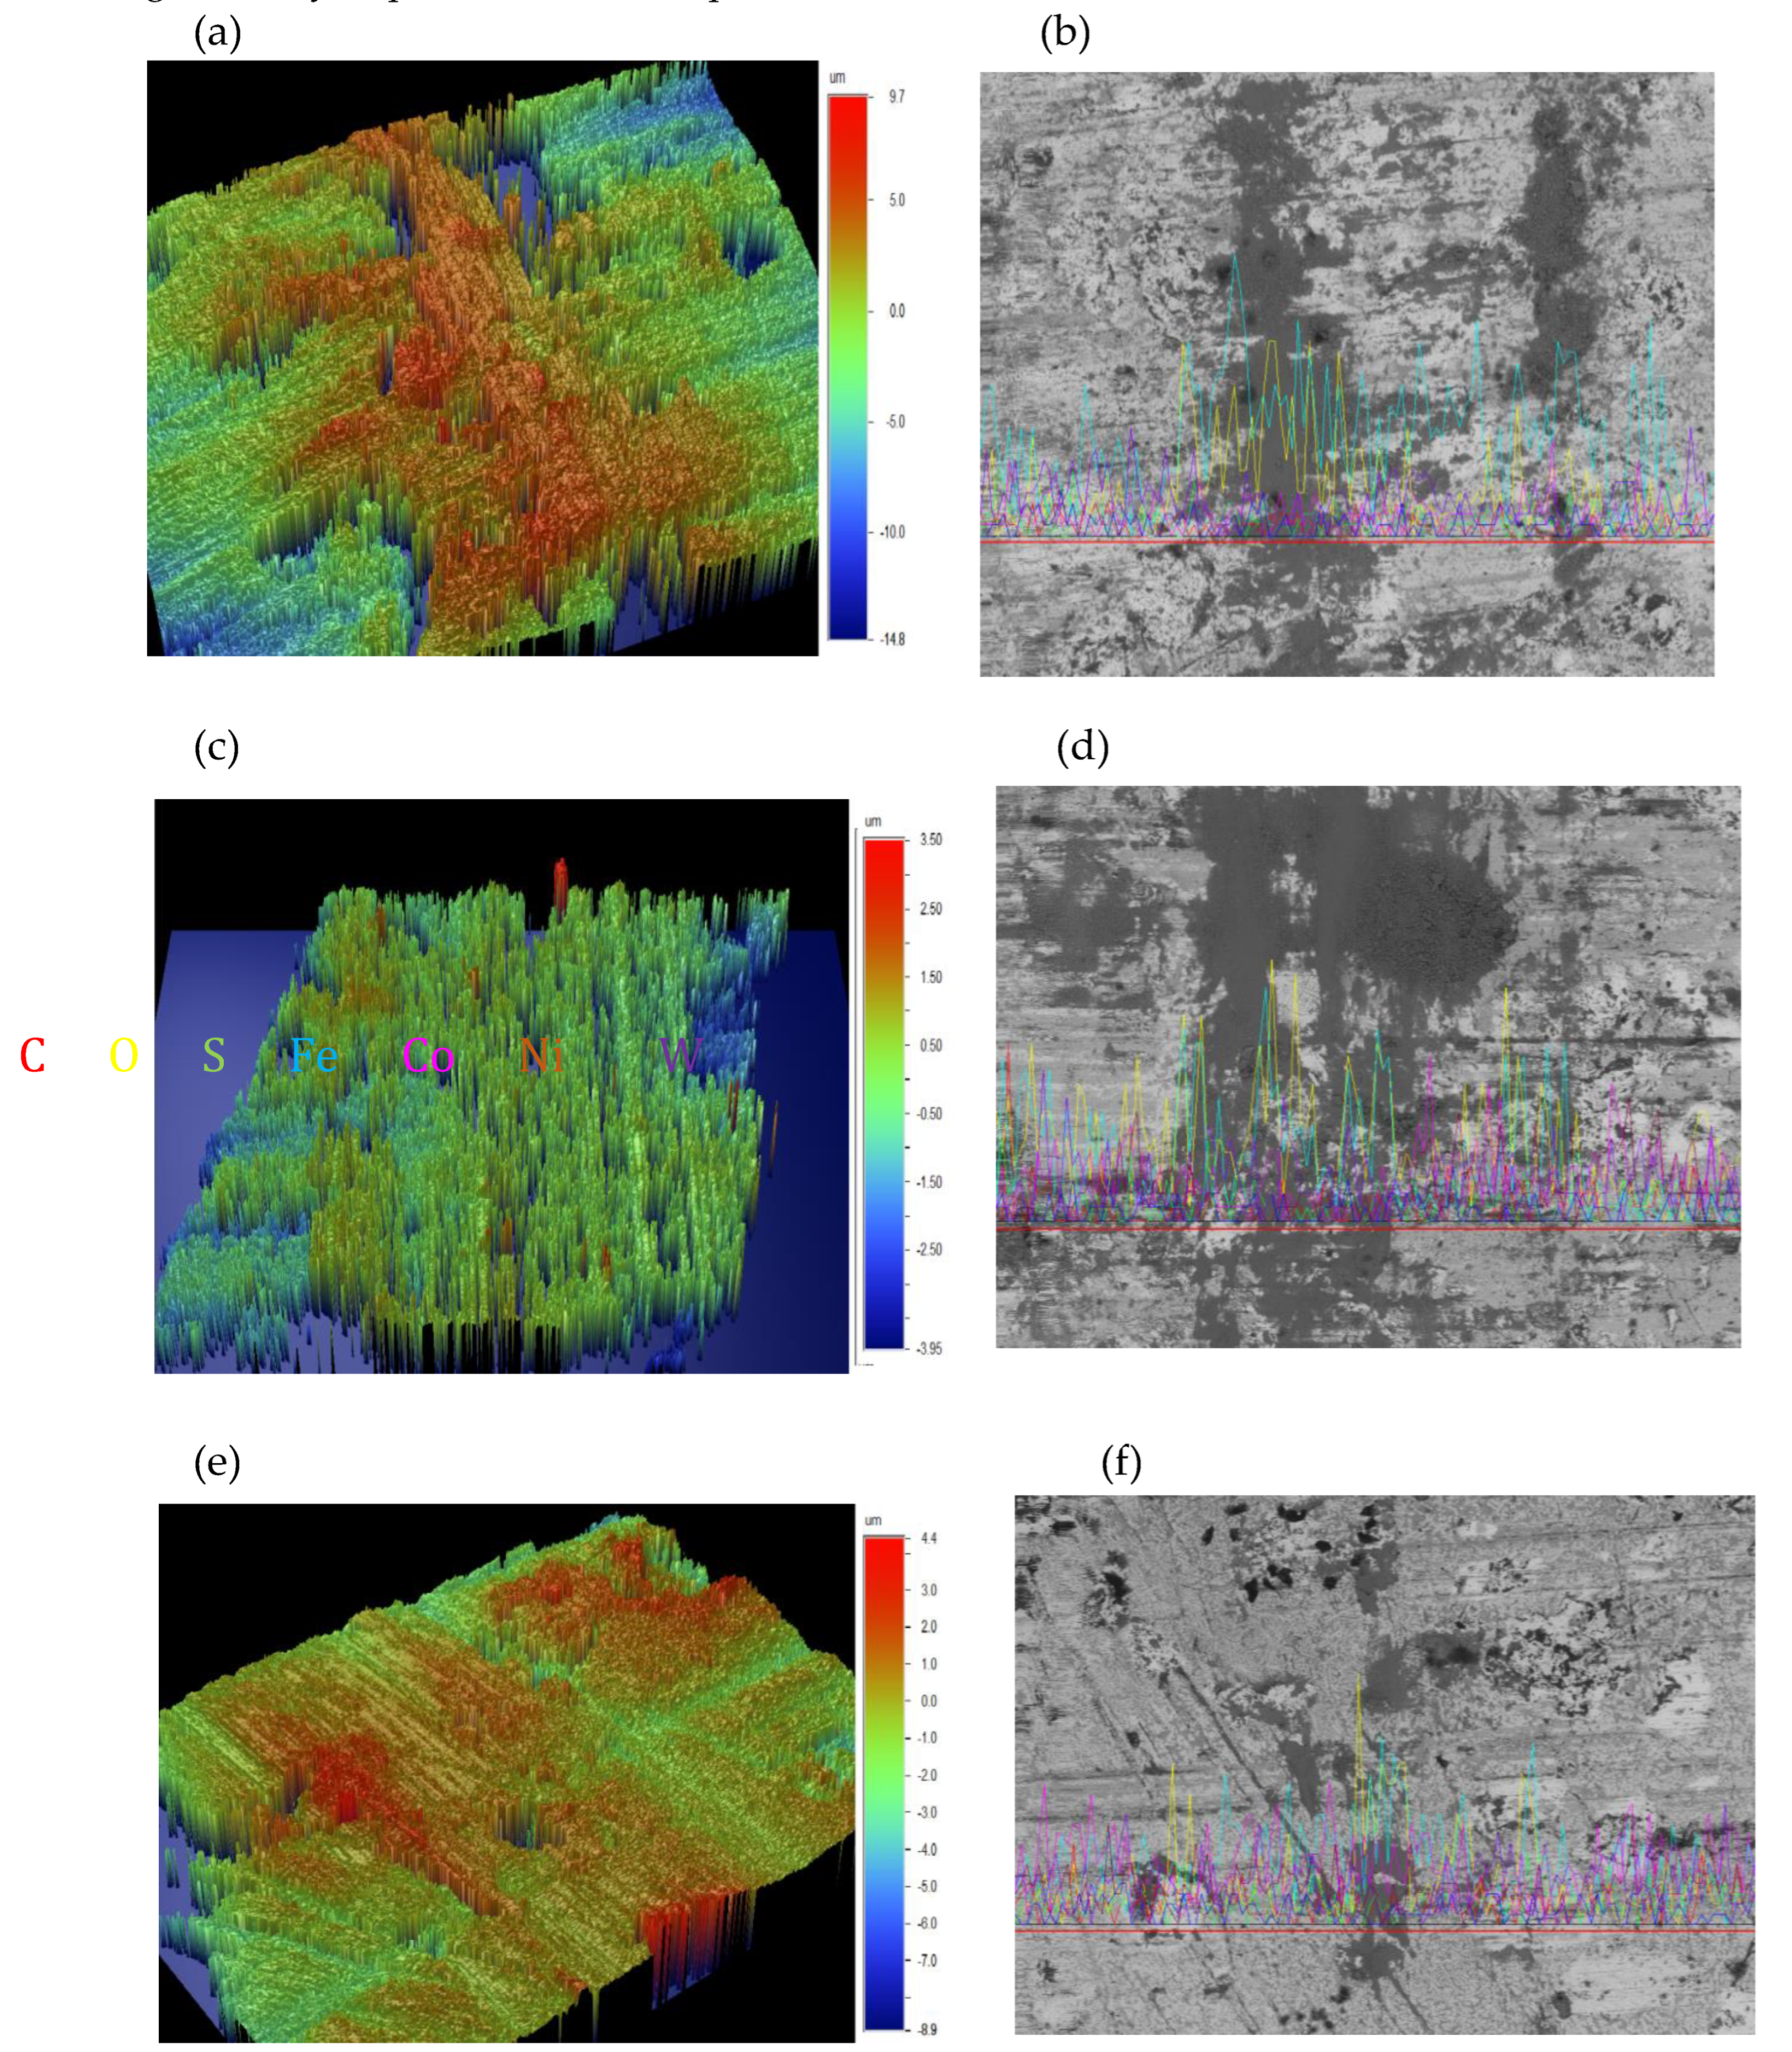
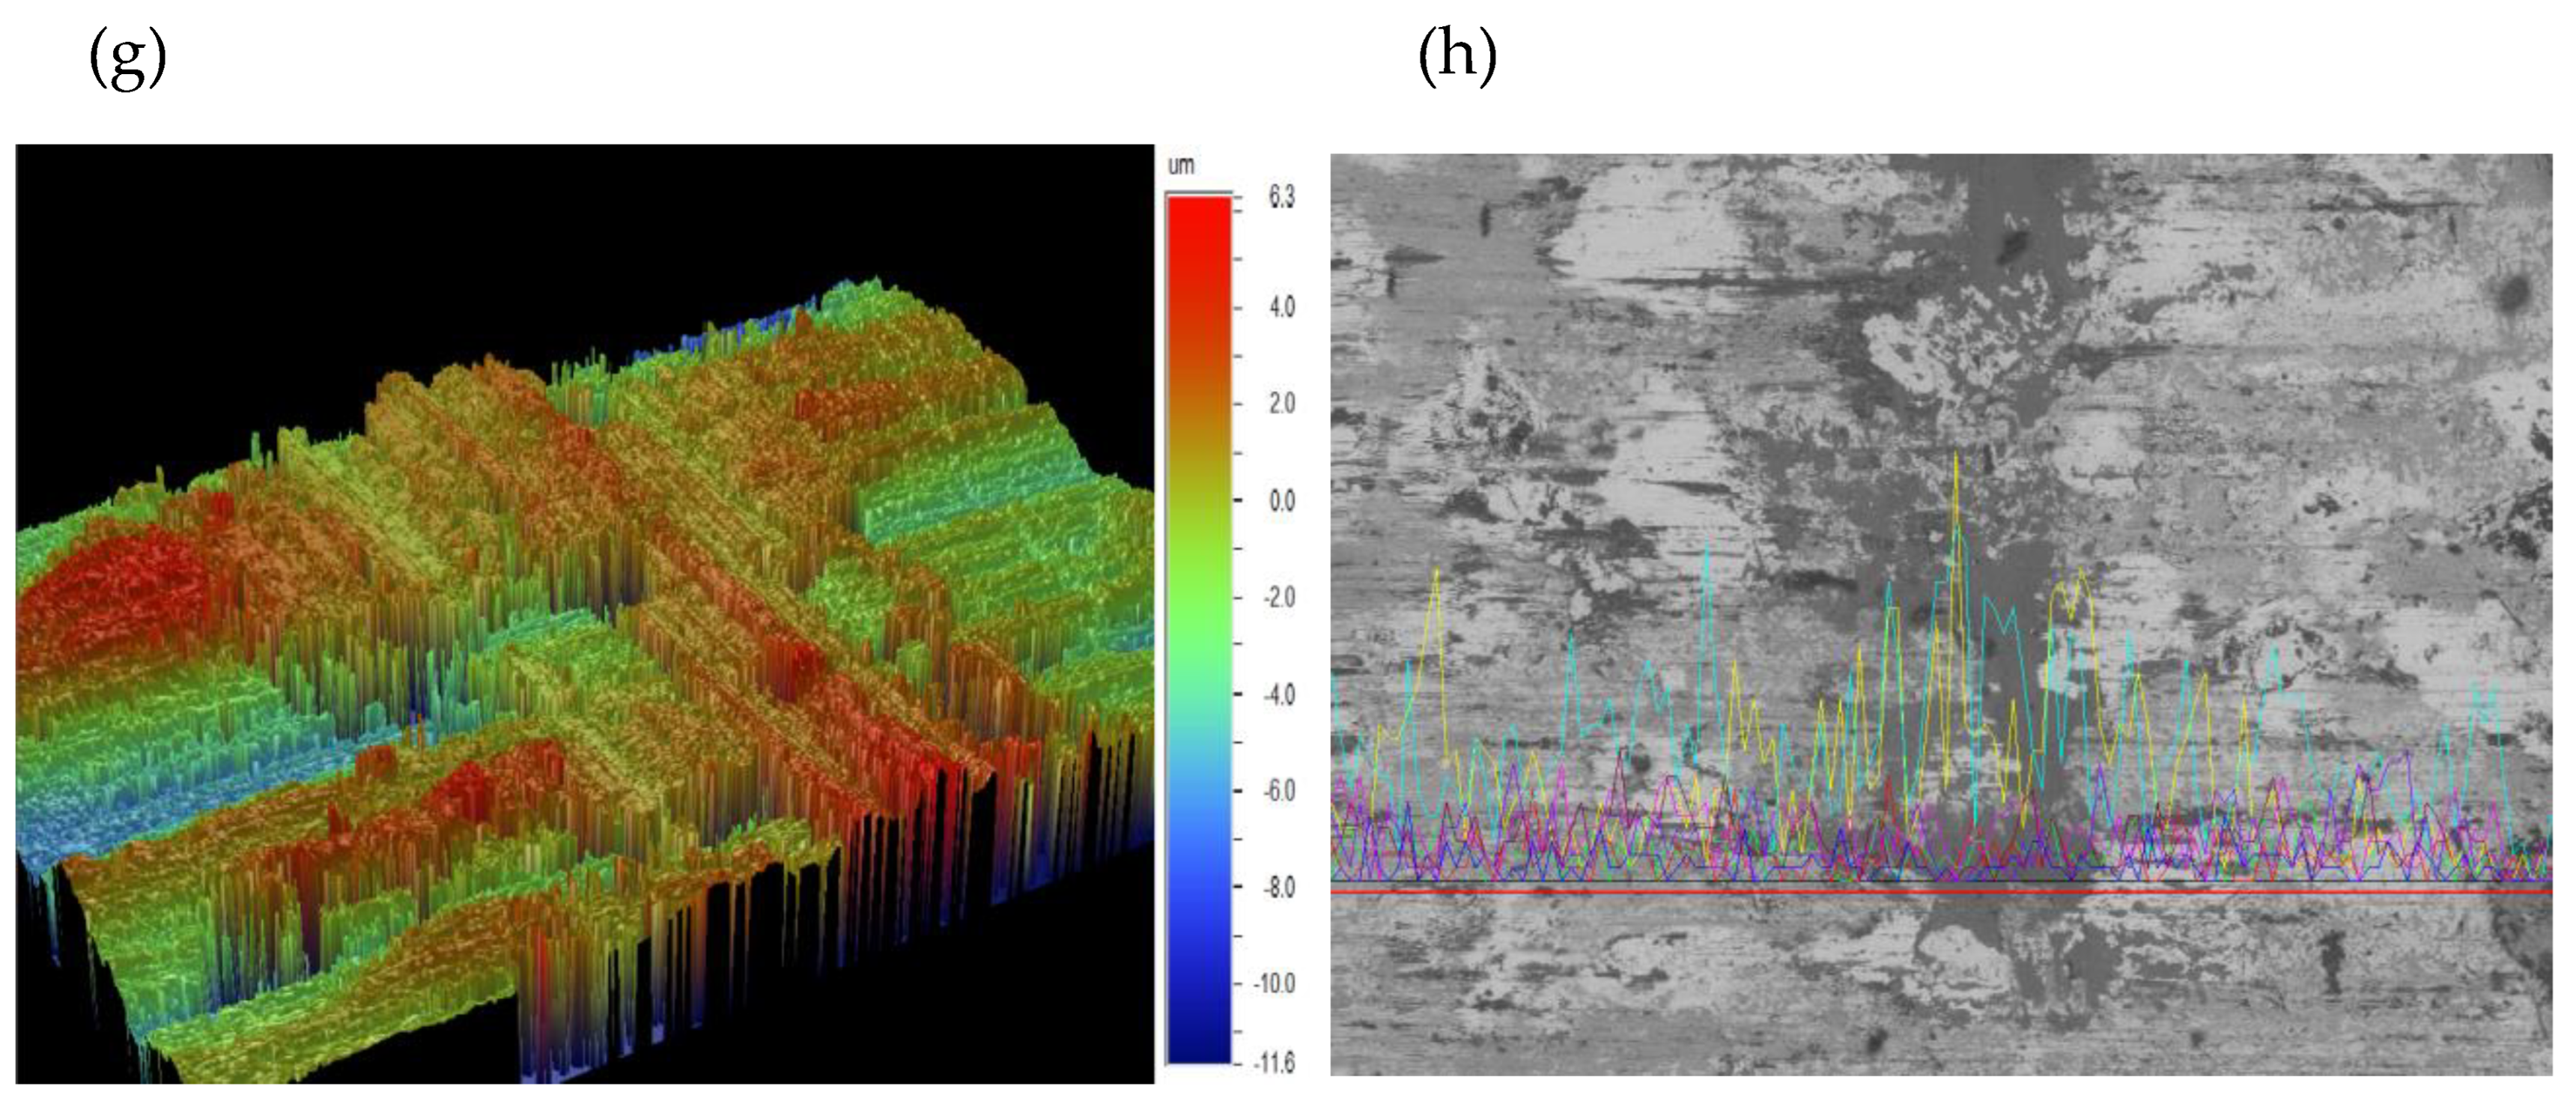
Figure 3.
Response plot for S/N ratios of wear volume for WC/Co/Ni welds.
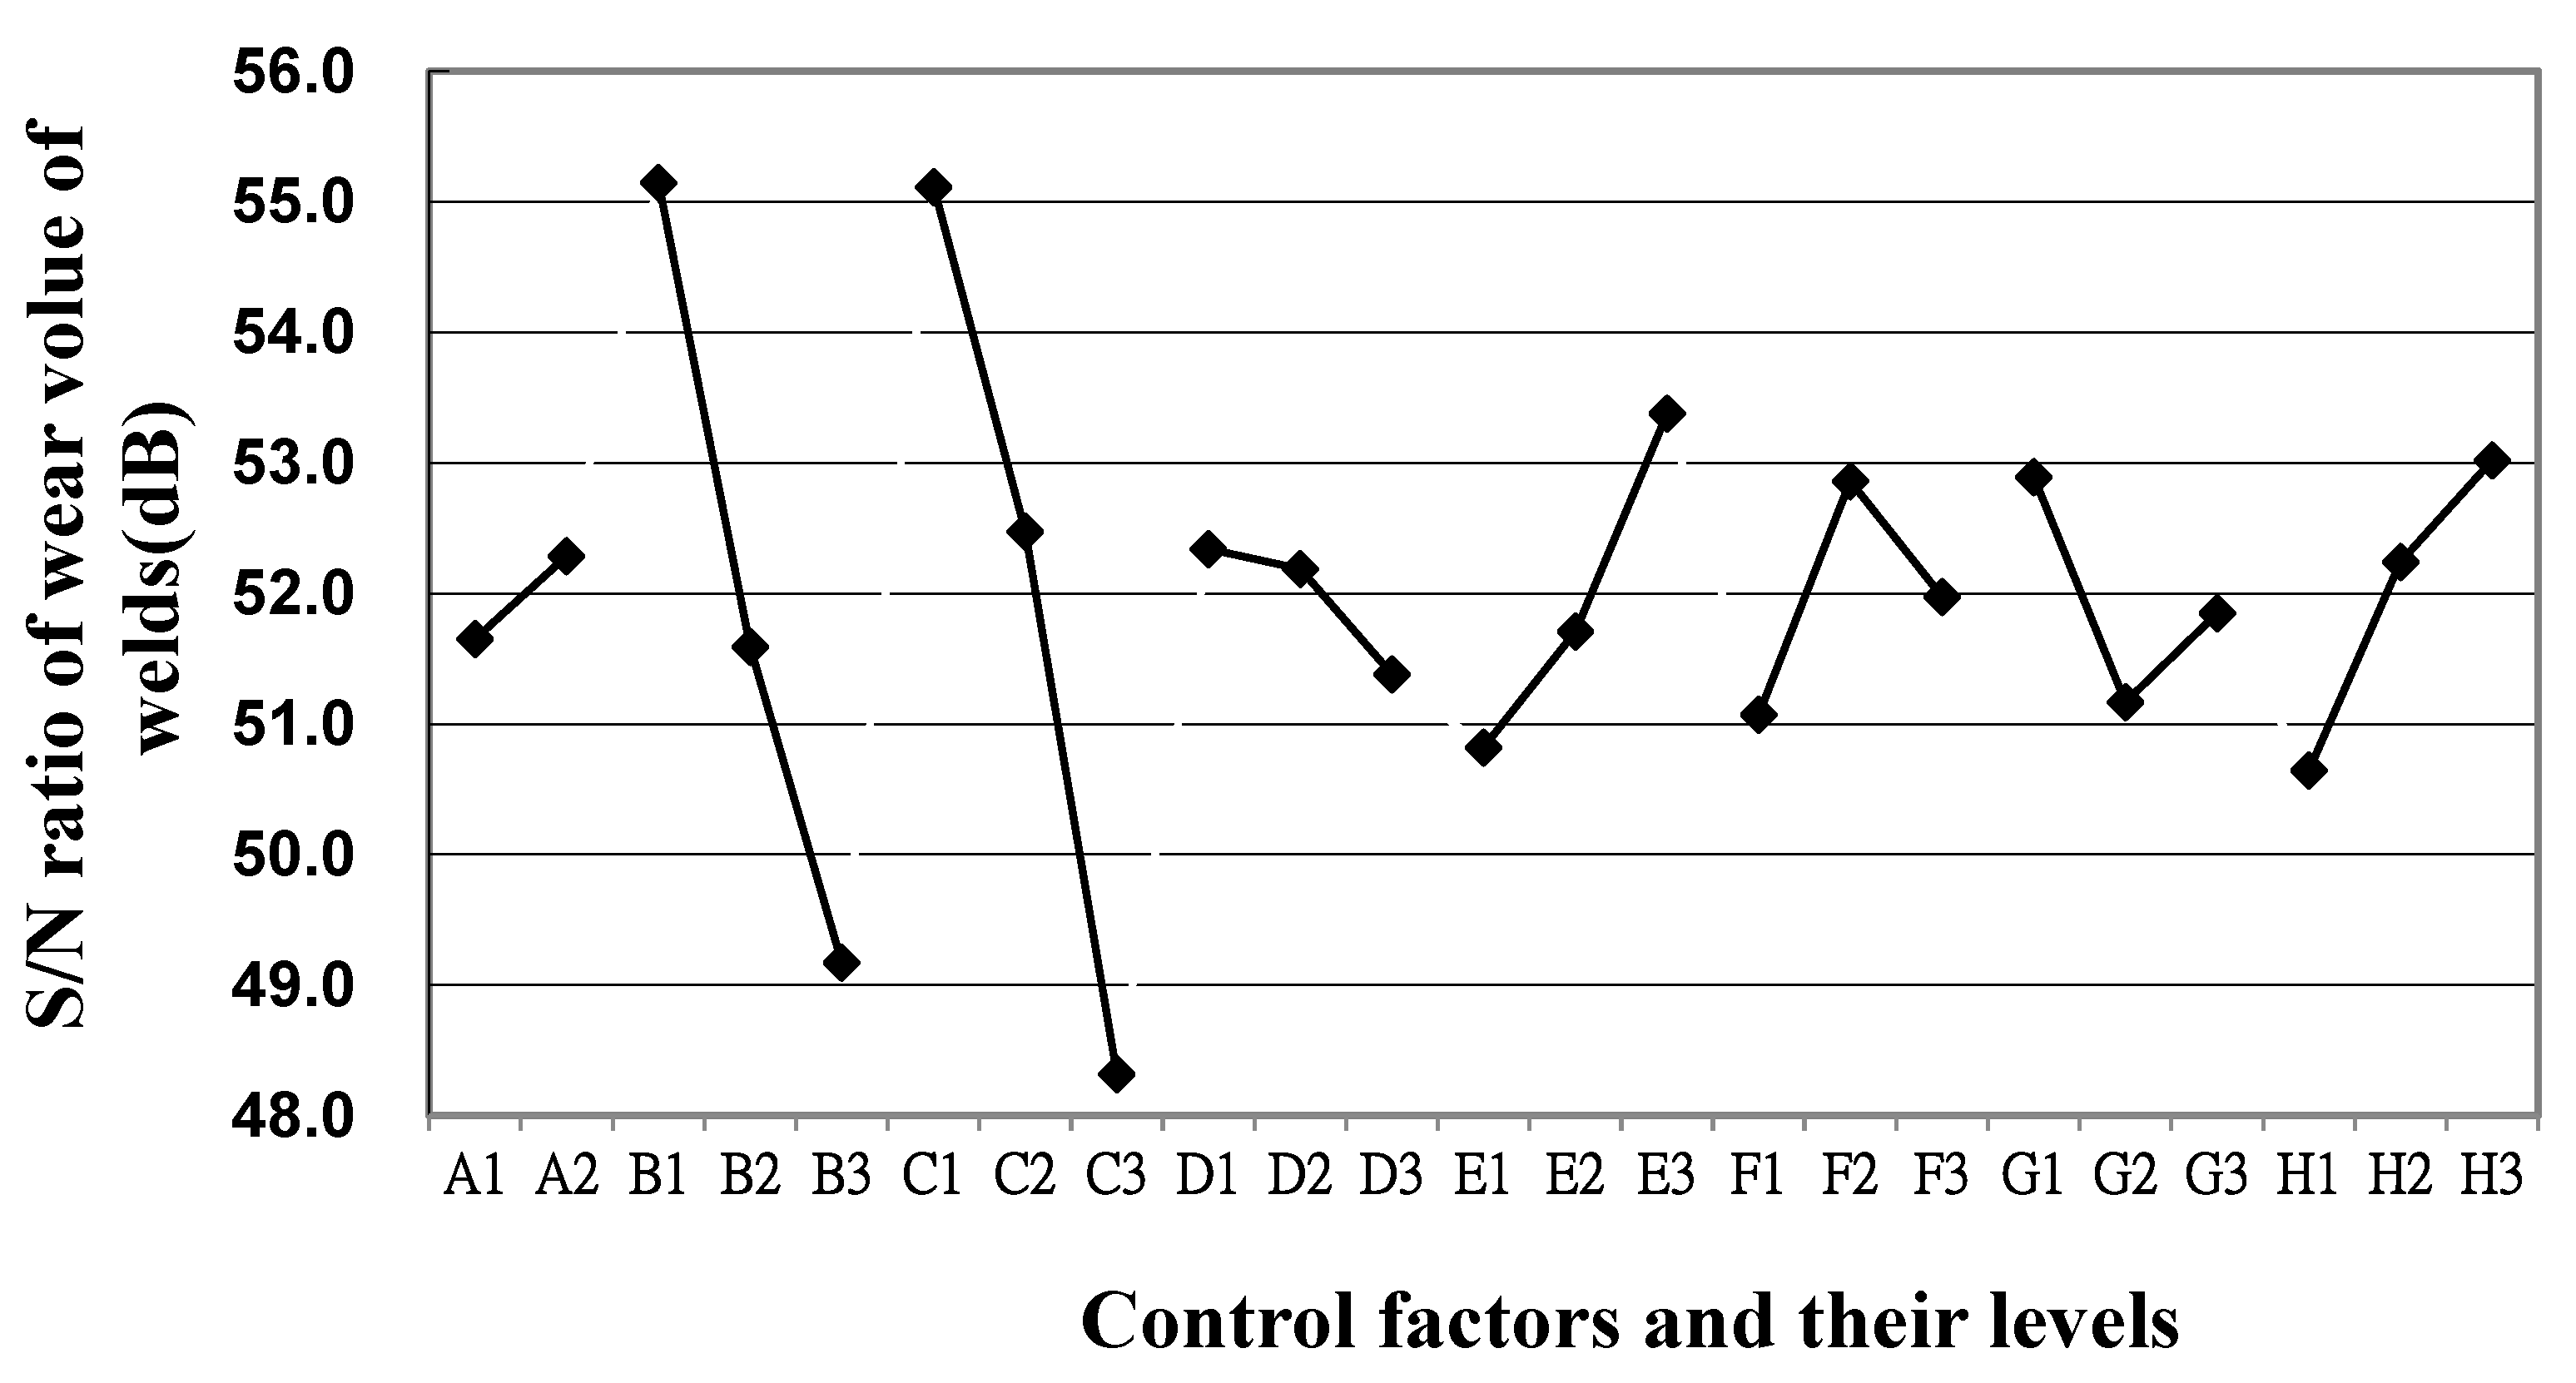
Figure 4.
Contour plots of wear volume(x10-4) for the interaction model, with the influence of the three components WC, Ni and Co on the wear considered.
Figure 4.
Contour plots of wear volume(x10-4) for the interaction model, with the influence of the three components WC, Ni and Co on the wear considered.
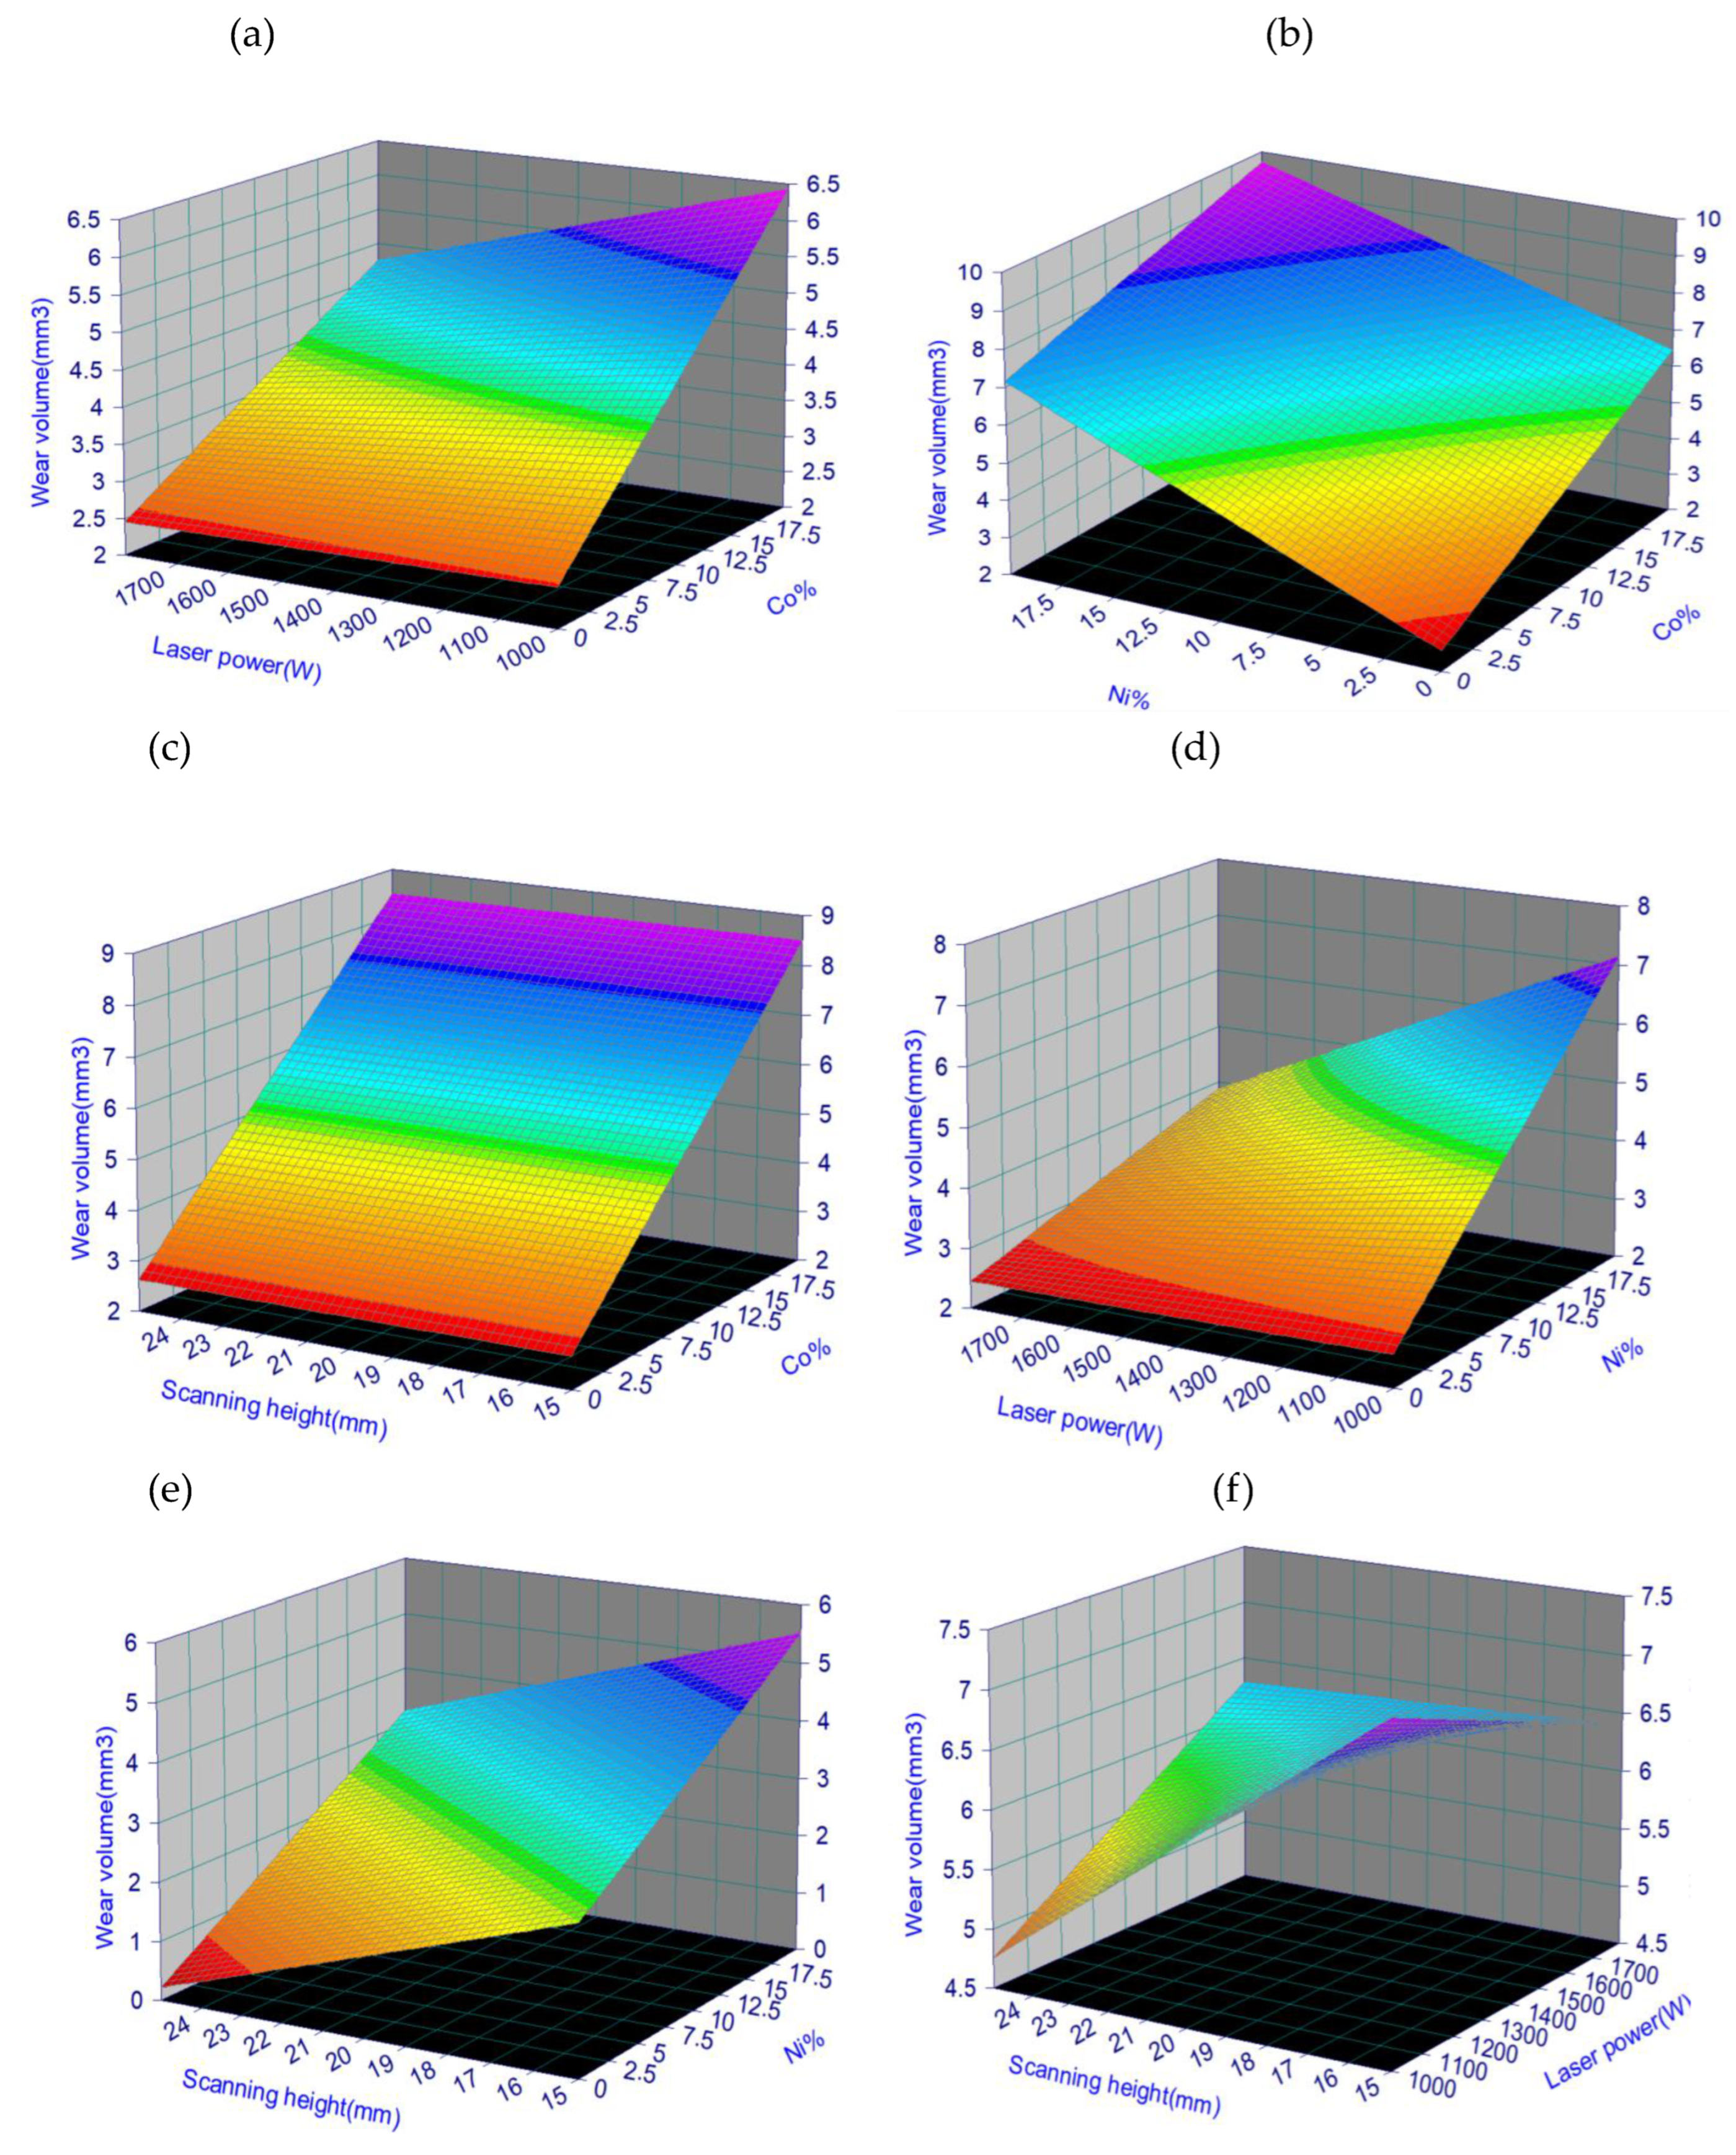
Figure 5.
Comparison of Histograms and Errors of Prediction with experimental data obtained using an interaction model.
Figure 5.
Comparison of Histograms and Errors of Prediction with experimental data obtained using an interaction model.
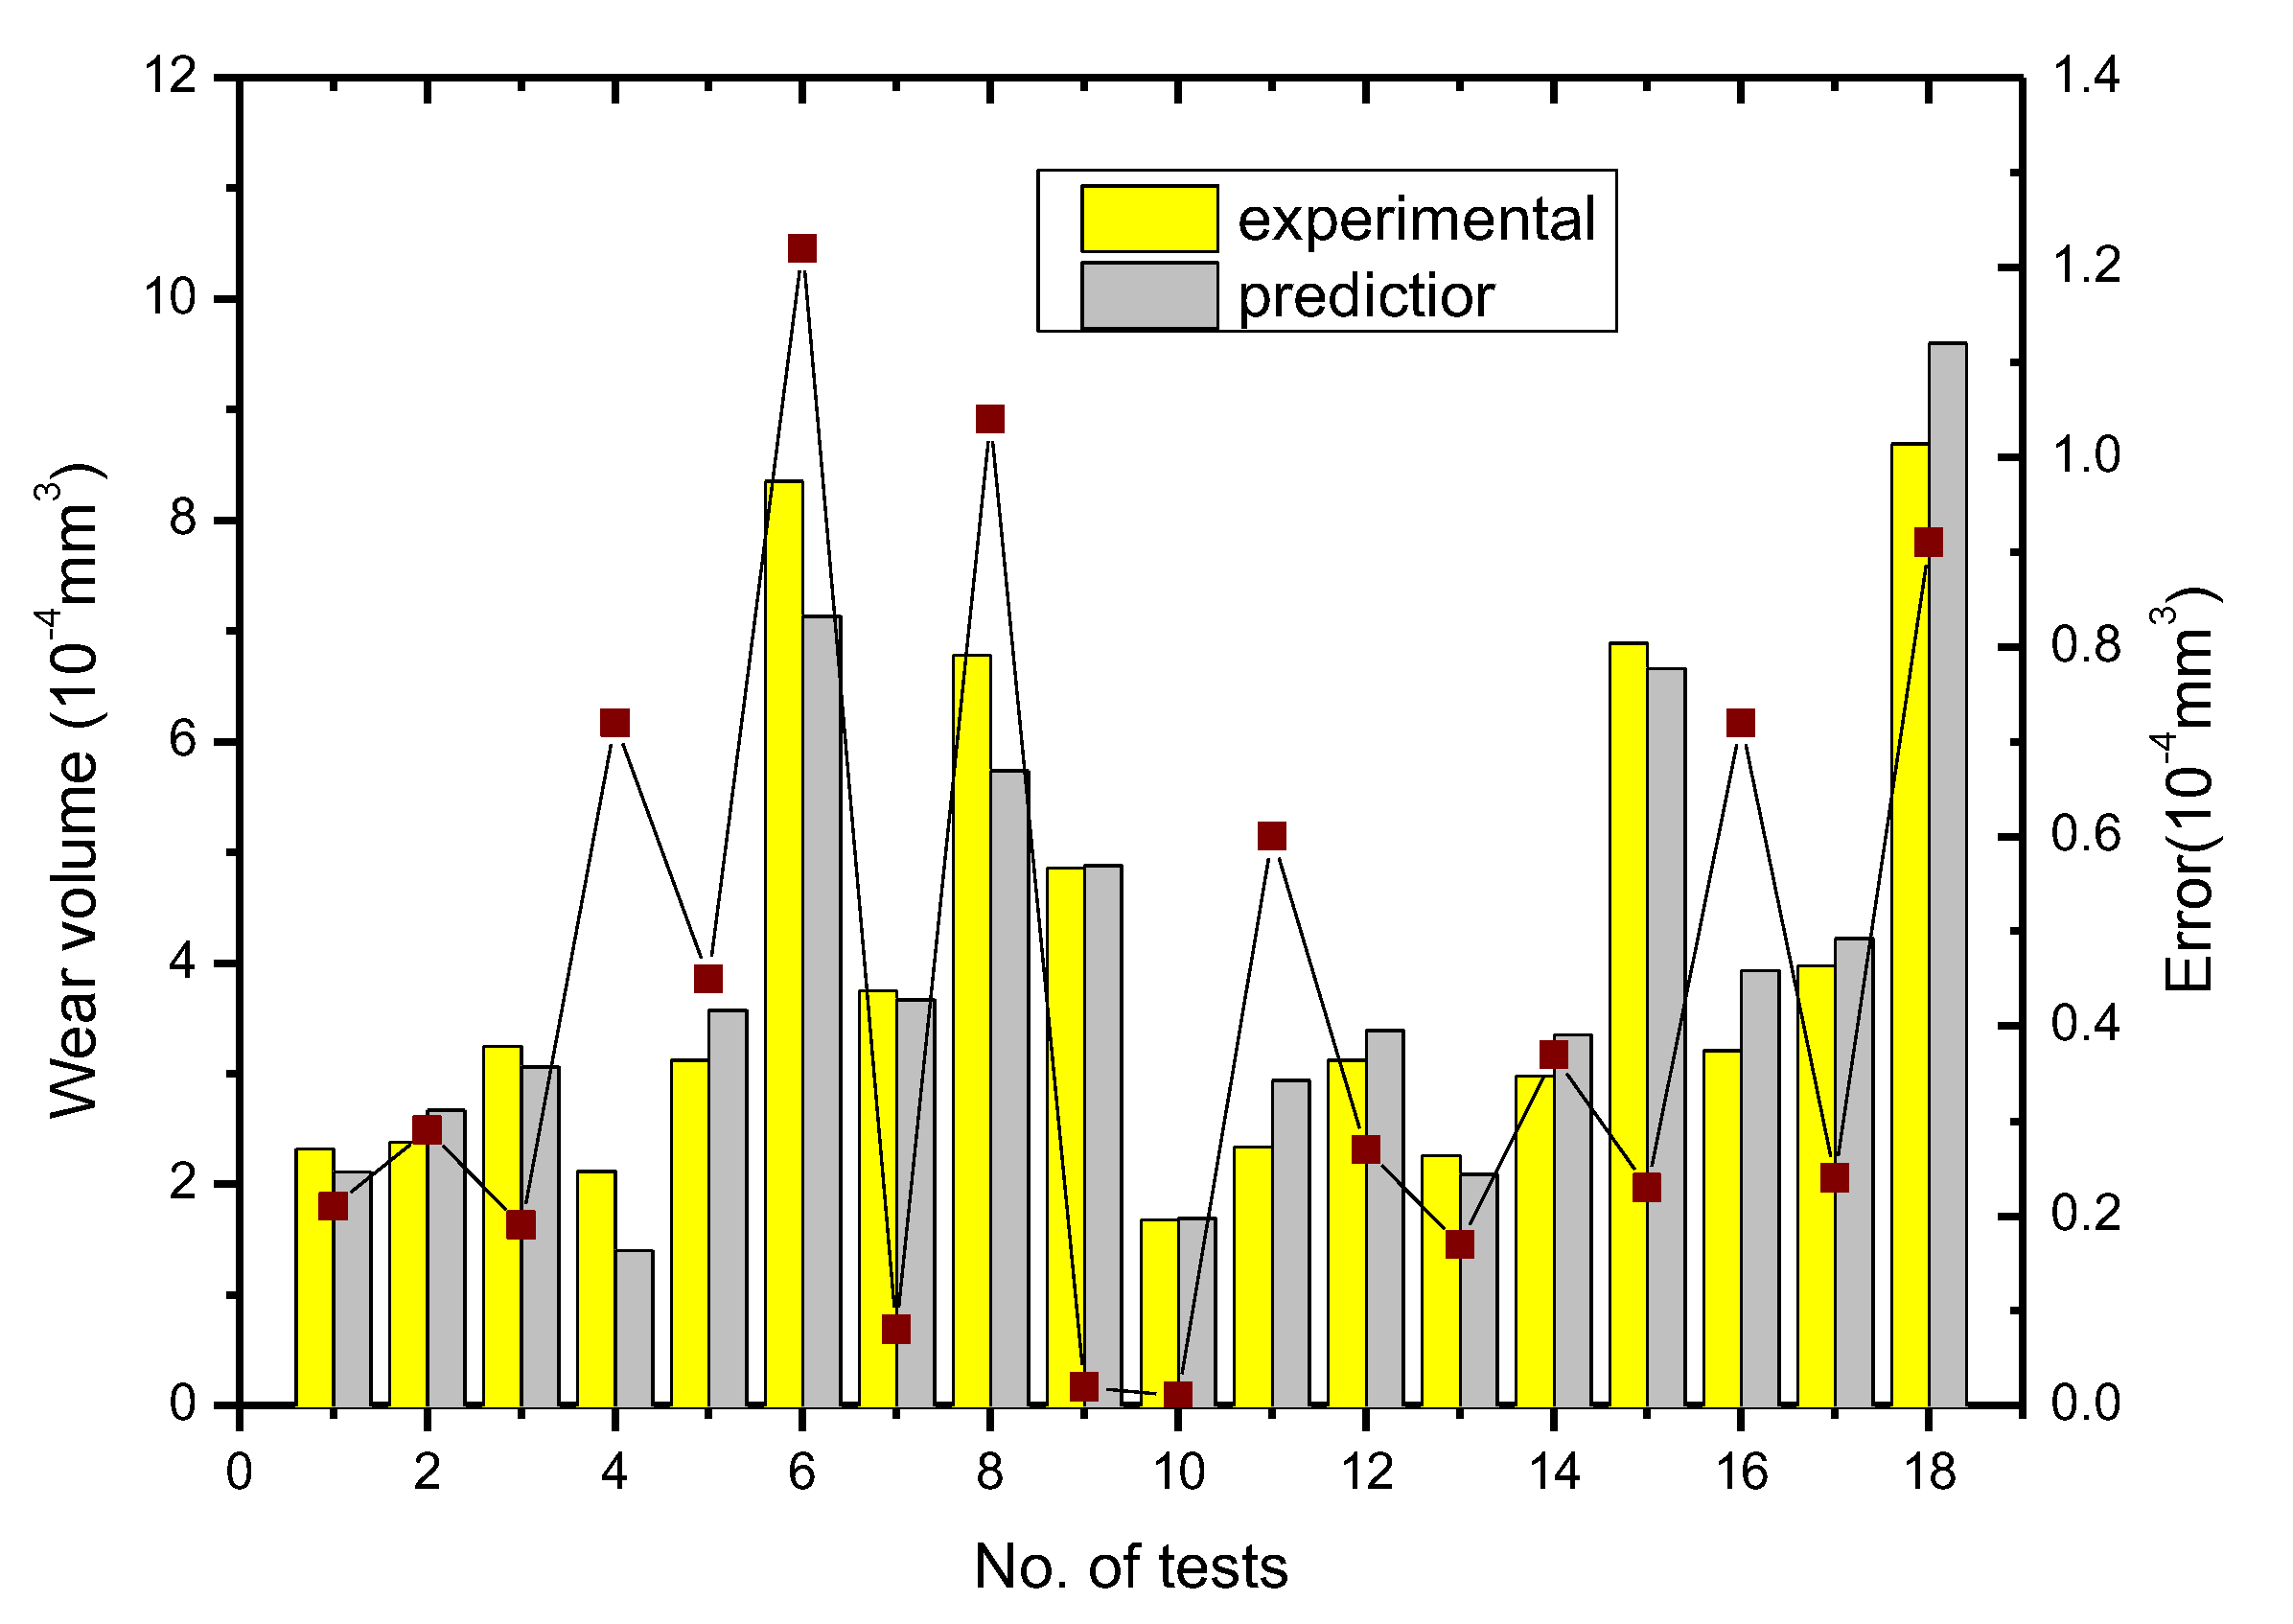
Figure 6.
Confirmation of the optimum test based on the orthogonal table for the amount of wear of the coated surfaces and comparison of the selected L6 and L10 tests with Gaussian function.
Figure 6.
Confirmation of the optimum test based on the orthogonal table for the amount of wear of the coated surfaces and comparison of the selected L6 and L10 tests with Gaussian function.
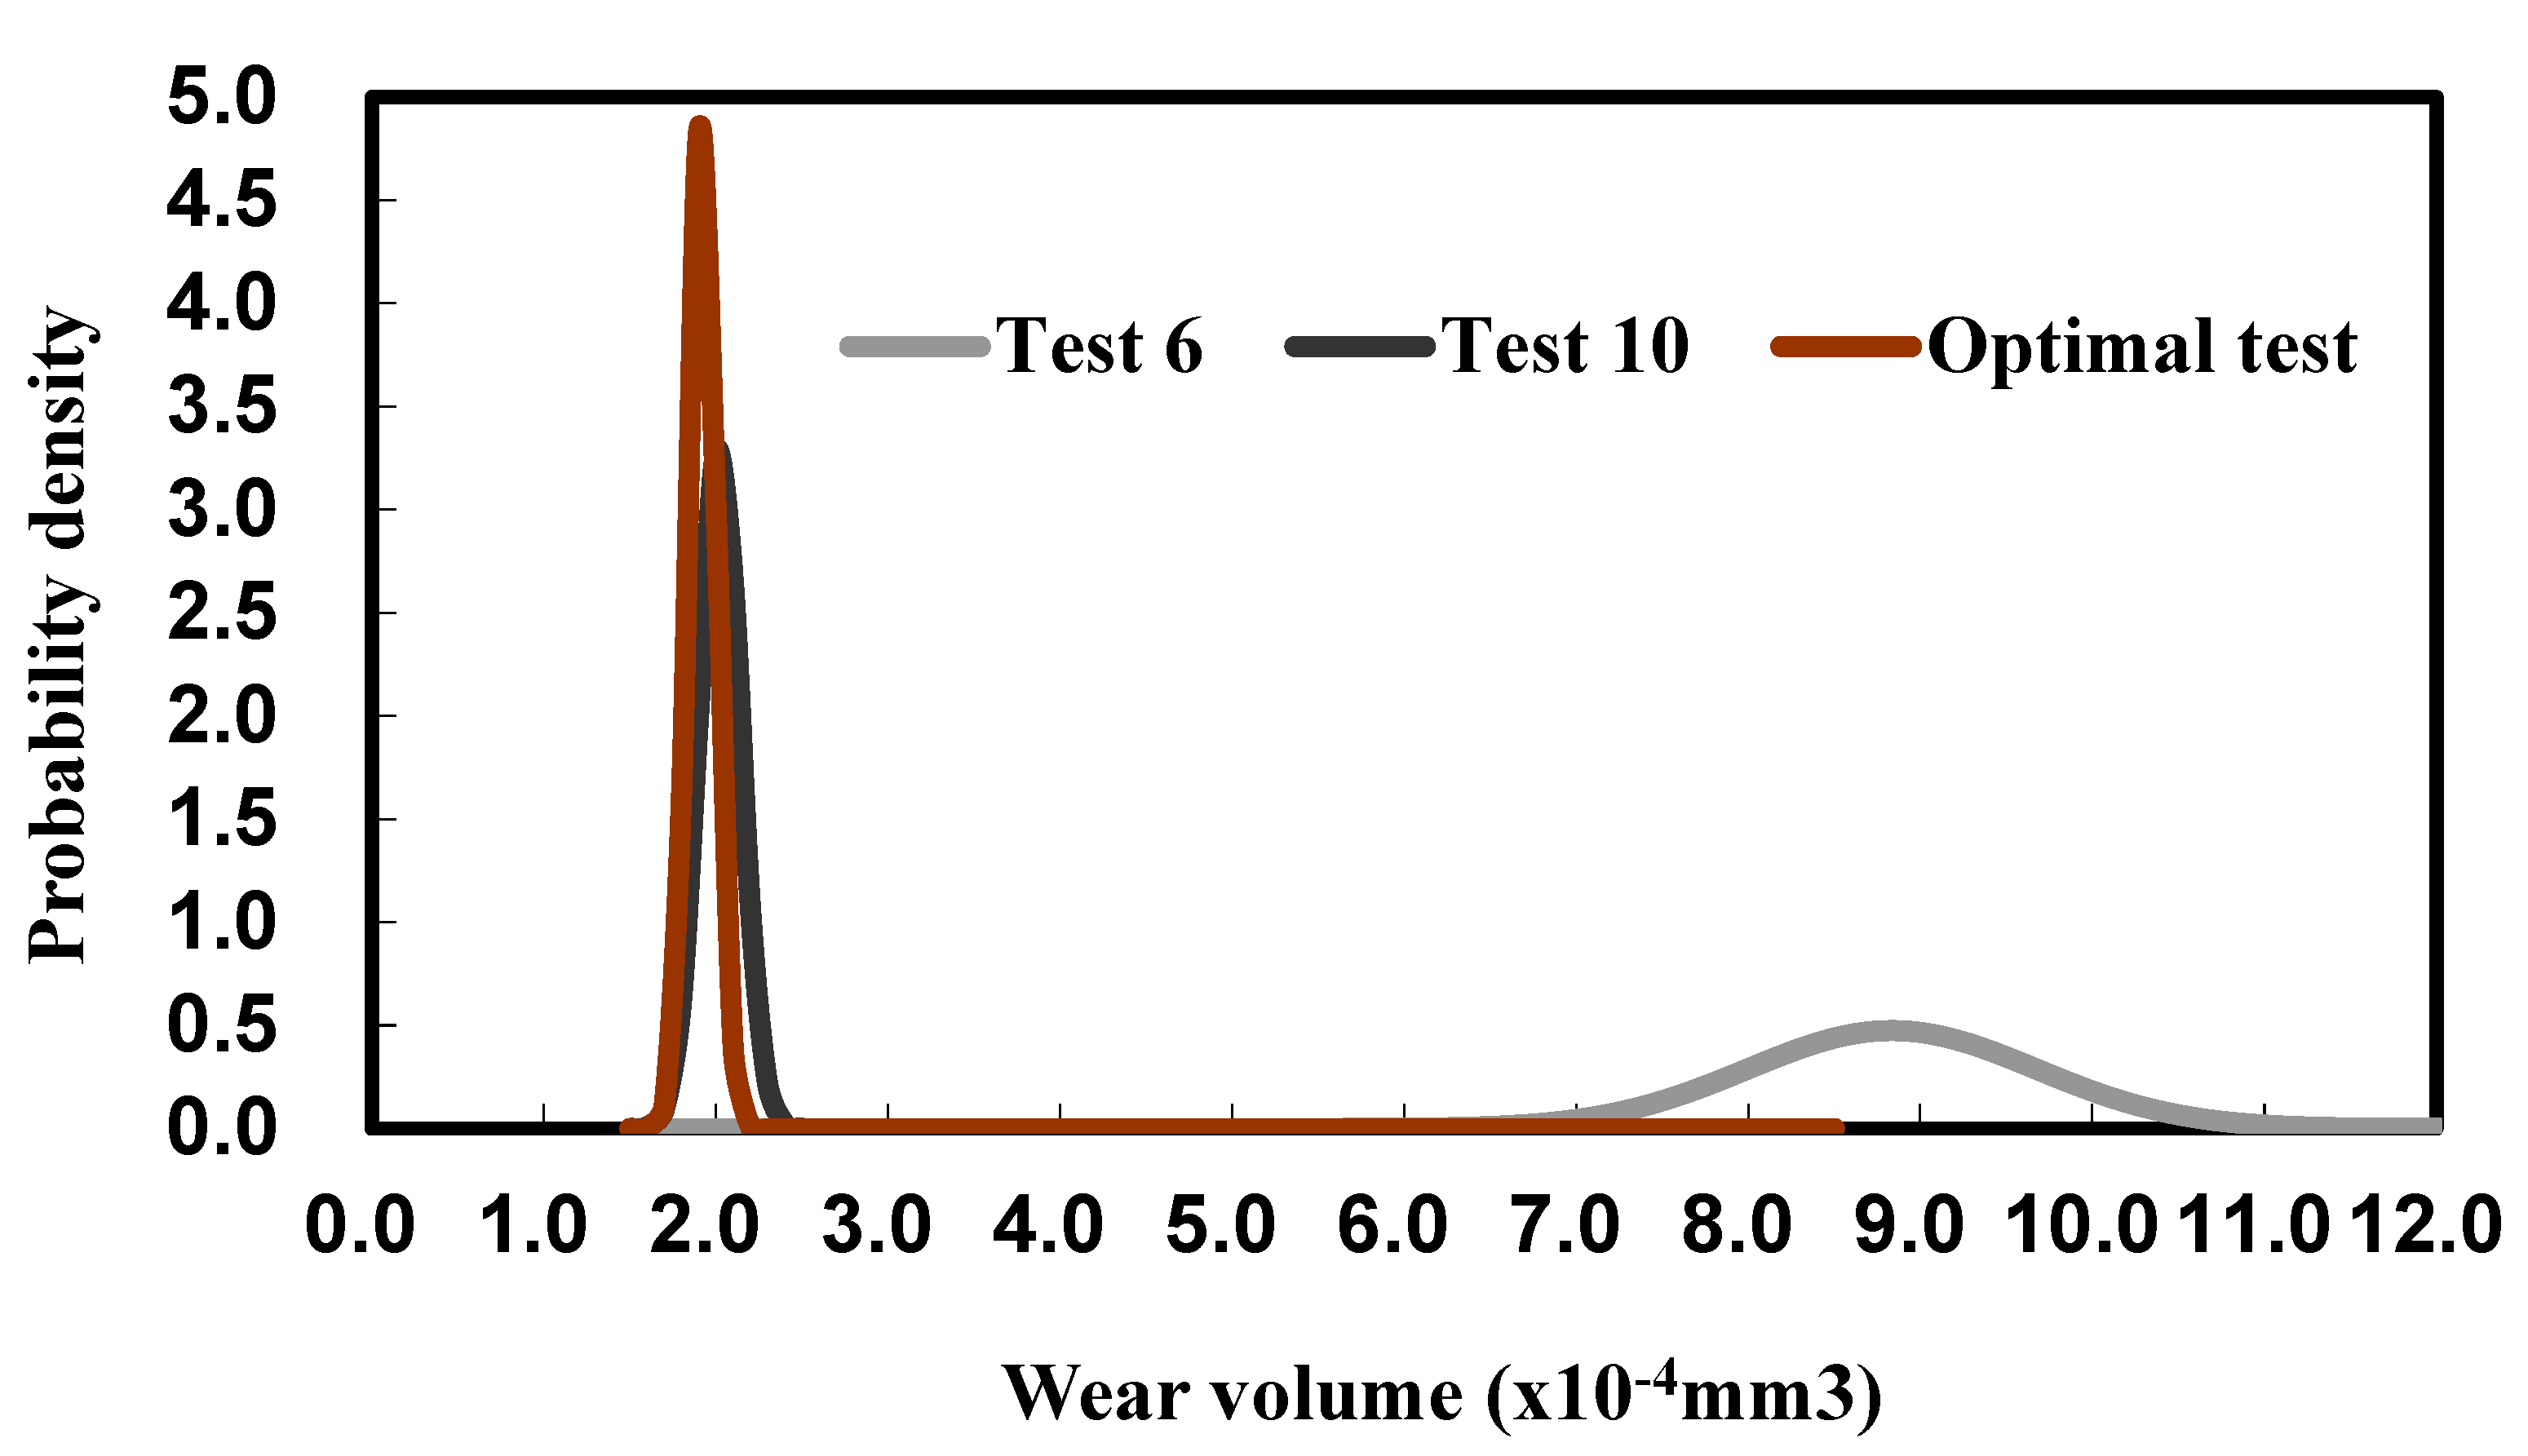

Table 1.
The chemical composition of the Co, Ni-based alloys for the WC welds in this study.
| Symbol | Weight of elements (%) | |||||
| WC | W | C | Fe | Co | Cu | S |
| >98.3 | 1.3 | 0.0013 | 0.0005 | 0.0013 | 0.0015 | |
| Co | Co | C | Fe | Al | Cu | S |
| >99.8 | 0.02 | 0.065 | 0.005 | 0.05 | 0.009 | |
| Ni | Ni | Co | Fe | Al | C | S |
| >99.9 | 0.0013 | 0.0013 | 0.01 | 0.01 | 0.0015 | |
Table 2.
Control factors and their levels for WC-Co-Ni welds by laser cladding.
| Symbol | Controllable factors | Level 1 | Level 2 | Level 3 |
| A | Substrate | 45steel | 40Cr | - |
| B | Co(%) | 0 | 10 | 20 |
| C | Ni(%) | 0 | 10 | 20 |
| D | Preheat temperature(℃) | 25 | 100 | 200 |
| E | Laser power(W) | 1000 | 1400 | 1800 |
| F | Carrier flowrate (mL/min) | 1400 | 1600 | 1800 |
| G | Scanning speed (mm/min) | 2 | 4 | 6 |
| H | Scanning height (mm) | 15 | 20 | 25 |
Table 3.
A orthogonal array with eight parameters and three levels and the observed response by laser cladding.
Table 3.
A orthogonal array with eight parameters and three levels and the observed response by laser cladding.
| No.of tests | Substrate | Co | Ni | Preheat temperature | laser power | Carrier Flowrate | Scanning Speed | Scanning height | Wear volume | S/N ratio | |
| Mean | St.dev | ||||||||||
| A | B | C | D | E | F | G | H | 10-4mm3 | dB | ||
| 1 | 1 | 0 | 0 | 25 | 1000 | 1400 | 2 | 15 | 2.105 | 0.23 | 60.61 |
| 2 | 1 | 0 | 10 | 100 | 1400 | 1600 | 4 | 20 | 2.470 | 0.65 | 59.20 |
| 3 | 1 | 0 | 20 | 200 | 1800 | 1800 | 6 | 25 | 3.570 | 0.75 | 57.84 |
| 4 | 1 | 10 | 0 | 25 | 1400 | 1600 | 6 | 25 | 2.400 | 0.35 | 59.69 |
| 5 | 1 | 10 | 10 | 100 | 1800 | 1800 | 2 | 15 | 3.330 | 0.52 | 58.02 |
| 6 | 1 | 10 | 20 | 200 | 1000 | 1400 | 4 | 20 | 8.835 | 0.84 | 56.52 |
| 7 | 1 | 20 | 0 | 100 | 1000 | 1800 | 4 | 25 | 3.810 | 0.49 | 57.23 |
| 8 | 1 | 20 | 10 | 200 | 1400 | 1400 | 6 | 15 | 7.160 | 0.95 | 56.81 |
| 9 | 1 | 20 | 20 | 25 | 1800 | 1600 | 2 | 20 | 5.105 | 0.87 | 56.10 |
| 10 | 2 | 0 | 0 | 200 | 1800 | 1600 | 4 | 15 | 2.020 | 0.12 | 60.70 |
| 11 | 2 | 0 | 10 | 25 | 1000 | 1800 | 6 | 20 | 2.495 | 0.35 | 59.27 |
| 12 | 2 | 0 | 20 | 100 | 1400 | 1400 | 2 | 25 | 3.330 | 0.62 | 58.02 |
| 13 | 2 | 10 | 0 | 100 | 1800 | 1400 | 6 | 20 | 2.355 | 0.36 | 59.42 |
| 14 | 2 | 10 | 10 | 200 | 1000 | 1600 | 2 | 25 | 3.050 | 0.41 | 58.22 |
| 15 | 2 | 10 | 20 | 25 | 1400 | 1800 | 4 | 15 | 7.365 | 0.75 | 56.70 |
| 16 | 2 | 20 | 0 | 200 | 1400 | 1800 | 2 | 20 | 3.375 | 0.42 | 57.90 |
| 17 | 2 | 20 | 10 | 25 | 1800 | 1400 | 4 | 25 | 4.050 | 0.51 | 56.97 |
| 18 | 2 | 20 | 20 | 100 | 1000 | 1600 | 6 | 15 | 8.485 | 0.49 | 56.25 |
Table 4.
The chemical composition of silicon carbide with nickel additives by weight percentage (%) of atomic concentration as shown by EDS surface analysis in Figure 1.
Table 4.
The chemical composition of silicon carbide with nickel additives by weight percentage (%) of atomic concentration as shown by EDS surface analysis in Figure 1.
| No. of trials |
Atomic concentration(%) | ||||||
| W | O | C | Fe | Ni | Co | ||
| WC | A(white) | 84.167 | 3.774 | 0.866 | 11.193 | 0.000 | 0.000 |
| B(black) | 68.122 | 7.338 | 0.717 | 23.742 | 0.000 | 0.000 | |
| C(grey) | 88.099 | 2.412 | 0.000 | 3.736 | 0.000 | 0.000 | |
| WC/Ni | A | 97.209 | 0.884 | 1.023 | 0.624 | 0.260 | 0.000 |
| B | 87.608 | 8.248 | 1.897 | 0.000 | 0.781 | 0.000 | |
| C | 88.099 | 2.412 | 0.000 | 4.603 | 4.49 | 0.000 | |
| WC/Co | A | 90.516 | 2.31 | 1.464 | 4.652 | 0.000 | 0.725 |
| B | 64.295 | 9.932 | 4.23 | 21.148 | 0.000 | 0.092 | |
| C | 62.563 | 21.66 | 2.131 | 12.402 | 0.000 | 0.081 | |
| WC/Co/Ni | A | 82.291 | 4.108 | 0.677 | 6.700 | 3.717 | 2.906 |
| B | 54.965 | 36.235 | 1.284 | 5.574 | 1.656 | 0.000 | |
| C | 86.027 | 5.275 | 0.567 | 4.799 | 1.935 | 1.427 | |
Table 5.
Analysis of variance.
| Symbol |
Sum of Squares |
Degree of Freedom |
Mean square |
F-test |
Contribution percent |
| A | 1.82 | 1 | 1.82 | 7.63 | 0.59 |
| B | 108.36 | 2 | 54.18 | 226.6 | 34.82 |
| C | 140.9 | 2 | 70.45 | 294.64 | 45.28 |
| D | 3.17 | 2 | 1.58 | 6.64 | 1.02 |
| E | 20.24 | 2 | 10.12 | 42.33 | 6.51 |
| F | 9.56 | 2 | 4.78 | 20 | 3.07 |
| G | 9.033 | 2 | 4.51 | 18.88 | 2.9 |
| H | 17.59 | 2 | 8.79 | 36.78 | 5.65 |
| Error | 0.47 | 2 | 0.23 | 1 | 0.15 |
Table 6.
Analysis of variance of response of wear volume based on linear, interaction and quadratic functions.
Table 6.
Analysis of variance of response of wear volume based on linear, interaction and quadratic functions.
| Symbol | Degree of Freedom |
Sum of Squares |
Mean square |
F-test | Prob > F | Adjust-R2 |
| First-order model | 4 | 70.54 | 17.63 | 20.49 | 0.000 | 0.82 |
| Interaction model | 10 | 76.23 | 7.62 | 9.71 | 0.0032 | 0.84 |
| Second-order model | 14 | 77.86 | 5.56 | 4.31 | 0.1273 | 0.73 |
Table 7.
The estimated coefficient of regression and p-value for linear, interaction and quadratic models.
Table 7.
The estimated coefficient of regression and p-value for linear, interaction and quadratic models.
| Second-order model | Interaction model | ||||||
| Source | Coefficient Estimate |
t- statistical |
Prob > F | Source | Coefficient Estimate |
t- statistical |
Prob > F |
| Intercept | 9.0616 | 0.579 | 0.6032 | Intercept | 12.3394 | 2.1465 | 0.069 |
| B | 0.347 | 0.9442 | 0.4147 | B | 0.153 | 0.8176 | 0.4405 |
| C | 0.1333 | 0.331 | 0.7624 | C | 0.4325 | 1.9486 | 0.0924 |
| E | 0.0024 | 0.1687 | 0.8768 | E | -0.0046 | -1.3315 | 0.2248 |
| H | -0.6669 | -0.5984 | 0.5918 | H | -0.6474 | -2.0972 | 0.0742 |
| BC | -0.0011 | -0.1593 | 0.8835 | BC | -0.0034 | -0.7425 | 0.4819 |
| BE | -0.0002 | -1.0098 | 0.387 | BE | -0.0001 | -1.3688 | 0.2134 |
| BH | 0.0138 | 0.9863 | 0.3967 | BH | 0.0095 | 1.0201 | 0.3416 |
| CE | -0.0001 | -0.6562 | 0.5585 | CE | -0.0002 | -1.6971 | 0.1335 |
| CH | 0.0093 | 0.6078 | 0.5862 | CH | -0.0005 | -0.0593 | 0.9544 |
| EH | 0.0004 | 1.3075 | 0.2822 | EH | 0.0003 | 1.5289 | 0.1701 |
| B2 | -0.0084 | -0.9502 | 0.4121 | First-order model | |||
| C2 | 0.0002 | 0.0236 | 0.9827 | Source | Coefficient Estimate |
t- statistical |
Prob > F |
| E2 | 0.0000 | -0.6321 | 0.5722 | ||||
| H2 | -0.0063 | -0.2081 | 0.8485 | Intercept | 7.1378 | 4.7933 | 0.0004 |
| B | 0.1348 | 5.0347 | 0.0002 | ||||
| C | 0.1652 | 6.1673 | 0.000 | ||||
| E | -0.0019 | -2.8876 | 0.0127 | ||||
| H | -0.1713 | -3.1988 | 0.007 | ||||
Disclaimer/Publisher’s Note: The statements, opinions and data contained in all publications are solely those of the individual author(s) and contributor(s) and not of MDPI and/or the editor(s). MDPI and/or the editor(s) disclaim responsibility for any injury to people or property resulting from any ideas, methods, instructions or products referred to in the content. |
© 2024 by the authors. Licensee MDPI, Basel, Switzerland. This article is an open access article distributed under the terms and conditions of the Creative Commons Attribution (CC BY) license (http://creativecommons.org/licenses/by/4.0/).
Copyright: This open access article is published under a Creative Commons CC BY 4.0 license, which permit the free download, distribution, and reuse, provided that the author and preprint are cited in any reuse.


