Submitted:
02 October 2024
Posted:
02 October 2024
You are already at the latest version
Abstract
We developed and applied a new calibration method to make the measurement more accurate with our multi-color ellipsometric mapping tool from cheap parts. Ellipsometry is an optical technique that measures the relative change in polarization state of the measurement beam induced by reflection from or transmission though a sample. During the conventional ellipsometric measurement, the data collection is relatively slower and measures one spot at a time, so mapping needs long time compared with our new optical mapping equipment made by an ordinary color LED monitor and a polarization sensitive camera. The angle-of-incidence and the incident polarization state is varied point-by-point so a special optical calibration method is needed. Three SiO2 samples with different thicknesses were used to determine point-by-point the angle-of-incidence and rho corrections. After the calibration, another SiO2 sample was measured and analyzed using the calibrated corrections and this sample further was independently measured using a conventional spectroscopic ellipsometer. The difference between the two measured thickness maps is less than 1 nm. Our optical mapping tool from cheap parts is faster and covers wider area samples in relative to the conventional ellipsometers and these correction enhancements further signify its performance.
Keywords:
ellipsometry
; optical mapping
; multi-color
; polarization
; thin films
; photovoltaic
1. Introduction
Non-destructive optical techniques are crucial in almost all disciplines of science, especially in the field of materials science like thin films characterization in photovoltaics, microelectronics and other tasks as it can be used during all the stages of the manufacturing processes of the material sample. One of such techniques is the spectroscopic ellipsometry (SE). SE is a non-destructive, non- invasive and non-intrusive optical technique. It measures the relative change in polarization state of the measurement beam induced by reflection from or transmission though a sample. Generally, ellipsometry technique use collimated light beams with a well-defined angle of incidence to illuminate the sample. Nevertheless, a non-parallel expanded light beam with precision suitable for real-time mapping, production lines and quality control can also be used [1].
During in situ real-time measurement, fabrication and processing, ellipsometry is used to analyze the multilayered film structures, interfaces, and composites, being famous for its extreme sensitivity to very thin over layers well below 1 nm thickness [2], which makes it an efficient optical mapping tool for thin film solar cells added with its high speed measurement capability. Under appropriate circumstances, SE determines film thicknesses more accurately than any other known technique [3].
Ellipsometry measures the amplitude ratio tan ψ and phase difference Δ between the p- and s-polarizations [4], which depends on the wavelength of the light beam (λ) and the angle of incidence of the beam (θ) at the sample surface, see Figure 1.
It should be noted that this technique cannot be used at normal angle of incidence as the s-polarizations (perpendicular to the plane of incidence) and the p-polarizations (parallel to the plane incidence) cannot be distinguished one from the other, which makes the choice of the incidence angle more important. For semiconductors, the angle of incidence is typically between 60o-80 o. Generally, in ellipsometry, the angle of incidence is set at Brewster angle [5]. The general working principle of spectroscopic ellipsometry is depicted in Figure 1.
In case of light reflection, the measured complex reflectance ratio ρ is equal
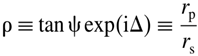
where tan ψ is the amplitude ratio, and Δ is the phase difference, rp= reflection coefficient for p-polarized light, and rs= reflection coefficient for s-polarized light.
During data analysis, information about the sample under the study is obtained by fitting measured ellipsometry spectra to optical and structural models, as ellipsometry does not give a direct information of the sample in consideration.
The purpose of this work is to make a well calibrated prototype optical mapping tool for thin film measurements using only cheap parts such as an LCD monitor and a pinhole camera with CMOS Sensor with Integrated 4-Directional Wire Grid Polarizer Array (Sony's IMX250MYR CMOS).
During the conventional ellipsometric mapping, the data collection is relatively slower and use a scanned small spot, while our new optical mapping tool from cheap parts measures a big area in one shot. Specifically, in this paper the special focus is on a newly developed calibration method. The thickness map result is independently cross checked using a commercial Woollam M2000 ellipsometer and the agreement is within 1 nm, which makes our optical mapping tool a good candidate for industrial purposes.
2. Materials and Methods
20 cm diameter SiO2 on Si samples of nominally 40, 60 and 100 nm thickness were used for calibration of angle-of-incidence and rho correction and another nominally 80 nm thickness SiO2/Si sample was used as independent check.
Note that, silicon dioxide is one of the most studied materials and widely used in semiconductor industry, due to its huge abundance, affordability and technological importance. The homogeneity of the SiO2 film was proved to be maximum 5 nm across the samples qualifying it as patterned large-area reference sample for film thickness [6].
Our optical mapping tool consists of a polarization sensitive camera (The Imaging Source Company’s DYK 33UX250 USB 3.0 Polarsens camera, a 2/3 inch Sony CMOS Pregius Polarsens sensor of model IMX250MZR Integrated with 4-Directional Wire Grid Polarizer Array) with a pinhole of sub-mm size in front of it, a Sample holder and an LCD monitor (Dell UltraSharp™ U2412M, GB-LED) as a light source for illumination of the selected sample. See Figure 2 below, for the Schematics of the experimental setup diagram, where
1) Light source 2) Vertical polarizer 3) Liquid crystal cell 4) Horizontal polarizer
5) Sample 6) Sample holder 7) Pinhole and 8) Camera sensor.
Notice that, our optical mapping ellipsometer uses a non-collimated beam (coming from the monitor screen) as a source of light, despite most conventional ellipsometers usage of collimated light beams with a well-defined angle of incidence. Our arrangement shows similarity to the solution of Bakker et al [7], using a computer screen as a light source and a webcam as a detector in an imaging off-null ellipsometer. The basis of the work is a patent from our Institute: Horváth Z Gy, Juhász G, Fried M, Major C, Petrik P: Imaging optical inspection device with a pinhole camera; EP2160591B1, Submission Number: PCT/HU2008/000058, NSZO: G01N21/8422, Country of patent: Europe.
The non-collimated beam ellipsometer set up is shown in Fig. 2. A LED-LCD monitor serves the polarized RGB colored light (see the built-in polarizer sheet, number 4 in Fig. 2 and a polarization sensitive camera behind a pinhole (7&8) together. The LCD monitor (Dell UltraSharp™ U2412M, GB-LED) is used in a 45-degree rotated position, measured by a digital angle gauge with 0.1 deg precision. In straight-through position, we can detect the extinction of the polarization sensitive camera better than 10-2.
The polarization sensitive camera sensor (The Imaging Source Company’s DYK 33UX250 USB 3.0 Polarsens camera), serves the polarization state data, from 0, 45, 90, 135-degree rotation positions (plus 3 RGB colors in each position). This arrangement is equal to a conventional static photometric rotating analyzer ellipsometer.
The sample is illuminated by a non-collimated light through a fixed polarizer at an azimuth of 45 degrees to the plane of incidence. The reflected light passes through a virtual “rotating analyzer” and the intensity is captured by a two-dimensional position sensitive photodetector system at four different angular positions of the analyzer.
Minimum 3 different analyzer positions are required. These four polarization states (intensity) data (at 0, 45, 90, 135-degree rotation positions) are enough (the fourth date is good to reduce the error) to determine the ellipsometric angles: ψ and Δ. Our camera serves the data for 3 colors, so we have 3x2 measured ψ and Δ.
Theoretically, perfect linearly polarized light is coming from the monitor at 3 different (red, green, blue) light-bands. If this is true, then we should measure 1 and 1 for tan ψ and cos Δ, if we measure without a sample, but we direct the camera to the monitor. The result of such measurement can be seen below in Figure 4. This measurement shows the fact that a point-by-point ρ-correction calibration is needed.
Three SiO2 sample with different thicknesses (nominally 40 nm, 60 nm and 100 nm) on Silicon substrates were used for the calibration process:
Monitor-correction are calculated using the following equation:
where ρopt is the measured value with perfect light source, ρmeas is the actually measured value and ρmonitor is the ρ-correction. We measure three SiO2/Si samples with different thicknesses. We determine 3*N*2 ψ and Δ (where N is the number of different wavelengths, presently 3) and we should calculate (fit) 2*N+3+1 unknown calibration values for a full calibration: N*real(ρmonitor) and N*im(ρmonitor) + 3 thicknesses + 1 actual angle of incidence in each points and each wavelengths. The thicknesses and angle-of-incidences are only place-dependents, but the ρ-corrections (ρmonitor) are place- and wavelength-dependents.
ρopt=ρmeas*ρmonitor (different for each point and each wavelength)
The basic equations for theses evaluations are the Fresnel equations. Below are the equations for the optical interference in an ambient/thin film/substrate optical model.
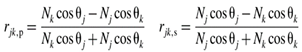
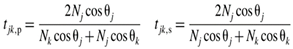
Where,
N=n-ik, the comples refractive index.
r and t are the complex reflection coefficient and complex transmission coefficient for p- and s-polarized lights respectively.
Ɵj and Ɵk are the angle of incidence and transmission respectively, and are related by the Snell`s law
NjsinƟj=NksinƟk
Ellipsometry is an indirect measurement method, generally the measured values (ellipsometric angles) cannot be converted directly into the physical parameters, i.e. thicknesses and optical constants of the sample. Normally, an optical model is supposed and a fitting procedure is used to evaluate the variable parameters. Finding the best match between the model and the experiment is typically achieved through regression, where the computer-program calculates the ellipsometric angles (based on the optical model) and compare them with the measured ones. An estimator, such as the Mean Squared Error (MSE), is used to quantify the difference between the calculated and measured ellipsometric angles. The lower MSE indicates a better fit and better optical model. In our calibration process, we fit the angle-of-incidence (wavelength independent), the 3 thicknesses (wavelength independent), and the ρmonitor (wavelength dependent), point-by-point.
A special software or program is required to perform this complicated calibration process, because we should fit the results in a complicated manner, fitting all the 10 unknown parameters in the same time using the measurements of the 3 different oxides. Mainly, a MatLab program with some other complementary softwares have been used in our case to analyze and interpret the experimental results.
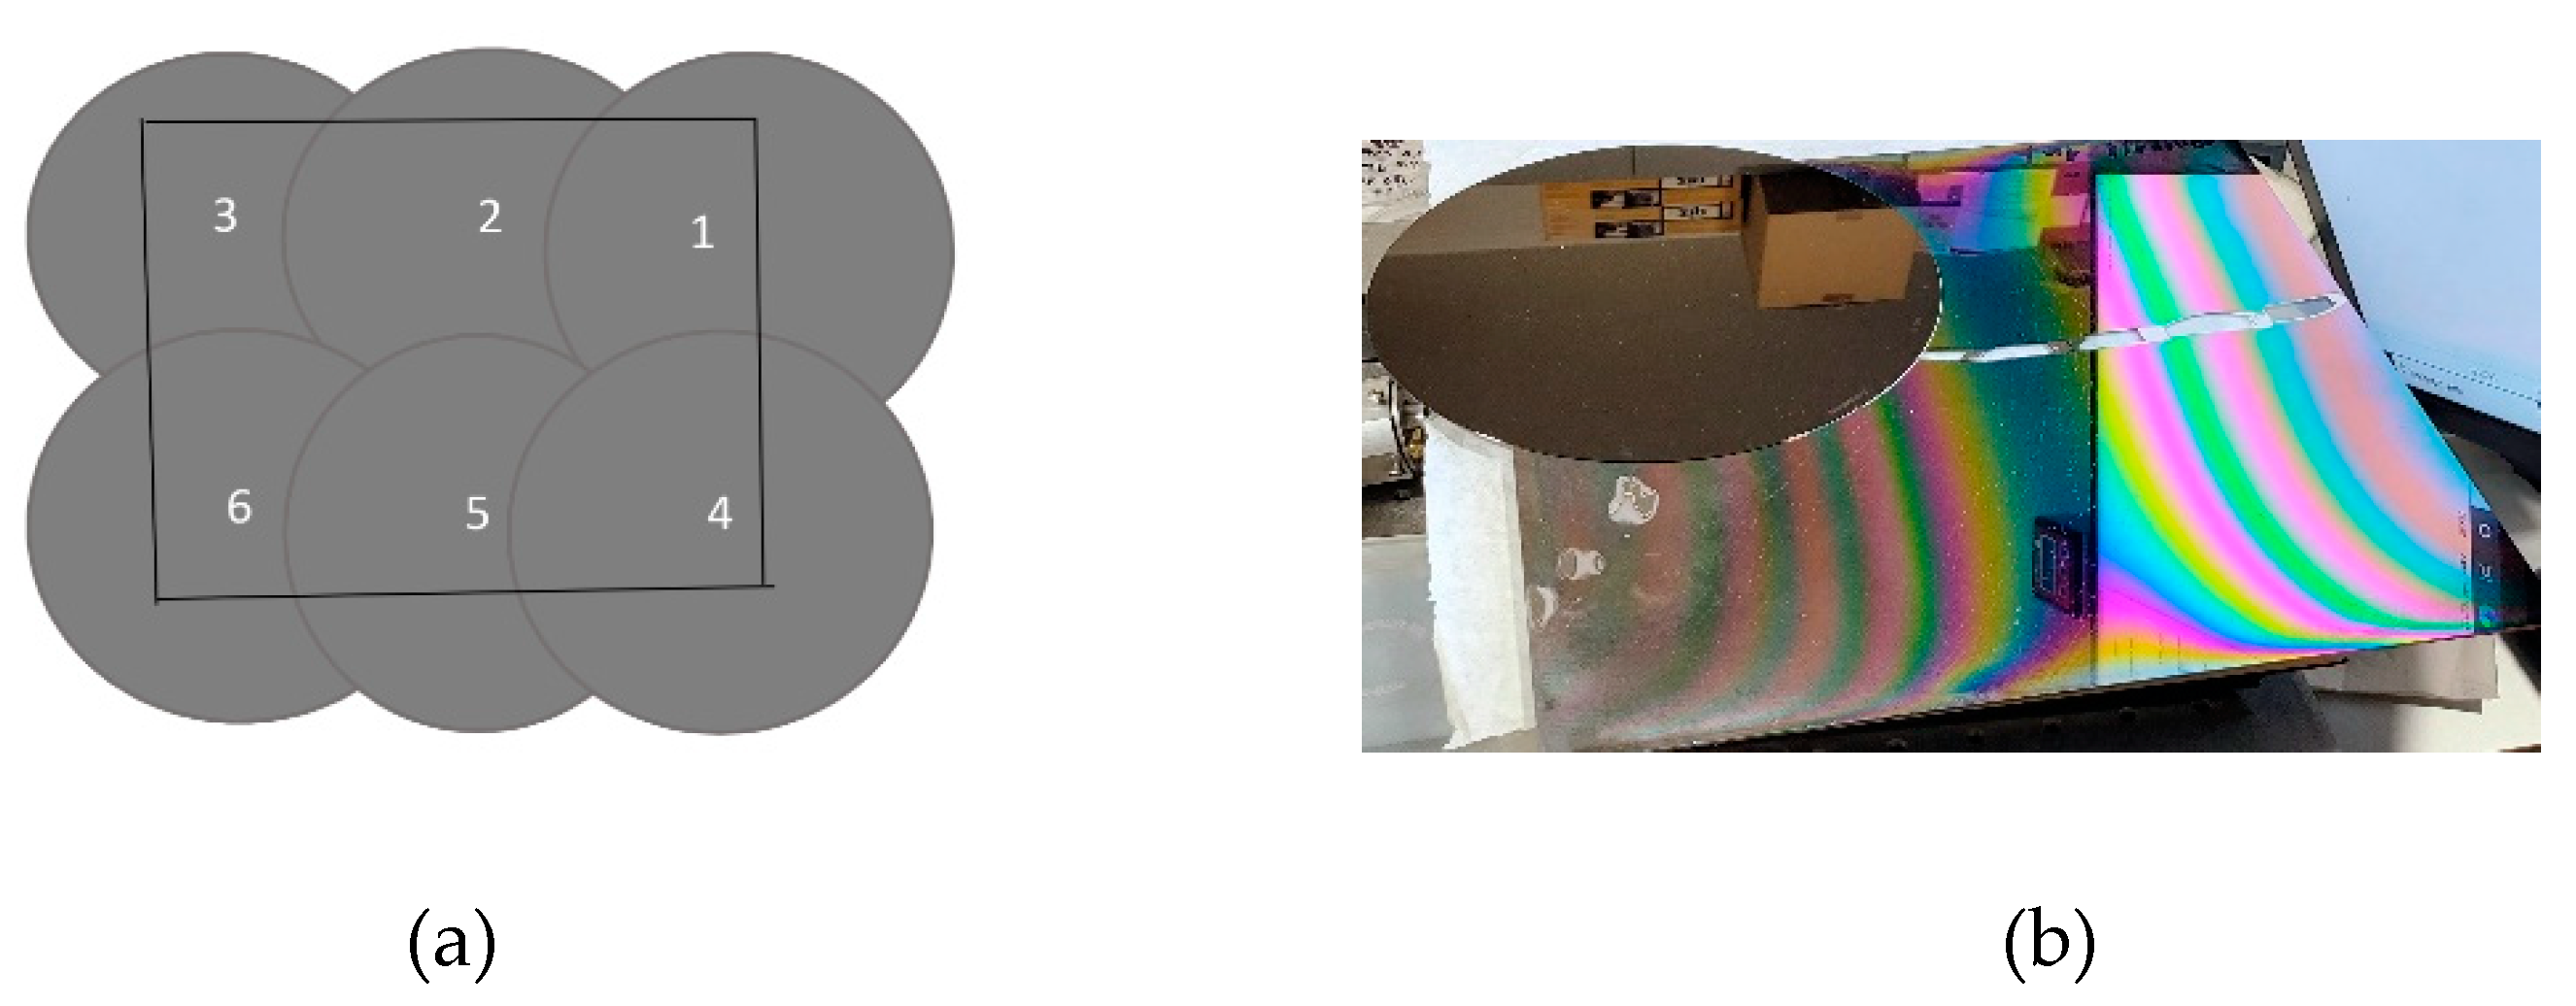
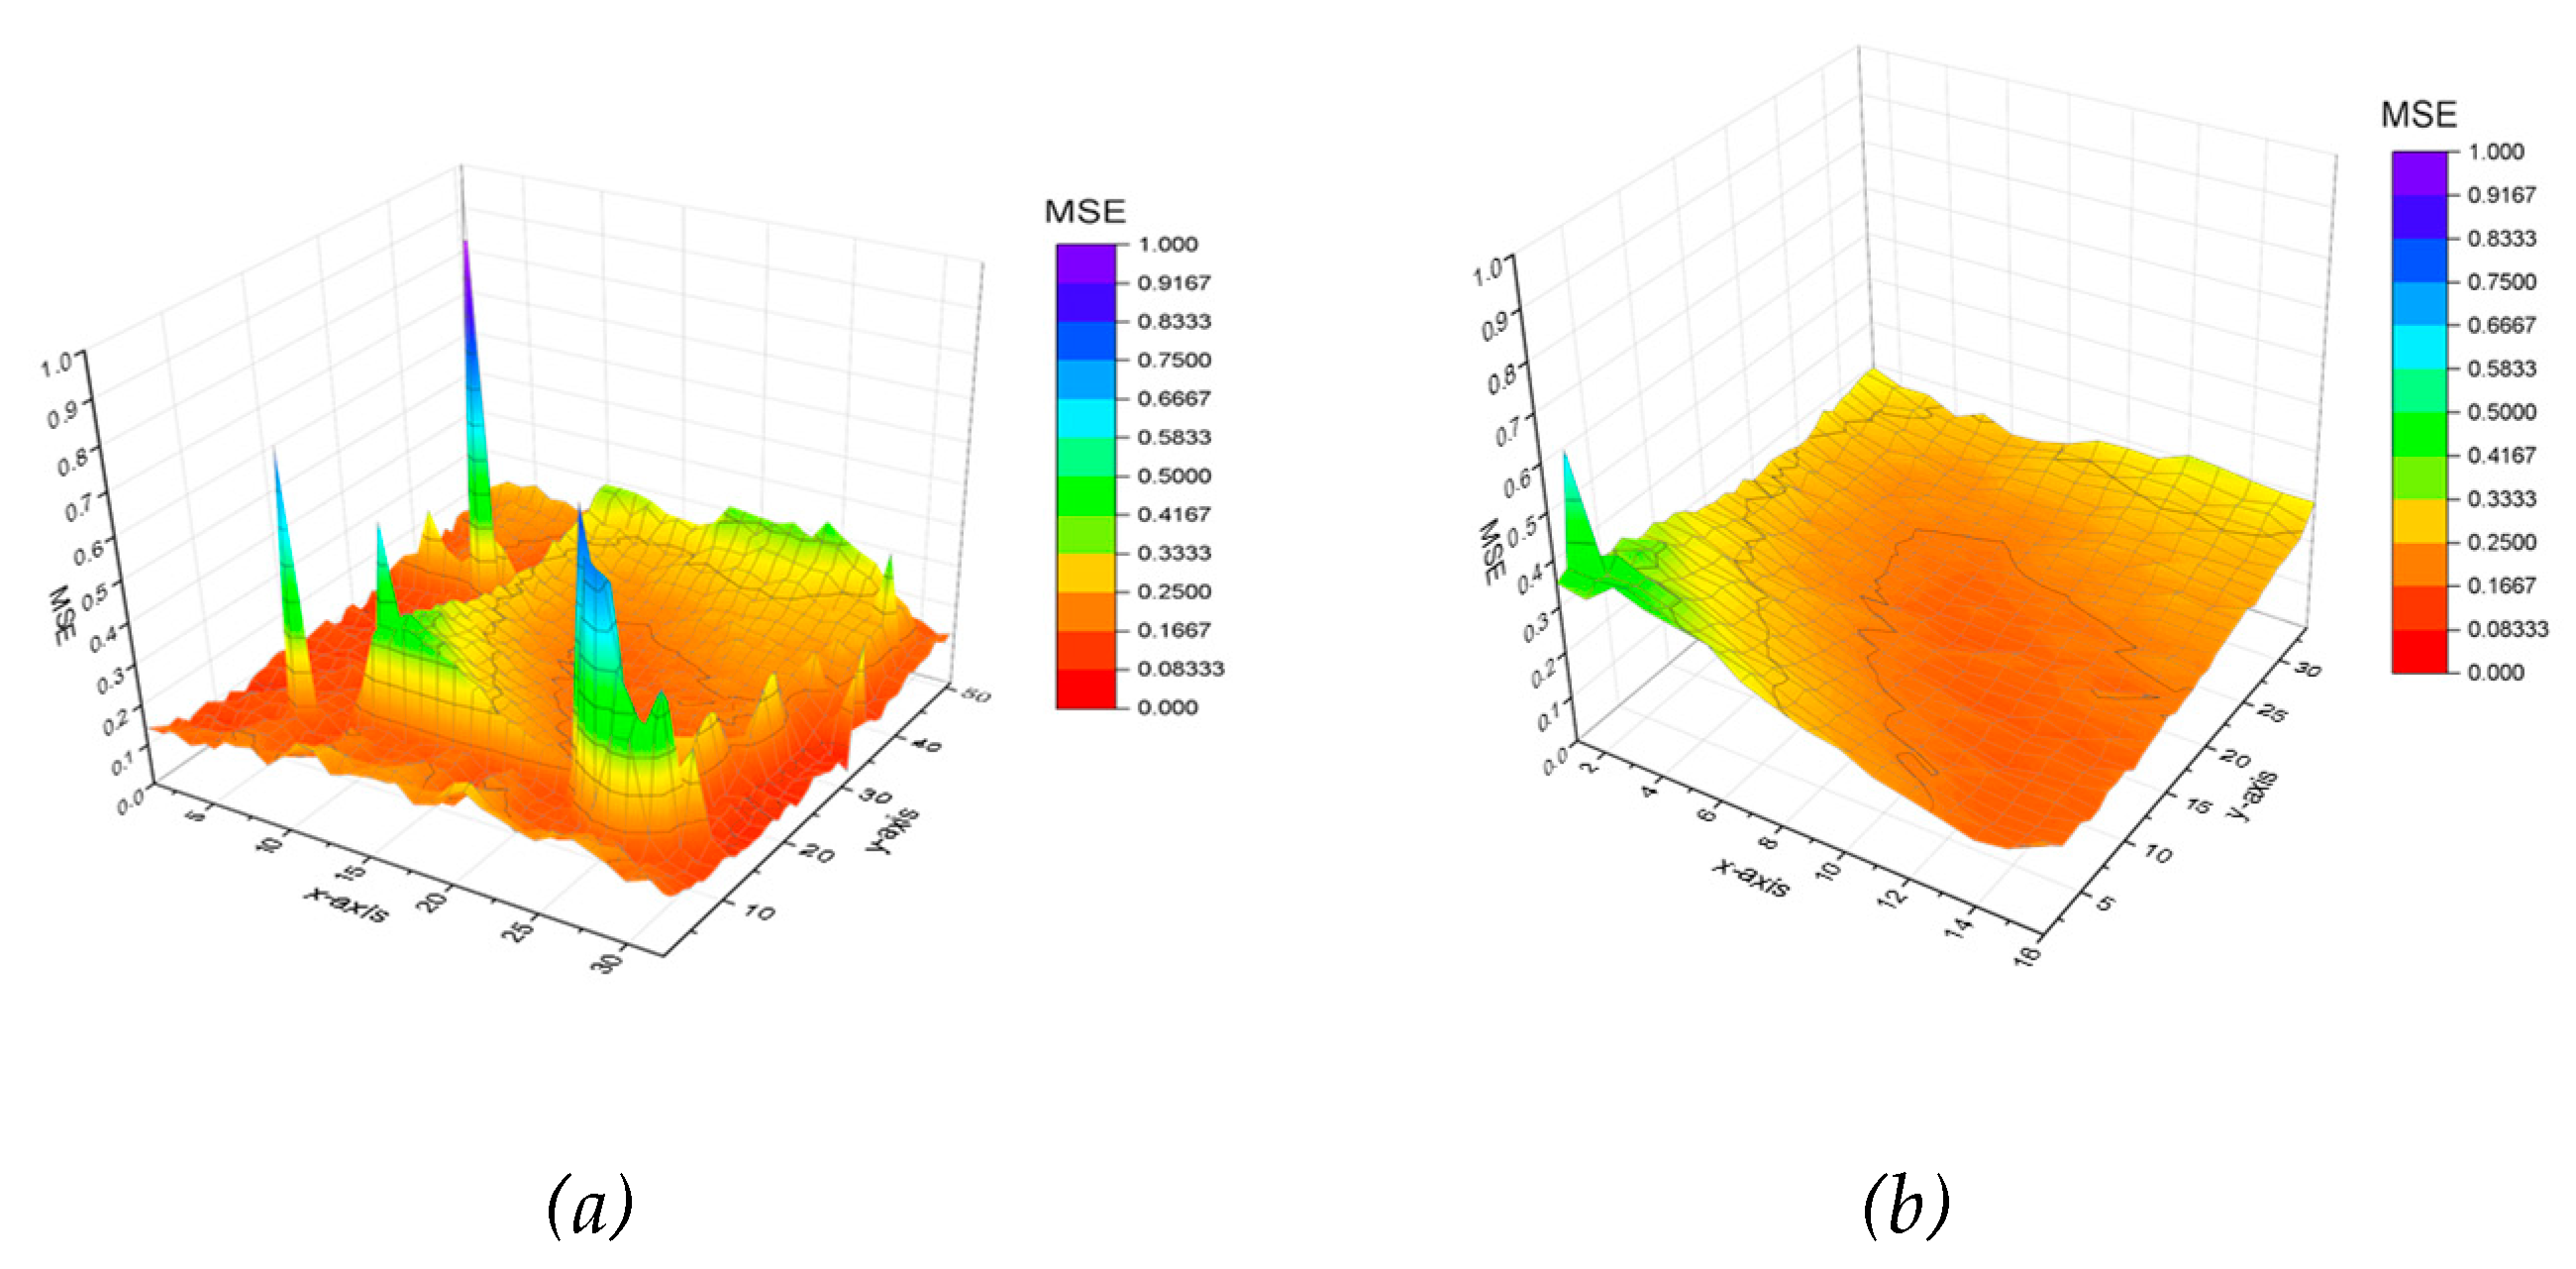
Each 20 cm diameter oxide sample was placed at six different positions on the 30x30 cm holder, see Figure 3. After the fitting procedure, we get the thickness values, the angle-of-incidence values, the ρmonitor values, and the MSE (mean square error, the goodness of the fit), which is the squared difference between the measured and calculated ψ and Δ values. The fitted thickness, the angle and ρ values were collected according to the low MSE values, see Figure 5. As each oxide sample is put at a specific position on the substrate, significant errors can be seen several places due to the edges or the insufficient illumination from the monitor. We merged the maps according to the lower MSE, and checking that what parts of the maps (angle of incidence, thicknesses and ρmonitor values) are “smooth” enough. As a result, the pixels in the mapping figures were truncated, where the MSE is not low enough, and where values changes step-like manner. At last, we diagnosed that we can use reliably only the central 20x15 cm part.
Figure 3.
Position order of a SiO2 sample, on six different positions at different places. (a) Sample position order model (b) Sample at 3rd position.
Figure 3.
Position order of a SiO2 sample, on six different positions at different places. (a) Sample position order model (b) Sample at 3rd position.
3. Results
It is a common scientific practice to check any device or a setup for an accuracy and precision and trying to correct any errors or malfunctions on the setup through calibration and comparing with other corresponding standard models. Accordingly, a direct monitor measurement is taken in our setup and we noticed, rather confirmed, that we need error correction and calibration of the experiment setup. Figure 4 below show the result of direct-monitor measurements, tan ψ and cos Δ values for each color, Red, Blue and Green. The systematic alterations form 1 in the maps show measurement errors in our optical mapping tool that justify the need for a special calibration.
Figure 4.
Figures show experiment results of tan ψ and cos Δ values for each color from the direct monitor measurement.
Figure 4.
Figures show experiment results of tan ψ and cos Δ values for each color from the direct monitor measurement.
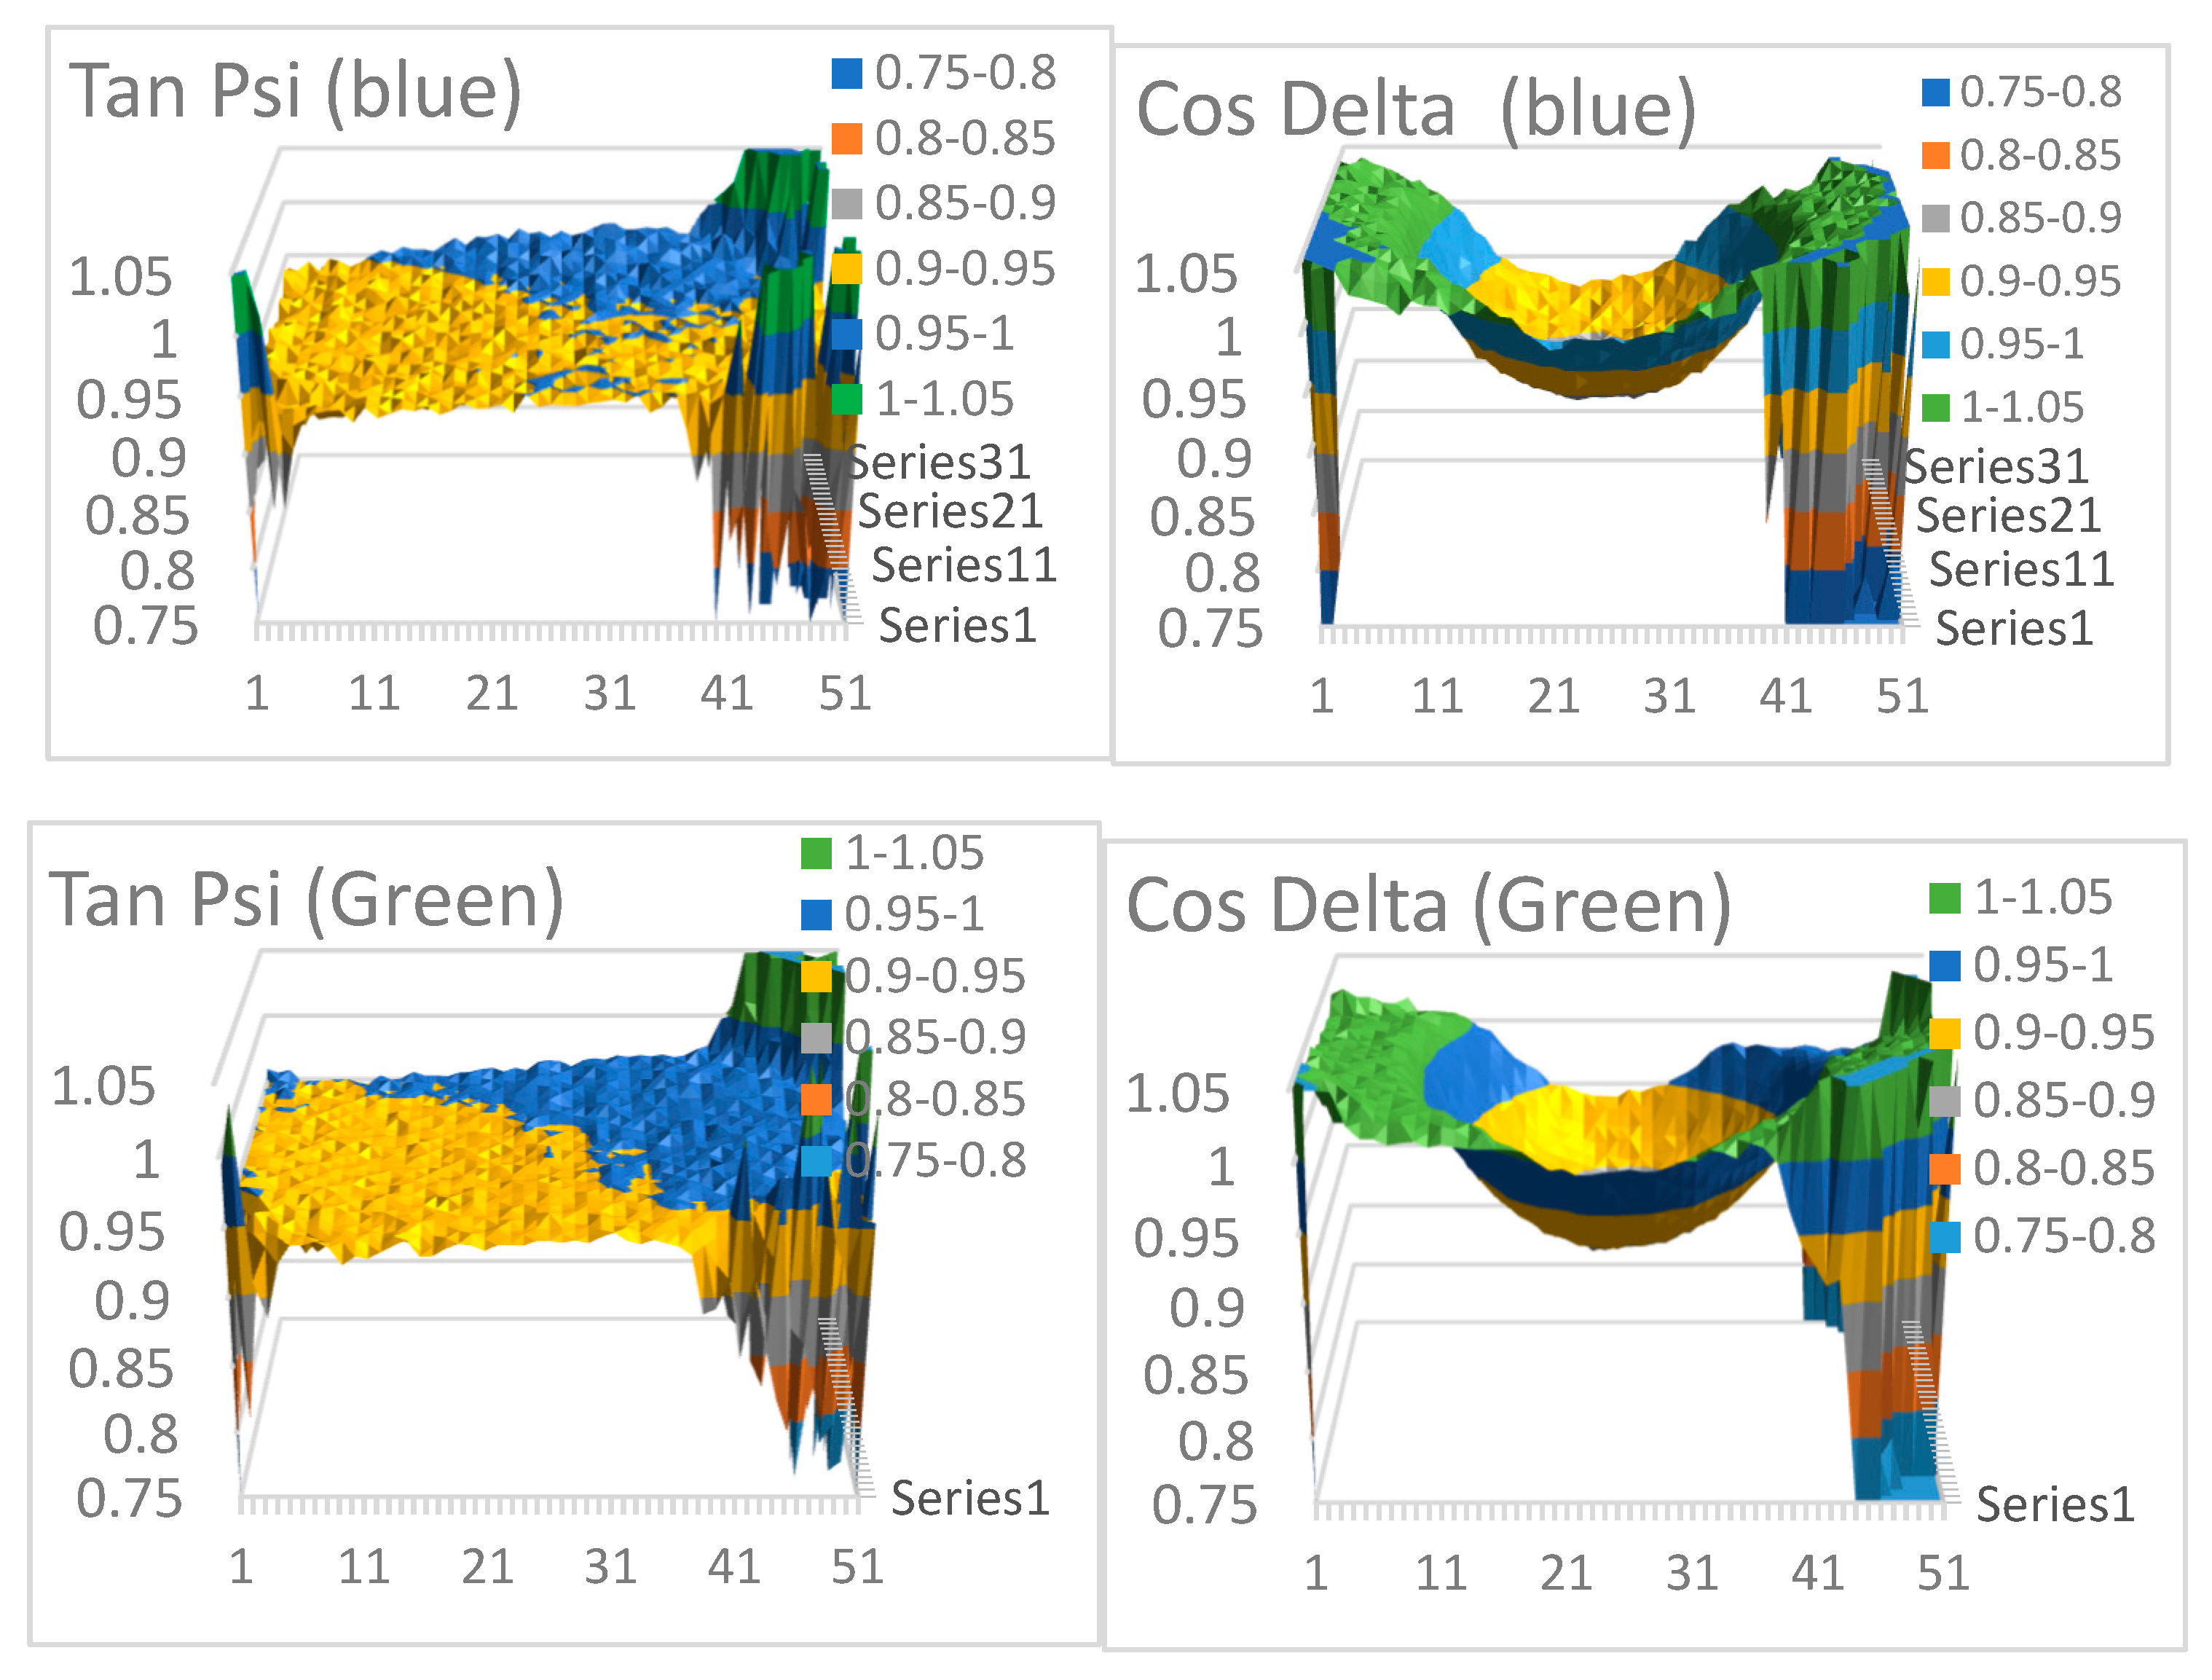
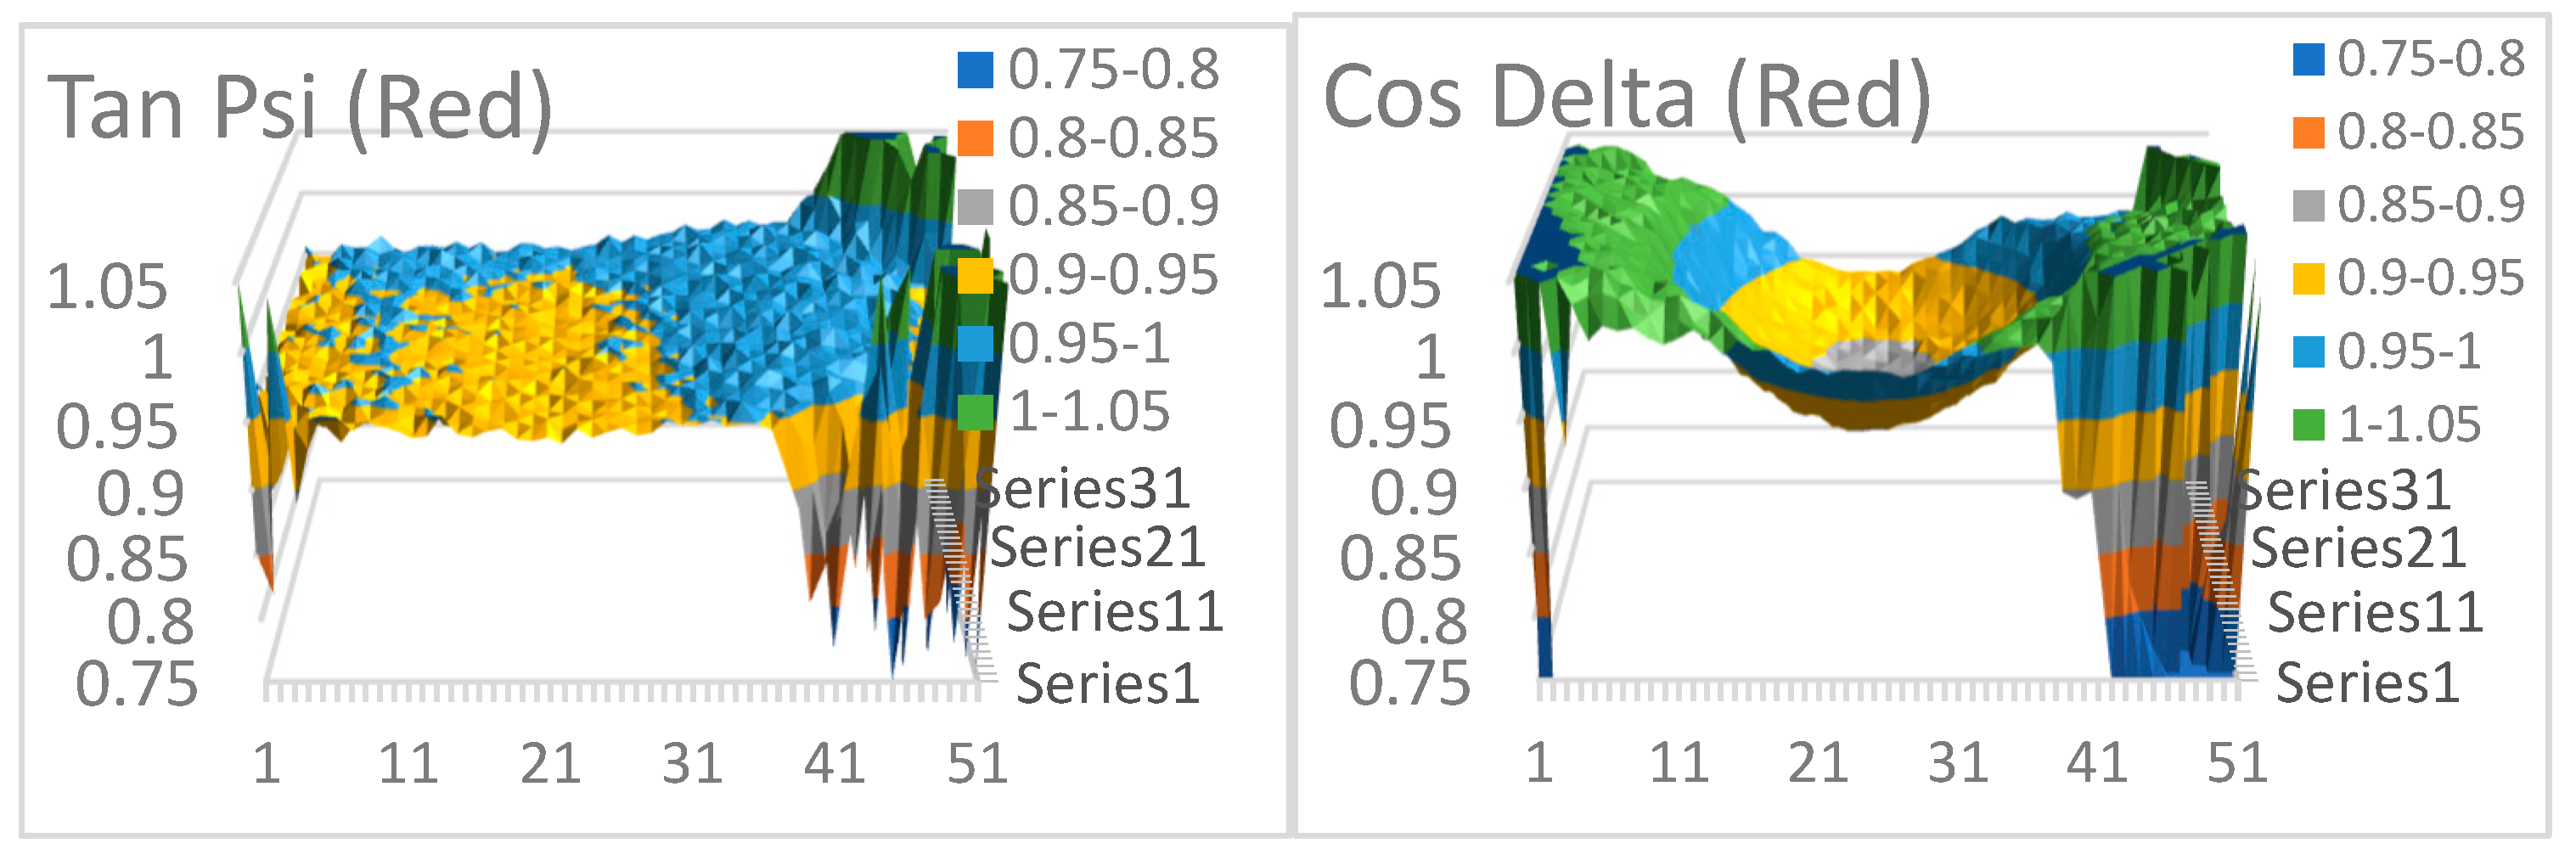
The camera directly measured the monitor pixels without a reflecting sample. Ideally, if the light-source had been perfectly linearly polarized, the values should be 1. The results showed the necessity of the calibration measurements and the use of the calculated ρ-monitor-correction. The polarization state (from the monitor) is depending on the angle.
Three SiO2/Si samples of nominally 40, 60 and 100 nm thickness were used for the calibration process and another nominally 80 nm SiO2/Si sample was analyzed using the calibration values from the three oxide samples. The experimental data is collected for each three oxide samples and then, six different positions of each sample was used in the calibration process. The experimental figures shown in this paper are mostly deduced by excluding pixels with high MSE values that deviate the results from the true expected values, prioritizing points of only low MSE. Figure 5 (b) shows the MSE-map of the central 20x15 cm part where the measurement proved to reliable.
Figure 5.
(a). Merged MSE full map (b). Low MSE pixels map.
The result of the angle-of-incidence calibration is shown in Figure 6. Using the same criterions (low MSE, smooth map), we refined the angle-of-incidence map (Figure 6 b) from the angle-of-incidence full map (Fig. 6 a). As it can be seen in Figure 6 (b), the angle-of-incidence varies smoothly across the surface, which agrees with the theoretical values. This refined angle-of-incidence map was used latter to evaluate the nominally 80 nm SiO2/Si sample thickness map.
The same calibration process resulted the thickness maps of our calibration oxide samples (nominally 40, 60 and 100 nm thickness) which are shown below in Figure 7.
The calibrated ρmonitor values for the specific setting of the device are also mapped, see Figure 8. These values differ only by less than 0.3 from the ideal values, so we can use them to evaluate independent measurements.
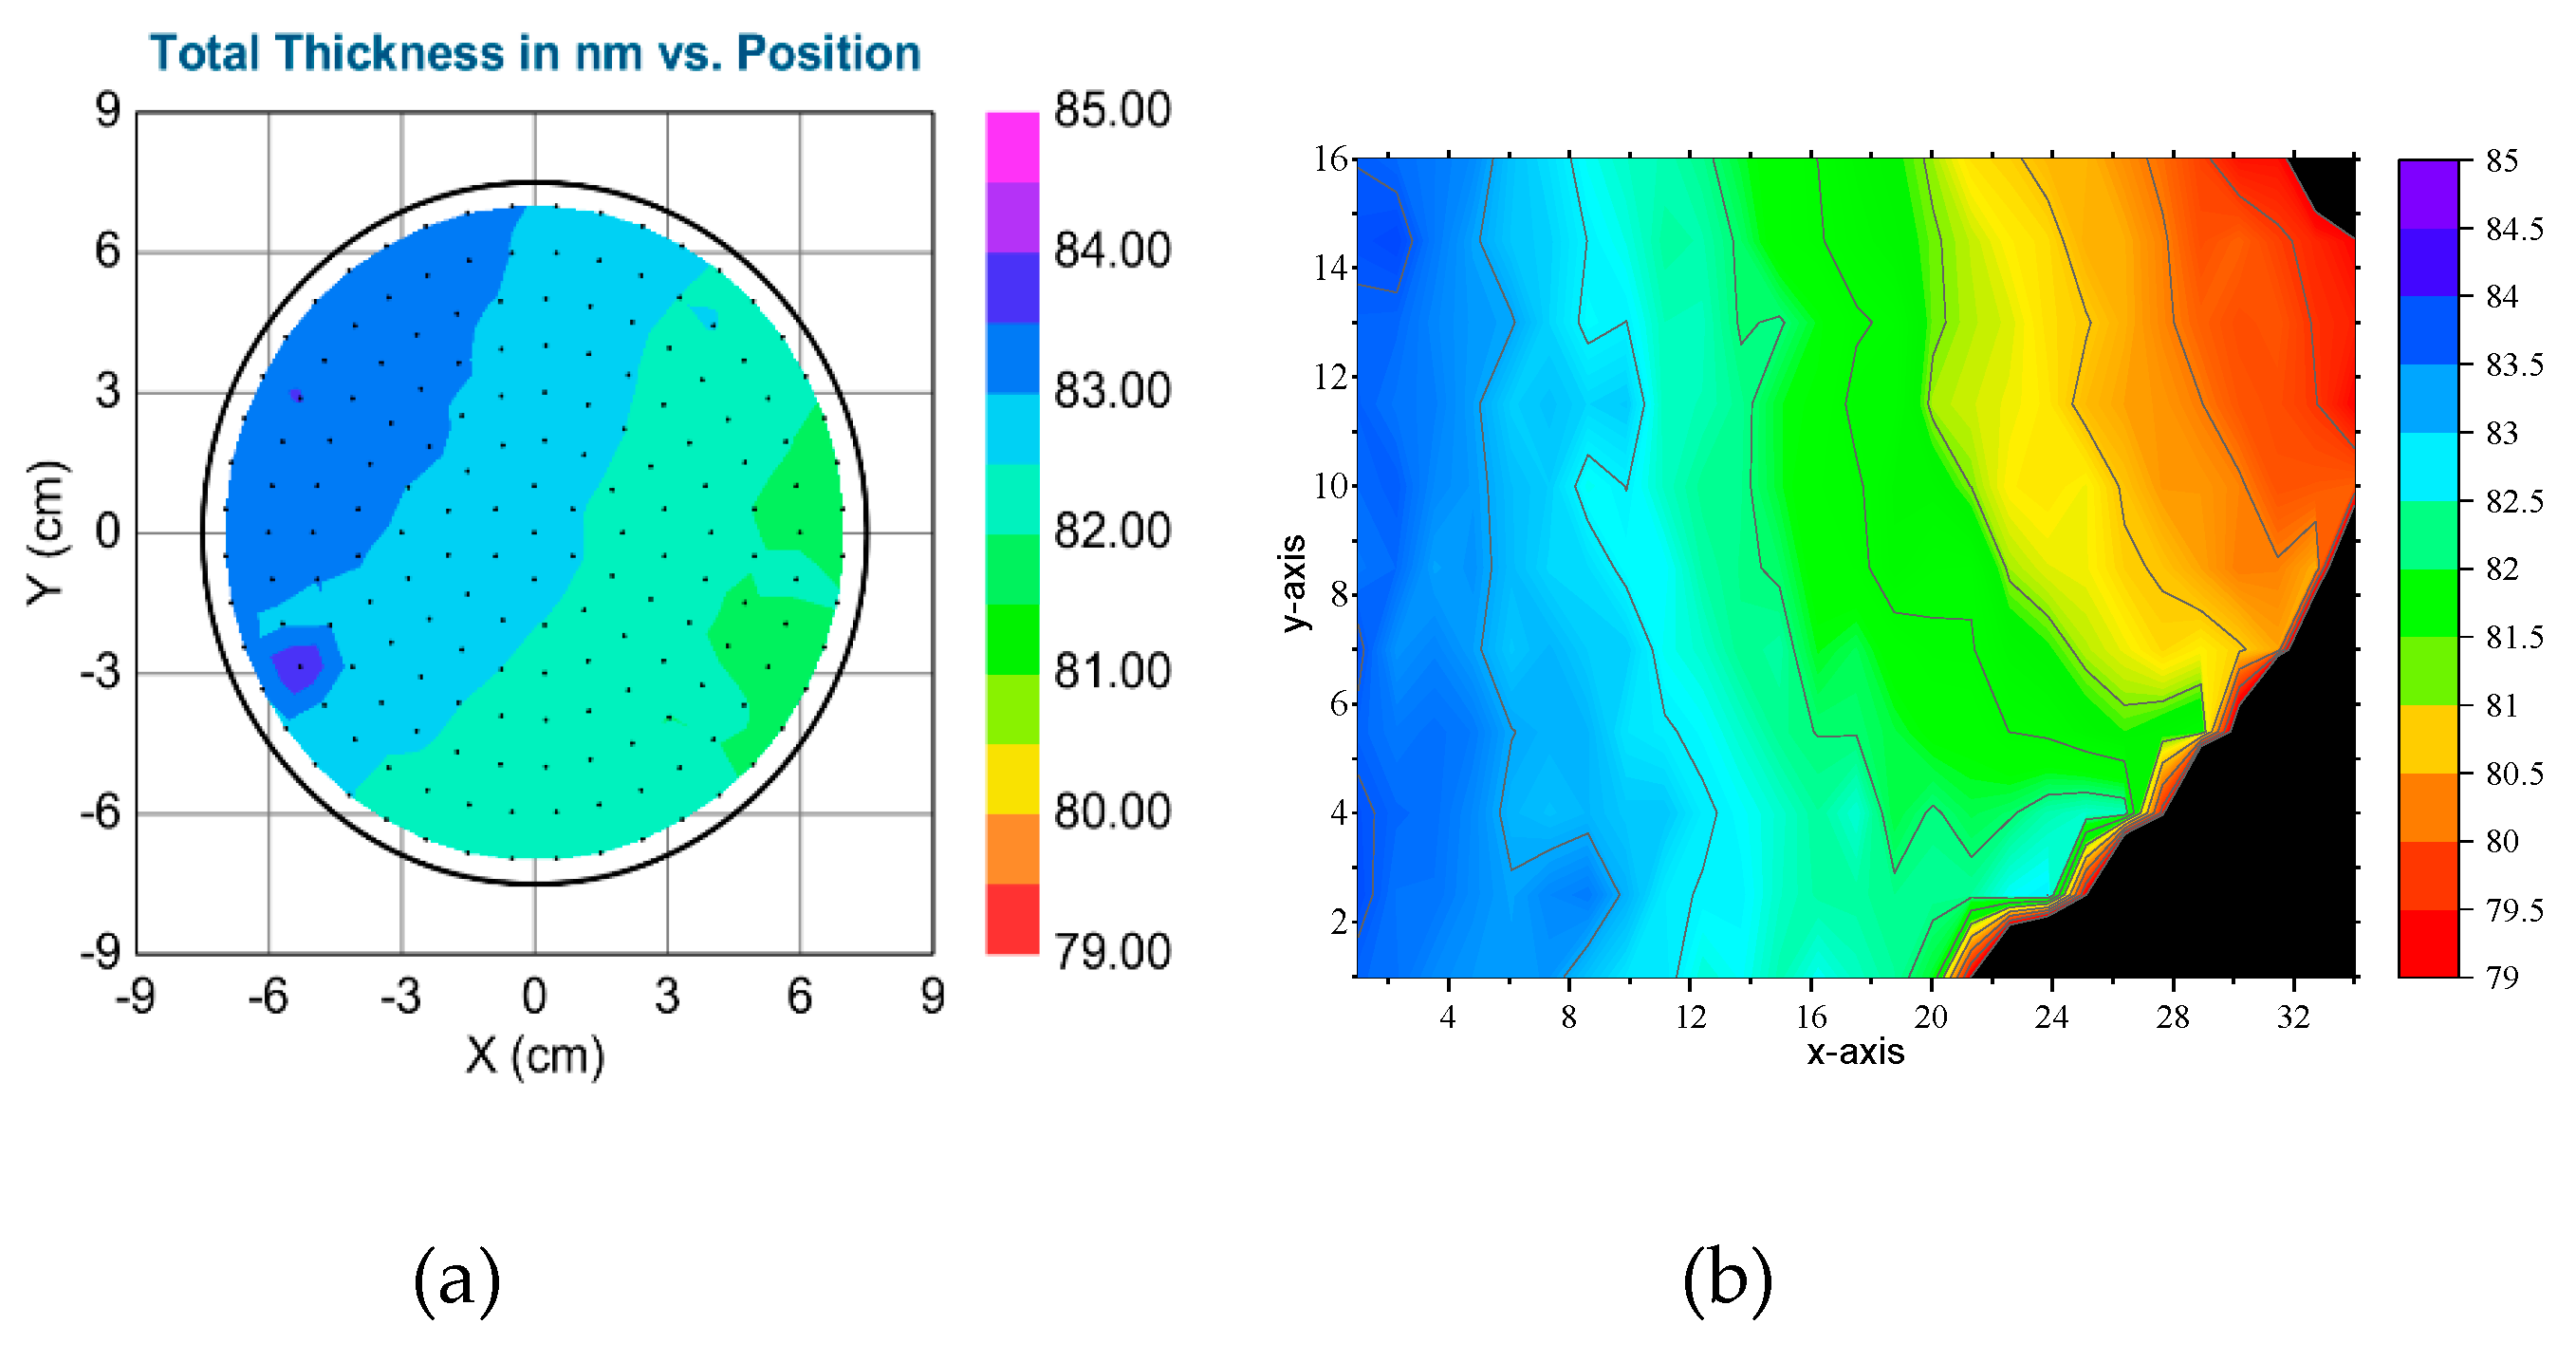
We used a nominally 80 nm thick, 20 cm diameter SiO2/Si sample to check the results of the calibration. We used the calibrated ρmonitor values to correct the measured ellipsometric angles and used the corrected values to determine the thickness map. The thickness map of the 80 nm oxide sample in Figure 9 (b) appears to be smooth enough. Note, that one color in Figure 9 is only 0.5 nm.
An independent checking measurement of the same sample was also made by the Wollam M2000 ellipsometer, as shown in the Figure 9 (a). The agreement of the thickness measurement made between our non-collimated ellipsometer after correction, and the conventional Wollam M2000 ellipsometer is only within 1 nm, which is a good agreement.
4. Discussion
As shown in the Results section, the experimental results starting from the tan ψ and cos Δ values of the Blue (450 nm), Green (550) and Red (650) colors evaluation, which resulted the need for the optical mapping tool calibration and then correction, calibration and independent experiments were done on the selected three oxide samples to learn more about the mapping tool performance through these typical samples. In each position, the MSE, angle-of-incidence, individual thickness, and ρmonitor correction maps were determined.
Generally,
- The new prototype is fast imaging (only seconds) and set up from cheap parts
- Ellipsometric data of large areas (even square meter size) can be collected less than 10 seconds compared to the several minutes of “traditional” scanning methods.
- Wide mapping area, up to 150 cm is possible, if we use big LCD TV instead of monitor.
- No moving parts, leading to higher stability.
- In contrast,
- Only three wide wavelength bands (RGB) are in action, which narrows the range of the light band source.
- Besides, there is a ‘0.1 degree’ angle uncertainty from the digital angle gauge used in rotation angle of the LCD monitor which may be estimated to contribute to the experimental result deviation from the precise value as the incident polarization state of the light is determined by the rotation angle of the monitor.
5. Conclusions
We developed a multi-color ellipsometric mapping tool from cheap parts and applied a new calibration method to make the thin film thickness measurement fast and accurate. Our new optical mapping equipment made by an ordinary color LED monitor and a polarization sensitive camera can measure big area in one second shot, while conventional ellipsometric devices needs several minutes to scan big area. After a careful calibration, the accuracy of our device is less than 1 nm.
6. Patents
The basis of the work is a patent from our Institute: Horváth Z Gy, Juhász G, Fried M, Major C, Petrik P: Imaging optical inspection device with a pinhole camera; EP2160591B1, Submission Number: PCT/HU2008/000058, NSZO: G01N21/8422, Country of patent: Europe.
Author Contributions
Conceptualization, B.N.Z., G. J, C.M., Z.G.H., P.P. and M.F.; Methodology, G.J., C.M., Z.G.H.; Software, B.N.Z., S.K., G.J., C.M., P.P.; Investigation, B.N.Z., G. J, C.M. and M.F.; Resources, P.P., M.F.; Data curation, B.N.Z., S.K. and M.F.; Writing—original draft, B.N.Z., S.K. and M.F.; Writing—review & editing, P.P. and M.F.; Supervision, M.F.; Funding acquisition, P.P. and M.F. All authors have read and agreed to the published version of the manuscript.
Funding
This work has been funded by NKFIH OTKA K 143216 and 146181 projects. Project TKP2021-EGA-04 has been implemented with the support provided by the Ministry of Innovation and Technology of Hungary from the National Research, Development, and Innovation Fund, financed under the TKP2021 funding scheme. The work in frame of the 20FUN02 ‘‘POLight’’ project has received funding from the EMPIR programme, co-financed by the Participating States and from the European Union’s Horizon 2020 research and innovation programme. Berhane Nugusse Zereay is grateful for the Stipendium Hungaricum scholarship and support from National Higher Education and Research Institute (NHERI), Eritrea.
References
- Fried, M., Juhász, G., Major, C., Petrik, P., Polgár, O., Horváth, Z., & Nutsch, A. Expanded beam (macro-imaging) ellipsometry. Thin Solid Films 2011, 519, 2730–2736. [Google Scholar] [CrossRef]
- Losurdo, M., Bergmair, M., Bruno, G. et al. Spectroscopic ellipsometry and polarimetry for materials and systems analysis at the nanometer scale: state-of-the-art, potential, and perspectives. J Nanopart Res 2009, 11, 1521–1554. [Google Scholar] [CrossRef] [PubMed]
- Harland G. Tompkins, 2005, Handbook OF Ellipsometry, Thin Films Materials Science Consultant Chandler, Arizona And Eugene A. Irene Department of Chemistry, University of North Carolina Chapel Hill, North Carolina pp 237.
- Fujiwara H. and R. W. Collins, (2018). Spectroscopic Ellipsometry for Photovoltaics, Springer Series in Optical Sciences 212, Springer International Publishing AG, part of Springer Nature.
- Hiroyuki Fujiwara, 2007, Spectroscopic Ellipsometry Principles and Applications, Maruzen Co. Ltd, Tokyo, Japan.
- Rosu, D., Petrik, P., Rattmann, G., Schellenberger, M., Beck, U., & Hertwig, A. Optical characterization of patterned thin films. Thin Solid Films 2014, 571, 601–604. [Google Scholar] [CrossRef]
- Bakker JW, Arwin H, Lundström I, Filippini D. Computer screen photoassisted off-null ellipsometry. Appl Opt. 2006 Oct 20;45(30):7795-9. [CrossRef]
Figure 1.
Spectroscopic Ellipsometry Working Principle (Source: https://www.jawoollam.com/resources/ellipsometry-tutorial/what-is-ellipsometry).
Figure 1.
Spectroscopic Ellipsometry Working Principle (Source: https://www.jawoollam.com/resources/ellipsometry-tutorial/what-is-ellipsometry).
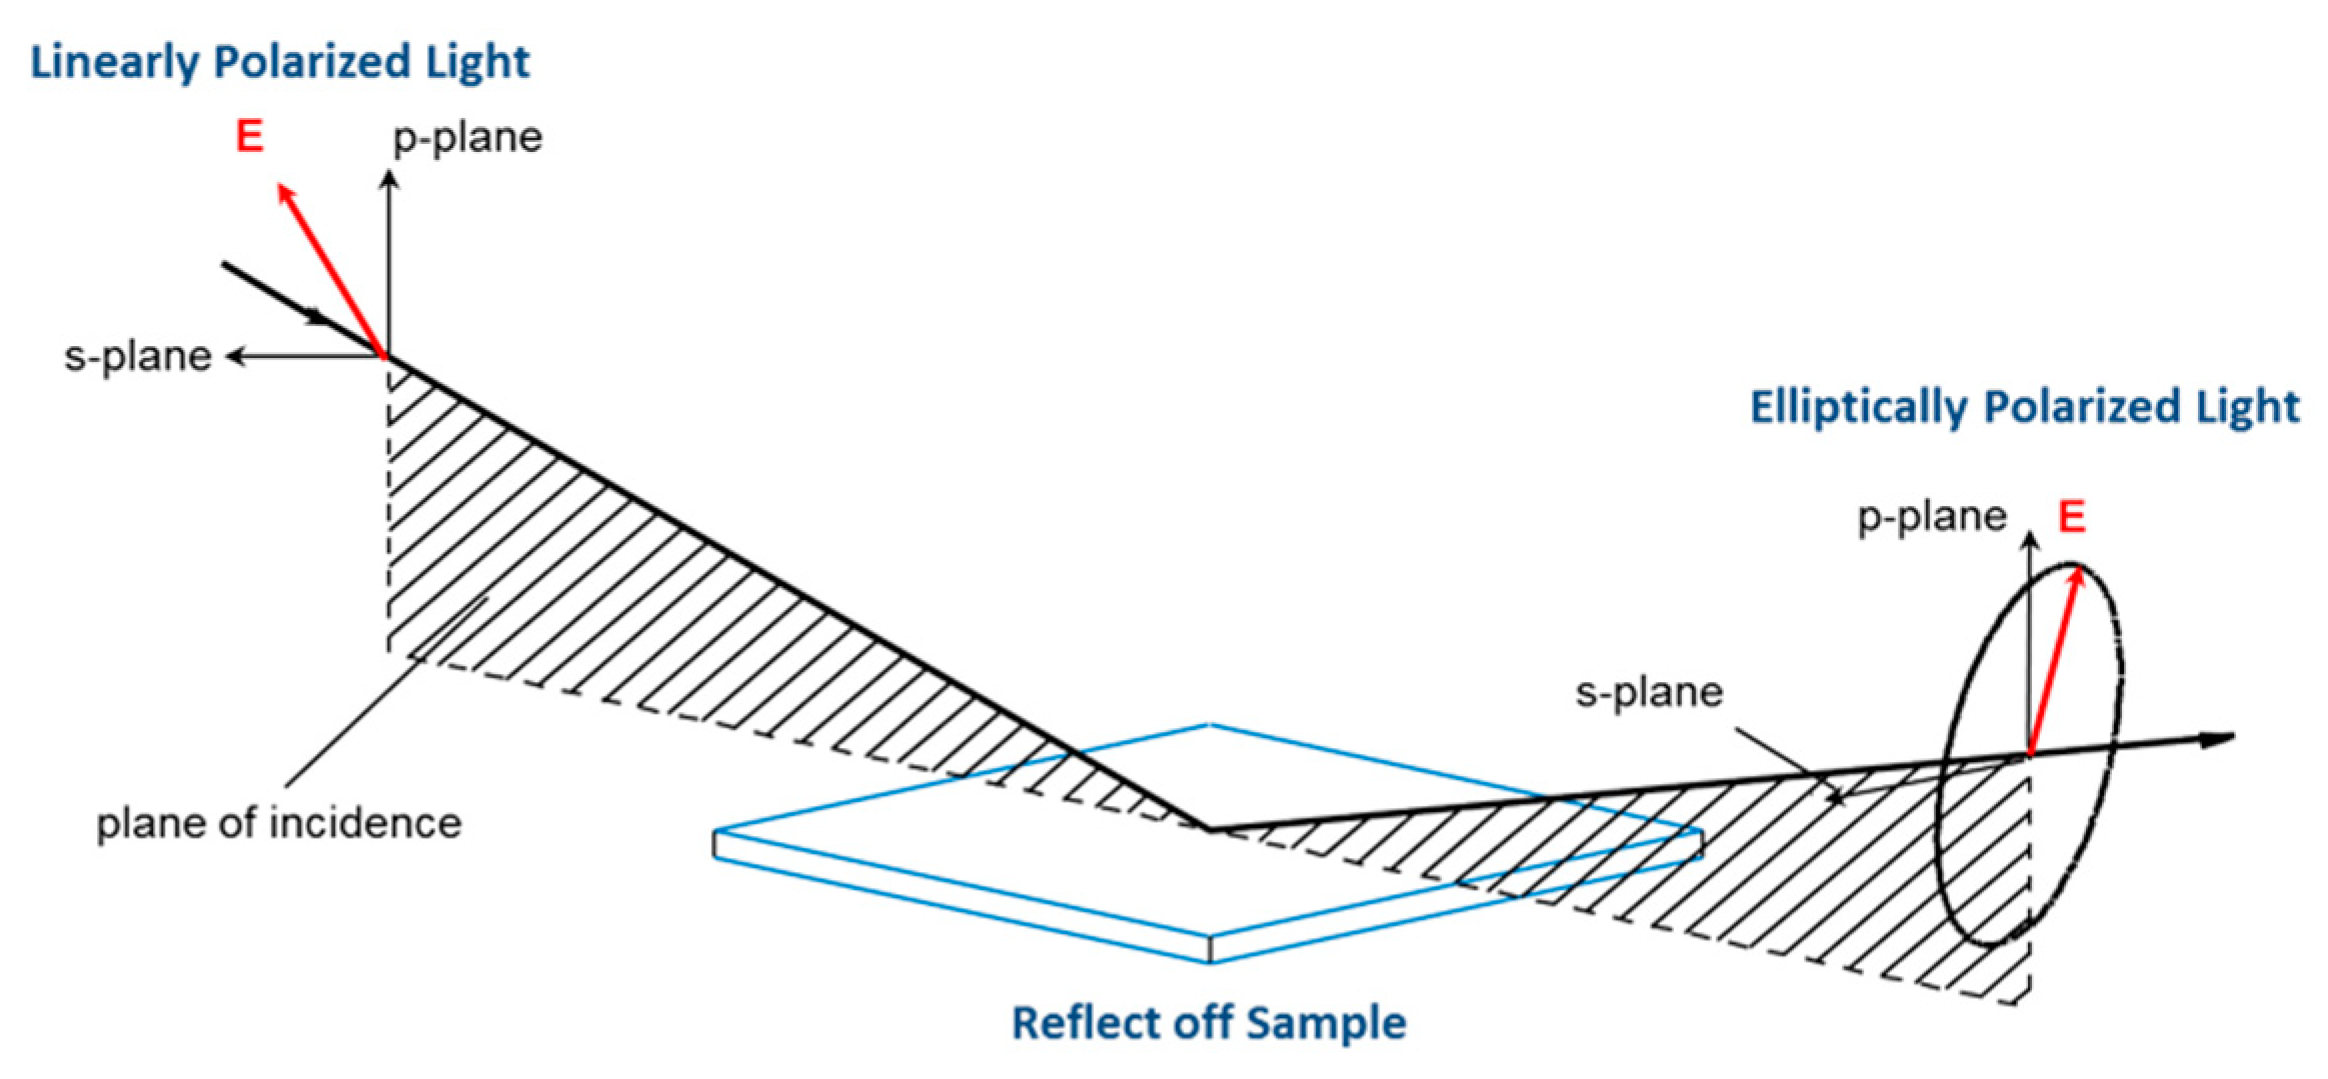
Figure 2.
Schematics of the non-collimated beam ellipsometer (optical Mapping tool from cheap parts).
Figure 2.
Schematics of the non-collimated beam ellipsometer (optical Mapping tool from cheap parts).
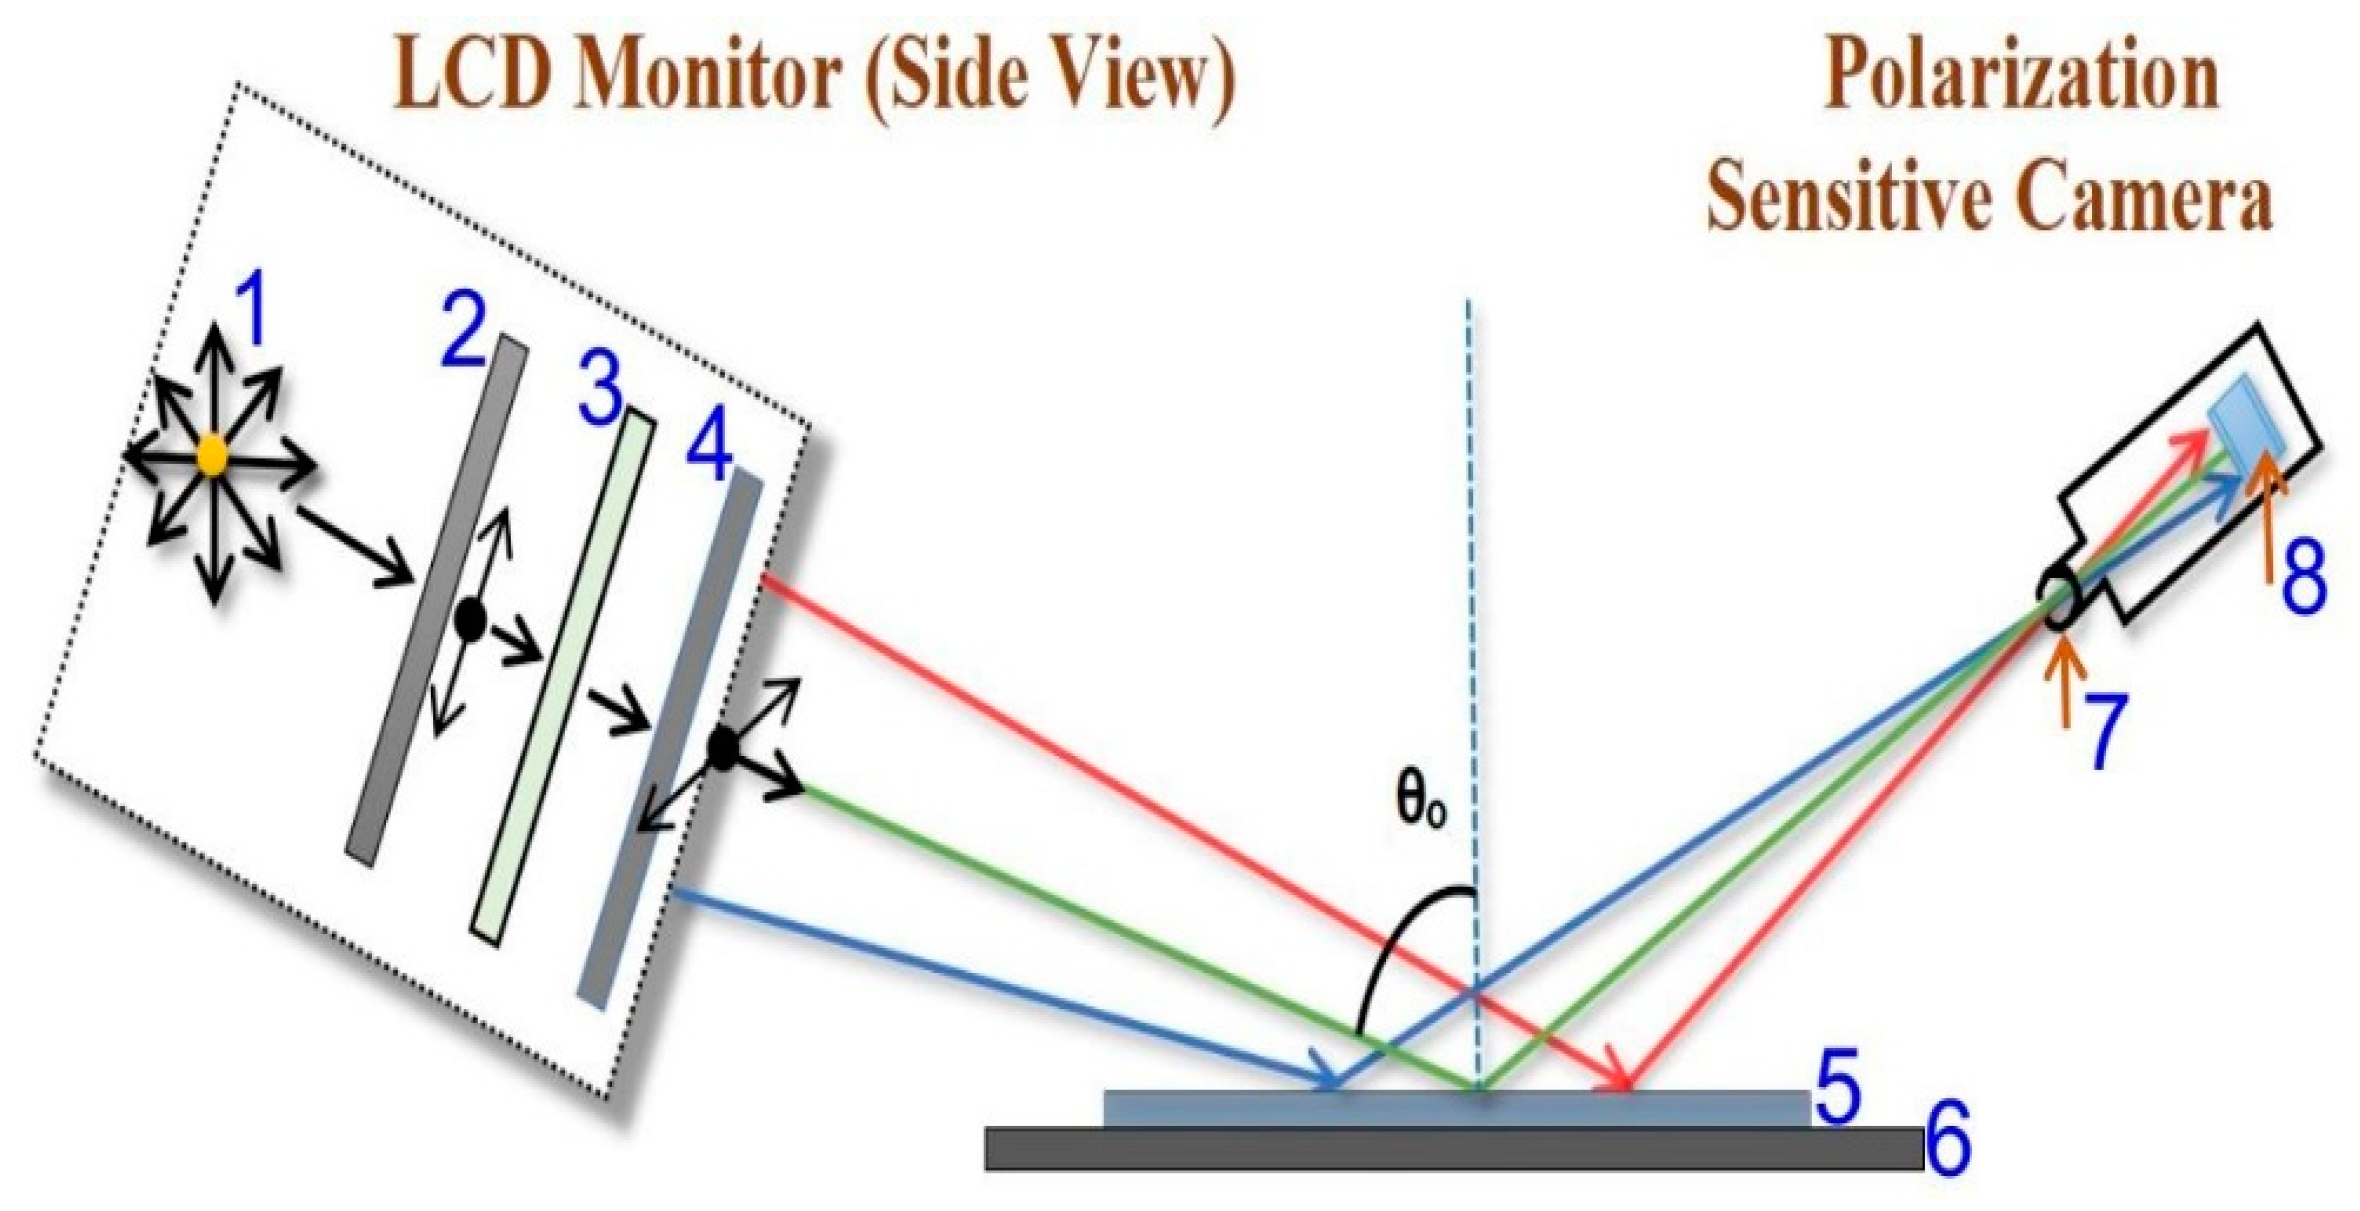
Figure 6.
a). Angle of incidence full map b). Angle of incidence with high MSE pixels removed.
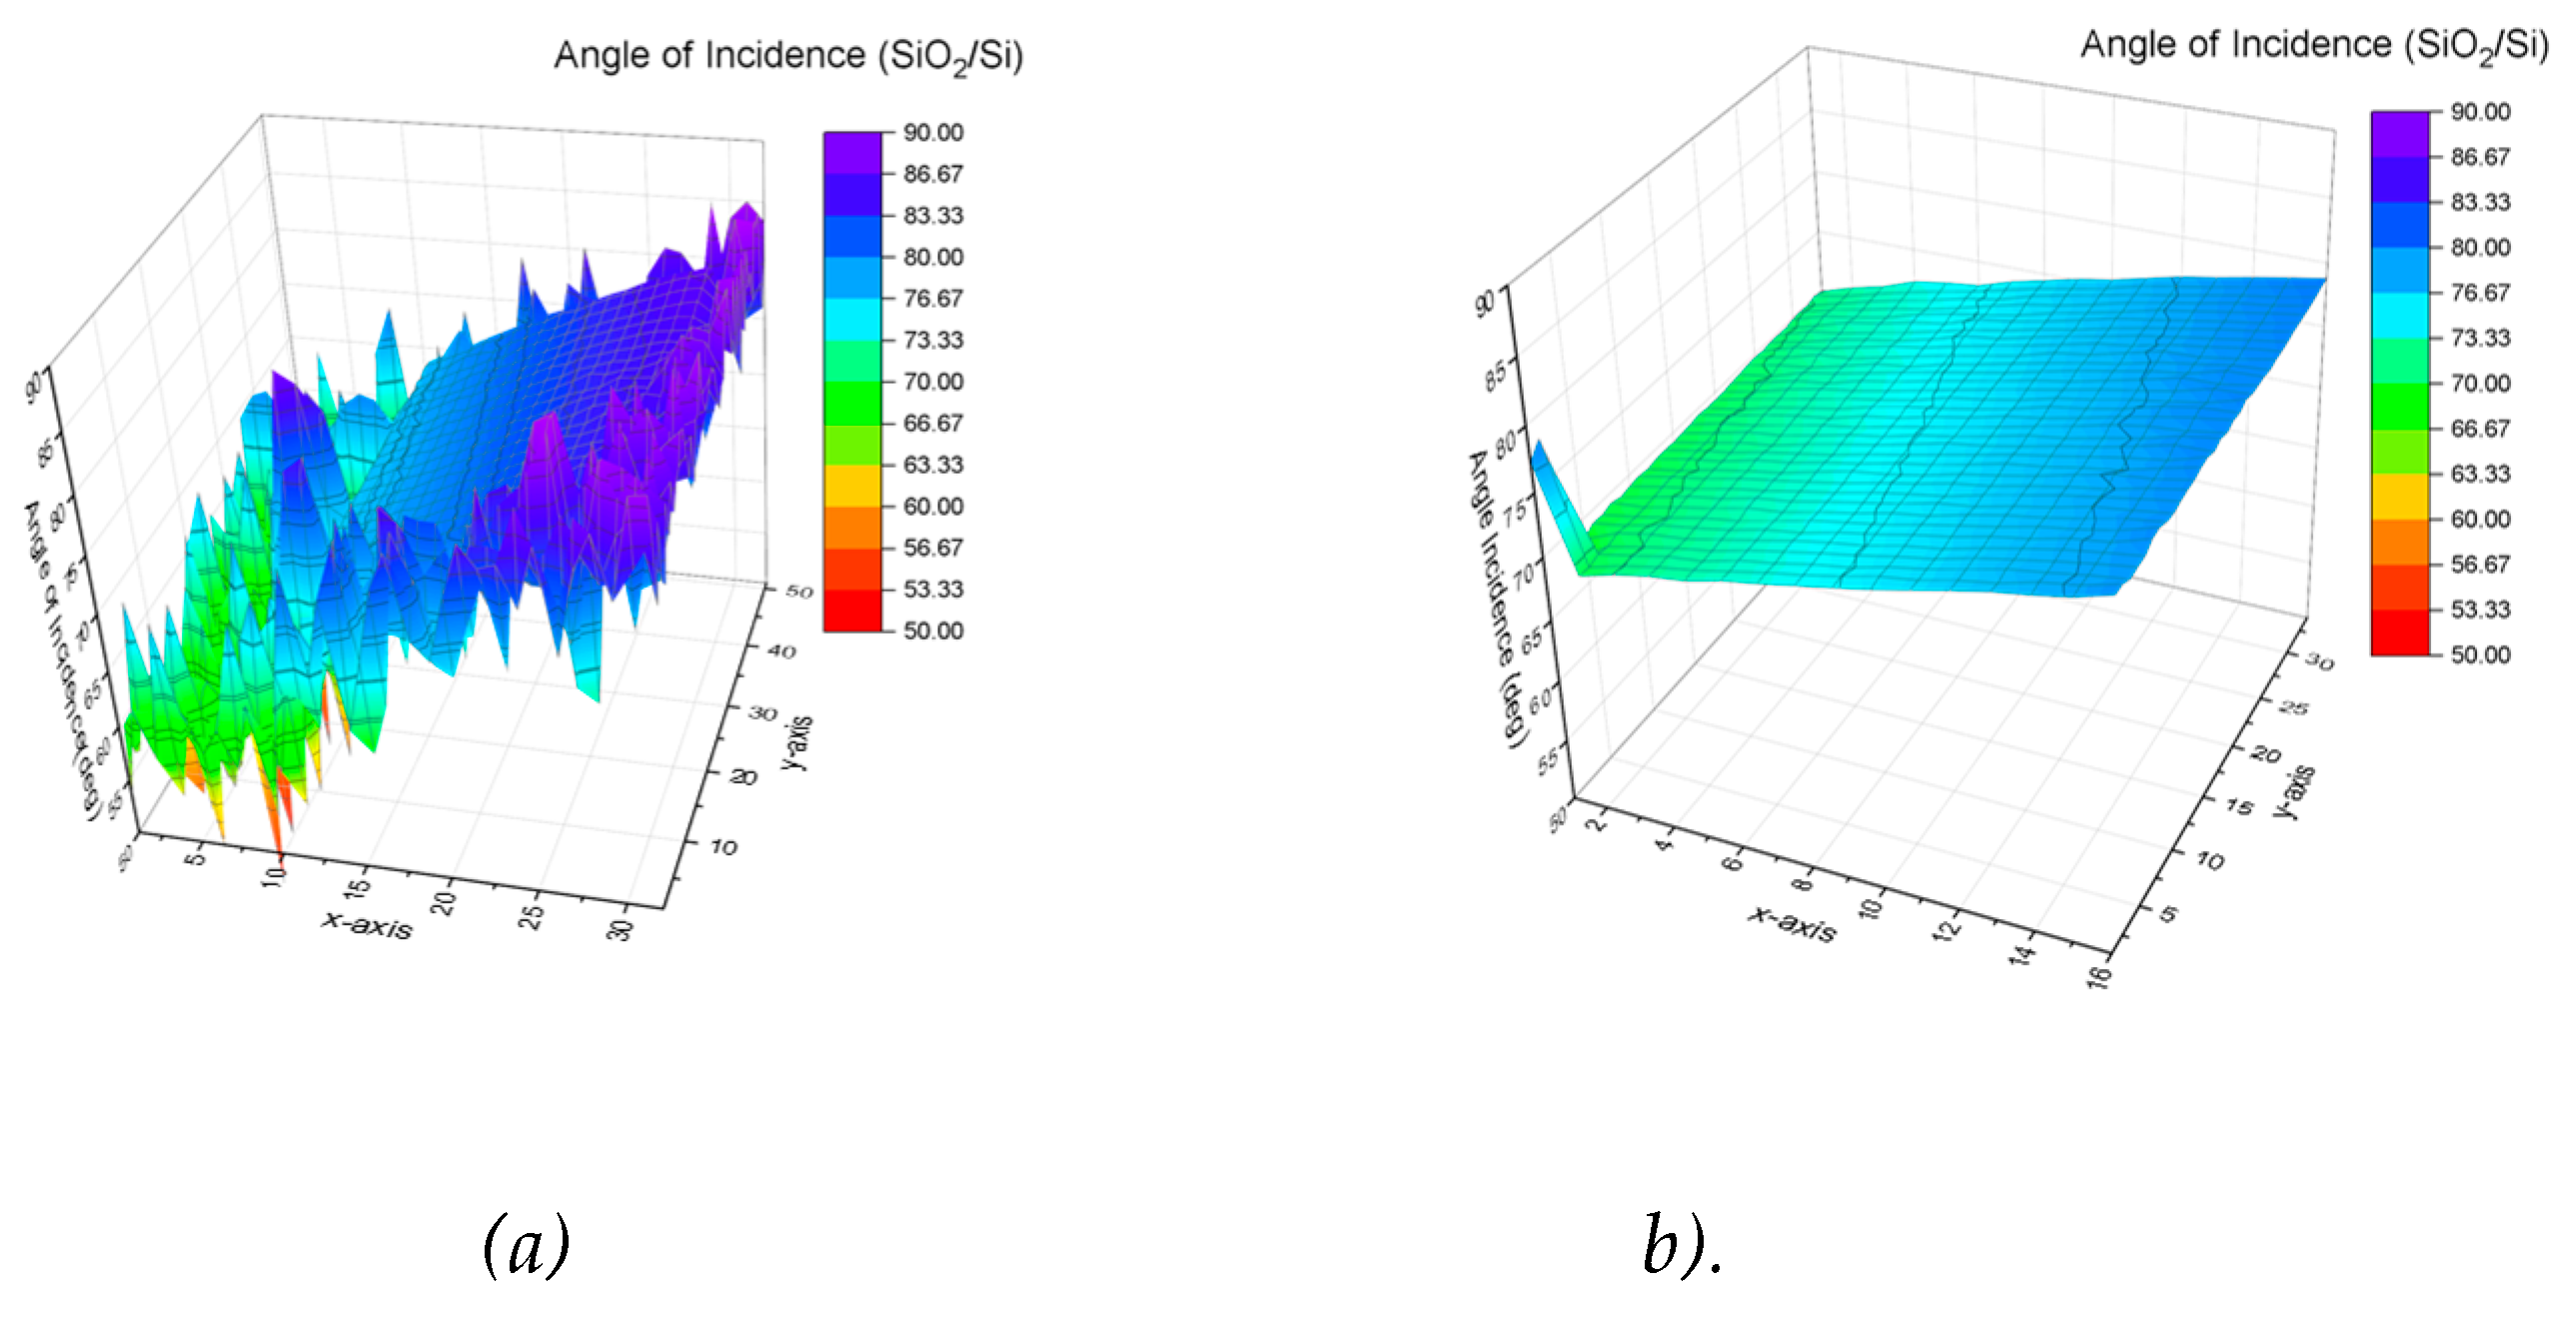
Figure 7.
Thickness maps of nominally 40 nm, 60 nm and 100 nm of SiO2/Si samples (low MSE areas) from the refined central 20x15 cm part.
Figure 7.
Thickness maps of nominally 40 nm, 60 nm and 100 nm of SiO2/Si samples (low MSE areas) from the refined central 20x15 cm part.
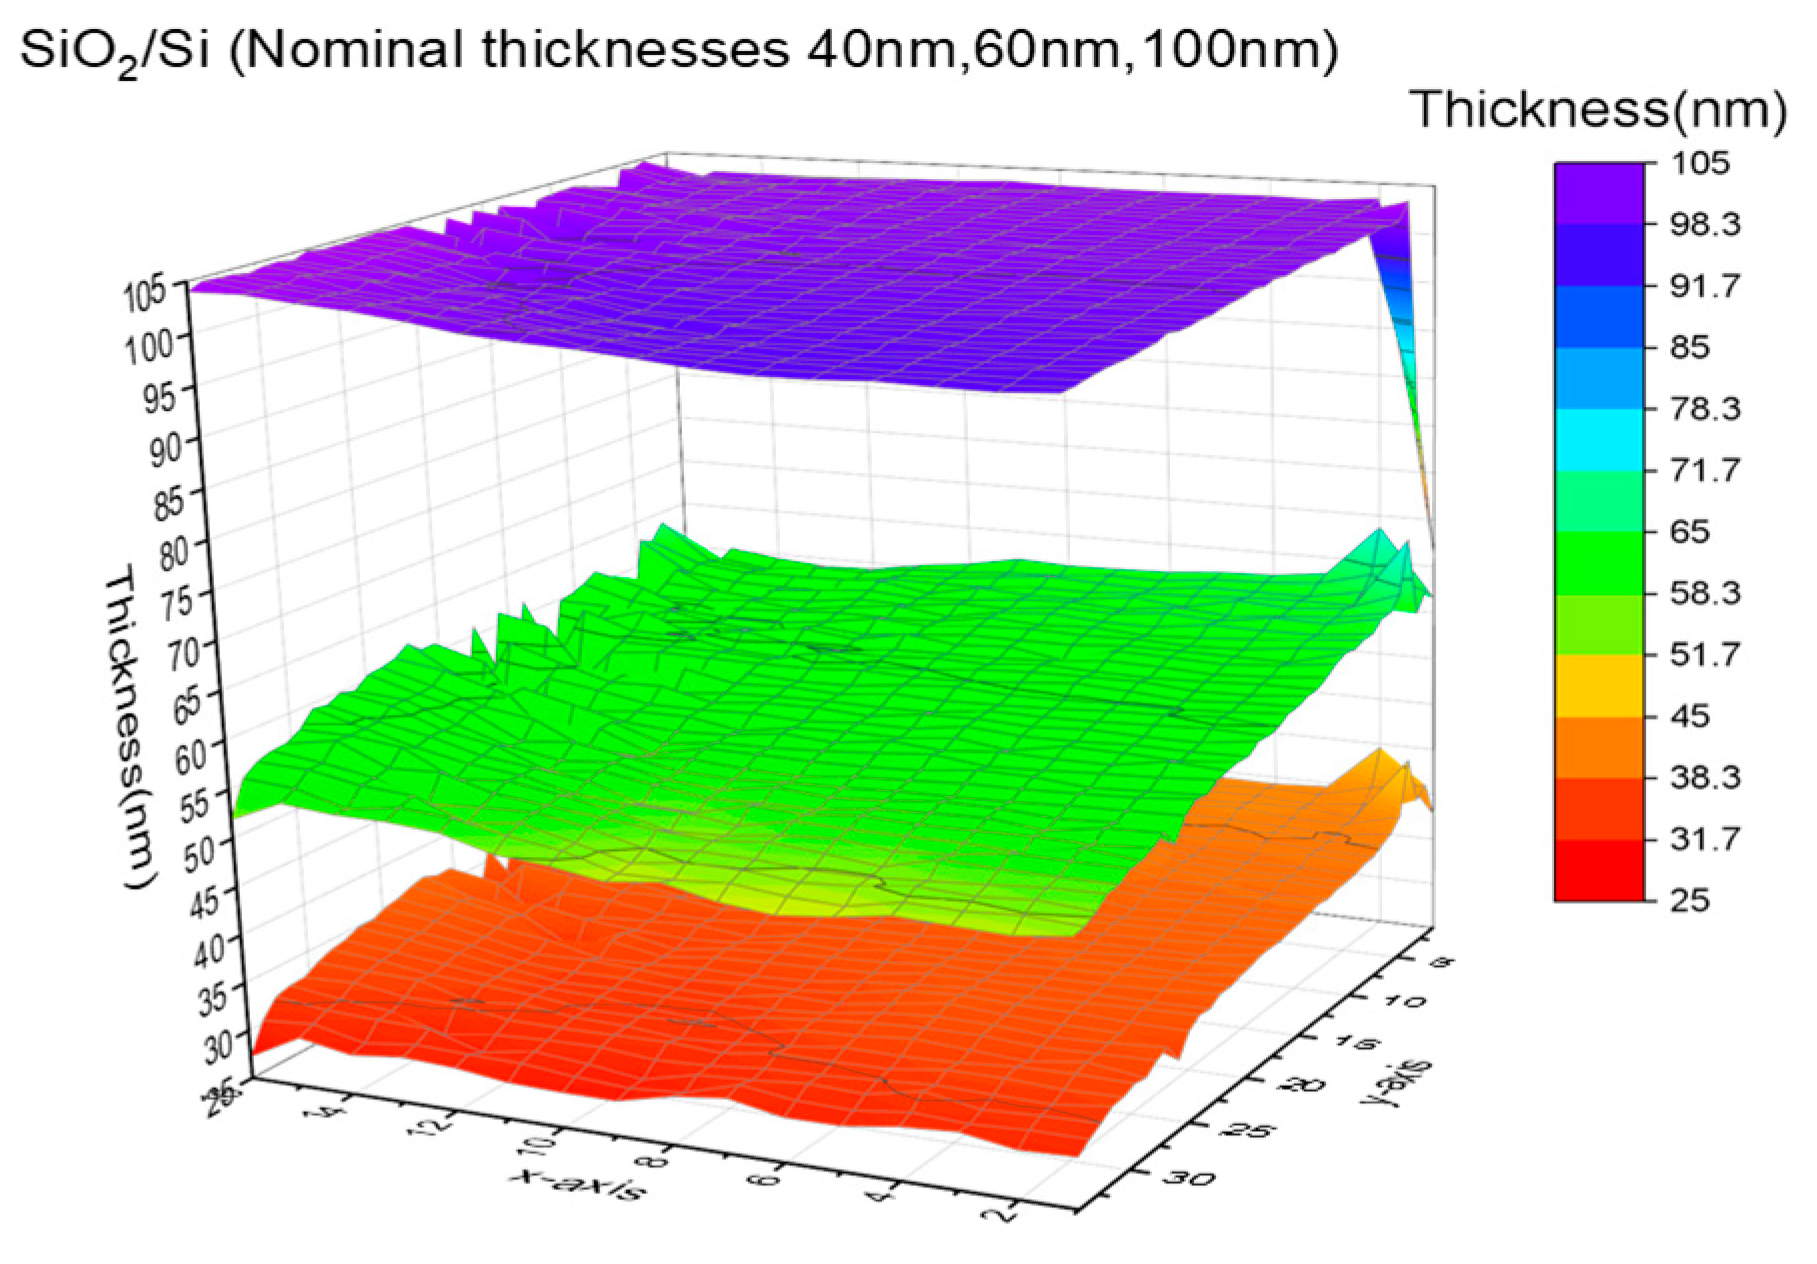
Figure 8.
The calibrated ρmonitor values. Left column: real ρmonitor, rigth column: phase shift-correction in rad. Upper row: blue (450 nm), Middle row: green (550 nm), Lower row: red (650 nm).
Figure 8.
The calibrated ρmonitor values. Left column: real ρmonitor, rigth column: phase shift-correction in rad. Upper row: blue (450 nm), Middle row: green (550 nm), Lower row: red (650 nm).
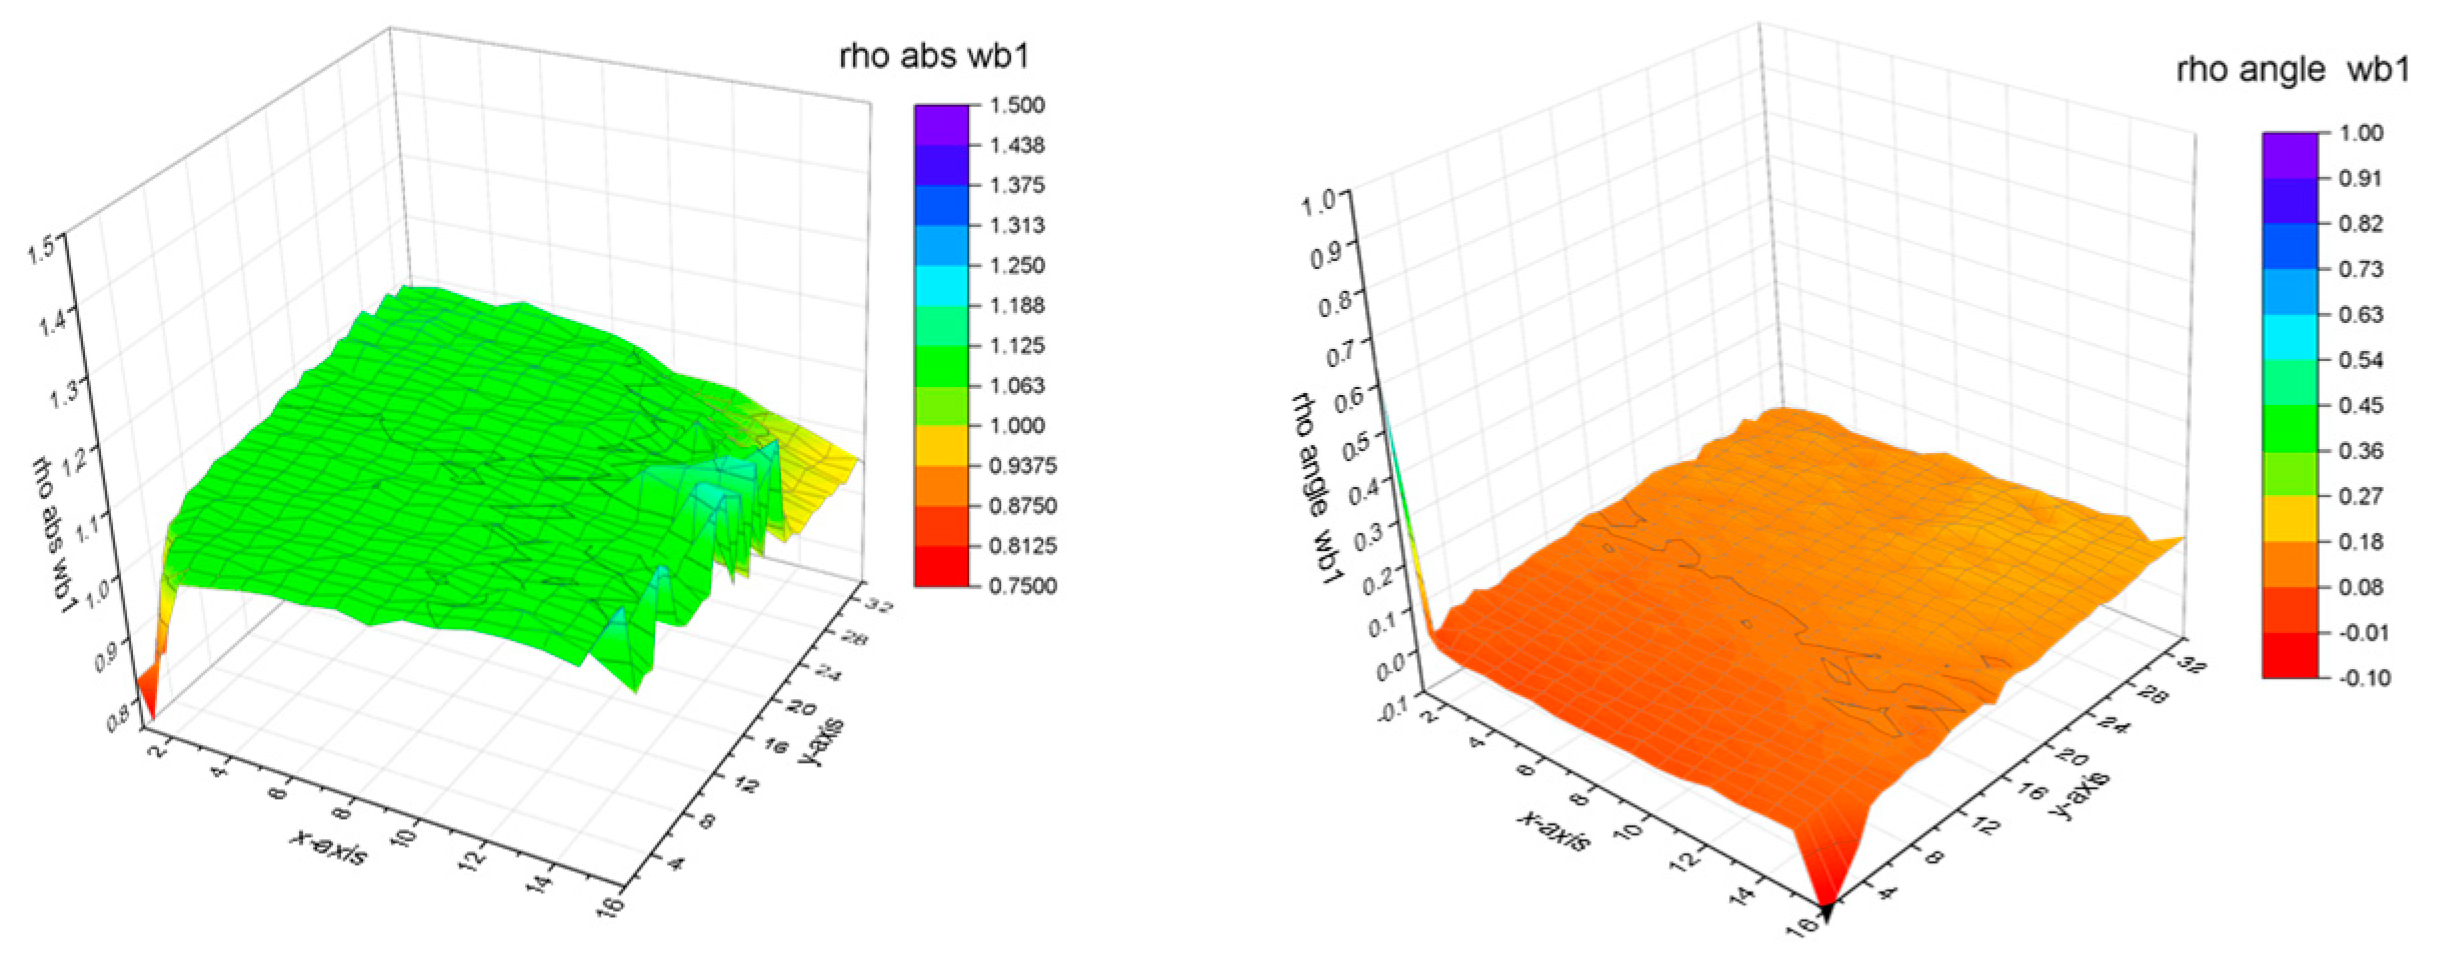
Figure 9.
(a) Nominally 80 nm oxide sample thickness map by Wollam M2000 SE (Note, that our M2000 can map only the central 14 cm diameter area of the 20 cm diameter sample (b) Thickness map of same SiO2/Si sample 20x15 cm area by the non-collimated, calibrated mapping tool.
Figure 9.
(a) Nominally 80 nm oxide sample thickness map by Wollam M2000 SE (Note, that our M2000 can map only the central 14 cm diameter area of the 20 cm diameter sample (b) Thickness map of same SiO2/Si sample 20x15 cm area by the non-collimated, calibrated mapping tool.
Disclaimer/Publisher’s Note: The statements, opinions and data contained in all publications are solely those of the individual author(s) and contributor(s) and not of MDPI and/or the editor(s). MDPI and/or the editor(s) disclaim responsibility for any injury to people or property resulting from any ideas, methods, instructions or products referred to in the content. |
© 2024 by the authors. Licensee MDPI, Basel, Switzerland. This article is an open access article distributed under the terms and conditions of the Creative Commons Attribution (CC BY) license (http://creativecommons.org/licenses/by/4.0/).
Copyright: This open access article is published under a Creative Commons CC BY 4.0 license, which permit the free download, distribution, and reuse, provided that the author and preprint are cited in any reuse.


