
Submitted:
01 October 2024
Posted:
02 October 2024
You are already at the latest version
Abstract
This paper presents a method for filtering and extracting noise from ECG signals using a Butterworth filter. The aim is to enhance signal qual- ity, enabling more accurate analysis in biomedical contexts, particularly in arrhythmia detection and other cardiac assessments.
Keywords:
ECG
; Butterworth filter
; noise reduction
; signal processing
1. Introduction
Electrocardiography (ECG) is essential for monitoring the heart’s electrical activity. Accurate interpretation of ECG signals is critical in diagnosing various cardiac conditions. However, these signals are often contaminated with noise from multiple sources, including electromagnetic interference, motion artifacts, and electronic device interference. Such noise can obscure important features of the ECG waveform, leading to misdiagnosis or missed detections. This study employs a Butterworth low-pass filter to remove high-frequency noise while preserving the integrity of the ECG signals.
2. Methods
2.1. Data Acquisition
ECG data were obtained from a specific database, containing two signals. Each signal was segmented into parts of 2500 samples, corresponding to 10 seconds. The dataset used is from the thesis by Greenwald SD, titled "Development and analysis of a ventricular fibrillation detector," M.S. thesis, MIT Dept. of Electrical Engineering and Computer Science, 1986.
2.2. Filtering
A low-pass Butterworth filter was applied to the signals. As defined in the frequency domain, the transfer function of an n-th order Butterworth filter can be expressed as:
where is the cutoff frequency (in radians per second) and s is the complex variable. The cutoff frequency is related to the cutoff frequency in Hertz by:
The filter coefficients b and a are calculated using the `butter` function from the SciPy library, and the filtered output is obtained using the `filtfilt` function.
The filter parameters are as follows:
- Sampling frequency (): 250 Hz
- Cutoff frequency: 50 Hz
- Filter order: 4
The cutoff frequency was chosen based on the typical frequency range of heart signals, which generally lie below 50 Hz. Frequencies higher than this are predominantly noise and can interfere with the accurate detection of cardiac events.
2.3. Noise Extraction
Noise was extracted by subtracting the filtered signal from the original signal. This approach allows for the identification of unwanted components that were removed during the filtering process, providing insights into the nature and characteristics of the noise present in the ECG signals.
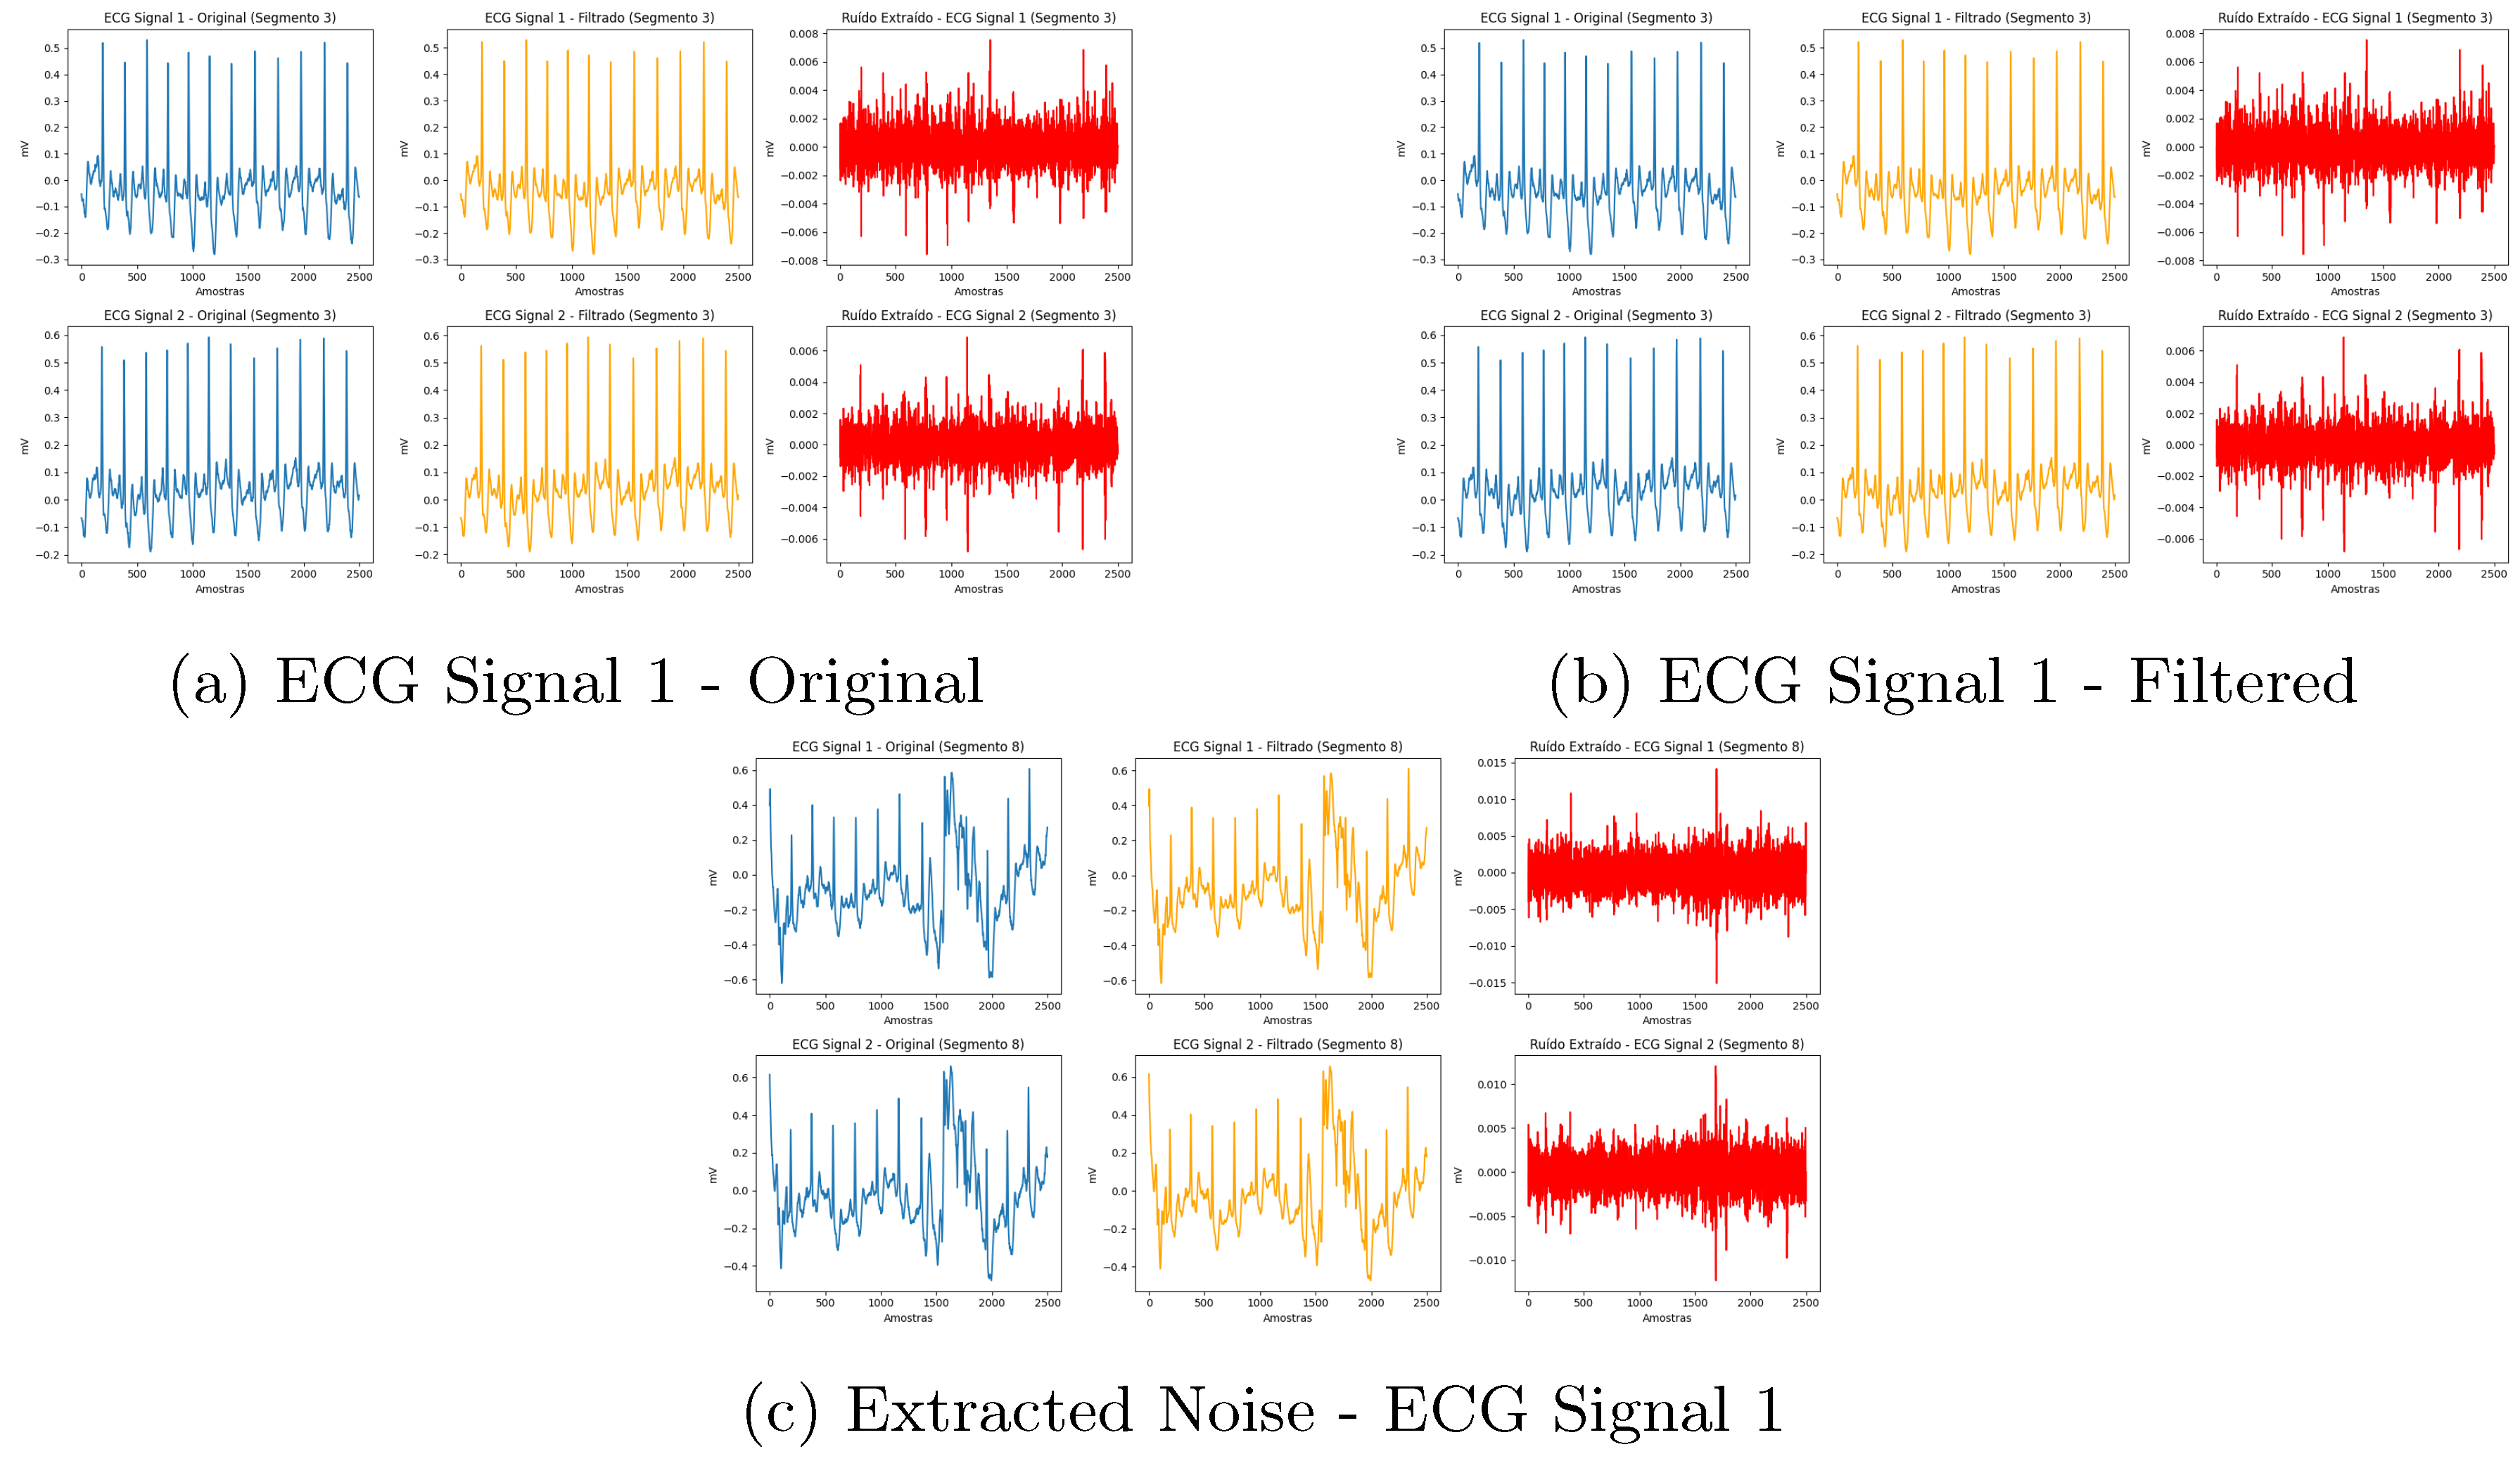
3. Results
The results were plotted in graphs showing the original signal, the filtered signal, and the extracted noise for both ECG signals. Below are examples of the generated graphs.
Figure 1.
Filtering Results for ECG Signal 1
4. Conclusion
The application of the Butterworth filter proved effective in removing noise from ECG signals, significantly improving signal clarity. The results indicate that such filtering techniques are crucial for enhancing the reliability of ECG analyses, thereby facilitating more accurate diagnoses in clinical settings. Future work may explore adaptive filtering methods that can dynamically adjust to varying noise conditions in real-time.
References
- Greenwald, S. D. (1986). Development and analysis of a ventricular fibrillation detector. M.S. thesis, MIT Dept. of Electrical Engineering and Computer Science.
- Goldberger, A., Amaral, L., Glass, L., Hausdorff, J., Ivanov, P. C., Mark, R., ... & Stanley, H. E. (2000). PhysioBank, PhysioToolkit, and PhysioNet: Components of a new research resource for complex physiologic signals. Circulation, 101(23), pp. e215–e220. [CrossRef]
Disclaimer/Publisher’s Note: The statements, opinions and data contained in all publications are solely those of the individual author(s) and contributor(s) and not of MDPI and/or the editor(s). MDPI and/or the editor(s) disclaim responsibility for any injury to people or property resulting from any ideas, methods, instructions or products referred to in the content. |
© 2024 by the authors. Licensee MDPI, Basel, Switzerland. This article is an open access article distributed under the terms and conditions of the Creative Commons Attribution (CC BY) license (http://creativecommons.org/licenses/by/4.0/).
Copyright: This open access article is published under a Creative Commons CC BY 4.0 license, which permit the free download, distribution, and reuse, provided that the author and preprint are cited in any reuse.


