
Submitted:
17 October 2024
Posted:
18 October 2024
You are already at the latest version
Abstract
The Gandoca-Manzanillo Wildlife Refuge in Costa Rica is facing significant threats from deforestation, raising concerns about its impact on forest health and carbon sequestration. This study utilized high-resolution satellite data from Sentinel-2 and Planet NICFI to assess forest degradation and quantify deforestation from January 2023 to August 2024. Multiple vegetation indices, including NDVI, GNDVI, EVI, SAVI, and MSI, were applied to monitor changes in forest health. Deforestation was calculated using relative NDVI change detection and thresholding techniques, while CO₂ emissions were estimated based on biomass loss derived from NDVI. The results show a 5% decrease in NDVI from Planet NICFI and a 2-3% decline from Sentinel-2, leading to the loss of 3.5 hectares of forest cover. Carbon dynamics revealed a CO₂ loss of 33,322.64 tons between January 2023 and January 2024, followed by a gain of 100,834.54 tons by August 2024, indicating partial recovery. The integration of Sentinel-2 and Planet NICFI data detected 13.22% deforestation with Sentinel-2 and 16.76% with Planet NICFI, emphasizing the importance of multi-source satellite imagery for accurate monitoring. These findings highlight the need for continuous monitoring and effective management to sustain carbon storage and combat deforestation.
Keywords:
Deforestation Monitoring
; Satellite Remote Sensing
; Carbon Sequestration
; Vegetation Indices
; Forest Degradation
; Costa Rica Conservation
1. Introduction
The escalating threats to global forests, driven by illegal logging, deforestation, and forest degradation, present significant obstacles to conservation initiatives and the global effort to enhance carbon sequestration. One critical area at the heart of this issue is the Gandoca-Manzanillo Wildlife Refuge in Costa Rica, renowned for its remarkable biodiversity. This refuge is currently entangled in a legal and environmental dispute following allegations of illegal logging and deforestation. Recent satellite imagery confirmed a significant loss of 3.5 hectares of forest cover in Gandoca-Manzanillo between January and May 2024, raising concerns about the involvement of the National System of Conservation Areas (SINAC) in issuing potentially illegal logging permits (Cambronero & Lara Salas, 2024; Altamirano & Cambronero, 2024). These claims suggest possible political influence in the authorization of logging permits (Madrigal, 2024).
This research is particularly innovative because it combines high-resolution Sentinel-2 and Planet NICFI satellite data to provide precise, fine-scale detection of deforestation in a legally contested area. The importance of this work is amplified by the ongoing legal investigations, as the Environmental Prosecutor’s Office investigates whether SINAC allowed deforestation in protected forest and wetland regions, violating national and international laws like the Ramsar Convention. These events underscore the need for high-resolution, independent monitoring tools to track deforestation in sensitive ecosystems. Traditional forest inventory methods, which have faced criticism for inaccuracies, are replaced here by satellite imagery combined with advanced remote sensing techniques, providing verifiable evidence of land use changes for legal and conservation purposes.
Although Costa Rica has made remarkable strides in forest conservation—largely due to initiatives like the Payment for Ecosystem Services (PES) program, which increased forest cover from 25% in the mid-1990s to over 60% by 2020—the events in Gandoca-Manzanillo highlight that without real-time, robust monitoring, these gains may be vulnerable to exploitation and degradation. The PES program has protected 1.4 million hectares of forest between 1997 and 2020, distributing USD 565 million to over 20,000 landowners (Sarmiento et al., 2024). This study seeks to use satellite data to ensure the integrity of such conservation efforts.
This research aims to assess the extent of forest degradation and carbon sequestration loss in Gandoca-Manzanillo using multiple vegetation indices (NDVI, GNDVI, EVI, SAVI, NDFI, MSI, NDWI, ARVI) derived from satellite imagery. By employing both Sentinel-2 and Planet NICFI data, the study leverages their complementary strengths—Sentinel-2’s broader coverage and Planet NICFI’s higher resolution—to detect fine-scale deforestation and degradation, providing critical data for conservation and legal decision-making. The study hypothesizes that satellite-based remote sensing can accurately detect deforestation in protected areas, offering a precise tool for quantifying environmental changes. Additionally, the research will investigate the impact of forest cover loss on carbon storage and CO₂ emissions, estimating biomass loss and its implications for Costa Rica’s carbon neutrality goals.
The research aligns with Costa Rica’s National Decarbonisation Plan, which emphasizes forest conservation as a core strategy for achieving carbon neutrality. Despite the country’s achievement of zero net deforestation between 2012 and 2019, current trends in urban development and deforestation threaten these gains, particularly in vulnerable ecosystems like wetlands and mangroves (OECD, 2023). The ongoing deforestation in Gandoca-Manzanillo calls for enhanced monitoring frameworks to protect these ecosystems.
By applying satellite imagery and remote sensing, this research provides independent verification systems for monitoring deforestation and CO₂ emissions. These tools offer a model for other regions grappling with similar deforestation pressures, demonstrating the global significance of satellite monitoring for environmental protection. Furthermore, the study acknowledges the potential economic impact of forest degradation, which could lead to annual losses of USD 314 billion by 2100, stressing the need for sustainable forest management to maintain carbon sinks and mitigate climate change (Baumbach et al., 2023). Costa Rica’s PES program has already contributed to sequestering 0.9 to 2.6 gigatons of CO₂ annually, preventing emissions and fostering sustainable economic activities like eco-tourism (Claes et al., 2020). This research strengthens the case for these policies, which emphasize the economic and cultural value of nature as critical for long-term sustainability (Pascual et al., 2023).
In sum, this study contributes to the ongoing discourse on sustainable land management and precise monitoring methods for conservation, offering cutting-edge tools for protecting vulnerable ecosystems. The deforestation in Gandoca-Manzanillo exemplifies the urgent need for satellite-based monitoring to ensure the long-term protection of conservation zones (Hordijk et al., 2024; Piaggio et al., 2024).
2. Methodology
2.1. Study Design
This study employs an observational and comparative geospatial analysis using remote sensing techniques to monitor and evaluate forest degradation and carbon sequestration within the Gandoca-Manzanillo Wildlife Refuge. January 2023 was selected as the baseline, representing the period before any suspected illegal logging activities had commenced. At this point, 96% of the area was covered in trees, as documented in investigations by public authorities (Cambronero & Lara Salas, 2024). August 2024 was chosen as the final observation point, extending the study to provide a longer-term analysis of forest cover changes following the granting of a logging permit in April 2024. This extended timeframe captures potential deforestation, regrowth, or other changes in forest cover beyond the initial logging activities.
The study utilizes high-resolution imagery from Planet NICFI (3-meter resolution) and Sentinel-2 (10-60 meter resolution) for each period, enabling a detailed comparison of fine-scale vegetation changes and broader landscape dynamics. Data were processed through Google Earth Engine (GEE), with necessary pre-processing steps such as cloud masking and spatial re-projection to ensure data quality. By extending the analysis to August 2024, this study offers a comprehensive assessment of forest cover dynamics, allowing for the detection of changes that occurred beyond the initial deforestation period and providing a deeper understanding of long-term forest degradation in the region.
2.1.1. Study Area and Sample
The study focuses on two properties located within the Gandoca-Manzanillo Wildlife Refuge:
- Property 1: (7-Limón, Inscription No. 942968) covers an area of 122,388.46 m² (approximately 12.24 hectares).
- Property 2: (7-Limón, Inscription No. 110409) spans 31,789 m² (approximately 3.18 hectares).
These properties, with a total study area of 15.44 hectares, were selected due to their ecological sensitivity and involvement in ongoing legal disputes regarding illegal deforestation. Together, they provide a representative sample for examining how illegal logging and forest degradation can be monitored using advanced remote sensing techniques.
2.2. Vegetation Indices and CO₂ Estimation Using Satellite Data
2.2.1. Vegetation Indices Formulas
Vegetation indices are crucial tools for assessing vegetation health and estimating CO₂ dynamics in ecosystems. These indices, derived from spectral bands in both Sentinel-2 and Planet NICFI imagery, provide insights into various aspects of vegetation, such as moisture content, chlorophyll levels, and atmospheric resistance. Each index plays a vital role in monitoring vegetation cover changes, detecting deforestation, and estimating carbon storage and emissions. Table 1 below outlines the key vegetation indices used in this study, along with their formulas and the corresponding Sentinel-2 and Planet NICFI spectral bands. These indices enabled accurate monitoring of the region’s vegetation dynamics and carbon balance over time.

Table 1.
Vegetation Indices Formulas and Corresponding Sentinel-2 and Planet NICFI Bands.
| Index | Formula | Sentinel-2 Bands | Planet NICFI Bands |
|---|---|---|---|
| NDVI (Normalized Difference Vegetation Index) | 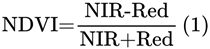 |
NIR = B8, Red = B4 | NIR = ‘N’, Red = ‘R’ |
| GNDVI (Green Normalized Difference Vegetation Index) | 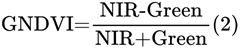 |
NIR = B8, Green = B3 | NIR = ‘N’, Green = ‘G’ |
| EVI (Enhanced Vegetation Index) | 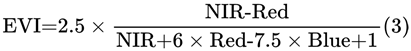 |
NIR = B8, Red = B4, Blue = B2 | NIR = ‘N’, Red = ‘R’, Blue = ‘B’ |
| SAVI (Soil-Adjusted Vegetation Index) | 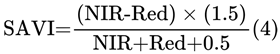 |
NIR = B8, Red = B4 | NIR = ‘N’, Red = ‘R’ |
| NDFI (Normalized Difference Fraction Index) | 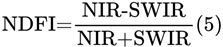 |
NIR = B8, SWIR = B11 | NIR = ‘N’, Red = ‘R’ (as proxy for SWIR) |
| MSI (Moisture Stress Index) | 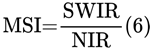 |
SWIR = B11, NIR = B8 | Not applicable |
| NDWI (Normalized Difference Water Index) | 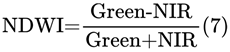 |
Green = B3, NIR = B8 | Not applicable |
| ARVI (Atmospherically Resistant Vegetation Index) | 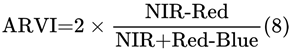 |
NIR = B8, Red = B4, Blue = B2 | Not applicable |
2.2.2. Key Code Snippets for Vegetation Indices Calculation
The vegetation indices are computed using the formulas and bands outlined in Table 2. Below are concise code snippets that demonstrate the process for calculating the indices programmatically using Sentinel-2 and Planet NICFI data.
Table 2.
Code Snippets for Vegetation Indices Calculation Using Sentinel-2 and Planet NICFI Data.
| Vegetation Index | Key Code Snippet (Pseudocode) |
|---|---|
| NDVI (Sentinel-2) | ndvi = image.normalizedDifference([‘B8’, ‘B4’]).rename(‘NDVI’) |
| NDVI (Planet NICFI) | ndvi = image.normalizedDifference([‘N’, ‘R’]).rename(‘NDVI’) |
| EVI (Sentinel-2) | evi = image.expression(‘2.5 * ((NIR − RED) / (NIR + 6 * RED − 7.5 * BLUE + 1))’).rename(‘EVI’) |
| SAVI (Sentinel-2) | savi = image.expression(‘(NIR − RED) / (NIR + RED + 0.5) * 1.5’).rename(‘SAVI’) |
| MSI (Sentinel-2) | msi = image.expression(‘SWIR / NIR’).rename(‘MSI’) |
2.3. CO₂ Estimation Using Satellite Data
This section details the methodology employed to estimate carbon stock and CO₂ emissions within the area of interest using satellite data from Sentinel-2 and Planet NICFI for two time periods: January 2023 and August 2024. NDVI (Normalized Difference Vegetation Index) served as a proxy for vegetation health, which was then used to estimate biomass. The estimated biomass was converted into carbon stock, which was subsequently used to calculate CO₂ emissions. Below is Table 3, which outlines the key formulas applied in this study to perform the biomass and CO₂ estimations.
Table 3.
Key Formulas for Biomass and CO₂ Calculation.
| Formula | Description | Sentinel-2 Bands | Planet NICFI Bands |
|---|---|---|---|
 |
Empirical relationship to estimate biomass from NDVI. |
 (B8 = NIR, B4 = Red) |
 (N = NIR, R = Red) |
 |
Biomass to carbon conversion using 47% carbon content in biomass. | Same as above | Same as above |
 |
Carbon to CO2 conversion using the molecular weight ratio of CO2 to carbon. | Same as above | Same as above |
The NDVI calculation for both Sentinel-2 and Planet NICFI was performed by taking the difference between the near-infrared (NIR) and red bands, divided by their sum, to assess vegetation health. Higher NDVI values indicate denser, healthier vegetation. For biomass estimation, the NDVI values were multiplied by a factor of 150, a standard conversion for tropical ecosystems, to estimate biomass in megagrams per hectare (Mg/ha). The carbon stock was then calculated by multiplying the biomass by 0.47, as 47% of biomass is assumed to be carbon. Finally, to estimate CO₂ emissions, the carbon stock was converted using the molecular weight ratio of CO₂ to carbon (44/12), accounting for the weight of oxygen in CO₂.
This methodology provided a clear understanding of carbon dynamics, especially how vegetation changes impact CO₂ emissions and sequestration. The combination of Sentinel-2’s 10-meter resolution and Planet NICFI’s 3-meter resolution offered precise spatial details, allowing for a thorough comparison of vegetation changes over time. By analyzing data from January 2023 and August 2024, the study covered critical periods to monitor the effects of both seasonal and human-induced changes on carbon storage and CO₂ emissions. This approach is vital for understanding the impact of deforestation and reforestation on carbon balance and climate change.
2.4. Deforestation Detection and Analysis Using Sentinel-2 and Planet NICFI Imagery
To accurately detect and quantify deforestation using Sentinel-2 and Planet NICFI satellite data, the analysis utilized NDVI calculations, thresholding techniques, and relative NDVI change detection. These methods allowed for the precise identification of deforested areas. Table 4 below outlines the key formulas and pseudocode used in this process, explaining how the satellite data were processed to detect and quantify vegetation loss.
Table 4.
Biomass and CO₂ Calculation Formulas and Key Code Snippets.
| Formula | Description | Purpose |
|---|---|---|
| NDVI = (NIR − Red) / (NIR + Red) | Normalized Difference Vegetation Index. NIR and Red bands used for both Sentinel-2 and Planet NICFI. | Measures vegetation health and density by comparing the reflection of NIR and Red bands. |
| Relative NDVI Change (%) = [(NDVI_After − NDVI_Before) / NDVI_Before] * 100 | Sentinel-2 only. Calculates the relative change in NDVI between two time periods. | Quantifies the percentage change in vegetation health over time, helping detect deforestation. |
| Deforestation Area = Σ (Area of Pixels where NDVI < threshold) | Applies an NDVI threshold to classify deforested regions. | Identifies areas where NDVI falls below the threshold, indicating vegetation degradation or loss. |
2.4.1. Explanation of Formula Use and Purpose
To effectively detect and quantify deforestation using Sentinel-2 and Planet NICFI satellite data, the analysis employed NDVI calculations, thresholding techniques, and relative NDVI change detection. These methods facilitated the identification of areas experiencing significant vegetation loss. Table 5 below outlines the key code snippets and formulas utilized to process the satellite data for deforestation detection and analysis
Table 5.
Key Code Snippets for Deforestation Detection and Analysis.
| Step | Code Snippet |
|---|---|
| NDVI Calculation (Sentinel-2 Before) | var sentinelNDVIBefore = ee.ImageCollection(‘COPERNICUS/S2’).filterDate(‘2023-01-01’, ‘2023-12-31’).normalizedDifference([‘B8’, ‘B4’]).rename(‘NDVI_Before’); |
| NDVI Calculation (Sentinel-2 After) | var sentinelNDVIAfter = ee.ImageCollection(‘COPERNICUS/S2’).filterDate(‘2024-01-01’, ‘2024-08-31’).normalizedDifference([‘B8’, ‘B4’]).rename(‘NDVI_After’); |
| Relative NDVI Change (Sentinel-2) | var sentinelRelativeNDVIChange = sentinelNDVIAfter.subtract(sentinelNDVIBefore).divide(sentinelNDVIBefore).multiply(100).rename(‘Relative_NDVI_Change’); |
| Deforestation Mask (Sentinel-2) | var sentinelDeforestationMask = sentinelRelativeNDVIChange.lt(-10).rename(‘Deforestation’); |
| Deforestation Area Calculation (Sentinel-2) | var sentinelDeforestationArea = sentinelDeforestationMask.multiply(ee.Image.pixelArea()).reduceRegion({ reducer: ee.Reducer.sum(), geometry: area_of_interest.geometry(), scale: 10, maxPixels: 1e9 }); |
| NDVI Calculation (Planet NICFI) | var planetNDVIAfter = ee.ImageCollection(‘projects/planet-nicfi/assets/basemaps/americas’).filterDate(‘2024-01-01’, ‘2024-08-31’).normalizedDifference([‘N’, ‘R’]).rename(‘NDVI_After’); |
| Deforestation Mask (Planet NICFI) | var planetDeforestationMask = planetNDVIAfter.lt(0.8).rename(‘Deforestation’); |
| Deforestation Area Calculation (Planet NICFI) | var planetDeforestationArea = planetDeforestationMask.multiply(ee.Image.pixelArea()).reduceRegion({ reducer: ee.Reducer.sum(), geometry: area_of_interest.geometry(), scale: 3, maxPixels: 1e9 }); |
| Deforestation Visualization (Sentinel-2) | Map.addLayer(sentinelDeforestationMask.updateMask(sentinelDeforestationMask), {palette: [‘red’]}, ‘Sentinel-2 Deforestation Areas’); |
| Deforestation Visualization (Planet NICFI) | Map.addLayer(planetDeforestationMask.updateMask(planetDeforestationMask), {palette: [‘blue’]}, ‘Planet NICFI Deforestation Areas’); |
| Deforestation Percentage Calculation (Sentinel-2) | var sentinelDeforestationPercentage = sentinelDeforestationAreaValue.divide(sentinelTotalAreaValue).multiply(100); |
3. Results
Figure 2.
Heatmaps of Vegetation Indices Metrics for Planet NICFI Data. This figure displays heatmaps for eight vegetation indices (ARVI, EVI, GNDVI, MSI, NDFI, NDVI, NDWI, SAVI) derived from Planet NICFI satellite data. Each heatmap shows the minimum, maximum, mean, and standard deviation (stdDev) values for the respective indices. The color intensity indicates the magnitude of the metrics, with darker colors representing lower values and lighter colors representing higher values. Color bars are included for visual reference.
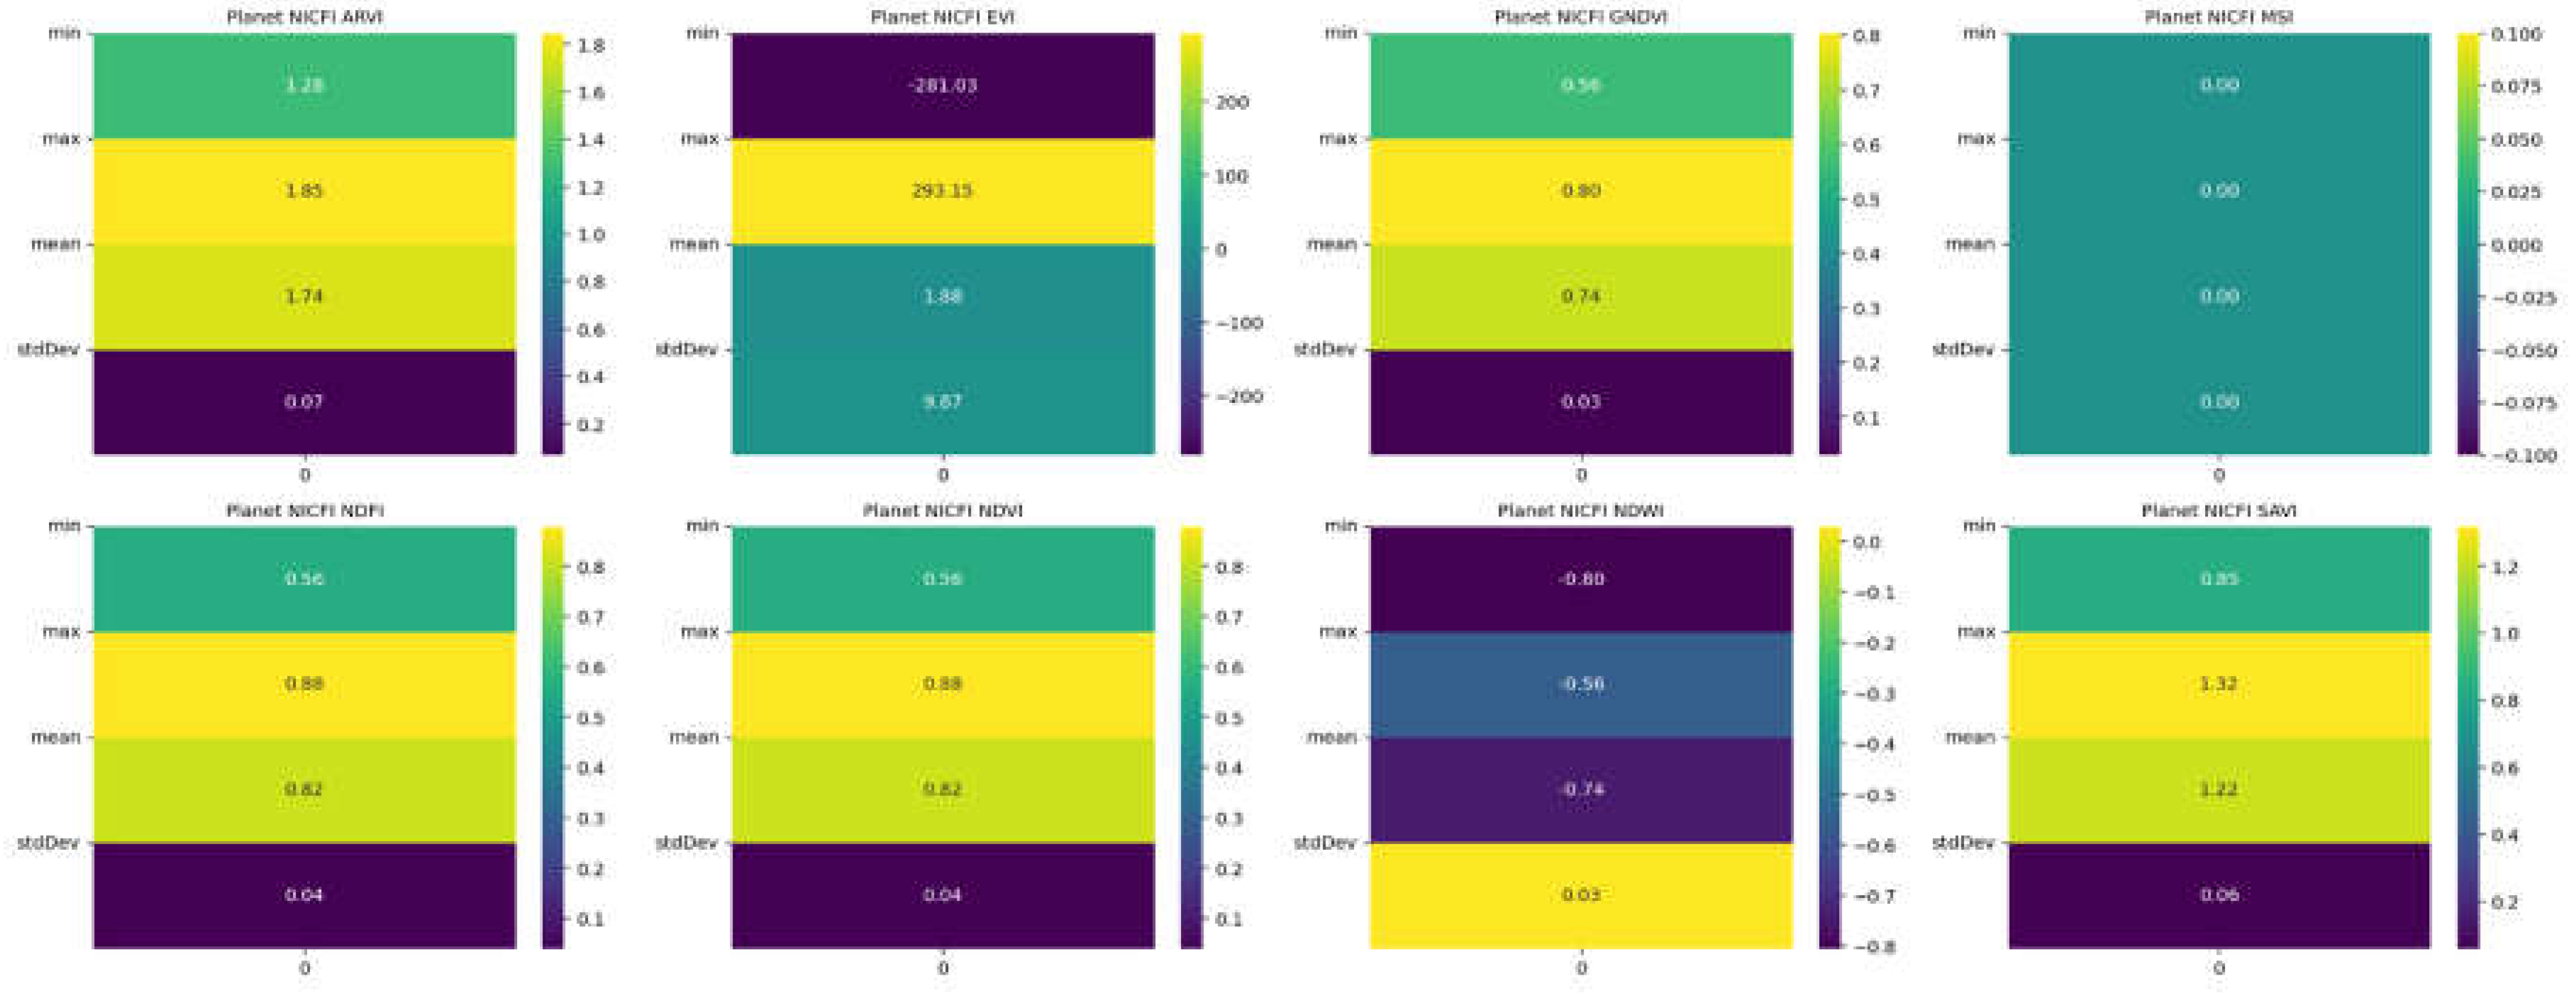
Figure 3.
Heatmaps of Vegetation Indices Metrics for Sentinel-2 Data. This figure presents heatmaps of eight vegetation indices (ARVI, EVI, GNDVI, MSI, NDFI, NDVI, NDWI, SAVI) derived from Sentinel-2 satellite data. Each heatmap displays the minimum, maximum, mean, and standard deviation (stdDev) values for the respective indices. The color intensity represents the magnitude of the metrics, with darker shades indicating lower values and lighter shades indicating higher values. Each subplot is accompanied by a color bar for reference.
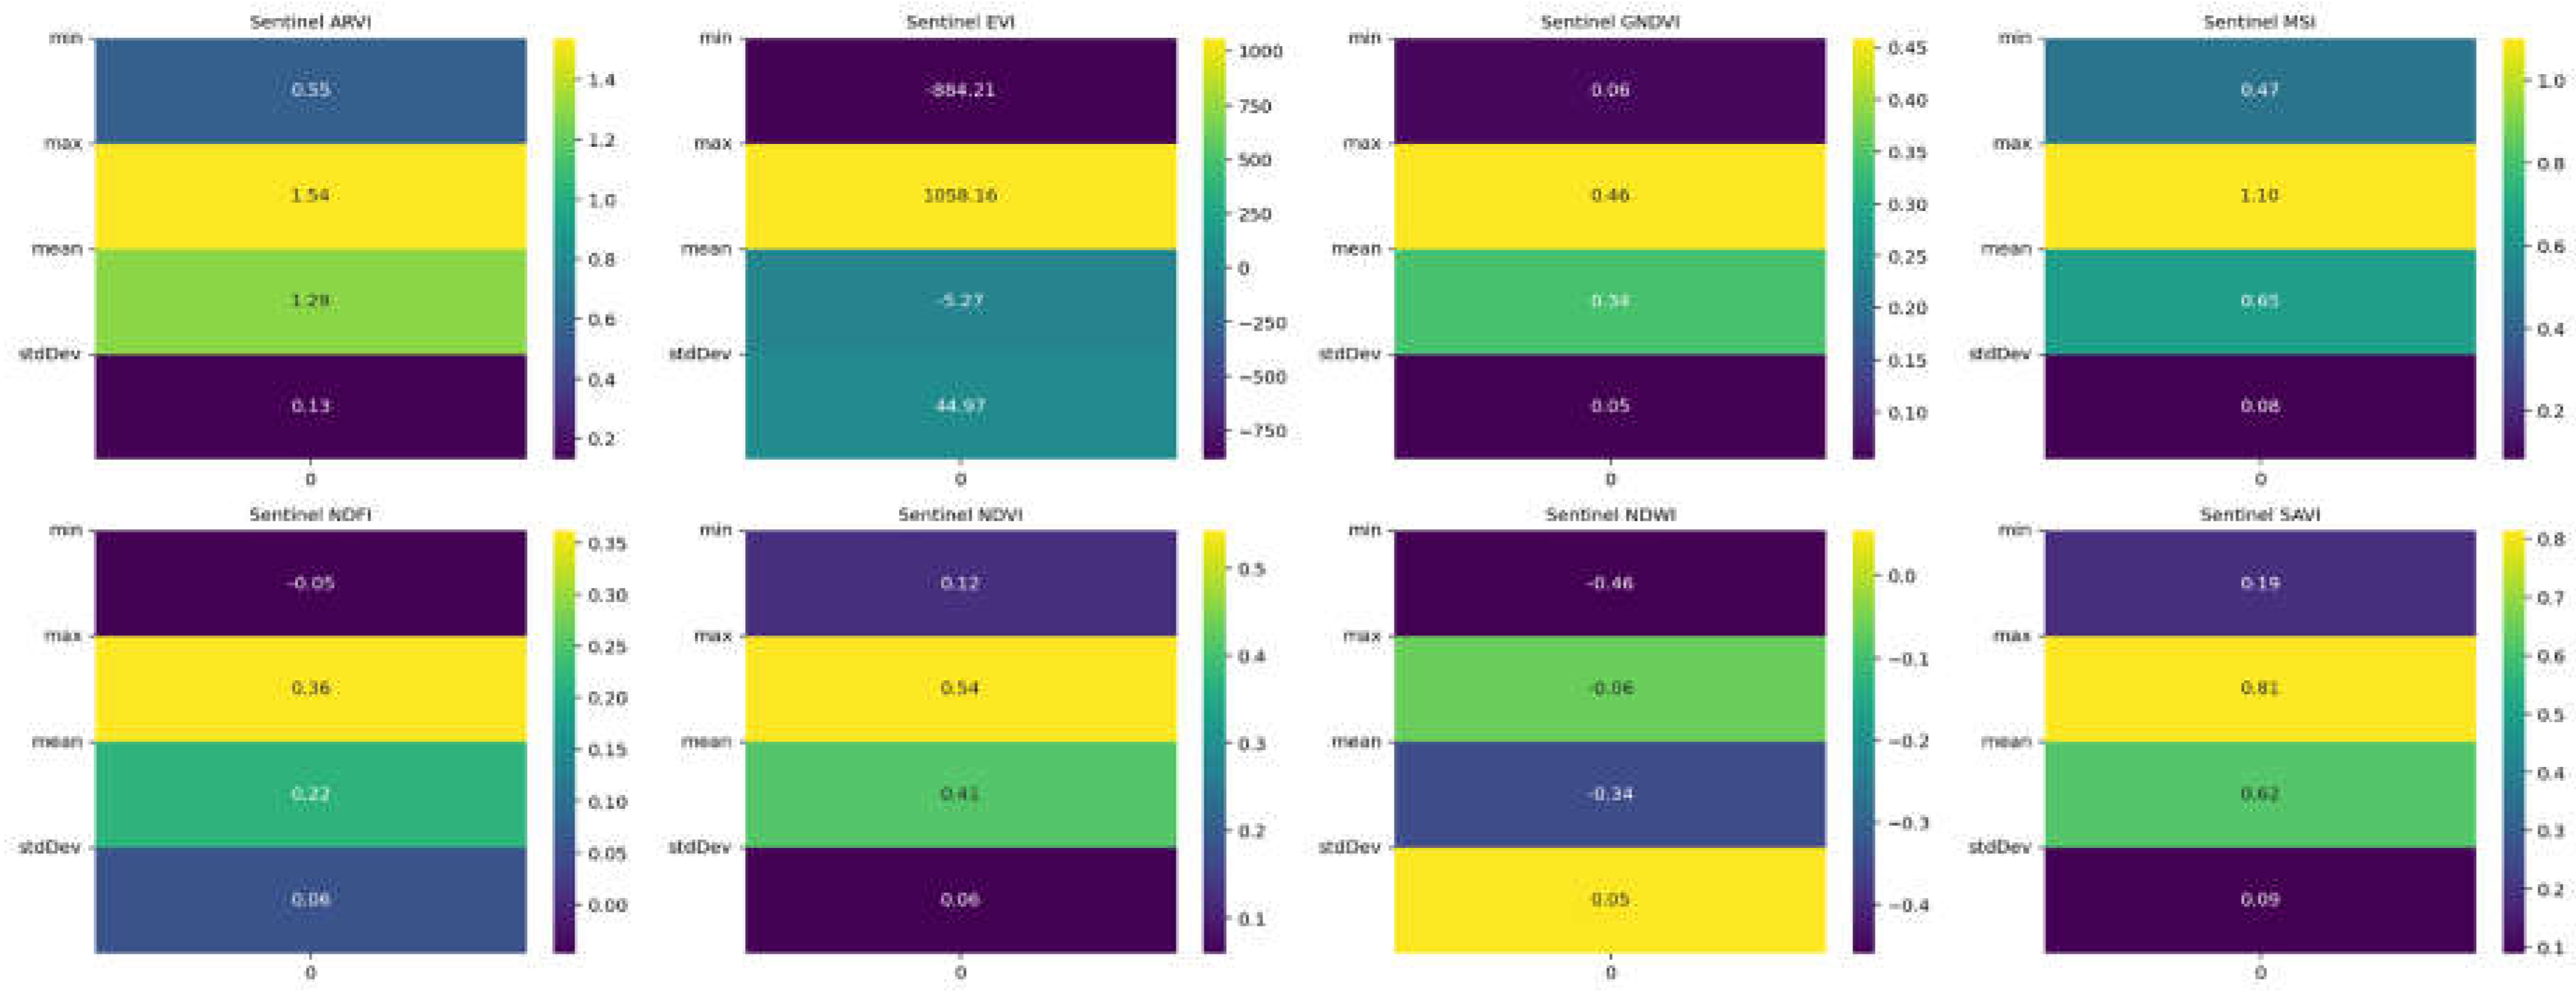
Figure 4.
Comparison of Vegetation Indices Across Key Time Points (January 2023 and August 2024) in the area using Planet NICFI Imagery. This figure displays the spatial distribution of key vegetation indices (NDVI, SAVI, EVI, MSI, GNDVI, NDFI, NDWI, and ARVI) across the study area for two critical time points: January 2023 and August 2024. The top row illustrates the indices in January 2023, while the bottom row represents the same indices in August 2024. Each subplot includes a color bar, indicating the relative value of the index across the area, with higher values generally reflecting more vegetation or water content, depending on the specific index. This comparison highlights the changes in land cover and vegetation health over the study period.
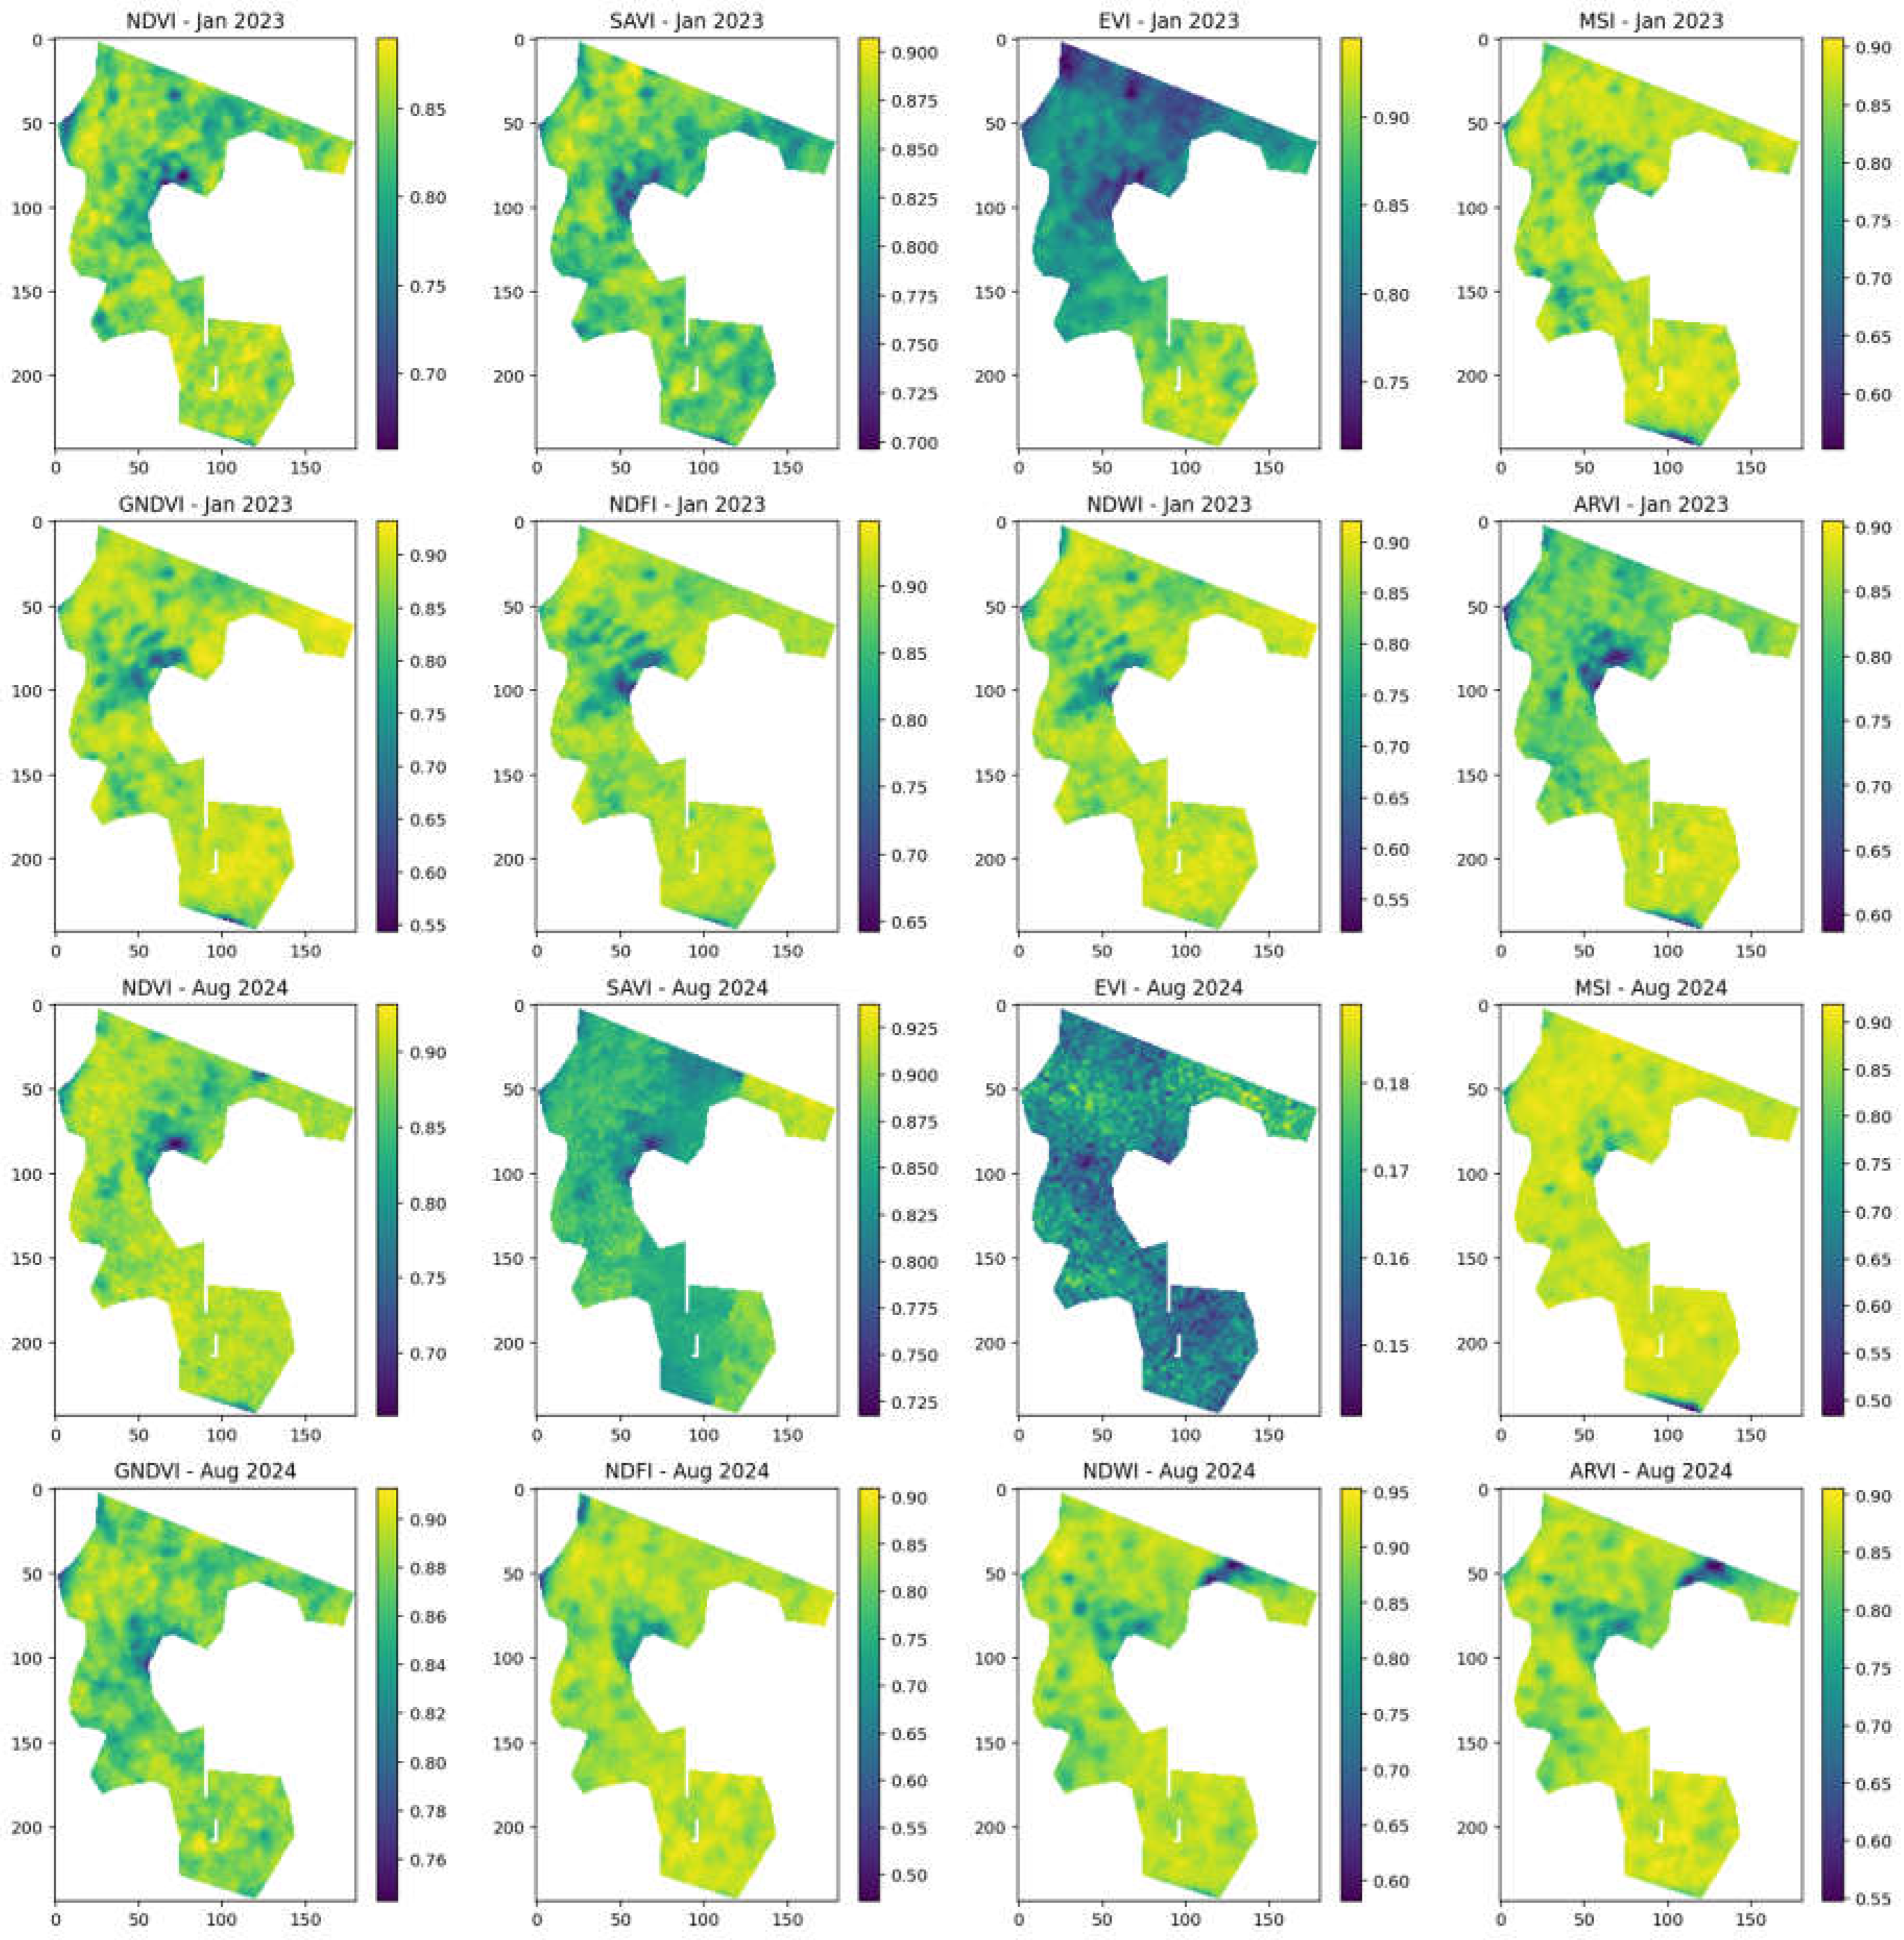
Figure 5.
Comparison of Vegetation Indices for January 2023 and August 2024 in area using Sentinel-2. This figure presents a comparison of various vegetation indices derived from Sentinel-2 data for the Gandoca-Manzanillo region. The indices include NDVI (Normalized Difference Vegetation Index), SAVI (Soil-Adjusted Vegetation Index), EVI (Enhanced Vegetation Index), MSI (Moisture Stress Index), GNDVI (Green Normalized Difference Vegetation Index), NDFI (Normalized Difference Fraction Index), NDWI (Normalized Difference Water Index), and ARVI (Atmospherically Resistant Vegetation Index). Each index is displayed for January 2023 (top row) and August 2024 (bottom row), highlighting temporal changes in vegetation conditions. The color scale ranges from low (purple) to high (yellow) values, indicating vegetation health, moisture levels, and atmospheric corrections.
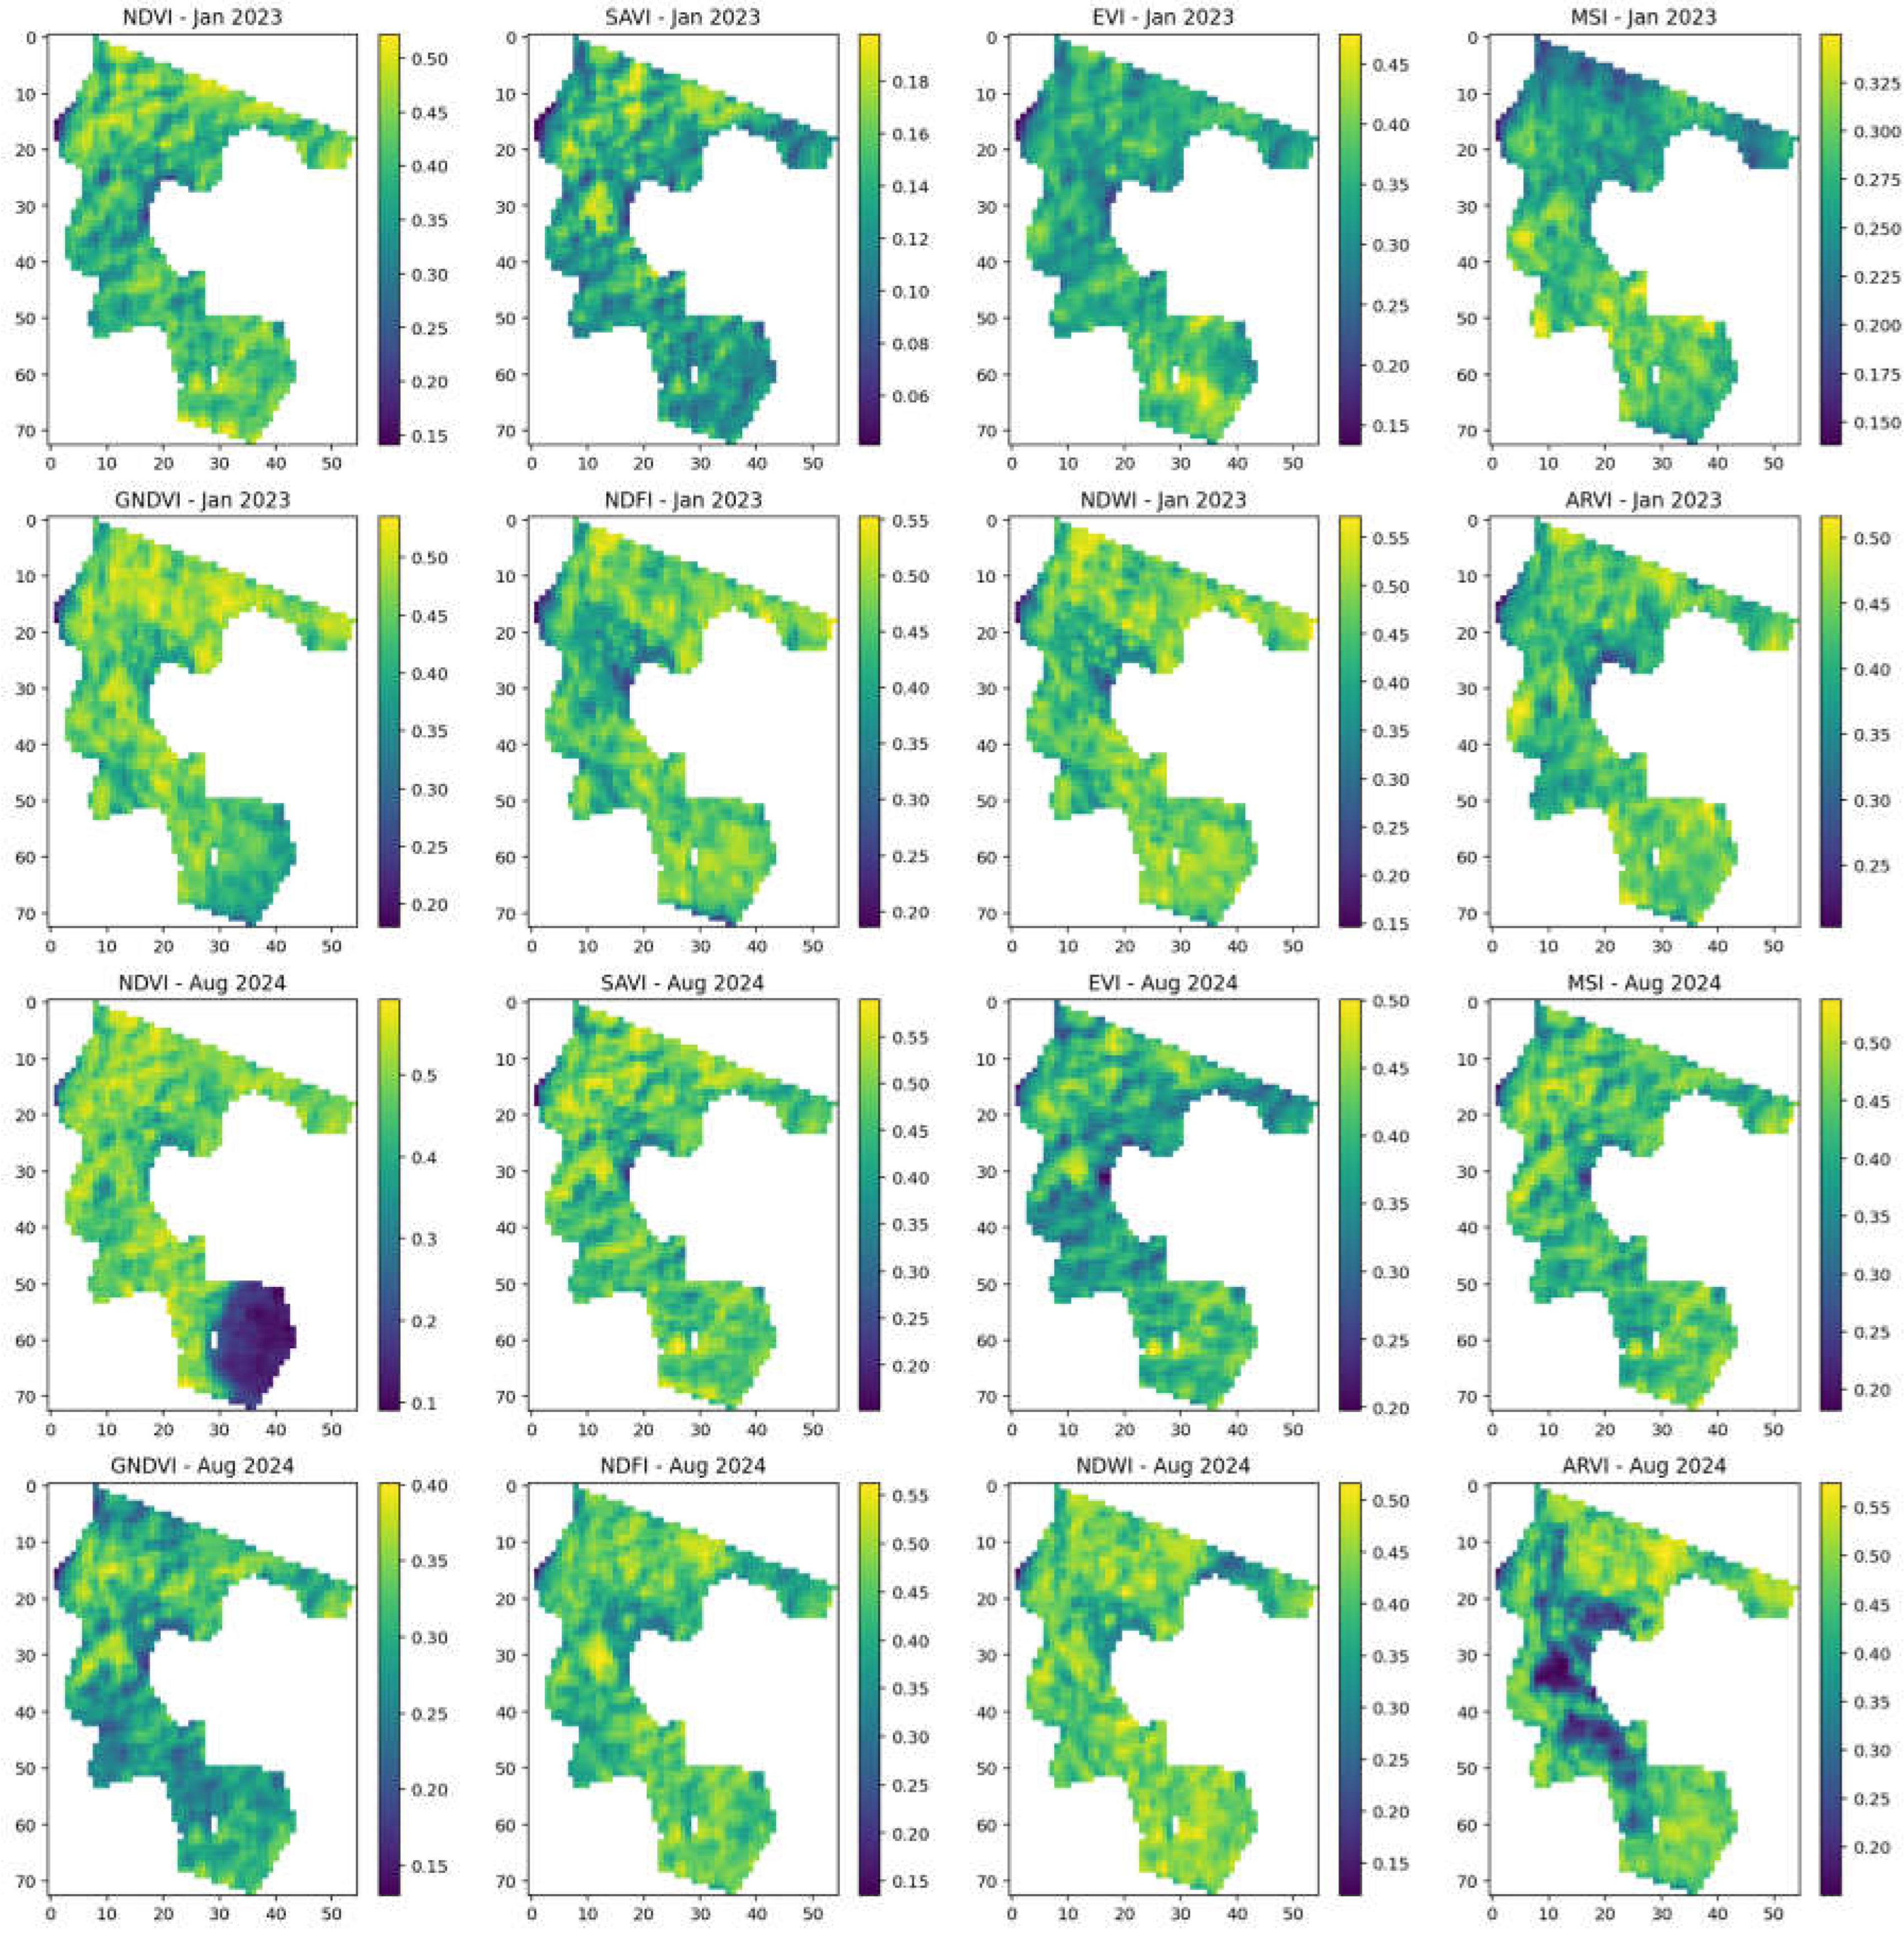
Table 6.
CO2 Concentration and Total CO2 in the Area of Interest.
| Statistic | Value |
|---|---|
| Total CO2 (tons) | 4,024,510.41 |
| Mean CO2 concentration | 221.27 |
| Minimum CO2 concentration | 179.08 |
| Maximum CO2 concentration | 231.61 |
Table 7.
Total CO₂ and CO₂ Loss/Gain in the Study Area (15.44 ha) for Sentinel-2 and Planet NICFI Datasets.
Table 7.
Total CO₂ and CO₂ Loss/Gain in the Study Area (15.44 ha) for Sentinel-2 and Planet NICFI Datasets.
| Dataset | Total CO₂ (tons) | CO₂ Loss/Gain (tons) |
|---|---|---|
| Sentinel-2 (January 2023) | 144,161.39 | -33,322.64 |
| Sentinel-2 (January 2024) | 177,484.04 | +100,834.54 |
| Sentinel-2 (August 2024) | 76,649.50 | +163,552.99 |
| Planet NICFI (January 2023) | 3,831,682.10 | -152,788.73 |
| Planet NICFI (January 2024) | 3,984,470.82 | +163,552.99 |
Figure 6.
CO₂ Loss Maps for Sentinel-2 and Planet NICFI in January 2023 and August 2024. This figure displays CO₂ loss for Sentinel-2 (a, b) and Planet NICFI (c, d) datasets in January 2023 and August 2024. Sentinel-2 captures broader landscape changes, while Planet NICFI provides finer details with higher resolution. The yellow and blue areas represent high and moderate CO₂ emissions, indicating changes in vegetation and carbon dynamics over time.
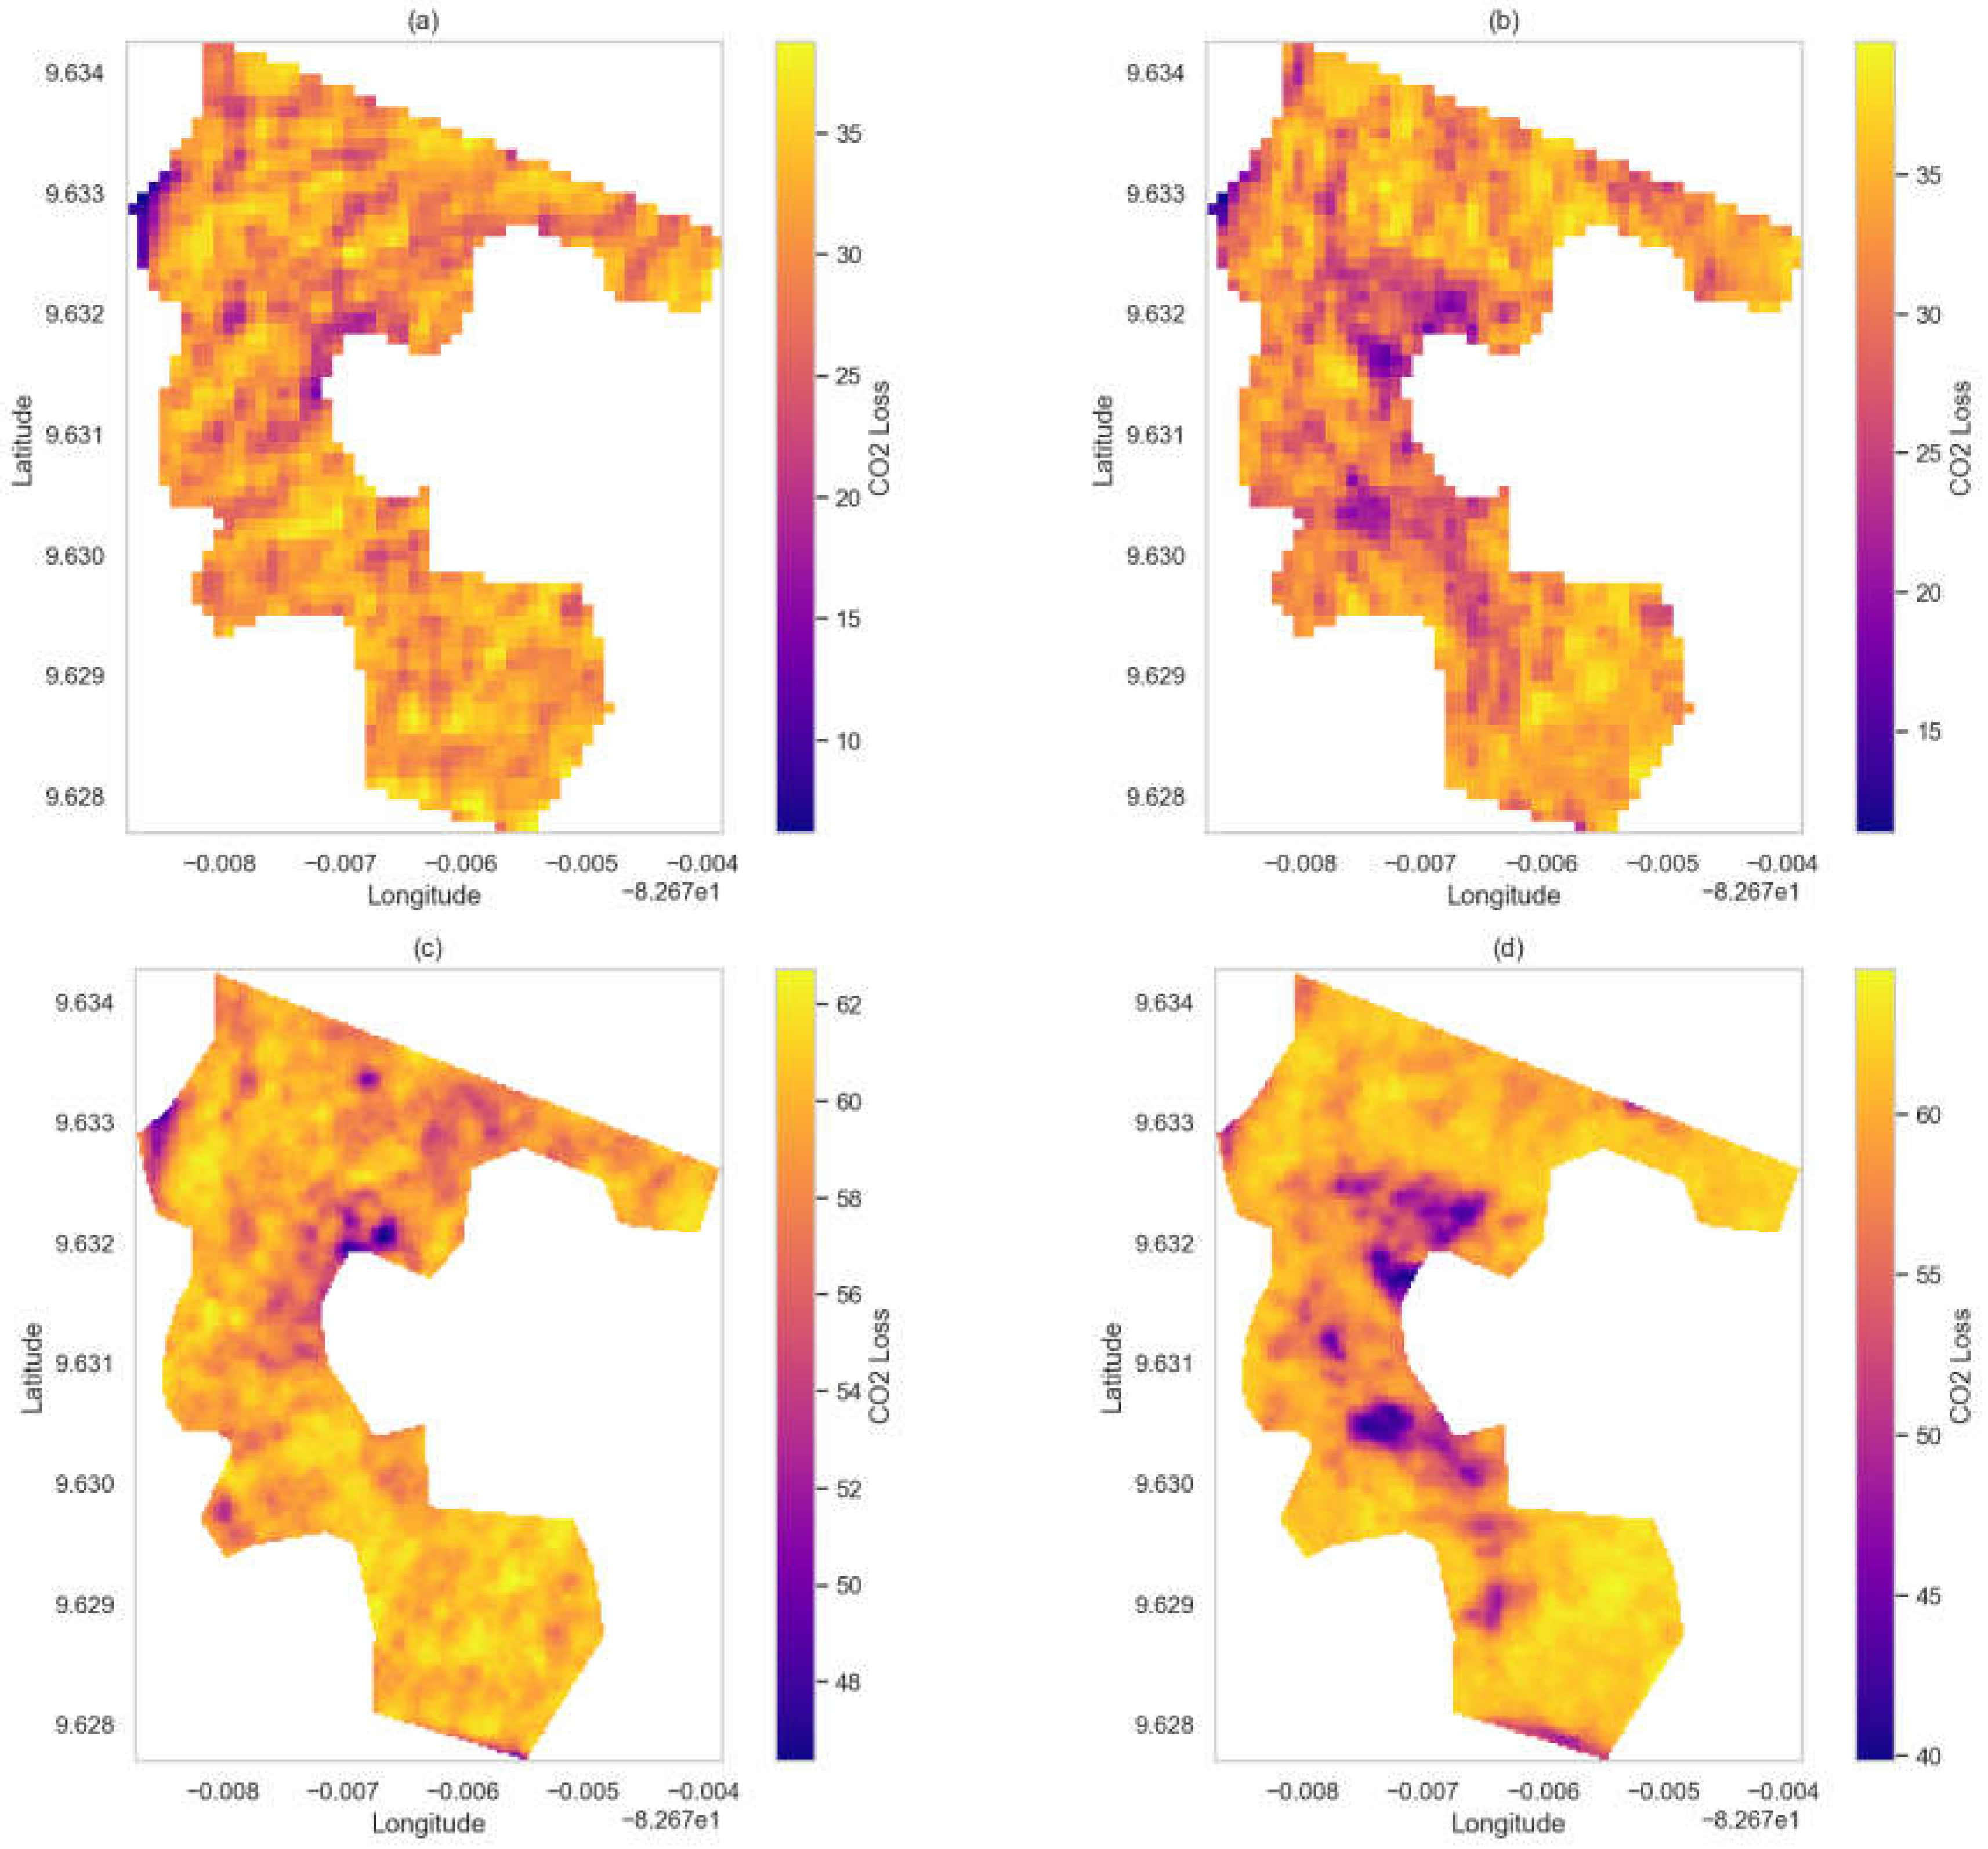
Figure 7.
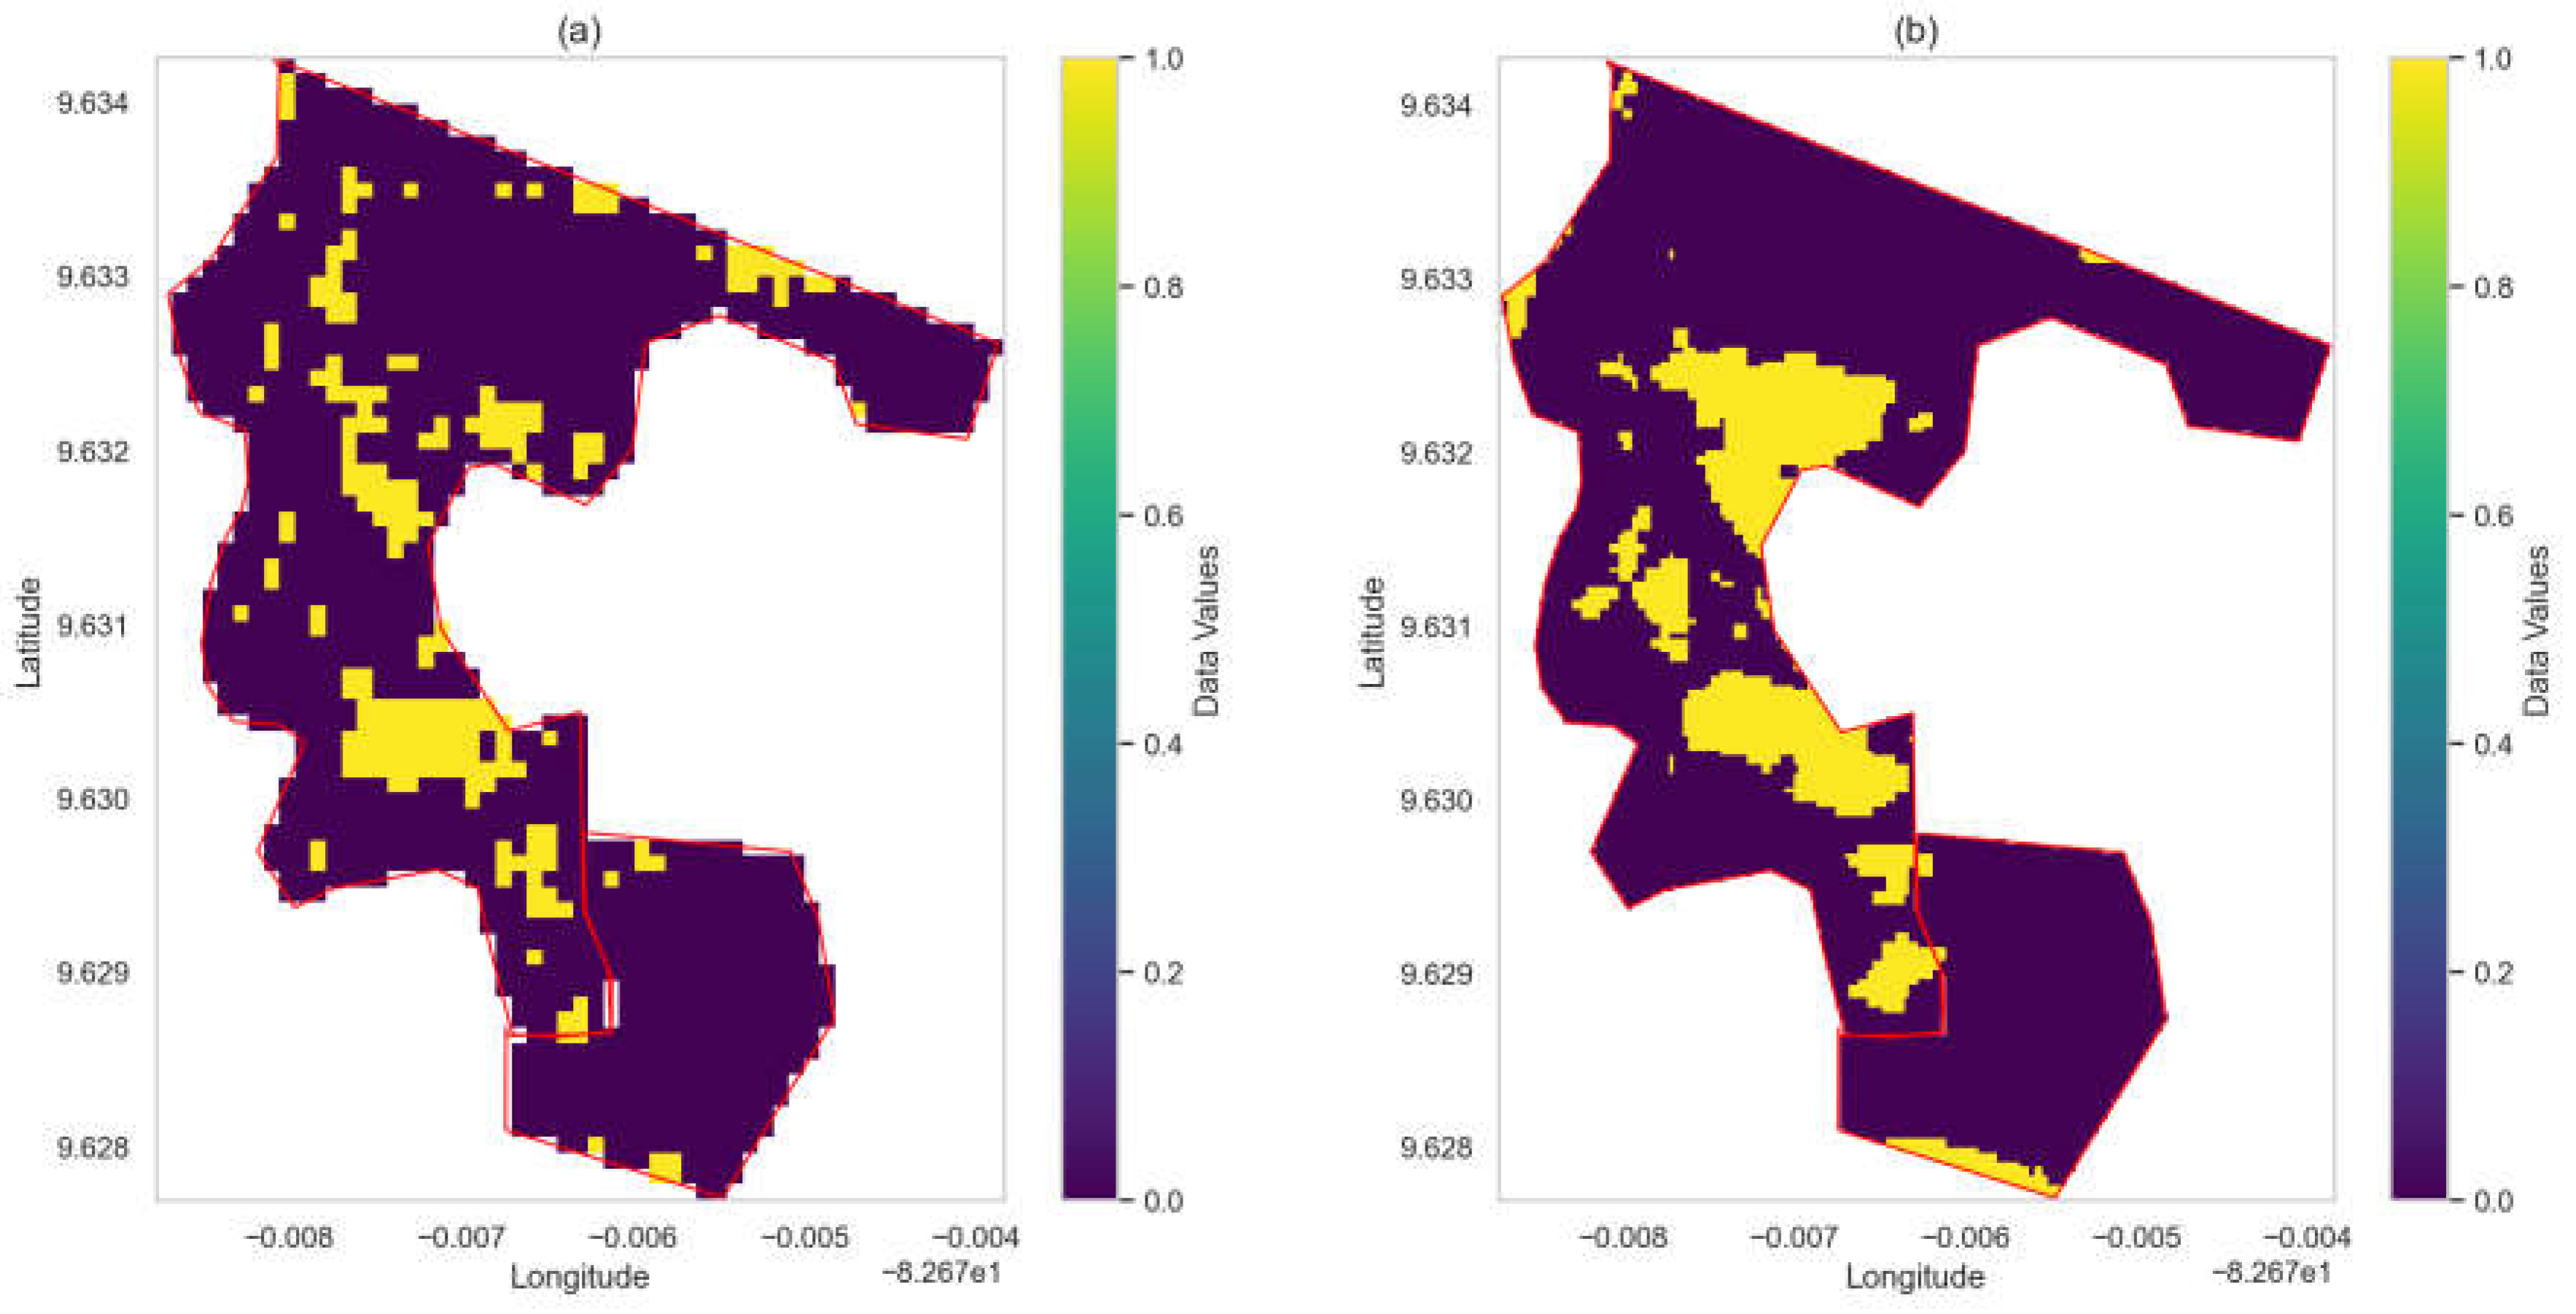
Deforestation Detection from Satellite Data for January 2023 and August 2024. Figure 6 presents a visual comparison of deforestation detected in the study area using satellite imagery from two sources: (a) Sentinel-2 and (b) Planet NICFI. The images illustrate the areas of vegetation loss between January 2023 and August 2024. The boundaries of the area of interest (AOI) are outlined in red. Notably, Sentinel-2 data reveals more fragmented deforestation patterns, while Planet NICFI data captures larger contiguous patches. Both datasets highlight critical areas of deforestation, indicating the effectiveness of satellite monitoring in tracking environmental changes over time.
Figure 7.
Deforestation Detection from Satellite Data for January 2023 and August 2024. Figure 6 presents a visual comparison of deforestation detected in the study area using satellite imagery from two sources: (a) Sentinel-2 and (b) Planet NICFI. The images illustrate the areas of vegetation loss between January 2023 and August 2024. The boundaries of the area of interest (AOI) are outlined in red. Notably, Sentinel-2 data reveals more fragmented deforestation patterns, while Planet NICFI data captures larger contiguous patches. Both datasets highlight critical areas of deforestation, indicating the effectiveness of satellite monitoring in tracking environmental changes over time.
4. Discussion
The analysis of vegetation indices and forest cover dynamics using Sentinel-2 and Planet NICFI data from January 2023 to August 2024 reveals significant changes in forest health and carbon sequestration in the Gandoca-Manzanillo area. NDVI values were higher in January 2023, reflecting healthier vegetation, while the decline by August 2024 suggests deforestation impacts. This trend aligns with the findings of Wang et al. (2024), who observed spatial differentiation in vegetation health using NDVI in China’s montane forests. Similarly, our results indicate spatial variation caused by deforestation, reinforcing NDVI as a key monitoring tool. The EVI and MSI results highlight environmental stress, with high EVI values in early 2023 comparable to Perućica forest’s values of 0.76418 to 0.80822 as reported by Govedar & Anikić (2024). However, by August 2024, increased MSI values signal heightened moisture stress, consistent with findings by Zhu et al. (2024) in grassland ecosystems, where MSI effectively captured drought conditions.
The Planet NICFI data further underscores the forest degradation, with a 5% decline in NDVI between January 2023 and August 2024, similar to the 5.75% loss documented by Miletić et al. (2024) in Serbia’s Norway spruce forests. This highlights the sensitivity of NDVI in detecting deforestation. Sentinel-2 data similarly reflects a 2-3% NDVI decline, reaffirming the effectiveness of satellite imagery in monitoring tropical forest health. Additionally, deforestation led to a forest cover loss of 3.5 hectares in Gandoca-Manzanillo, paralleling the reduction in forest cover observed in the Ponasa watershed, where Veliz et al. (2024) reported significant vegetation loss over time. Both studies demonstrate how fractional cover analysis and NDVI track long-term ecosystem degradation.
In terms of carbon sequestration, the results indicate a sharp increase in CO₂ emissions linked to forest cover loss, a trend also seen in Abera et al. (2024), who found that deforestation in African montane forests raised local temperatures and reduced carbon storage. The Sentinel-2 CO₂ data from Gandoca-Manzanillo shows a similar trajectory, reinforcing the need for continued monitoring. Further, GNDVI values in January 2023 were comparable to Mohammed Ali et al. (2024) in northern Iraq, where GNDVI showed strong correlations with Leaf Area Index (LAI), indicating a healthy forest ecosystem. The decline in GNDVI by August 2024 signals reduced chlorophyll content and ecosystem degradation, similar to the patterns observed in Iraq’s pine forests.
Comparatively, the study’s 3.5 hectares of forest loss is consistent with global patterns of deforestation, such as the 11,381-hectare loss reported by Veliz et al. (2024) in the Ponasa watershed. The rise in MSI during August 2024 reflects increased moisture stress, supporting the observed patterns of drought-induced stress. Overall, the integration of quantitative values and comparative analysis demonstrates that the forest dynamics in Gandoca-Manzanillo follow global deforestation trends, highlighting the crucial role of satellite-based monitoring in assessing environmental impacts and guiding conservation efforts.
The CO₂ concentration and total CO₂ data derived from Sentinel-2 and Planet NICFI datasets offer crucial insights into the region’s carbon dynamics. The total CO₂ concentration of 4,024,510.41 tons highlights the significant carbon storage potential of the area, while the mean concentration of 221.27 tons, with a maximum of 231.61 tons, reflects variations in vegetation density and ecosystem health. Comparatively, Qur’ani et al. (2024) observed mangrove ecosystems storing 72 to 936 Mg ha−1 (72 to 936 tons per hectare) of carbon, underscoring the variability in carbon sequestration across different ecosystems.
The analysis of CO₂ loss and gain over time reveals that Sentinel-2 recorded a CO₂ loss of 33,322.64 tons between January 2023 and January 2024, followed by a gain of 100,834.54 tons by August 2024, indicating forest recovery. This aligns with Narayan et al. (2024), who noted that global deforestation under unmanaged scenarios could result in significant carbon emissions, while sustainable management can lead to carbon gains. Similarly, the Planet NICFI dataset shows a CO₂ loss of 152,788.73 tons in January 2023, followed by a gain of 163,552.99 tons by August 2024, reflecting the forest’s recovery potential.
These results emphasize the dynamic nature of forest carbon storage and the importance of continuous monitoring. The contrasting CO₂ losses and gains suggest a resilient ecosystem, yet the significant initial losses underscore the need for effective management to maintain long-term carbon storage, as seen in similar global studies (Narayan et al., 2024; Qur’ani et al., 2024).
The deforestation analysis in Table 8 compares forest loss between Sentinel-2 and Planet NICFI datasets, revealing discrepancies in the extent of deforestation detected by each source. Sentinel-2 recorded 2.05 hectares of deforestation, accounting for 13.22%, while Planet NICFI detected a larger area of 2.60 hectares, equivalent to 16.76%. The higher detection by Planet NICFI can be attributed to its finer spatial resolution, which allows for more detailed identification of vegetation changes, especially in fragmented landscapes or along edges. This variation highlights the need for multi-source satellite data integration to capture a comprehensive view of deforestation, as relying solely on coarser-resolution imagery like Sentinel-2 may lead to underestimation in certain areas.
Table 8.
Comparación del Área de Deforestación y Porcentaje para Sentinel-2 y Planet NICFI (en hectáreas).
Table 8.
Comparación del Área de Deforestación y Porcentaje para Sentinel-2 y Planet NICFI (en hectáreas).
| Satélite | Área de Deforestación (ha) | Porcentaje de Deforestación (%) |
|---|---|---|
| Sentinel-2 | 2.05 | 13.22 |
| Planet NICFI | 2.60 | 16.76 |
Comparing these findings with the study by Withanage et al. (2024), which utilized multi-temporal Landsat imagery to assess forest loss in Sri Lanka, reveals similar trends in forest degradation. Their study observed a decline of 8.52 km² of forest cover, with a deforestation rate of 2.44% over 34 years. In both cases, the primary drivers of deforestation were human activities. The relatively moderate pace of deforestation in both regions highlights how gradual but consistent changes in land use can accumulate over time to significantly impact forest cover and ecosystem health.
4.1. Study Limitations
A key limitation in this study arises from the spatial resolution differences between Sentinel-2 and Planet NICFI datasets, which complicates direct comparison. Planet NICFI’s finer resolution allows for more precise detection of small-scale deforestation, particularly in fragmented landscapes or along forest edges, but its more limited coverage can affect its ability to provide consistent long-term monitoring. In contrast, Sentinel-2’s broader coverage, while effective for larger-scale forest dynamics, may not capture the finer details of forest changes detected by Planet NICFI. This challenge in harmonizing data from different platforms for large-scale forest monitoring has also been noted in studies like Francini et al. (2024), which encountered similar difficulties in comparing datasets with varying spatial resolutions across national forest inventories.
4.2. Future Research
Future research should focus on improving data integration across satellites with different spatial and temporal resolutions, such as combining Sentinel-1’s radar data with optical imagery, which could help overcome some limitations in detecting small-scale deforestation and enhance long-term tracking. Expanding the use of ground-based validation, through field surveys or drone technologies, could strengthen the accuracy of satellite-based assessments. Additionally, predictive models that account for varying land-use and climate conditions, similar to those explored by Masolele et al. (2024), could further enhance forest monitoring and conservation efforts.
5. Conclusions
This study provides critical insights into the dynamics of forest health and carbon sequestration in the Gandoca-Manzanillo Wildlife Refuge, using high-resolution satellite data from Sentinel-2 and Planet NICFI. The analysis reveals a significant decline in vegetation health between January 2023 and August 2024, as indicated by a 5% NDVI decrease from Planet NICFI data and a 2-3% decline from Sentinel-2 data. This degradation mirrors global deforestation patterns, such as the 5.75% forest loss in Serbia’s forests reported by Miletić et al. (2024).
The deforestation led to the loss of 3.5 hectares of forest cover, significantly impacting local carbon sequestration. The carbon analysis shows a CO₂ loss of 33,322.64 tons from Sentinel-2 between January 2023 and January 2024, followed by a gain of 100,834.54 tons by August 2024, indicating partial recovery. Similarly, Planet NICFI data shows a CO₂ loss of 152,788.73 tons and a gain of 163,552.99 tons, underscoring the region’s carbon recovery potential despite ongoing deforestation.
The comparison between the satellite datasets demonstrates the value of multi-source data integration in accurately detecting deforestation. Planet NICFI’s finer resolution detected 16.76% deforestation, while Sentinel-2 detected 13.22%, highlighting the greater sensitivity of higher-resolution data. This research emphasizes the need for continuous monitoring and effective management strategies to maintain long-term carbon storage and mitigate deforestation impacts.
These findings contribute to broader conservation efforts by offering satellite-based evidence of deforestation and ecosystem degradation, underscoring the necessity for independent, high-resolution monitoring in protected areas to support carbon neutrality initiatives in Costa Rica and beyond.
Author’s Note on AI Usage
The author used AI-assisted technology to enhance the grammar and readability of the manuscript. The AI was applied under human supervision and did not contribute to the scientific insights, conclusions, or recommendations. The final manuscript was thoroughly reviewed and edited by the author, who takes full responsibility for its content.
Author Contributions
Andrea Navarro Jimenez developed the research concept, designed the study, collected and analyzed the data, and prepared the manuscript.
Funding
This study did not receive specific funding from governmental, corporate, or non-profit organizations.
Institutional Review Board Statement
This study did not involve research on human subjects, human data, human tissue, or animals, and therefore no ethical approval was required.
Data Availability Statement
All datasets supporting the findings of this research are publicly available in the Mendeley Data repository. The dataset, titled “High-Resolution Satellite Monitoring of Forest Degradation and Carbon Sequestration in Costa Rica’s Gandoca-Manzanillo Wildlife Refuge,” can be accessed at: NAVARRO, ANDREA (2024), Mendeley Data, V1, doi: 10.17632/8528b5xyhd.1.
Conflicts of Interest
The author declares no conflicts of interest related to the publication of this manuscript.
References
- Abera, T. A. , Heiskanen, J., Maeda, E. E., Muhammed, M. A., Bhandari, N., Vakkari, V., Hailu, B. T., Pellikka, P. K. E., Hemp, A., van Zyl, P. G., & Zeuss, D. (2024). Deforestation amplifies climate change effects on warming and cloud level rise in African montane forests. ( 15, 6992. [CrossRef] [PubMed]
- Altamirano, K. , & Cambronero, N. (2024). Reporting on the controversy surrounding the SINAC permits and the modification of forest inventories. La Nación, /: from https.
- Baumbach, L. , Hickler, T., Yousefpour, R., & Hanewinkel, M. (2023). High economic costs of reduced carbon sinks and declining biome stability in Central American forests. ( 14, 2043. [CrossRef] [PubMed]
- Cambronero, N. , & Lara Salas, J. F. (2024, September 15). Imágenes satelitales muestran tamaño de tala en fincas de Pacheco Dent. La Nación, 15 September.
- Claes, J. , Conway, M., Hansen, T., Henderson, K., Hopman, D., Katz, J., & Wilson, R. (2020). Valuing nature conservation: A methodology for quantifying the benefits of protecting the planet’s natural capital. McKinsey & Company, /: https.
- Francini, S. , Schelhaas, M.-J., Vangi, E., Lerink, B., Nabuurs, G.-J., McRoberts, R. E., & Chirici, G. (2024). Forest species mapping and area proportion estimation combining Sentinel-2 harmonic predictors and national forest inventory data. International Journal of Applied Earth Observation and Geoinformation, 131. [CrossRef]
- Govedar, Z. , & Anikić, N. (2024). Vegetation indices monitoring by using Copernicus data in the old-growth forests of the Republic of Srpska/Bosnia and Herzegovina. Frontiers in Forests and Global Change, 7. [CrossRef]
- Hordijk, I. , Poorter, L., Meave, J. A., Bongers, F., Van der Sande, M. T., López Mendoza, R. D., Romero, P. J., De Jong, J., & Martínez-Ramos, M. (2024). Land use history and landscape forest cover determine tropical forest recovery. Journal of Applied Ecology, 77. [CrossRef]
- Madrigal, A. (2024). Potential political influence on deforestation permits: An investigation of SINAC. La Nación, /: from https.
- Masolele, R. N. , Marcos, D., De Sy, V., Abu, I.-O., Verbesselt, J., Reiche, J., & Herold, M. (2024). Mapping the diversity of land uses following deforestation across Africa. ( 14(1681), 1–12. [CrossRef]
- Miletić, B. R. , Matović, B., Orlović, S., Gutalj, M., Đorem, T., Marinković, G., Simović, S., Dugalić, M., & Stojanović, D. B. (2024). Quantifying forest cover loss as a response to drought and dieback of Norway spruce and evaluating sensitivity of various vegetation indices using remote sensing. B. ( 15, 662. [CrossRef]
- Mohammed Ali, M. B. S. , Al-Bek, M. S., & Al-Allaf, M. Y. (2024). Leaf Area Index estimated of pine stand using remote sensing. IOP Conference Series: Earth and Environmental Science, 1371. [CrossRef]
- Narayan, K. B. , Patel, P., Wise, M., Snyder, A., Calvin, K., & Graham, N. (2024). Seeing the forest for the trees: Implementing dynamic representation of forest management and forest carbon in a long-term global multisector model. Environmental Research Letters, 19. [CrossRef]
- OECD. (2023). Environmental performance reviews: Costa Rica 2023. OECD Environmental Performance Reviews. [CrossRef]
- Pascual, U. , Adams, V., Drucker, A., & Brown, K. (2023). The cultural and economic value of nature in sustainable development. ( 16(2), e12831. [CrossRef]
- Qur’ani, C. G. , Lee, B., Sasmito, S. D., Maulana, A. M., Seol, M., Wiradana, P. A., Leksono, B., Watiniasih, N. L., & Baral, H. (2024). Natural and anthropogenic impacts on mangrove carbon dynamics: A systematic review protocol. Forest Science and Technology, 20. [CrossRef]
- Sarmiento, J. L. , Hastings, M., & Friedlingstein, P. (2024). Land-use change and carbon dynamics in Costa Rica’s Payment for Ecosystem Services program. Environmental Research Letters, 16. [CrossRef]
- Veliz, M. , Aparicio, R., Segovia, E., Llactayo, W., Tinoco, P., & Jauregui, M. (2024). Contribution of fractional cover analysis for monitoring degraded ecosystems at the watershed level. ( 28(9), 120–137. [CrossRef]
- Wang, Z. , Han, F., Li, C., Li, K., & Wang, Z. (2024). Analysis of spatial differentiation of NDVI and climate factors on the upper limit of montane deciduous broad-leaved forests in the East Monsoon Region of China. Forests, 15. [CrossRef]
- Withanage, N. C. , Mishra, P. K., Abdelrahman, K., & Singh, R. (2024). Monitoring deforestation, forest health, and environmental criticality in a protected area periphery using geospatial techniques. ( 12, e17714. [CrossRef] [PubMed]
- Zhu, X. , Li, Q., & Guo, C. (2024). Evaluation of the monitoring capability of various vegetation indices and mainstream satellite band settings for grassland drought. ( 82, 102717. [CrossRef]
Figure 1.
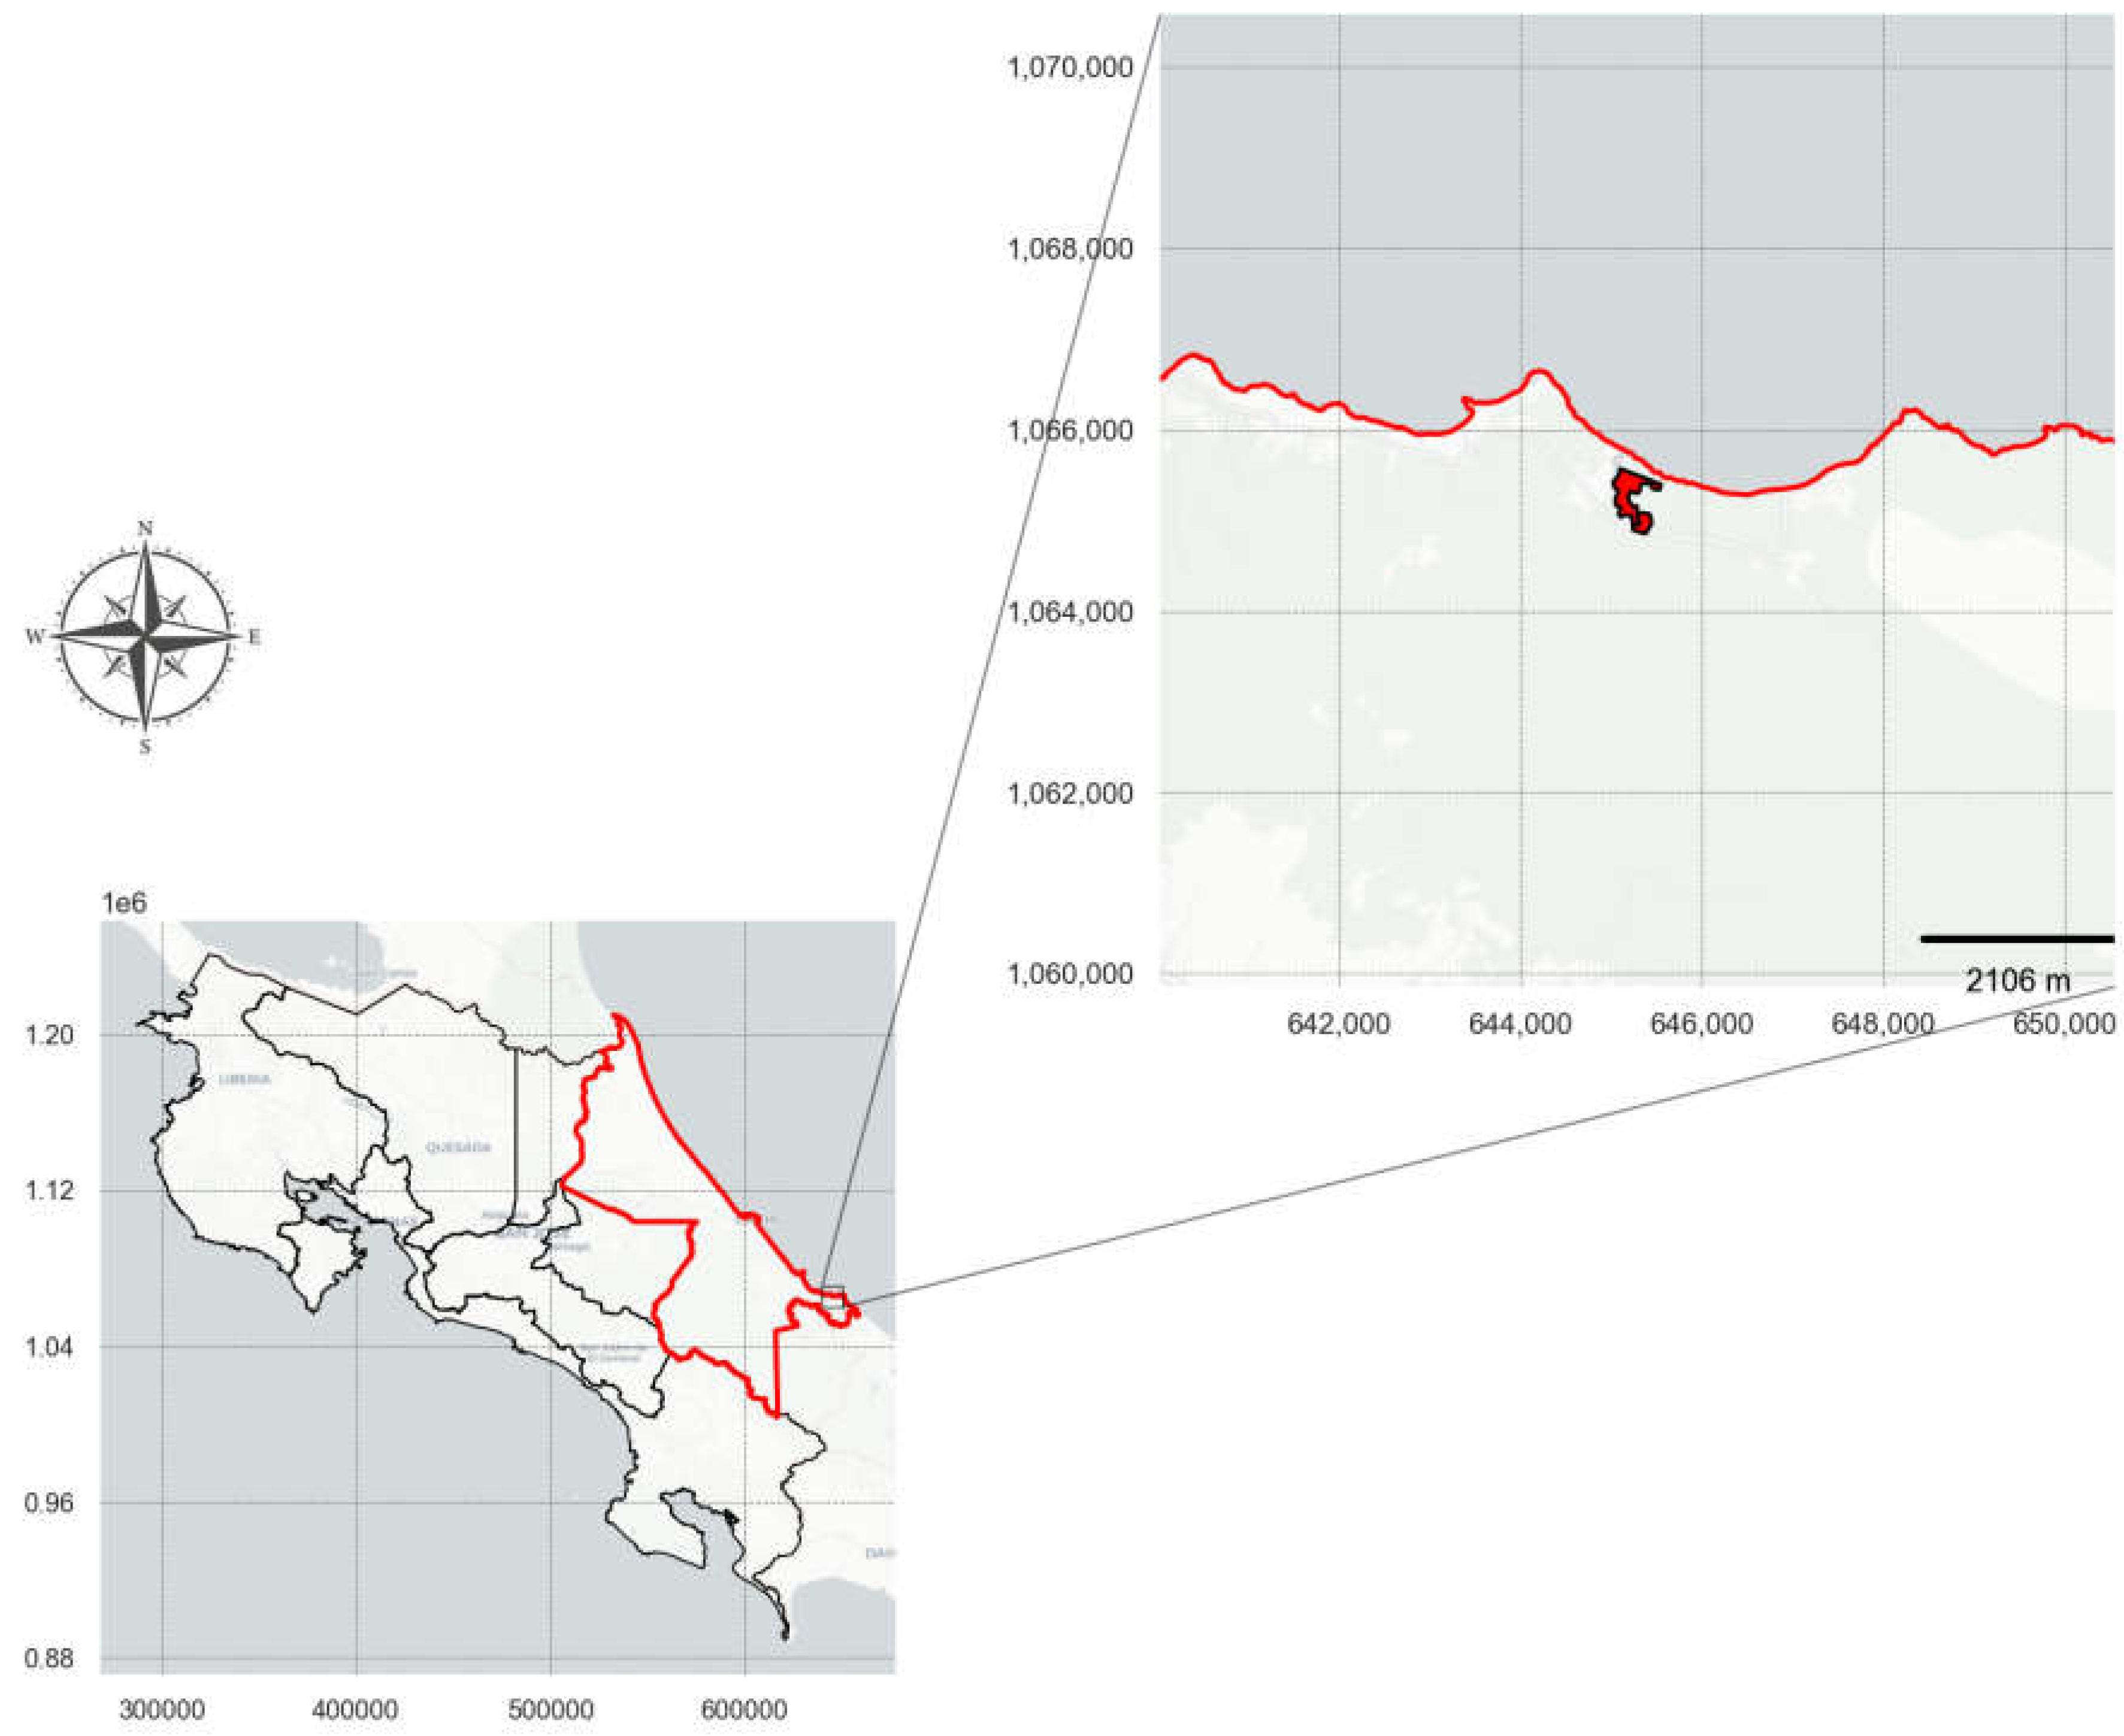
Location and Boundaries of Properties in Limón Province, Costa Rica. The map shows the geographical location and boundaries of Property 1 (7-Limón, Inscription No. 942968) and Property 2 (7-Limón, Inscription No. 110409) in the canton of Talamanca, district of Sixaola. Property 1 covers an area of 12.24 hectares and Property 2 covers an area of 3.18 hectares. The red boundaries on the inset map highlight the properties, while the surrounding area of Limón Province is outlined in black. The basemap was created using CartoDB Positron and shows the properties’ proximity to the Gandoca-Manzanillo Wildlife Refuge, an important environmental conservation zone in Costa Rica.
Figure 1.
Location and Boundaries of Properties in Limón Province, Costa Rica. The map shows the geographical location and boundaries of Property 1 (7-Limón, Inscription No. 942968) and Property 2 (7-Limón, Inscription No. 110409) in the canton of Talamanca, district of Sixaola. Property 1 covers an area of 12.24 hectares and Property 2 covers an area of 3.18 hectares. The red boundaries on the inset map highlight the properties, while the surrounding area of Limón Province is outlined in black. The basemap was created using CartoDB Positron and shows the properties’ proximity to the Gandoca-Manzanillo Wildlife Refuge, an important environmental conservation zone in Costa Rica.
Disclaimer/Publisher’s Note: The statements, opinions and data contained in all publications are solely those of the individual author(s) and contributor(s) and not of MDPI and/or the editor(s). MDPI and/or the editor(s) disclaim responsibility for any injury to people or property resulting from any ideas, methods, instructions or products referred to in the content. |
© 2024 by the authors. Licensee MDPI, Basel, Switzerland. This article is an open access article distributed under the terms and conditions of the Creative Commons Attribution (CC BY) license (http://creativecommons.org/licenses/by/4.0/).
Copyright: This open access article is published under a Creative Commons CC BY 4.0 license, which permit the free download, distribution, and reuse, provided that the author and preprint are cited in any reuse.


