Submitted:
01 October 2024
Posted:
02 October 2024
Read the latest preprint version here
Abstract
This study aims to assess the impact of deforestation and carbon sequestration within the Gandoca-Manzanillo Wildlife Refuge, Costa Rica, using high-resolution satellite imagery from Planet NICFI and Sentinel-2. The research evaluates the impact of forest degradation on forest health and carbon absorption during two periods in 2024 (January and August). Advanced vegetation indices (NDVI, GNDVI, EVI, and SAVI) were applied to assess changes in forest cover and health. Planet NICFI data revealed a 0.41% loss in forest cover, identifying subtle degradation less detectable with Sentinel-2. In terms of carbon sequestration, Sentinel-2 showed a modest increase in CO₂ absorption from 180,231.88 tons to 186,211.33 tons, while Planet NICFI indicated a decrease from 3,984,470.82 tons to 3,820,917.83 tons, suggesting forest degradation. These findings highlight the importance of high-resolution satellite imagery in detecting fine-scale disturbances that lower-resolution data might miss. However, the study’s short timeframe, covering only two periods in 2024, limits long-term trend analysis. The research underscores the need for improved remote sensing technologies and stronger legal frameworks to protect areas like Gandoca-Manzanillo from illegal logging. Despite programs like Payment for Ecosystem Services (PES) in Costa Rica, significant challenges remain in protecting biodiversity-rich regions.
Keywords:
Deforestation
; Carbon Sequestration
; Remote Sensing
; Satellite Monitoring
; Tropical Forests
1. Introduction
The escalating threats to global forests, driven by illegal logging, deforestation, and forest degradation, present significant obstacles to conservation initiatives and the global effort to enhance carbon sequestration. One critical area at the heart of this issue is the Gandoca-Manzanillo Wildlife Refuge in Costa Rica, renowned for its remarkable biodiversity. This refuge is currently entangled in a legal and environmental dispute, following allegations of illegal logging and deforestation on land owned by businessman Allan Pacheco Dent. Recent satellite imagery has confirmed a significant loss of 3.5 hectares of forest cover on these properties between January and May 2024, raising concerns about the involvement of the National System of Conservation Areas (SINAC) in issuing potentially illegal logging permits (Cambronero & Lara Salas, 2024; Altamirano & Cambronero, 2024). These claims have raised concerns about potential political influence in the authorization of logging permits (Madrigal, 2024).
The importance of this research is underscored by the ongoing legal investigations, as the Environmental Prosecutor's Office investigates claims that SINAC issued permits allowing deforestation in protected forest and wetland regions, which violates national and international laws, such as the Ramsar Convention. These events highlight the urgent need for high-resolution, objective monitoring tools to detect and quantify fine-scale deforestation in sensitive ecosystems. While traditional methods of forest inventory have been criticized for inaccuracy, satellite imagery, when applied with advanced remote sensing techniques, provides an independent, verifiable record of land use changes, helping to ensure compliance with conservation regulations.
Despite these challenges, Costa Rica's achievements in forest conservation are remarkable. Through initiatives like the Payment for Ecosystem Services (PES) program, the country has increased forest cover from 25% in the mid-1990s to over 60% by 2020. The PES program has protected 1.4 million hectares of forest between 1997 and 2020, distributing USD 565 million to over 20,000 landowners (Sarmiento et al., 2024). However, incidents like those in Gandoca-Manzanillo show that without strong, real-time monitoring, these gains may be vulnerable to exploitation and degradation.
This study seeks to confirm the loss of forest cover in Gandoca-Manzanillo by analyzing high-resolution satellite imagery from Planet NICFI and Sentinel-2, using advanced vegetation indices (NDVI, GNDVI, EVI) to assess forest degradation and carbon sequestration. By doing so, it addresses the critical gap in detecting fine-scale environmental changes, particularly in biodiversity-rich areas that are legally protected but under threat from human activity.
Costa Rica's National Decarbonisation Plan emphasizes forest conservation as a cornerstone of its strategy to achieve carbon neutrality. While the country achieved zero net deforestation from 2012 to 2019, current trends in urban development and increased deforestation jeopardize its ability to maintain these gains, particularly in vulnerable ecosystems like wetlands and mangroves (OECD, 2023). The ongoing Pacheco Dent case underscores the need for robust monitoring frameworks to safeguard these ecosystems.
By leveraging satellite imagery and advanced remote sensing techniques, this research provides independent verification of reported deforestation, supporting legal frameworks and enhancing the potential for long-term conservation success. The application of these tools in Costa Rica’s protected areas serves as a model for other regions facing similar deforestation pressures, demonstrating the global importance of satellite monitoring for environmental protection.
Furthermore, research indicates that the economic impact of forest degradation could result in annual economic losses of USD 314 billion by 2100, highlighting the need for sustainable forest management to maintain carbon sinks and mitigate the effects of climate change (Baumbach et al., 2023). Costa Rica’s PES program contributes to this goal by sequestering 0.9 to 2.6 gigatons of CO₂ annually, preventing emissions and promoting sustainable economic opportunities like eco-tourism (Claes et al., 2020). These policies, which emphasize the economic and cultural valuation of nature, are essential for long-term sustainability (Pascual et al., 2023).
This research contributes to the ongoing discourse on sustainable land management and conservation strategies, emphasizing the need for precise and transparent monitoring methods in protecting vulnerable ecosystems. The ongoing legal dispute surrounding logging permits in Gandoca-Manzanillo further underscores the importance of satellite-based remote sensing in ensuring the long-term protection of conservation zones (Hordijk et al., 2024; Piaggio et al., 2024).
2. Methodology
2.1. Study Design
This study employs an observational and comparative geospatial analysis using remote sensing techniques to monitor and evaluate forest degradation and carbon sequestration within the Gandoca-Manzanillo Wildlife Refuge. The study focuses on two key periods in 2024: January and August, to capture temporal changes in vegetation health and forest cover.
- January 2024 was chosen as the baseline, representing the period before any suspected illegal logging activities had commenced. At this time, the property was mostly undisturbed, with 96% of the area covered in trees, as documented in the investigation by public authorities (Cambronero & Lara Salas, 2024).
- August 2024 was included in this research to extend the observation period and provide a longer-term analysis of forest cover changes following the granting of the logging permit in April 2024. This extended timeframe helps identify whether additional deforestation, regrowth, or changes in forest cover occurred beyond the initial logging activities.
The study utilizes high-resolution imagery from Planet NICFI (3-meter resolution) and Sentinel-2 (10-60 meter resolution) for each period. The combination of these datasets enables a detailed comparison of fine-scale changes in vegetation structure and broader landscape dynamics. Data were accessed and processed through Google Earth Engine (GEE), with pre-processing steps applied to ensure data quality, such as cloud masking and spatial re-projection.
By extending the analysis to August, this study provides a more comprehensive assessment of forest cover dynamics, allowing for the detection of changes that occurred beyond the initial deforestation period and offering a deeper understanding of long-term forest degradation in the region.
2.2. Study Area and Sample
The study focuses on two properties located within the Gandoca-Manzanillo Wildlife Refuge, Costa Rica:
- Property 1: (7-Limón, Inscription No. 942968) covers an area of 122,388.46 m² (approximately 12.24 hectares).
- Property 2: (7-Limón, Inscription No. 110409) spans 31,789 m² (approximately 3.18 hectares).
These properties were selected due to their ecological sensitivity and involvement in ongoing legal disputes regarding illegal deforestation. Together, the properties form a total study area of 15.44 hectares. This site provides a representative sample for examining how illegal logging and forest degradation can be monitored using advanced remote sensing techniques.
Figure 1.
Location and Boundaries of Properties in Limón Province, Costa Rica.
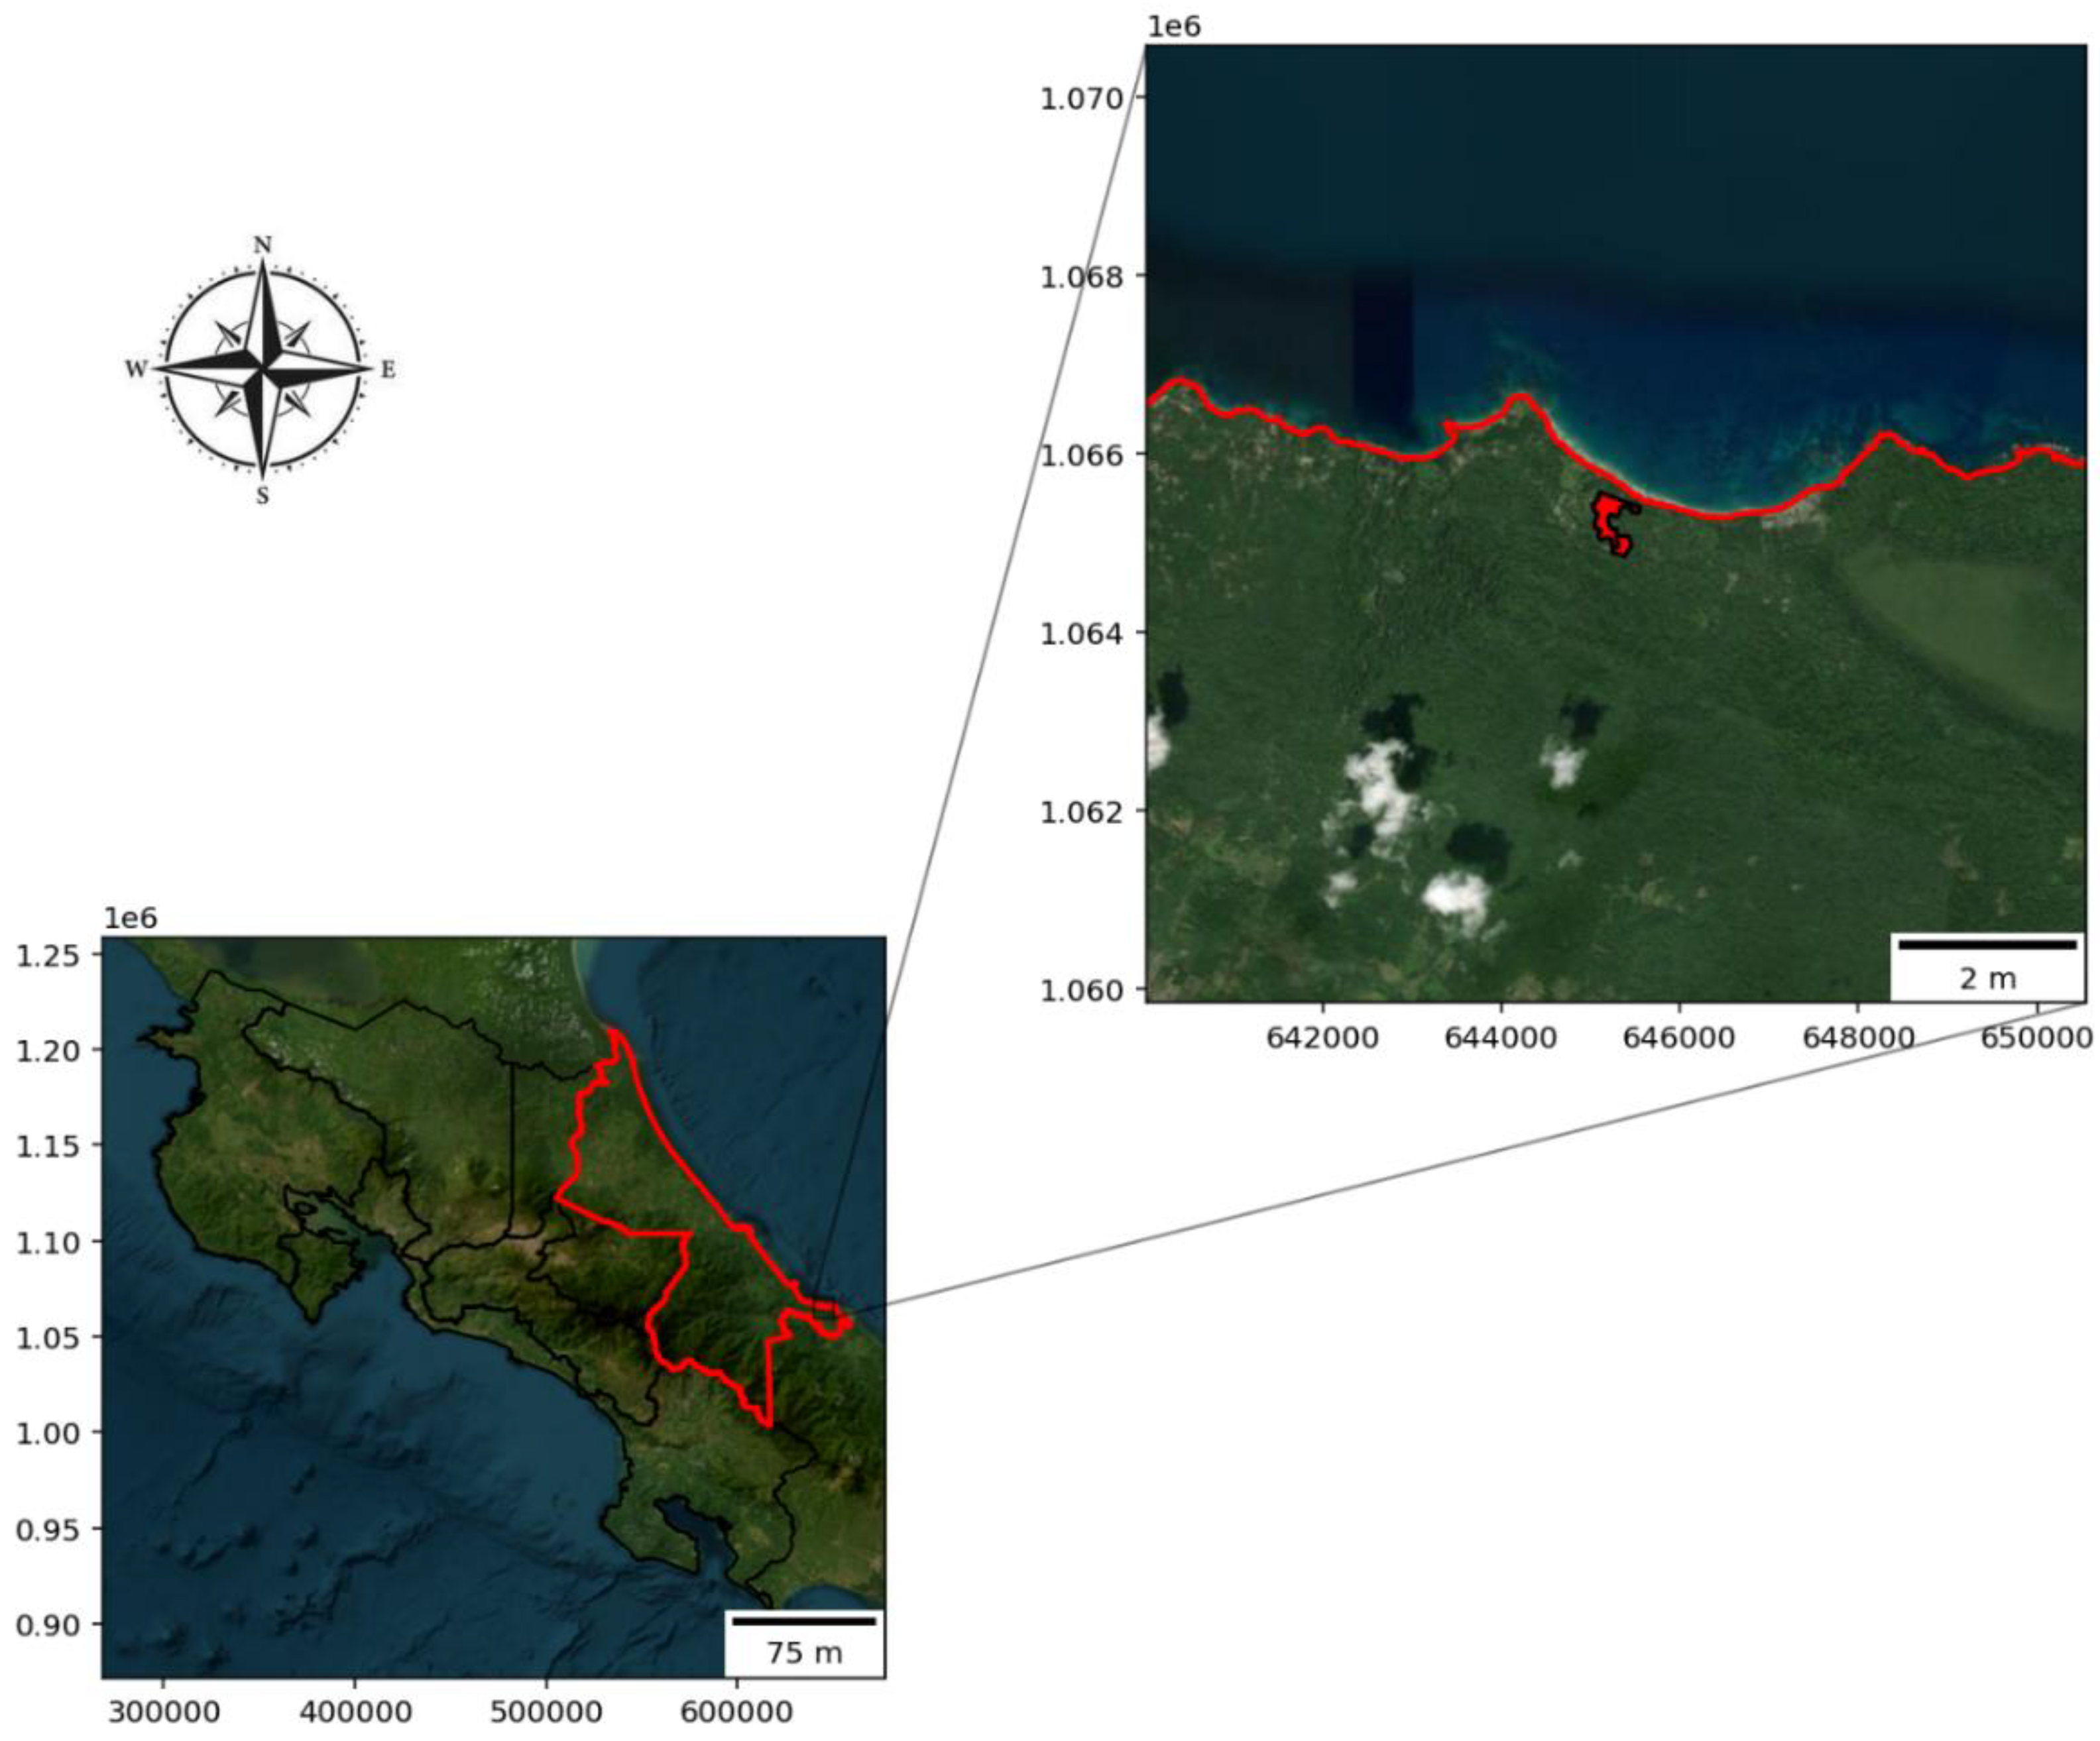
Caption: The map shows the geographical location and boundaries of Property 1 (7-Limón, Inscription No. 942968) and Property 2 (7-Limón, Inscription No. 110409) in the canton of Talamanca, district of Sixaola. Property 1 covers an area of 12.24 hectares and Property 2 covers an area of 3.18 hectares. The red boundaries on the inset map highlight the properties, while the surrounding area of Limón Province is outlined in black. The basemap was created using CartoDB Positron and shows the properties’ proximity to the Gandoca-Manzanillo Wildlife Refuge, an important environmental conservation zone in Costa Rica.
2.3. Data Collection
Satellite imagery was obtained from two sources:
- •
- Sentinel-2: Data was collected for January and August 2024, offering multi-spectral imagery with resolutions between 10 to 60 meters, depending on the spectral band (Drusch et al., 2012; Main-Knorn et al., 2017).
- ○
- Key spectral bands: B4 (Red) for chlorophyll absorption, B8 (Near-Infrared - NIR) for vegetation structure, B3 (Green) for assessing vegetation health, and B11 (SWIR) for detecting soil moisture.
- •
- Planet NICFI: High-resolution imagery was also collected for January and August 2024, offering 3-meter resolution, suitable for detecting fine-scale vegetation changes (Korhonen et al., 2017).
All data were accessed through Google Earth Engine (GEE), a platform facilitating large-scale environmental data processing (Gorelick et al., 2017).
Pre-processing steps were applied to both datasets to ensure data quality and consistency:
- Cloud masking was performed for Sentinel-2 using the QA60 band to remove clouds and shadows, a common practice in tropical forest monitoring (Zhu & Woodcock, 2012).
- Planet NICFI's cloud-free basemaps did not require additional masking, improving the reliability of vegetation assessments (Korhonen et al., 2017).
- Both datasets were re-projected to the WGS 84 coordinate system (EPSG:4326) to ensure spatial consistency and then clipped to the Area of Interest (AOI) corresponding to the two properties. This step reduced processing time and improved the accuracy of the vegetation indices calculations (Hijmans et al., 2005).
2.4. Variables
- Dependent Variables: Vegetation health, forest cover, and CO₂ absorption, represented by vegetation indices such as NDVI, EVI, GNDVI, SAVI, and NDFI.
- Independent Variables: Time periods (January and August 2024) and spatial resolution (Sentinel-2 at 10-60 meters vs. Planet NICFI at 3 meters).
- Control Variables: Cloud cover, atmospheric conditions, and soil brightness, which were controlled through pre-processing steps such as cloud masking and the use of the SAVI index (Huete, 1988).
2.5. Data Analysis
To assess changes in forest cover and vegetation health, the following vegetation indices were calculated using Python libraries (rasterio, geopandas, matplotlib) and processed through Google Earth Engine (GEE):
- NDVI (Normalized Difference Vegetation Index): Assesses vegetation conditions by comparing reflectance in the Red (RED) and Near-Infrared (NIR) spectral bands (Bhandari et al., 2012).
- EVI (Enhanced Vegetation Index): Corrects for atmospheric interference and soil background noise (Jiang et al., 2008).
- GNDVI (Green Normalized Difference Vegetation Index): Focuses on green reflectance to measure chlorophyll concentration (Gitelson et al., 1996).
- SAVI (Soil Adjusted Vegetation Index): Adjusts for soil brightness in low-vegetation areas (Huete, 1988).
- NDFI (Normalized Difference Forest Index): Monitors forest cover changes using Short-Wave Infrared (SWIR) and Near-Infrared (NIR) bands (Souza et al., 2005).
The finer resolution of Planet NICFI allowed for a more detailed analysis of small-scale changes in vegetation structure, while Sentinel-2 provided broader coverage at a lower resolution. These indices were used to quantify forest cover changes and CO₂ absorption capacity. Validation was carried out through ground-truthing and comparison with official deforestation statistics. By combining high-resolution and medium-resolution data, the study provides a comprehensive assessment of forest degradation and its impact on carbon sequestration.
2.6. Geospatial Analysis and Study Area Description
The Gandoca-Manzanillo Wildlife Refuge is the focus of this study due to its legal and environmental importance. The properties under investigation, Property 1 and Property 2, are located in the canton of Talamanca, district of Sixaola, covering a combined area of 15.44 hectares. These properties are situated in sensitive environmental zones, as governed by international treaties and national conservation laws.
The calculation of vegetation indices such as NDVI, EVI, GNDVI, SAVI, and NDFI was performed using multi-spectral satellite imagery from Sentinel-2 and Planet NICFI. These indices are widely used in environmental monitoring and land-use management to assess vegetation health, estimate biomass, and monitor land cover changes. The temporal span of the imagery from January to August 2024 captured temporal variations in vegetation across the study area. Data analysis was performed using Python and Google Earth Engine (GEE), which facilitates large-scale environmental data processing (Gorelick et al., 2017).
3. Vegetation Indices Calculation
To evaluate vegetation health and monitor changes over time, several vegetation indices were calculated using Python libraries, including rasterio, geopandas, and matplotlib, in conjunction with Google Earth Engine (GEE) for processing satellite data. A primary index utilized in this study is the Normalized Difference Vegetation Index (NDVI), which assesses vegetation conditions by comparing reflectance values in the Red (RED) and Near-Infrared (NIR) spectral bands. The NDVI is calculated as follows (Eq. 1):
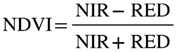
In this formula, NIR represents the reflectance in the Near-Infrared band, and RED refers to the reflectance in the red spectral band. Higher NDVI values (approaching 1) indicate dense, healthy vegetation, while lower values (approaching -1) suggest sparse or stressed vegetation. The NDVI was calculated for both Sentinel-2 and Planet NICFI imagery, with Planet NICFI offering a finer spatial resolution (3 meters), enabling more detailed assessments of vegetation health (Bhandari et al., 2012).
3.1. Enhanced Vegetation Index (EVI)
The Enhanced Vegetation Index (EVI) refines the NDVI by correcting for atmospheric interference and soil background noise. The EVI is calculated as follows (Eq. 2):
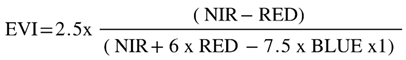
Here, NIR represents the Near-Infrared band, which provides critical information about vegetation structure and biomass. RED captures the reflectance in the red wavelength, which is primarily absorbed by healthy plant chlorophyll, while the BLUE band accounts for atmospheric disturbances. The EVI offers a more nuanced analysis of vegetation health by reducing noise from atmospheric and soil conditions, making it especially effective for dense forests. Both Sentinel-2 and Planet NICFI data were used to calculate EVI, with Planet NICFI's 3-meter resolution allowing for more detailed detection of vegetation dynamics (Jiang et al., 2008).
3.2. Green Normalized Difference Vegetation Index (GNDVI)
The Green Normalized Difference Vegetation Index (GNDVI) emphasizes green reflectance to provide a more accurate measurement of chlorophyll concentration in vegetation. The GNDVI is calculated using (Eq. 3):
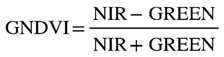
In this equation, NIR refers to the reflectance in the Near-Infrared band, while GREEN represents the reflectance in the green band. GNDVI is particularly effective in detecting water stress in plants, which makes it highly valuable for applications in agriculture and ecology. By comparing the data from Sentinel-2 and Planet NICFI, the analysis offered a more detailed view of vegetation health in the study area. The higher resolution of Planet NICFI imagery provided finer details on the condition of vegetation, offering greater insight into the dynamics of vegetation health (Gitelson et al., 1996).
3.3. Soil Adjusted Vegetation Index (SAVI)
The Soil Adjusted Vegetation Index (SAVI) adjusts for the influence of soil brightness in regions with low vegetation cover. The formula for SAVI is presented in (Eq. 4):
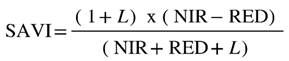
In this formula, NIR represents the reflectance in the Near-Infrared band, which is important for detecting vegetation structure and biomass, while RED captures the reflectance in the red wavelength band, which is absorbed by chlorophyll in healthy plants. The term L refers to the soil brightness correction factor, typically set to 0.5 in areas with intermediate vegetation cover. This factor helps reduce the impact of exposed soil on the overall vegetation index, making SAVI especially useful in areas with sparse vegetation, where the influence of soil might distort the index (Huete, 1988).
Both Sentinel-2 and Planet NICFI data were used to compute SAVI, and the 3-meter resolution of Planet NICFI provided more detailed insights into regions with lower vegetation cover, allowing for a more accurate assessment of vegetation conditions even in areas where soil effects might otherwise dominate.
3.4. Normalized Difference Forest Index (NDFI)
The Normalized Difference Forest Index (NDFI) is used to monitor changes in forest cover, focusing on the reflectance values from the Short-wave Infrared (SWIR) and Near-Infrared (NIR) bands. The formula for NDFI is presented in (Eq. 5):
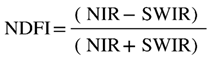
In this equation, NIR refers to the reflectance in the Near-Infrared band, which is sensitive to vegetation structure and health, while SWIR represents the reflectance in the Short-wave Infrared band, which is particularly useful for detecting moisture content in both vegetation and soil. NDFI serves as an important metric for tracking forest cover and identifying areas of deforestation or forest degradation, particularly in tropical and temperate regions where such changes can be rapid and difficult to detect.
By utilizing data from both Sentinel-2 and Planet NICFI, the study benefited from detailed temporal and spatial analysis of forest changes. Planet NICFI’s higher 3-meter resolution provided finer detail, allowing for the precise detection of subtle changes in forest cover over time, and enhancing the ability to monitor deforestation and forest degradation effectively (Souza et al., 2005).
3.5. Data Processing and Visualization
The computed vegetation indices were visualized and analyzed using Python libraries, including Matplotlib, Rasterio, and Cartopy. The following steps were taken:
- Raster Image Generation: Raster files were generated for each vegetation index for January and August 2024, enabling temporal comparisons of vegetation dynamics.
- Spatial Analysis: The total area of forested land was calculated using specific thresholds for vegetation indices (e.g., NDVI > 0.3 to classify forested areas). The forest area was calculated for both periods to identify potential forest loss.
- Visualization: Composite maps of the study area were created, comparing vegetation health using Sentinel-2 and Planet NICFI data. Insets were added to highlight specific zones of interest.
4. Forest Cover Analysis
Following the computation of the vegetation indices (NDVI, EVI, GNDVI, SAVI, and NDFI), the analysis focused on quantifying forest cover for both January and August 2024. This was accomplished by applying specific NDVI thresholds to the Sentinel-2 and Planet NICFI data, enabling the classification of densely forested areas.
4.1. NDVI Threshold Selection
Two distinct NDVI thresholds were applied:
- Sentinel-2 NDVI Threshold: A threshold of 0.3–0.4 was used to classify areas as forested, consistent with studies that monitor tropical deforestation (Othman et al., 2018).
- Planet NICFI NDVI Threshold: A higher threshold of 0.6–0.8 was applied, given Planet NICFI's finer spatial resolution of 3 meters. This higher threshold allows for more precise detection of dense, undisturbed tropical forests.
These thresholds were selected based on standard NDVI ranges for tropical forests and supported by findings from other studies.
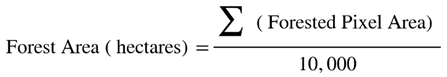
4.2. Forest Area Calculation
After applying the NDVI thresholds, areas covered by dense vegetation were quantified. The total forest area was computed using (Eq. 6):
The total forest area was computed using (Eq. 6):
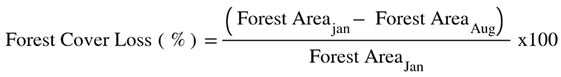
The forest cover change rate was calculated using (Eq. 7):
4.3. Zone-Based Analysis
To refine the analysis, the study area was divided into smaller zones to identify areas with the highest deforestation rates.
4.4. Validation and Accuracy Assessment
The forest cover change results were validated by:
- Ground Truthing using field visits or high-resolution imagery.
- Comparison with Official Deforestation Data related to forest loss in the region.
5. Change Detection and CO2 Loss Estimation
To assess changes in vegetation cover between January and August 2024, the Normalized Difference Vegetation Index (NDVI) was used. NDVI values were calculated for both periods, with changes in NDVI computed using (Eq. 8):
This formula measures the difference in NDVI values over time, with positive values indicating improvements in vegetation health, and negative values signaling a decline in vegetation cover or health (Myneni et al., 1995; Tucker, 1979).
5.1. Biomass and CO₂ Loss Estimation
To estimate biomass based on NDVI, the following relationship was used in Equation 9:
In this equation, a and b are constants derived from empirical studies that describe the linear relationship between NDVI and biomass. As NDVI increases, indicating healthier and denser vegetation, the biomass also increases. This formula is used to estimate the biomass per hectare (Myneni et al., 1995).
Next, the change in biomass between January and August 2024 was calculated using Equation 10:

This equation quantifies the reduction in biomass over time, reflecting the effects of deforestation or forest degradation in the study area.
After calculating the biomass loss, it was converted into CO₂ emissions using Equation 11:
In this formula:
- 0.47 represents the fraction of carbon in dry biomass,
- 44/12 is the molecular weight ratio of CO₂ to carbon.
This equation calculates the total CO₂ emissions resulting from the loss of vegetation, providing a critical metric for understanding the environmental impact of deforestation on carbon sequestration (Myneni et al., 1995).
Finally, the overall CO₂ loss across the entire study area (covering 15.44 hectares) was estimated using Equation 12:

This formula provided the total CO₂ loss in tons for the entire study area, offering insights into the forest's ability to sequester carbon and the extent of deforestation. By comparing results derived from both Sentinel-2 and Planet NICFI imagery, the analysis enabled a comparison of the resolution and accuracy of each dataset. This comparison highlighted how different resolutions affect the precision of the CO₂ loss estimates and the sensitivity of the datasets in detecting vegetation changes (Tucker, 1979; Myneni et al., 1995).
6. Results
The analysis of vegetation indices—NDVI, GNDVI, EVI, SAVI, and NDFI—was conducted for the Pacheco Finca using both Sentinel-2 and Planet NICFI imagery for two time periods: January 2024 and August 2024. By comparing the outputs from these two satellite sources, we gained a deeper understanding of the vegetation health, biomass, and forest coverage within the study area. The data from Google Earth Engine (GEE) was further processed to estimate forest loss and assess vegetation changes over time. Below is a breakdown of the results for each index, along with figures representing these changes, followed by an interpretation of the observed differences between the two time periods.
6.1. NDVI (Normalized Difference Vegetation Index)
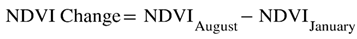
For NDVI, the Sentinel-2 imagery (Figure 2a,b) showed that in January 2024, NDVI values ranged from 0.17 to 0.54, which increased slightly to 0.20 to 0.56 in August 2024. This indicates a minimal improvement in vegetation health during this period. The relatively low upper bound suggests that the area may be dominated by secondary growth or disturbed vegetation. In contrast, the Planet NICFI data (Figure 2c,d) showed significantly higher NDVI values, ranging from 0.74 to 0.91 in January and 0.56 to 0.91 in August 2024, indicating denser vegetation cover. The slight decrease in the lower bound in August suggests minor seasonal changes or disturbances, but overall, the vegetation appears healthy.
Figure 2 illustrates these comparisons, with NDVI values mapped for each time period and satellite source. The scatter plots show the frequency distribution of NDVI values, allowing for a visual analysis of the concentration of vegetation density across different seasons.
Caption: This figure illustrates the Normalized Difference Vegetation Index (NDVI) for January and August 2024, derived from Sentinel-2 and Planet NICFI satellite data. The left-hand side maps represent NDVI values for different periods and satellite sources. Specifically, Map (a) shows the NDVI from Sentinel-2 for January 2024, which provides insight into early-year vegetation health, while Map (b) displays NDVI from Sentinel-2 for August 2024, reflecting seasonal changes during late summer. On the other hand, Map (c) and Map (d) highlight NDVI values from the Planet NICFI satellite, covering the same periods for January and August 2024, respectively, but with finer spatial resolution. The corresponding scatter plots on the right depict the frequency distribution of NDVI values, where clusters of higher density are represented by the color gradient, helping to visually analyze the concentration of NDVI values across different seasons and satellite data sources.
The NDVI analysis reveals that Planet NICFI consistently reports higher vegetation cover than Sentinel-2, likely due to its finer spatial resolution. Both satellite sources indicate slightly improved vegetation health from January to August 2024, although the differences in NDVI values suggest variability in the detection of biomass density and vegetation health. These findings highlight the potential of Planet NICFI for detecting denser vegetation, especially in areas with mixed or secondary growth.
6.2. GNDVI (Green Normalized Difference Vegetation Index)
The GNDVI analysis based on Sentinel-2 imagery for January 2024 showed values ranging from 0.09 to 0.46 (Figure 3a), with a slight increase to 0.12 to 0.47 in August 2024 (Figure 3b). This suggests that the chlorophyll content and photosynthetic activity remained relatively stable between the two periods, with only minimal seasonal changes observed. These values indicate moderate vegetation health, consistent with findings from the NDVI analysis. In comparison, the Planet NICFI data (Figure 3c,d) showed consistently higher GNDVI values, with a range of 0.61 to 0.83 in January and 0.58 to 0.83 in August 2024. These higher values reflect more robust chlorophyll activity and suggest healthier vegetation in the region, likely due to the finer spatial resolution of Planet NICFI imagery. The slight decrease in the lower bound in August, similar to the NDVI analysis, may reflect minor seasonal variability or disturbances.
Figure 3 visually compares the GNDVI values for both satellite sources and periods. The scatter plots show the distribution of GNDVI values, with brighter regions representing higher concentrations of healthy vegetation. This enables a clear comparison of chlorophyll activity and vegetation health over time.
Caption: This figure compares the Green Normalized Difference Vegetation Index (GNDVI) for January and August 2024, using data from the Sentinel-2 and Planet NICFI satellites. Map (a) illustrates GNDVI values for January 2024 based on Sentinel-2 data, offering an overview of early-year vegetation conditions. Map (b) shows GNDVI values from Sentinel-2 for August 2024, capturing vegetation growth during the mid-year period. Additionally, Map (c) and Map (d) present GNDVI values from the Planet NICFI satellite for January and August 2024, respectively, with enhanced detail due to higher-resolution imagery. The scatter plots on the right demonstrate the distribution of GNDVI values, where denser regions are indicated by brighter colors, allowing for a more detailed comparison of the index across different time points and satellite platforms.
The GNDVI results indicate that Planet NICFI consistently detects higher chlorophyll content and healthier vegetation compared to Sentinel-2. The minimal seasonal changes in both datasets suggest stability in vegetation health and photosynthetic activity from January to August 2024. These findings align with the NDVI analysis and emphasize the value of high-resolution imagery in detecting subtle variations in vegetation health.
6.3. EVI (Enhanced Vegetation Index)
The EVI data from Sentinel-2 (Figure 4a,b) exhibited significant variability, with values ranging from -25.34 to -0.42 in January 2024, and a more extreme shift to -405.52 to 65.25 in August 2024. These extreme negative values are likely the result of atmospheric interference or data errors, which may compromise the reliability of the Sentinel-2 EVI results for this period. Such variability suggests caution when interpreting Sentinel-2 EVI data in areas with complex terrain or atmospheric conditions. In contrast, the Planet NICFI data (Figure 4c,d) provided much more stable EVI values, ranging from 1.72 to 2.56 in January and 1.16 to 2.62 in August 2024. These values reflect healthy and dense vegetation, with only minor seasonal changes between the two periods. The stability and consistency of Planet NICFI's EVI data highlight the advantages of using higher-resolution satellite imagery, which is less prone to atmospheric distortion and better suited for tracking vegetation health in regions with complex landscapes.
Figure 4 visually compares EVI data for both Sentinel-2 and Planet NICFI across the two time periods. The scatter plots illustrate the frequency distribution of EVI values, with the color gradient indicating the concentration of values. This helps identify clusters of healthy vegetation and highlights the differences in data stability between the two satellite sources.
Caption: This figure presents the Enhanced Vegetation Index (EVI) for January and August 2024, sourced from both Sentinel-2 and Planet NICFI satellite data. Map (a) illustrates EVI values from Sentinel-2 for January 2024, providing insights into vegetation health at the start of the year. Map (b) follows with Sentinel-2 data for August 2024, highlighting changes in vegetation during the peak of the summer season. Meanwhile, Map (c) and Map (d) show Planet NICFI-derived EVI values for January and August 2024, offering a more detailed perspective due to the finer spatial resolution of the data. The right-hand side scatter plots display the frequency distribution of EVI values, where the concentration of data points is represented by the color intensity, helping to identify significant clusters of EVI values over time and across satellite sources.
The EVI analysis underscores the limitations of Sentinel-2 data due to extreme variability, potentially caused by atmospheric or sensor-related noise. In contrast, Planet NICFI's stable EVI readings provide a more reliable indication of healthy vegetation, emphasizing the utility of high-resolution imagery for accurate vegetation monitoring.
6.4. SAVI (Soil-Adjusted Vegetation Index)
The SAVI data from Sentinel-2 (Figure 5a,b) demonstrated relatively stable values, ranging from 0.25 to 0.81 in January 2024, with a slight increase to 0.31 to 0.84 in August 2024. These stable values suggest that Sentinel-2 detected little variation in soil conditions over the study period, and vegetation health appeared largely consistent with minor improvements during the summer months. However, the Planet NICFI data (Figure 5c,d) revealed higher SAVI values, ranging from 1.11 to 1.36 in January and 0.84 to 1.37 in August 2024. These values provide a more detailed view of the interaction between soil and vegetation, reflecting superior sensitivity to soil-vegetation dynamics. The slight decrease in the lower bound in August suggests some seasonal variability in soil moisture or vegetation density. The high-resolution imagery from Planet NICFI allows for a more nuanced understanding of soil-vegetation interactions, potentially capturing variations that Sentinel-2 could not detect.
Figure 5 provides a comparative analysis of SAVI values for both satellite sources across the two time periods. The scatter plots to the right illustrate the distribution of SAVI values, with brighter colors indicating areas of higher soil-vegetation interaction density, enabling a detailed comparison of soil effects on vegetation across seasons and satellite datasets.
Caption: This figure compares the Soil Adjusted Vegetation Index (SAVI) for January and August 2024, using data from the Sentinel-2 and Planet NICFI satellites. Map (a) shows the SAVI values derived from Sentinel-2 for January 2024, providing an assessment of early-year vegetation while considering soil brightness. Map (b) displays Sentinel-2 SAVI values for August 2024, reflecting vegetation conditions during late summer with soil effects taken into account. Additionally, Map (c) and Map (d) present Planet NICFI SAVI values for January and August 2024, respectively, offering higher spatial resolution to more accurately assess the vegetation concerning the soil. The scatter plots on the right visualize the distribution of SAVI values, with denser areas highlighted by brighter colors, offering a deeper understanding of the vegetation-soil relationship across different times of the year and satellite platforms.
The SAVI analysis reveals that Planet NICFI detects stronger soil-vegetation interactions than Sentinel-2, thanks to its finer spatial resolution. While both satellites showed relatively stable SAVI values, Planet NICFI's data offers a more detailed assessment of soil conditions and their impact on vegetation health over time, making it a valuable tool for monitoring regions with significant soil-vegetation dynamics.
6.5. NDFI (Normalized Difference Forest Index)
The NDFI analysis using Sentinel-2 data (Figure 6a,b) indicated a slight decline in forest density between the two periods. In January 2024, NDFI values ranged from 0.00 to 0.37, while in August 2024, the values slightly decreased from -0.06 to 0.34, suggesting minor disturbances in forest density over the study period. These fluctuations may reflect seasonal variations in canopy cover or small-scale disturbances in forested areas, but no significant deforestation was detected.In contrast, the Planet NICFI data (Figure 6c,d) showed consistently higher NDFI values, ranging from 0.74 to 0.91 in January, and decreasing slightly to 0.56 to 0.91 in August 2024. These higher values indicate a denser and more stable forest structure, with only minor reductions in August, likely due to seasonal changes rather than forest loss. The Planet NICFI's finer spatial resolution allows for better detection of forest density and structure, providing a clearer and more detailed picture of the forest canopy over time.
Figure 6 offers a visual comparison of NDFI values for both satellite sources across January and August 2024. The scatter plots display the frequency distribution of NDFI values, highlighting the concentration of higher values and giving insights into the density and stability of forest cover. The color gradient in the plots helps to visualize the seasonal variation and differences in forest density across the two satellite platforms.
Caption: This figure compares the Normalized Difference Fraction Index (NDFI) for January and August 2024, using data from Sentinel-2 and Planet NICFI satellites. Map (a) represents NDFI values from Sentinel-2 for January 2024, focusing on early-year vegetation fraction. Map (b) depicts NDFI values for August 2024 from Sentinel-2, reflecting how the vegetation fraction evolves throughout the growing season. Additionally, Map (c) and Map (d) showcase Planet NICFI-derived NDFI values for January and August 2024, respectively, with the added benefit of finer spatial resolution to capture more detailed vegetation patterns. The scatter plots on the right visualize the distribution of NDFI values, where denser regions of data points are highlighted by the color gradient, providing a comprehensive overview of the seasonal variation in vegetation fraction across different satellite data sources.
The NDFI results show that Planet NICFI consistently reports higher forest density compared to Sentinel-2, with only minor seasonal reductions observed in August. The stable forest structure detected by Planet NICFI underscores its ability to accurately capture dense forest canopy, while the fluctuations in Sentinel-2 data may suggest greater sensitivity to seasonal changes or atmospheric noise.
6.6. Quantitative Analysis of Vegetation Indices
A quantitative analysis of the vegetation indices—NDVI, GNDVI, EVI, SAVI, and NDFI—was conducted using both Sentinel-2 and Planet NICFI data for January 2024 and August 2024, providing insights into vegetation health and seasonal dynamics across the study area. The computed statistics highlight differences in vegetation cover between the two datasets and across time.
The NDVI values from Sentinel-2 indicated minor seasonal improvements, with a slight increase from 0.14–0.55 in January (mean: 0.44) to 0.16–0.56 in August (mean: 0.45), reflecting stable vegetation health. However, Planet NICFI recorded significantly higher NDVI values throughout, ranging from 0.74–0.91 in January (mean: 0.87) and from 0.57–0.92 in August (mean: 0.84), indicating denser vegetation cover with only minor seasonal variations. A similar pattern was observed with GNDVI, where Sentinel-2 values ranged from 0.07–0.47 in January (mean: 0.36) to 0.09–0.47 in August (mean: 0.38). In contrast, Planet NICFI exhibited higher GNDVI values, from 0.62–0.84 in January (mean: 0.78) and from 0.58–0.83 in August (mean: 0.76), indicating healthier and more robust vegetation overall.
EVI data from Sentinel-2 displayed considerable variability, with extreme values likely influenced by atmospheric noise or data errors, ranging from -25.34 to -0.34 in January and -405.53 to 65.25 in August, raising concerns about data reliability. By contrast, Planet NICFI showed stable EVI values, ranging from 1.65–2.58 in January (mean: 2.29) and from 1.16–2.62 in August (mean: 2.17), suggesting consistently healthy vegetation with minor seasonal fluctuations. For SAVI, Sentinel-2 values remained relatively stable, ranging from 0.22–0.82 in January (mean: 0.66) to 0.24–0.85 in August (mean: 0.68). Meanwhile, Planet NICFI data revealed higher SAVI values, from 1.10–1.37 in January (mean: 1.31) to 0.85–1.37 in August (mean: 1.26), highlighting the superior sensitivity of Planet NICFI to soil-vegetation interactions. Lastly, NDFI values from Sentinel-2 reflected minor disturbances in forest density, decreasing slightly from 0.00–0.38 in January (mean: 0.24) to -0.06–0.34 in August (mean: 0.21). Planet NICFI, however, demonstrated a denser and more stable forest structure, with NDFI values consistently ranging from 0.74–0.91 in January (mean: 0.87) to 0.57–0.92 in August (mean: 0.84), indicating that the higher resolution data captures finer forest details.
Figure 7 shows heatmaps visualizing the minimum, maximum, mean, median, and standard deviation values for the five vegetation indices across both Sentinel-2 and Planet NICFI datasets for January and August 2024. The color intensity highlights the range of values for each statistic, facilitating a comparison of vegetation health across seasons and satellite platforms, and demonstrating the seasonal and spatial variation in vegetation cover.
Caption: The heatmaps display the minimum, maximum, mean, median, and standard deviation values for five vegetation indices: (a) NDVI (Normalized Difference Vegetation Index), (b) GNDVI (Green Normalized Difference Vegetation Index), (c) EVI (Enhanced Vegetation Index), (d) SAVI (Soil Adjusted Vegetation Index), and (e) NDFI (Normalized Difference Forest Index). Each row represents the corresponding statistics for Sentinel-2 and Planet NICFI satellite data for January and August 2024. The color intensity reflects the range of values for each statistic, with darker shades indicating lower values and lighter shades indicating higher values. This visualization facilitates the comparison of vegetation health metrics over time and between the two datasets, demonstrating the seasonal and spatial variation in vegetation cover.
The quantitative analysis reveals that Planet NICFI consistently detects denser vegetation and provides more stable data across indices than Sentinel-2, particularly for NDVI, GNDVI, and NDFI. While Sentinel-2 captures seasonal fluctuations, Planet NICFI offers greater sensitivity to vegetation structure and soil-vegetation interactions, making it a more reliable tool for monitoring forest health and biomass density over time.
7. Forest Cover and Vegetation Change Analysis
The analysis of forest cover change between January 2024 and August 2024 was conducted using both Sentinel-2 and Planet NICFI satellite imagery. These datasets provided insights into vegetation health and forest cover dynamics through various vegetation indices such as NDVI, GNDVI, EVI, SAVI, and NDFI. By comparing the outputs of both satellite platforms over this period, we quantified vegetation changes, assessed forest cover dynamics, and evaluated any potential forest loss.
Figure 8 presents the NDVI maps for both January 2024 and August 2024 using Sentinel-2 and Planet NICFI imagery. Subfigure (a) shows the NDVI from Sentinel-2 for January 2024, while (b) represents the NDVI for August 2024. Similarly, (c) displays NDVI from Planet NICFI for January 2024, and (d) for August 2024. These maps visually depict subtle shifts in vegetation density over time. From Sentinel-2 imagery, NDVI values in January 2024 ranged from 0.17 to 0.54 (Figure 8a), increasing slightly to 0.20 to 0.56 by August 2024 (Figure 8b). Despite this small improvement in NDVI values, the overall forest area remained relatively stable, with only a 0.20% reduction in forest cover observed, which suggests minimal disturbance in the forested areas. In contrast, Planet NICFI imagery, with its higher resolution, provided a more detailed depiction of forest cover changes.
The NDVI values in January 2024 ranged from 0.74 to 0.91, indicating predominantly dense and healthy vegetation, which likely corresponds to forest cover. By August 2024, the NDVI values decreased slightly to a range of 0.56 to 0.92, suggesting potential disturbances, such as localized degradation, or seasonal changes in vegetation health. Using high-resolution Planet NICFI data, the forest area was estimated to have decreased slightly from 15.44 hectares in January to 15.38 hectares in August, reflecting a 0.41% loss in forest cover. While this reduction is minimal, the finer spatial resolution of Planet NICFI allowed for the detection of subtle changes in forest density and small-scale disturbances. Despite this, the data indicate that forest cover remained the predominant land type in the area, with the minor degradation suggesting potential localized impacts, consistent with the reported disturbances in the region.
Although both satellite platforms indicated a small forest cover loss, the higher resolution of Planet NICFI provided a more precise quantification of the change. Planet NICFI’s ability to detect fine-scale changes, such as localized vegetation disturbances, complements the broader coverage provided by Sentinel-2, underscoring its utility in monitoring forest cover dynamics more accurately. Overall, the observed forest cover loss between January and August 2024 was minor, with no significant deforestation detected in the study area.
The differences between Sentinel-2 and Planet NICFI emphasize the importance of using high-resolution imagery to monitor subtle vegetation changes. While both datasets indicated minimal reductions in forest cover, the Planet NICFI data revealed a more pronounced loss, suggesting its superior sensitivity to fine-scale vegetation changes.
Caption: The comparison of CO2 loss from Planet NICFI and Sentinel-2 satellite imagery for January 2024 and August 2024 highlights changes in forest cover and carbon emissions over time. Subfigure (a) displays the CO2 loss from Planet NICFI for January 2024, while (b) shows the CO2 loss for Planet NICFI in August 2024. Similarly, (c) represents the CO2 loss from Sentinel-2 for January 2024, and (d) shows the CO2 loss for Sentinel-2 in August 2024.
The analysis of forest cover change between January and August 2024 using Sentinel-2 and Planet NICFI imagery revealed minimal forest loss and subtle shifts in vegetation health. Sentinel-2 indicated a slight improvement in NDVI values and a 0.20% forest cover loss, while Planet NICFI, with its higher resolution, detected more detailed changes, showing a 0.41% reduction in forest cover. Despite the differences in the observed forest loss between the two datasets, both platforms demonstrated that the changes were minor, with no significant deforestation during the study period. The results highlight the importance of high-resolution imagery, such as Planet NICFI, for capturing fine-scale vegetation disturbances and more accurately monitoring forest dynamics.
7.1. Forest Coverage and CO2 Change
The analysis of forest coverage and CO₂ absorption between January 2024 and August 2024 revealed contrasting results from the Sentinel-2 and Planet NICFI datasets. These datasets provided insights into the health and dynamics of the secondary forest in the study area.
Sentinel-2 data indicated that the forest area remained stable at 15.44 hectares in both January and August 2024, with no significant forest loss detected. However, Planet NICFI, with its higher spatial resolution, revealed more granular changes in forest coverage, highlighting potential localized disturbances or degradation that may not have been fully captured by Sentinel-2. These subtle changes were also reflected in the significant reduction in CO₂ absorption observed by Planet NICFI.
The CO2 absorption between January and August 2024 was calculated for both datasets, revealing notable differences:
- •
- Sentinel-2:
- ○
- January 2024: 180,231.88 tons
- ○
- August 2024: 186,211.33 tons
- ○
- CO2 change: +385.69 Mg/ha This positive change suggests that the forest gained CO2 absorption capacity, indicating an improvement in forest health.
- •
- Planet NICFI:
- ○
- January 2024: 3,984,470.82 tons
- ○
- August 2024: 3,820,917.83 tons
- ○
- CO2 change: -1,874.54 Mg/ha The negative change reflects a significant loss in CO2 absorption, indicating potential forest degradation.
Figure 9 illustrates the CO2 absorption and loss as detected by both Sentinel-2 and Planet NICFI for January 2024 and August 2024. The figure provides a visual comparison of CO2 dynamics, with subfigures (a) and (b) showing CO2 loss for Planet NICFI, and (c) and (d) showing CO2 loss for Sentinel-2 during the same periods. The color scale highlights the magnitude of CO2 loss, with higher values indicating greater emissions, helping to illustrate the seasonal variations and differences between the two datasets.
The results indicate that Sentinel-2 detected a net gain in CO2 absorption capacity, suggesting that the forest remained healthy or even improved over time. However, Planet NICFI identified a substantial loss in CO2 absorption, which could point to localized degradation that was undetectable by the lower resolution of Sentinel-2. These contrasting findings highlight the importance of using high-resolution data for detecting fine-scale changes in forest dynamics and vegetation health.
Caption: Comparison of CO2 absorption and loss in January and August 2024, as observed in Planet NICFI and Sentinel-2 datasets. Subfigures (a) and (b) display CO2 loss maps for Planet NICFI in January and August, respectively, while (c) and (d) show CO2 loss maps for Sentinel-2 during the same periods. The color scale indicates the magnitude of CO2 loss, with higher values representing greater emissions. These maps illustrate seasonal variations in CO2 dynamics between the two satellite datasets, providing insights into carbon emissions across different regions in 2024.
The analysis of forest coverage and CO2 absorption from Sentinel-2 and Planet NICFI datasets between January and August 2024 shows contrasting results. Sentinel-2 data suggested stable forest health, with a net gain in CO2 absorption capacity (+385.69 Mg/ha), while Planet NICFI detected a significant loss in CO2 absorption (-1,874.54 Mg/ha), indicating potential forest degradation. The differences underscore the importance of high-resolution satellite imagery like Planet NICFI in detecting localized forest changes that may not be captured by lower-resolution platforms such as Sentinel-2. Integrating both datasets provides a comprehensive view of forest dynamics and carbon sequestration, highlighting the need for accurate monitoring in ecologically sensitive areas.
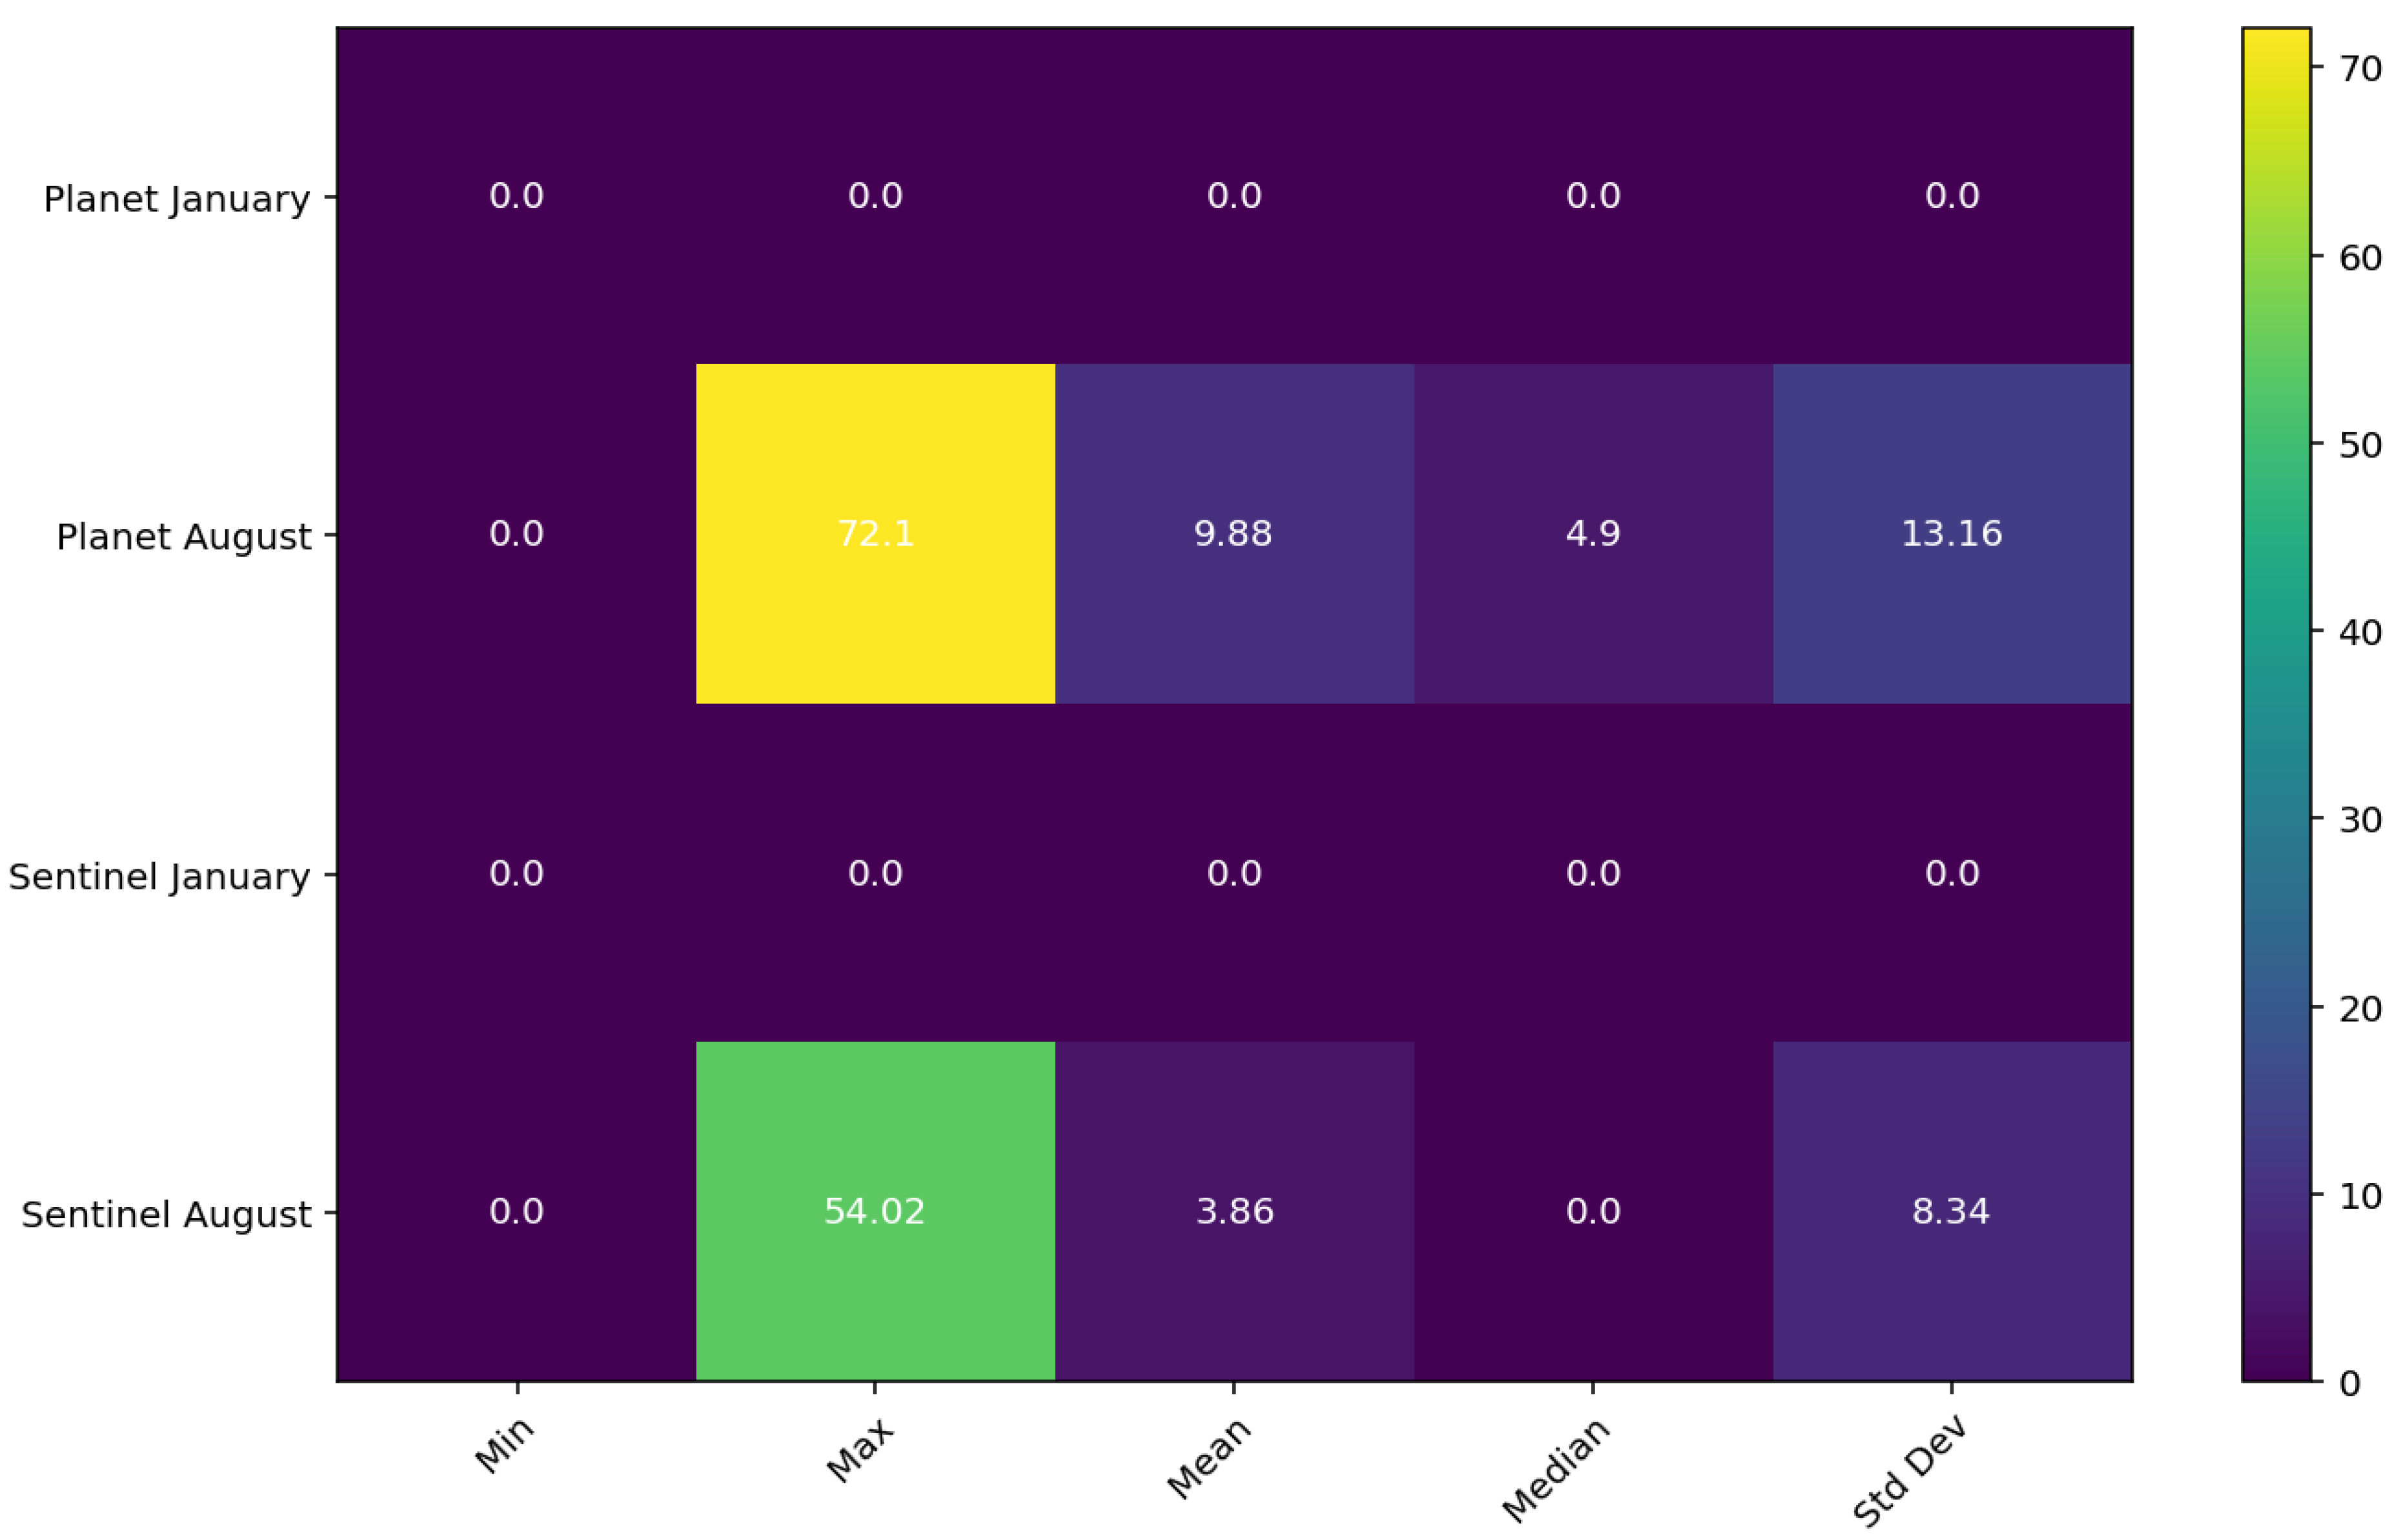
7.2. CO2 Loss Analysis: Sentinel-2 vs. Planet NICFI
The analysis of CO₂ loss between January and August 2024 using both Sentinel-2 and Planet NICFI datasets reveals significant differences in how these satellite platforms capture forest dynamics. The statistical findings, visualized in Figure 10, highlight the disparity in sensitivity between the datasets, especially in detecting variations in CO₂ absorption over the study period.
The Planet NICFI dataset, with its 3-meter resolution, identified more granular changes in CO₂ absorption. For example, the maximum recorded CO₂ loss in August 2024 reached 72.10 Mg/ha, significantly higher than the maximum recorded by Sentinel-2, which peaked at 54.02 Mg/ha. This suggests that Planet NICFI is better suited for detecting fine-scale disturbances, such as small-scale deforestation or degradation, that may be less visible to the coarser Sentinel-2 resolution.
The mean CO2 loss for Planet NICFI was also notably higher, averaging 9.88 Mg/ha compared to 3.86 Mg/ha for Sentinel-2 in August 2024. This discrepancy indicates that while both datasets detected CO2 absorption loss, Planet NICFI provided a clearer and more detailed picture of forest degradation. In contrast, Sentinel-2 captured broader trends, which may have smoothed out localized changes in forest health.
Further, the median CO2 loss highlighted a stark contrast between the two datasets. Planet NICFI reported a median CO2 loss of 4.90 Mg/ha in August 2024, while Sentinel-2 recorded 0.0 Mg/ha for the same period. The 0.0 Mg/ha median for Sentinel-2 suggests that, for much of the area, forest health remained stable or improved, with only localized regions showing notable CO2 loss. However, the Planet NICFI data indicates that forest degradation may have been more widespread, capturing subtle declines in CO2 absorption that Sentinel-2 did not detect.
The standard deviation of CO2 loss further supports this analysis. Planet NICFI recorded a higher standard deviation of 13.16 Mg/ha in August compared to 8.34 Mg/ha for Sentinel-2, indicating a more complex pattern of forest degradation. Some areas experienced significant loss, while others remained relatively unaffected. The Sentinel-2 data, with its lower variability, suggests a more uniform trend in forest health, potentially missing some of the finer-scale disturbances captured by Planet NICFI.
Caption: The heatmap displays the minimum, maximum, mean, median, and standard deviation of CO2 loss for both datasets in January and August 2024. The color intensity indicates the variation in CO2 loss, with Planet NICFI data showing significantly higher maximum and mean CO2 loss in August compared to Sentinel-2. Planet NICFI also records a higher standard deviation, suggesting greater variability in CO2 loss, especially in August.
Sentinel-2 and Planet NICFI detected CO2 loss over the study period, the Planet NICFI dataset provides a more detailed and nuanced understanding of the extent and distribution of forest degradation. Planet NICFI's higher resolution allows for the identification of localized disturbances that may not be visible in coarser datasets like Sentinel-2. This analysis highlights the importance of using multiple data sources with varying resolutions to accurately monitor forest dynamics, particularly in areas of secondary forest undergoing subtle changes.
8. Discussion
The application of satellite-based remote sensing and advanced machine learning techniques has proven crucial for monitoring deforestation and assessing vegetation health, particularly in sensitive areas like the Gandoca-Manzanillo Wildlife Refuge. This study utilized high-resolution imagery from Planet NICFI and Sentinel-2 to detect significant changes in forest cover between January and August 2024. These findings align with other studies in tropical regions that have demonstrated the effectiveness of using satellite-based indices like NDVI, GNDVI, and EVI to identify forest degradation. The evidence of forest degradation on the properties investigated mirrors reports of illegal logging activities, further underscoring the value of remote sensing for ecological monitoring and legal enforcement.
The results of this study align with those of Suwanprasit and Shahnawaz (2024), who utilized Sentinel-2 imagery in combination with Object-Based Image Analysis (OBIA) to map fire-affected regions in Thailand. Their research demonstrated that OBIA enhances land cover classification by significantly reducing noise and improving the detection of small-scale land use changes. Such techniques could be highly beneficial for improving the monitoring of forest degradation in Costa Rica. Similarly, the work of Fernandes et al. (2024) on monitoring tropical pastures with Sentinel-2 and machine learning emphasizes how integrating satellite data with meteorological inputs improves the accuracy of vegetation assessments. Employing machine learning algorithms for more precise vegetation health analysis could further enhance monitoring efforts in forested landscapes such as Gandoca-Manzanillo.
The broader implications of these findings extend to global forest monitoring efforts. Melo et al. (2023) emphasized the underutilization of Earth observation (EO) products in national greenhouse gas (GHG) inventories submitted to the UNFCCC, suggesting that high-resolution satellite data like Planet NICFI could enhance forest cover assessments and carbon stock estimates. This aligns with Brumberg et al. (2024), who showed how increasing forest cover and connectivity through policies like Costa Rica's Payment for Ecosystem Services (PES) significantly impacts conservation outcomes. Addressing these gaps in the integration of EO products could improve the reporting accuracy and effectiveness of Costa Rica's conservation policies.
Further, Wang et al. (2023) demonstrated the underestimation of deforestation caused by agricultural expansion, particularly rubber plantations in Southeast Asia, which highlights the need for robust monitoring systems. This reinforces the potential of high-resolution satellite data to track deforestation more accurately and align local efforts with global conservation policies. The hierarchical approach for forest carbon stock estimation discussed by Illarionova et al. (2024), which integrates multiple forest characteristics into machine learning models, mirrors this study’s emphasis on integrating remote sensing techniques for more accurate carbon sequestration estimates.
One limitation of this study is the short temporal scope, covering only two periods in 2024. Extending the timeframe would provide a more comprehensive understanding of deforestation drivers and long-term impacts. Future research could benefit from machine learning techniques demonstrated by Illarionova et al. (2024) and Smolina et al. (2023) to improve predictive accuracy in detecting forest structure changes and carbon stock variations. Ground-truth validation and in situ measurements would further support the accuracy of satellite-based estimates.
Finally, expanding the use of Earth observation technologies in environmental reporting could enhance transparency and reliability in deforestation monitoring, especially when reported to global bodies like the UNFCCC. As Melo et al. (2023) highlighted, the limited use of EO products in biomass and fire mapping presents an opportunity for improvement. Addressing these gaps would significantly enhance Costa Rica's conservation efforts, particularly in maintaining accurate forest monitoring for the success of the PES program.
9. Conclusion
This study provides a comprehensive analysis of forest degradation and carbon sequestration in the Gandoca-Manzanillo Wildlife Refuge, Costa Rica, by leveraging high-resolution satellite imagery from Planet NICFI and Sentinel-2. By applying advanced vegetation indices such as NDVI, GNDVI, EVI, and SAVI, this research offered precise assessments of vegetation health and forest cover during two critical periods in 2024. The key findings indicate a 0.41% loss in forest area as detected by Planet NICFI, which was more pronounced than that captured by Sentinel-2. Furthermore, while Sentinel-2 data suggested a modest increase in CO₂ absorption (from 180,231.88 tons to 186,211.33 tons), Planet NICFI detected a significant CO₂ loss (from 3,984,470.82 tons to 3,820,917.83 tons), highlighting the critical role of high-resolution imagery in detecting fine-scale disturbances in forest cover and carbon sequestration.
However, the study faced limitations in its temporal scope, being confined to two periods in 2024 (January and August), which may not fully capture long-term deforestation trends or seasonal variations in vegetation health and carbon absorption. Additionally, data constraints such as cloud cover and reliance on satellite-derived indices introduce uncertainties in forest cover and CO₂ estimations. Despite these challenges, the study emphasizes the importance of integrating multi-spectral satellite data with advanced vegetation indices to effectively track deforestation in protected areas. The findings expose critical weaknesses in governance frameworks, particularly in preventing illegal deforestation, even in areas benefiting from conservation initiatives like the Payment for Ecosystem Services (PES) program.
Future research should focus on expanding the temporal scope to include multi-year datasets for a more comprehensive understanding of long-term deforestation trends and carbon dynamics. Additionally, integrating ground-truth data with satellite observations could enhance the accuracy of vegetation assessments. Strengthening legal frameworks and improving remote sensing technologies are essential for the ongoing protection of high-biodiversity areas like Gandoca-Manzanillo, where accurate, high-resolution data is critical for monitoring and enforcement in the face of ongoing environmental challenges.
Author Contributions
Andrea Navarro Jimenez developed the research idea, designed the study, gathered and analyzed the data, and prepared the manuscript.
Funding Declaration
This study did not receive any particular funding from governmental, corporate, or charitable sources.
Data Availability Statement
All datasets underpinning the results presented in this research are openly accessible via the Mendeley Data repository. The dataset, titled "High-Resolution Satellite Monitoring of Forest Degradation and Carbon Sequestration in Costa Rica’s Gandoca-Manzanillo Wildlife Refuge," can be found at the following link: NAVARRO, ANDREA (2024), Mendeley Data, V1, doi: 10.17632/8528b5xyhd.1.
Ethics Statement
This study did not involve any research on human subjects, human data, human tissue, or animals. Therefore, no ethical approval was required.
Conflict of Interest Declaration
The author confirms that no conflicts of interest are associated with the publication of this manuscript.
Author's Note on AI Usage
The author used AI-assisted technology to improve the grammar and readability of the manuscript. The AI was applied under human oversight and did not contribute to the generation of scientific insights, conclusions, or recommendations. The final manuscript has been thoroughly reviewed and edited by the author, who is fully responsible for its content.
References
- Altamirano & Cambronero, 2024.Reporting on the controversy surrounding the SINAC permits and the modification of forest inventories.https://www.nacion.com/politica/regente-justifica-cambio-que-desaparecio-bosque-en/IKPUYTDF3ZH4BLS3ZDHFYRDEBY/story/.
- Baumbach, L., Hickler, T., Yousefpour, R., & Hanewinkel, M. (2023). High economic costs of reduced carbon sinks and declining biome stability in Central American forests. Nature Communications, 14, 2043. [CrossRef]
- Bhandari, S., Kumar, R., & Singh, R. (2012). Feature extraction using normalized difference vegetation index (NDVI): A case study of Jabalpur City. Procedia Technology, 6, 612-621. [CrossRef]
- Brumberg, H., Furey, S., Bouffard, M.G., Mata Quirós, M.J., Murayama, H., Neyestani, S., Pauline, E., Whitworth, A., & Madden, M. (2024). Increasing forest cover and connectivity both inside and outside of protected areas in southwestern Costa Rica. Remote Sensing, 16, 1088. [CrossRef]
- Cambronero, N., & Lara Salas, J. F. (2024, September 15). Imágenes satelitales muestran tamaño de tala en fincas de Pacheco Dent. La Nación. https://www.nacion.com/el-pais/politica/imagenes-satelitales-muestran-tamano-de-tala-en/ALIXTFSZZNHDTP37J4Z5XFLBS4/story/.
- Claes, J., Conway, M., Hansen, T., Henderson, K., Hopman, D., Katz, J., & Wilson, R. (2020). Valuing nature conservation: A methodology for quantifying the benefits of protecting the planet’s natural capital. McKinsey & Company. https://www.mckinsey.com/~/media/McKinsey/Business%20Functions/Sustainability/Our%20Insights/Valuing%20nature%20conservation/Valuing-nature-conservation.pdf.
- Cohen, W. B., & Goward, S. N. (2004). Landsat’s role in ecological applications of remote sensing. BioScience, 54(6), 535-545. [CrossRef]
- Drusch, M., Del Bello, U., Carlier, S., Colin, O., Fernandez, V., Gascon, F., & Bargellini, P. (2012). Sentinel-2: ESA's optical high-resolution mission for GMES operational services. Remote Sensing of Environment, 120, 25-36. [CrossRef]
- Fernandes, M. H. M. R., Fernandes, J. S., Adams, J. M., Lee, M., Reis, R. A., & Tedeschi, L. O. (2024). Using Sentinel-2 satellite images and machine learning algorithms to predict tropical pasture forage mass, crude protein, and fiber content. Scientific Reports, 14, 8704. [CrossRef]
- Gascon, F., Berger, M., Fernández, V., García, J., De Smet, H., & Bouzinac, C. (2017). Copernicus Sentinel-2 mission: Products, algorithms, and calibrations. Remote Sensing, 9(6), 1-23. [CrossRef]
- Gitelson, A. A., Kaufman, Y. J., & Merzlyak, M. N. (1996). Use of a green channel in remote sensing of global vegetation from EOS-MODIS. Remote Sensing of Environment, 58(3), 289-298. [CrossRef]
- Gorelick, N., Hancher, M., Dixon, M., Ilyushchenko, S., Thau, D., & Moore, R. (2017). Google Earth Engine: Planetary-scale geospatial analysis for everyone. Remote Sensing of Environment, 202, 18-27. [CrossRef]
- Hijmans, R. J., Cameron, S. E., Parra, J. L., Jones, P. G., & Jarvis, A. (2005). Very high-resolution interpolated climate surfaces for global land areas. International Journal of Climatology, 25(15), 1965-1978. [CrossRef]
- Hordijk, I., Poorter, L., Meave, J. A., Bongers, F., Van der Sande, M. T., López Mendoza, R. D., Romero, P. J., De Jong, J., & Martínez-Ramos, M. (2024). Land use history and landscape forest cover determine tropical forest recovery. Journal of Applied Ecology, 77(1), 1-17. [CrossRef]
- Huete, A. R. (1988). A soil-adjusted vegetation index (SAVI). Remote Sensing of Environment, 25(3), 295-309. [CrossRef]
- Illarionova, S., Tregubova, P., Shukhratov, I., Shadrin, D., Efimov, A., & Burnaev, E. (2024). Advancing forest carbon stocks’ mapping using a hierarchical approach with machine learning and satellite imagery. Scientific Reports, 14, 21032. [CrossRef]
- Jiang, Z., Huete, A. R., Didan, K., & Miura, T. (2008). Development of a two-band enhanced vegetation index without a blue band. Remote Sensing of Environment, 112(10), 3833-3845. [CrossRef]
- Korhonen, L., Hadi, H., Packalen, P., & Rautiainen, M. (2017). Comparison of Sentinel-2 and Landsat 8 in the estimation of boreal forest canopy cover and leaf area index. Remote Sensing of Environment, 195, 259-274. [CrossRef]
- Lu, D., Mausel, P., Brondizio, E., & Moran, E. (2004). Change detection techniques. International Journal of Remote Sensing, 25(12), 2365-2407. [CrossRef]
- Macera, L., Deslarzes, K., Crook, O.-J., Pioch, S., & Andrieu, J. (2024). Monitoring mangrove restoration projects in Senegal, Benin, Costa Rica, and Philippines using remote sensing. Dynamiques Environnementales, 53. [CrossRef]
- Madrigal, L. M. (2024, September 17). Fincas de Pacheco Dent y otras 133 en Gandoca-Manzanillo deben regresar al Estado, según Procuraduría. Delfino.cr. https://delfino.cr/2024/09/fincas-de-pacheco-dent-y-otras-133-en-gandoca-manzanillo-deben-regresar-al-estado-segun-procuraduria.
- Malhi, Y., & Daily, G. C. (2024). Bringing nature into decision-making. Philosophical Transactions of the Royal Society B, 379(20220313). [CrossRef]
- Melo, J., Baker, T., Nemitz, D., Quegan, S., & Ziv, G. (2023). Satellite-based global maps are rarely used in forest reference levels submitted to the UNFCCC. Environmental Research Letters, 18(034021). [CrossRef]
- Myneni, R. B., Hall, F. G., Sellers, P. J., & Marshak, A. L. (1995). The interpretation of spectral vegetation indexes. IEEE Transactions on Geoscience and Remote Sensing, 33(2), 481-486. [CrossRef]
- OECD. (2023). Global forests and land use. OECD Environmental Outlook 2023. [CrossRef]
- Othman, M. A., Ash’aari, Z. H., Aris, A. Z., & Ramli, M. F. (2018). Tropical deforestation monitoring using NDVI from MODIS satellite: A case study in Pahang, Malaysia. IOP Conference Series: Earth and Environmental Science, 169, 012047. [CrossRef]
- Pascual, U., Balvanera, P., Anderson, C. B., & Chaplin-Kramer, R. (2023). Diverse values of nature for sustainability. Nature, 620, 813–823. [CrossRef]
- Piaggio, M., Guzman, M., Pacay, E., Robalino, J., & Ricketts, T. (2024). Forest cover and dengue in Costa Rica: Panel data analysis of the effects of forest cover change on hospital admissions and outbreaks. Environmental and Resource Economics, 87(2), 2095-2114. [CrossRef]
- Sarmiento, E., Madrigal, L. M., & Pacheco, J. (2024). Payment for ecosystem services program in Costa Rica: An analysis of effectiveness and future directions. Environmental Economics Review, 32(1), 50-68.
- Smolina, A., Illarionova, S., Shadrin, D., Kedrov, A., & Burnaev, E. (2023). Forest age estimation in Northern Arkhangelsk region based on machine learning pipeline on Sentinel-2 and auxiliary data. Scientific Reports, 13, 22167. [CrossRef]
- Souza, C. M., Roberts, D. A., & Cochrane, M. A. (2005). Combining spectral and spatial information to map canopy damage from selective logging and forest fires. Remote Sensing of Environment, 98(2-3), 329-343. [CrossRef]
- Suwanprasit, C., & Shahnawaz. (2024). Mapping burned areas in Thailand using Sentinel-2 imagery and OBIA techniques. Scientific Reports, 14, 9609. [CrossRef]
- Tucker, C. J. (1979). Red and photographic infrared linear combinations for monitoring vegetation. Remote Sensing of Environment, 8(2), 127-150. [CrossRef]
- Wang, Y., Hollingsworth, P. M., Zhai, D., West, C. D., Green, J. M. H., Chen, H., & Ahrends, A. (2023). High-resolution maps show that rubber causes substantial deforestation. Nature, 623, 340-346. [CrossRef]
- Zhu, Z., & Woodcock, C. E. (2012). Object-based cloud and cloud shadow detection in Landsat imagery. Remote Sensing of Environment, 118, 83-94. [CrossRef]
Figure 2.
NDVI Comparison for January and August 2024 (Sentinel-2 and Planet NICFI).
Figure 3.
GNDVI Comparison for January and August 2024 (Sentinel-2 and Planet NICFI).
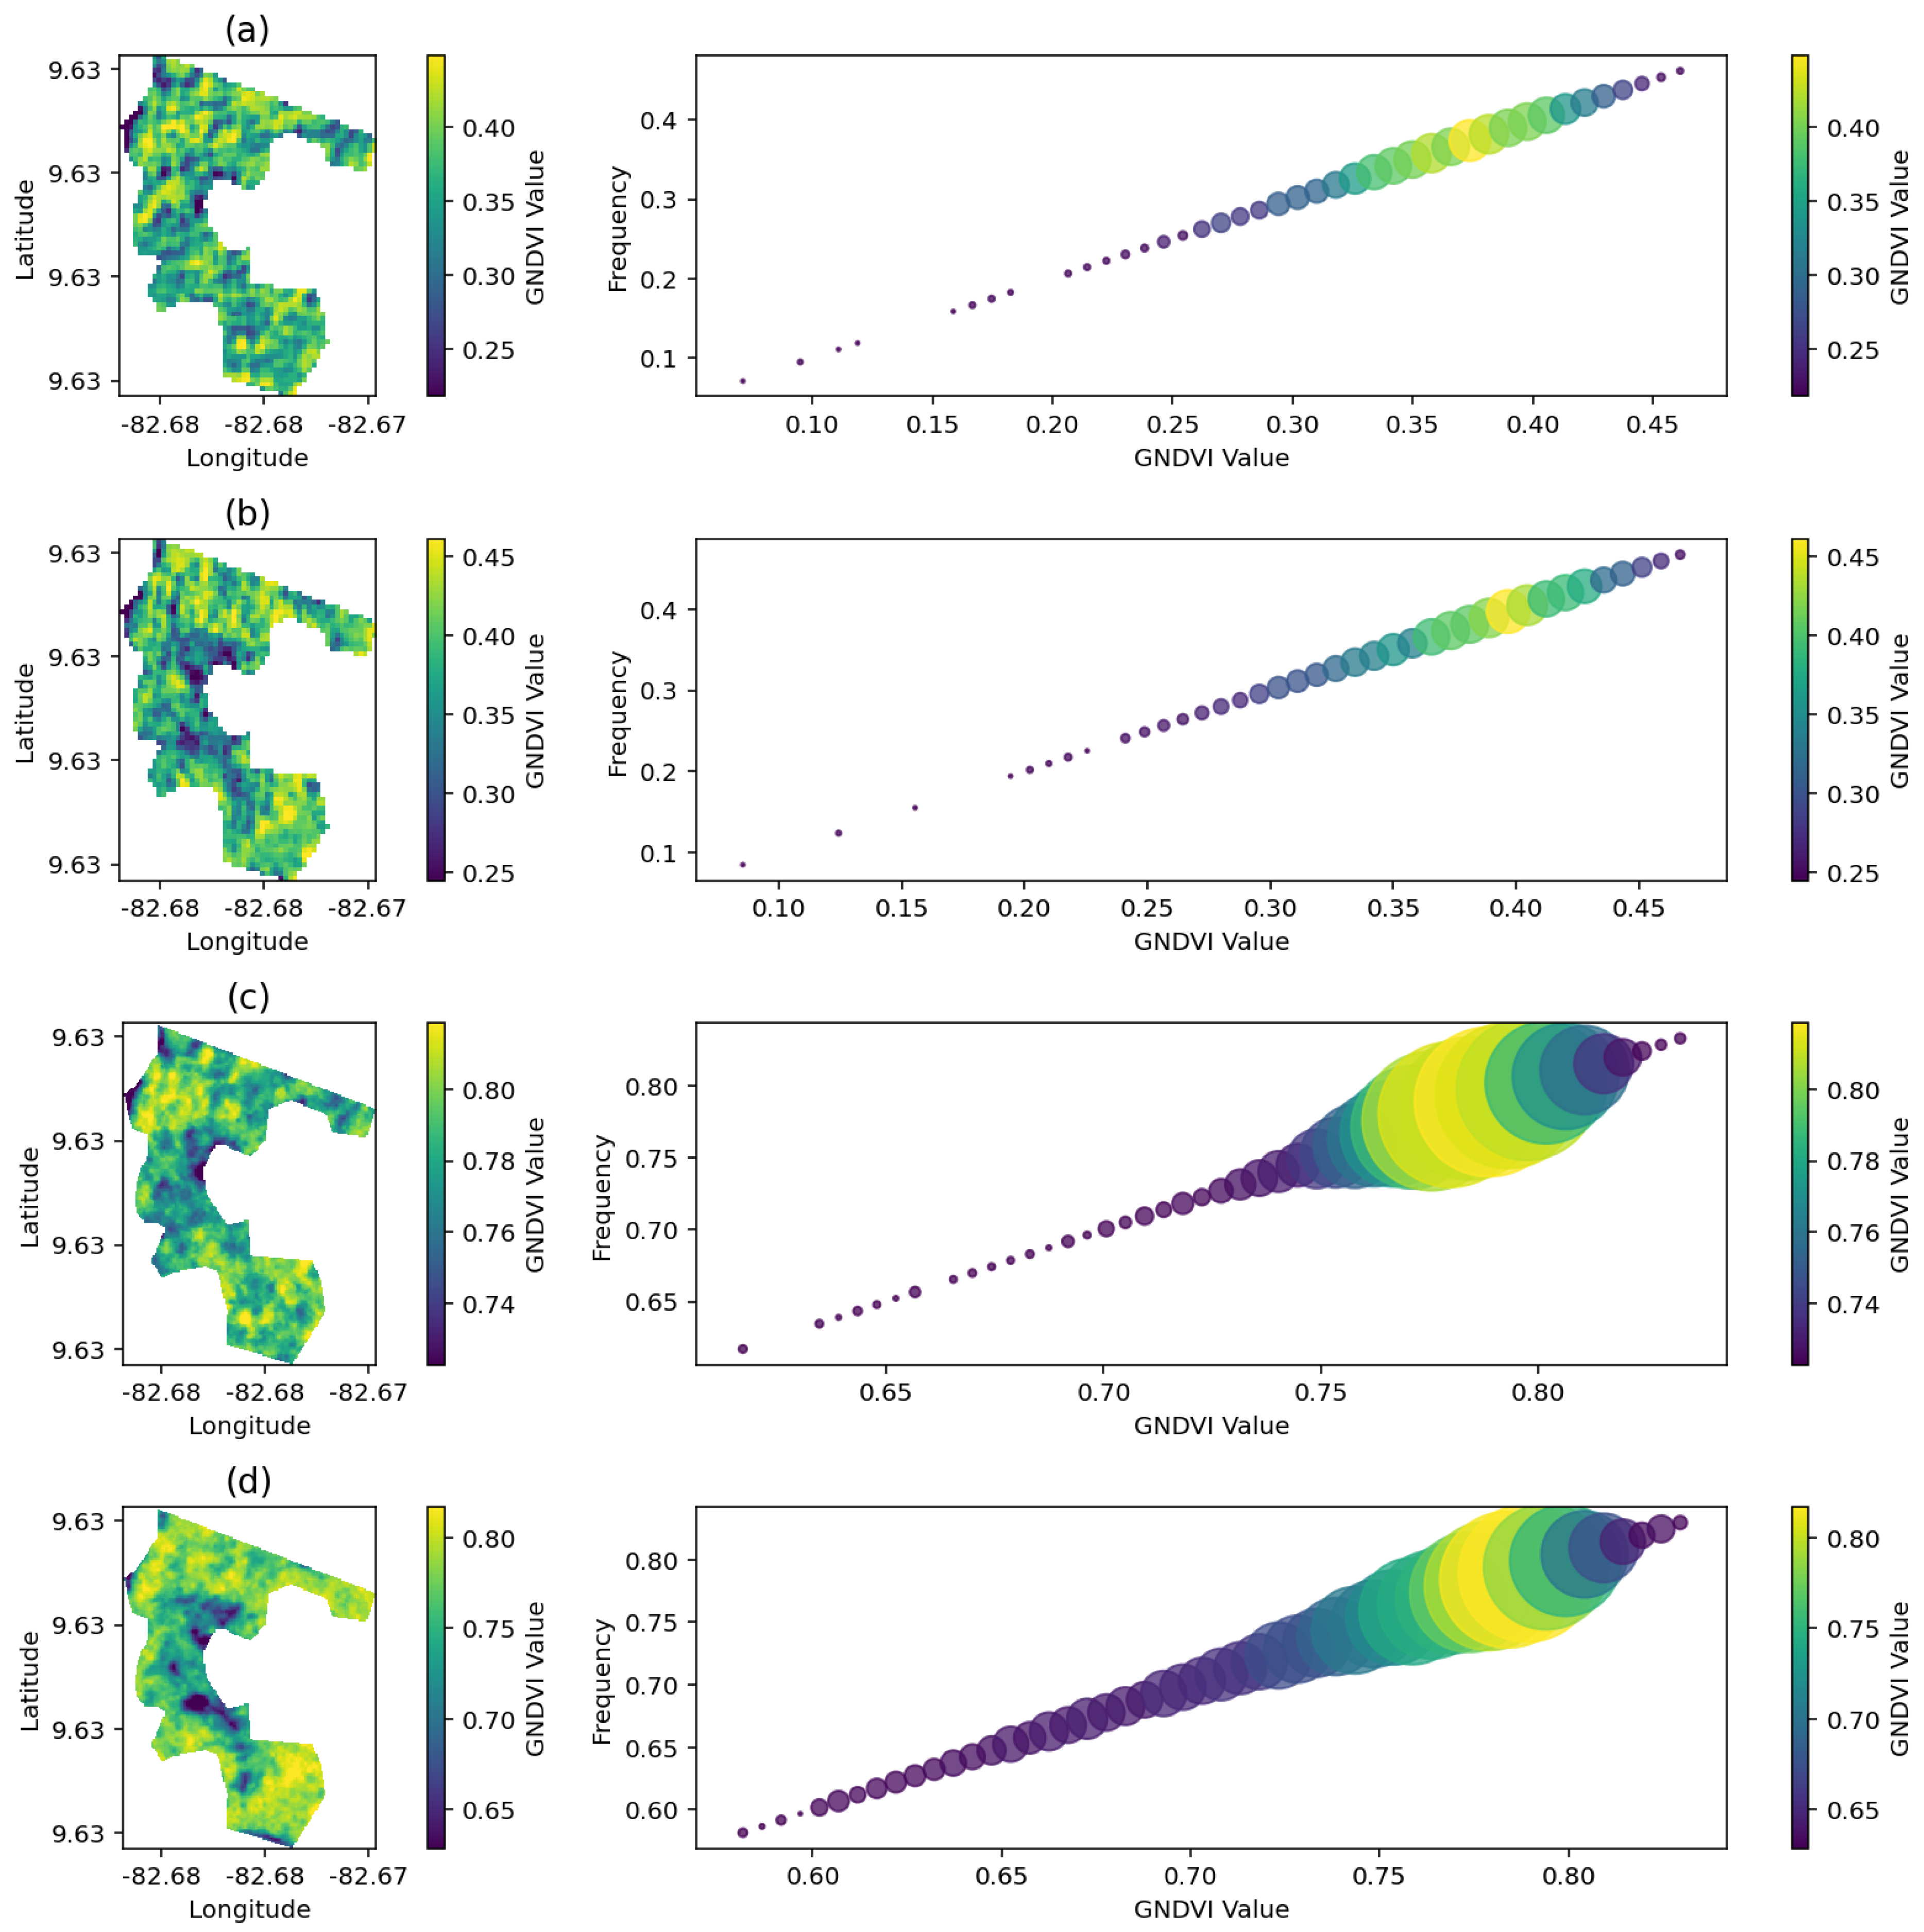
Figure 4.
EVI Comparison for January and August 2024 (Sentinel-2 and Planet NICFI).
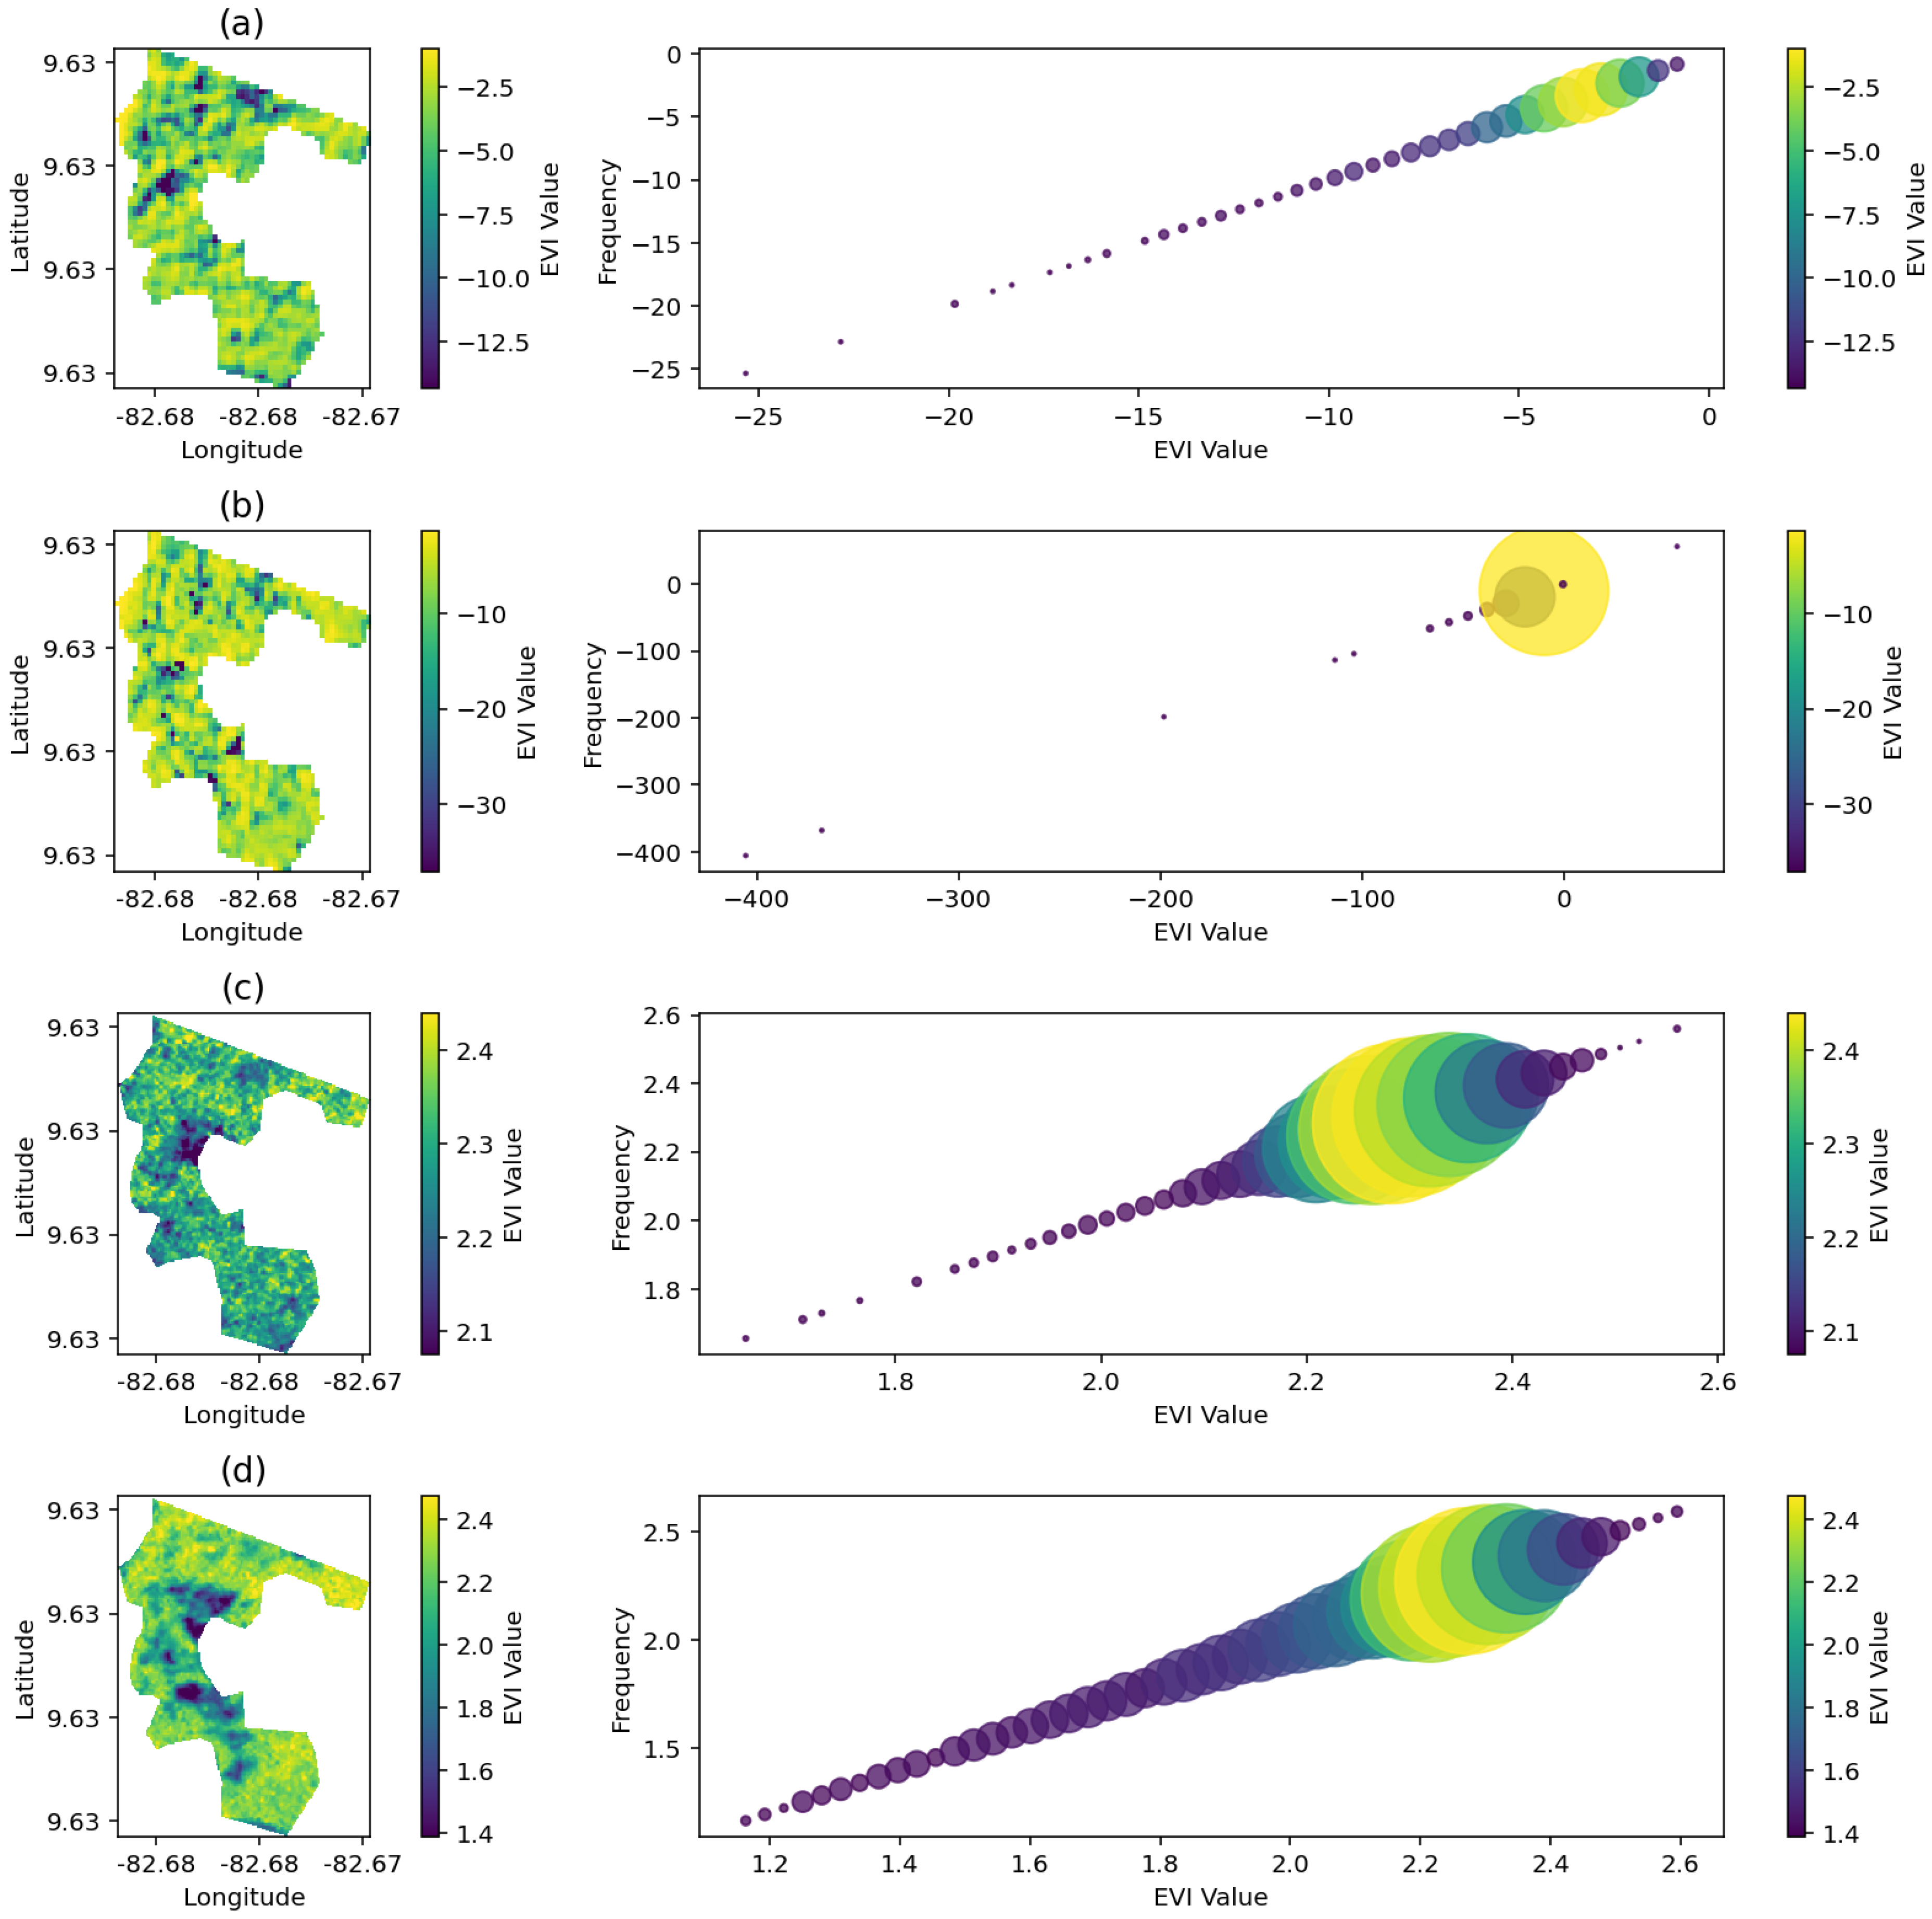
Figure 5.
SAVI Comparison for January and August 2024 (Sentinel-2 and Planet NICFI).
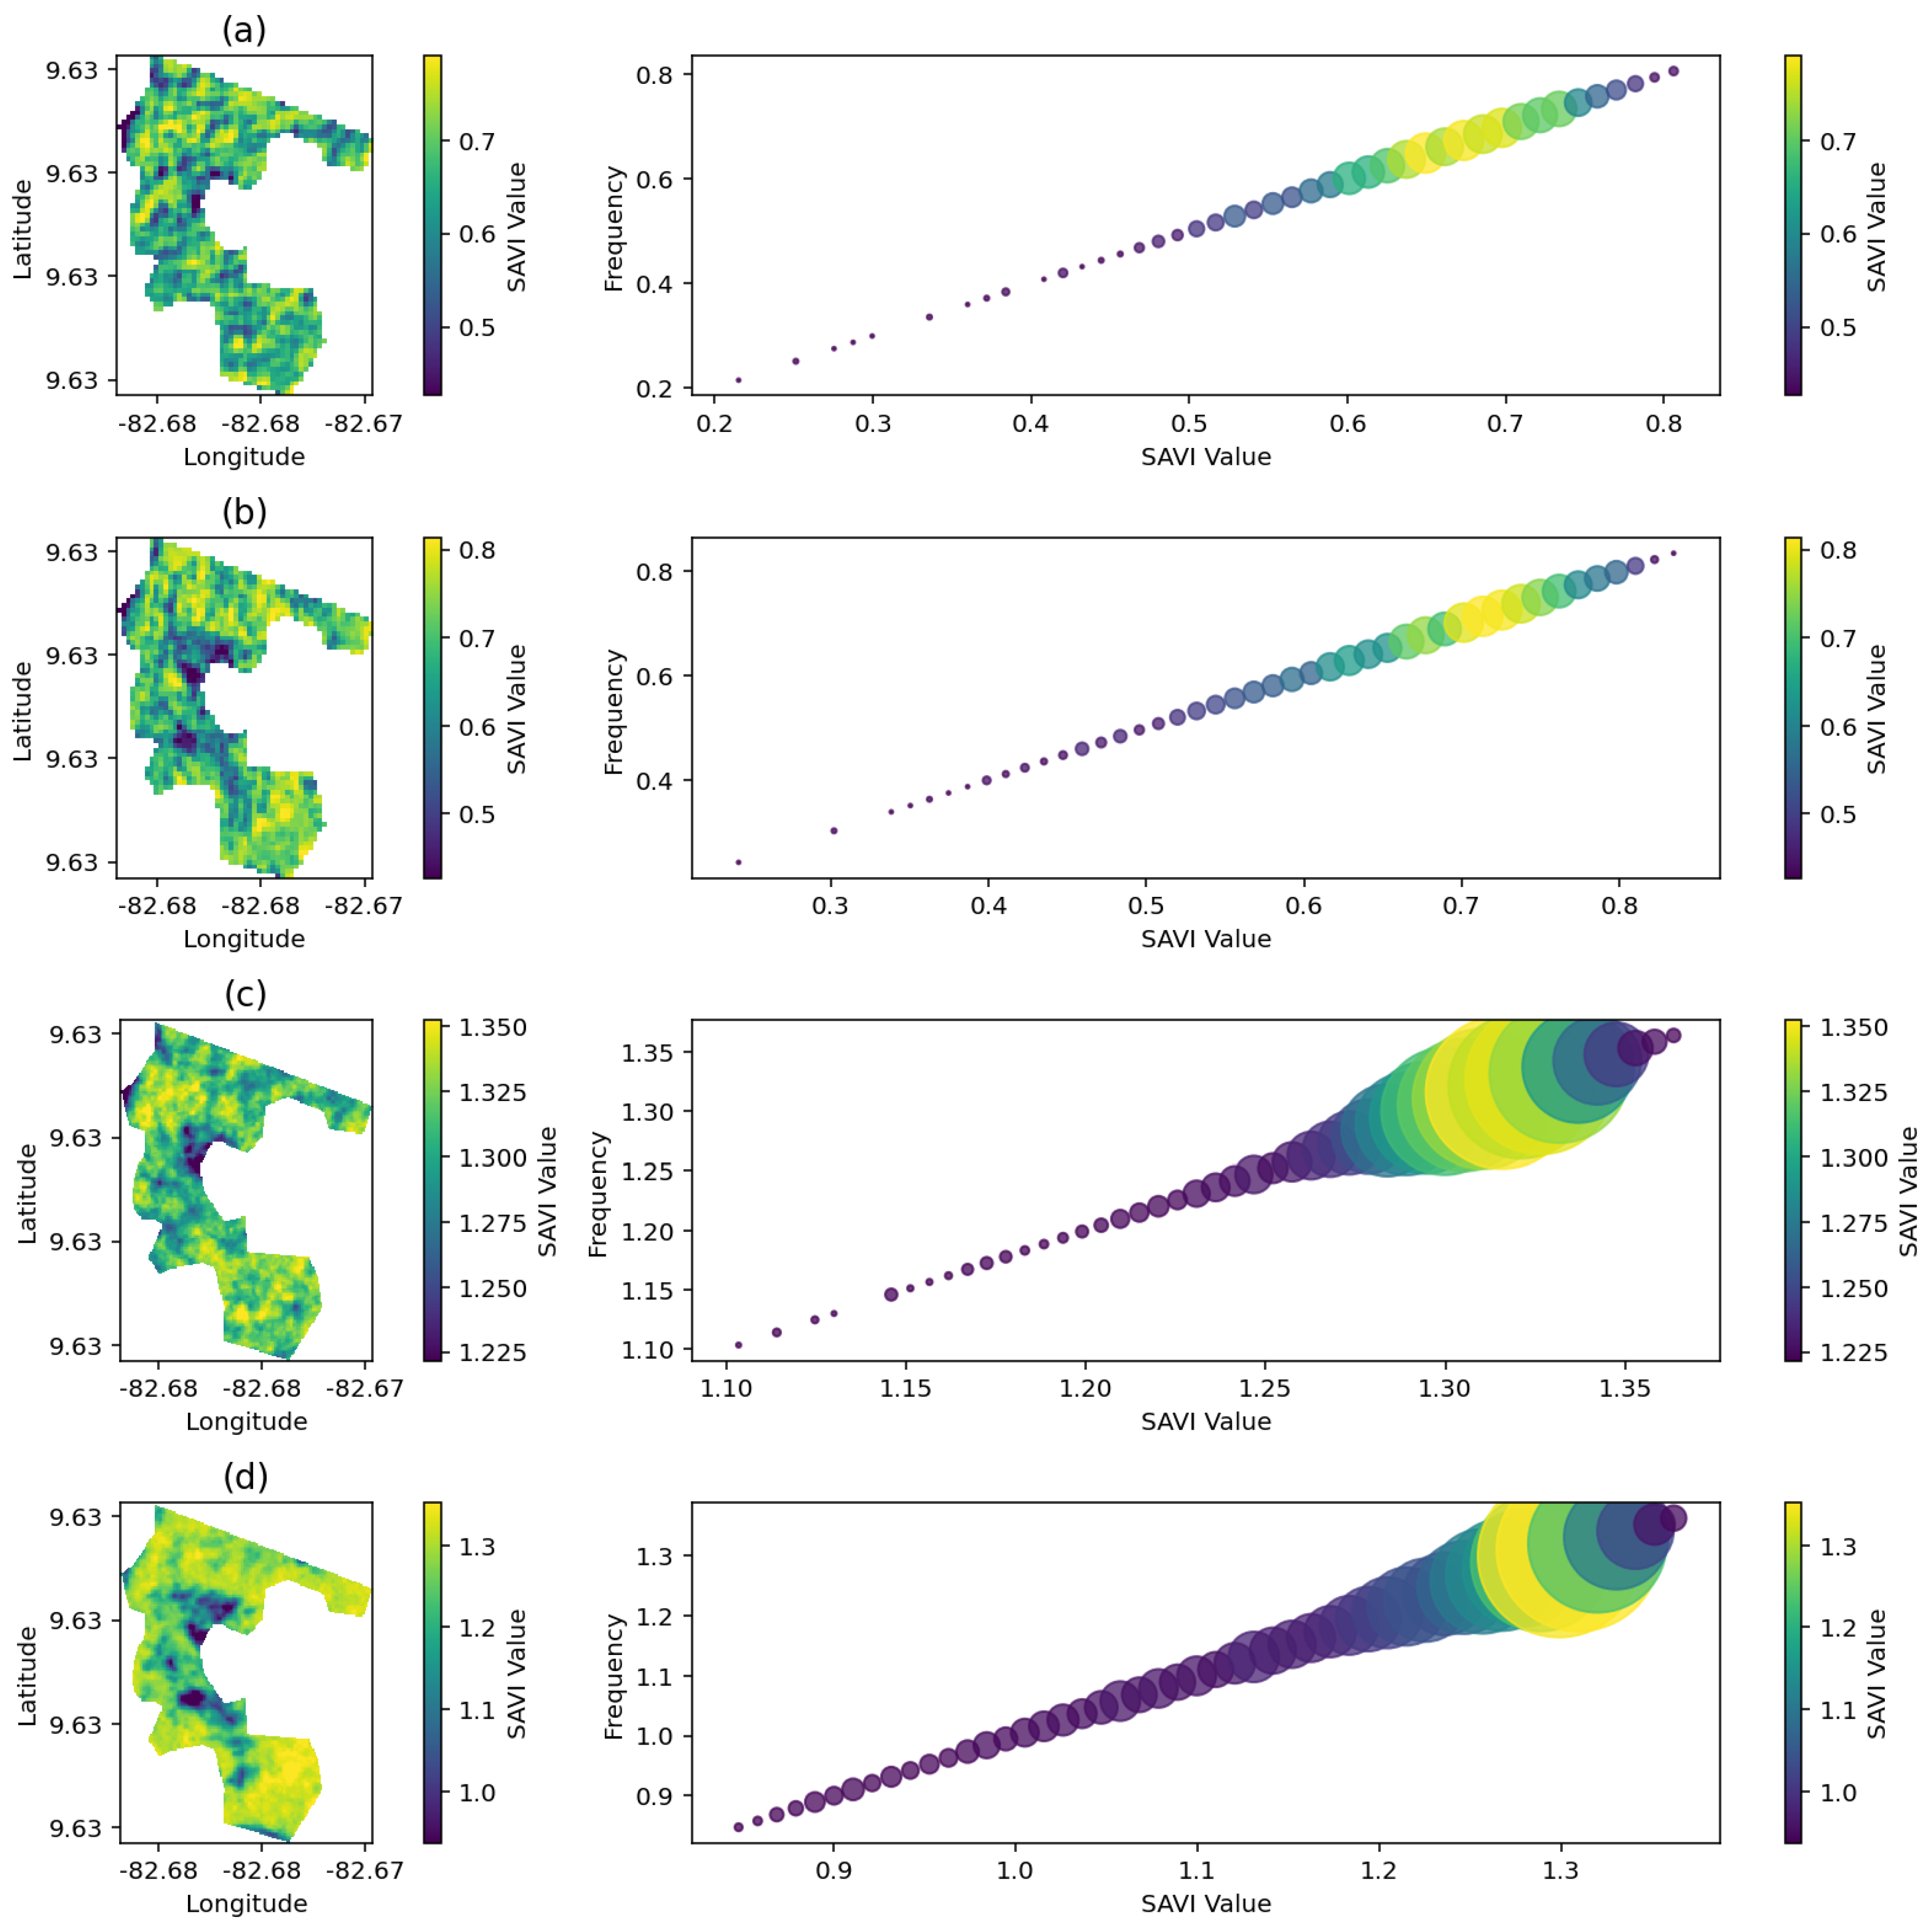
Figure 6.
NDFI Comparison for January and August 2024 (Sentinel-2 and Planet NICFI).
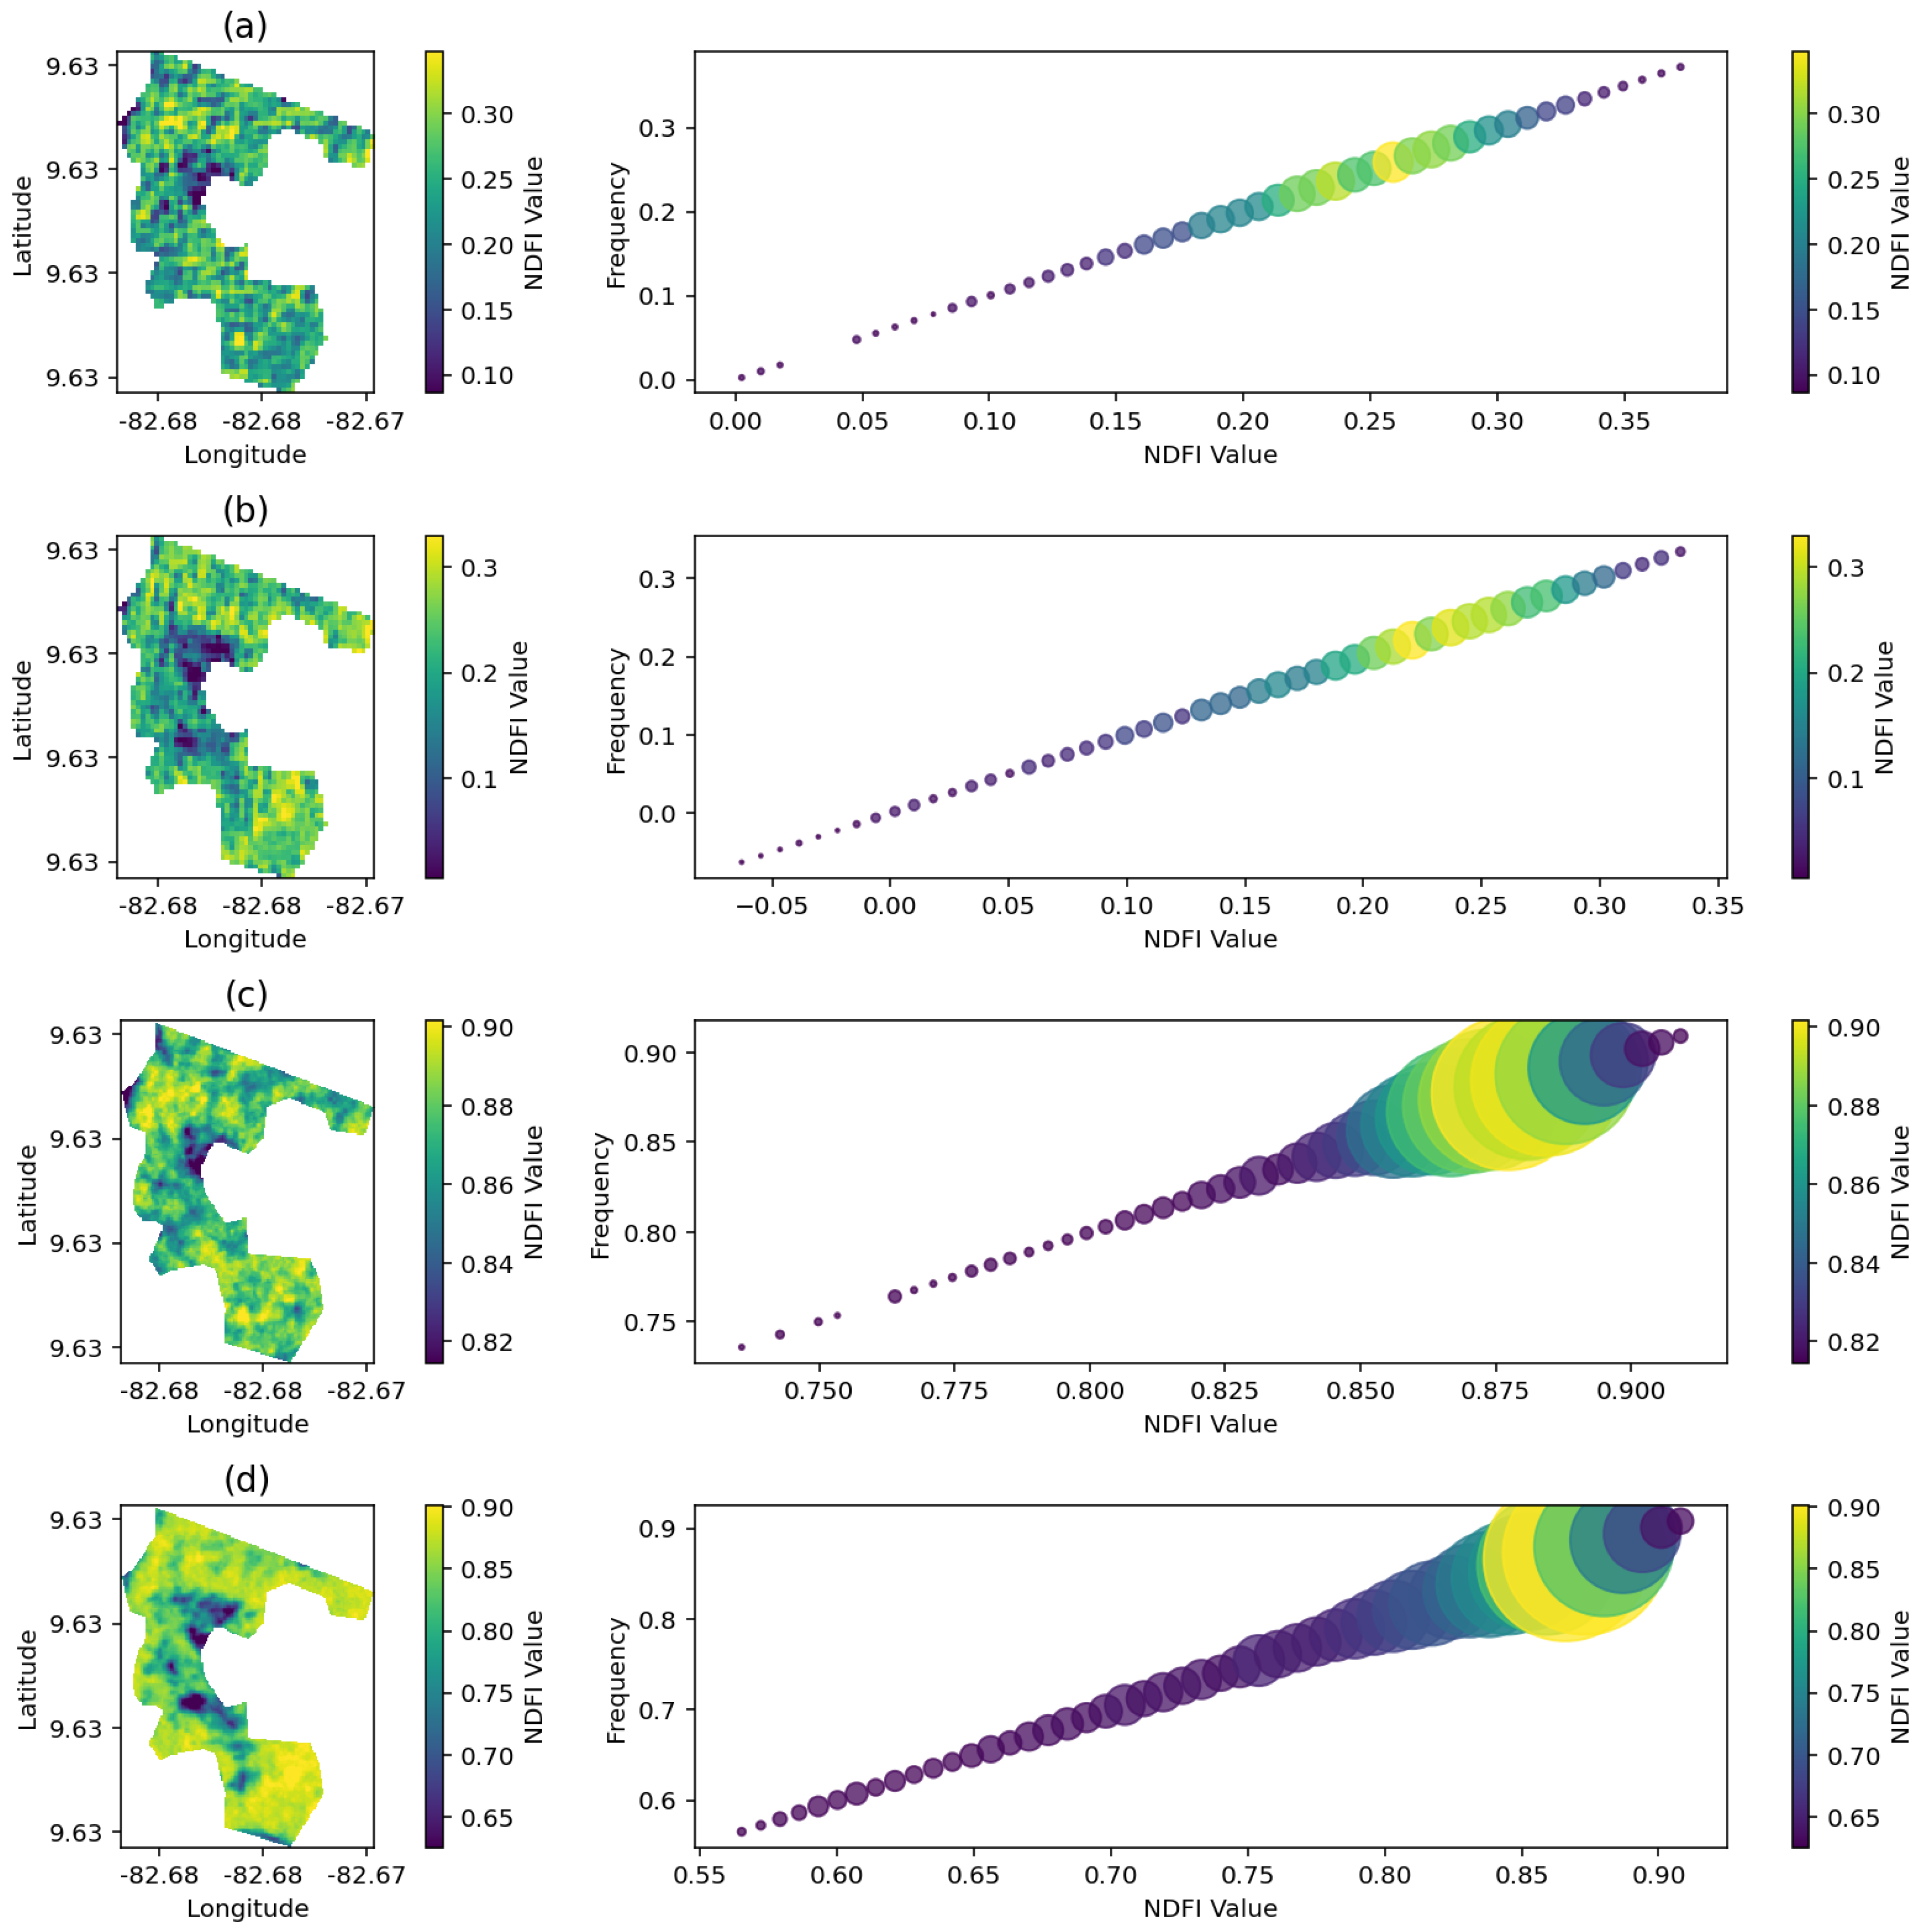
Figure 7.
Heatmaps of Vegetation Indices Statistics for Sentinel-2 and Planet NICFI, January & August 2024.
Figure 7.
Heatmaps of Vegetation Indices Statistics for Sentinel-2 and Planet NICFI, January & August 2024.
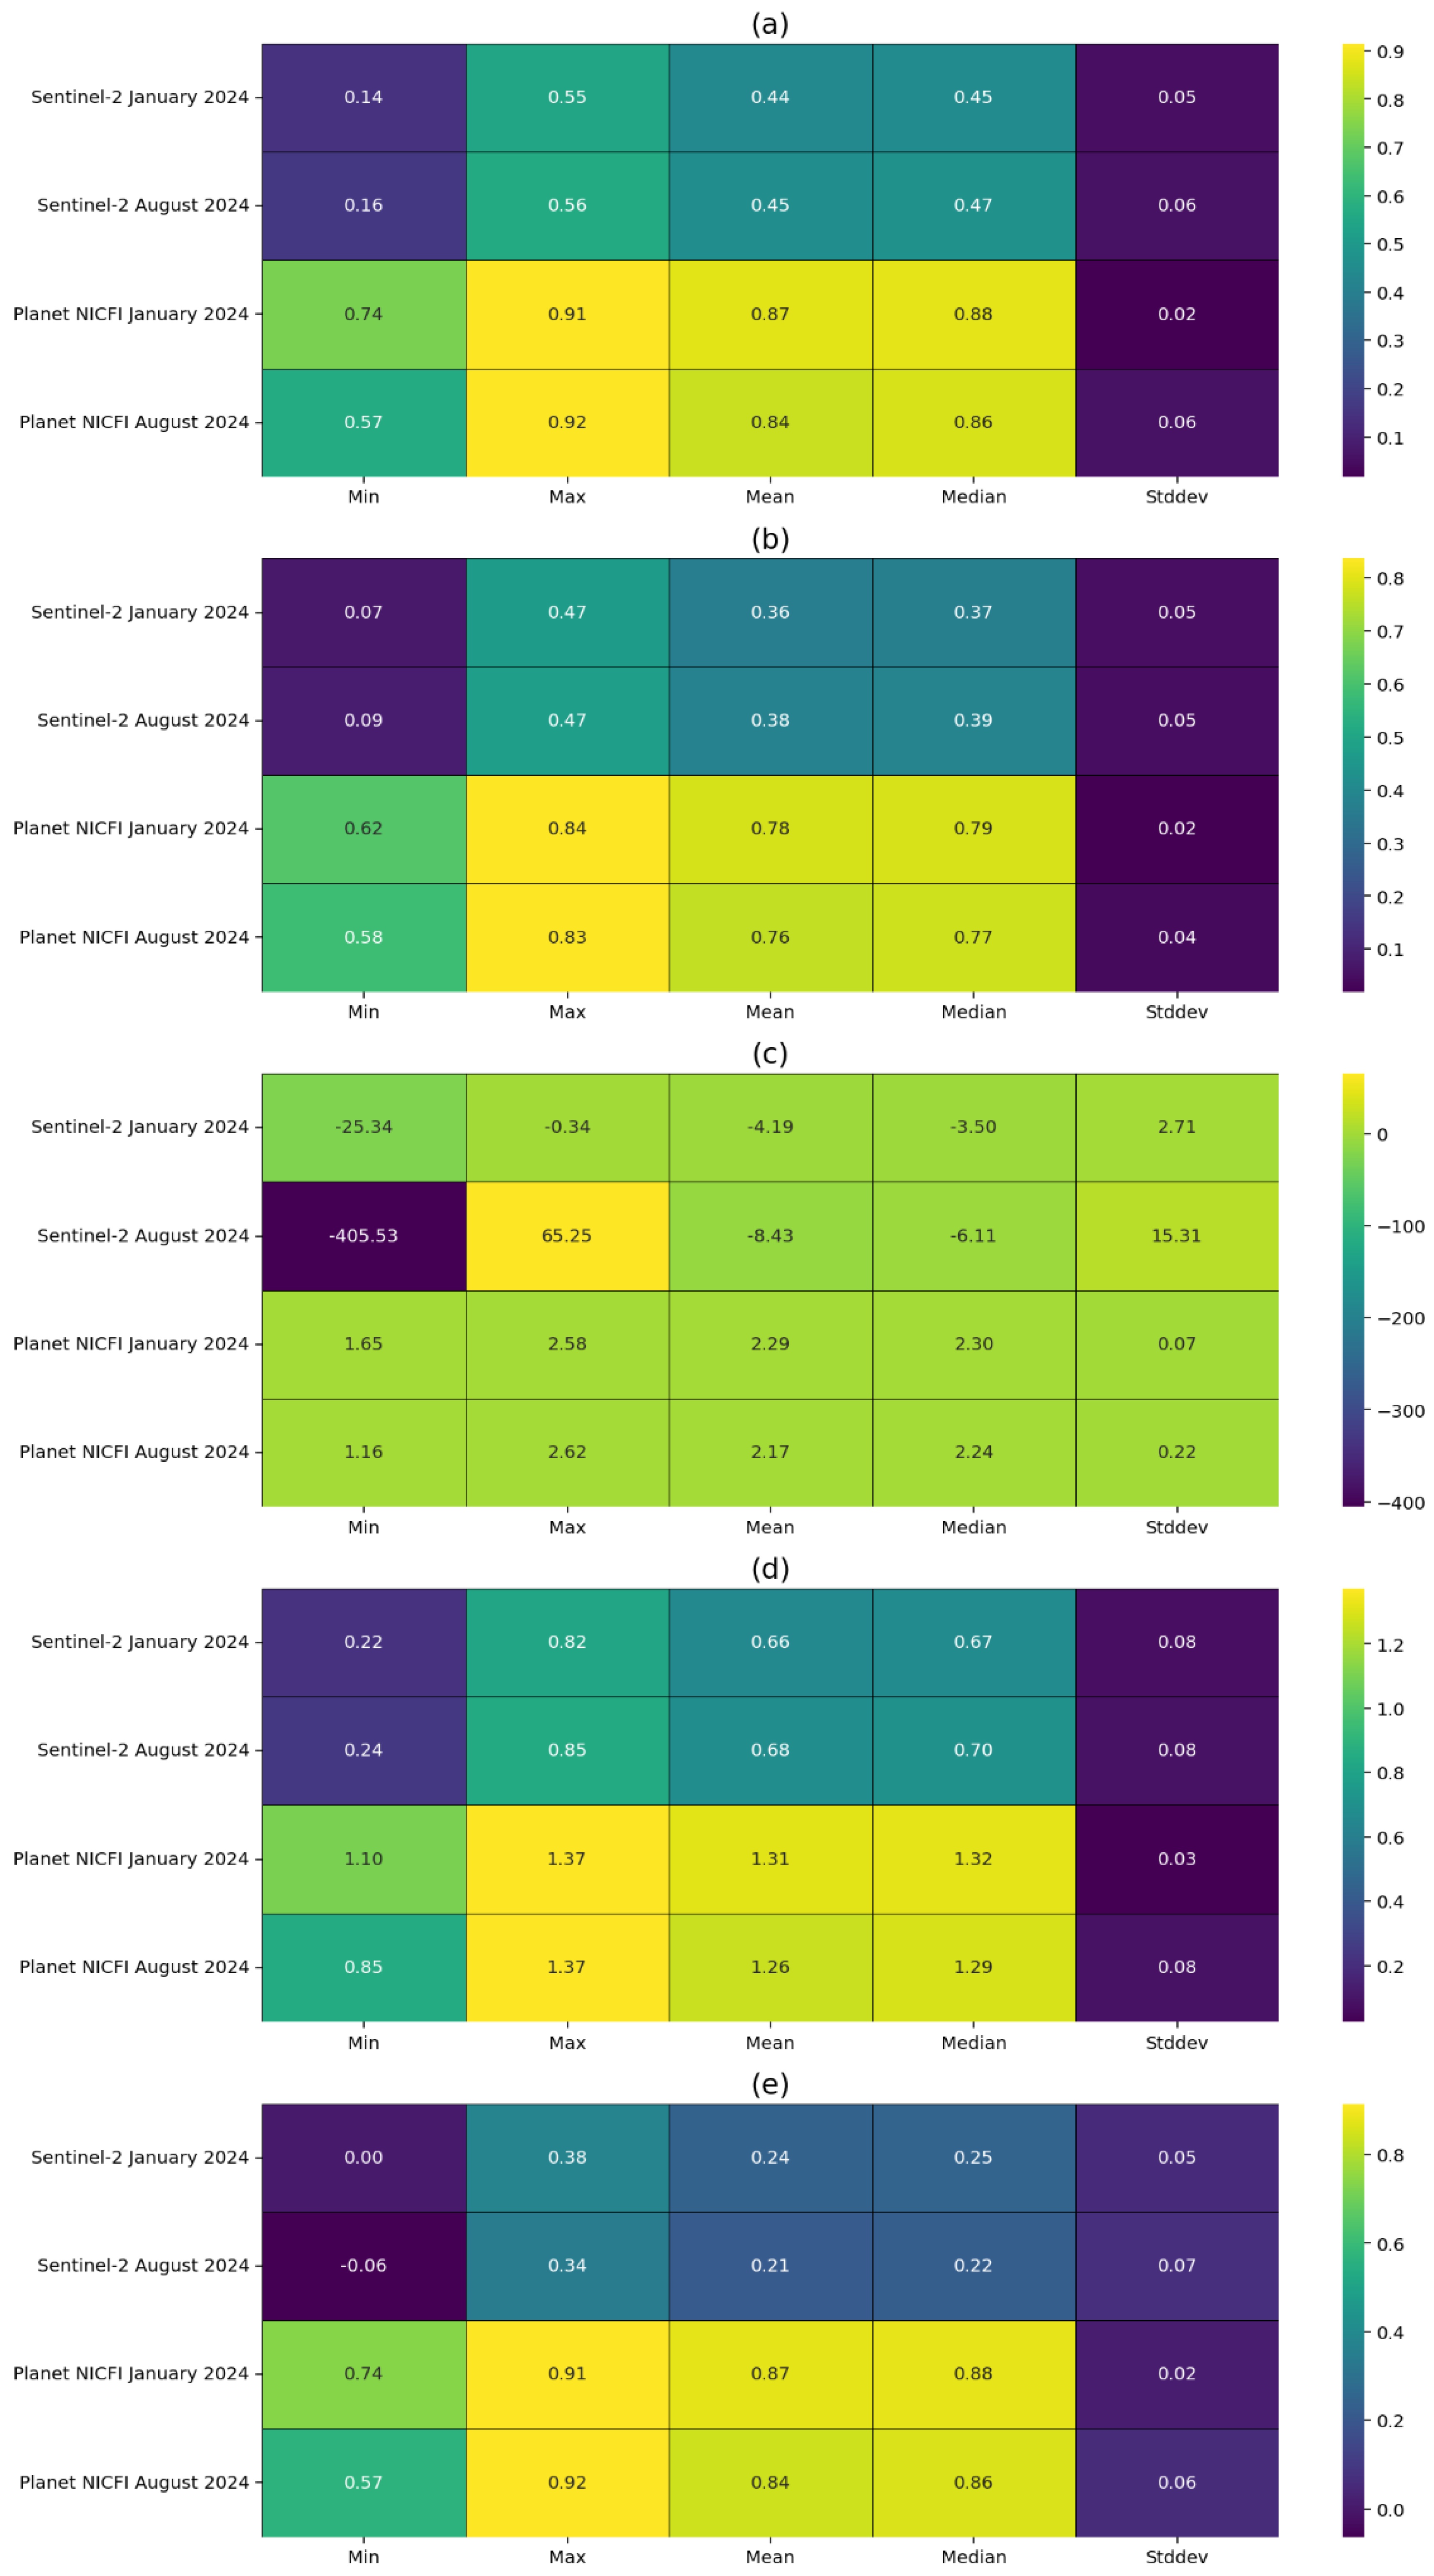
Figure 8.
Forest Cover CO2 Loss Comparison for Planet NICFI and Sentinel-2 (January and August 2024).
Figure 8.
Forest Cover CO2 Loss Comparison for Planet NICFI and Sentinel-2 (January and August 2024).
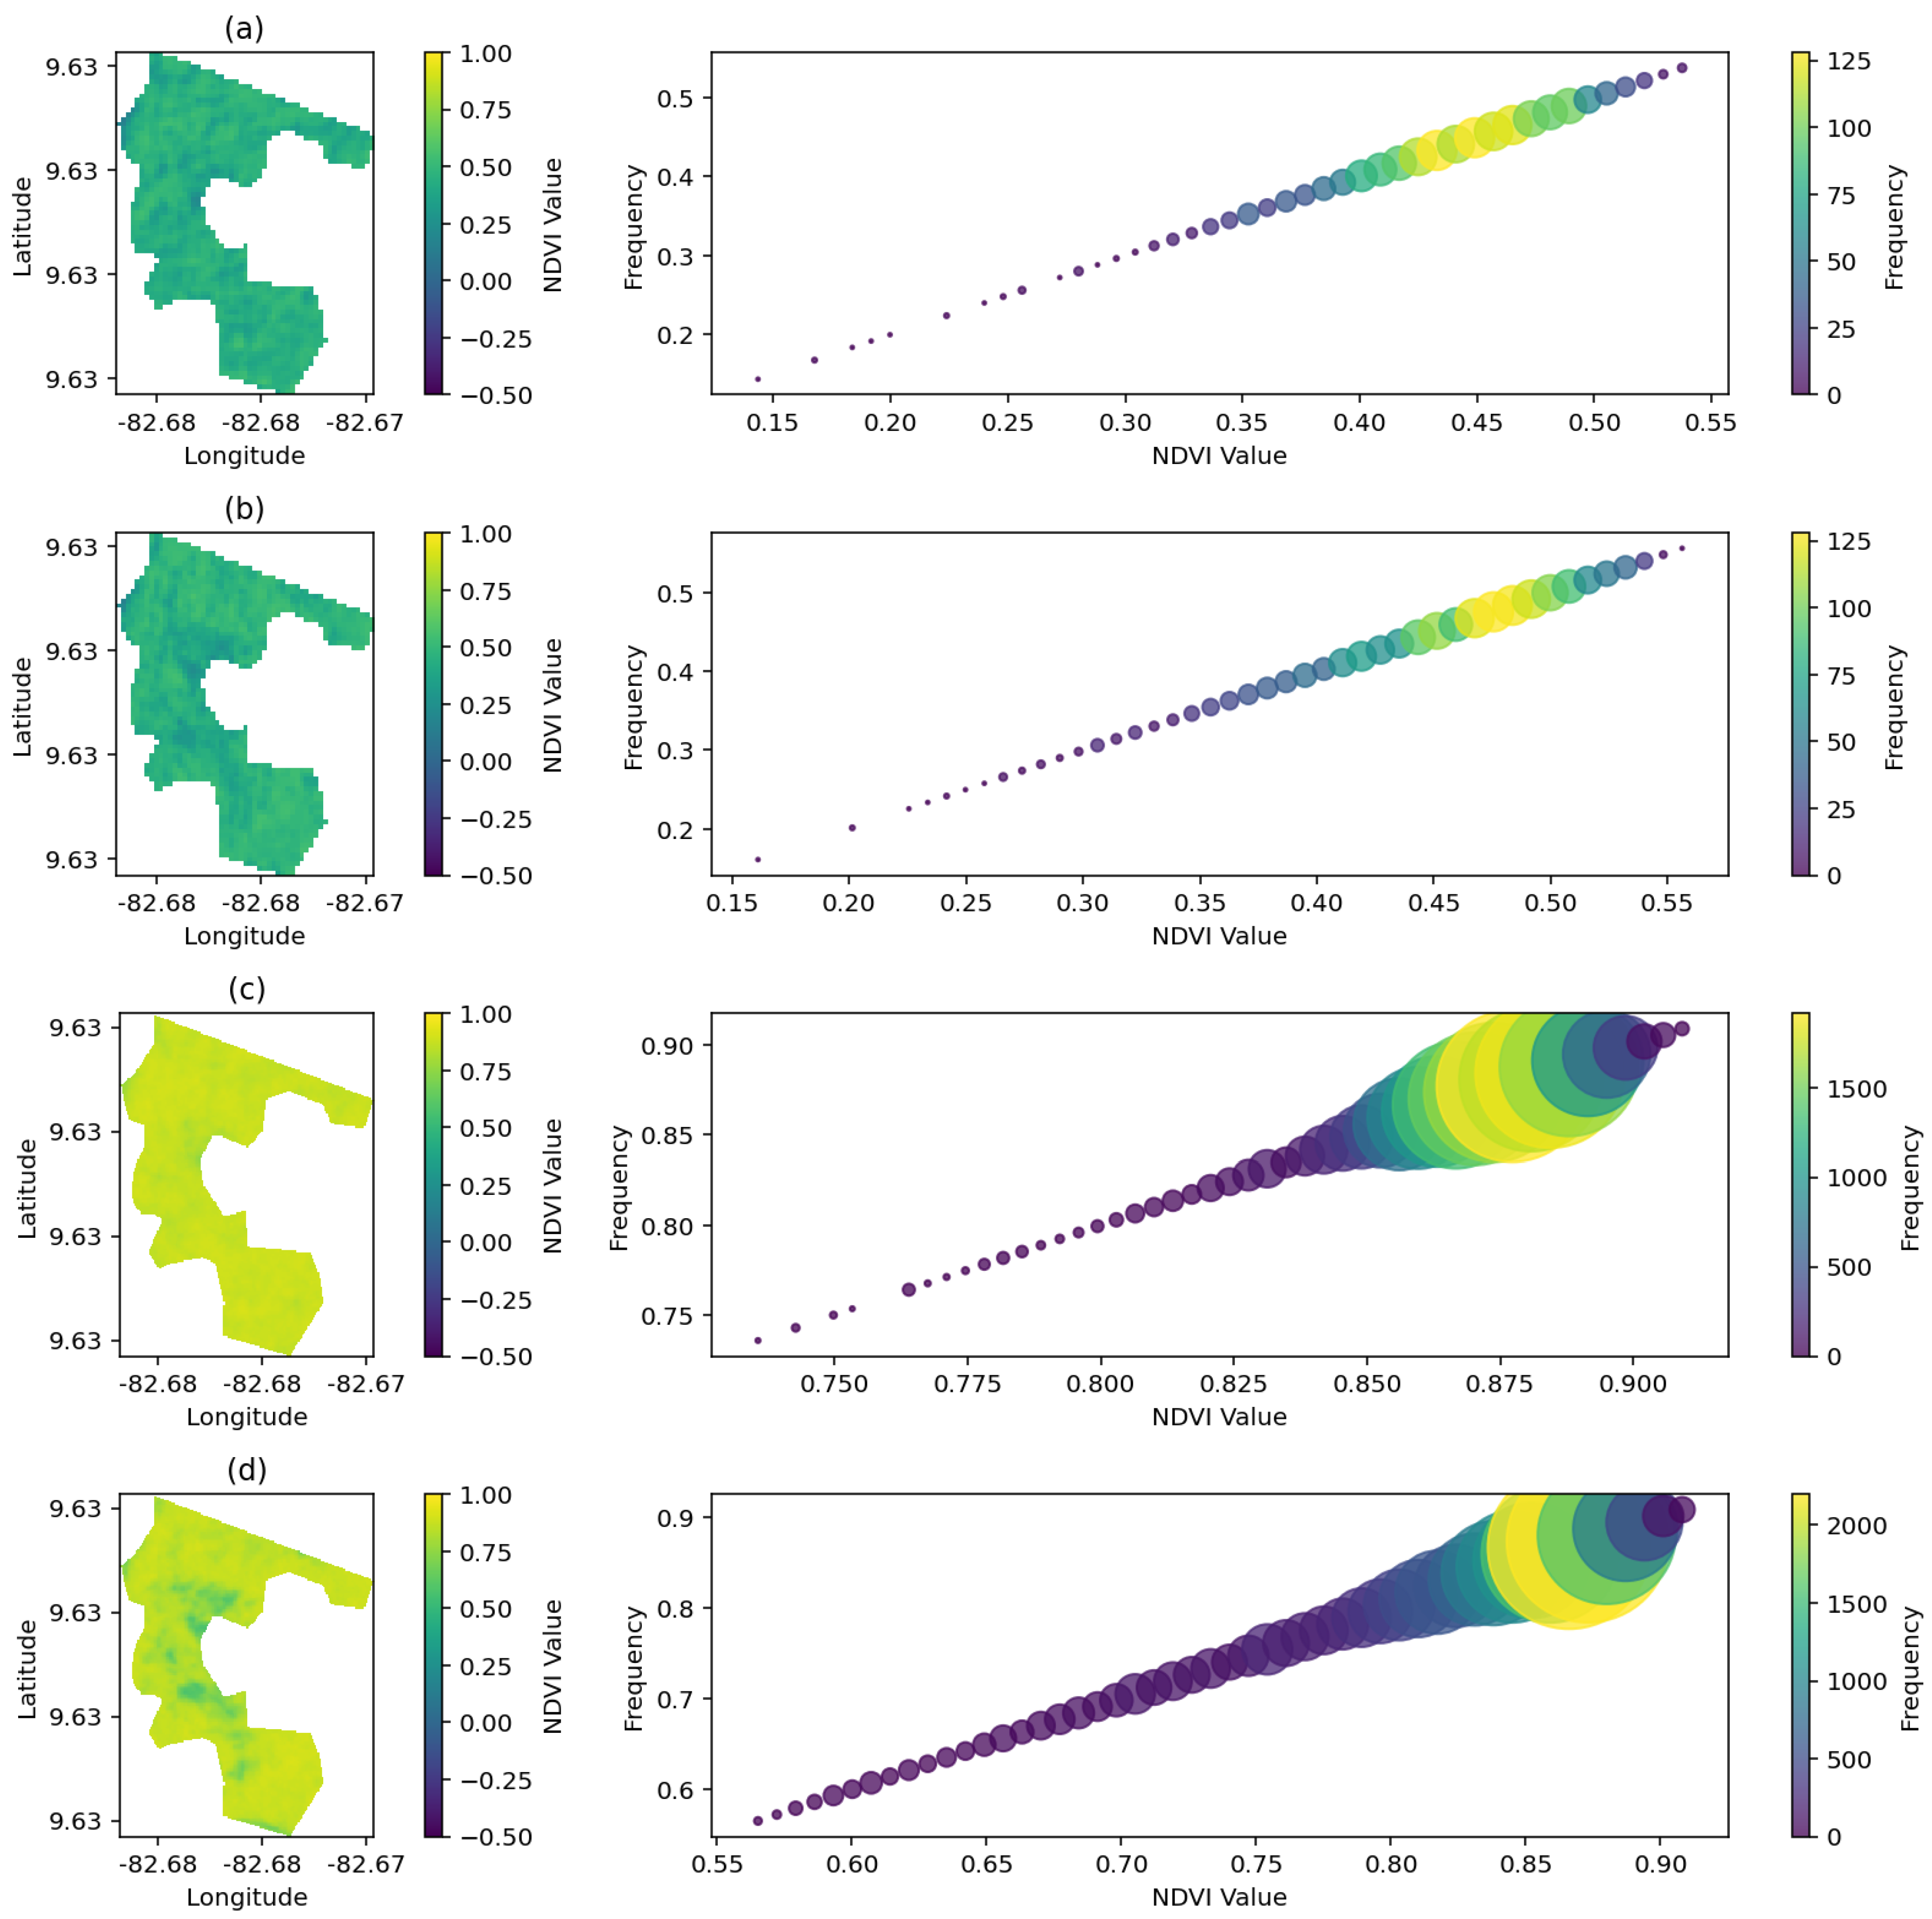
Figure 9.
Comparison of CO2 Absorption and Loss in January and August 2024 for Sentinel-2 and Planet NICFI Datasets.
Figure 9.
Comparison of CO2 Absorption and Loss in January and August 2024 for Sentinel-2 and Planet NICFI Datasets.

Figure 10.
Heatmap of CO2 Loss Statistics for Sentinel-2 and Planet NICFI datasets.
Disclaimer/Publisher’s Note: The statements, opinions and data contained in all publications are solely those of the individual author(s) and contributor(s) and not of MDPI and/or the editor(s). MDPI and/or the editor(s) disclaim responsibility for any injury to people or property resulting from any ideas, methods, instructions or products referred to in the content. |
© 2024 by the authors. Licensee MDPI, Basel, Switzerland. This article is an open access article distributed under the terms and conditions of the Creative Commons Attribution (CC BY) license (http://creativecommons.org/licenses/by/4.0/).
Copyright: This open access article is published under a Creative Commons CC BY 4.0 license, which permit the free download, distribution, and reuse, provided that the author and preprint are cited in any reuse.


