Submitted:
01 October 2024
Posted:
02 October 2024
You are already at the latest version
Abstract
Cyclic straining simulations using incompatibility-incorporated crystal plasticity-FEM, which exhibit PSB ladder structure evolutions as detailed in Part I, are coupled with diffusion analyses of produced vacancies. We introduce a new vacancy source model based on the Field Theory of Multiscale Plasticity (FTMP), interpreting the relationship between the incompatibility rate and the flux of dislocation density as edge dipole annihilation processes. Both direct and indirect coupling diffusion analyses, with and without cyclic straining, demonstrate that varying incompatibility rates tend to further promote vacancy diffusion, leading to surface grooving, enhanced extension rates, and eventual transition to cracks. The findings reveal that: (i) the evolved PSB ladder structure serves as a site for vacancy formation, (ii) it provides a diffusion path toward the specimen surface, and (iii) it significantly enhances groove extension rates. These factors effectively facilitate the transition from a "groove" to a "crack," evidenced by the abrupt acceleration of the extension rate, mirroring systematic experimental observations by Nakai et al. These achievements validate the FTMP's capability to simulate complex phenomena and significantly deepen our understanding of slip band-fatigue crack transition mechanisms.
Keywords:
fatigue
; persistent slip band
; crack initiation
; crystal plasticity
; field theory
; non-Riemannian plasticity
; finite element method
; vacancy diffusion
; dislocation dynamic
1. Introduction
Modeling the fatigue crack initiation process is one of the most important yet challenging problems, not only in engineering but also within the multiscale modeling community of materials science [1,2,3]. Although pioneering numerical simulations by Repetto et al. were reported as early as 1997 [4], progress in this area has been limited since then. Continuum simulations have largely remained a supplementary approach to recent advancements in experimental observation techniques and physics-based microscopic simulations (e.g., [5,6]), primarily due to their limited descriptive capabilities. This situation is unfortunate, as it hinders the potential of continuum simulations to contribute meaningfully to our understanding of fatigue crack initiation processes. In contrast, the Field Theory of Multiscale Plasticity (FTMP) [7,8,9,10,11,12] stands out from conventional methods due to its ability to naturally reproduce deformation-induced field evolutions that result in patterning, as demonstrated in Part I of the present attempt.
In Part I, we developed a simulation model that realistically mimics the ladder structure of persistent slip bands (PSBs), which naturally forms and evolves under cyclic plastic straining in a single-slip oriented single crystal sample, accompanied by eventual surface undulation and groove embryos. We tentatively introduced the effect of vacancy formation on surface grooving through incompatibility contributions; however, a more explicit model that incorporates both vacancy formation and subsequent diffusion is needed. The critical roles of vacancy formation in relation to the PSB ladder structure concerning fatigue crack initiation have been recognized for some time [13,14,15]. While some interpretations and visual models have been proposed in conjunction with PSB ladder structures, no explicit investigations combining deformation analyses have been conducted to date. To fully understand the fatigue crack nucleation process, an approach that reproduces the entire process, including vacancy effects, will be indispensable. This study extends our efforts by coupling analyses with vacancy diffusion after introducing a newly proposed vacancy source model. To this end, we first prepare new samples using a cut-and-paste operation based on the Di-CAP concept (deformation-induced context-dependent autonomic pluripotency; see Appendix A1 for details), transferring information about the grooved surface obtained from the results in Part I.
For the detailed process of fatigue cracks evolving from surface grooves, which manifest the underlying PSBs, Nakai et al. [16,17,18] reported informative empirical observations using atomic force microscopy (AFM) combined with interrupted fatigue tests on various materials, as detailed in Part I. They focused on the transition from slip bands to cracks, noting that this transition occurs when the groove depth (referred to as slip distance) reaches a critical value. Focusing on the transition from slip bands to cracks once this critical condition is reached may provide a more effective framework, minimizing ambiguities in the modeling process. Moreover, utilizing this critical condition for assessing the transition to cracks can significantly reduce computational costs when integrated with our FTMP-based approach, as the FTMP does not always require intricate fine mesh divisions to accurately reproduce deformation-induced substructural patterns.
This study further utilizes FTMP [7,8,9,10,11,12] for modeling vacancy formation via the conservation law for the 4D extended incompatibility tensor, exhibiting relationship between the incompatibility rate and the edge dislocation flux [7]. Combining with the diffusion equation proposed by Reppeto and Ortiz [4], we perform indirect and direct coupling analyses on the simulated samples. We try to attempt to identify the essential roles of the PSB ladder structure for the fatigue crack initiation process based on the simulations.
2. Theory and Model
2.1. Model Preparation
Figure 1 schematically illustrates the processes involved in preparing the analytical model for the current series of simulations based on the Di-CAP concept. Samples are numerically machined from a parent sample that has developed a PSB ladder structure under cyclic straining, incorporating surface information separately derived from the simulation results obtained in Part I. These prepared samples are subsequently used for restart analyses. The critical information to be transferred is the plastic distortion tensor , which enables us to reproduce the evolved deformation-induced patterns in the new model through the activation of the dislocation density tensor and the incompatibility tensor.
2.2. Vacancy Source Model
In the FTMP framework, the central hypothesis is encapsulated in the “Flow-Evolutionary Law (FEL),” which correlates the incompatibility tensor with fluctuations in elastic strain energy. Unlike the conventional three-dimensional incompatibility tensor, this approach extends the definition into four-dimensional spacetime. As a result, the pure temporal component of the FEL simplifies to the following relationship:
Here, the left-hand side originates from , while the right-hand side simplifies to under the static assumptions applied in this study. For the four-dimensional extended incompatibility tensor, the conservation law is expressed as:
The spacetime mixed component is given by:
Substituting this expression into Equation (2), we obtain:
Thus, the incompatibility rate is interpreted equivalently as the edge dislocation flux, providing valuable insights for modeling processes involving edge dislocation pair production and annihilation. In the current study, this framework is specifically applied to model vacancy generation processes.
2.3. Diffusion Equation
The diffusion equation used in the following analysis is consistent with that employed by Repetto et al. [4] and is expressed as:
In this equation, the diffusion coefficient is decomposed into lattice and pipe components:
Where represents the diffusion coefficient for the pipe diffusion process, assuming a ratio against that for lattice diffusion as . The vacancy production rate in Equation (5) is assumed to be driven by the incompatibility rate. Consequently, the vacancy source model is expressed as:
where a represents a conversion constant, and denotes the Macauley bracket, accounting for vacancy production only.
Figure 2 provides an overview of the proposed vacancy source model along with the accompanying diffusion equation (5) and current simulation snapshots. It powerfully illustrates the advantages of the current FTMP-based simulation, emphasizing that all contributions in Equation (5) (and Equation (6)) are directly derived from the simulated patterned structure. Furthermore, based on the vacancy concentration flux outward from the sample surface, the receding surface velocity is evaluated as follows:
where is the outward normal vector of the sample surface.
A previous application of the incompatibility rate was demonstrated in a series of dislocation dynamics (DD) simulations by Ihara and Hasebe [19], where it was correlated with the number of edge debris loops considered responsible for vacancy formation, which tends to occur resulting from interactions among cross-slipped screw dislocations in the channel region between ladder walls. This establishes a foundation for applying the incompatibility rate to the vacancy source model presented here.
The effectiveness of the model is confirmed in Figure 3a, which provides a direct comparison between DD-based simulations (top middle-right) and the current FTMP-based results for the PSB-laddered region (bottom middle-right) in terms of phase-space trajectories (PhS-Ts). The detailed variation of during the straining cycle aligns well with the former, even quantitatively, resulting in well-simulated PhS-T in the CP-FEM.
It is noteworthy that the DD simulations examined the effect of cross-slip frequency on debris loop formation; without this mechanism, no debris loops are created, as detailed in Figure 3b Effect of cross slip frequency on debris loop formations in channel region of PSB ladder structure, resulting from interactions among screw segments bowed out from edge wall. Detailed process for the debris loop formation is depicted below, where several annihilation processes contribute it. Additionally, the back-and-forth movements of screw dislocations can lead to the pair annihilation of wall-constructing edge dislocations, as partially depicted in a snapshot located in the far top-left of Figure 3a. This aspect is not included in the aforementioned correlation. Since this process also contributes to vacancy formation in the ladder wall regions, we expect that including it will reduce data scatter in the correlation. Both situations can be collectively accounted for in Equation (7) in the present simulations.
2.4. Coupling Analyse
We conduct coupling simulations incorporating the proposed vacancy source model into the diffusion analysis in two steps. First, an indirect coupling simulation is performed using a stationary snapshot that includes an already developed PSB ladder structure. In the second step, a direct coupling simulation is carried out, solving the diffusion and cyclic straining analyses simultaneously. Figure 4 illustrates the analytical models for the CP-FEM and the associated diffusion analyses, highlighting how information about vacancy concentration is converted. For the diffusion analyses, we employ the finite difference method (FDM) for solving Equation (5). The figure also specifies the conversion process for between the FEM and FDM elements.
3. Analytical Results
3.1. Indirect Coupling Analyses
Figure 5 summarizes the results of the indirect coupling simulations, comparing three representative cases: with and without a threshold for applying the vacancy source model (), and with and without information transfer for the restart analyses. The effect of the conversion rate in Equation (7) is also examined in each case.
When no threshold is set, as shown in Figure 5(a), a sample-wide surface descent occurs regardless of the conversion rate, due to broader vacancy diffusion. This highlights the necessity of introducing a threshold for vacancy formation. When a threshold is applied, as depicted in Figure 5(b), surface grooving becomes localized at the edge of the formed PSB, resulting from confined vacancy diffusion in the PSB region, as expected. Overall, a larger conversion rate leads to a higher extension rate of the grooving.
Regarding the effect of information transfer for the restart analyses, as examined in Figure 5(c), it can significantly influence subsequent vacancy production behavior and the following surface grooving, as new PSBs are likely to emerge in response to the new boundary conditions without this transfer. In the present example cases, a new PSB emerge from the bottom-right of the sample, giving ultimately rise to another grooving on the other side of the PSB.
Since this study does not prioritize the further growth of the PSB structure and instead focuses on the extension of a single groove, we choose condition (b). The physical rationale for setting the threshold for vacancy formation is related to the frequency of cross slip, based on DD simulation results by Ihara and Hasebe [19], which indicated no debris loop formation under this condition (see Figure 3b). Alternatively, other factors related to vacancy formation may also be relevant and warrant further examination.
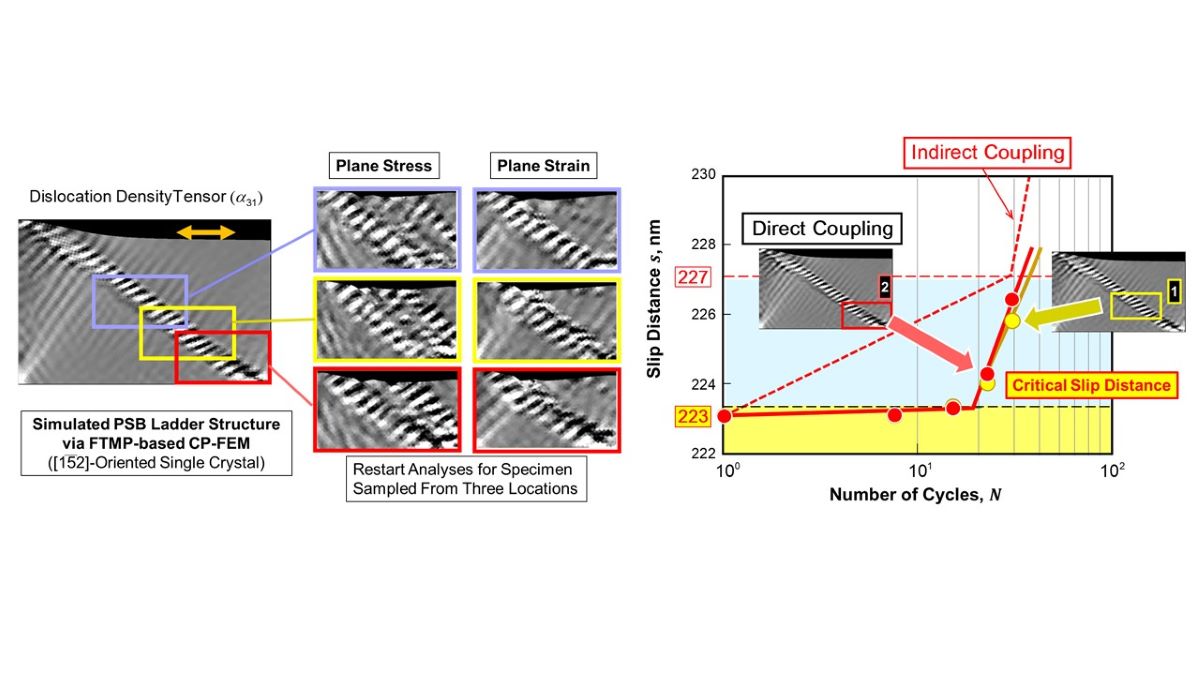
The resultant variation of the surface receding velocity distribution, calculated using Equation (8), is shown in Figure 6 (left) as a function of straining cycles. It exhibits multiple peaks that ultimately converges into a single peak as the cycles progress. This leads to surface recession, resulting in groove growth, as demonstrated on the right. For comparison, the result without considering is overlaid with a broken line. The change in the slip distance is measured as schematized in the figure, indicated by double-sided arrows. Figure 7 displays the variation of slip distance with the number of straining cycles, where the slope corresponds to the extension rate of the groove. We observe that the groove extension rate accelerates sharply when a critical value of slip distance is reached, resembling the experimental observations shown in Figure 1(b) by Nakai et al. [16,17,18] on Part I. In this context, we conclude that the groove, representing a slip band, transitions into a crack, indicating that this transformation is successfully reproduced. In contrast, the scenario without considering vacancy diffusion, depicted by black circular plots, does not exhibit such acceleration; the slip band does not evolve into a crack.
3.2. Direct Coupling Analyses
The series of simulations described above can be readily extended to direct coupling analyses of CP-FEM and vacancy diffusion. In this section, we extensively examine the effect of sampling site on changes in the surface profile in the subsequent restart analyses.
Figure 8 illustrates three sampling sites on a parent specimen subjected to cyclic straining under two conditions: plane stress and plane strain. Markedly different evolutions of the PSB are observed, influenced by both the sampling site and the stress/strain condition. Notably, the plane stress condition promotes the growth of secondary and even tertiary PSBs alongside the original PSB, attributed to the increased freedom in the deformation mode during the restart analyses. This underscores a key feature of the FTMP-based approach, which effectively captures context-dependent evolutionary aspects of inhomogeneous fields, even in simple deformation analyses. Additionally, the figure includes experimental observations via TEM (top), demonstrating similar phenomena for comparison.
Direct coupling analyses are performed using the above samples under plane strain condition. We select two sites—the middle and bottom boxes in Figure 8, labeled #1 and #2, respectively—for the coupling analyses, omitting surface information for simplicity. The conversion rate is set to a =1.010-12 at%/s, with the threshold applied to the edge components of the dislocation density tensor rather than to . Figure 9 displays a series of simulated snapshots illustrating the variation in vacancy concentration contours across straining cycles, comparing #1 and #2. We observe contrasting features between the two results: site #2 shows much earlier vacancy production concentrated in the bottom right, followed by rapid growth toward the surface, while site #1 exhibits a delayed onset and subsequent growth that is more uniform.
Figure 10 summarizes the results: variations in the cross-sectional distribution of vacancy concentration (left), surface receding velocity (middle), and surface profile (right) with progressing straining cycles. In response to the contrasting features observed in Figure 9, distinct trends emerge. Site #1 exhibits a relatively uniform evolution, leading to a fluctuating vacancy flux history (accompanied by peak shifts) at the surface, which ultimately results in a relatively blunted surface groove. In contrast, site #2 demonstrates significantly biased growth in the cross-sectional vacancy concentration distribution, resulting in a focused vacancy flux peak history (without peak shifts) that leads to sharp and deep groove formation. Additionally, a small extrusion can be seen forming on the right side of the PSB edge.
3.3. General Discussion
The current indirect/direct coupling analyses incorporate the effects of (i) dislocation density, (ii) elastic strain energy, and (iii) incompatibility rate on the associated vacancy concentration, as schematically illustrated in Figure 2. The key distinction between the indirect and direct simulations is whether these three quantities remain stationary or are subject to cyclic alteration. Therefore, the emphasis here is on how these cyclic updates affect diffusion behavior, surface grooving, and the eventual transition to cracking.
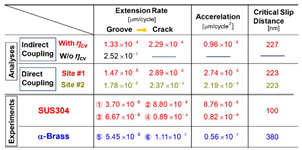
We compare the two results regarding groove-crack transition using the slip distance versus number of cycles diagram in Figure 11, where the results for indirect analyses (shown in Figure 7) are overlaid with dashed lines. Additionally, a quantitative comparison—including experimental data—is presented in Table 1, detailing extension rates for grooves and cracks, acceleration, and the critical slip distance for crack nucleation. The numbers 1 through 6 associated with the experimental values correspond to those depicted in Figure 1(a) of Part I, illustrating the conditions before and after the acceleration of the extension rate. The following points emerge from this comparison:
(a) The simulation results—both indirect and direct coupling analyses—successfully reproduce the experimental trends (cf. Figure 1(a) of Part I), even quantitatively.
(b) Cyclic updates of the quantities significantly promote the grooving and subsequent crack nucleation process. The direct coupling analyses demonstrate a smaller critical slip distance and slightly larger acceleration in the extension rate compared to the indirect counterpart.
(c) The slip distance in the direct coupling analyses appears to be insensitive to the differing vacancy diffusion and surface recession trends shown in Figure 10. This observation offers valuable insight into determining the critical slip distance in experiments [16,17,18], which remains unaffected by the loading conditions.
The primary reason for the promoted groove-crack transitions in the direct analyses lies particularly in the cyclically varying incompatibility rate , which significantly enhances the vacancy formation rate in Equation (5). This is evident in the snapshots shown in Figure 9, where pronounced ladder-like patterns emerge in the vacancy concentration contours from the early stages of the straining cycles and persist into the later cycles.
The above results emphasize the critical roles played by the incompatibility tensor in the current FTMP for modeling and simulating fatigue crack initiation process. It not only generates the PSB laddered pattern but also serves as a source of vacancies through its rate. Furthermore, thus reproduced PSB laddered pattern provides a crucial diffusion pathway toward the sample surface, effectively facilitating the groove-crack transition, as previously demonstrated. These aspects also apply to the essential roles of the PSB ladder structure itself in the fatigue crack initiation process.
The current simulation results are insufficient to explain why experimental findings consistently indicate a material-dependent critical slip distance for groove-crack transitions, regardless of straining or loading conditions, aside from the tentative insights provided above in (c). Additionally, they do not yet clarify the factors that dictate this critical distance. However, this series of studies highlights the promising potential of simulation-driven investigations to explore these aspects of fatigue crack nucleation processes effectively far beyond the conventional crystal plasticity framework. Furthermore, the strength of the present vacancy source model based on lies its insensitivity to the specific mechanism of vacancy formation, as long as it accurately represents the pairwise annihilation of edge dislocations, as defined in Equation (4).
4. Concluding Remarks
The present series of simulation results compellingly highlight the critical role of the incompatibility tensor within the Field Theory of Multiscale Plasticity (FTMP) in accurately capturing the fatigue crack initiation process. This tensor not only enables the reproduction of the PSB laddered pattern but also generates vacancies through its rate. Furthermore, the PSB ladder structure provides a crucial diffusion pathway to the sample surface. Together, these elements are enhanced by the cyclically varying incompatibility rate in the presence of the laddered dislocation structure, underscoring the essential influence of the PSB ladder structure on fatigue crack initiation.
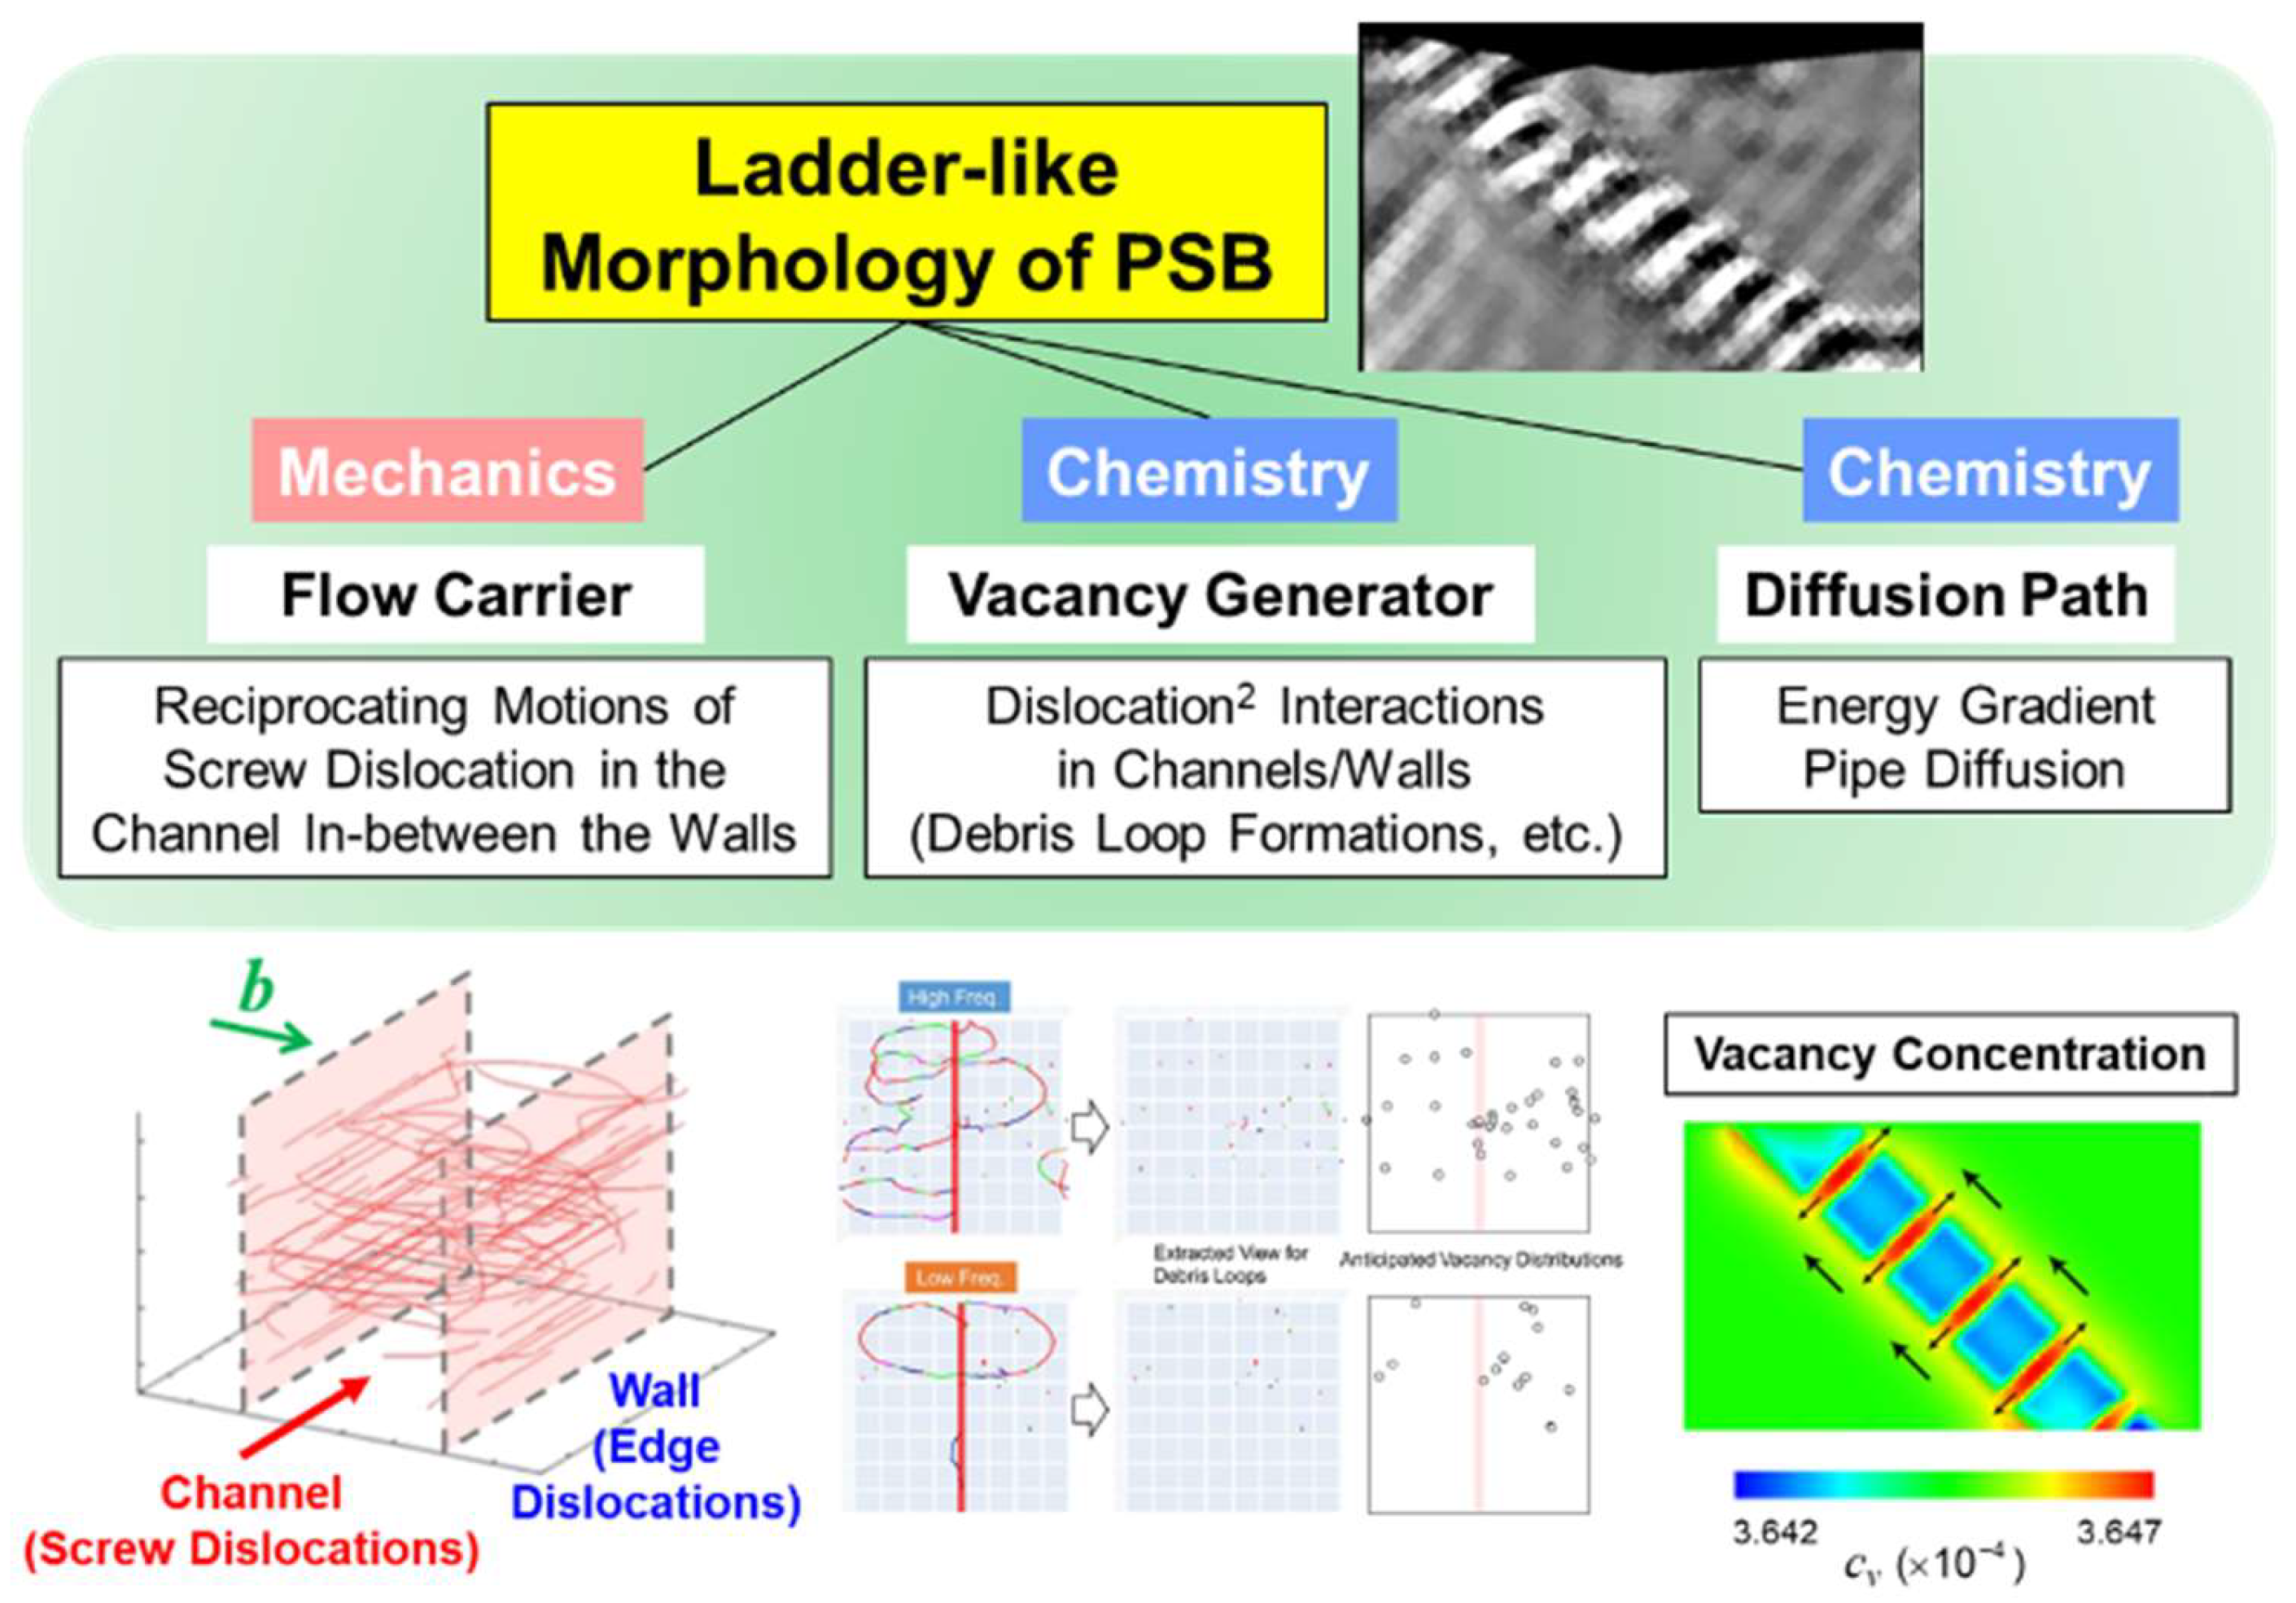
A primary objective of this series of studies, encompassing Part I and Part II, is to elucidate the significant role of the PSB ladder structure in crack initiation, as evidenced by these simulations. Our comprehensive analyses of the transition from PSB to crack reveal three fundamental aspects inherent to the PSB ladder structure: one mechanical and two chemical roles, as summarized in Figure 12. These roles include: (1) acting as a flow carrier and a site for stress concentration, (2) serving as a generator of vacancies, and (3) functioning as a diffusion pathway for these vacancies. The incorporation of the incompatibility tensor into the hardening law of the FTMP makes all of this possible.
From this perspective, the formation of a laddered dislocation structure within PSBs plays a multifaceted role in stabilizing the crack initiation process. In contrast, other morphologies, such as cellular structures, may lead to less stable crack nucleation. This observation serves as an indirect yet significant conclusion to the first pivotal research finding presented in Figure 1 of Part I, underscoring the necessity for further investigation as we continue to explore these complexities.
In conclusion, the FTMP framework not only deepens our understanding of the intricate interplay between laddered morphology and vacancy dynamics in fatigue crack initiation but also establishes a new benchmark for modeling dislocation substructures. This sets the stage for future breakthroughs in multiscale materials science, ultimately advancing our ability to predict and mitigate fatigue failure in materials.
Appendix A1. About Di-CAP Concept for Restart Analyses
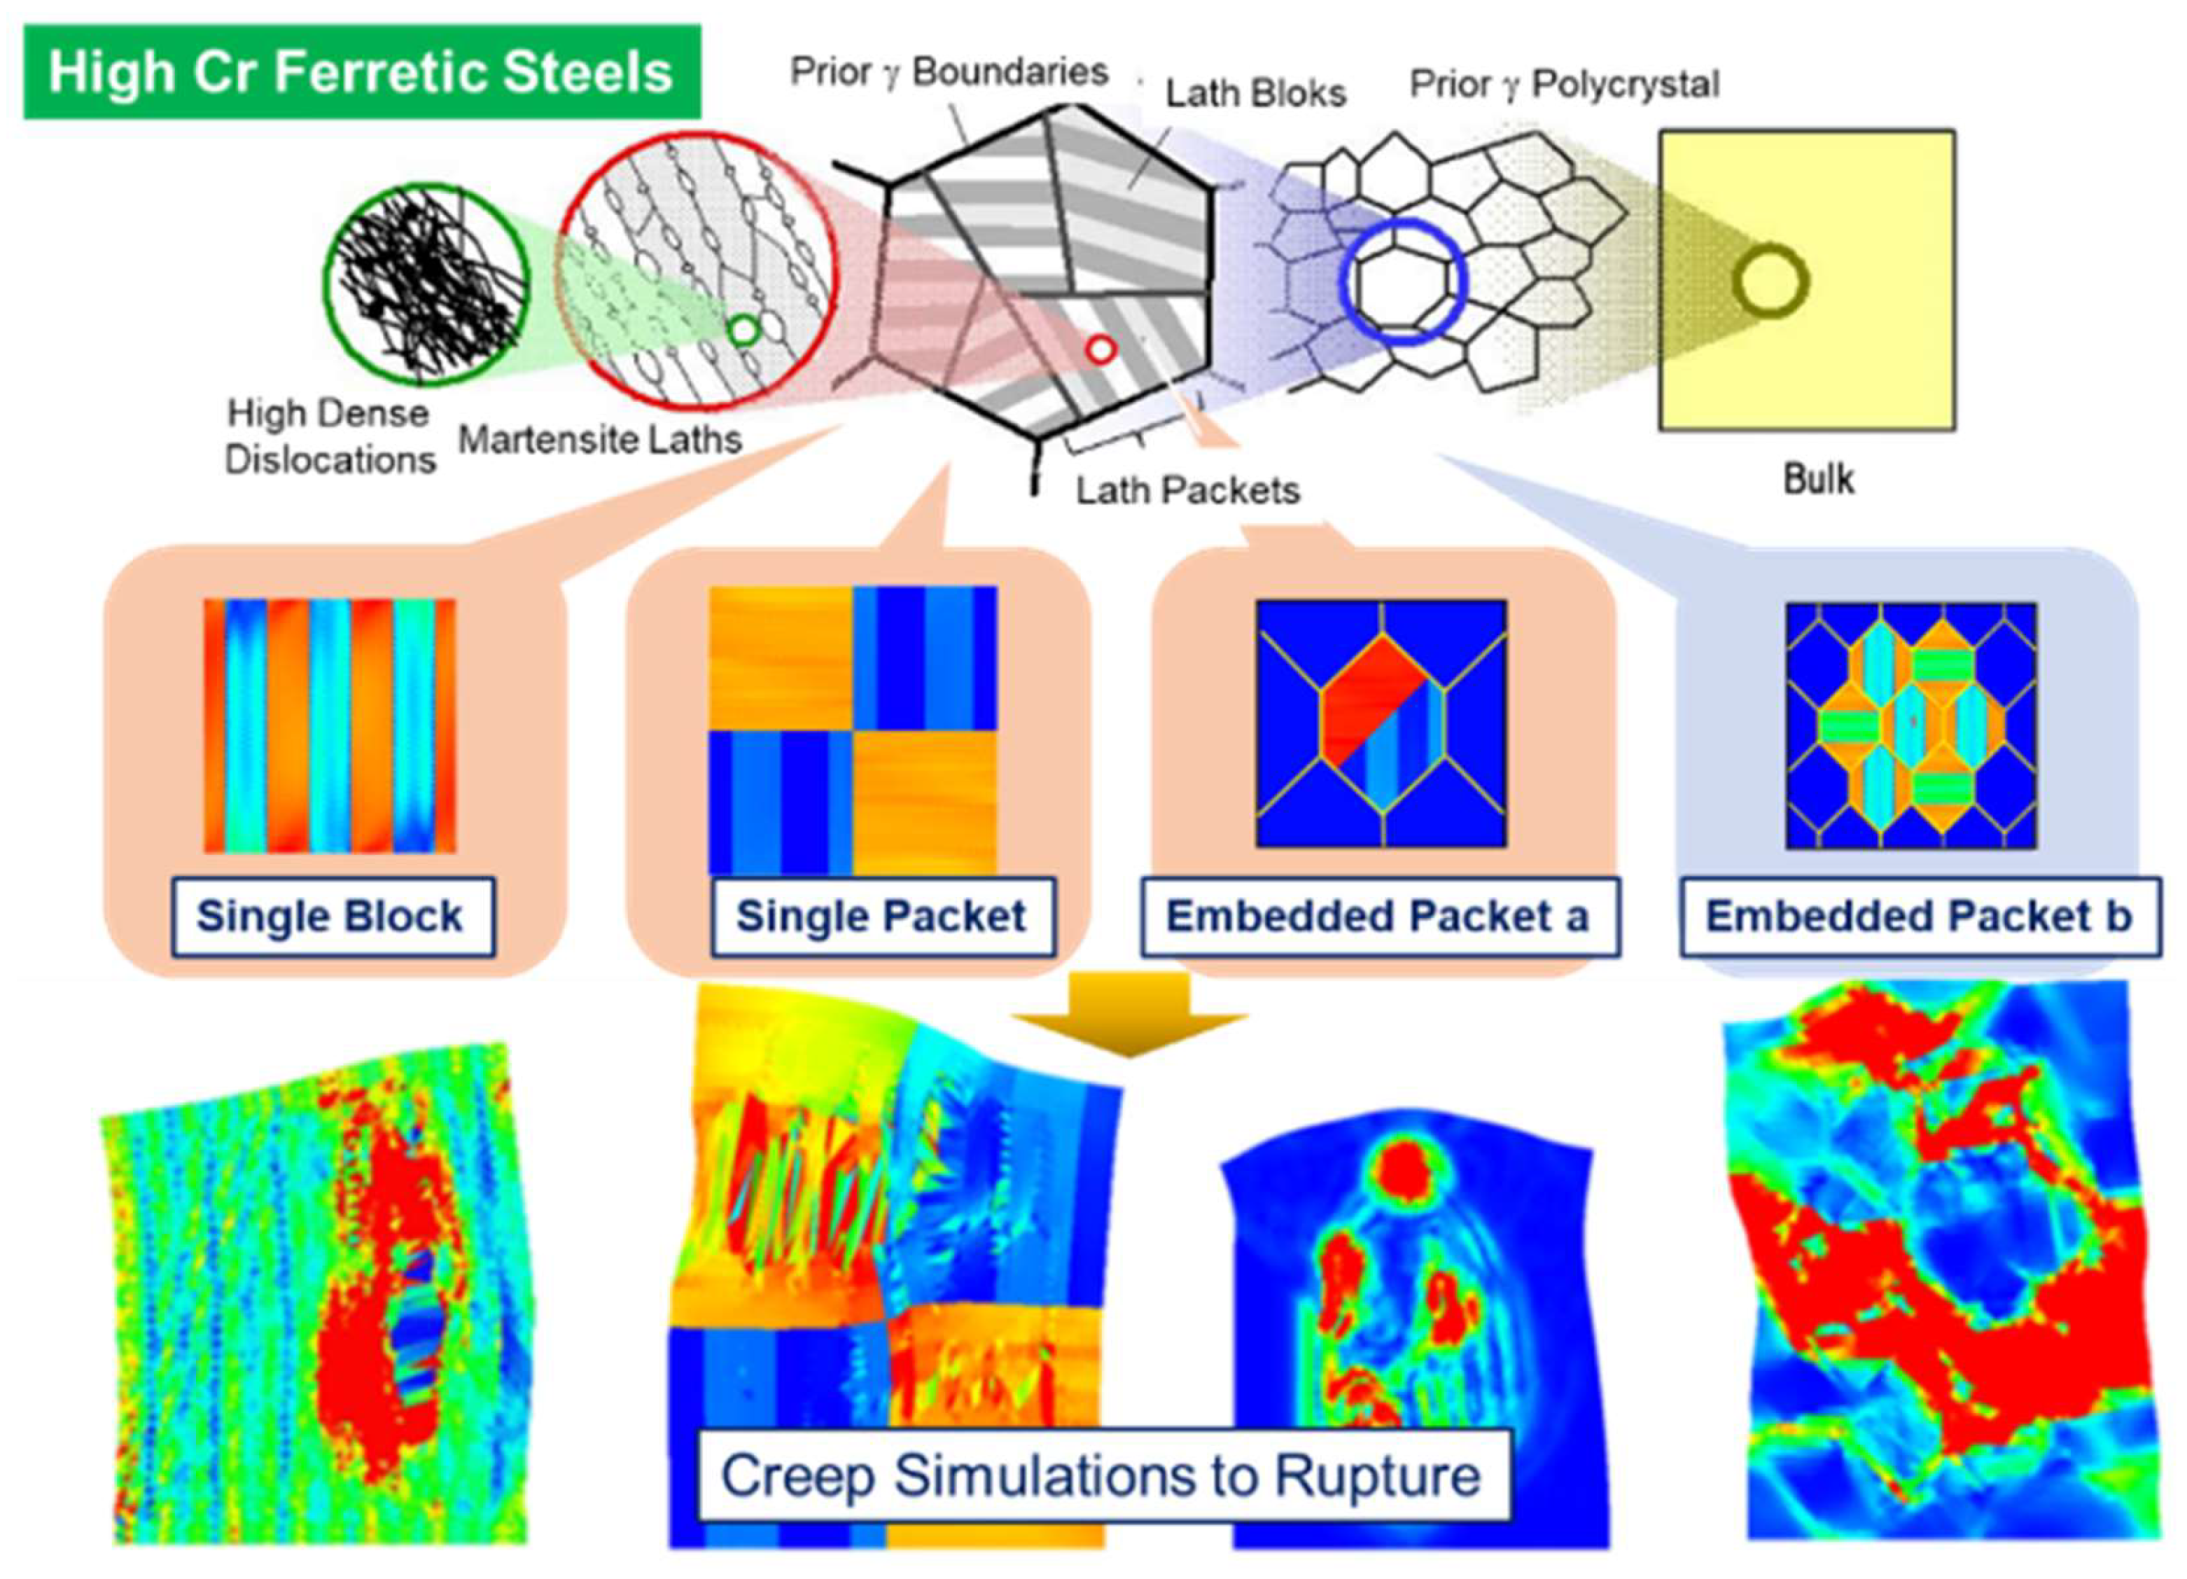
One of the powerful features of FTMP is its ability to utilize evolved patterns for further modeling through “cut-and-paste” operations, leveraging its robust descriptive capability. This process involves transferring information about the plastic distortion tensor , which enables the reproduction of both the dislocation density tensor and incompatibility tensor fields. We refer to the concept underlying this methodology as Di-CAP, which stands for Deformation-induced Context-dependent Autonomic Pluripotency, as illustrated in Figure A1. A typical example of this approach is its application to modeling hierarchical martensite lath structures for creep analyses. Complex lath martensite structures can be computationally constructed by combining unit lath block structures like building blocks, as illustrated in Figure A2. The present study employs this Di-CAP concept for the restart analyses.
Figure A1.
Schematics illustrating the Di-CAP concept and subsequent modeling/analyses based on arbitrary “cut-and-paste” operations.
Figure A1.
Schematics illustrating the Di-CAP concept and subsequent modeling/analyses based on arbitrary “cut-and-paste” operations.
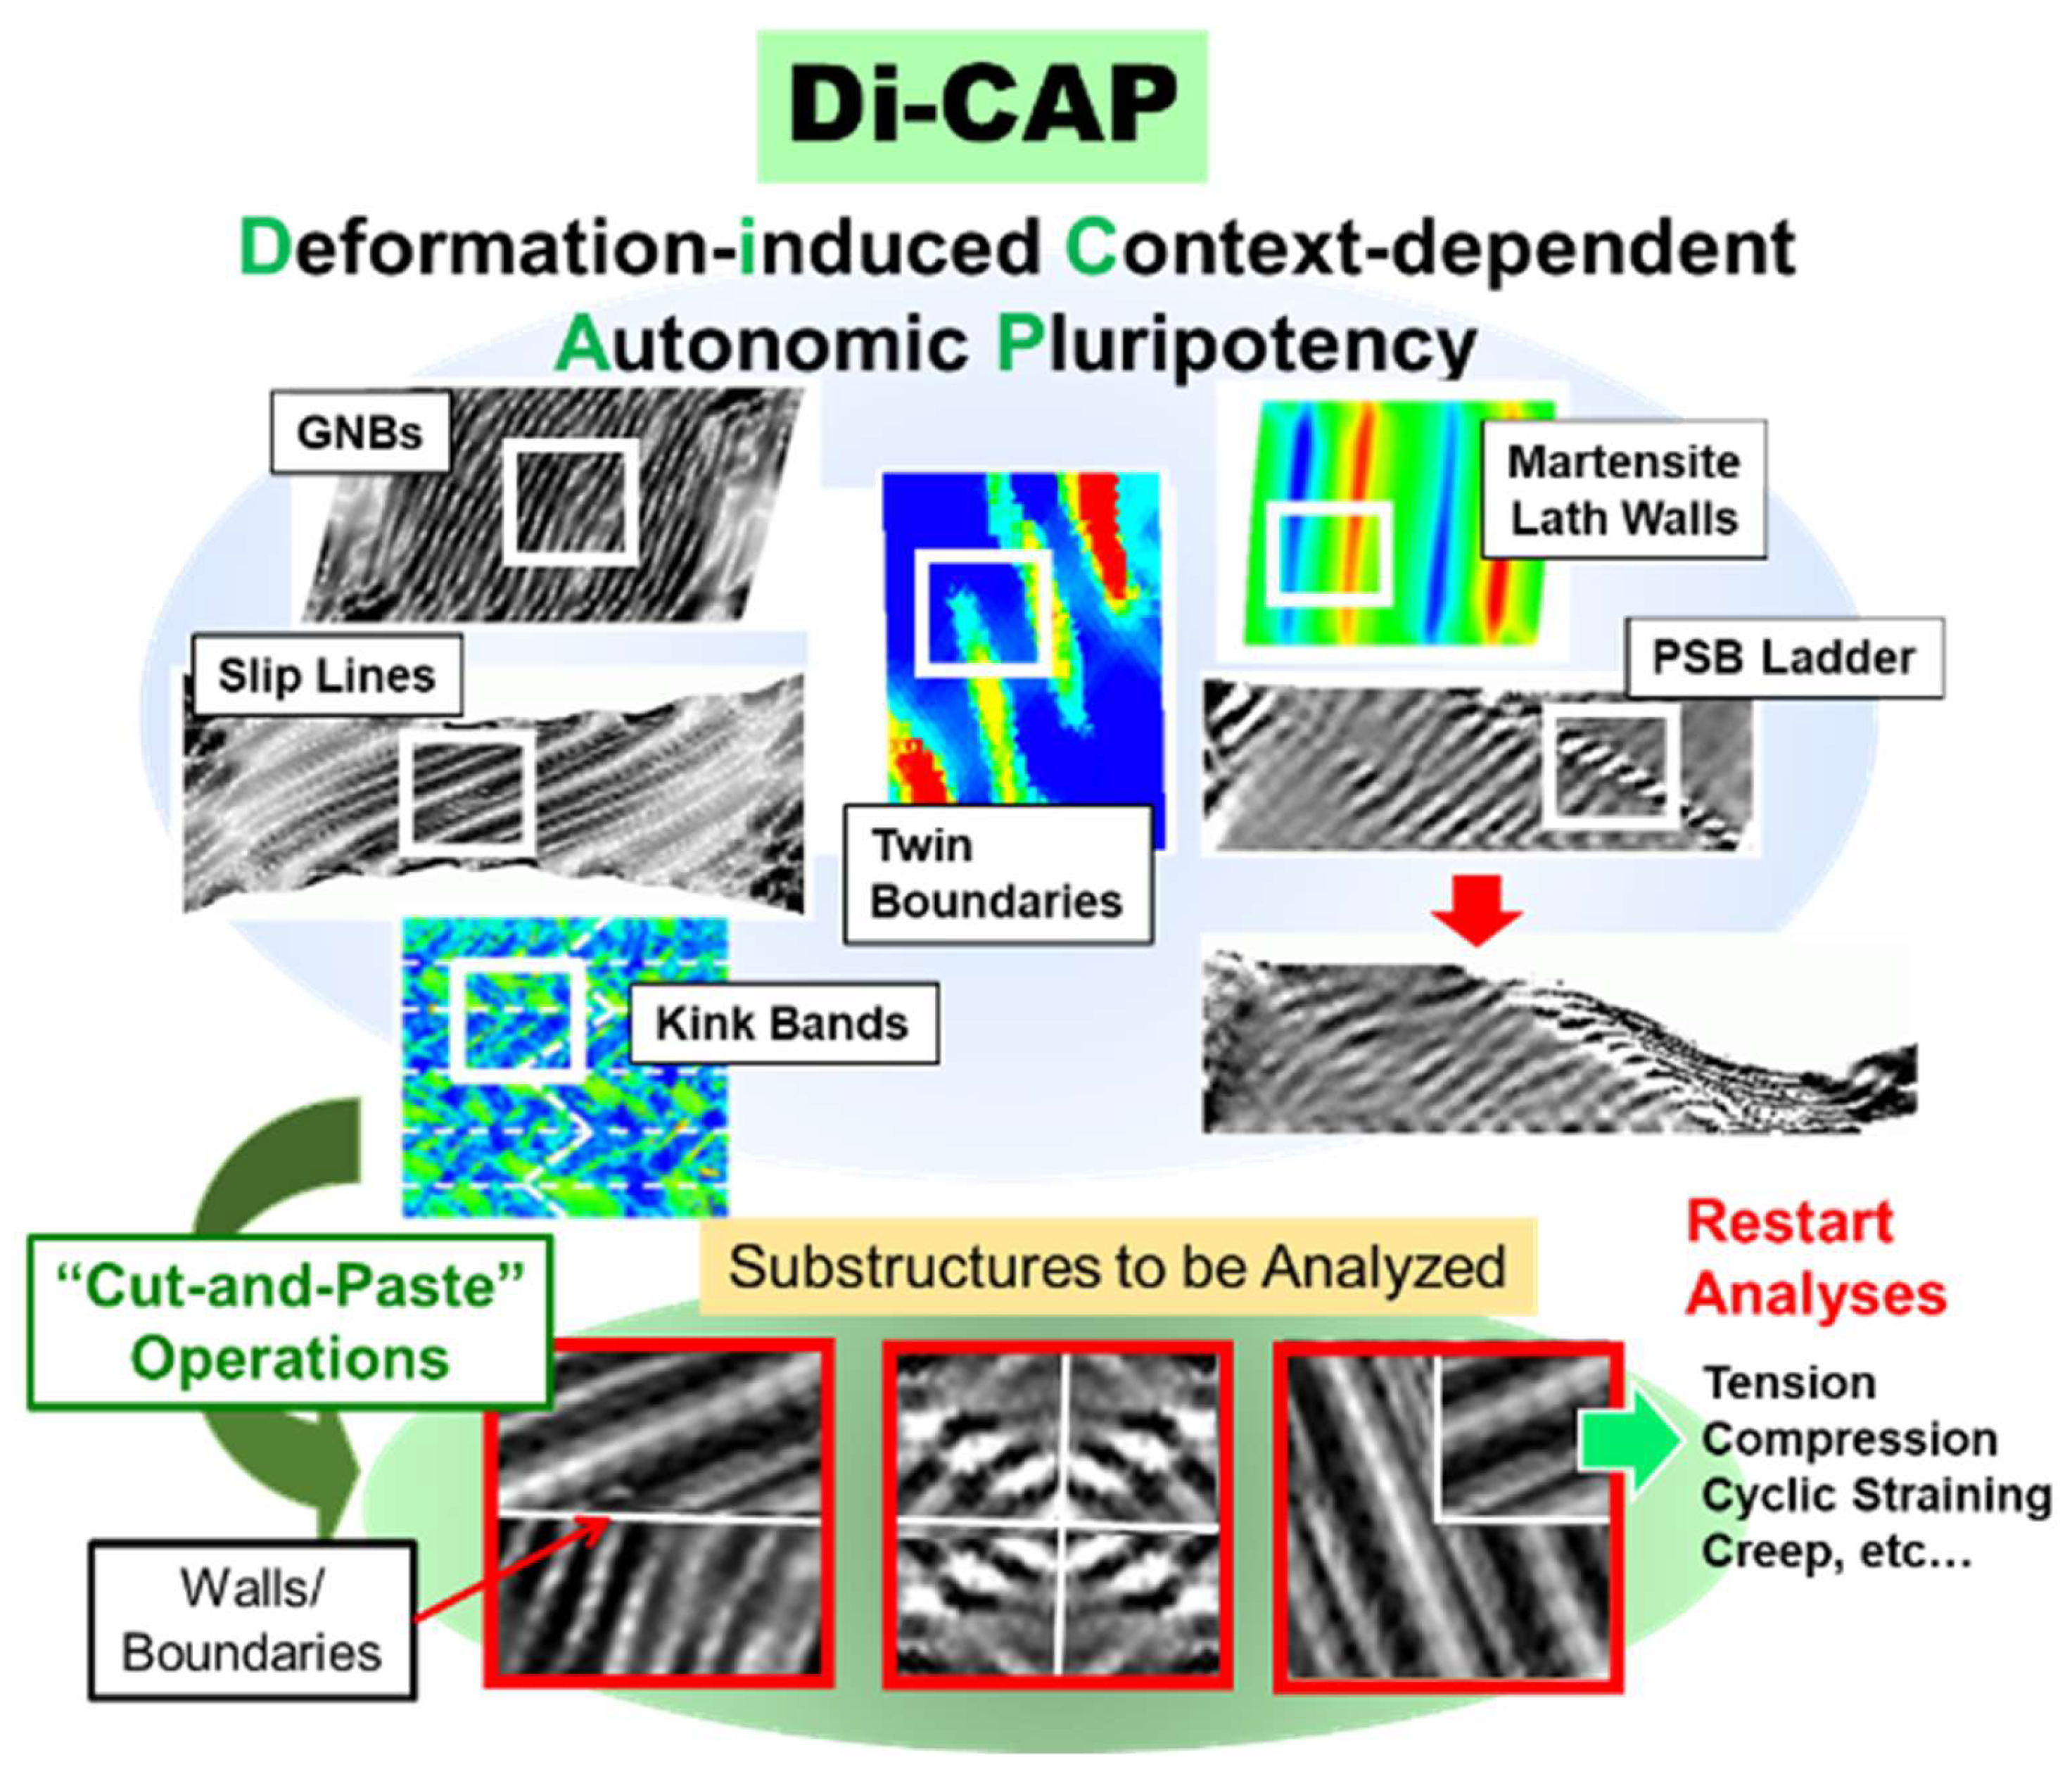
Figure A2.
Representative example of the application of the Di-CAP concept from Figure A1, demonstrating the fabrication of hierarchical structures in a building block-like manner to model complex lath martensite-based steels for subsequent creep analyses.
Figure A2.
Representative example of the application of the Di-CAP concept from Figure A1, demonstrating the fabrication of hierarchical structures in a building block-like manner to model complex lath martensite-based steels for subsequent creep analyses.
References
- Boehme, F.; Hidaka, K.; Weertman, J. R. PSB Observation in Copper Fatigued at One Half the Melting Temperature. Scr. metall. mater. 1990, 24(12), 2341–2346. [CrossRef]
- Mughrabi, H. Introduction to the Viewpoint Set on: Surface Effects in Cyclic Deformation and Fatigue. Scr. metall. mater. 1992, 26(10), 1499–1504. [CrossRef]
- Mughrabi, H.; Ungar, T.; Kienle, W.; Wilkens, M. Long-Range Internal Stress and Asymmetric X-Ray Line Broadening in Tensile Deformed [001]-Oriented Copper Single Crystals, Phil. Mag. A 1986, 53(6), 793-813. [CrossRef]
- Repetto, E.; Ortiz, M. A Micromechanical Model of Cyclic Deformation and Fatigue-Crack Nucleation in f.c.c. Single Crystals. Acta Mater. 1997, 45(6), 2577–2595. [CrossRef]
- Zhao, Z.; Ramesh, M.; Raabe, D.; Cuitiño, A. M.; Radovitzky, R. Investigation of Three-Dimensional Aspects of Grain-Scale Plastic Surface Deformation of an Aluminum Oligocrystal. IJP 2008, 24, 2278–2297. [CrossRef]
- Sumikawa, T.; Wada, T.; Hashimoto, S.; Kitamura, T. Effect of Interface Boundary on Slip Behavior in the High Cycle Fatigue : Analysis of Slip in Two-Phase (α/γ) Stainless Steel Bicrystal. Trans. Jpn. Soc. Mech. Eng. 2001, 67(656), 732-739. [CrossRef]
- Hasebe, T. Field Theory of Multiscale Plasticity, 1st ed; Cambridge Univ. Press, Cambridge, UK 2024. [CrossRef]
- Hasebe, T. Interaction Fields Based on Incompatibility Tensor in Field Theory of Plasticity-Part I: Theory. IMMIJ 2009, 2(1), 1–14. [CrossRef]
- Hasebe, T. Interaction Fields Based on Incompatibility Tensor in Field Theory of Plasticity-Part II: Application. IMMIJ 2009, 2(1), 15–30. [CrossRef]
- Hasebe, T.; Sugiyama, M.; Adachi, H.; Fukutani, S.; Iida, M. Modeling and Simulations of Experimentally-Observed Dislocation Substructures Based on Field Theory of Multiscale Plasticity (FTMP) Combined with TEM and EBSD-Wilkinson Method for FCC and BCC Poly/Single Crystals. Mater. Trans. 2014, 55(5), 779–787. [CrossRef]
- Hasebe, T. Field Theoretical Multiscale Modeling of Polycrystal Plasticity. Trans. MRS-J 2004, 29, 3619–3624.
- Hasebe, T. Multiscale Crystal Plasticity Modeling based on Field Theory. CMES 2006, 11, 145–156. [CrossRef]
- Polák, J. Role of Persistent Slip Bands and Persistent Slip Markings in Fatigue Crack Initiation in Polycrystals. Crystals 2023, 13 (2), 220. [CrossRef]
- Polák, J.; Man, J. Fatigue Crack Initiation – The Role of Point Defects. Int. J. Fatigue 2014, 65, 18–27. [CrossRef]
- Essmann, U.; Gösele, U.; Mughrabi, H. A Model of Extrusions and Intrusions in Fatigued Metals I. Point-Defect Production and the Growth of Extrusions. Philo. Mag. A 1981, 44(2), 405–426. [CrossRef]
- Nakai, Y. Evaluation of Fatigue Damage and Fatigue Crack Initiation Process by Means of Atomic-Force Microscopy. J. Soc. Mater. Sci. Jpn. 2001, 50(6Appendix), 73–81. [CrossRef]
- Nakai, Y.; Kusukawa, T. Quantitative Evaluation of Slip-Band Growth and Crack Initiation in Fatigue of 70-30 Brass by Means of Atomic-Force Microscopy. Trans. Jpn. Soc. Mech. Eng. 2001, 67(655), 476-482. [CrossRef]
- Nakai, Y.; Maeda, K. Observations of fatigue Slip-Band Growth and Crack Initiation in α-Brass under Cyclic Shear Stresses by Means of Atomic-Force Microscopy. J. Mater. Sci. Soc. Jpn. 2003, 52(6), 625-630. [CrossRef]
- Ihara, S.; Kojima, N.; Hasebe, T. FTMP-Based Approach toward Dislocation Dynamics of PSB. Int. J. Multiphys. 2021, 15(2). [CrossRef]
Figure 1.
Overview of the present simulation.
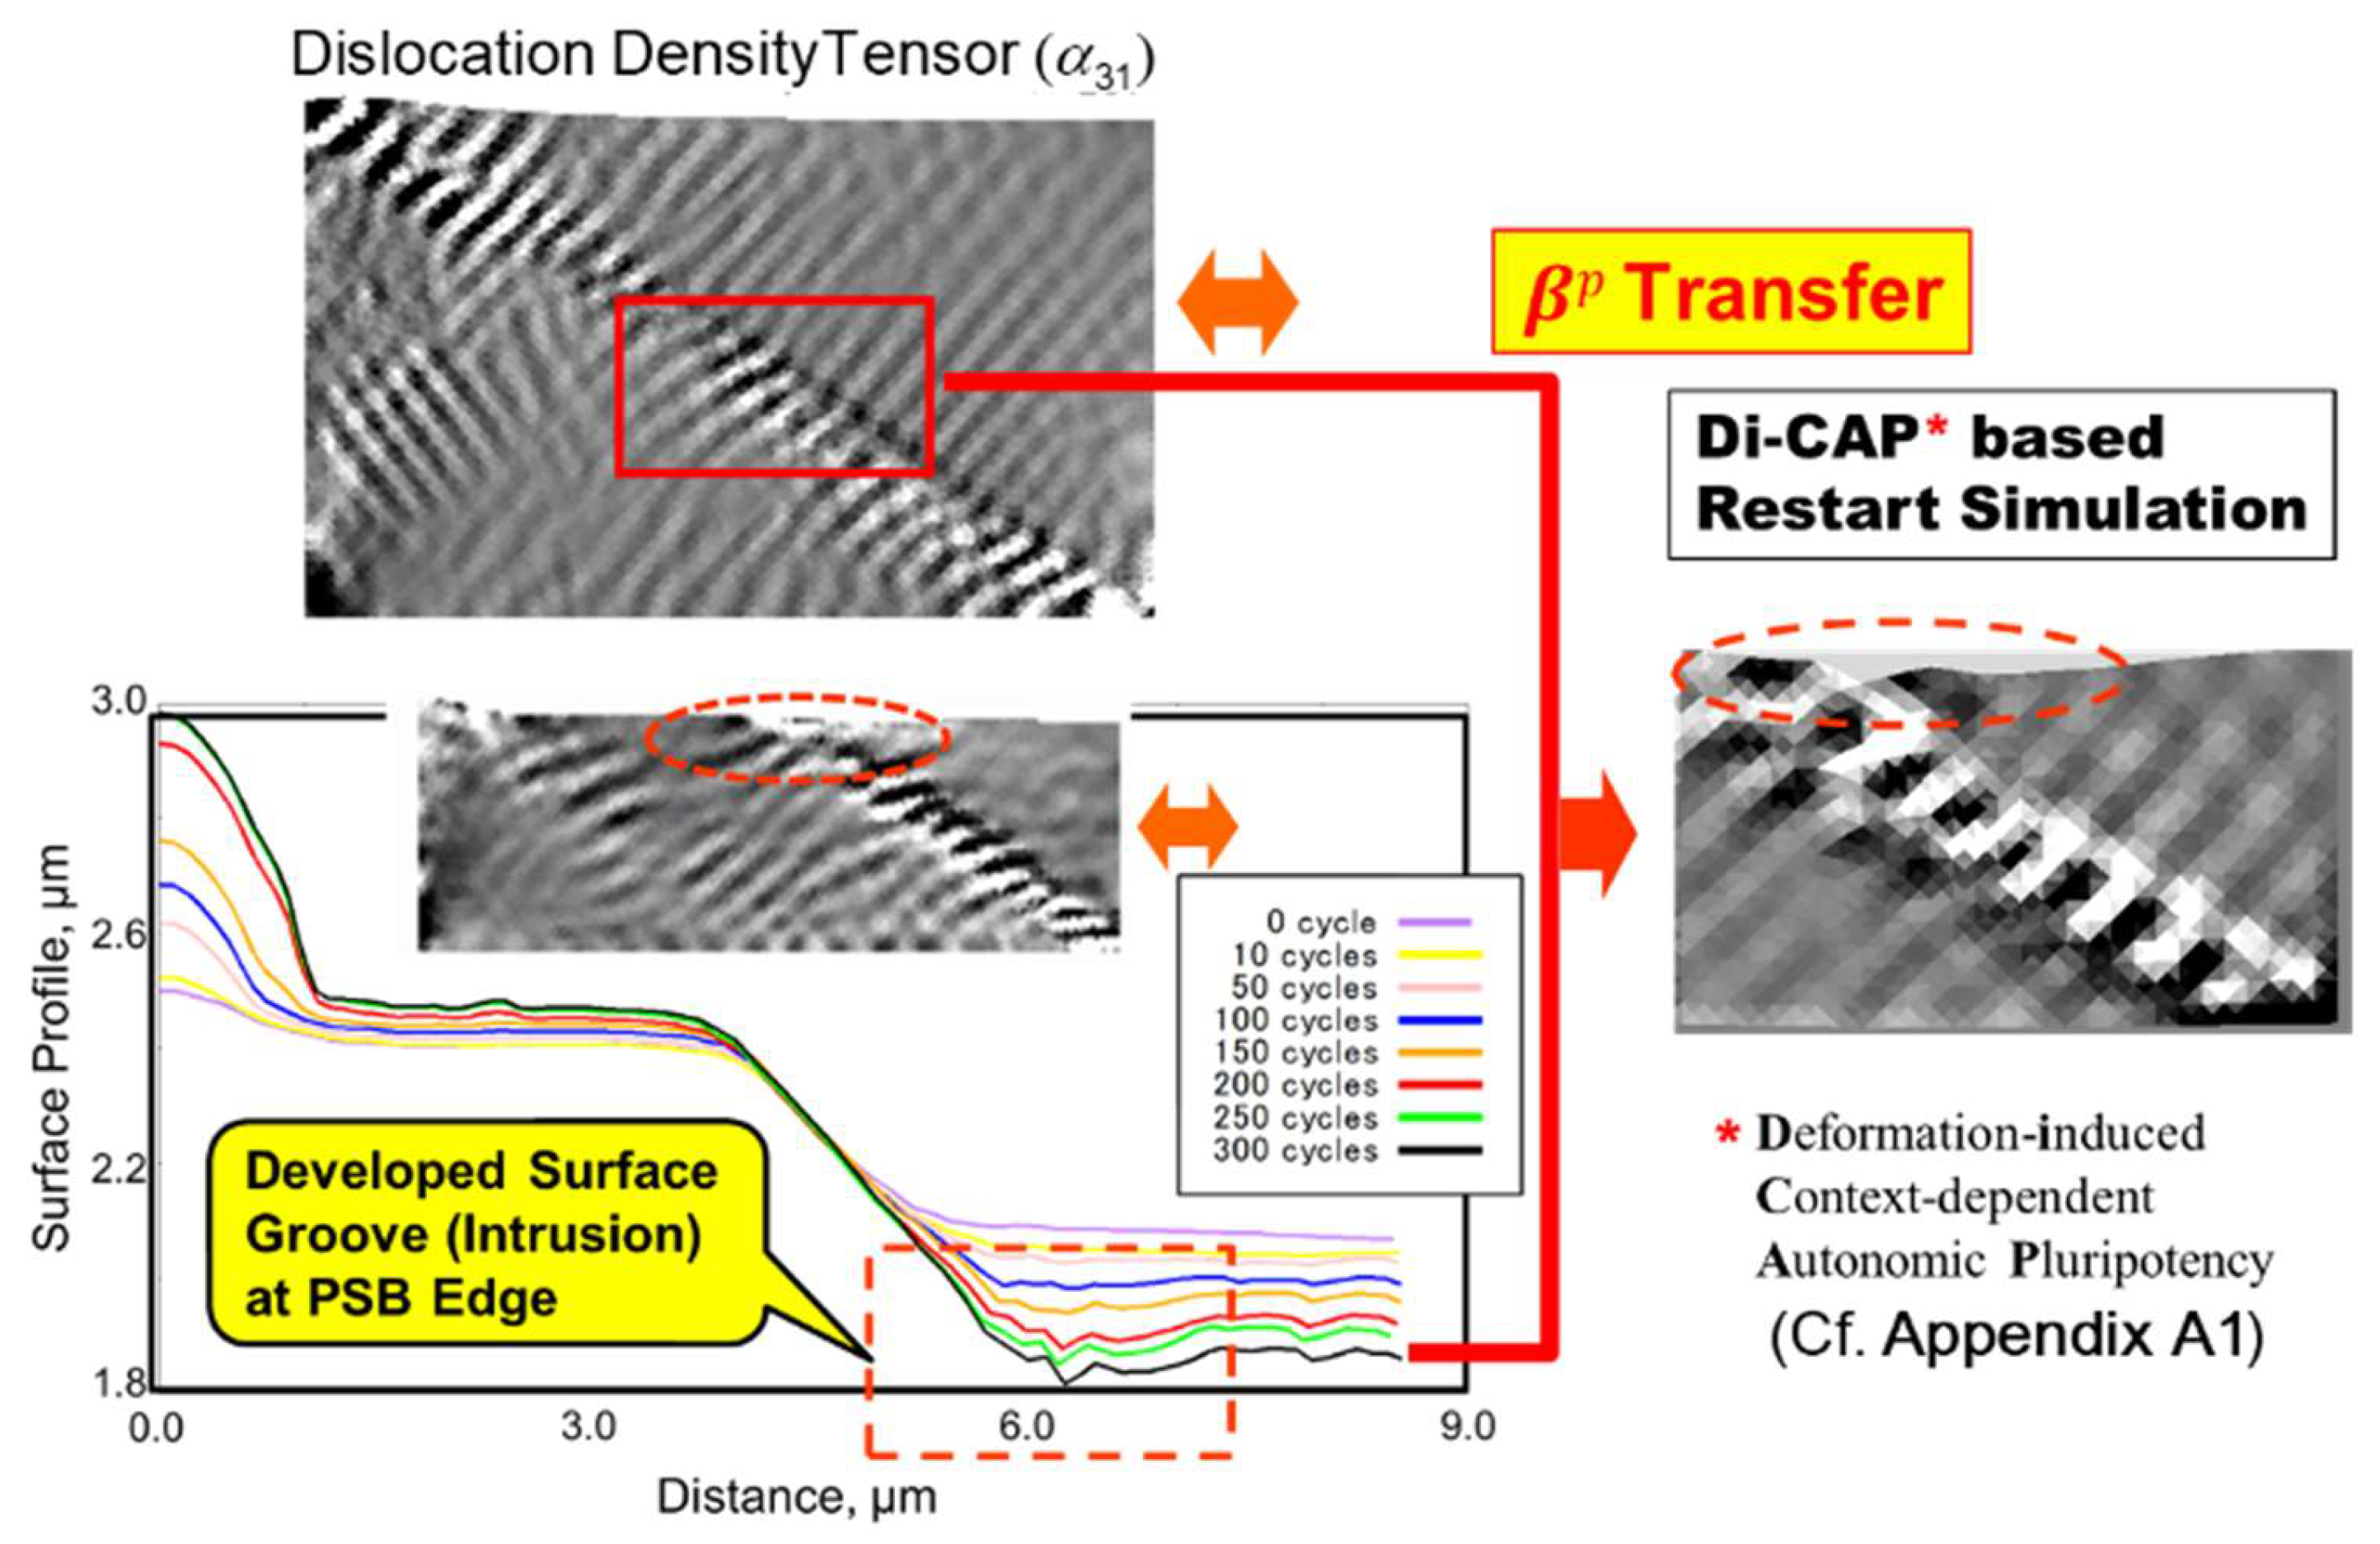
Figure 2.
Schematics for diffusion analysis coupled with CP-FEM simulation.
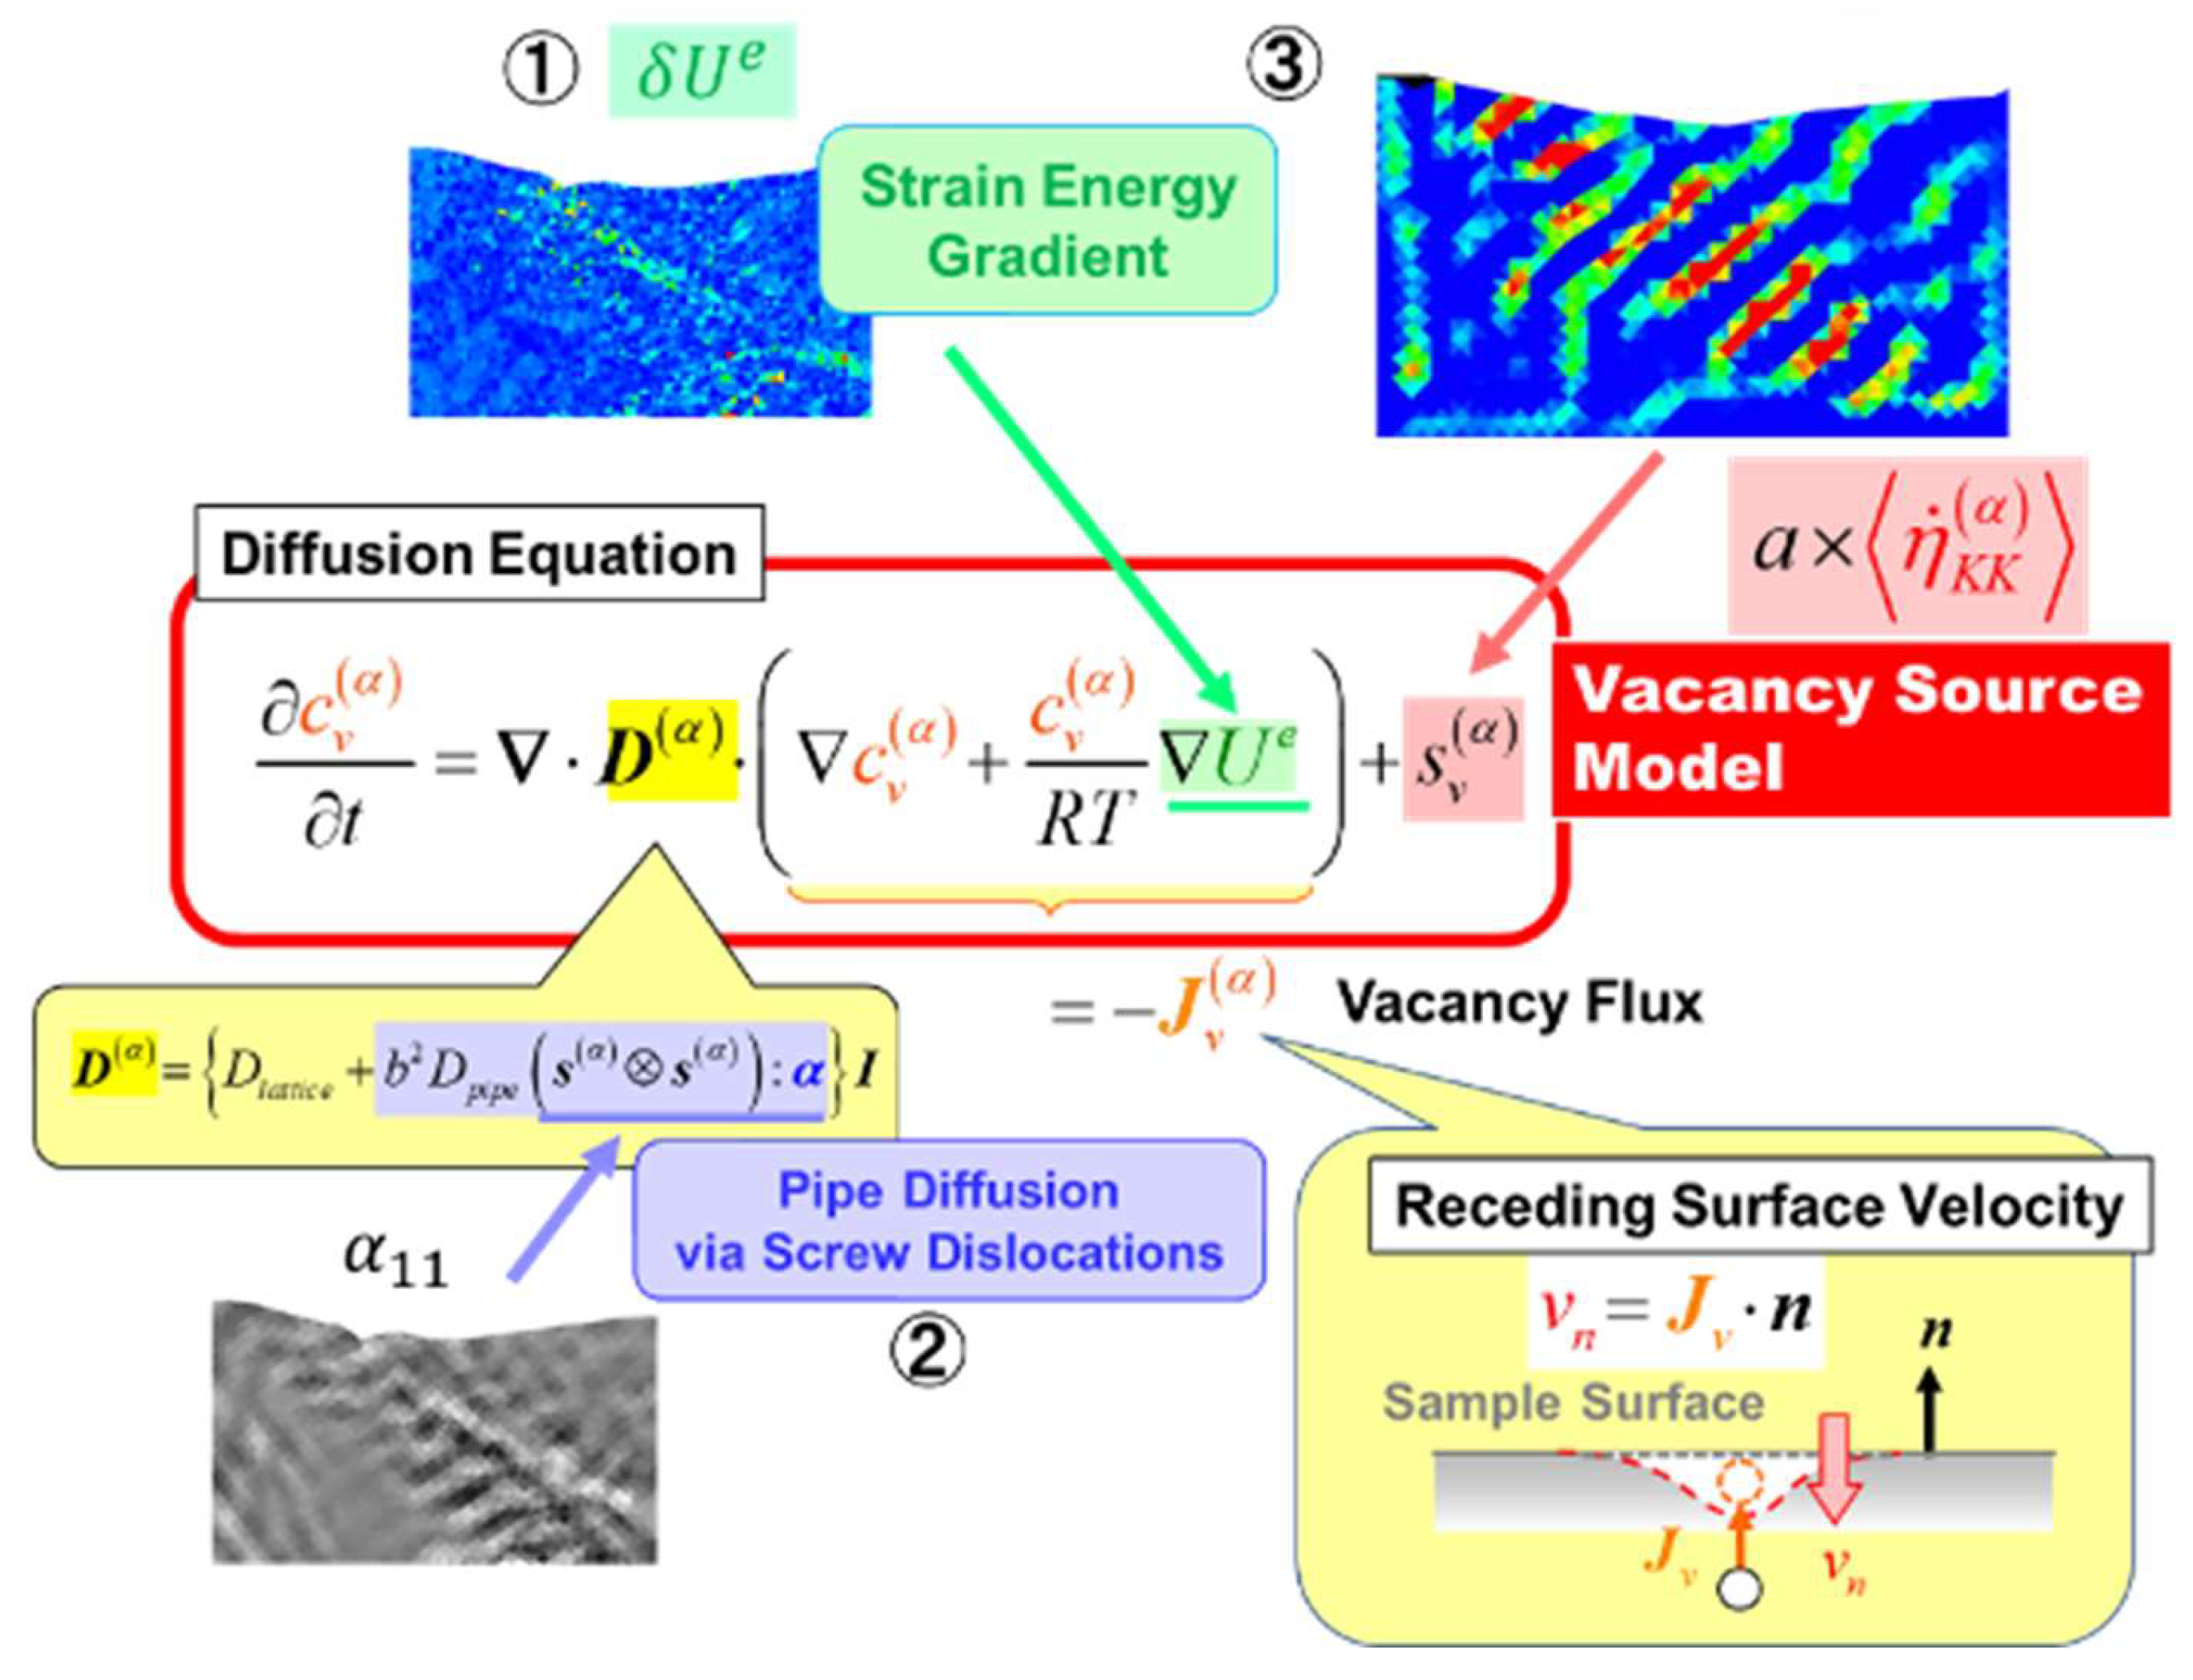
Figure 3.
(a). Extended comparison of phase-space trajectories (PhS-Ts) obtained from dislocation dynamics (DD) simulations and the current finite element (FE) analysis. The DD simulation reveals that the incompatibility rate can effectively account for the number of debris loops of dislocations (vacancy type with edge character) formed within the channels during the back-and-forth motion of screw dislocations (extreme left) [19]. (b). Effect of cross-slip frequency on debris loop formation in the channel region of the PSB ladder structure, resulting from interactions among screw segments that are bowed out from the edge wall. The detailed process for debris loop formation is illustrated below, highlighting several annihilation processes that contribute to it.
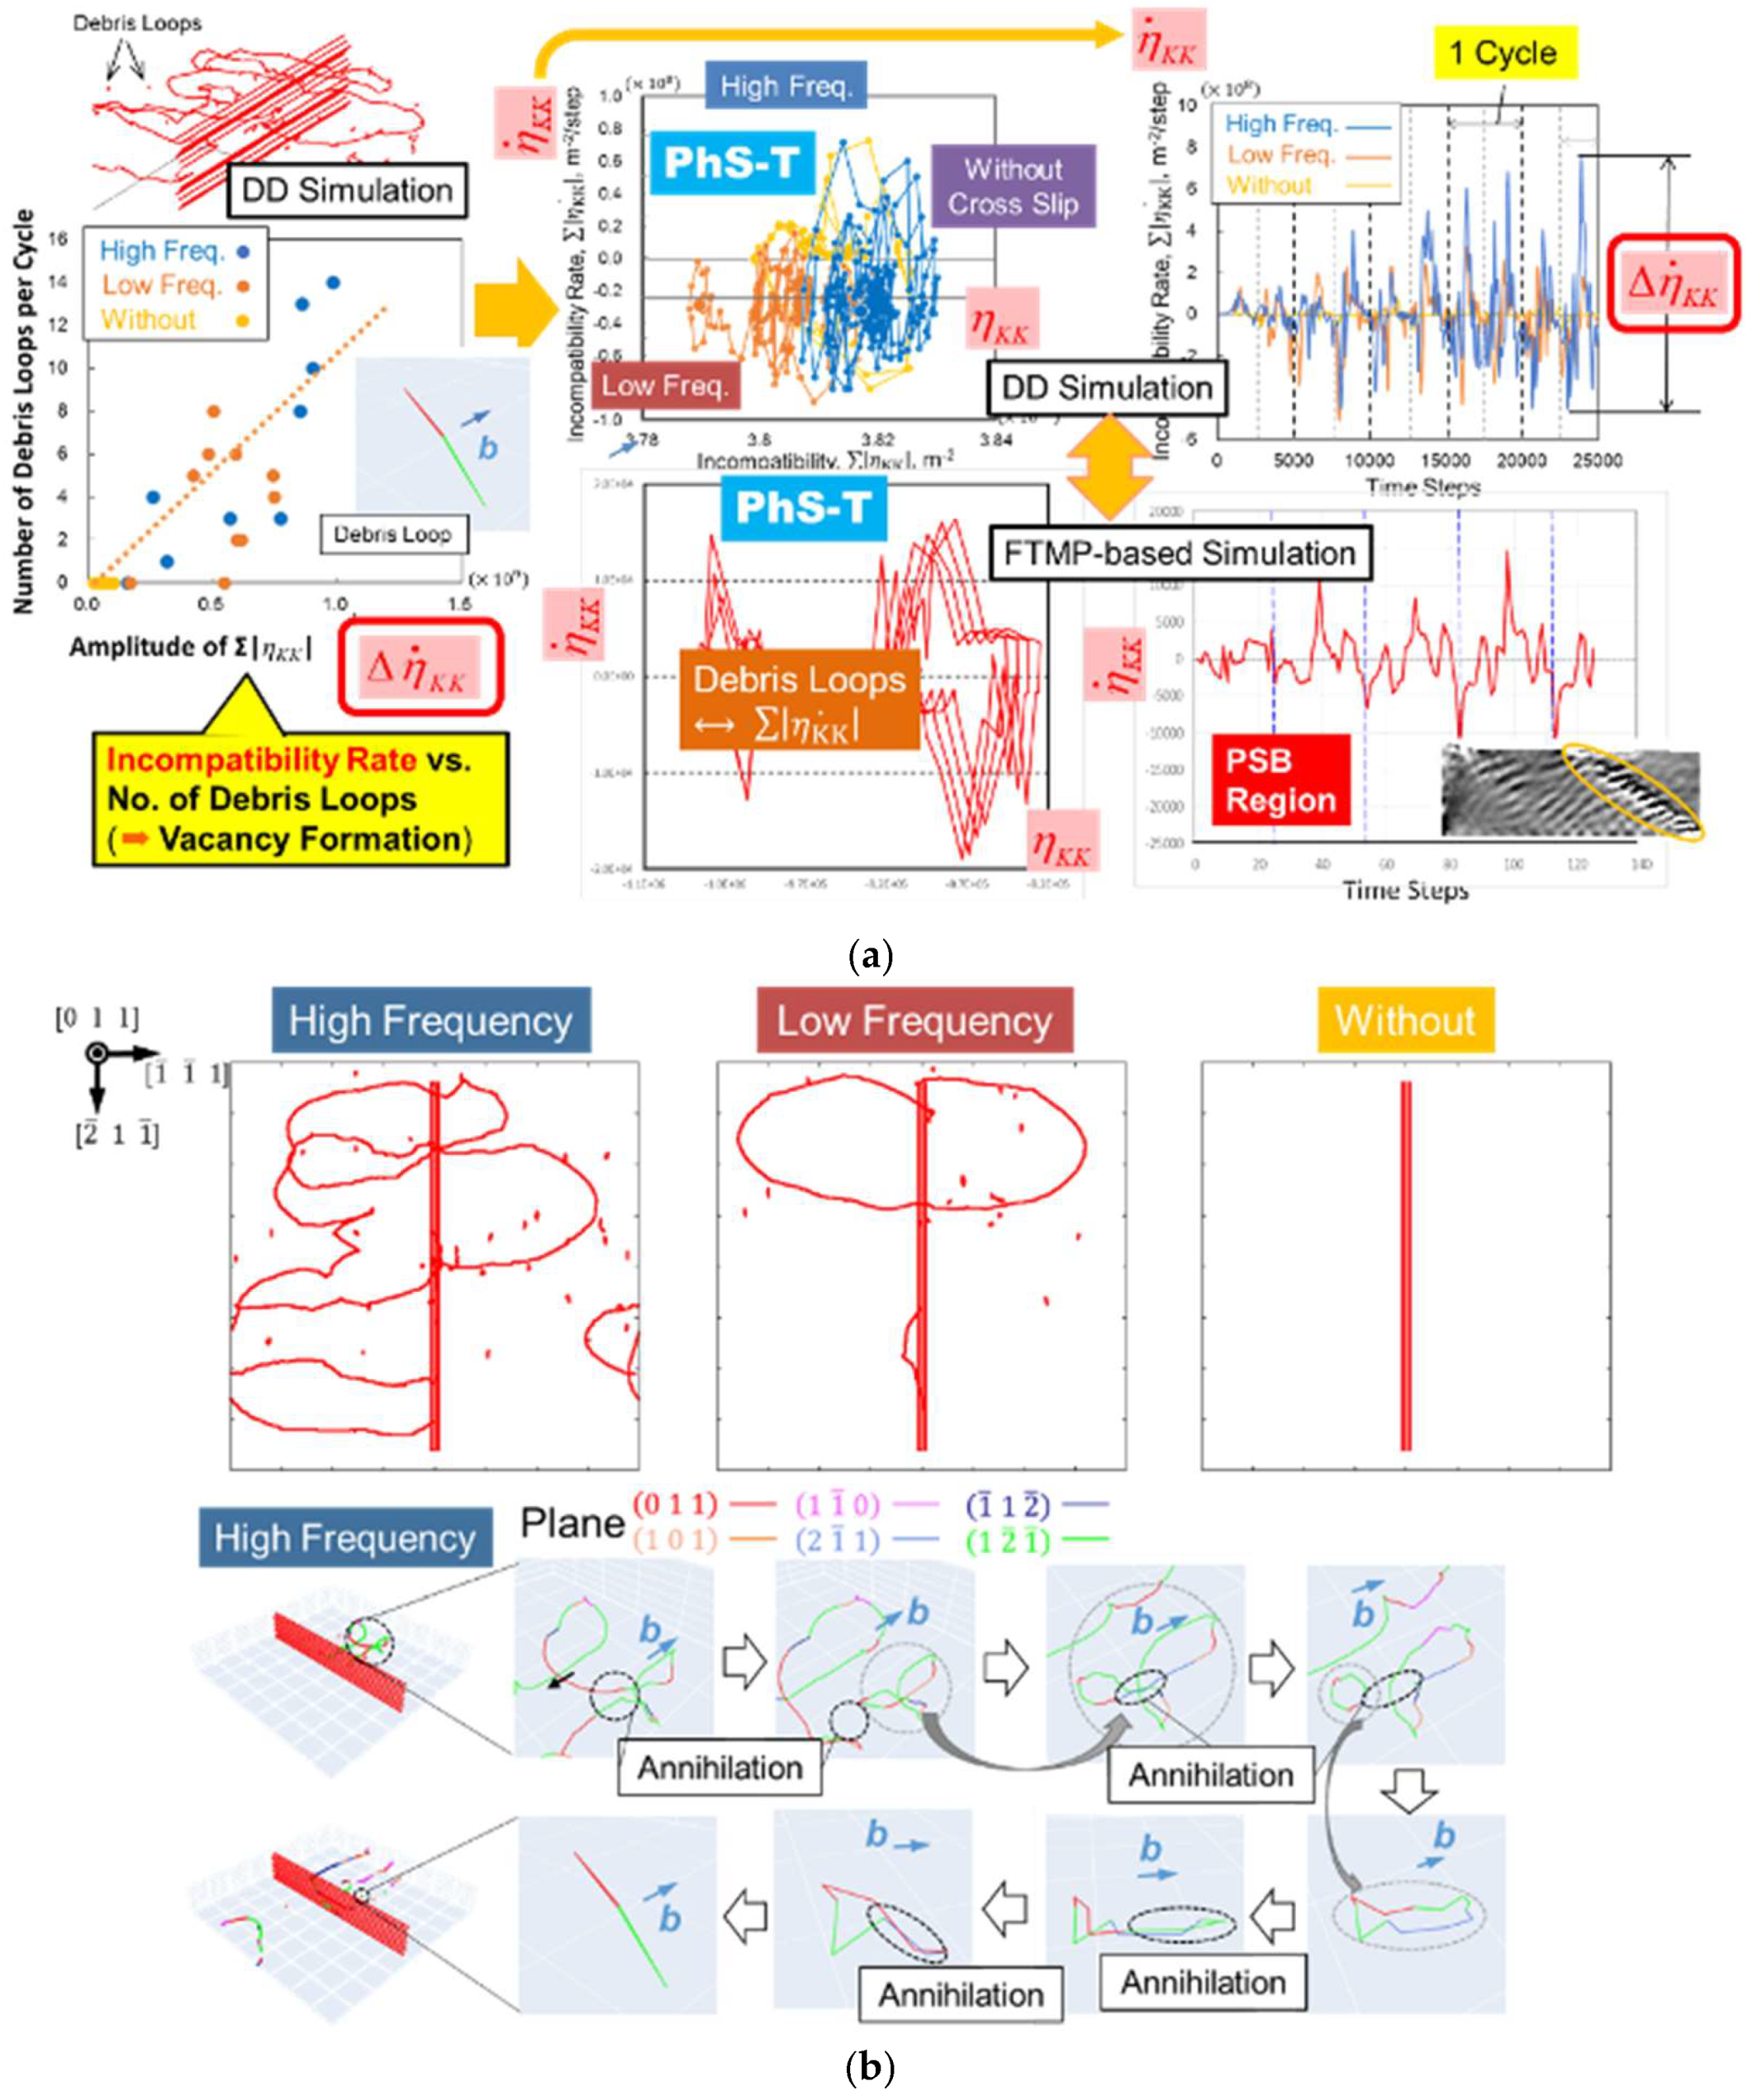
Figure 4.
Analytical models for CP-FEM and diffusion analyses, accompanied by schematics that illustrate the information transfer process between the two methods.
Figure 4.
Analytical models for CP-FEM and diffusion analyses, accompanied by schematics that illustrate the information transfer process between the two methods.
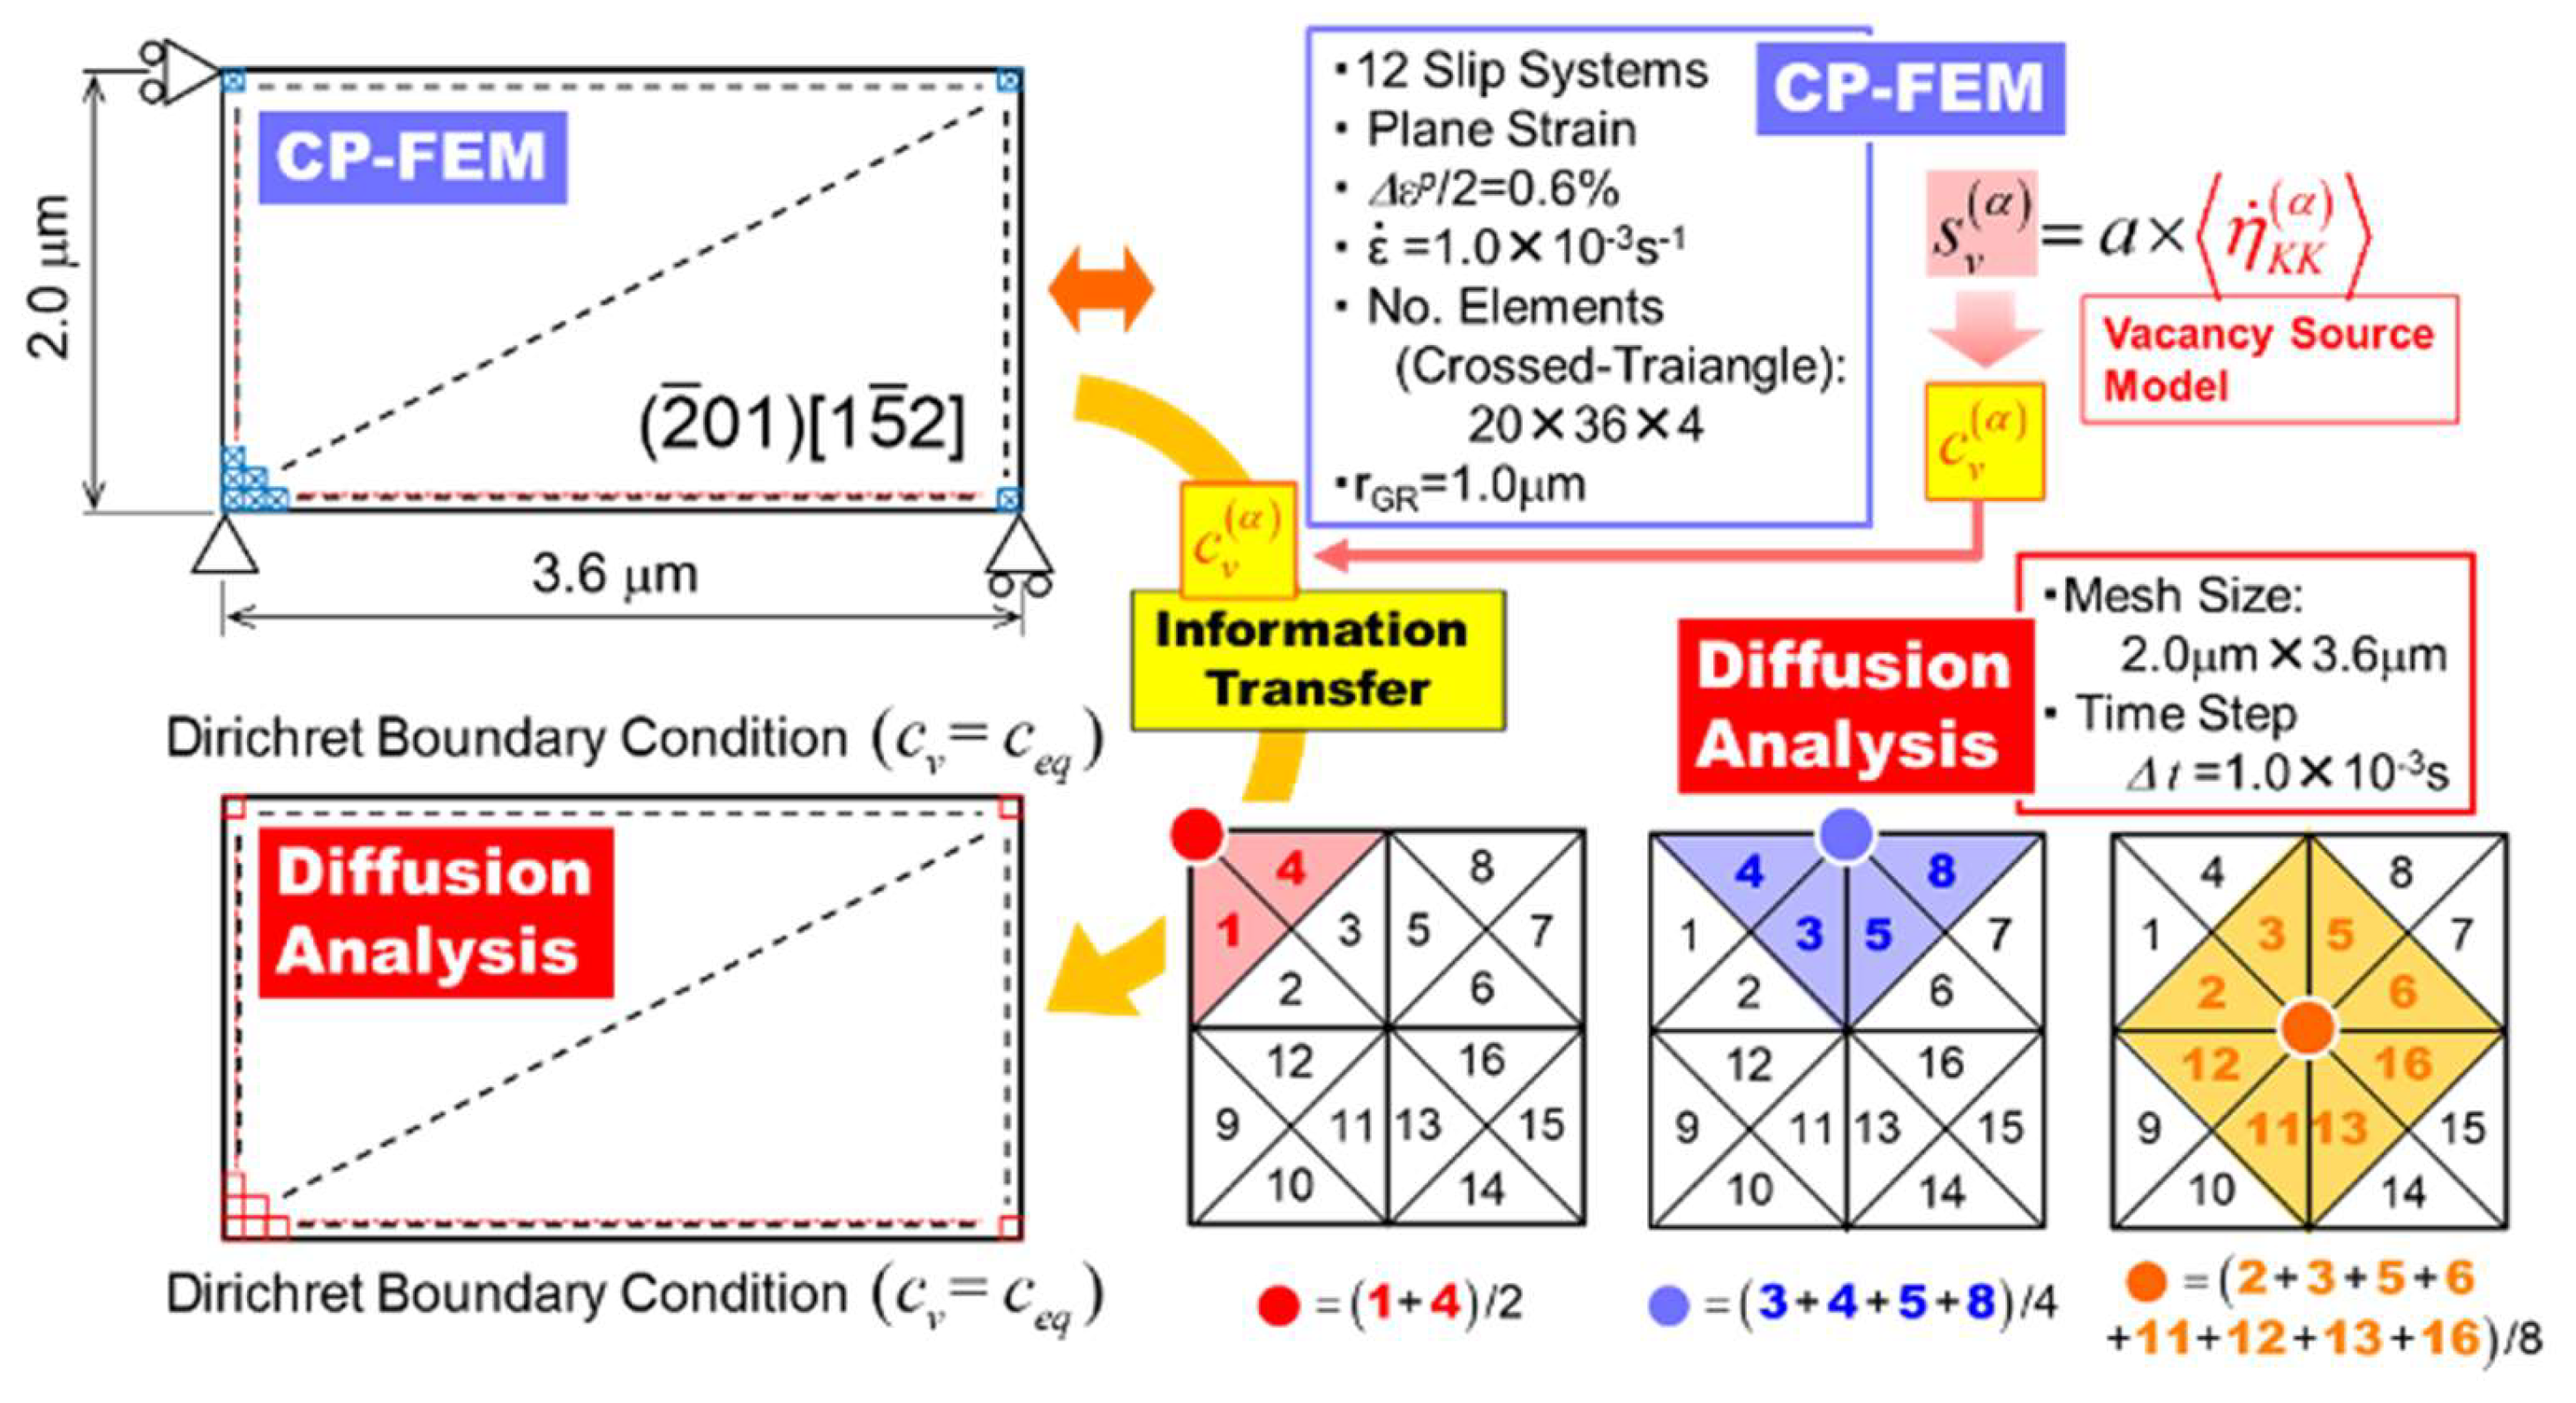
Figure 5.
Results for indirect CP-FEM-diffusion coupling analyses toward groove-crack transition process using the proposed vacancy production model.
Figure 5.
Results for indirect CP-FEM-diffusion coupling analyses toward groove-crack transition process using the proposed vacancy production model.
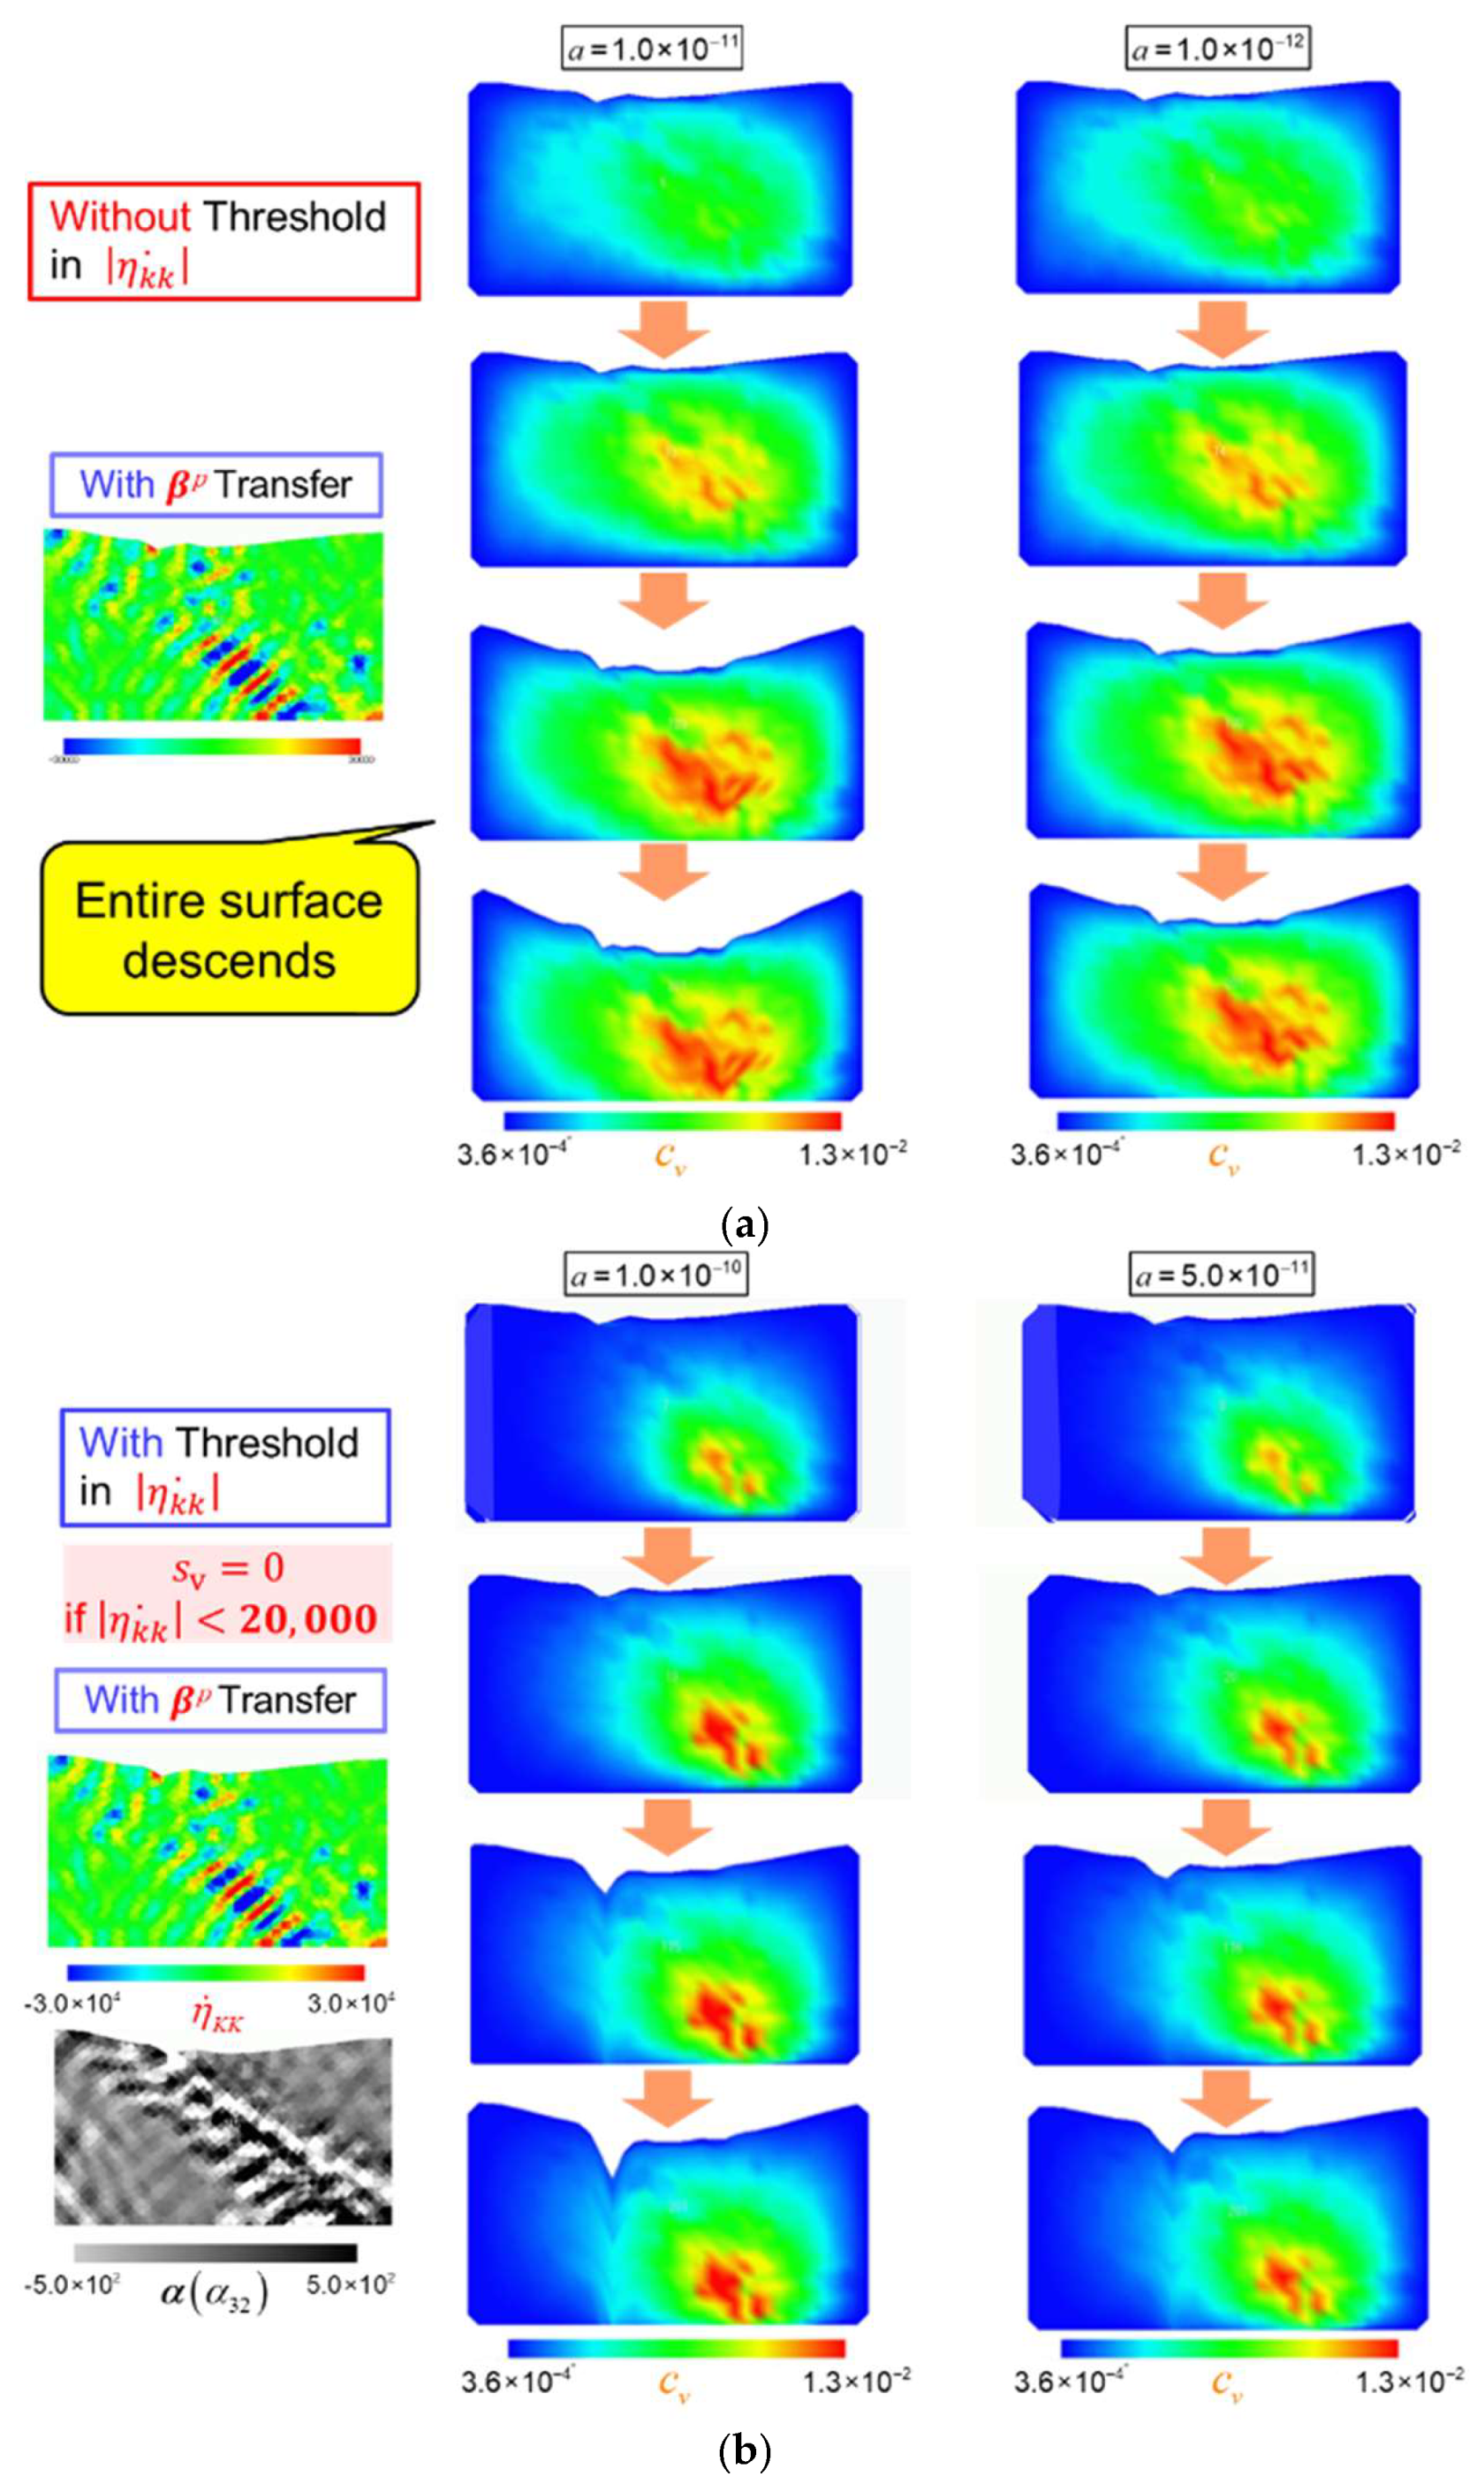
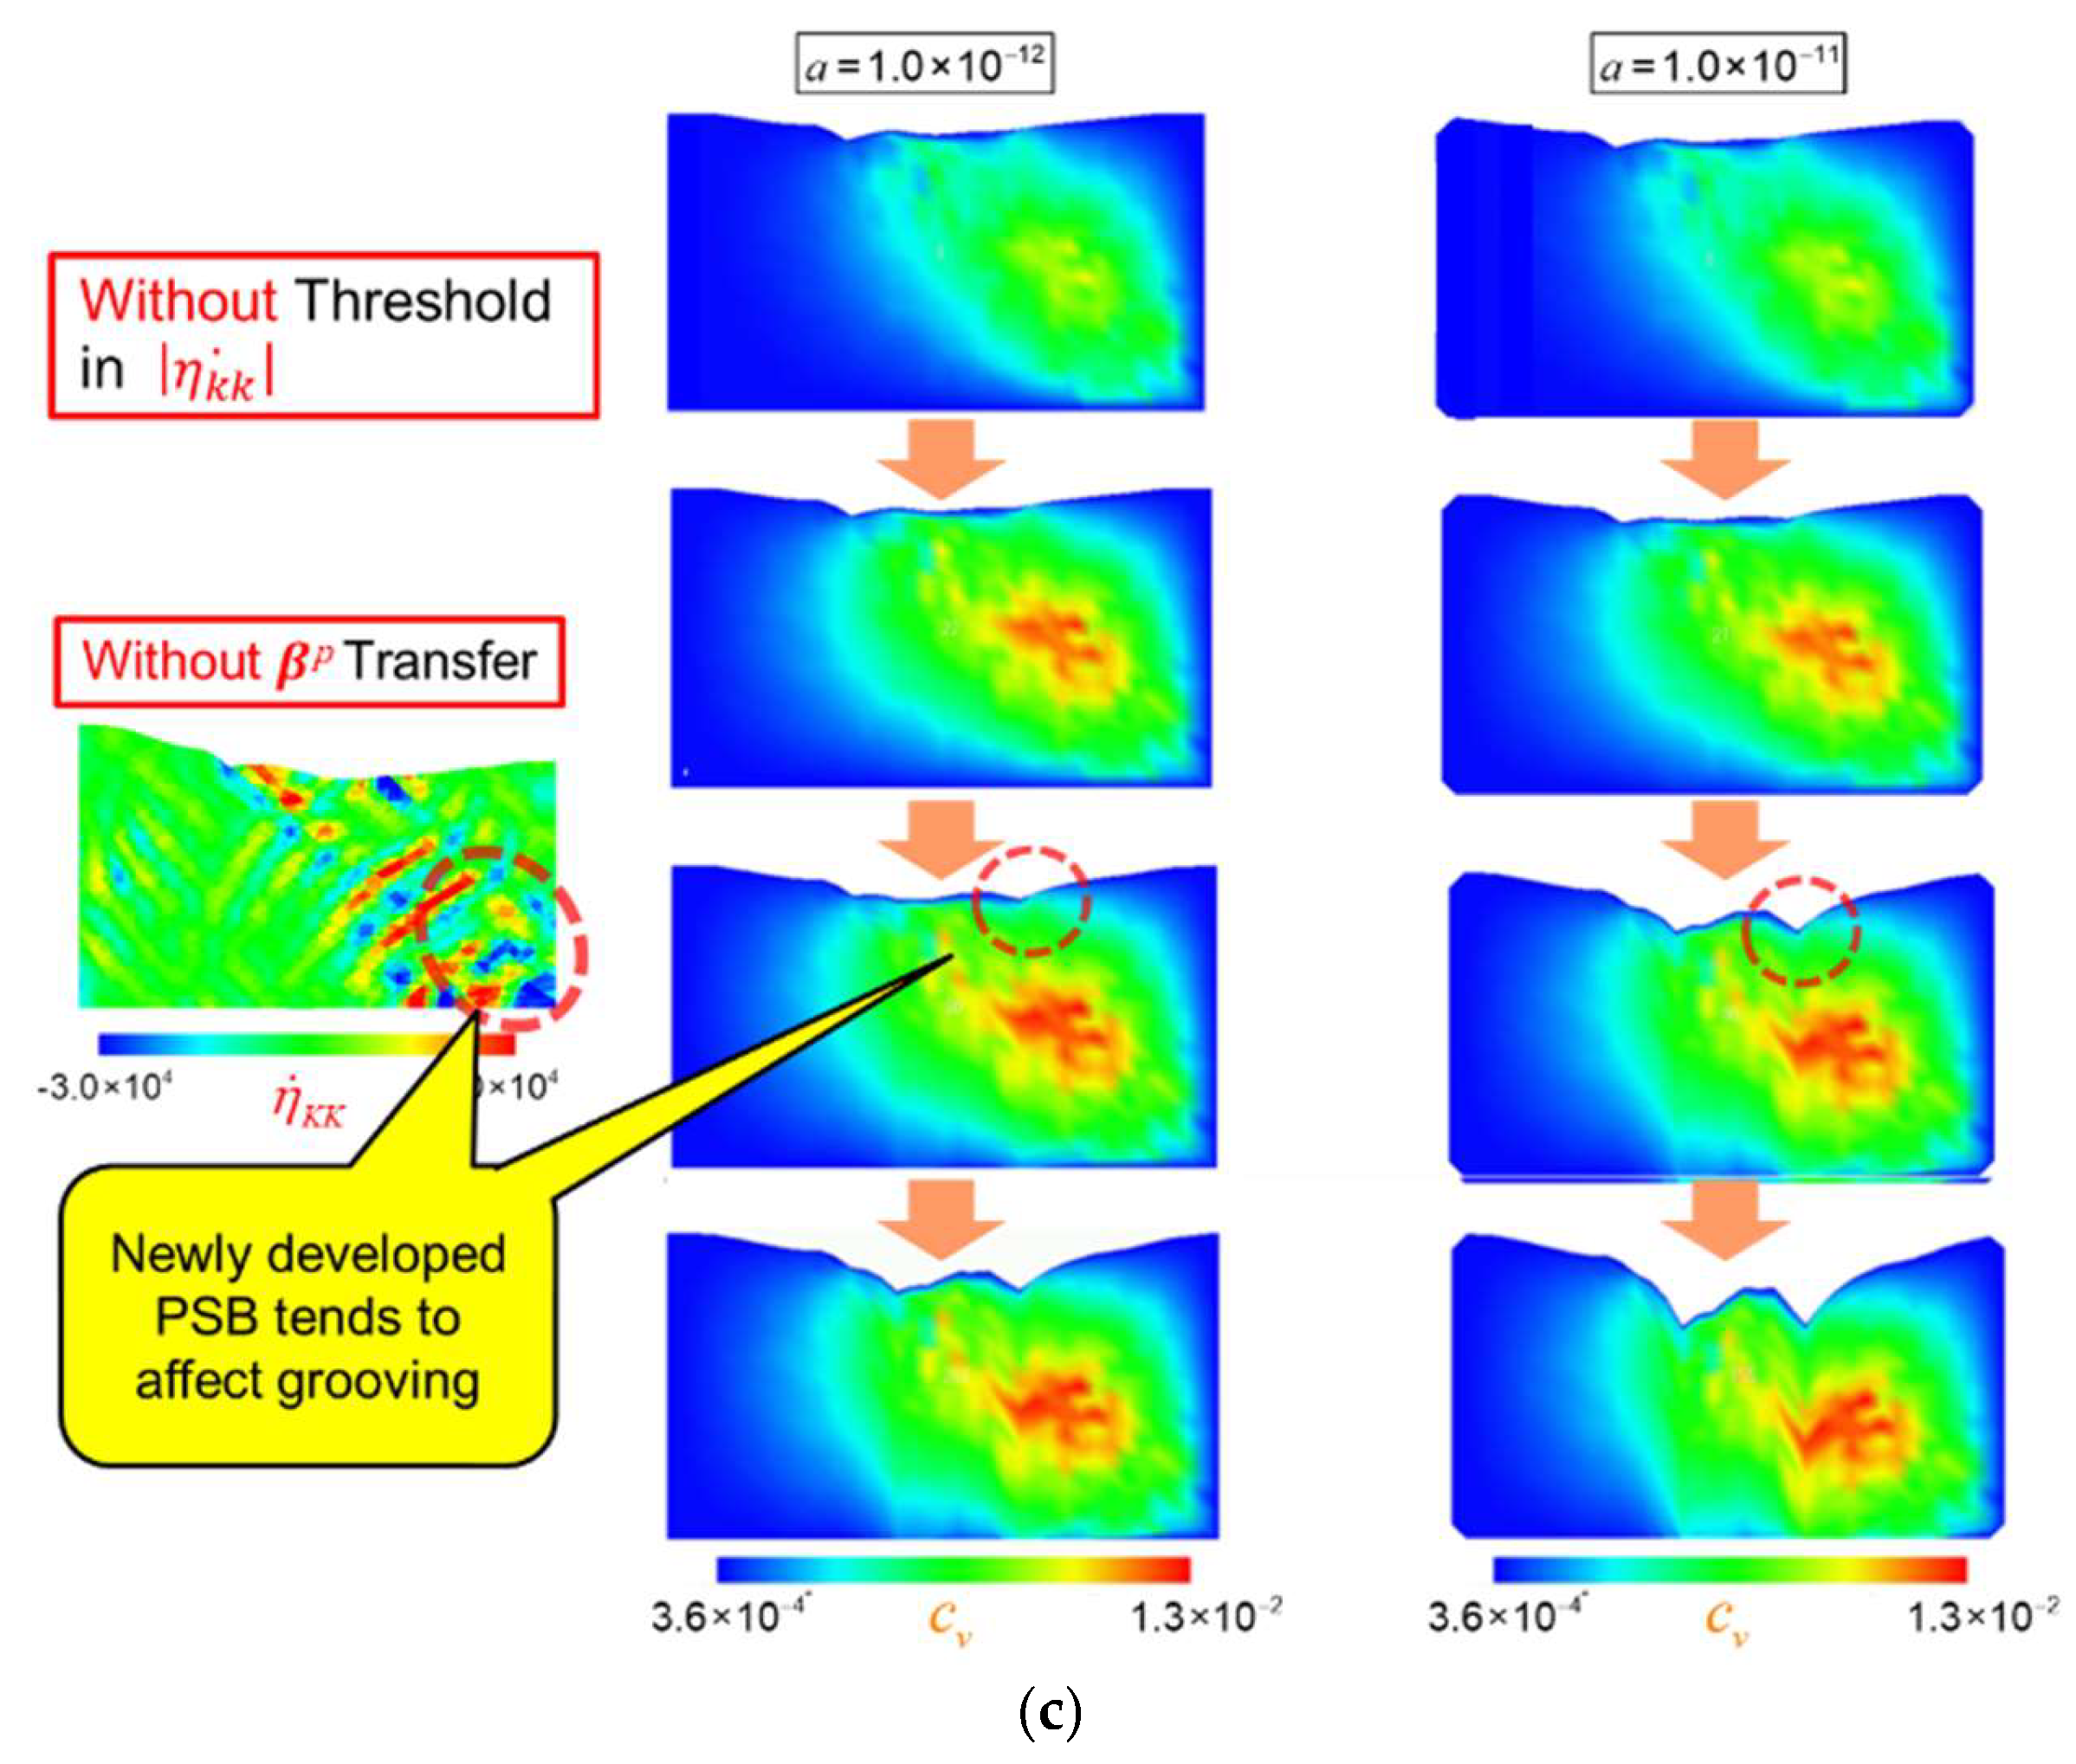
Figure 6.
Simulated variations in surface receding velocity and the corresponding surface profile with increasing straining cycles.
Figure 6.
Simulated variations in surface receding velocity and the corresponding surface profile with increasing straining cycles.

Figure 7.
Simulated groove extension rates as they progress into a crack, comparing scenarios with and without vacancy diffusion.
Figure 7.
Simulated groove extension rates as they progress into a crack, comparing scenarios with and without vacancy diffusion.
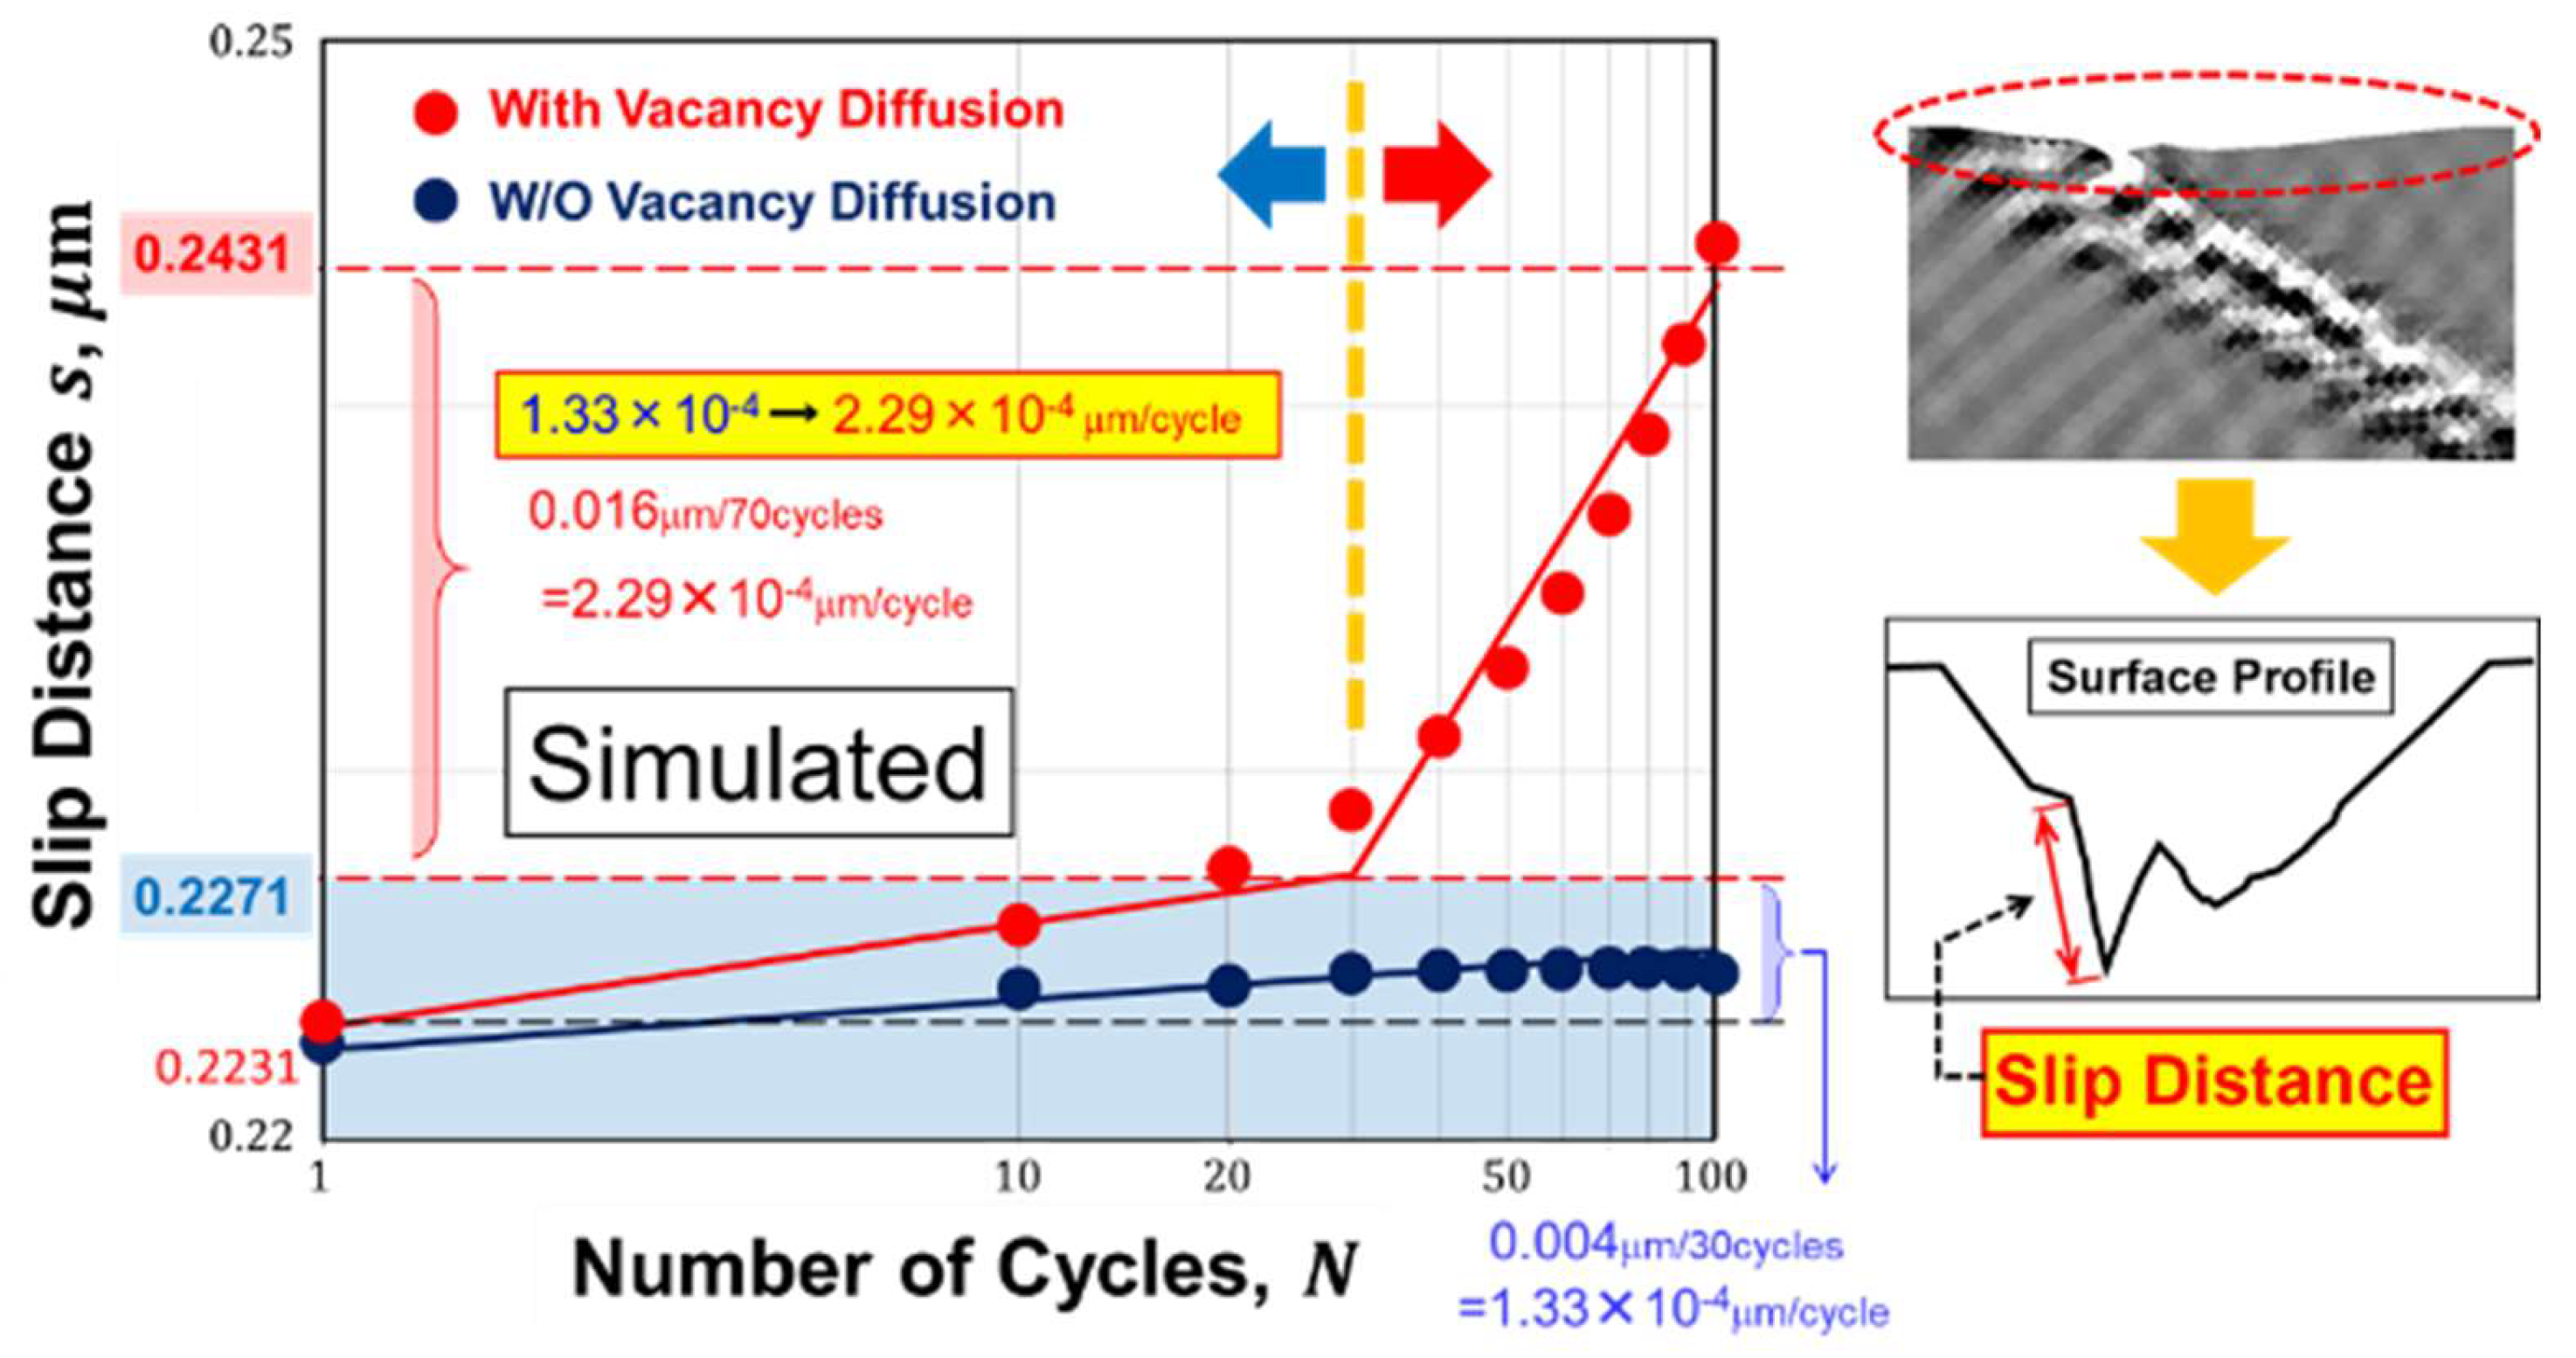
Figure 8.
Sampling of restart specimens from a parent model exhibiting a PSB laddered pattern, comparing the effects of different sampling sites and analytical conditions. Similar experimental observations from Tabata et al. (1983) are shown above for reference.
Figure 8.
Sampling of restart specimens from a parent model exhibiting a PSB laddered pattern, comparing the effects of different sampling sites and analytical conditions. Similar experimental observations from Tabata et al. (1983) are shown above for reference.
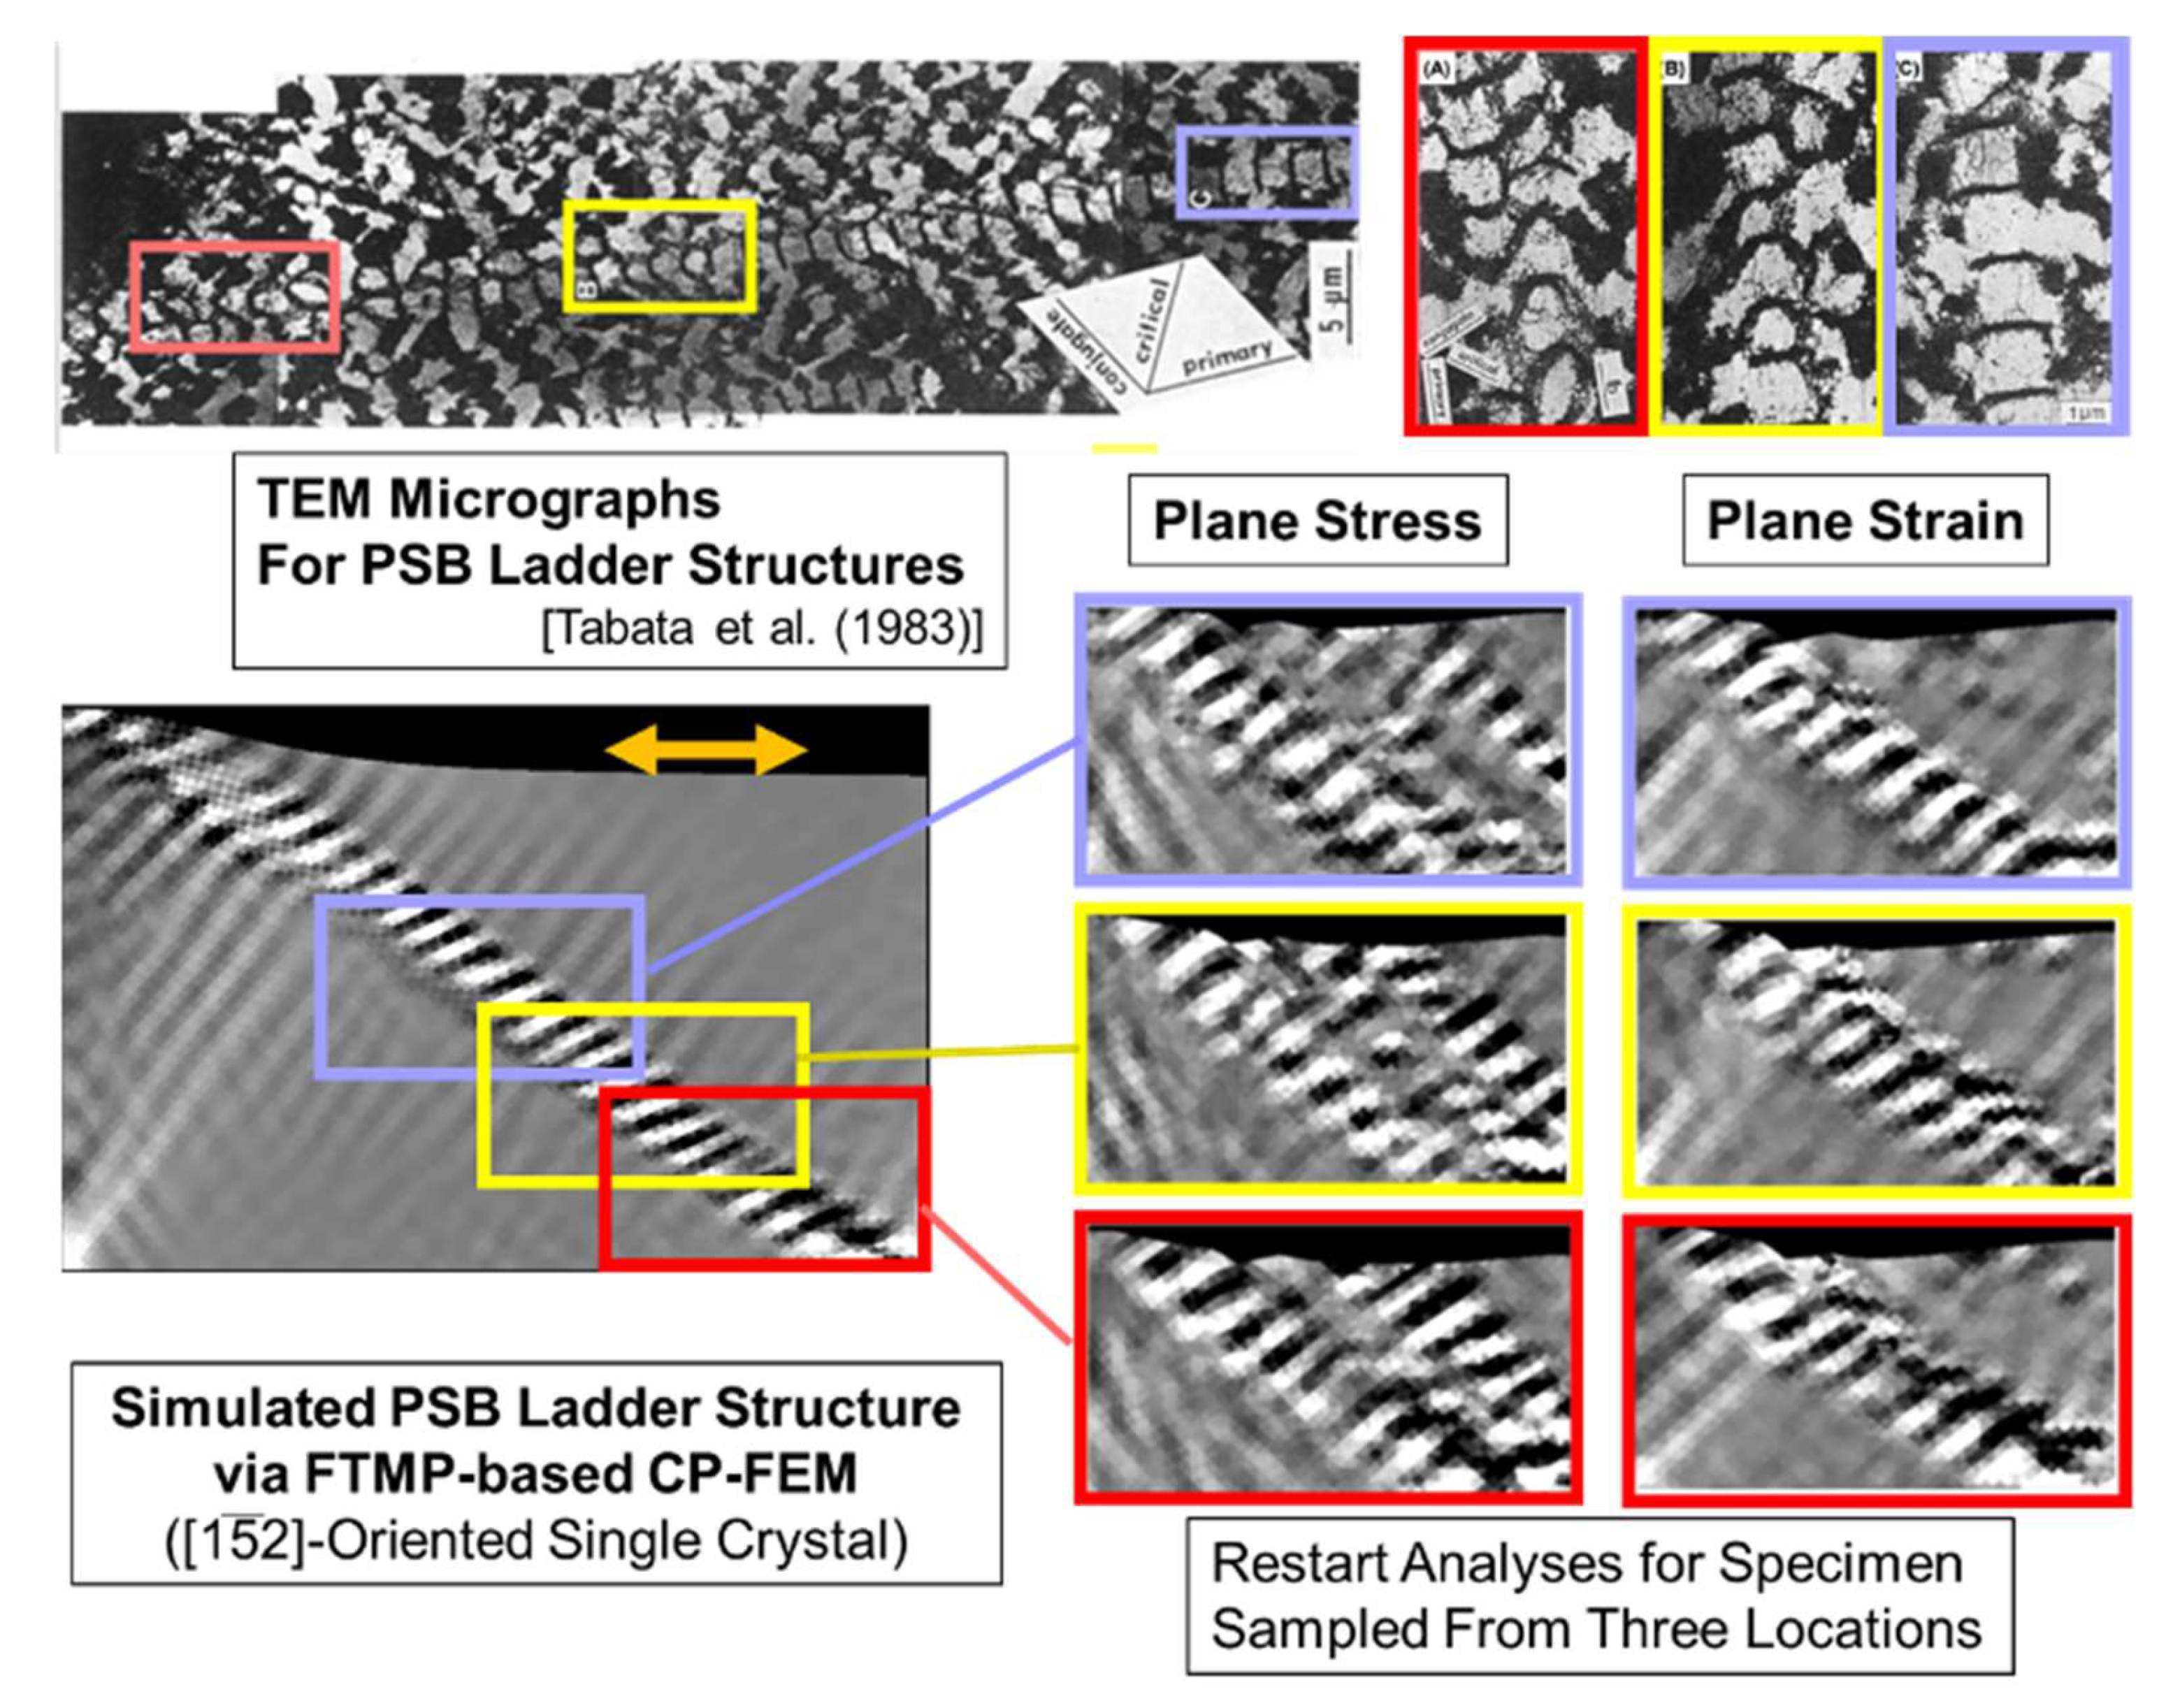
Figure 9.
Series of snapshots showing variation of vacancy concentration contour with straining cycles, comparing two sampling sites #1 and #2.
Figure 9.
Series of snapshots showing variation of vacancy concentration contour with straining cycles, comparing two sampling sites #1 and #2.
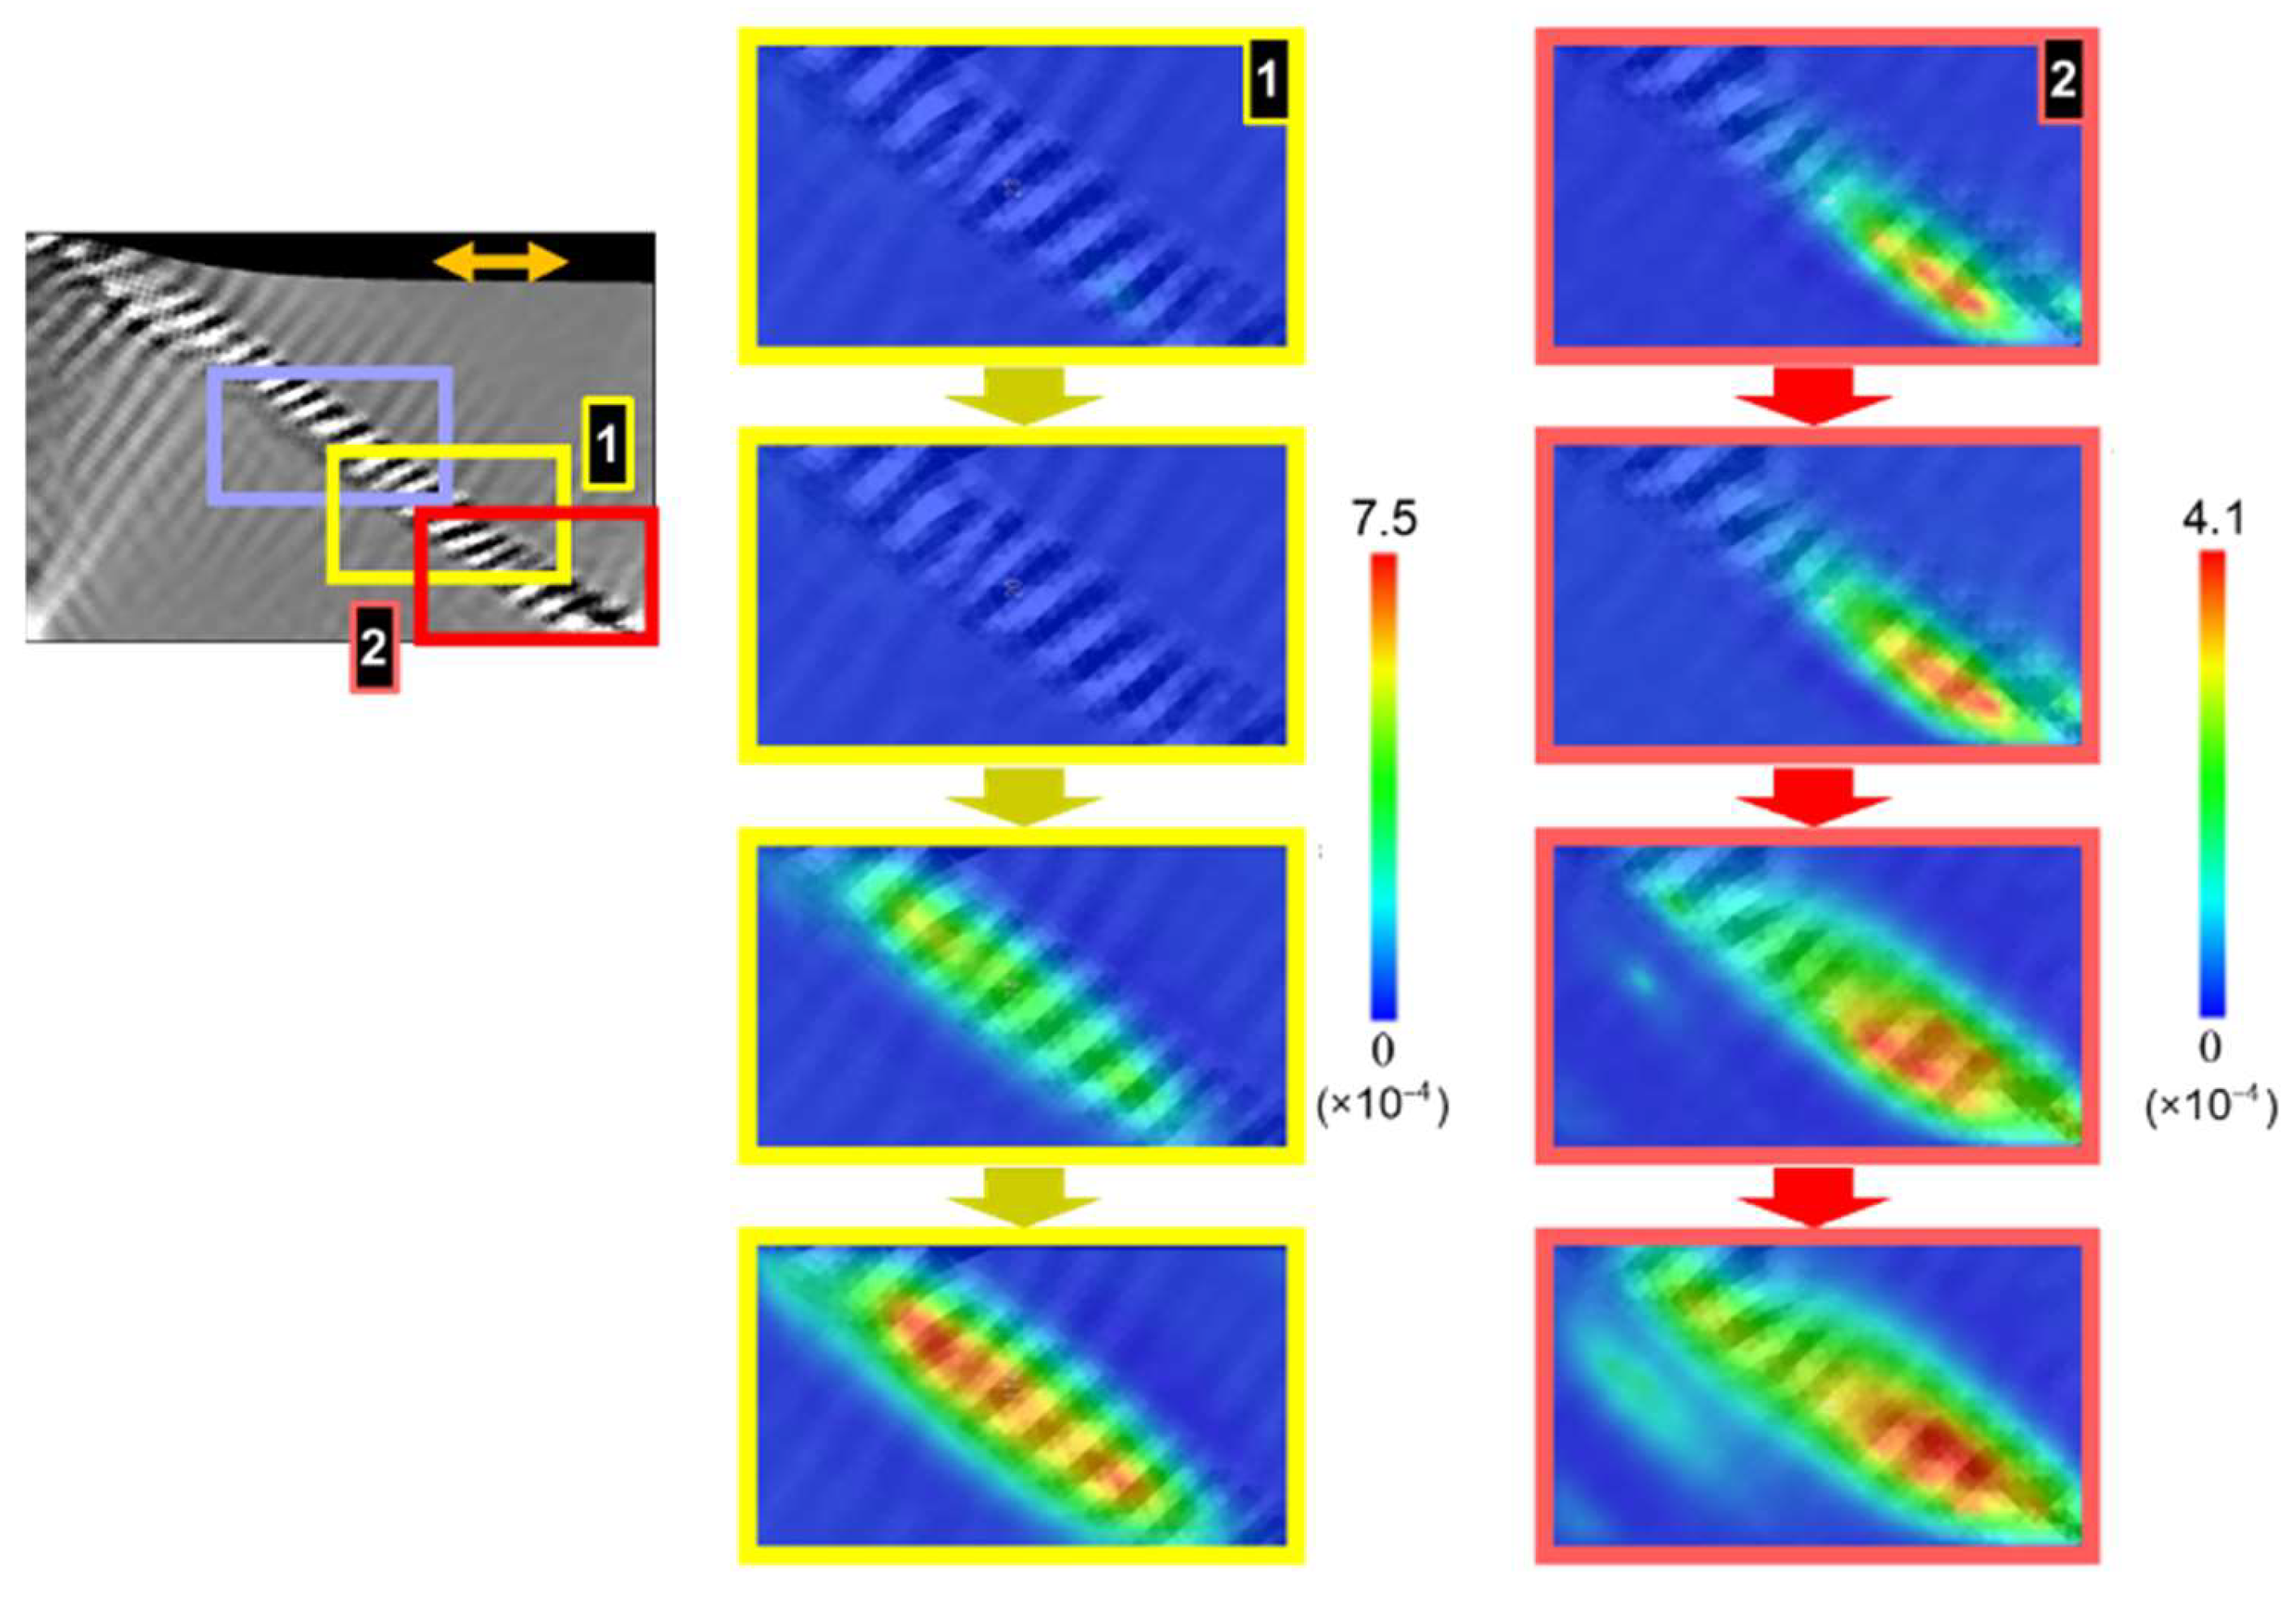
Figure 10.
Representative results from direct CP-FEM-diffusion coupling analyses, illustrating variations of vacancy concentration distribution along the PSB (left), vacancy flux at the surface (middle), and evolving surface profiles with straining cycles (right).
Figure 10.
Representative results from direct CP-FEM-diffusion coupling analyses, illustrating variations of vacancy concentration distribution along the PSB (left), vacancy flux at the surface (middle), and evolving surface profiles with straining cycles (right).
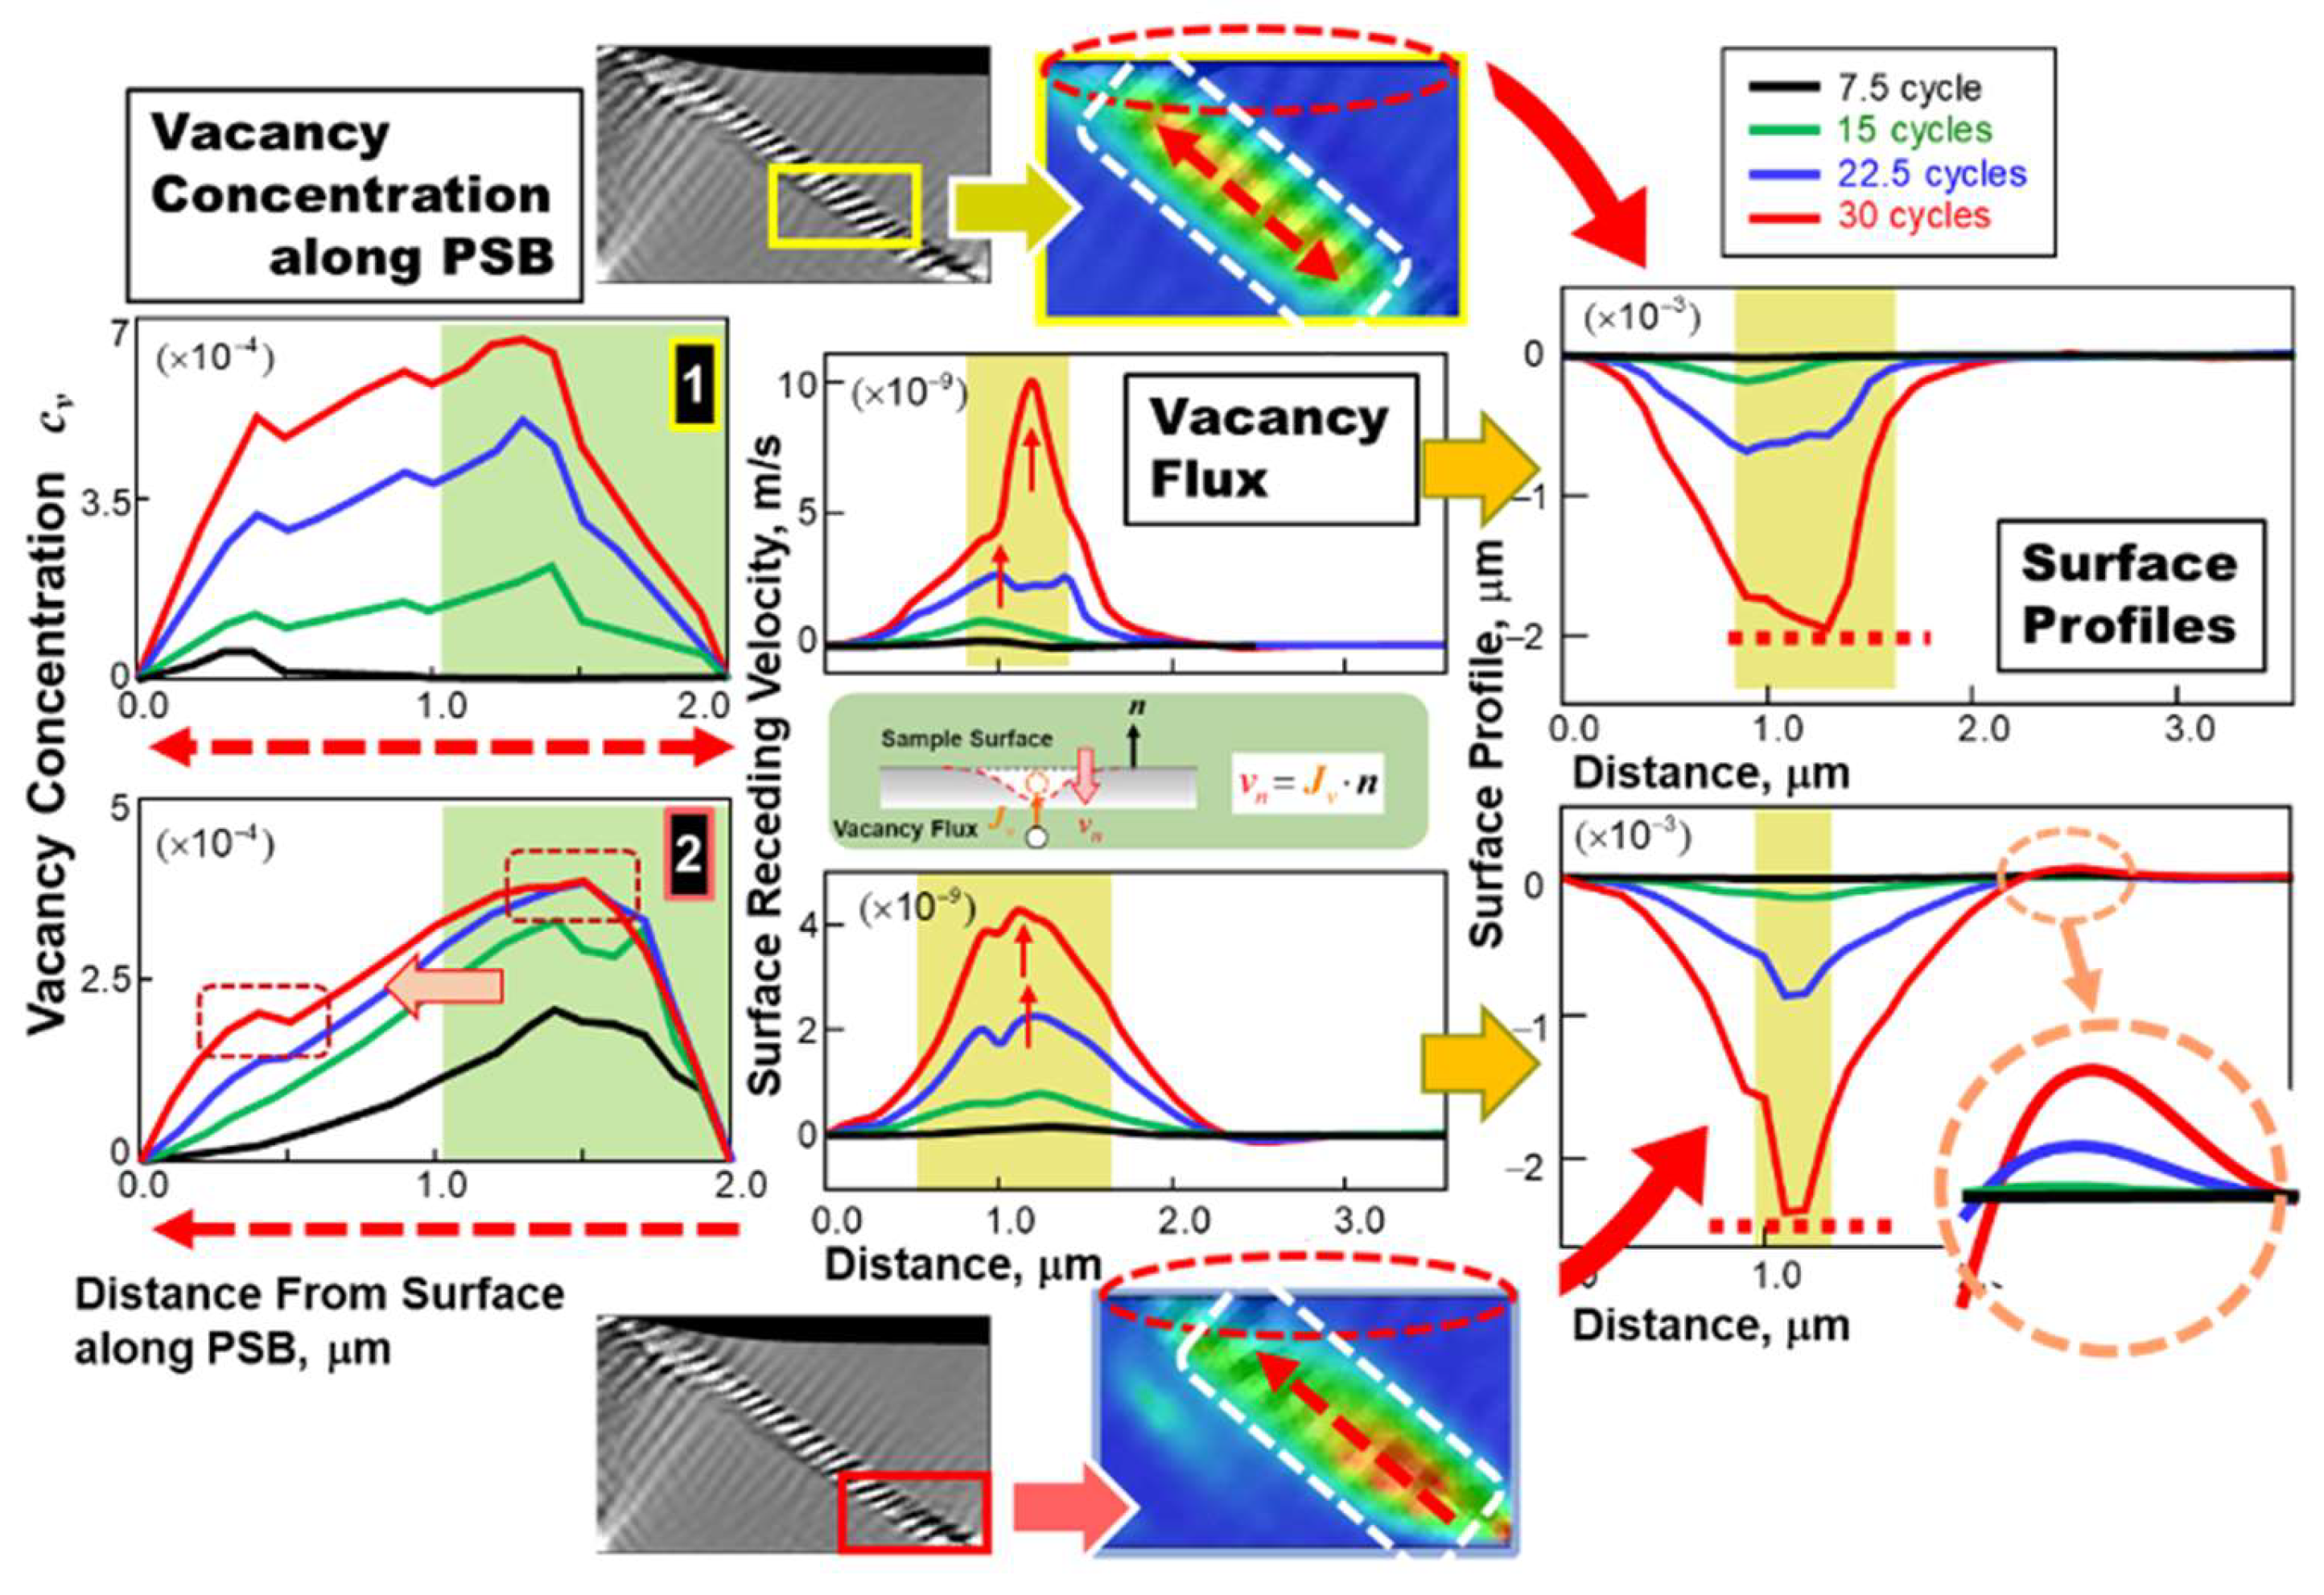
Figure 11.
Overall comparison of the simulated groove extension rate versus the number of cycles for direct and indirect coupling analyses, with the original diagram for the latter presented in Figure 7.
Figure 11.
Overall comparison of the simulated groove extension rate versus the number of cycles for direct and indirect coupling analyses, with the original diagram for the latter presented in Figure 7.
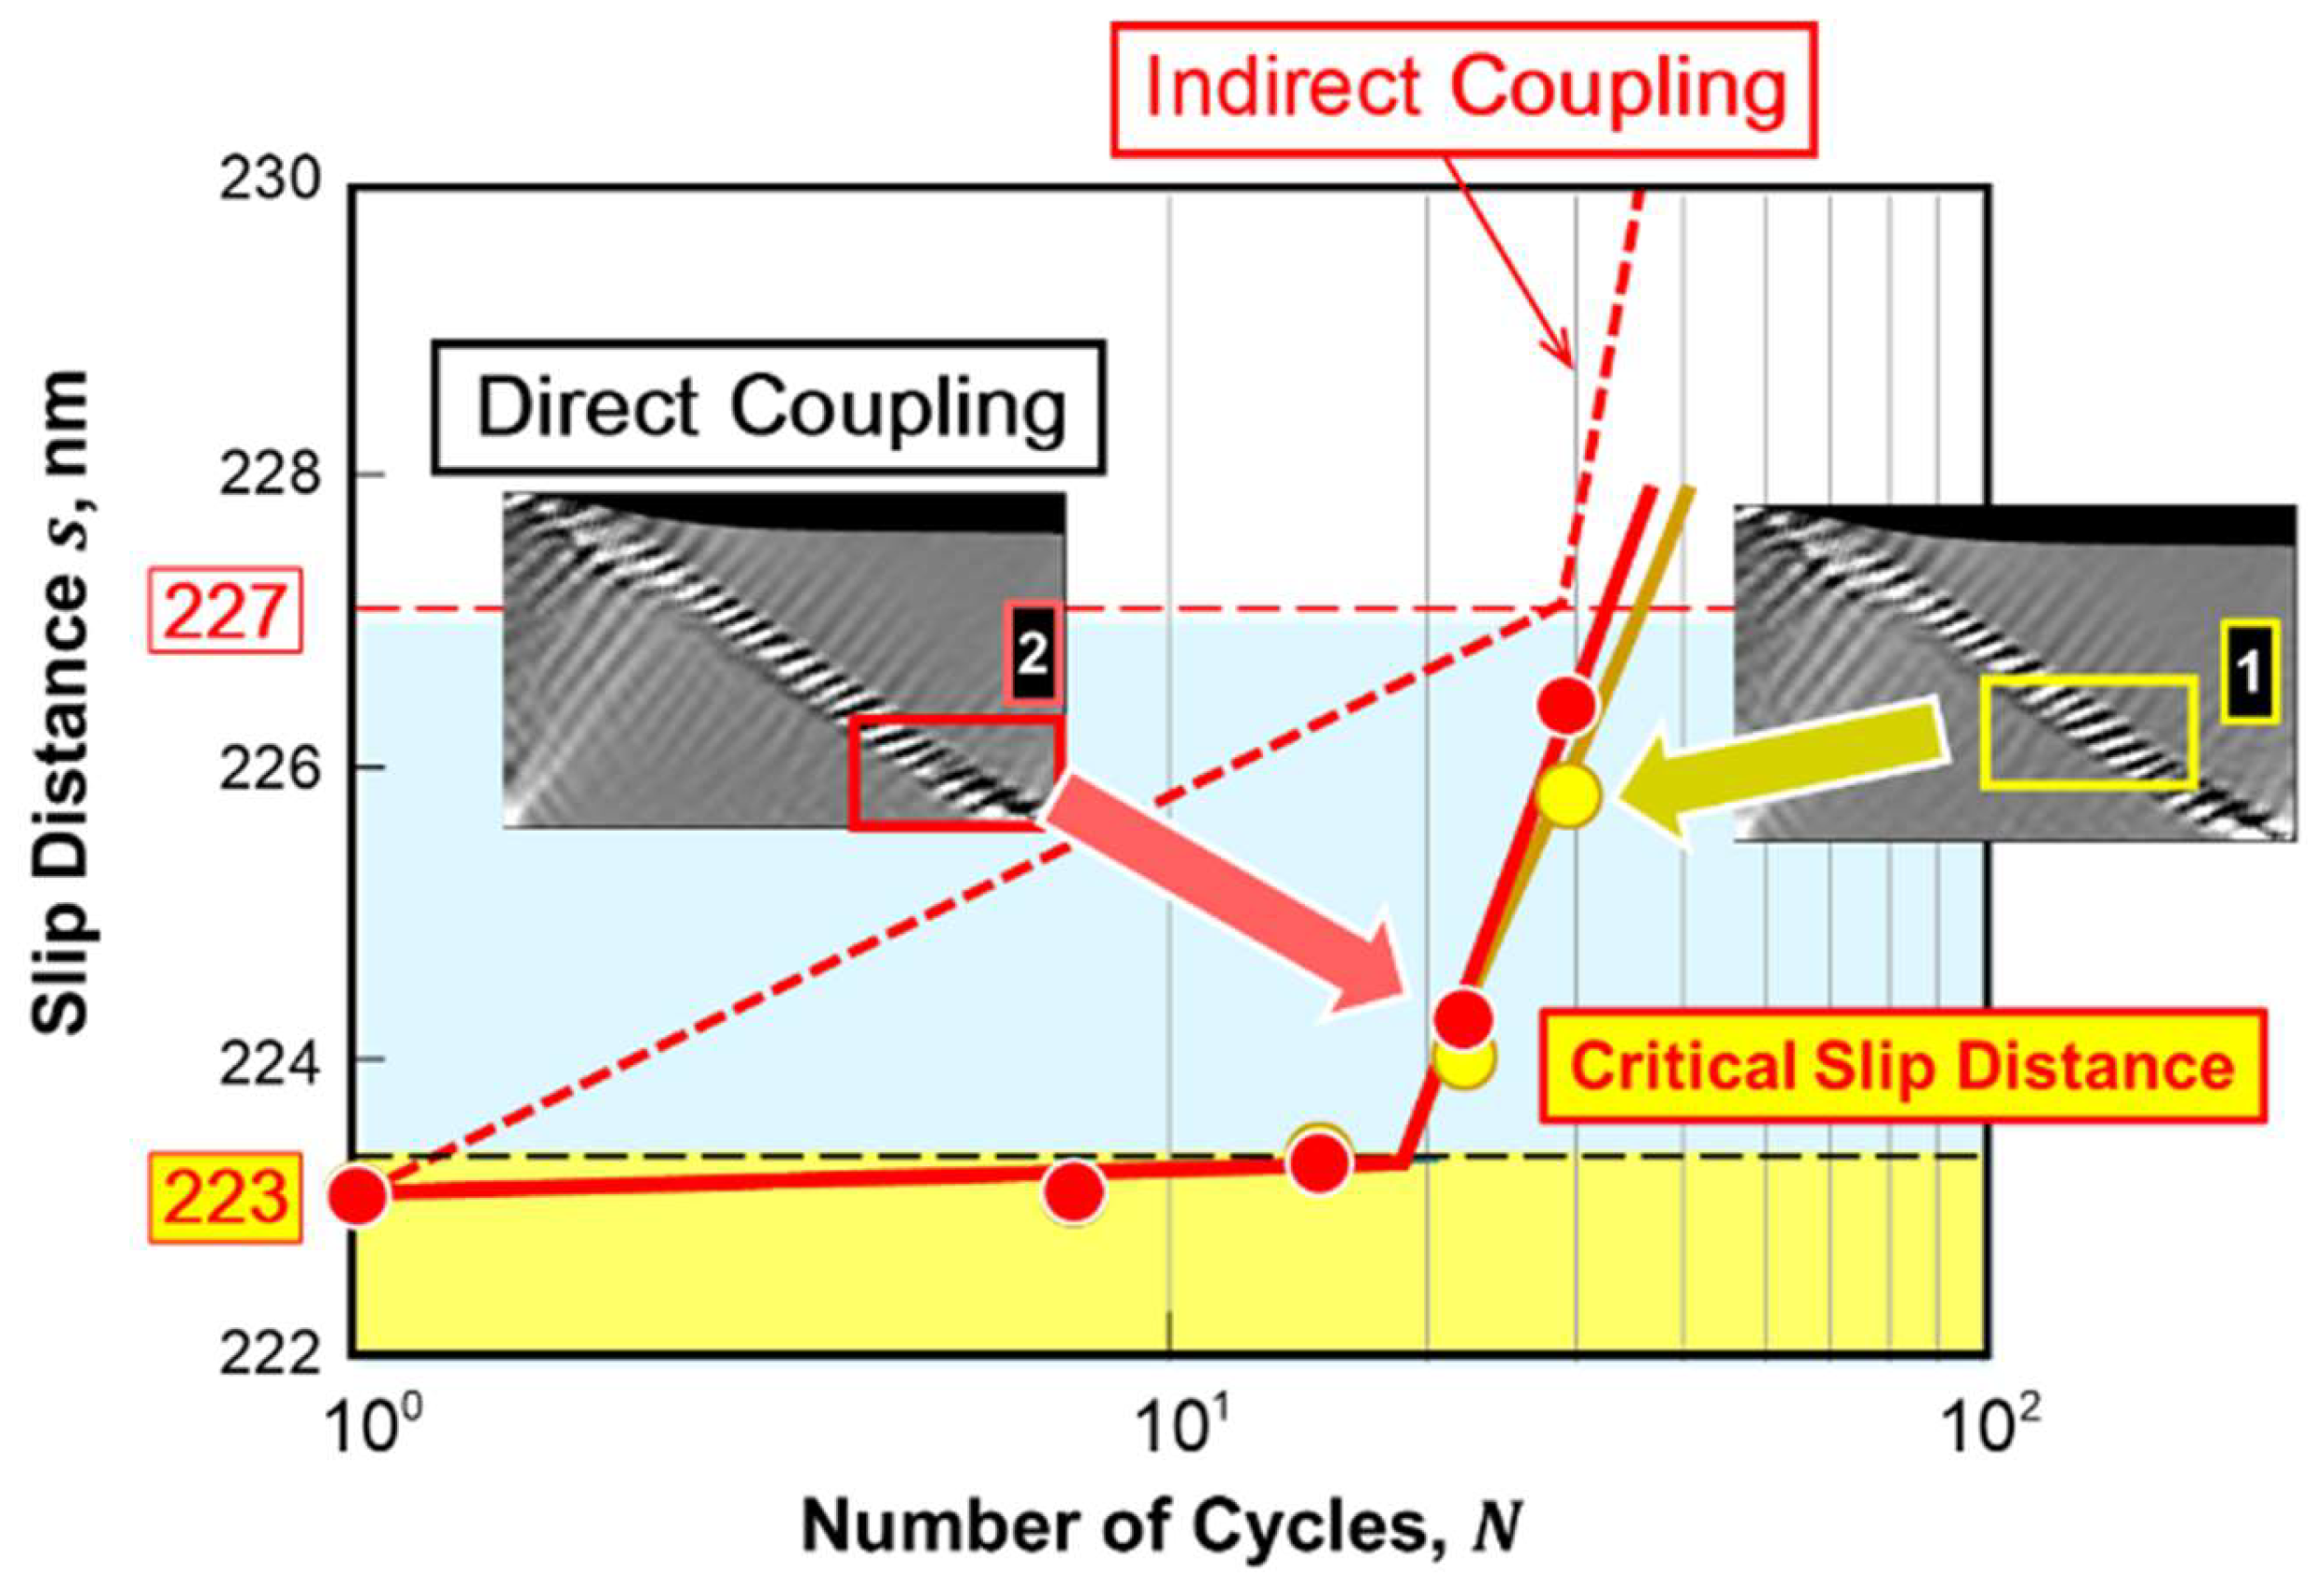
Figure 12.
Three fundamental aspects inherent to the PSB ladder structure: one mechanical and two chemical roles.
Figure 12.
Three fundamental aspects inherent to the PSB ladder structure: one mechanical and two chemical roles.

Disclaimer/Publisher’s Note: The statements, opinions and data contained in all publications are solely those of the individual author(s) and contributor(s) and not of MDPI and/or the editor(s). MDPI and/or the editor(s) disclaim responsibility for any injury to people or property resulting from any ideas, methods, instructions or products referred to in the content. |
© 2024 by the authors. Licensee MDPI, Basel, Switzerland. This article is an open access article distributed under the terms and conditions of the Creative Commons Attribution (CC BY) license (http://creativecommons.org/licenses/by/4.0/).
Copyright: This open access article is published under a Creative Commons CC BY 4.0 license, which permit the free download, distribution, and reuse, provided that the author and preprint are cited in any reuse.


