
Submitted:
25 September 2024
Posted:
27 September 2024
You are already at the latest version
Abstract
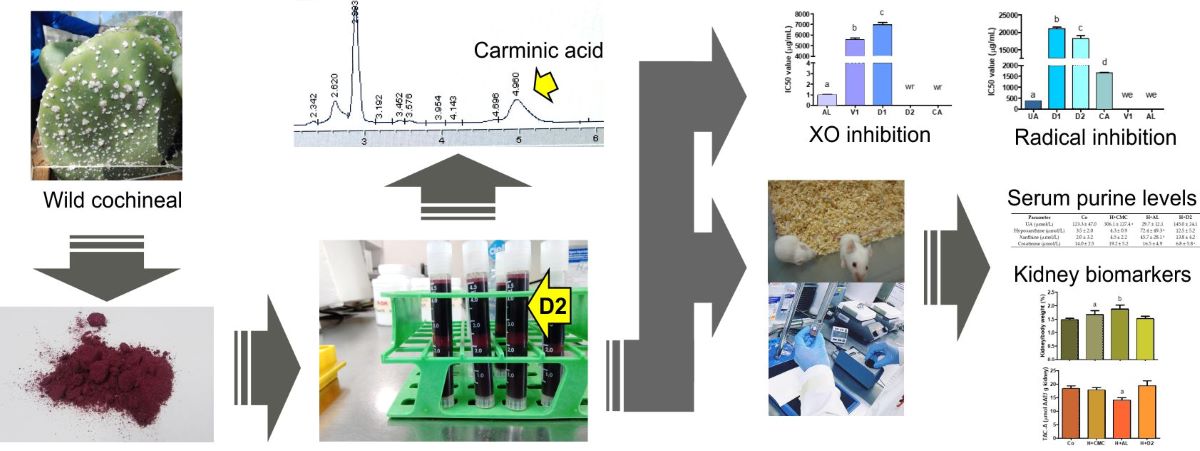
Background/Objectives: Actual urate-lowering therapies may cause serious side effects in patients. Thus, alternative treatments are needed to regulate uric acid (UA) levels in patients with hyperuricemia associated with kidney injury, and natural sources have demonstrated utility in this field. For the first time, our study evaluated the effects of an extract of Dactylopius opuntiae insects on hyperuricemia related to renal dysfunction in vitro and in mice. Methods: Insects were bred and collected, and two different extracts (D1 and D2) were obtained. For both extracts, xanthine oxidase (XO) and radical inhibitory assays were performed. Subsequently, serum purine levels and renal markers were quantified in male BALB/c mice who received potassium oxonate, hypoxanthine, and gentamicin. Results: The D2 extract contained 18,037.7 µg of carminic acid/mL, inhibited 53.2% of XO activity at one concentration, and showed IC50 values of 18,207.8 and 5729.6 µg/mL against ABTS and DPPH radicals. D2 administration reduced serum UA and creatinine levels, and it avoided the increased kidney weight and reduced renal antioxidant capacity caused by hyperuricemia and allopurinol use in mice. Despite the satisfactory results obtained in vitro, the D1 extract killed the animal models due to its citric acid content. Conclusions: The D2 insect extract can be used as an effective therapy for hyperuricemia associated with kidney dysfunction.
Keywords:
Wild cochineal
; uric acid
; kidney function
; antioxidant activity
; carminic acid
1. Introduction
Uric acid (UA) is the end product of the purine degradation pathway in humans. In this pathway, xanthine oxidase (XO) is the enzyme that transforms hypoxanthine and xanthine into UA. Hyperuricemia, which is the excess accumulation of UA in the blood, can be caused by the metabolic overproduction or reduced renal excretion of UA [1]. Two-thirds of the total UA elimination primarily occurs via excretion by the kidney. Thus, as kidney function declines, uric acid is retained to a certain degree because other compensatory excretion pathways are activated. Consequently, hyperuricemia can result from impaired kidney function; however, in the clinical setting, hyperuricemia commonly precedes the development of chronic kidney disease. In this way, hyperuricemia causes kidney injury through the deposition of monosodium urate crystals in renal structures and surrounding vascular capillaries, as well as through the intracellular activation of mechanisms related to impaired renal flow, oxidative stress induction, and ischemia mediated by the soluble UA fraction [2].
The two main effective strategies used to prevent or treat hyperuricemia in patients are the use of XO inhibitors (e.g., allopurinol, AL), which leads to decreased UA production, and the use of uricosuric agents (e.g., benzbromarone), which are capable of increasing UA excretion. Nevertheless, both classes of drugs may cause serious side effects. For example, with regard to AL, there have been reports of reactions involving eosinophilia and systemic symptoms, toxic epidermal necrolysis, and gastrointestinal toxicity, among others, and, with regard to benzbromarone, there have been reports of hepatotoxicity in patients. Therefore, there is a need for effective therapies without serious or fewer side effects to regulate serum UA levels in patients. In this way, some extracts from natural sources are useful against hyperuricemia [1,3,4].
Dactylopius opuntiae, known as wild cochineal, is an insect considered an invasive pest of Opuntia species, and the female adult insects are a source of carminic acid (CA) [5]. CA has been described as a potential therapeutic strategy for fructose-induced kidney injury because it restricts inflammation and reactive oxygen species production during the injury and reduces the progression to chronic kidney damage [6]. Additional biological actions have been described for CA, such as antioxidant abilities, the attenuation of fatty liver disease progression, and suppressive activity against tumors. Meanwhile, a CA-rich extract obtained from D. opuntiae female insects has been reported to have properties of interest to the food industry, such as antioxidant activity and biochemical actions against the discoloration and oxidation of proteins and lipids in refrigerated meat [5].
To the best of our knowledge, D. opuntiae extracts have not been evaluated against a hyperuricemic state related to kidney injury. Therefore, the present study aimed to evaluate the effects of a D. opuntiae aqueous extract on XO inhibition, serum purine levels, and renal antioxidant markers in mice with hyperuricemia related to kidney dysfunction.
2. Results
2.1. D1 and D2 Insect Extraction
The extract obtained from method 2 (D2) exhibited a higher concentration of CA and a higher recovery fraction than the extract obtained from method 1 (D1) (Table 1).
2.2. Inhibition of the XO Enzyme
AL exhibited a higher inhibitory action, reflected by a lower IC50 value, against XO than the D1 and vehicle (V1) samples. Although the D2 and CA samples did not produce typical concentration–inhibition curves against XO, they showed inhibitory action of 53.2 and 19.9% at 41,687.5 and 570.0 µg/mL, respectively (Figure 1).
2.3. Inhibition of Synthetic Radicals
The UA samples exhibited a higher antioxidant activity, reflected by a lower IC50 value, against the 2,2´-azino-bis 3-ethylbenzothiazoline-6-sulfonic acid (ABTS) radical than the CA, D2, and D1 samples. The D2 samples showed superior antioxidant activity to the D1 samples. The V1 and AL samples did not inhibit the ABTS radical (Figure 2).
The UA and CA samples exhibited similar antioxidant activity against the 2,2´-diphenyl-1-picrylhydrazyl (DPPH) radical, reflected by similar IC50 values. This effect was superior to that exhibited by the D1 and D2 samples. The D2 samples had a lower inhibitory effect than the D1 samples. The V1 and AL samples did not inhibit the DPPH radical (Figure 3).
2.4. Effect of Experimental Samples in the Mouse Model
The administration of the V1 samples caused rapid death of the mice in the hyperuricemia state (H+V1). The time to death ranged between 1 and 4 min after the administration of the first dose. Moreover, the administration of the D1 samples caused the death of four of the six mice in the hyperuricemia state (H+D1) in a similar way to the V1 administration. The other groups did not show observable harmful effects over time.
The mice in the hyperuricemia and sodium carboxymethylcellulose administration (H+CMC) group exhibited higher serum UA levels than did those in the control (Co) group. Under hyperuricemic conditions, the administration of D2 or AL reduced the serum UA levels in the mice to similar values to those observed in the Co group without statistical difference. The mice in the hyperuricemia and AL administration (H+AL) group exhibited higher serum levels of hypoxanthine and xanthine than did those in the other groups. Higher hypoxanthine and xanthine levels were observed in the mice in the hyperuricemia and D2 administration (H+D2) group than in those in the Co and H+CMC groups but without statistical significance. Additionally, the serum creatinine level of the mice in the H+D2 group was inferior to that of the animals in the H groups (Table 2).
As shown in Figure 4, hyperuricemia induction in the H+CMC group caused an increase in kidney weight and a reduction in the amount of renal thiobarbituric acid-reactive substances (TBARSs) compared with the Co group. Additionally, the administration of AL to this hyperuricemia model (the H+AL group) caused pronounced changes in kidney weight and TBARS levels, alongside a reduction in the renal antioxidant capacity, in comparison with the Co group. Finally, the H+D2 data showed that the administration of the D2 extract avoided the increase in kidney weight and the reduction in the antioxidant capacity observed in the H+AL group.
3. Discussion
The CA contents in the D2 and D1 extracts were superior to those reported in a D. opuntiae extract sample obtained using a procedure similar to that presented here (4497.1 ± 113.8 µg of CA/mL of M3 extract) and those reported in Dactylopius coccus extract samples obtained via solid–liquid extractions with different solvents and temperatures (concentrations below 450 µg of CA/mL of extract) [5,7]. The present and previous extracts differed because of the amount of cochineal powder, type of cochineal, and volume of solvent used during the extraction procedures. Our data show that the extraction technique performed without citric acid was superior to that performed with citric acid (Table 1) despite previous data indicating that citric acid is an enhancer of CA extraction from a water matrix [7]. An explanation for this situation is that our procedure in which citric acid was used may have lost CA during sample processing due to it having more preparative steps than the technique without citric acid. However, it is important to note that, although there are other methods that can be used to obtain CA-rich extracts from insect powder, they involve sophisticated equipment and high costs, such as those used for supercritical fluid extraction [7]. In contrast, solid–liquid extractions are easy and accessible procedures, as observed in the present methodology.
To the best of our knowledge, this is the first time that an evaluation against the XO of extracts obtained from insects belonging to the Dactylopius genus has been performed. Our data show that the D. opuntiae aqueous extract had a very limited inhibitory effect on XO due to its key component CA showing an effect close to inactivity against XO in com-parison with AL (Figure 1). The inhibitory effect of the D1 extract on XO was due to its citric acid content, which was confirmed by the results obtained from the V1 samples. However, the D2 extract exhibited important action against the enzyme only at one concentration (Figure 1). The action of the D2 extract on XO was not a common behavior of the XO inhibitors. Possible reasons for this are the type of assay used, as it was a discontinuous assay, and the reaction time, which may have been insufficient to achieve an appropriate interaction between the inhibitor and the enzyme [8,9]. It is important to note that our finding that the V1 sample functioned as an XO inhibitor has not yet been reported. Only one prior study mentioned that citrate preparations, which are conjugate bases of citric acid, alongside AL improve serum UA levels through an enhanced renal function in patients with hyperuricemia [10].
The antioxidant abilities of the D2 and D1 extracts (Figure 2 and Figure 3) were due to the content of CA, as this compound possesses free radical scavenging properties [6]. The antioxidant abilities found in D2 and D1 varied according to the CA content, type of radical, and CA solubility in the reaction medium. We report for the first time that the AL molecule did not possess antioxidant abilities by itself. In line with our result, previous data show that AL can inhibit free radical formation through its specific action against XO [11]. The V1 sample did not inhibit the two synthetic radicals tested because its major component, citric acid, did not possess antioxidant abilities [12]. Under the present experimental conditions, UA exhibited only antioxidant abilities without prooxidant actions [13].
Despite the confirmed XO inhibitory activity of the V1 samples, it did not prove to be useful in the preclinical setting, as its administration killed the mice in the hyperuricemia model. The V1 administration involved a dose of citric acid/citrate at 3.98 g/kg bw, which was inferior to the No Observed Adverse Effect Level (NOAEL) reported for citric acid in mice (7.5 g/kg bw/day) and to a dose of citric acid used in albino mice (4 g/kg bw) in a lipopolysaccharide-induced endotoxemia model, where animal deaths were not reported [14,15]. A possible explanation for this is that the V1 sample caused a fatal cytotoxic and prooxidant effect in the mice in the hyperuricemia model [15,16]. As the D1 extract contained the same amount of citric acid/citrate as the V1 samples, D1 administration also killed the mice in the present model.
For the first time, our preclinical data demonstrate that the D2 insect extract can be used as a therapy for hyperuricemia associated with renal dysfunction. The administration of the D2 extract resulted in a low serum UA level due to high renal clearance, as indicated by the H+D2 group having a low level of serum creatinine in comparison with the group with hyperuricemia only (Table 2). The enhanced renal clearance by the D2 extract was caused by improved kidney function, as kidney function is related to an appropriate renal antioxidant capacity [17]. In our case, the D2 extract protected the kidney weight and antioxidant renal status in the mice subjected to hyperuricemia induction and AL administration (Figure 4). Our data show that AL had a deleterious effect on the kidneys during hyperuricemia induction in the mice (Figure 4), which is consistent with previously reported data [4]. Our study shows that damage to the kidney caused by hyperuricemia induction activated the antioxidant system, reflected by low TBARS values together with unchanged antioxidant levels. Moreover, this insult was exacerbated by AL administration, as a very low TBARS value was accompanied by a reduced antioxidant capacity in the kidneys (Figure 4). In some cases, inconsistent results between the TBARS and antioxidant levels were found. One explanation for these conflicting results is that antioxidant defense can be activated in response to an insult, which, in turn, prevents oxidative damage to lipids, and, thus, the generation of TBARSs is reduced while antioxidant levels remain unchanged [18,19]. Taking into account this explanation and the H+AL data, we suggest that the insult caused by AL was superior to the velocity of the response of the antioxidant renal system.
The H+CMC data confirmed that hyperuricemia was successfully induced under the present animal protocol. In this case, hyperuricemia was induced via the administration of gentamicin, potassium oxonate, and hypoxanthine, as the application of potassium oxonate and hypoxanthine did not produce hyperuricemia in this mouse strain by day 3 [1]. Previous reports have confirmed that gentamicin causes nephrotoxicity, where the generation of free radicals and other pathways are involved in causing kidney damage with a renal inflammation response, alongside an increase in creatinine and UA concentrations in plasma [20,21,22]. The use of gentamicin in our hyperuricemia mouse model increased kidney weight and serum UA levels. However, there was no statistically significant increase in the serum creatinine level following gentamicin administration because the duration of aminoglycoside exposure was short in comparison with that in previously published studies [20,21,22]. Additionally, the H+AL data supported the in vivo inhibitory action of AL against the XO enzyme, while the H+D2 data did not show statistically significant changes in the xanthine or hypoxanthine levels (Table 2). This latter finding was in line with the poor activity of the D2 extract against the XO enzyme in vitro. It is known that the measurement of xanthine, hypoxanthine, and UA, which are involved in the purine catabolism pathway, is desirable to effectively interpret XO inhibition in vivo [1].
As this work involved in vitro and preclinical experiments, further evaluations such as clinical studies are necessary to contribute to the evidence. Nevertheless, our study is the beginning of the use of a cactus pest insect as a therapy for a common disorder, such as hyperuricemia linked to kidney dysfunction.
4. Materials and Methods
4.1. Insect Breeding
D. opuntiae [Cockerell] specimens and cladodes of Opuntia ficus-indica cv. Rojo pelón were obtained from an orchard belonging to the Colegio de Postgraduados, Campus San Luis, Salinas de Hidalgo, S.L.P., Mexico. Since 2011, Dactylopius specimens have been identified using microscopic features, and their reproduction has been maintained until now [23]. Cleaned and healed cladodes were placed in a container containing wet soil, and then they were exposed to D. opuntiae nymphs for 48 h. The infested cladodes were placed in a container covered with a fine mesh to produce adult female insects under controlled humidity (40%) and temperature (23.5 ⁰C) conditions [24].
4.2. Cochineal Pigment Extraction
Adult female insects, alongside their wax, were collected, dried at 40 ⁰C, and powdered with a blender. Subsequently, the insect powder was stored in polypropylene opaque containers at room temperature. Two conventional solid–liquid extraction methods were performed to obtain two cochineal extracts.
For the first method [5], a 433 mg/mL citric acid solution was prepared using drinking water, and then 3.34 g of the powdered insect sample was mixed with 10 mL of the citric acid solution. This mixture was incubated at 50 ⁰C for 30 min, cooled at 4 ⁰C for 14 min, and centrifugated at 1500 rpm for 10 min at room temperature. After centrifugation, three phases were identified, and the intermediate layer was collected. Then, 1.14 g of sodium carbonate was gradually added to the collected layer and maintained at room temperature until the formed foam disappeared completely. This mixture was centrifugated again, and two layers were produced. The lower layer was collected, weighed, and stored at -20 ⁰C until use. In addition, the same procedure was applied for a citric acid solution without insect powder to obtain the V1 sample.
For the second method, 20 mL of drinking water was heated at 50⁰C, and 6.68 g of the powered insect sample was mixed with the water for 5 min. This mixture was centrifugated at 1500 rpm for 10 min at room temperature. After centrifugation, four phases were identified, and the second layer from the top was collected, weighed, and stored at -20 ⁰C until use.
4.3. CA Quantification
A CA quantification analysis was performed as described earlier [25] but with modifications. Calibrators containing CA (0.73-145 µg/mL) and fortified with AL (81.3 µg/mL) as an internal standard were prepared in deionized water. Subsequently, these calibrators were mixed with methanol at a ratio of 1:1. Then, these mixtures were centrifugated (at 12,100 rpm for 10 min at 4 ⁰C), and their supernatants were placed in vial inserts inside amber glass tubes for a chromatographic analysis.
A 1100 series Agilent liquid chromatography system consisting of a quaternary pump with a degasser, autosampler, thermostated column compartment, and diode-array detector, alongside Agilent ChemStation software for LC 3D systems, was used for measurements and data analyses (Agilent Technologies, Palo Alto, CA, USA). For chromatographic separation, a 250 mm long Syncronis C18 column was used, with a 5 µm particle size and a 4.6 mm internal diameter (Thermo Fisher Scientific, CA, USA). The column compartment was maintained at 30 ⁰C during isocratic separation, and a mixture of acetic acid solution (3.49 g/L) and methanol at a ratio of 1:1 v/v was used as the mobile phase.
The preparation of extract samples included a dilution of 1:400 v/v with deionized water alongside fortification with AL. Each chromatographic peak in the extract samples was identified by its retention time and spectrum record, which were compared with those obtained from the calibrators. Monitoring was carried out at 274 and 254 nm for CA and AL alongside a drawing of the spectra from 190 to 400 nm. A flow of 1 mL/min for an 8 min run time and an injection volume of 10 µL for each sample were programmed in the chromatographic system for the separation. The CA concentration in each extracted sample was obtained by interpolating its response (ratio of the CA and AL peak areas) into the curve obtained with the calibrators.
4.4. XO Inhibition by Experimental Samples
This assay was performed as described previously [1]. In brief, working standards for the AL, CA, V1, D1, and D2 samples were prepared using drinking water (six to nine points per sample, n = 5). The assay was initiated with a mixture containing 100 µL of the test sample, 70 µL of 70 mM phosphate-buffered saline (PBS) solution (pH 7.5), and 60 µL of 0.37 U/mL XO, which was incubated at 37 ⁰C for 30 min. After this incubation period, 120 µL of a 1 mM xanthine solution was added and mixed with the sample, and this subsequent mixture was incubated again at 37 ⁰C for 30 min. After this second incubation period, the reaction was stopped by adding 50 µL of 1N HCl solution to the sample. Then, 200 µL of each sample was placed into a well of a 96-well plate, and the absorbance was read at 290 nm using a Cytation™ 3 microplate reader controlled using Gen5™ software version 2.06 (Biotek Instruments Inc., Winooski, VT, USA).
Using the data obtained from blank samples (samples processed as mentioned above but with the HCl solution added before XO), an interference-free absorbance was calculated for each tested sample. Each experimental result is expressed as the percentage of XO inhibition, which was calculated using the interference-free absorbance of the assay mixture, both with and without the test material.
4.5. Radical Inhibition by Test Samples
To evaluate the antioxidant capacity of the experimental samples, the DPPH and ABTS radicals were employed. These assays were carried out as described previously [26,27]. For both assays, working standards for the UA, AL, CA, V1, D1, and D2 samples were prepared using drinking water (seven to nine points per sample, n = 5). In this case, UA was used as a positive control, as it is a powerful antioxidant found in blood and renal tissues [13].
For the DPPH radical scavenging assay, a mixture of each sample (50 µL) and 450 µmol/L DPPH solution (200 µL) was incubated at 30 ⁰C for 20 min. After the incubation period, the mixture was centrifugated at 1500 rpm for 5 min at 15 ⁰C, and the resultant supernatant (150 µL) was placed into a well of a 96-well plate to monitor the absorbance at 517 nm. Before the ABTS radical scavenging assay was started, the ABTS radical was produced by a reaction between ABTS diammonium salt and potassium persulfate in an aqueous medium. Subsequently, it was diluted with deionized water to obtain a 95.7 µmol/L ABTS radical solution. Then, a mixture of each sample (3 µL) and the diluted ABTS radical solution (300 µL) was incubated at 30 ⁰C for 4 min. Finally, each mixture (150 µL) was placed into a well of a 96-well plate to monitor the absorbance at 730 nm.
For both radical scavenging assays, the microplate reader and software described above were used to measure the absorbance units. The percentage of inhibition against the DPPH or ABTS radical was calculated using the absorbance values of the blank (drinking water) and experimental samples.
4.6. Mouse Model and Sampling
The procedure for the mouse model was carried out according to a prior study [1] but with modifications. Male BALB/c mice weighing between 15 and 20 g were kept at room temperature (21 ± 1 °C) and housed in acrylic cages with free access to water and a standard diet under a 12 h dark and light cycle. The mice were housed under these laboratory conditions for one week before the experiment.
Hypoxanthine and AL were suspended in a 0.3% CMC aqueous solution, potassium oxonate was suspended in a 0.5 % CMC aqueous solution, and gentamicin (160 mg/ 2 mL, Antibióticos de México, Coyoacán, Ciudad de México, México) was diluted at a ratio of 1:1 v/v with a physiological saline solution. The mice were randomly divided into the following six groups (n = 6 for each group): Co, H+CMC, H+AL, H+D1, H+D2, and H+V1 groups.
After 2 h of fasting, gentamicin (96 mg/kg bw, i.p.) alongside 0.3% CMC (9.2 mL/kg, p.o.), AL (2.5 mg/kg bw, p.o.), D1 (9.2 mL/kg bw, p.o.), D2 (9.2 mL/kg bw, p.o.), or V1 (9.2 mL/kg bw, p.o.) was administered once daily to the animals for three consecutive days.
On the third day, potassium oxonate (280 mg/kg bw, i.p.) was mixed with gentamicin for administration to the mice in the same injection. After one hour of the potassium oxonate/gentamicin injection and experimental oral therapy, a hypoxanthine suspension (268.0 mg/kg bw, p.o.) was administered to the mice. For the Co group, a physiological saline solution or a physiological saline solution plus 0.5% CMC was administered via an intraperitoneal injection, while 0.3% CMC was administered via the oral route for the same periods of time as the other groups.
One hour after hypoxanthine administration, the mice were anesthetized with a combination of ketamine and xylazine (100 and 20 mg/kg bw, respectively). Then, blood and kidneys were collected from the mice. The kidneys were placed in liquid nitrogen, while the blood was kept at 4 °C for 1 h. Subsequently, the blood samples were centrifuged at 5600 rpm for 10 min at 4 °C. The resultant serum samples were separated and frozen at -20 °C for further analysis. To continue the processing of the kidneys, they were thawed at 4 °C, weighed, and homogenized in 2 mL of a cold 70 mM PBS solution (pH 7.5). Subsequently, each homogenate was centrifugated at 11,200 rpm for 10 min at 4 °C. Finally, each supernatant was frozen at -20 °C for further analysis.
4.7. Serum UA, Xanthine, Hypoxanthine, and Creatinine Levels
A liquid chromatography method was used for the quantification of purines and creatinine, as described in a prior study [1]. In brief, the chromatographic conditions used were as follows: a column compartment maintained at 32 °C, a mobile phase consisting of a PBS solution at pH 6.0 in an acetonitrile gradient, an injection sample volume of 20 µL, a flow rate of 1 mL/min, and multiple monitoring wavelengths (236, 248, 263, and 292 nm for creatinine, hypoxanthine, xanthine, and UA, respectively) together with spectrum drawing (range from 200 to 400 nm). The same apparatus, stationary phase, and software as described above were used for this chromatographic analysis. The compounds were identified by retention times and spectrum records. The compound concentration in the serum samples was calculated from the calibration curves obtained with the pure compounds. The results are expressed as μmol of compound/L of serum sample.
4.8. Antioxidant and Lipid Peroxidation Levels in Kidney Homogenate Supernatant
The ABTS and DPPH radical scavenging assays described above were employed. In the ABTS radical inhibition assay, the kidney supernatants were undiluted, and the blank sample was the 70 mM PBS solution (pH 7.5). For the DPPH radical inhibition assay, the kidney supernatants were diluted 1:1 with the 70 mM PBS solution (pH 7.5) before the reaction with the radical, and the blank sample was the PBS solution. The absorbance value obtained from each tissue supernatant was interpolated in a calibration curve prepared with ascorbic acid. Using the kidney weight and interpolated ascorbic acid concentration, the antioxidant ability of each sample is expressed in µmol of ascorbic acid equivalents (AAE)/g of the kidney.
To measure the lipid peroxidation in the samples, the TBARS assay was used. This assay was adapted from prior studies [28,29]. A sample of the kidney supernatant (200 µL), 20 µL of a 493 mg/mL trichloroacetic acid solution, and 2.5 µL of a 1 mg/mL butylated hydroxytoluene solution were mixed for 1 min. This mixture was centrifuged at 4400 rpm for 10 min at 18 °C. A volume of the supernatant or malondialdehyde calibrator (100 µL) was mixed with 60 µL of a 0.8% thiobarbituric acid solution. Then, this mixture was incubated at 75 °C for 30 min and kept at 4 °C for 3 min. A volume of the mixture (120 µL) was placed in 1 well of a 96-well plate to read the absorbance at 532 nm using the same microplate reader and software mentioned above. The TBARS value for each sample was calculated using the calibration curves of malondialdehyde. The malondialdehyde stock solution was obtained as described previously [28]. Considering the TBARS concentration, volume of the sample, and kidney weight, the results are expressed as mg TBARS/g of the kidney.
4.9. Data Analysis
Data are presented as the mean and standard deviation. Student’s t-test with Welch's correction was used for the analysis of the CA content. A one-way ANOVA with Tukey's post-test was used for the analyses of the data obtained from the XO inhibition experiments, antioxidant abilities in vitro, kidney weighing, and kidney homogenates. A p-value of <0.05 was considered statistically significant. The calculation of IC50 values and statistical analyses were performed using GraphPad Prism 5 software (San Diego, CA, USA).
5. Conclusions
A D. opuntiae aqueous extract, free of citric acid and rich in the antioxidant compound CA, can be used as an alternative therapy for hyperuricemia related to kidney dysfunction, as the administration of this extract successfully reduced serum UA levels through enhanced renal functionality and exerted a minor XO inhibitory effect in mice.
Author Contributions
Conceptualization, O.H.A.-M., M.M.G.-C., and S.d.J.M.-G.; methodology, O.H.A.-M., M.M.G.-C., O.G.G.-C., S.d.J.M.-G., and F.M.-M.; formal analysis, O.H.A.-M., M.M.G.-C., and S.d.J.M.-G.; data curation, O.H.A.-M., M.M.G.-C., O.G.G.-C., F.M.-M., and M.A.I.-E.; writing—original draft preparation, O.H.A.-M. and M.A.I.-E.; writing—review and editing, M.M.G.-C., M.A.I.-E., O.G.G.-C., O.H.A.-M., and F.M.-M.; supervision, M.M.G.-C., O.H.A.-M., and O.G.G.-C.; funding acquisition, M.M.G.-C. All authors have read and agreed to the published version of the manuscript.
Funding
The present study was partially supported by the CONAHCYT from México (Ciencia de Frontera, funding number: 320298, provided to M.M.G.-C.).
Institutional Review Board Statement
The animal study protocol was approved by the Institutional Animal Care and Use Committee of Universidad Autónoma de San Luis Potosí (Approval No. BGFMUASLP-06-19), complied with the ARRIVE guidelines, and was in accordance with the National Institutes of Health guide for the care and use of Laboratory Animals.
Data Availability Statement
The datasets used and analyzed in the current study are available from the corresponding author upon reasonable request.
Acknowledgments
The authors thank Juan F. López-Rodríguez for their technical assistance. J.F.L.-M. is affiliated with the Bioterio of the Facultad de Medicina of the Universidad Autónoma de San Luis Potosi. O.H.A.-M. received a CONAHCYT fellowship from México during his postdoctoral training (CVU: 227179).
Conflicts of Interest
The authors declare no conflicts of interest.
References
- Martinez-Morales, F.; Zapata-Morales, J.R.; López-Rodríguez, J.F.; Galicia-Cruz, O.G.; Isiordia-Espinoza, M.A.; Aragon-Martinez, O.H. Effects of a Leucaena leucocephala leaf extract on xanthine oxidase activity and serum oxypurine levels in mice. Biotecnia 2024, 26, 211–221. [Google Scholar] [CrossRef]
- Piani, F.; Sasai, F.; Bjornstad, P.; Borghi, C.; Yoshimura, A.; Sanchez-Lozada, L.G.; Roncal-Jimenez, C.; Garcia, G.E.; Hernando, A.A.; Fuentes, G.C.; Rodriguez-Iturbe, B.; Lanaspa, M.A.; Johnson, R.J. Hyperuricemia and chronic kidney disease: to treat or not to treat. J. Bras. Nefrol. 2021, 43, 572–579. [Google Scholar] [CrossRef] [PubMed]
- Imai, S.; Nasuhara, Y.; Momo, K.; Oki, H.; Kashiwagi, H.; Sato, Y.; Miyai, T.; Sugawara, M.; Takekuma, Y. Implementation Status of Liver Function Tests for Monitoring Benzbromarone-Induced Hepatotoxicity: An Epidemiological Survey Using the Japanese Claims Database. Biol. Pharm. Bull. 2021, 44, 1499–1505. [Google Scholar] [CrossRef] [PubMed]
- Guo, X.L.; Gao, Y.Y.; Yang, Y.X.; Zhu, Q.F.; Guan, H.Y.; He, X.; Zhang, C.L.; Wang, Y.; Xu, G.B.; Zou, S.H.; Wei, M.C.; Zhang, J.; Zhang, J.J.; Liao, S.G. Amelioration effects of α-viniferin on hyperuricemia and hyperuricemia-induced kidney injury in mice. Phytomedicine 2023, 116, 154868. [Google Scholar] [CrossRef]
- Aragon-Martinez, O.H.; Martinez-Morales, F.; González-Chávez, M.M.; Méndez-Gallegos, S.J.; González-Chávez, R.; Posadas-Hurtado, J.C.; Isiordia-Espinoza, M.A. Dactylopius opuntiae [Cockerell] Could Be a Source of Antioxidants for the Preservation of Beef Patties. Insects 2023, 14, 811. [Google Scholar] [CrossRef]
- Li, Q.; Xu, Q.; Tan, J.; Hu, L.; Ge, C.; Xu, M. Carminic acid supplementation protects against fructose-induced kidney injury mainly through suppressing inflammation and oxidative stress via improving Nrf-2 signaling. Aging 2021, 13, 10326–10353. [Google Scholar] [CrossRef]
- Borges, M.E.; Tejera, R.L.; Díaz, L.; Esparza, P.; Ibáñez, E. Natural dyes extraction from cochineal (Dactylopius coccus). New extraction methods. Food Chem. 2012, 132, 1855–1860. [Google Scholar] [CrossRef]
- Ramsay, R.R.; Tipton, K.F. Assessment of Enzyme Inhibition: A Review with Examples from the Development of Monoamine Oxidase and Cholinesterase Inhibitory Drugs. Molecules 2017, 22, 1192. [Google Scholar] [CrossRef] [PubMed]
- Robinson, P.K. Enzymes: principles and biotechnological applications. Essays Biochem. 2015, 59, 1–41. [Google Scholar] [CrossRef]
- Saito, J.; Matsuzawa, Y.; Ito, H.; Omura, M.; Ito, Y.; Yoshimura, K.; Yajima, Y.; Kino, T.; Nishikawa, T. The alkalizer citrate reduces serum uric Acid levels and improves renal function in hyperuricemic patients treated with the xanthine oxidase inhibitor allopurinol. Endocr. Res. 2010, 35, 145–154. [Google Scholar] [CrossRef]
- Brandão, R.I.; Gomes, R.Z.; Lopes, L.; Linhares, F.S.; Vellosa, J.C.R.; Paludo, K.S. Remote post-conditioning and allopurinol reduce ischemia-reperfusion injury in an infra-renal ischemia model. Ther. Adv. Cardiovasc. Dis. 2018, 12, 341–349. [Google Scholar] [CrossRef]
- Pruteanu, L.L.; Bailey, D.S.; Grădinaru, A.C.; Jäntschi, L. The Biochemistry and Effectiveness of Antioxidants in Food, Fruits, and Marine Algae. Antioxidants (Basel) 2023, 12, 860. [Google Scholar] [CrossRef] [PubMed]
- Allegrini, S.; Garcia-Gil, M.; Pesi, R.; Camici, M.; Tozzi, M.G. The Good, the Bad and the New about Uric Acid in Cancer. Cancers 2022, 14, 4959. [Google Scholar] [CrossRef] [PubMed]
- Organisation for Economic Co-operation and Development (OECD) Existing Chemicals Database. Available online: https://hpvchemicals.oecd.org/UI/SIDS_Details.aspx?key=8e6ce32d-3483-48a5-ad15-58391b636d58&idx=0 (accessed on 21 August 2024).
- Abdel-Salam, O.M.; Youness, E.R.; Mohammed, N.A.; Morsy, S.M.; Omara, E.A.; Sleem, A.A. Citric acid effects on brain and liver oxidative stress in lipopolysaccharide-treated mice. J. Med. Food 2014, 17, 588–598. [Google Scholar] [CrossRef]
- Marins, J.S.; Sassone, L.M.; Fidel, S.R.; Ribeiro, D.A. In vitro genotoxicity and cytotoxicity in murine fibroblasts exposed to EDTA, NaOCl, MTAD and citric acid. Braz. Dent. J. 2012, 23, 527–533. [Google Scholar] [CrossRef]
- Park, J. H.; Jo, Y.I.; Lee, J.H. Renal effects of uric acid: hyperuricemia and hypouricemia. Korean J. Intern. Med. 2020, 35, 1291–1304. [Google Scholar] [CrossRef]
- Li, Y.; Browne, R.W.; Bonner, M.R.; Deng, F.; Tian, L.; Mu, L. Positive relationship between total antioxidant status and chemokines observed in adults. Oxid. Med. Cell. Longev. 2014, 2014, 693680. [Google Scholar] [CrossRef]
- Neshat, F.; Shirzaiy, M.; Shademan, S. Salivary Total Antioxidant and Lipid Peroxidation Levels in Passive Smoking and Nonsmoking Adolescents. Addict. Health 2020, 12, 216–224. [Google Scholar] [CrossRef] [PubMed]
- Saleem, M.; Javed, F.; Asif, M.; Baig, M.K.; Arif, M. HPLC Analysis and In Vivo Renoprotective Evaluation of Hydroalcoholic Extract of Cucumis melo Seeds in Gentamicin-Induced Renal Damage. Medicina (Kaunas) 2019, 55, 107. [Google Scholar] [CrossRef]
- Meka Kedir, W.; Dukassa Dubiwak, A.; Tofik Ahmed, E. Nephroprotective Effect of Asparagus africanus Lam. Root Extract against Gentamicin-Induced Nephrotoxicity in Swiss Albino Mice. J. Toxicol. 2022, 2022, 8440019. [Google Scholar] [CrossRef]
- Georgiev, T.; Nikolova, G.; Dyakova, V.; Karamalakova, Y.; Georgieva, E.; Ananiev, J.; Ivanov, V.; Hadzhibozheva, P. Vitamin E and Silymarin Reduce Oxidative Tissue Damage during Gentamycin-Induced Nephrotoxicity. Pharmaceuticals (Basel) 2023, 16, 1365. [Google Scholar] [CrossRef] [PubMed]
- Chávez-Moreno, C.K.; Tecante, A.; Casas, A.; Claps, L.E. Distribution and habitat in Mexico of Dactylopius Costa (Hemiptera: Dactylopiidae) and their cacti hosts (Cactaceae: Opuntioideae). Neotrop. Entomol. 2011, 40, 62–71. [Google Scholar] [CrossRef] [PubMed]
- López-Rodríguez, P.E.; Aquino-Pérez, G.; Morales-Flores, F.J.; Mena-Covarrubias, J.; Rodríguez-Leyva, E.; de Jesús Méndez-Gallegos, S. Productos no convencionales como alternativa de control de Dactylopius opuntiae Cockerell (Hemiptera: Dactylopiidae). Rev. Fitotec. Mex. 2021, 44, 417. [Google Scholar] [CrossRef]
- Nishizaki, Y.; Sato-Masumoto, N.; Yokota, A.; Mikawa, T.; Nakashima, K.; Yamazaki, T.; Kuroe, M.; Numata, M.; Ihara, T.; Ito, Y.; Sugimoto, N.; Sato, K. HPLC/PDA determination of carminic acid and 4-aminocarminic acid using relative molar sensitivities with respect to caffeine. Food Addit. Contam. Part A Chem. Anal. Control Expo. Risk Assess. 2018, 35, 838–847. [Google Scholar] [CrossRef]
- Martinez-Morales, F.; Alonso-Castro, A.J.; Zapata-Morales, J.R.; Carranza-Álvarez, C.; Aragon-Martinez, O.H. Use of standardized units for a correct interpretation of IC50 values obtained from the inhibition of the DPPH radical by natural antioxidants. Chem. Pap. 2020, 74, 3325–3334. [Google Scholar] [CrossRef]
- Gonzalez-Rivera, M.L.; Martinez-Morales, F.; Alonso-Castro, A.J.; López-Rodríguez, J.F.; Aranda Romo, S.; Zapata-Morales, J.R.; Aragon-Martinez, O.H. Matrix effect evaluation and validation of the 2,2-azino-bis (3-ethylbenzothiazoline-6-sulfonic acid) radical cation scavenging assay, as well as its application using a tejate, an ancient beverage in Mexico. Chem. Pap. 2019, 73, 2767–2781. [Google Scholar] [CrossRef]
- Martinez-Morales, F.; Zapata-Morales, J.R.; Aragon-Martinez, O.H. Evaluation of the antioxidant interaction between butylated hydroxytoluene and quercetin and their utility for beef patties preservation. Biotecnia 2022, 24, 69–78. [Google Scholar] [CrossRef]
- Serpeloni, J.M.; Grotto, D.; Aissa, A.F.; Mercadante, A.Z.; Bianchi, M.deL. Antunes, L.M. An evaluation, using the comet assay and the micronucleus test, of the antigenotoxic effects of chlorophyll b in mice. Mutat. Res. 2011, 725, 50–56. [Google Scholar] [CrossRef]
Figure 1.
Activity of samples against the XO enzyme: (a) XO inhibition graph; (b) IC50 values calculated from curves. In Figure 1b, the lowercase letters a, b, and c above the bars indicate statistical differences (p < 0.0001). The green, red, gray, blue, and black lines represent the AL, CA, V1, D1, and D2 samples, respectively. wr, with no concentration–inhibition relationship. XO, xanthine oxidase; AL, allopurinol; V1, vehicle.
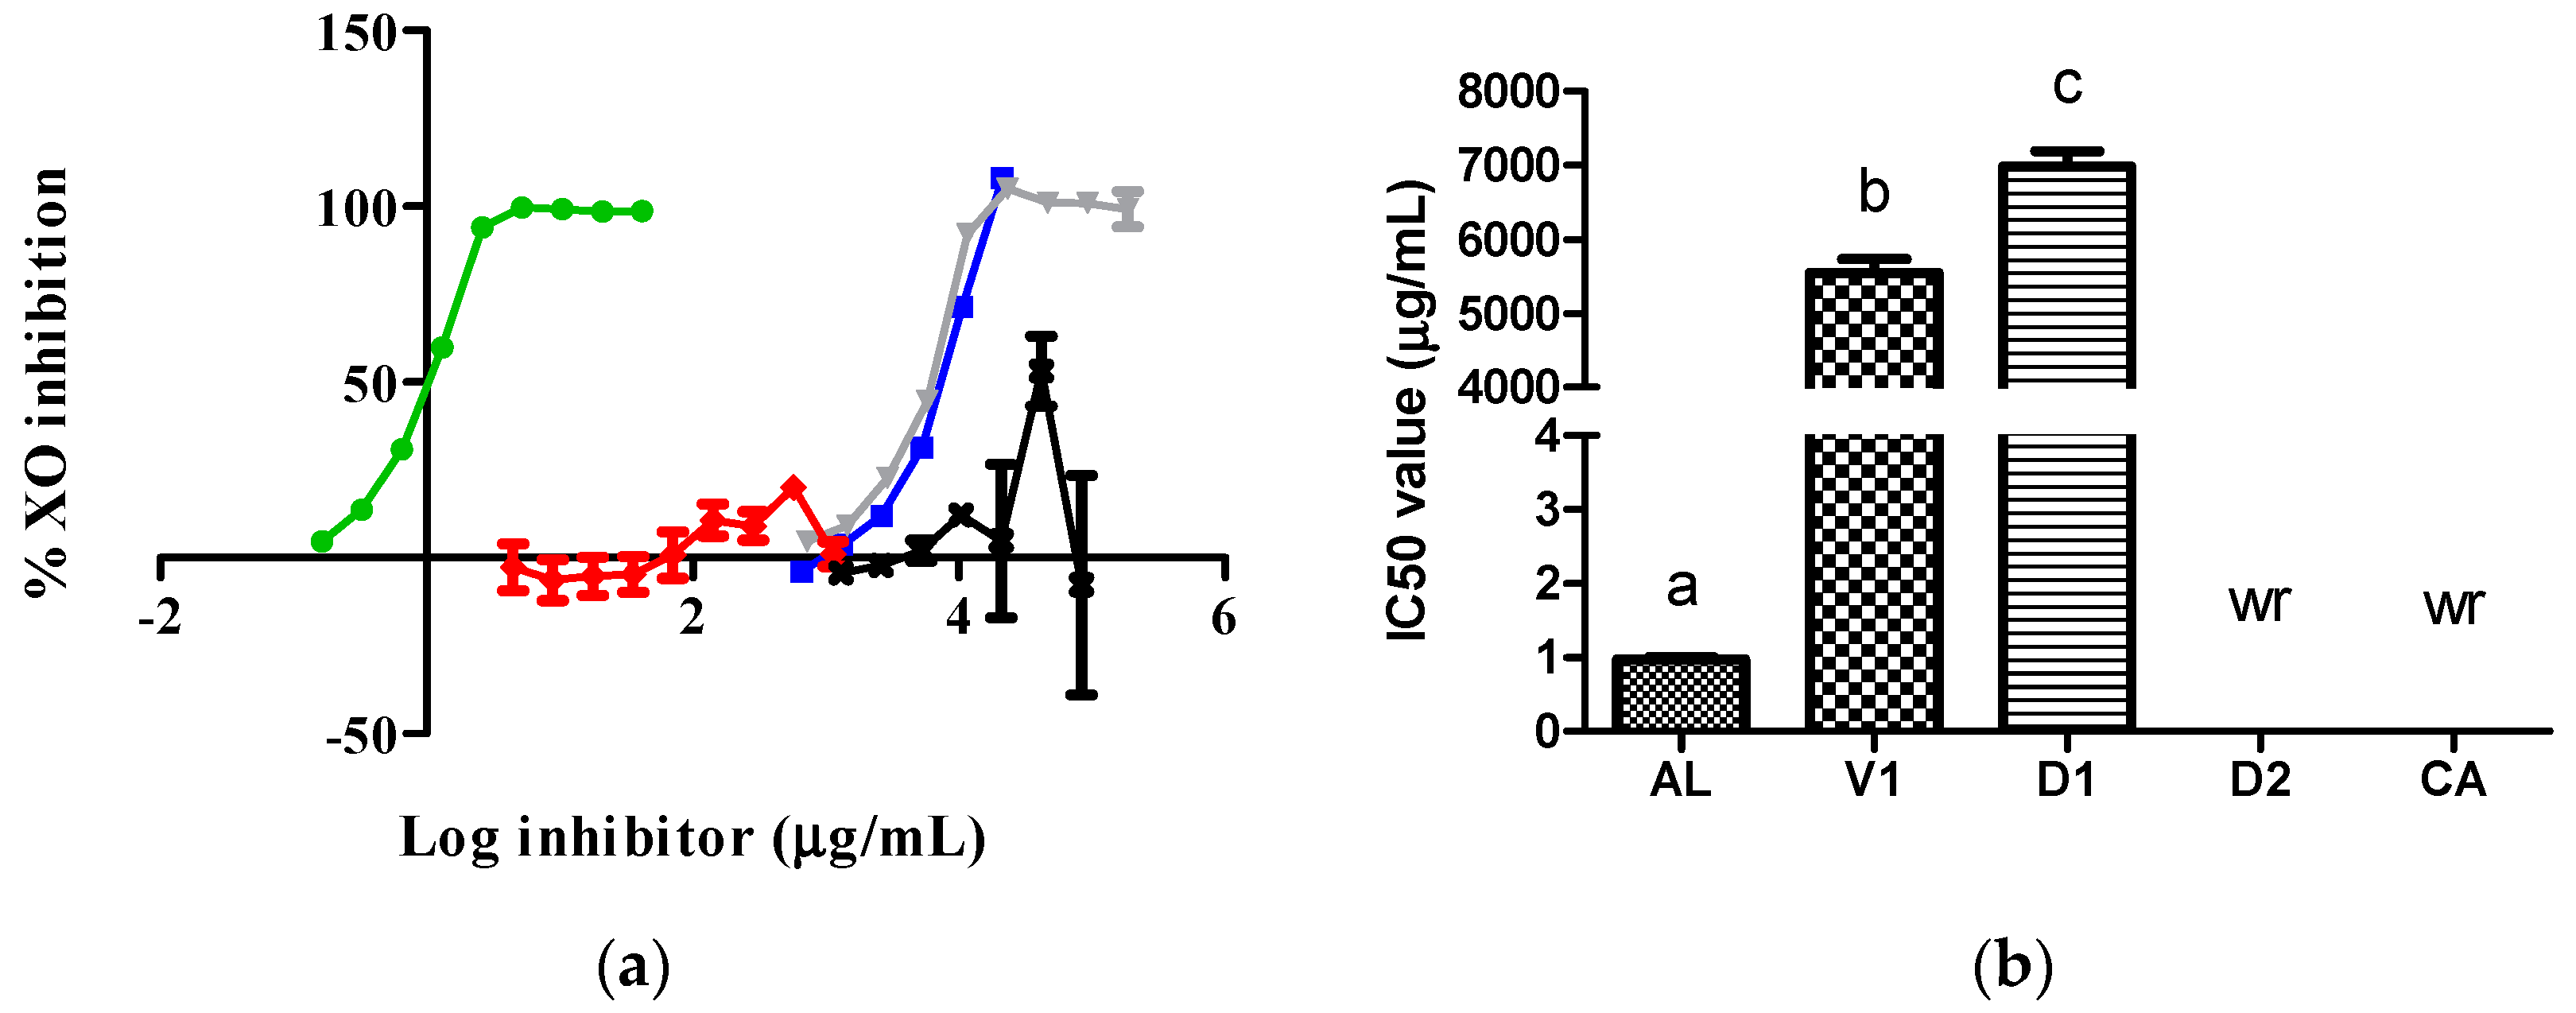
Figure 2.
Activity of samples against the ABTS radical: (a) ABTS radical inhibition graph; (b) IC50 values calculated from curves. In Figure 2b, the lowercase letters a, b, and c above the bars indicate statistical differences (p < 0.0001). The green, red, gray, blue, black, and brown lines represent the AL, CA, V1, D1, D2, and UA samples, respectively. We, with no effect. ABTS, 2,2´-azino-bis 3-ethylbenzothiazoline-6-sulfonic acid; UA, uric acid. CA and V1 data were collected from a prior evaluation [5].
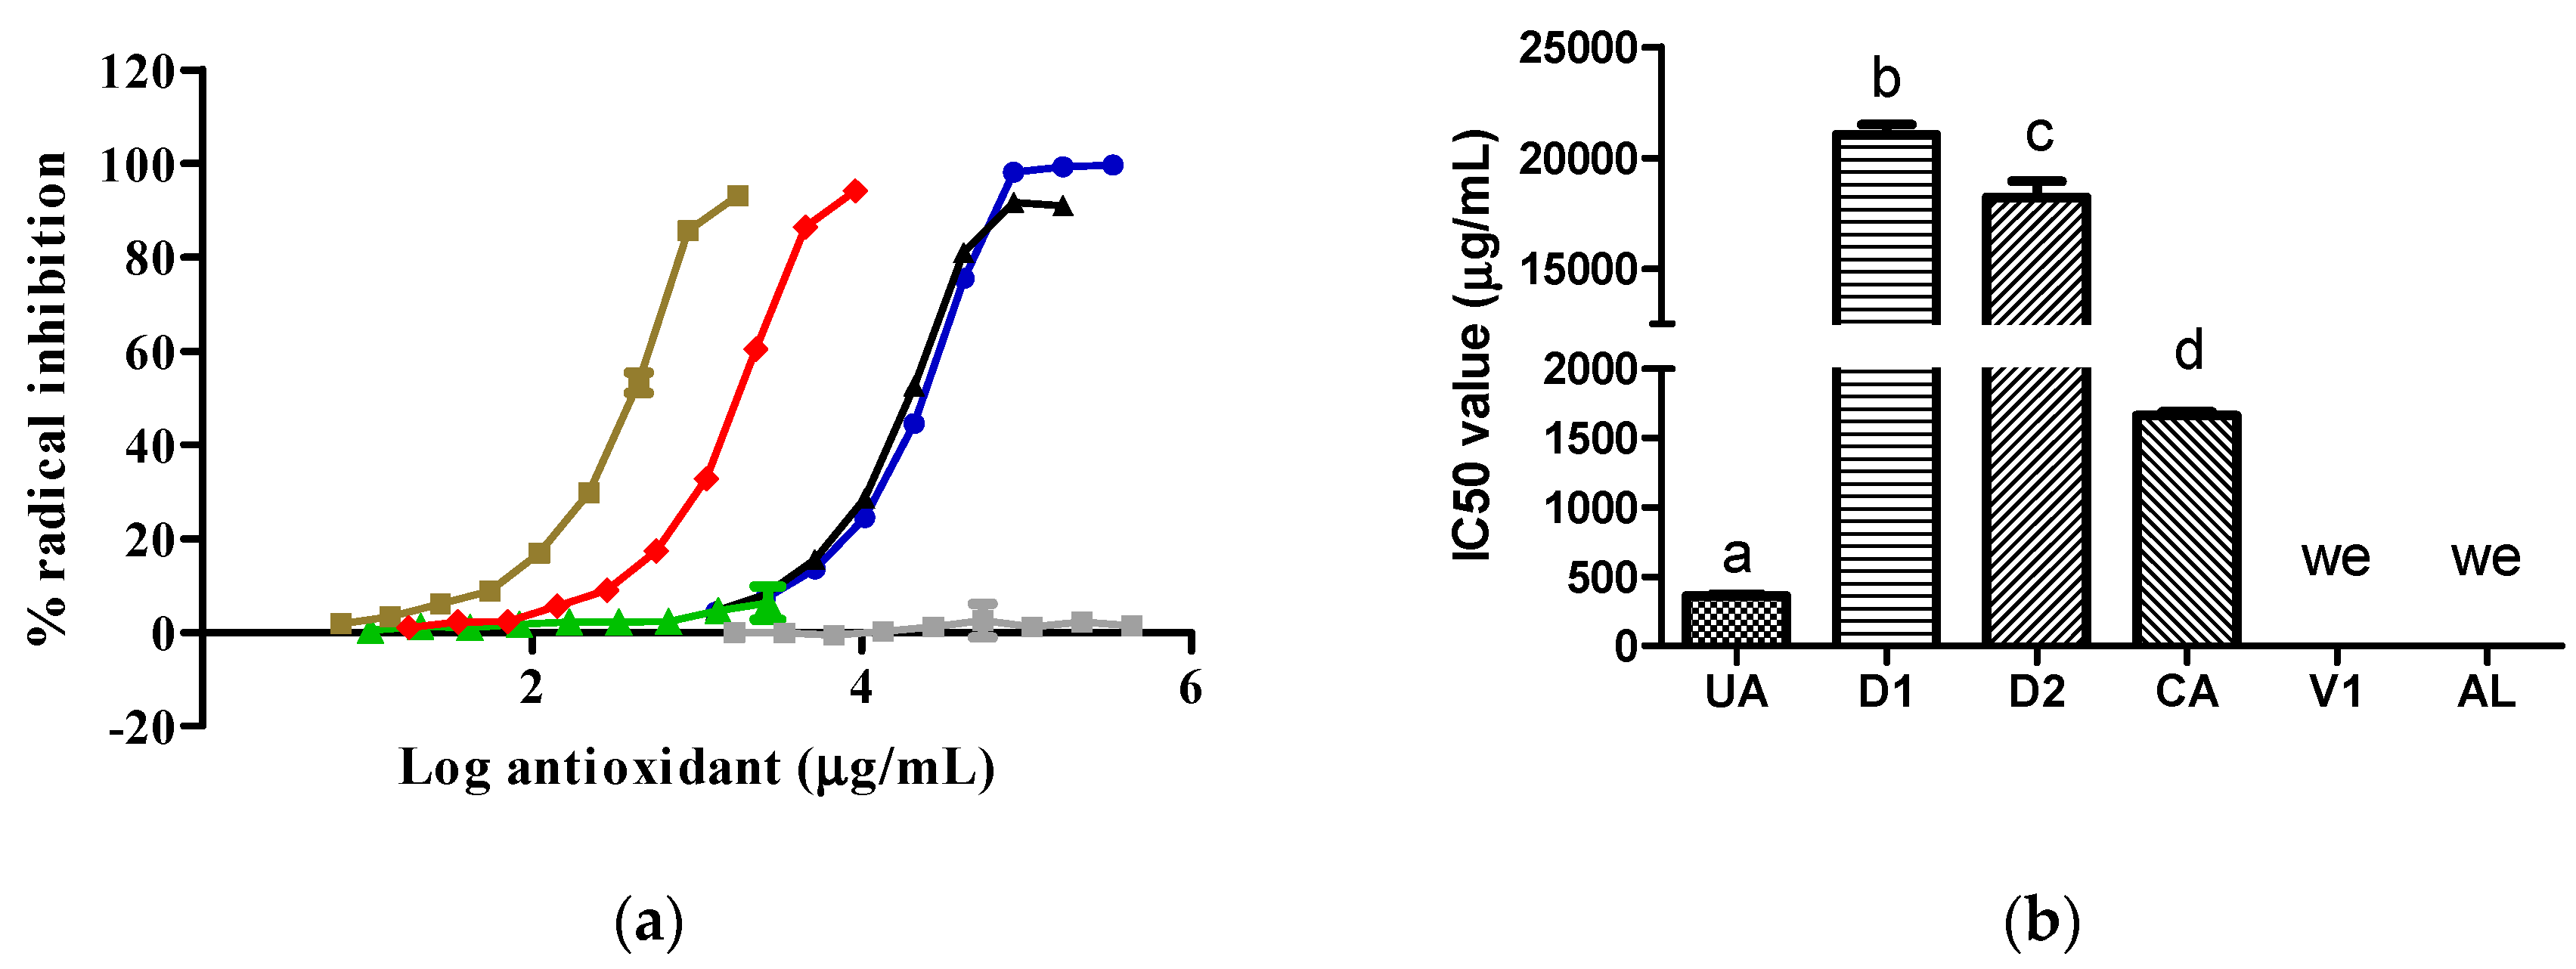
Figure 3.
Activity of samples against the DPPH radical: (a) DPPH radical inhibition graph; (b) IC50 values calculated from curves. In Figure 3b, the lowercase letters a, b, and c above the bars indicate statistical differences (p < 0.0001). The green, red, gray, blue, black, and brown lines represent the AL, CA, V1, D1, D2, and UA samples, respectively. We, with no effect. DPPH, 2,2´-diphenyl-1-picrylhydrazyl. CA and V1 data were collected from a prior evaluation [5].
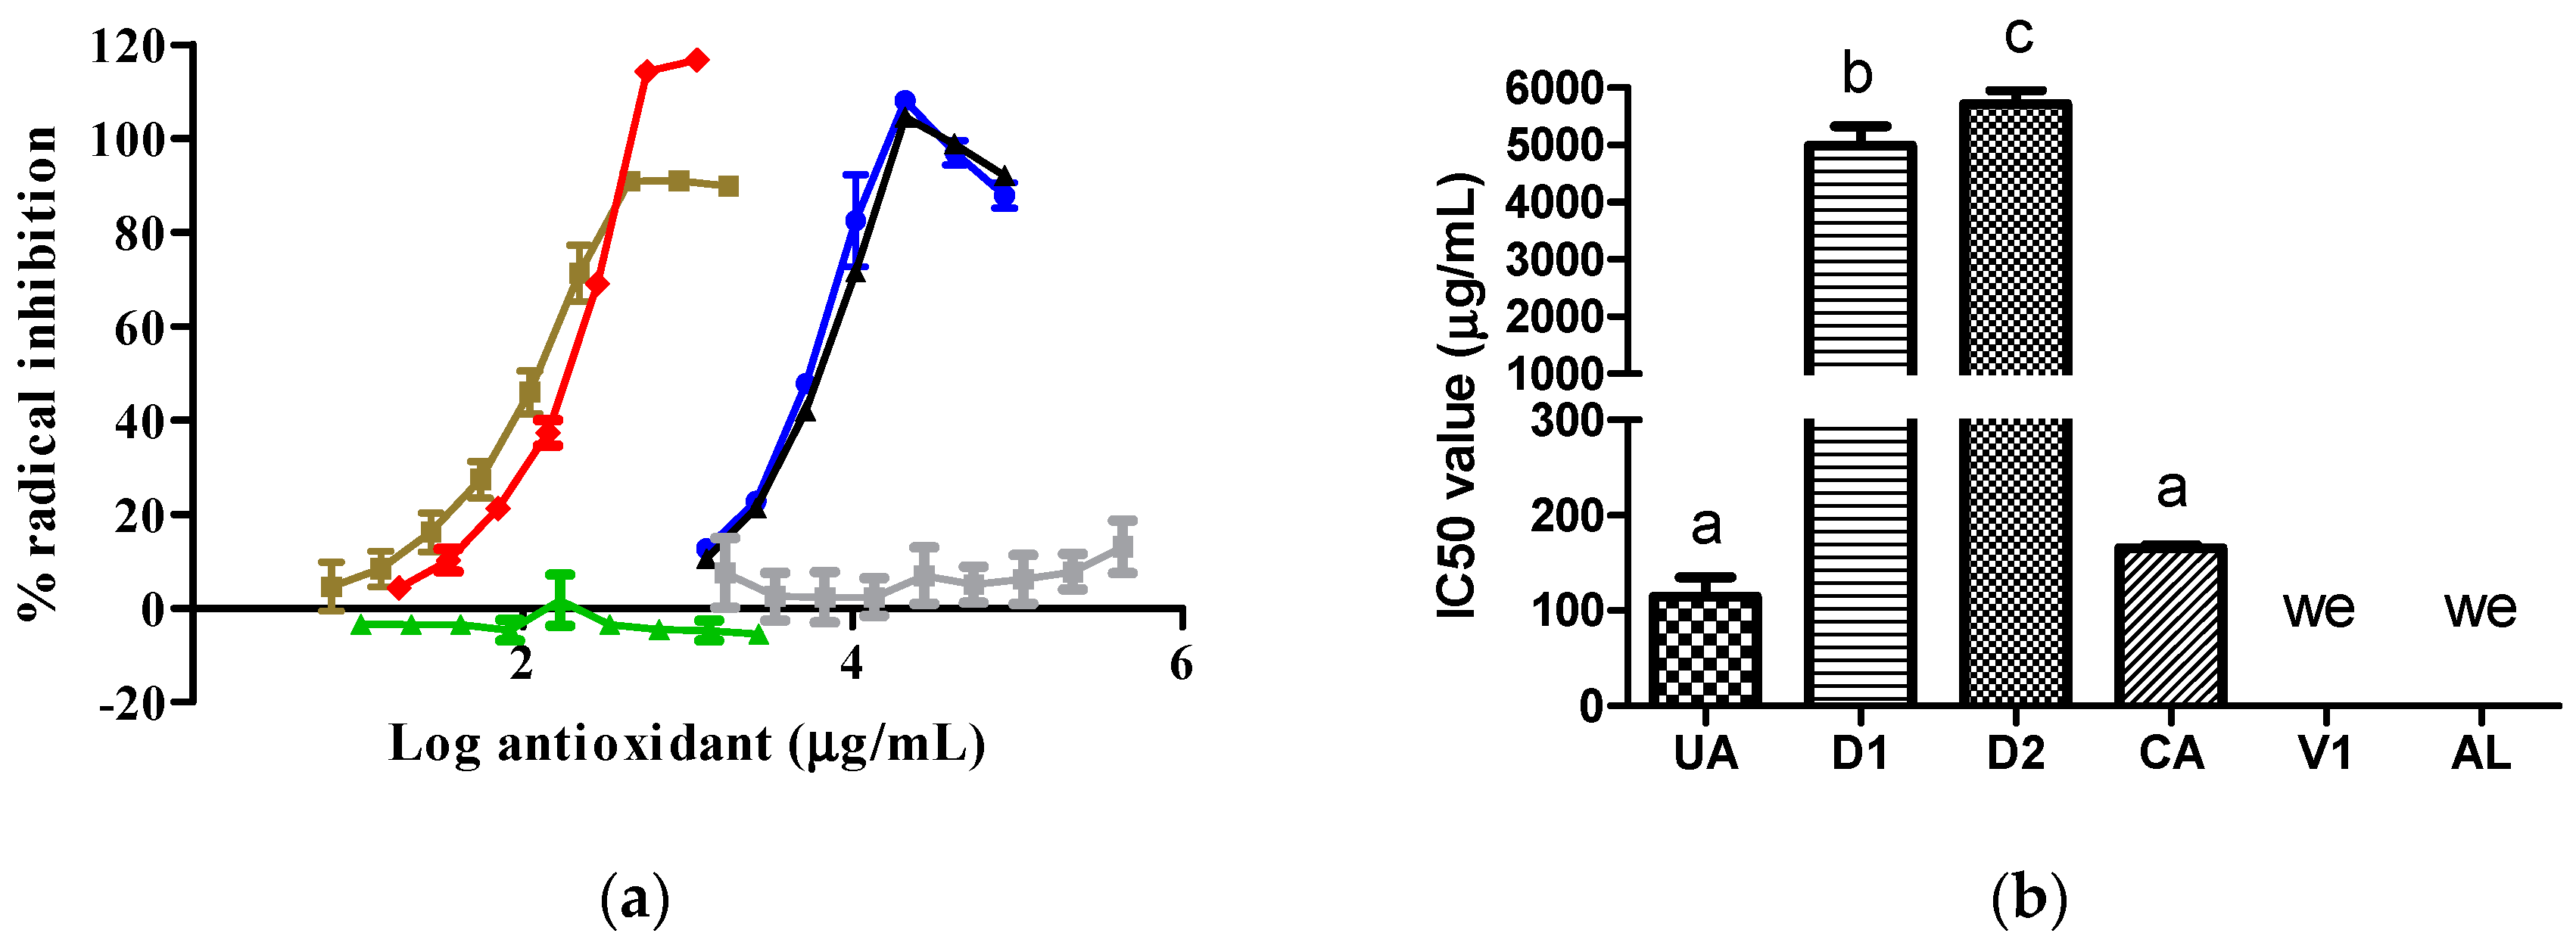
Figure 4.
Effects of therapies in mouse kidneys: (a) kidney/body weight relationship; (b) ABTS radical inhibition by kidney supernatant; (c) DPPH radical inhibition by kidney supernatant; (d) TBARS amount found in kidney homogenates. For graph a, a p value of < 0.05 versus Co and H+AL groups; b p value of < 0.0001 versus Co and H+D2 groups. For graphs b and c, a p value of < 0.0001 versus Co, H+CMC, and H+D2 groups. For graph d, a p value of < 0.05 versus the Co group; b p value of 0.0009 versus the Co group. TAC-A, total antioxidant capacity against the ABTS radical; TAC-D, total antioxidant capacity against the DPPH radical.
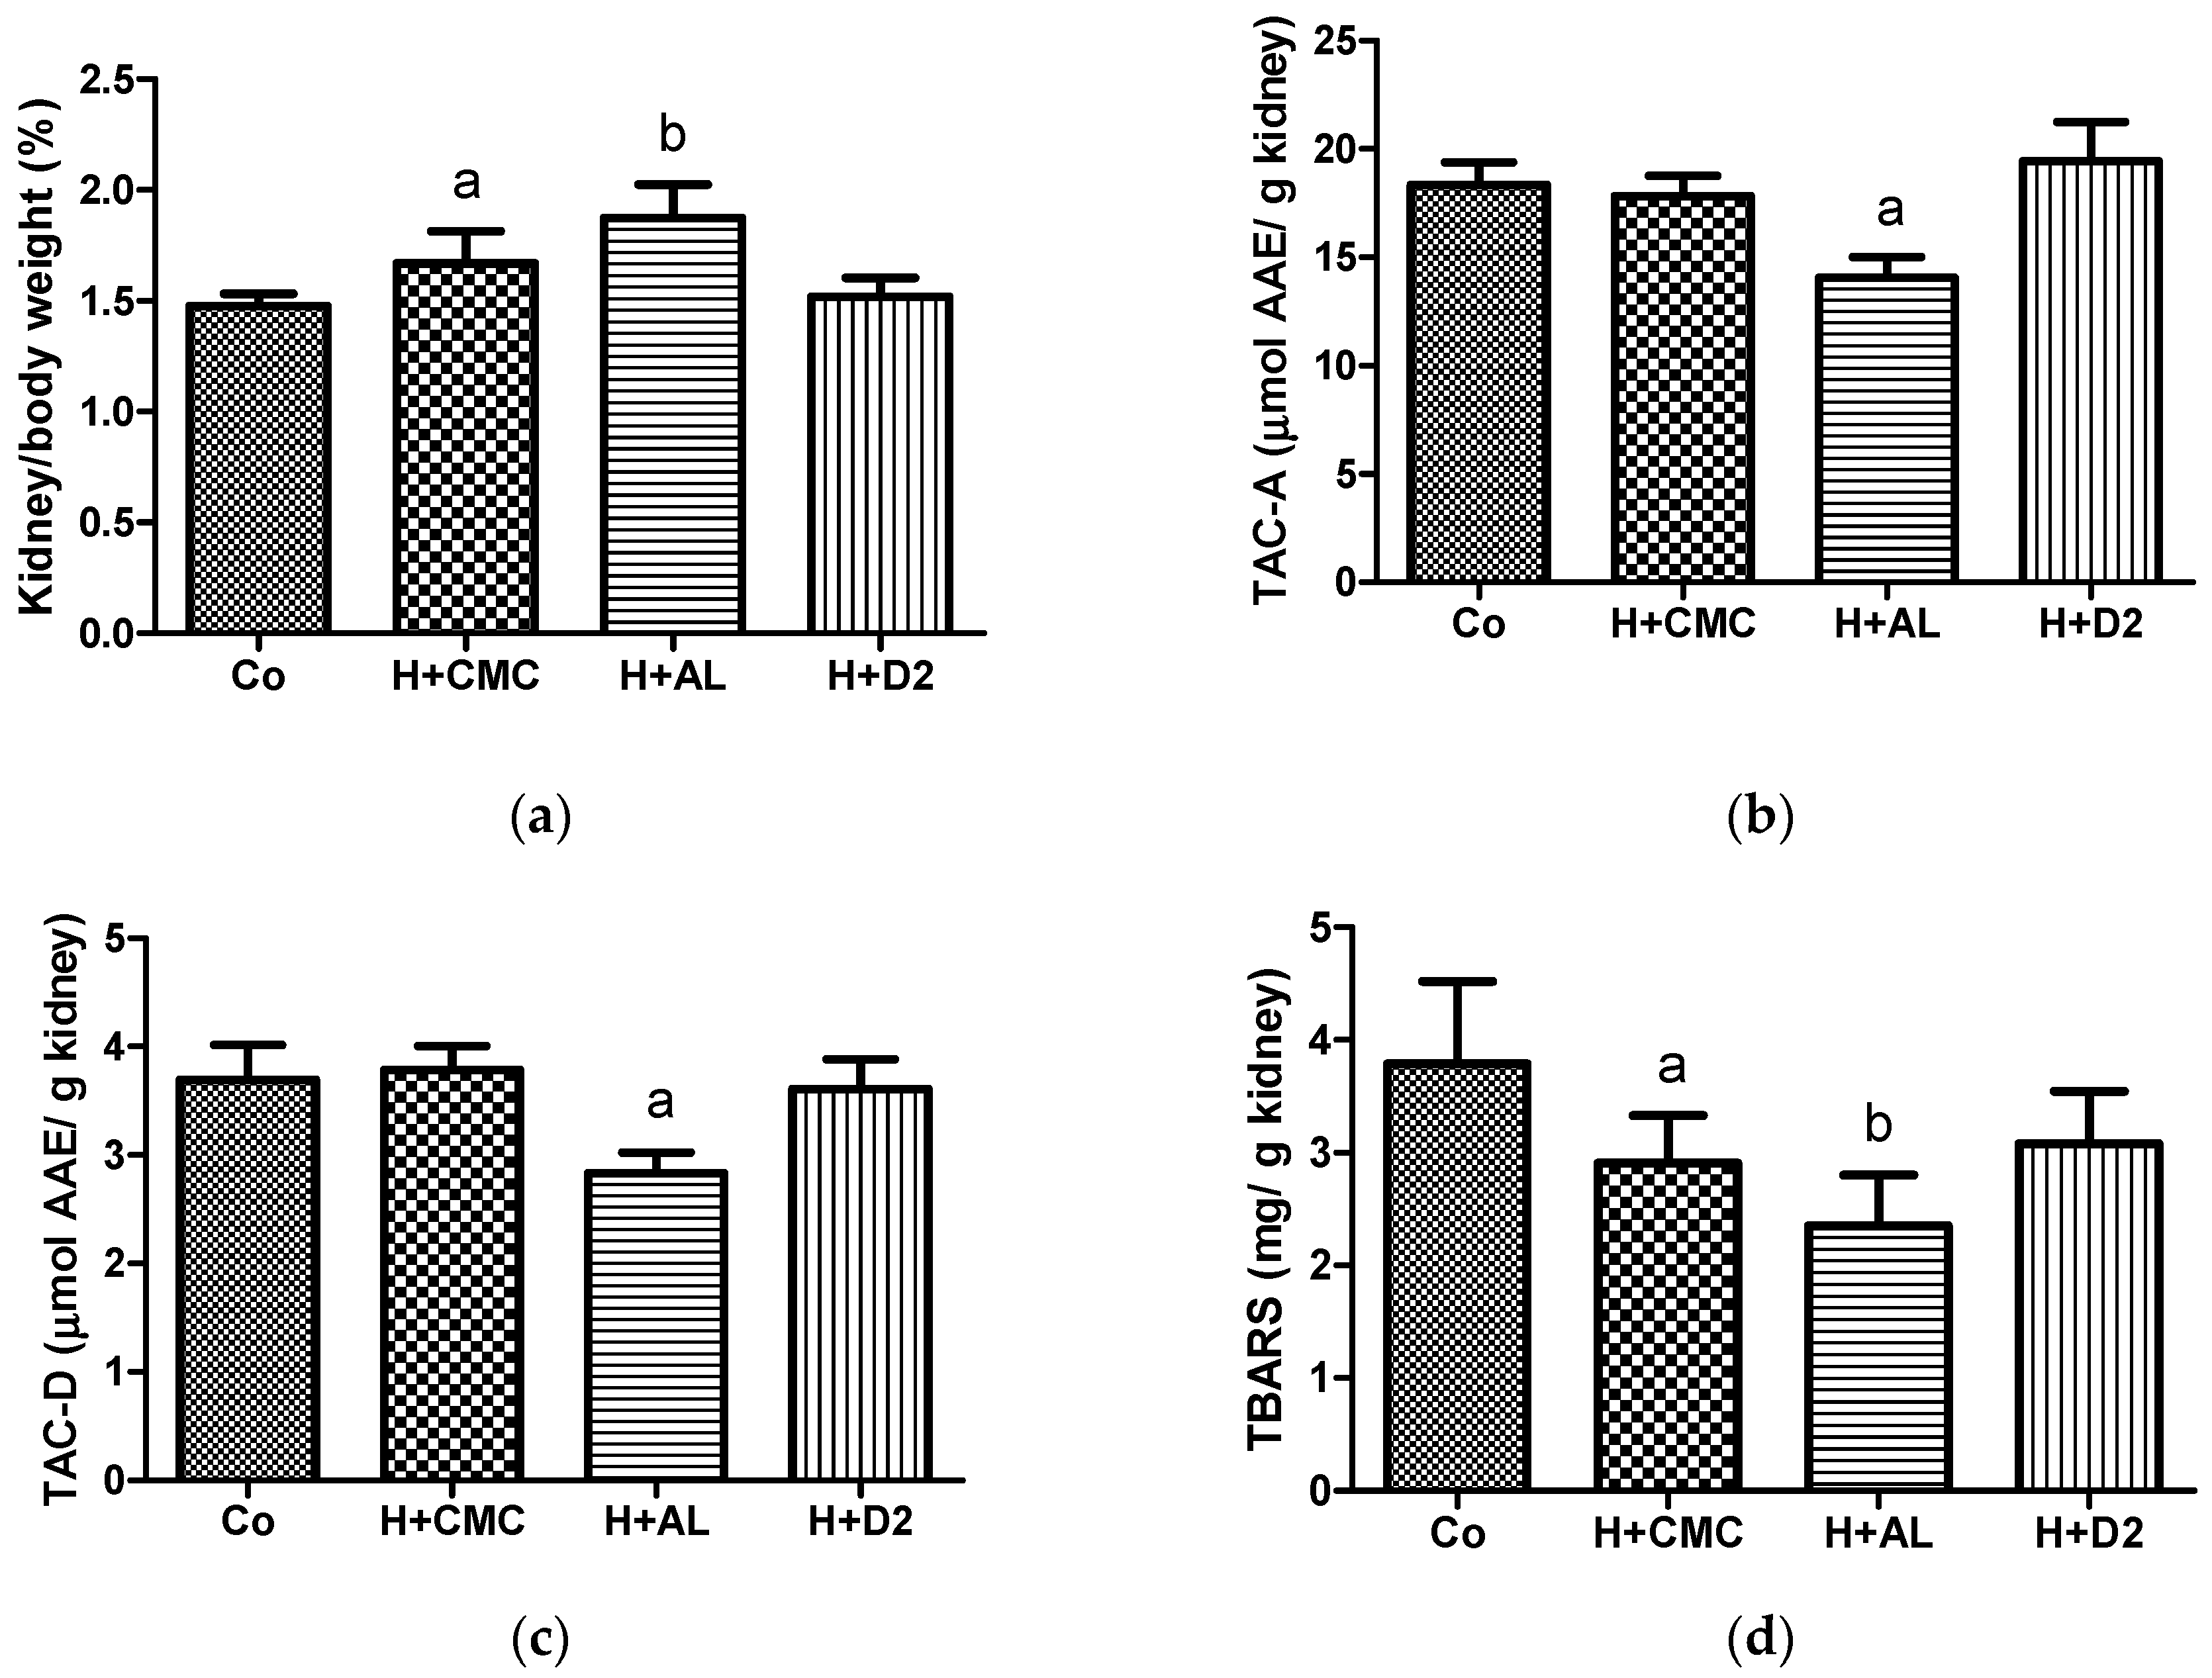

Table 1.
Results of extraction procedures.
| Parameter | D1 | D2 | p value |
|---|---|---|---|
| CA (µg/mL) | 12,734.1 ± 1751.1 | 18,037.7 ± 1016.2 | 0.0002 |
| Amount of extract (g) | 2.11 ± 0.25 | 10.05 ± 0.58 | < 0.0001 |
Every value includes the mean ± standard deviation (n = 6). CA, carminic acid; D1, extract obtained from method 1; D2, extract obtained from method 2.
Table 2.
Serum biochemical parameters evaluated in experimental animal groups.
| Parameter | Co | H+CMC | H+AL | H+D2 |
|---|---|---|---|---|
| UA (µmol/L) | 123.3 ± 47.0 | 306.1 ± 127.4 a | 29.7 ± 12.1 | 145.0 ± 24.1 |
| Hypoxanthine (µmol/L) | 3.5 ± 2.0 | 4.3 ± 0.9 | 72.4 ± 49.3 b | 12.5 ± 5.2 |
| Xanthine (µmol/L) | 2.0 ± 3.2 | 4.5 ± 2.2 | 45.7 ± 28.1 b | 13.8 ± 4.2 |
| Creatinine (µmol/L) | 14.0 ± 2.5 | 19.2 ± 5.2 | 16.5 ± 4.9 | 6.8 ± 5.8 c |
Every value includes the mean ± standard deviation. For each parameter, a superscript letter means that there is a statistical difference: a p value of < 0.0001 versus the Co, H+AL, and H+D2 groups; b p value of < 0.0001 versus the Co, H+CMC, and H+D2 groups; and c p value of 0.0011 versus the H+CMC and H+AL groups. Co, control; H, hyperuricemia; CMC, sodium carboxymethylcellulose; AL, allopurinol.
Disclaimer/Publisher’s Note: The statements, opinions and data contained in all publications are solely those of the individual author(s) and contributor(s) and not of MDPI and/or the editor(s). MDPI and/or the editor(s) disclaim responsibility for any injury to people or property resulting from any ideas, methods, instructions or products referred to in the content. |
© 2024 by the authors. Licensee MDPI, Basel, Switzerland. This article is an open access article distributed under the terms and conditions of the Creative Commons Attribution (CC BY) license (http://creativecommons.org/licenses/by/4.0/).
Copyright: This open access article is published under a Creative Commons CC BY 4.0 license, which permit the free download, distribution, and reuse, provided that the author and preprint are cited in any reuse.


