Submitted:
26 September 2024
Posted:
27 September 2024
You are already at the latest version
Preprints on COVID-19 and SARS-CoV-2
Abstract
Codon bias analysis of SARS-CoV-2 reveals suboptimal adaptation for translation in human cells it infects. The detailed examination of the codons preferentially used by SARS-CoV-2 shows a strong preference for LysAAA, GlnCAA, GluGAA, and Arg AGA infrequently used in human genes. In the absence of an adapted tRNA pool, efficient decoding of these codons requires a 5-methoxycarbonylmethyl-2-thiouridine (mcm5s2) modification at the U34 wobble position of the corresponding tRNAs (tLysUUU; tGlnUUG; tGluUUC; tArgUCU). The optimal translation of SARS-CoV-2 open reading frames (ORFs) may therefore require several adjustments to the host's translation machinery, enabling the highly biased viral genome to achieve a more favorable "Ready-to-Translate" state in human cells. Experimental approaches based on LC-MS/MS quantification of tRNA modifications and on alteration of enzymatic tRNA modification pathways provide strong evidence to support the hypothesis that SARS-CoV-2 induces U34 tRNA modifications and relies on these modifications for its lifecycle. The conclusions emphasize the need for future studies on the evolution of SARS-CoV-2 codon bias and its ability to alter the host tRNA pool through the manipulation of RNA modifications.
Keywords:
SARS-CoV-2
; codon usage
; tRNA
; epitranscriptome
; translation
1. Introduction: The Critical Role of Codon Bias in Translation Efficiency
The efficiency of genetic code translation into amino acid is of utmost importance for rapidly dividing organisms. This tedious process is carried out by the ribosome and necessitates accurate decoding of the genetic code in messenger RNA (mRNA), through the selection of transfer RNAs (tRNA). The standard genetic code is degenerate: with the exception of tryptophan (Trp) and methionine (Met), most amino acids are encoded by two or more synonymous codons, which are used unequally within a genome (Figure 1A) [1]. This non-random distribution of synonymous codons, known as codon usage bias (CUB) [2], evolved alongside the expansion of the genetic code, shaped by evolution and natural selection [3,4]. CUB affects translation efficiency based on the availability of cognate codon-specific tRNAs, the effector molecules of translation, to ensure incorporation of the correct amino acids during polypeptide synthesis through complementary codon–anticodon base pairing [5,6]. CUB varies in a given genome. Highly expressed genes typically display stronger CUB, aligning with abundant tRNAs for optimal translation [7,8]. Conversely, rare codons may be selected on purpose, particularly at the beginning of coding sequences in eukaryotes. Indeed low CUB in the 5′ region decreases the translation elongation rate and reduces the likelihood of ribosomal traffic jams as translation progresses towards the 3′ end [9]. Additionally, reducing the elongation rate can promote the recruitment of chaperons facilitating co-translational protein folding [10,11]. Notably, CUB influences gene expression beyond translation, affecting transcription efficiency [12], termination [13], chromatin structure, and splicing [14]. As CUB varies depending on the organism [15,16], it is crucial for investigating the adaptation of infectious agents in their hosts, as well as virus evolution and pathogenesis. This report focuses on these aspects using SARS-CoV-2 as a case study.
Besides the three codons that signal translation termination ((UAA, UAG or UGA), 61 codons in mRNA are decoded through sequence complementarity with tRNA anticodon. Human cells display over 270 isodecoder genes (tRNAs with the same anticodon but different body sequence) among more than 610 annotated tRNA genes. Yet there are only 49 isoacceptor families (tRNAs with distinct anticodons but incorporating the same amino acid) to decode the 21 amino acids specified by the genetic code. Thus, the efficient deciphering of the 61 amino acid codons implies that some tRNAs can recognize more than one codon.
This conundrum led to the wobble hypothesis, introduced by Francis Crick in 1966 [17], proposing that only the first two bases of the codon pair precisely with corresponding bases in the anticodon, while the third position allows for flexibility or “wobble”. Accordingly, 30–40% of all codon recognition in a given organism is achieved through tRNA wobble recognition [18]. The modified wobble hypothesis of 1991 [19,20,21] expanded on the original hypothesis by including the role of certain base modifications occurring in or near the tRNA anticodon loop (Figure 1B). These modifications, ranging from simple methyl groups, to more complex structures such as sugars, affect either the folding of the tRNA [22] or its ability to bind to codons [23]. Progressively, the impact of these modifications in almost all steps of RNA metabolism has emerged [24], and their potential consequences for translation fidelity are being characterized [21]. Currently, these modifications are recognized as major architects of the anticodon structure, capable of preventing, favoring or expanding wobble base pairing, depending on their nature and position on the tRNA [25,26].
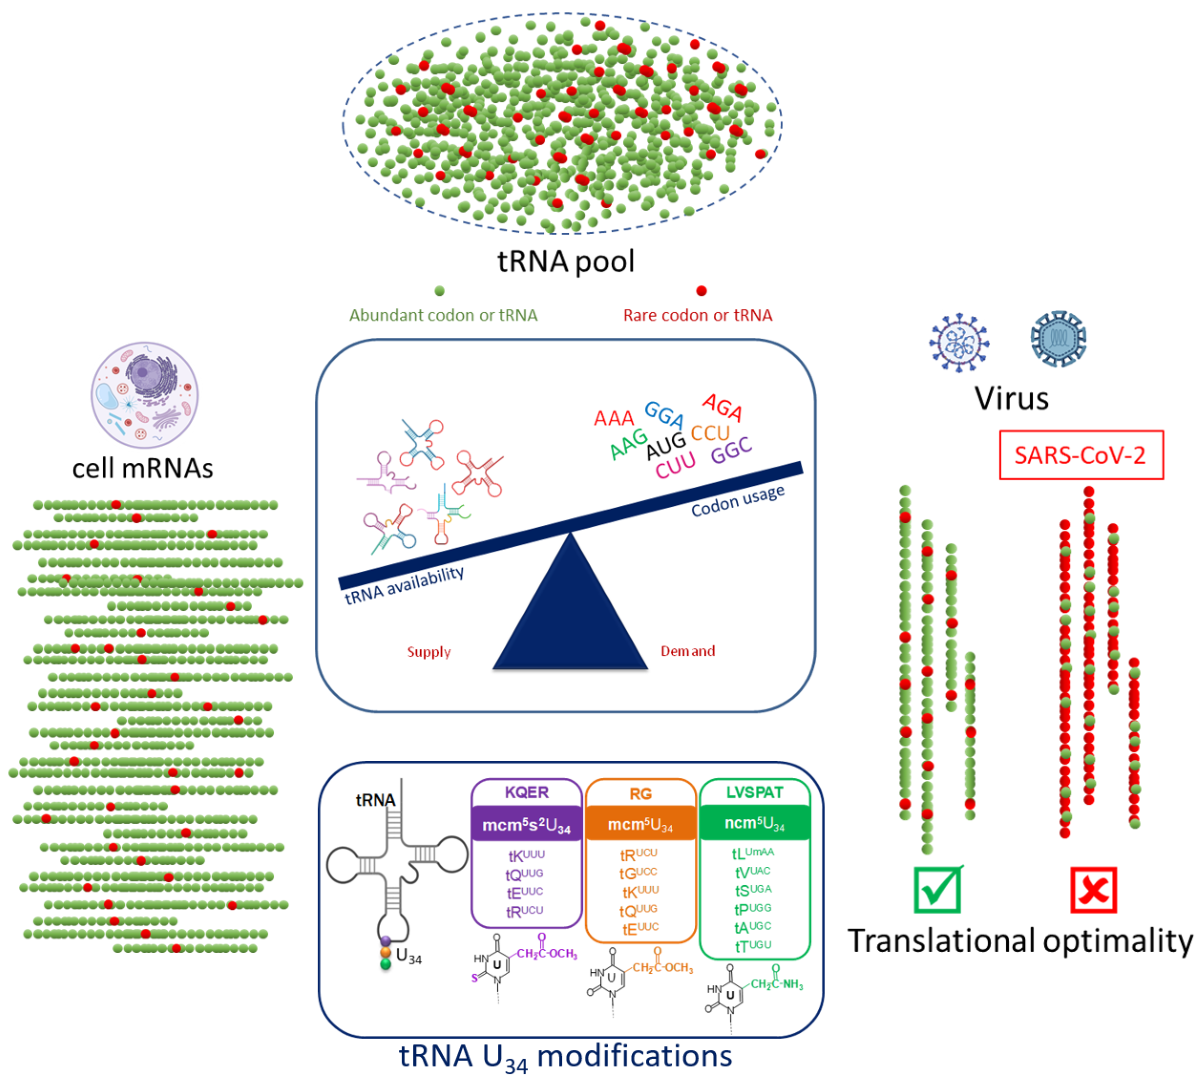
Recently, modifications in the tRNAs anticodon-loop, particularly at the U34 position of tRNA have emerged as a central pillar in controlling codon bias interpretation by the translational machinery, impacting translation fidelity [27]. Position 34 in the anticodon loop of tRNAs has indeed been identified as a hot spot for base modifications. The addition of a methoxycarbonylmethyl group at position 5 and a thiol group at position 2 (mcm5s2) of U34 in tRNALysUUU, tRNAGlnUUG, tRNAGluUUC and tRNAArgUCU, by the stepwise action of the Elongator (ELP1-6), ALKBH8, CTU1/2 multi-enzyme complex [28] enhances base pairing with A-ending codons that are infrequent in the human genome (Lys AAA; Gln CAA; Glu GAA; Arg AGA codons) (Figure 1C). The first two enzymatic steps (Elongator and ALKBH8) generate mcm5 modifications at the U34 position of two additional tRNA (tRNAGlyUCC and tRNAArgUCU) whereas Elongator alone can attach carbamoylmethyl (ncm5) to U34 of six different tRNA (tRNAAlaUGC, tRNAThrUGU, tRNAProUGG, tRNASerUGA, tRNAValUAC, tRNALeuUmAA). Additionally, KIAA1456 [29] (a human Trm9 homolog) has been recently shown to generate mcm5U directly from uridine [30]. In humans, additional modifications at position 34 include pseudouridine (Ψ), inosine (I), methycytidine (m5C) and queuosine (Q). Without these tRNA modifications, a codon-specific slowdown of translation occurs, impacting the overall translation efficiency of mRNAs enriched in corresponding codons [31,32,33].
1.2. Codon Bias and tRNA Pool
Translation efficiency cannot be explained solely by CUB, since preferentially used codons are not necessarily translated faster than non-preferred ones [34]. The overall control of translation efficiency also depends on the relationship between codon usage and the concentration of cognate tRNA. In any given organism, the set of tRNA molecules, known as the tRNA pool, is fitted to the corresponding genome’s codon bias to ensure optimal translation. This mutual alignment, measurable by the tRNA adaptation index (tAI, defined below) [35,36], defines codon optimality, indicating how efficiently a codon is translated by the ribosome. Indeed, adapting CUB to the most abundant tRNAs, decreases the time required for selecting the correct tRNAs, thereby reducing the likelihood of binding non-cognate tRNAs. In most prokaryotes and eukaryotes, there is a close correlation between tRNA level and the efficiencies of each codon–anticodon pairing. Consistent with translational selection, most optimal codons also have abundant corresponding tRNA copies in the human genome, although some still require wobble tRNAs. Yet, a close correlation between codon usage and tRNA abundance is not consistently observed, especially in multicellular organisms with higher tRNA gene redundancy [9]. In mammals, direct adaptation to anticodon pools does not fully explain synonymous codon usage, which is also shaped by mutational biases and genetic drift [35], such as GC-biased gene conversion [37]. Despite weak correlations between synonymous CUB and tRNA pools [38], the global correlation between codon and anticodon pools in mammals is strong and stable across different cell types and cell states [39,40]. Obviously, the extent of base modification in tRNAs also influences this balance especially for codons decoded through tRNA wobble recognition.
1.3. Viral Manipulation of Host Translational Machinery through tRNA Modifications
Viruses are obligatory parasites that rely entirely on the host’s translation machinery to translate their genome [41]. Numerous analyses comparing virus and host cell genomes in terms of codon usage have revealed that they use synonymous codons at different frequencies. Since discrepancy between the viral codon usage and the availability of the corresponding tRNAs in the host tRNA pool induces ribosome pausing [27], the central question we would like to bring to light is how viruses overcome the inadequacy between their own CUB and the suboptimal tRNA pool composition of the cells they infect, to efficiently translate their genome. In this context, viruses may need to maneuver host tRNAs to decode their skewed codons and optimize translation [42,43,44,45]. Moreover, because the tRNA pool in each cell type contains a subset of all the isodecoder and isoacceptor tRNAs needed for correct amino acids incorporation through complementary codon–anticodon base pairing, the differential expression of tRNA genes across tissues and individuals [46,47] may also influence viral tropism.
2. Results and Discussion
2.1. Analysis of SARS-CoV-2 Codon Bias
Severe acute respiratory syndrome coronavirus 2 (SARS-CoV-2) is the causative agent of the recent devastating coronavirus disease 2019 (COVID-19) pandemic [48,49], which has infected over 600 million people and caused more than 6 million deaths worldwide (https://covid19.who.int). Coronaviruses belong to the order “Nidovirales”, with those infecting humans falling into two genera: alphacoronaviruses (HCoV-229E and HCoVNL63), and betacoronaviruses (HCoV-HKU1, HCoV-OC43, Middle East respiratory syndrome coronavirus (MERS-CoV), the severe acute respiratory syndrome coronavirus (SARS-CoV1 and SARS-CoV-2). Since SARS-CoV-2 belongs to the same genus as SARS-CoV-1 and MERS-CoV, they share several structural characteristics [50] briefly outlined below [51,52].
SARS-CoV-2 is an enveloped virus with a positive-sense, single-stranded RNA genome of ~30 kb. Upon cell entry, two overlapping open reading frames (ORFs) ORF1a and ORF1b are translated from the positive strand genomic RNA (Figure 2A). The translation of ORF1b involves a -1 ribosomal frameshift enabling read-through of the ORF1a stop codon. ORF1a and ORF1b encode continuous polypeptides that are processed into 16 nonstructural proteins (Nsps) [53,54]. The viral genome is then used by the viral RNA-dependent RNA polymerase, Nsp12, to produce negative-strand RNA intermediates that serve as templates for the synthesis of positive-strand genomic RNA and subgenomic RNAs [55,56]. The subgenomic transcripts contain a common 5' leader sequence fused to different segments from the 3′ end of the viral genome [57], along with a 5′ cap structure [58] and a 3′ poly(A) tail [59]. They encode four conserved structural proteins: spike protein (S), envelope protein (E), membrane or matrix protein (M), nucleocapsid protein (N), along with several accessory proteins. By homology with SARS-CoV1, SARS-CoV-2 is predicted to translate 9 accessory proteins [60]. Nevertheless, the current annotation of SARS-CoV-2 (Reference Sequence: NC_045512.2) includes only 6 accessory proteins (3a, 6, 7a, 7b, 8, and 10), and not all of these ORFs have been experimentally reproducibly confirmed [61,62]. Using ribosome profiling techniques, the accurate quantification of canonical viral ORFs expression was established, along with 23 novel unannotated viral ORFs [63]. These include several in-frame internal ORFs lying within existing ORFs, resulting in N-terminally truncated products, and internal out-of-frame ORFs producing novel polypeptides.
2.1.1. Codon Bias Analysis: A Tool to Shed Light on Virus History, Origins and Evolution
It is well established that mutation pressure and natural selection are the primary factors shaping the codon usage of an organism [64]. Codon usage can also be influenced by nucleotide composition, synonymous substitution rate, gene length, expression level, and transfer RNA (tRNA) abundance [65,66]. Due to their reliance on host tRNA, viruses may evolve their codon usage to optimize or deoptimize translation in relation to their host’s codon usage [67,68]. Therefore, exploring the codon usage of viral genes is critical for uncovering viral evolutionary history [69], understanding virus-host interactions, and identifying the evolutionary forces shaping viral genomes [70,71]. Such information can also help characterize newly emerging viruses and trace their propagation across different host species.
Codon analysis toolbox
The level of bias can be investigated according to widely used bioinformatic tools:
Codon Adaptation Index (CAI) - The CAI estimates the degree of adaptation between a gene segment or an entire virus genome, and a potential host [72,73,74]. It compares the codon usage in the viral sequence to a reference set of highly expressed genes from the host which are assumed to use the most optimal codons for the host’s translational machinery. The CAI value ranges from zero to one, with one indicating that a gene uses the most frequently synonymous codon for each encoded amino acid, and values close to zero indicating the use of less common synonymous codons. Higher CAI values between different genes on genome segments, indicate a better adaptation to the host’s cell translational machinery. However, the CAI index is not strictly speaking a measure of CUB as codon usage is inherently multivariate and requires complementary approaches for comprehensive analysis.
Plotting the effective number of codons (Nc plot) – Nc plots graph the effective number of codons used (Nc) against the G+C frequency at the third base position of the codon (GC3s). This quantifies how far a gene’s codon usage deviates from equal usage of synonymous codons [75]. Neutrality plots, which plots GC1+2 (mean G+C frequency at the 1st and 2nd position) against GC3 for each gene, are commonly used alongside Nc plots to estimate the respective contribution of mutation pressure and natural selection in shaping the CUB [76,77,78]. The slope of the curve in neutrality plots indicates the percentage contribution of mutual pressure to the overall codon bias.
Relative Synonymous Codon Usage (RSCU) - RSCU determines the intrinsic preference of a given cell or virus gene for synonymous codons by calculating the ratio of observed codon frequency to the expected frequency, assuming equal usage of all synonymous codons for the same amino acid [79,80]. The codon bias is considered positive for RSCU > 1.6 and negative for RSCU < 0.6, and unbiased for values in between.
tRNA Adaptation Index (tAI) - The tAI quantifies translational efficiency in a given context by considering the availability of tRNAs for each codon, factoring in wobble base pairing efficiency (Wi) [81]. The normalized Wi values indicate the nominal speed at which the ribosome translates a codon relative to tRNA concentration, gene copies and pairing efficiency. The tAI of a gene reflects the adaptation of its coding sequence to the intracellular tRNA pool, providing a measure of translational efficiency complementary to CAI, Nc and RSCU [82]. If tRNA levels are not available, tRNA gene copy number can be used instead [36,83] and retrieved from dedicated database GtRNAdb [84] (http://gtrnadb.ucsc.edu).
2.1.2. SARS-CoV-2 Adaptation to Various Species
Several reports based on state-of-the-art bioinformatics suggest that SARS-CoV-2 originated from an ancestral coronavirus in bats, specifically related to the bat RaTG13 coronavirus [85], that likely passed through intermediate hosts such as pangolin (Manis javanica) before crossing species barriers again to infect humans [86,87,88]. We performed CAI [73] comparisons of the Wuhan reference strain NC_045512 of SARS-CoV-2 (weighted by the size of each ORF) against codon usage table (CUT) of several species from the HIVE-CUTs database (https://hive.biochemistry.gwu.edu/cuts/). Our analysis confirmed a high degree of SARS-CoV-2 codon usage adaptation to both pangolin and bat (Figure 2B), supporting their proposed role as animal sources for this emerging virus. Interestingly, our analysis also revealed an even higher adaptation index to snakes (Naja atra among others) and to the marsupial wombat (Vombatus ursinus), suggesting these animals may also be relevant in understanding the virus's transmission. Interestingly, the hypothesis that snake could serve as a potential intermediate host of SARS-CoV-2 between bats and humans has been debated [89,90,91] and remains plausible considering that snakes are common wildlife meal of Chinese people and are ordinarily sold at the Wuhan seafood and animal market [92]. The wombat seems less likely since it only lives in Australia. However, the recent trend among wealthy Chinese people to hunt wombats in Australian lodges [93,94] makes it a tiny but potential virus transmission niche. Global CAI analysis of SARS-CoV-2 ORFs shows oscillations around the 0.69 mark (Figure 2A), indicating that none of the multiple ORFs are fully adapted to their human host codon preferences, with some regions showing poor adaptation with CAI values below 0.6, compared to CAIs of 0.869, 0.882, and 0.819 for the well-adapted highly expressed β-globin, β-myosin and β-tubulin humans genes with protein abundance above 10,000 ppm, and CAI values below 0.78 for the poorly expressed RHA, RIG-I and Kallmann Syndrome human genes (protein abundances below 300 ppm) [95].
2.1.3. Nc and Neutrality Plots
If GC3s is the only determinant factor shaping the codon usage, the Nc values would align with a dotted theoretical curve representing random codon usage [96] (Figure 3A and 3B). If G+C compositional constraint alone influences the codon usage the gene of interest, then the GC3s and Nc correlated spots would lie on or below the expected curve. Nc values range from 20 to 61. A value of 20 indicates a maximum level of codon bias, whereas a value of 61 indicates a complete lack of bias. In general, if the Nc value is ≤ 35, the coding sequence is considered to have significant codon usage bias. The Nc-GC3s plot has been widely used to determine whether codon usages of given genes are affected by mutation only (corresponding points would lie around the expected curve) or also by other factors such as selection (corresponding points would depart away from, considerably below the expected curve). When the Nc and GC3s values were plotted for the individual SARS-CoV-2 ORFs (Figure 3A, right), all points, except for ORFs 7a and 10, lied below the expected random curve, indicating that G+C compositional constraints might significantly influence SARS-CoV-2 codon usage. The deviation of almost all SARS-CoV-2 ORFs from the random curve towards the lower Nc-values suggests that not only mutation but also other factors, such as translational selection, are likely to be involved in determining the selective constraints on codon bias in SARS-CoV-2 genes towards a preferred and limited set of codons. As a reference to human genome, translational selection is much more pronounced in housekeeping genes [97] such as Globin, Myosin and Tubulin than in poorly expressed humans genes (DHX9, DDX58, IFN-beta, or KAL) as outlined in the corresponding Nc plot (Figure 3A, center). Accordingly, the weighted average for all SARS-CoV-2 ORFs (black dot with Nc=45.1 and GC3s=0.28 in Figure 3A) markedly differs from other RNA viruses such as the Flaviviridae Zika virus ORFs (Figure 3A, left), that also have a bias towards A-ending codons [98,99,100], showing a much lower GC content and overall Nc value for SARS-CoV-2, stressing again the unique codon-wise characteristics of SARS-CoV-2. The same analysis was performed for Orf1a and Spike gene segments of various Coronavirus (Figure 3B) including SARS-CoV-2 (Wuhan initial reference isolate and Omicron recent isolate), SARS-CoV-1, MERC-CoV and various hCoV lineages (229E, OC43 and NL63). We observed that all points representing different strains were lower than the standard curve for both genes, Orf1a showing more dispersion on the Nc axis than Spike. Additionally, with the exception of SARS-CoV-2 Orf1a (Wuhan and Omicron), the coronavirus strains were not clustered together, highlighting again that mutational pressure combined with other factors may have contributed to the codon usage bias of SARS-CoV-2. Spike Nc plot shows more clustering between strains revealing less bias between strains for this gene segment, with a potential higher contribution of mutational pressure to the Spike codon bias. This was further confirmed with the complementary neutrality plot analyses (Figure 3C) that revealed the greater contribution of mutation pressure to Spike than to Orf1a CUBs (Spike:32% >> Orf1a:23%), while the relative constraints on GC3 (natural selection) being the main evolutionary force driving CUB is conversely higher for Orf1a (Orf1a:77% >> Spike:68%).
2.2. SARS-CoV-2 Genome is Enriched in U34-Sensitive Codons
With the lack of information on the level of virus-mediated alteration of U34 tRNA modification in mind, we compared U34 sensitive codon frequencies in coronaviruses (HCOV-OC43, SARS-CoV-1, MERS-CoV and SARS-CoV-2) and human genomes using the RSCU indicator [15]. A striking contrast emerged when these frequencies were arranged in clusters (Figure 4). Codons preferred by SARS-CoV-2 are (i) barely used in human cells and (ii) predominantly include codons requiring U34 modifications on their cognate tRNAs for efficient decoding (with the exception of Gly (GGA)). Notably, SARS-CoV-2 exhibits a greater divergence from human codon frequencies compared with SARS-CoV-1 and MERS-CoV. Although the latter still shares some codon usage preferences with humans, SARS-CoV-2 contains a clear enrichment in U34-sensitive codons. This pattern was consistent across both nonstructural (Orf1a and Orf1b) or structural viral genes (Spike). U34-sensitive codon usage between SARS-CoV-2 and humans revealed a significant viral preference for U34-sensitive codons with up to two-fold enrichment for some codons such as GlnCAA, ArgAGA, and LeuTTA. (not shown).
2.2.1. Comparison of Coronavirus Translation Adaptation (tAI)
Previous CAI measurements have the disadvantage of relying on highly expressed reference host genes. The translation adaptation index (tAI) offers a more nuanced approach as it can be based on either intracellular tRNA levels (when available) or tRNA gene copy numbers in the host genome. Here, we compared tAI of various ORFs encoding non-structural (ORF1ab) and structural proteins (S, E, M and N) among coronaviruses infecting humans. Our analysis revealed SARS-CoV-2 as the least adapted to the translational machinery of its human host, with all its ORFs having tAI below 0.34, excepted for the Matrix protein (M) (Figure 5A). This tAI level obtained for SARS-CoV-2 is significantly lower than that observed for human ORFs encoding highly abundant proteins (such as β-myosin, β-globin, or β-tubulin). Calculations were performed using human tRNA gene copy number retrieved from the genomic tRNA database (http://gtrnadb.ucsc.edu) known to mirror the global tRNA abundancy of a given organism but lacking information related to tissue specificity. However, it seems from the recent of the Nedialkova’s group [101] that tRNA transcript levels may fluctuate without affecting significantly tRNA anticodon pools abundancy and availability that primarily dictate decoding pace. Accordingly, tRNA anticodon pool was shown to remain stable across cell types (human primary cells (cardiomyocytes (CM), neuronal precursor cells (NPC) and mature neurons) differentiated from iPSC cells) ensuring consistent decoding rates throughout development, independently of cell identity. This stability across cell types of tRNA pool was further authenticated by plotting normalized tRNA gene copy number (GCN) against the normalized experimental data of tRNA anticodon expression level in these human primary cells (Figure 5B), showing a quasi-constant correlation between GCN and experimental tRNA levels in the four cell types. This observation validates the use of human tRNA GCN in the calculation of aforementioned tAI used in Figure 5A.
2.2.2. The Enigma of Spike Protein’s Furin Cleavage Site
Among the SARS-CoV-2 ORFs, the region encoding the spike protein has been extensively studied as it mediates attachment to the host cell by binding to the ACE2 membrane protein and facilitates viral fusion to the host cell membrane following efficient cleavage by furin proteases [102,103]. Early examination of the Wuhan SARS-CoV-2 isolate early revealed an unusual furin-like cleavage site at the S1/S2 junction of spike ORF [104,105]. This site, created by insertion of a 4-amino acid sequence (PRRA), corresponds to the insertion of 12 nucleotides (...U CCU CGG CGG GC...) absent from all other sarbecoviruses, including the closely related bat sarbecovirus RaTG13 with ~96% genome sequence identity [48], [106] (Figure 6A). In SARS-CoV-2, the furin site insertion lies in a region where codons are moderately adapted to the human host, as depicted by the CAI curve. Most codons in this region are commonly used in the virus genome (high RSCU), except for the arginine dicodon (CGG CGG (R R)). Interestingly, the corresponding unique CGG codon is less preferred than AGA in SARS-CoV-2 (SARS-CoV-2 RSCUCGG=0.17, SARS-CoV-2 RSCUAGA=2.63,)), which is not the case in the human genome (human RSCUAGA =1.29, human RSCUCGG =1.21) (Figure 6C). During the pandemic, mutations impacting the furin site have been rare, suggesting a strong purifying selection in humans [107,108]. However, non-arginine residues in the PRRAR motif remain permissive to potential optimization during human viral evolution in different variants of concern and interest (Figure 6B). This complex interplay between codon usage and furin site evolution warrants further investigations to unravel its significance in SARS-CoV2 origins.
2.3. Suitability of the SARS-CoV2 Highly Biased Codon Composition for Viral Translation in Target Tissues
The translation efficiency of the viral genome is heavily influenced by codon optimality, which is determined by the balance between the viral codon usage bias and the availability of a suitable tRNA pool in target cells. However, recent reports highlighted the significant variability in tRNA gene expression across human tissues [46,109,110,111]. This variability suggests the necessity to reevaluate codon optimality by considering tissue-specific codon usage in compliance with virus tropism [112]. Whereas the evaluation of the effect of tissue-specific codon optimality on viral protein synthesis may remain experimentally elusive, a recent in silico study by Hernandez-Alias et al. [113] analyzing the relative codon usage landscape over 500 human-infecting viruses alongside with tissue-specific tRNA expression profiles from 23 human tissues from The Cancer Genome Atlas (TCGA), has suggested that tRNA repertoires could determine tissue-specific translational efficiency [114]. They proposed that the SARS-CoV-2 proteome was well-adapted to tissues like the upper respiratory airways, lung alveoli [115,116] and gastrointestinal tract [117], seemingly matching the observed SARS-CoV-2 tropism. However, the translation appropriateness of these tissues was also matching with other viruses such as Flavivirus or Alphavirus that exhibit tropisms that do not share one shred of similarity with SARS-CoV-2 tropism. Several flaws of this study, including the use of tRNA abundance data derived from cancer cells in which profound deregulation of tRNA expression occurs [118,119,120,121], restrict its significance. Interestingly, recent studies showed that highly expressed genes in human lung primary tissue have a codon composition perfectly aligned with SARS-CoV-2 codon usage, suggesting that the virus might have optimized its codon bias to take advantage of lung cells [122]. The recent Nedialkova’s report [101] that illustrated the broad stability of tRNA anticodon pools across human cell types (shown above in Figure 5B), reinforces even more the prohibition of cancer cells in approaches aiming tRNA pool dynamics.
Taken together, these observations underscore the crucial need to further investigate how the codon composition of the viral ORFeome influences the translation rate of host genes and promotes viral translation.
2.3.1. tRNA Modifications: Do RNA Viruses Have a Wobble?
In analyzing virus-host interactions, it is crucial to consider the modification of host cell tRNAs promoted by the virus. While the functional importance of the virus mRNA epitranscriptome has been extensively reported in human cells [123,124] and more recently in the SARS-CoV-2 RNA genome and subgenomic transcripts [125,126,127,128], our understanding of virus-induced modifications in host tRNAs is still limited although increasingly relevant [129]. As outlined earlier, modifications of the anticodon loop of tRNA regulate translation rate and fidelity, contributing to the translational adaptation [130]. For instance, changes in tRNA modifications significantly impact translation efficiency in response to physiological stresses [131,132]. Hypomodification, occurring especially at position U34 of specific tRNAs, namely tRNALysUUU; tRNAGlnUUG; tRNAGluUUC, slows down translation, disrupts protein homeostasis and reduces cellular fitness. These mechanisms are crucial for maintaining cellular function and viability during stress until normal conditions are restored. While these mechanisms may have a critical influence on viral translation, this aspect of virus/host relationships remains largely unexplored.
2.3.2. SARS-CoV-2 Codon Bias Dynamics during the Pandemic
Besides providing crucial information on viral genetic adaptation to host [133,134], evaluating nucleotide composition and CUB in viral genome also provide further insights into the mutational patterns of viruses over time and can be crucial for vaccines and antiviral therapy development [135]. A recent study analyzing over 3.5 million SARS-CoV-2 sequences revealed unique mutational trends with consistent nucleotide and codon frequencies [136]. This study also highlighted variations over time, including synonymous mutations, silent at the amino acid level, and nonsynonymous mutations inducing amino acid changes, impacting protein levels. It also revealed an unexpectedly high proportion of nonsynonymous mutations in the Spike gene when compared with glycoprotein genes from other RNA viruses.
To deepen this analysis, we examined the sequences from the various SARS-CoV2 clade (Alpha, Beta/Mu, Delta, Lambda/Gamma and Omicron) extracted from the Fumagalli’s paper [136] and generated their respective RSCU profile, monthly from December 2019 to July 2022. The RSCU pattern will here give us a snapshot of the average CUB for each month (Figure 7A). Focusing on SARS-CoV-2 Orf1ab and Spike genes, we analyzed the overall codon bias patterns by cluster analysis in order to compare the temporal codon usage variations of each clade. Notably, all seven clades were present and detectable at the very beginning of the pandemic albeit with variable abundancy. The Alpha clade was the first to strongly emerge and spread worldwide, while Beta/Mu and Lambda/Gamma remained at low levels of diffusion. Regarding their respective CUBs, all clades exhibited very similar patterns during the first 3 months of 2020. From April to September 2020, the RSCU pattern of Alpha clade began to fluctuate markedly before reaching a long period of stability from October 2020 to September 2021, coinciding with the peak of Alpha clade expansion worldwide. Surprisingly, the CUB pattern during this high transmission period was reversed compared to the initial pattern. The pattern of a stabilized, reversed CUB was observed not only in the Alpha clade but also in the Delta and Omicron clades, when they both reached their highest levels of transmission.
The clear correlation between CUB inversion and peak of diffusion can be interpreted in two opposite ways: a) the high level of expansion has selected sub-variants with a stable CUB, or b) a highly adapted sub-variant with optimized CUB preceded the peak, driving the exponential expansion. Although both scenarios might be involved, the persistence of inverted CUB beyond peak diffusion suggests natural selection of an optimized CUB likely played a role (favoring option b).
Comparing the RSCU of both genes at peak expansion for each clade reveals that Spike exhibits a much stronger preference for codons ending by A/U, especially those recognized by tRNAs modified at U34 position (e.g. ArgAGA, LysAAA, GluGAA and GlnCAA) (Figure 7B). This necessitates analyzing RSCU patterns for each gene individually at expansion peaks. Interestingly, each clade shows different CUB optimization pattern during peak diffusion, indicating that multiple codon patterns can support an optimal viral translation (Figure 7C and 7D). For instance, Omicron has evolved a codon bias diametrically opposed to the CUB of other clades, while Alpha and Delta Spike sequences share a similar CUB pattern (Figure 7C). Conversely, the Orf1ab gene in Alpha and Gamma/Lambda clades show the closest patterns (Figure 7D). Furthermore, within a given clade Orf1ab and Spike genes have developed distinct RSCU pattern. These varying preferences for A/U ending codons or codons requiring U34-modified tRNAs, suggest that efficient translation might depend on subtle but specific factors like translation speed and protein folding parameters.
2.4. Hypothesis: Virus-Driven Manipulation of the tRNA Pool and tRNA Modifications Forces Translation of SARS-CoV-2 Genes
Bioinformatic approaches like the tAI and the CAI measures, reasonably predict gene expression but can be improved. More precise estimations of amino acid-loaded tRNAs (“ready-to-translate” tRNAs) availability would be more realistic than using concentration of tRNA molecules or its estimate from tRNA gene copy number. The real availability of functional tRNAs, influenced by tissue-specific pools, is required for high translation efficiency. Another important mechanism for efficient protein synthesis is the channeling effect, which involves the direct transfer of aminoacyl-tRNA/tRNA between aminoacyl-tRNA synthetases (ARS), elongation factors, and ribosomes. This process is crucial because it regenerates and concentrates frequently used tRNAs near specific translation sites [137,138]. Additionally, the global CUB measures (CAI, tAI, RSCU) do not consider the order of favorable and unfavorable codons along the transcript, which can create fast or slow translation segments [42,139]. Environment-dependent dynamic variations in the tRNA pool and tRNA demand, should also be integrated in future models of translation efficiency. Using tRNAs composition from cancer cells can distort prediction of virus/host-tissue translational compatibility due to altered tRNA levels [118,119,120,121,140] and tRNA modifying enzymes in pathological conditions [141]. U34 modifications, in particular, rapidly respond to metabolic changes [142] such as methionine metabolism, carbon balance, or phosphate homeostasis [143,144,145].
Translational reprogramming is clearly appearing as a key element in cell adaptation to changing environments [146] and may aid virus adaptation to hosts. We have here highlighted striking discrepancies between SARS-CoV-2 preference for U34-sensitive codons and availability of cognate U34-modified tRNAs (ie: mcm5s2) in target cells. Since SARS-CoV-2 hasn't fully adjusted its codon bias to match human target cells, its recent rapid expansion may be due to its ability to manipulate U34 modifications, optimizing translation and facilitating its infection cycle. By reducing the need for precise codon usage adaptation, this ability could allow the virus to infect a broader range of hosts [147].
2.5. Evidences Supporting the Ability of SARS-CoV-2 to Exploit the tRNA Epitranscriptome in Order to Favor Viral Translation
2.5.1. Potential Manipulation of tRNAs by SARS-CoV-2
Direct evidence supporting this hypothesis for SARS-CoV-2 is currently limited in the literature, except for a recent study by Tao Pan’s group [148], which reported the presence of cellular tRNA in SARS-CoV-2 particles. This study suggested that each virion contains at least four different tRNA molecules. Notably, among the eight tRNAs preferentially enriched in SARS-CoV-2 particles, 75% require U34 modification for efficient decoding, including tRNALysUUU and tRNAGluUUC, both bearing the mcm5s2U34 modification. This observation suggests preferential packaging of critical tRNAs complementing skewed SARS-CoV-2 codons, reinforcing the assumption that U34-sensitive codons in viral genes require adaptation of the host tRNA pool for efficient viral translation. Other enzymes involved in tRNA modifications might also be involved in this virus-mediated translational control, such as the tRNA methyltransferase TRMT1 that generates the m22G26 mark. Indeed, recently we [149] and others [150,151] have shown that TRMT1 was specifically proteolyzed by the SARS-CoV-2 Nsp5 main protease leading to a decrease of the m22G26 modification on tRNAs in infected cells negatively impacting viral replication. This manipulation, suggests a role of m22G26 tRNA modification patterns in cellular pathogenesis and biology of SARS-CoV-2 infection.
This situation is not unique to SARS-CoV2. Recent studies have shown that during the Alphavirus CHIKV infection, deregulated expression of KIAA1456, an ALKBH8 homolog able to generate the mcm5U34 modification of tRNAs, consequently reprogramed codon optimality and favored viral RNA translation [30]. This mechanism was also shown to occur during the Flavivirus DENV infection, which like CHIKV exhibits a strong enrichment in U34-sensitive codons [30,129]. In parallel, a recent preprint [152] proposed that DENV is also able to exploit the host tRNA by a different mechanism involving the ALKBH1 RNA modifier and the virally-encoded NS5 protein (with dual RNA methyltransferase (MTase) and RNA-dependent RNA polymerase (RdRp) enzyme activities). The cellular and viral enzymes can both mediate f5Cm-modification of the cytoplasmic tRNA-Leu(CAA) at the wobble position C34, and collaboratively promote pro-viral translational remodeling during DENV infection.
2.5.2. Experimental Data Revealing SARS-CoV-2 Induced tRNA Epitranscriptome Modulations
To assess the validity of our hypothesis, we investigated the dynamic changes in tRNA modifications within SARS-CoV-2-infected cells. We first explored by LC-MS/MS the behavior of epitranscriptomic marks in the tRNA subpopulation extracted from SARS-CoV-2 infected VeroE6 cells (Figure 8A). Using this approach, we tracked 21 different tRNA post-transcriptional modifications and discovered that modifications at position 34, including ncm5U, mcm5U and mcm5s2U, were noticeably increased. We extended our analysis to human Caco2 cells, a more suitable cellular model for exploring SARS-CoV-2 infections given the known COVID-19 gastrointestinal manifestations. Our focus on U34 modifications once again highlighted the early and rapidly changing nature of the three marks we examined (Figure 8B). By simultaneously tracking tRNA levels, we also found that two of the four U34-modified tRNAs (tGluUUG and tGlnUUC) were upregulated at later time points (Figure 8C). Overall, these preliminary results indicate the possible role of tRNA modifications in SARS-CoV-2 infection and reinforce the idea that SARS-CoV-2 can manipulate the host's tRNA transcriptome. However, it remains unclear whether these changes can genuinely benefit viral infection.
2.5.3. SARS-CoV-2 Infection is Impaired when the tRNA U34 Modification Pathway is Disrupted
In mammals, enzymes responsible for the chemical U34 modification include the Elongator complex (Elp1–6), Alkylation repair homolog 8 (Alkbh8), and thiouridylases (Ctu1/Ctu2) [153]. If the induction of ncm5U, mcm5U and mcm5s2U marks indeed benefits viral translation, virus infection should be closely tied to the accurate activity of the Elongator complex. Using primary fibroblasts from patients with Familial Dysautonomia (FD) (Figure 9A), which lack Elp1 expression (=IKBKAP-/-) and consequently have reduced levels of all three U34 tRNA modifications (Figure 9B) [154], we observed significantly lower levels of SARS-CoV-2 infection in FD cells compared to control fibroblasts (wt) from healthy individuals (Figure 9C). These preliminary data emphasize the critical role played by U34 modifications of host tRNAs in SARS-CoV-2 lifecycle and provide the first evidence of SARS-CoV-2 ability to rewire the tRNA epitranscriptome to facilitate translation of its heavily codon-biased genome.
3. Concluding Remarks
3.1. Is altering tRNA Epitranscriptome a Common Viral Strategy?
Viruses are highly dependent on the host cell's translation machinery, including host tRNAs, for the efficient translation of their genetic material [42,155,156], and this process is heavily influenced by chemical modifications of tRNAs, catalyzed by various tRNA-modifying enzymes, particularly within the tRNA anticodon loop region [27,157]. We here showcased SARS-CoV-2's ability to directly target this crucial step by upregulating U34 tRNA modifications to facilitate the translation of its genome, which is enriched in U34-sensitive codons. In addition to Chikungunya and Dengue for which the ability to interfere with the host tRNA epitranscriptome has been suggested [30,129,152,158], Zika can have also evolved the same tactic to overcome its high degree of preference for U34-sensitive codons [98]. Besides tRNA modification, translation efficiency favoring viral translation can also be manipulated by altering tRNA levels [159], as we briefly illustrated in the case of SARS-CoV-2. Retrovirus such as HIV [160] or DNA viruses, such as SV40 [161], EBV [162], Adenovirus [163] or HSV-1 [164], are able to manipulate tRNA levels by stimulating Pol III transcription of tRNA genes.
3.2. Future Priority Investigation Areas
New approaches to explore the dynamics of tRNA epitranscriptome during viral infections are imperative. The direct quantification of tRNA pools with new experimental approaches like the recently developed mim-tRNAseq, which simultaneous measures tRNA abundance and modifications [165,166] could provide insight alongside with Ribo-seq analysis of viral and cellular translatomes. Expansion of the toolbox for quantitative recording and understanding the chemical biology of the tRNA epitranscriptome is clearly needed. It will include emerging technologies for mass spectrometry-based [167,168], nanopore-based tRNA modification mapping [169,170] and analysis of ribosome-bound tRNAs [171]. In this respect, MLC-seq [172] (mass spectrometry ladder complementation sequencing), a recent groundbreaking mass spectrometry approach, offers a potential solution to these challenges by providing quantitative, and site-specific mapping of RNA modifications, revealing the truly complete informational content of tRNA. The recent development of DORQ-seq [173], a combination of cDNA hybridization and deep sequencing, will also deliver a detailed tRNA composition matrix from femtomolar amounts of total tRNA. Advances in nanopore sequencing are anticipated with optimized basecalling models that could allow enhanced detection of RNA modifications and mapping [174].
The essential role of tRNA modifications in translation regulation is clearly appearing as a new crucial host process hijacked by RNA viruses to adapt host translation to their sub-optimal codon bias. It is therefore decisive to investigate the underlying mechanisms involved, particularly those targeting U34 tRNA modifications. By genetically inactivating U34 enzymes using CRISPR/Cas9 or RNA interference, we can assess their impact on SARS-CoV-2 translation and replication. Additionally, exploring how individual viral proteins influence the abundance and activity of U34 enzymes can provide valuable insights into the mechanisms of this new level of virus-host interaction.
Technological and scientific advances in RNA modification, highlighted their role in viral RNA structure, localization, splicing, stability, and translation [175,176]. Understanding viral- or host-induced alterations of RNA marks is essential for understanding gene regulation, identify essential marks for virus cycle and designing appropriate drugs. Nucleoside-derived inhibitors targeting SARS-CoV-2 nsp14 (N7-guanine)-methyltransferase have recently shown promise in crippling the stability of viral RNA [177]. Exploring virus–tRNA epitranscriptome interactions could open promising new avenues for therapeutic intervention.
4. Material and Methods
4.1. Bio-Informatics - Codon Analysis
Codon adaptation index (CAI) and Relative Synonymous Codon Usage (RSCU) calculations were done using CAIcal web available tools (http://genomes.urv.es/CAIcal) [73]. Nc data were obtained using CAIcal and plotted with Rstudio-ggplot2. Codon frequency were calculated with Codon Utilization Tool (CUT) website (http://pare.sunycnse.com/cut/index.jsp) [178]. tRNA adaptation index (tAI) was calculated using the stAIcalc software [179] (http://www.cs.tau.ac.il/∼tamirtul/stAIcalc/stAIcalc.html). Cluster analysis were done with Genesis 1.8.1 [180] and Cluster 3.0 [181] and visualization were made with Java Treeview [182]. Protein abundance were derived from PaxDb database version 4.1 (https://pax-db.org/) [183].
To verify the accuracy of tAI interpretation, we compared the consistency of tRNA expression across different human primary cell types by visually examining the relationship between tRNA gene copy number (GCN) and experimentally measured tRNA levels in various human primary cell types. We used a previously published dataset from the Nedialkova group [101] including addition information concerning modifications at position 34 occurring on some specific tRNAs.
4.2. SARS-CoV-2 Sequences
Accession numbers of the main SARS-CoV-2 sequences used in this report are listed in annex 1 and downloaded from NCBI database with the exception of SARS-CoV-2 FRA that was from the european virus archive (http://www.european-virus-archive.com) and corresponded to the exact 2020 isolate from Paris-Ile-de-France we used in our infection experiments. Analysis of clade-related RSCU evolution of SARS-CoV-2 during the pandemic, was performed using sequences recovered from the dataset generated in the Fumagalli’s paper [136].
4.3. Experimental Data
4.3.1. Cells and Viruses
Patient primary fibroblasts were from Coriell Institute: GMO1652 derived from non-FD control (Skin fibroblast (arm) from 11 years old Caucasian female); GMO4959 derived from FD patient (Skin fibroblast (arm) from 10 years old Caucasian female). The SARS-CoV-2 was a French Ile de France isolate (www.european-virus-archive.com/virus/sars-cov-2-isolate-betacovfranceidf03722020). Viral stocks were generated by amplification on VeroE6 cells (epithelial kidney of an African green monkey, ATCC CRL-1586). The supernatant was collected, filtered through a 0.45 µm membrane, and tittered using a TCID50 assay. Caco2 cells (epithelial colon adenocarcinoma, ATCC HTB-37) were used for tRNA modifications quantification upon SARS-CoV-2 infection.
4.3.2. Quantification of tRNA Modifications by Mass Spectrometry (LC-MS/MS)
RNA preparations enriched in tRNAs were obtained using mirVana™ miRNA Isolation Kit (Thermo). RNA samples were then digested by Nuclease P1 and treated by Alkaline phosphatase. Samples were then injected into LC-MS/MS. The nucleosides were separated by reverse phase ultra-performance liquid chromatography on a C18 column with online mass spectrometry detection using Agilent 6490 triple-quadrupole LC mass spectrometer in multiple reactions monitoring (MRM) positive electrospray ionization (ESI) mode. Quantification was performed by comparing with the standard curve obtained from pure nucleoside standards running with the same batch of samples.
4.3.3. Assays for Viral Replication
For infections, the cells were previously transduced with a Lentiviral vector expressing ACE2 using the lentiviral construct RRL.sin.cPPT.SFFV/Ace2.WPRE (MT136) kindly provided by Caroline Goujon (Addgene plasmid # 145842) [176]. Seventy-two hours after transduction, accurate ACE2 expression was controlled on western blot probed with anti-ACE2 antibody (Human ACE-2 Antibody, AF933, R&D systems). ACE2-positive cells (70-80% confluence) were then infected with SARS-CoV-2 diluted to achieve the desired MOI. After 24 hours in culture, the cells were lysed with the Luna cell ready lysis module (New England Biolabs). The amplification reaction was run on LightcyclerR 480 thermocycler (Roche Diagnostics) using the Luna Universal One-Step RT-qPCR kit (New England Biolabs), and SARS_For: 5’-ACAGGTACGTTAATAGTTAATAGCGT; SARS_Rev: 5’-ATATTGCAGCAGTACGCACACA; GAPDH_For: 5’-GCTCACCGGCATGGCCTTTCGCGT and GAPDH_Rev: 5’-TGGAGGAGTGGGTGTCGCTGTTGA primers. Each qPCR was performed in triplicate, and the means and standard deviations were calculated. Relative quantification of data obtained from RT-qPCR was used to determine changes in SARS-CoV-2 gene expression across multiple samples after normalization to the internal reference GAPDH gene. Individual tRNA quantification was performed by RTqPCR using tRNA gene specific primers and miR103a primers for internal normalization purposesi (see Appendix B).
Appendix A. Virus Sequences
| Virus genus | Name | Accession |
| Alphacoronavirus | Human CoV NL63 | MK334043.1 |
| Human CoV 229E | MN306046.1 | |
| Betacoronavirus | BatCoV RaTG13 | MN996532.2 |
| Human CoV-OC43 | KF530087.1 | |
| MERS-CoV | JX869059.2 | |
| SARS-CoV-1 | KY352407.1 | |
| SARS-CoV-2 FRA | european-virus-archive betacovfranceidf03722020 | |
| SARS-CoV-2 Wuhan | NC_045512.2 | |
| SARS-CoV-2 Omicron | ON248829.1 | |
| Flavivirus | Zika MR766 | MK105975 |
| Zika PF13 | KY766069 |
Appendix B. tRNA RTqPCR Primers
| Primer | Target tRNA | Sequence (5‘→3’) |
| tLys-TTT-For | tRNA-Lys-TTT-3-1 | TCAGTCGGTAGAGCATCAGA |
| tLys-TTT-Rev | tRNA-Lys-TTT-3-1 | CCCGAACAGGGACTTGAAC |
| tGln-TTG-For | tRNA-Gln-TTG-1-1 | TGGTGTAATGGTTAGCACTCTG |
| tGln-TTG-Rev | tRNA-Gln-TTG-1-1 | CCGAGATTTGAACTCGGATCG |
| tGlu-TTC-For | tRNA-Glu-TTC-1-1 | CATATGGTCTAGCGGTTAGGATTC |
| tGlu-TTC-Rev | tRNA-Glu-TTC-1-1 | CCCATACCGGGAGTCGAA |
| tArg-TCT-For | tRNA-Arg-TCT-1-1 | CCGTGGCGCAATGGATA |
| tArg-TCT-Rev | tRNA-Arg-TCT-1-1 | CTCGAACCCGGAACCTTT |
| tAsn-GTT-For | tRNA-Asn-GTT-1-1 | TGTGGCGCAATCGGTTAG |
| tAsn-GTT-Rev | tRNA-Asn-GTT-1-1 | GAACCACCAACCTTTCGGTTA |
| tAsp-GTC-For | tRNA-Asp-GTC-2-9 | GTATAGTGGTGAGTATCCCC |
| tAsp-GTC-Rev | tRNA-Asp-GTC-2-9 | AATCGAACCCCGGTCTCC |
| teMet-CAT-For | tRNA-Met-CAT-4-2 | GCGTCAGTCTCATAATCTGA |
| teMet-CAT-Rev | tRNA-Met-CAT-4-2 | GCCCTCTCTGAGGCTCGAAC |
| 103-For | miRNA103a-3p | GCTTCTTTACAGTGCTGCCT |
| 103-Rev | miRNA103a-3p | TTCATAGCCCTGTACAATGCT |
References
- Hershberg, R.; Petrov, D.A. General Rules for Optimal Codon Choice. PLoS Genet 2009, 5, e1000556. [Google Scholar] [CrossRef] [PubMed]
- Grantham, R. , Gautier, C., Gouy, M., Mercier, R.; Pavé, A. Codon catalog usage and the genome hypothesis. Nucleic Acids Res 1980, 8, r49–r62. [Google Scholar] [CrossRef] [PubMed]
- Deng, Y. , de Lima Hedayioglu, F., Kalfon, J., Chu, D.; von der Haar, T. Hidden patterns of codon usage bias across kingdoms. J R Soc Interface 2020, 17, 20190819. [Google Scholar] [CrossRef] [PubMed]
- Parvathy, S.T. , Udayasuriyan, V.; Bhadana, V. Codon usage bias. Mol Biol Rep 2022, 49, 539–565. [Google Scholar] [CrossRef] [PubMed]
- Chaney, J.L.; Clark, P.L. Roles for Synonymous Codon Usage in Protein Biogenesis. Annual Review of Biophysics 2015, 44, 143–166. [Google Scholar] [CrossRef]
- Supek, F. The Code of Silence: Widespread Associations Between Synonymous Codon Biases and Gene Function. Journal of Molecular Evolution 2016, 82, 65–73. [Google Scholar] [CrossRef]
- Barozai, M.Y. , Kakar, A.; Din, D. The relationship between codon usage bias and salt resistant genes in Arabidopsis thaliana and Oryza sativa. Pure and Applied Biology 2012, 1, 48–51. [Google Scholar] [CrossRef]
- Frumkin, I.; et al. Codon usage of highly expressed genes affects proteome-wide translation efficiency. Proceedings of the National Academy of Sciences 2018, 115, E4940–E4949. [Google Scholar] [CrossRef]
- Quax, T.E.F. , Claassens, N.J., Söll, D.; van der Oost, J. Codon Bias as a Means to Fine-Tune Gene Expression. Mol Cell 2015, 59, 149–161. [Google Scholar] [CrossRef]
- Plotkin, J.B.; Kudla, G. Synonymous but not the same: the causes and consequences of codon bias. Nat Rev Genet 2011, 12, 32–42. [Google Scholar] [CrossRef]
- Liu, Y. A code within the genetic code: codon usage regulates co-translational protein folding. Cell Commun Signal 2020, 18, 145. [Google Scholar] [CrossRef] [PubMed]
- Zhao, F.; et al. Genome-wide role of codon usage on transcription and identification of potential regulators. Proc Natl Acad Sci U S A 2021, 118, e2022590118. [Google Scholar] [CrossRef] [PubMed]
- Zhou, Z. , Dang, Y., Zhou, M., Yuan, H.; Liu, Y. Codon usage biases co-evolve with transcription termination machinery to suppress premature cleavage and polyadenylation. Elife 2018, 7, e33569. [Google Scholar] [CrossRef] [PubMed]
- Mordstein, C.; et al. Codon Usage and Splicing Jointly Influence mRNA Localization. Cell Syst 2020, 10, 351–362. [Google Scholar] [CrossRef]
- Sharp, P.M. , Tuohy, T.M.F.; Mosurski, K.R. Codon usage in yeast: cluster analysis clearly differentiates highly and lowly expressed genes. Nucleic Acids Research 1986, 14, 5125–5143. [Google Scholar] [CrossRef]
- Paulet, D. , David, A.; Rivals, E. Ribo-seq enlightens codon usage bias. DNA Research 2017, 24, 303–210. [Google Scholar] [CrossRef]
- Crick, F.H. Codon--anticodon pairing: the wobble hypothesis. J Mol Biol 1966, 19, 548–555. [Google Scholar] [CrossRef]
- Agris, P.F. , Vendeix, F.A.P.; Graham, W.D. tRNA’s wobble decoding of the genome: 40 years of modification. J Mol Biol 2007, 366, 1–13. [Google Scholar] [CrossRef]
- Agris, P.F. Wobble position modified nucleosides evolved to select transfer RNA codon recognition: A modified-wobble hypothesis. Biochimie 1991, 73, 1345–1349. [Google Scholar] [CrossRef]
- Agris, P.F. Decoding the genome: a modified view. Nucleic Acids Res 2004, 32, 223–238. [Google Scholar] [CrossRef]
- Agris, P.F. , Narendran, A., Sarachan, K., Väre, V.Y.P.; Eruysal, E. The Importance of Being Modified: The Role of RNA Modifications in Translational Fidelity. The Enzymes 2017, 41, 1–50. [Google Scholar] [PubMed]
- Lorenz, C. , Lünse, C.E.; Mörl, M. tRNA Modifications: Impact on Structure and Thermal Adaptation. Biomolecules 2017, 7, E35. [Google Scholar] [CrossRef] [PubMed]
- Tuorto, F.; Lyko, F. Genome recoding by tRNA modifications. Open Biol 2016, 6, 160287. [Google Scholar] [CrossRef] [PubMed]
- Valadon, C.; Namy, O. The Importance of the Epi-Transcriptome in Translation Fidelity. Noncoding RNA 2021, 7, 51. [Google Scholar] [CrossRef] [PubMed]
- Yarian, C.; et al. Accurate translation of the genetic code depends on tRNA modified nucleosides. J Biol Chem 2002, 277, 16391–16395. [Google Scholar] [CrossRef] [PubMed]
- Rodriguez-Hernandez, A.; et al. Structural and mechanistic basis for enhanced translational efficiency by 2-thiouridine at the tRNA anticodon wobble position. J Mol Biol 2013, 425, 3888–3906. [Google Scholar] [CrossRef] [PubMed]
- Nedialkova, D.D.; Leidel, S.A. Optimization of Codon Translation Rates via tRNA Modifications Maintains Proteome Integrity. Cell 2015, 161, 1606–18. [Google Scholar] [CrossRef]
- Johansson, M.J.O. , Xu, F.; Byström, A.S. Elongator-a tRNA modifying complex that promotes efficient translational decoding. Biochimica et biophysica acta. Gene regulatory mechanisms 2018, 1861, 401–408. [Google Scholar] [CrossRef]
- Begley, U.; et al. A human tRNA methyltransferase 9-like protein prevents tumour growth by regulating LIN9 and HIF1-α. EMBO Mol Med 2013, 5, 366–383. [Google Scholar] [CrossRef]
- Jungfleisch, J.; et al. CHIKV infection reprograms codon optimality to favor viral RNA translation by altering the tRNA epitranscriptome. Nat Commun 2022, 13, 4725. [Google Scholar] [CrossRef]
- Tuorto, F.; Lyko, F. Genome recoding by tRNA modifications. Open Biol 2016, 6, 160287. [Google Scholar] [CrossRef] [PubMed]
- Rapino, F.; et al. Wobble tRNA modification and hydrophilic amino acid patterns dictate protein fate. Nat Commun 2021, 12, 2170. [Google Scholar] [CrossRef] [PubMed]
- Wang, L.; Lin, S. Emerging functions of tRNA modifications in mRNA translation and diseases. Journal of Genetics and Genomics 2023, 50, 223–232. [Google Scholar] [CrossRef] [PubMed]
- Qian, W. , Yang, J.-R., Pearson, N.M., Maclean, C.; Zhang, J. Balanced Codon Usage Optimizes Eukaryotic Translational Efficiency. PLOS Genetics 2012, 8, e1002603. [Google Scholar] [CrossRef] [PubMed]
- dos Reis, M. , Savva, R.; Wernisch, L. Solving the riddle of codon usage preferences: a test for translational selection. Nucleic Acids Res 2004, 32, 5036–5044. [Google Scholar] [CrossRef]
- Sabi, R.; Tuller, T. Modelling the efficiency of codon-tRNA interactions based on codon usage bias. DNA Res 2014, 21, 511–526. [Google Scholar] [CrossRef]
- Pouyet, F. , Mouchiroud, D., Duret, L.; Sémon, M. Recombination, meiotic expression and human codon usage. Elife 2017, 6, e27344. [Google Scholar] [CrossRef]
- Novoa, E.M. , Pavon-Eternod, M., Pan, T.; Ribas de Pouplana, L. A Role for tRNA Modifications in Genome Structure and Codon Usage. Cell 2012, 149, 202–213. [Google Scholar] [CrossRef]
- Rudolph, K.L.M.; et al. Codon-Driven Translational Efficiency Is Stable across Diverse Mammalian Cell States. PLoS Genetics 2016, 12, e1006024. [Google Scholar] [CrossRef]
- Gao, W. , Gallardo-Dodd, C.J.; Kutter, C. Cell type–specific analysis by single-cell profiling identifies a stable mammalian tRNA–mRNA interface and increased translation efficiency in neurons. Genome Res. 2022, 32, 97–110. [Google Scholar] [CrossRef]
- Marques, M. , Ramos, B., Soares, A.; Ribeiro, D. Cellular Proteostasis During Influenza A Virus Infection—Friend or Foe? Cells 2019, 8, 228. [Google Scholar] [CrossRef] [PubMed]
- Pavon-Eternod, M.; et al. Vaccinia and influenza A viruses select rather than adjust tRNAs to optimize translation. Nucleic Acids Research 2013, 41, 1914–1921. [Google Scholar] [CrossRef] [PubMed]
- Khandia, R.; et al. Analysis of Nipah Virus Codon Usage and Adaptation to Hosts. Frontiers in Microbiology 2019, 10. [Google Scholar] [CrossRef] [PubMed]
- van Weringh, A.; et al. HIV-1 Modulates the tRNA Pool to Improve Translation Efficiency. Molecular Biology and Evolution 2011, 28, 1827–1834. [Google Scholar] [CrossRef]
- Kanduc, D. Role of codon usage and tRNA changes in rat cytomegalovirus latency and (re)activation. Journal of Basic Microbiology 2016, 56, 617–626. [Google Scholar] [CrossRef]
- Dittmar, K.A. , Goodenbour, J.M.; Pan, T. Tissue-specific differences in human transfer RNA expression. PLoS Genetics 2006, 2, 2107–2115. [Google Scholar] [CrossRef]
- Parisien, M. , Wang, X.; Pan, T. Diversity of human tRNA genes from the 1000-genomes project. RNA Biol 2013, 10, 1853–1867. [Google Scholar] [CrossRef]
- Zhou, P.; et al. A pneumonia outbreak associated with a new coronavirus of probable bat origin. Nature 2020, 579, 270–273. [Google Scholar] [CrossRef]
- Zhu, N.; et al. A Novel Coronavirus from Patients with Pneumonia in China, 2019. New England Journal of Medicine 2020, 382, 727–733. [Google Scholar] [CrossRef]
- Kirtipal, N. , Bharadwaj, S.; Kang, S.G. From SARS to SARS-CoV-2, insights on structure, pathogenicity and immunity aspects of pandemic human coronaviruses. Infect Genet Evol 2020, 85, 104502. [Google Scholar] [CrossRef]
- Abdelrahman, Z. , Li, M.; Wang, X. Comparative Review of SARS-CoV-2, SARS-CoV, MERS-CoV, and Influenza A Respiratory Viruses. Front Immunol 2020, 11, 552909. [Google Scholar] [CrossRef] [PubMed]
- Rabaan, A.A.; et al. SARS-CoV-2, SARS-CoV, and MERS-COV: A comparative overview. Le infezioni in medicina 2020, 28, 174–184. [Google Scholar] [PubMed]
- Snijder, E.J. , Decroly, E.; Ziebuhr, J. The Nonstructural Proteins Directing Coronavirus RNA Synthesis and Processing. in Advances in Virus Research 59–126 (2016). [CrossRef]
- Sola, I. , Almazán, F., Zúñiga, S.; Enjuanes, L. Continuous and Discontinuous RNA Synthesis in Coronaviruses. Annual Review of Virology 2015, 2, 265–288. [Google Scholar] [CrossRef] [PubMed]
- Stadler, K.; et al. SARS — beginning to understand a new virus. Nature Reviews Microbiology 2003, 1, 209–218. [Google Scholar] [CrossRef] [PubMed]
- Gao, Y.; et al. Structure of the RNA-dependent RNA polymerase from COVID-19 virus. Science 2020, 368, 779–782. [Google Scholar] [CrossRef]
- Liu, L. Leader sequences of coronavirus are altered during infection. Frontiers in Bioscience 2018, 23, 4579. [Google Scholar] [CrossRef]
- Viswanathan, T.; et al. Structural basis of RNA cap modification by SARS-CoV-2. Nature Communications 2020, 11, 3718. [Google Scholar] [CrossRef]
- Peng, Y.-H.; et al. Characterization of the Role of Hexamer AGUAAA and Poly(A) Tail in Coronavirus Polyadenylation. PLOS ONE 2016, 11, e0165077. [Google Scholar] [CrossRef]
- Yoshimoto, F.K. The Proteins of Severe Acute Respiratory Syndrome Coronavirus-2 (SARS CoV-2 or n-COV19), the Cause of COVID-19. Protein J 2020, 39, 198–216. [Google Scholar] [CrossRef]
- Bojkova, D.; et al. Proteomics of SARS-CoV-2-infected host cells reveals therapy targets. Nature ( 2020. [CrossRef]
- Davidson, A.D.; et al. Characterisation of the transcriptome and proteome of SARS-CoV-2 reveals a cell passage induced in-frame deletion of the furin-like cleavage site from the spike glycoprotein. Genome Med 2020, 12, 68. [Google Scholar] [CrossRef] [PubMed]
- Finkel, Y.; et al. The coding capacity of SARS-CoV-2. Nature ( 2020. [CrossRef] [PubMed]
- Biswas, K.K.; et al. Codon usage bias analysis of citrus tristeza virus: Higher codon adaptation to citrus reticulata host. Viruses 2019, 11, 331. [Google Scholar] [CrossRef] [PubMed]
- Rocha, E.P.C. Codon usage bias from tRNA’s point of view: Redundancy, specialization, and efficient decoding for translation optimization. Genome Research 2004, 14, 2279–2286. [Google Scholar] [CrossRef] [PubMed]
- Higgs, P.G.; Ran, W. Coevolution of codon usage and tRNA genes leads to alternative stable states of biased codon usage. Molecular Biology and Evolution 2008, 25, 2279–2291. [Google Scholar] [CrossRef]
- Pintó, R.M. , Aragonès, L., Costafreda, M.I., Ribes, E.; Bosch, A. Codon usage and replicative strategies of hepatitis A virus. Virus Research 2007, 127, 158–163. [Google Scholar] [CrossRef]
- Anwar, A.M. , Soudy, M.; Mohamed, R. vhcub: Virus-host codon usage co-adaptation analysis. F1000Research 2019, 8, 2137. [Google Scholar] [CrossRef]
- Sheikh, A. , Al-Taher, A., Al-Nazawi, M., Al-Mubarak, A.I.; Kandeel, M. Analysis of preferred codon usage in the coronavirus N genes and their implications for genome evolution and vaccine design. Journal of Virological Methods 2020, 277, 113806. [Google Scholar] [CrossRef]
- Chen, H. , Sun, S., Norenburg, J.L.; Sundberg, P. Mutation and Selection Cause Codon Usage and Bias in Mitochondrial Genomes of Ribbon Worms (Nemertea). PLoS ONE 2014, 9, e85631. [Google Scholar]
- Xu, Y.; et al. Analysis of synonymous codon usage pattern in duck circovirus. Gene 2015, 557, 138–145. [Google Scholar] [CrossRef]
- Sharp, P.M.; Li, W.H. The codon Adaptation Index--a measure of directional synonymous codon usage bias, and its potential applications. Nucleic Acids Res 1987, 15, 1281–1295. [Google Scholar] [CrossRef] [PubMed]
- Puigbò, P. , Bravo, I.G.; Garcia-Vallve, S. CAIcal: a combined set of tools to assess codon usage adaptation. Biology direct 2008, 3, 38. [Google Scholar] [CrossRef] [PubMed]
- Lee, S. , Weon, S., Lee, S.; Kang, C. Relative codon adaptation index, a sensitive measure of codon usage bias. Evol Bioinform Online 2010, 6, 47–55. [Google Scholar] [CrossRef] [PubMed]
- Wright, F. The ‘effective number of codons’ used in a gene. Gene 1990, 87, 23–29. [Google Scholar] [CrossRef]
- Song, H.; et al. Comprehensive analysis of codon usage bias in seven Epichloë species and their peramine-coding genes. Frontiers in Microbiology 2017, 8. [Google Scholar] [CrossRef]
- Yao, H. , Chen, M.; Tang, Z. Analysis of Synonymous Codon Usage Bias in Flaviviridae Virus. BioMed Research International 2019, 2019, 1–12. [Google Scholar]
- Nambou, K.; Anakpa, M. Deciphering the co-adaptation of codon usage between respiratory coronaviruses and their human host uncovers candidate therapeutics for COVID-19. Infection, Genetics and Evolution 2020, 85, 104471. [Google Scholar] [CrossRef]
- Fuglsang, A. The effective number of codons for individual amino acids: some codons are more optimal than others. Gene 2003, 320, 185–190. [Google Scholar] [CrossRef]
- Cannarozzi, G.; et al. A Role for Codon Order in Translation Dynamics. Cell 2010, 141, 355–367. [Google Scholar] [CrossRef]
- Sabi, R. , Volvovitch Daniel, R.; Tuller, T. stAIcalc: tRNA adaptation index calculator based on species-specific weights. Bioinformatics 2017, 33, 589–591. [Google Scholar] [CrossRef]
- Gingold, H.; Pilpel, Y. Determinants of translation efficiency and accuracy. Molecular Systems Biology 2011, 7, 481. [Google Scholar] [CrossRef] [PubMed]
- Man, O.; Pilpel, Y. Differential translation efficiency of orthologous genes is involved in phenotypic divergence of yeast species. Nat Genet 2007, 39, 415–421. [Google Scholar] [CrossRef] [PubMed]
- Chan, P.P.; Lowe, T.M. GtRNAdb 2.0: an expanded database of transfer RNA genes identified in complete and draft genomes. Nucleic acids research 2016, 44, D184–D189. [Google Scholar] [CrossRef] [PubMed]
- Matyášek, R.; Kovařík, A. Mutation Patterns of Human SARS-CoV-2 and Bat RaTG13 Coronavirus Genomes Are Strongly Biased Towards C to U Transitions, Indicating Rapid Evolution in Their Hosts. Genes 2020, 11, 761. [Google Scholar] [CrossRef] [PubMed]
- Lam, T.T.Y.; et al. Identifying SARS-CoV-2-related coronaviruses in Malayan pangolins. Nature ( 2020. [CrossRef]
- Xiao, K.; et al. Isolation and Characterization of 2019-nCoV-like Coronavirus from Malayan Pangolins. bioRxiv 2020.02.17.951335 ( 2020. [CrossRef]
- Zhang, T. , Wu, Q.; Zhang, Z. Probable Pangolin Origin of SARS-CoV-2 Associated with the COVID-19 Outbreak. Current Biology 2020, 30, 1346–1351. [Google Scholar] [CrossRef]
- Zhang, C.; et al. Protein Structure and Sequence Reanalysis of 2019-nCoV Genome Refutes Snakes as Its Intermediate Host and the Unique Similarity between Its Spike Protein Insertions and HIV-1. Journal of Proteome Research 2020, 19, 1351–1360. [Google Scholar] [CrossRef]
- Ji, W. , Wang, W., Zhao, X., Zai, J.; Li, X. Cross-species transmission of the newly identified coronavirus 2019-nCoV. Journal of Medical Virology 2020, 92, 433–440. [Google Scholar] [CrossRef]
- Wu, F.; et al. A new coronavirus associated with human respiratory disease in China. Nature 2020, 579, 265–269. [Google Scholar]
- Lu, H. , Stratton, C.W.; Tang, Y.W. Outbreak of pneumonia of unknown etiology in Wuhan, China: The mystery and the miracle. Journal of Medical Virology 2020, 92, 401–402. [Google Scholar] [CrossRef] [PubMed]
- Inquiry launched into wombat hunting by Chinese high rollers. Available online: https://www.theage.com.au/national/victoria/inquiry-launched-into-wombat-hunting-by-chinese-high-rollers-20190815-p52hn1.html.
- Report sparked by Chinese gamblers shooting wombats to be kept secret | 7NEWS.com.au. Available online: https://7news.com.au/news/wildlife/report-into-chinese-gamblers-shooting-wombats-in-victoria-to-be-kept-secret-c-590856.
- Wang, M.; et al. PaxDb, a database of protein abundance averages across all three domains of life. Molecular & cellular proteomics : MCP 2012, 11, 492–500. [Google Scholar]
- Jiang, W.; et al. Analysis of synonymous codon usage patterns in the edible fungus Volvariella volvacea. Biotechnology and Applied Biochemistry 2017, 64, 218–224. [Google Scholar] [CrossRef] [PubMed]
- Ma, L. , Cui, P., Zhu, J., Zhang, Z.; Zhang, Z. Translational selection in human: more pronounced in housekeeping genes. Biol Direct 2014, 9, 17. [Google Scholar] [CrossRef] [PubMed]
- Cristina, J. , Fajardo, A., Soñora, M., Moratorio, G.; Musto, H. A detailed comparative analysis of codon usage bias in Zika virus. Virus Research 2016, 223, 147–152. [Google Scholar] [CrossRef]
- Butt, A.M. , Nasrullah, I.; Tong, Y. Genome-Wide Analysis of Codon Usage and Influencing Factors in Chikungunya Viruses. PLoS ONE 2014, 9, e90905. [Google Scholar] [CrossRef]
- Sexton, N.R.; Ebel, G.D. Effects of arbovirus multi-host life cycles on dinucleotide and codon usage patterns. Viruses 2019, 11, 643. [Google Scholar] [CrossRef]
- Gao, L.; et al. Selective gene expression maintains human tRNA anticodon pools during differentiation. Nat Cell Biol 2024, 26, 100–112. [Google Scholar]
- Jackson, C.B. , Farzan, M., Chen, B.; Choe, H. Mechanisms of SARS-CoV-2 entry into cells. Nat Rev Mol Cell Biol 2022, 23, 3–20. [Google Scholar] [CrossRef]
- Hoffmann, M. , Kleine-Weber, H.; Pöhlmann, S. A Multibasic Cleavage Site in the Spike Protein of SARS-CoV-2 Is Essential for Infection of Human Lung Cells. Molecular Cell 2020, 78, 779–784. [Google Scholar] [CrossRef]
- Li, X. et al. A furin cleavage site was discovered in the S protein of the 2019 novel coronavirus. Chinese Journal of Bioinformatics 103–108 (2020).
- Coutard, B.; et al. The spike glycoprotein of the new coronavirus 2019-nCoV contains a furin-like cleavage site absent in CoV of the same clade. Antiviral research 2020, 176. [Google Scholar] [CrossRef] [PubMed]
- Boni, M.F.; et al. Evolutionary origins of the SARS-CoV-2 sarbecovirus lineage responsible for the COVID-19 pandemic. Nature Microbiology 2020, 1–10. [Google Scholar] [CrossRef] [PubMed]
- Lau, S.Y.; et al. Attenuated SARS-CoV-2 variants with deletions at the S1/S2 junction. Emerging Microbes and Infections 2020, 9, 837–842. [Google Scholar] [CrossRef] [PubMed]
- Wang, P.; et al. Characterization of an attenuated SARS-CoV-2 variant with a deletion at the S1/S2 junction of the spike protein. Nature Communications 2021, 12, 2790. [Google Scholar] [CrossRef] [PubMed]
- Polte, C.; et al. Assessing cell-specific effects of genetic variations using tRNA microarrays. BMC Genomics 2019, 20, 549. [Google Scholar] [CrossRef]
- Berg, M.D.; et al. Targeted sequencing reveals expanded genetic diversity of human transfer RNAs. RNA Biology 2019, 16, 1574–1585. [Google Scholar] [CrossRef]
- Torres, A.G. Enjoy the Silence: Nearly Half of Human tRNA Genes Are Silent. Bioinformatics and Biology Insights 2019, 13, 117793221986845. [Google Scholar] [CrossRef]
- B. Miller, J., Hippen, A.A., M.; Wright, S., Morris, C.; G. Ridge, P. Human viruses have codon usage biases that match highly expressed proteins in the tissues they infect. Biomedical Genetics and Genomics 2017, 2. [Google Scholar]
- Hernandez-Alias, X. , Benisty, H., Schaefer, M.H.; Serrano, L. Translational adaptation of human viruses to the tissues they infect. Cell Reports 2021, 34, 108872. [Google Scholar] [CrossRef]
- Hernandez-Alias, X. , Benisty, H., Schaefer, M.H.; Serrano, L. Translational efficiency across healthy and tumor tissues is proliferation-related. Molecular Systems Biology 2020, 16, e9275. [Google Scholar] [CrossRef]
- Sungnak, W., Huang, N., Bécavin, C., Berg, M.; Network, H.L.B. SARS-CoV-2 Entry Genes Are Most Highly Expressed in Nasal Goblet and Ciliated Cells within Human Airways. ArXiv (2020). [CrossRef]
- Sungnak, W.; et al. SARS-CoV-2 entry factors are highly expressed in nasal epithelial cells together with innate immune genes. Nature Medicine 2020, 26, 681–687. [Google Scholar] [CrossRef] [PubMed]
- Zhang, H.; et al. Digestive system is a potential route of COVID-19: an analysis of single-cell coexpression pattern of key proteins in viral entry process. Gut 2020, 69, 1010–1018. [Google Scholar] [CrossRef]
- Pavon-Eternod, M.; et al. tRNA over-expression in breast cancer and functional consequences. Nucleic Acids Research 2009, 37, 7268–7280. [Google Scholar] [CrossRef] [PubMed]
- Santos, M. , Fidalgo, A., Varanda, A.S., Oliveira, C.; Santos, M.A.S. tRNA Deregulation and Its Consequences in Cancer. Trends in Molecular Medicine 2019, 25, 853–865. [Google Scholar] [CrossRef] [PubMed]
- Aharon-Hefetz, N.; et al. Manipulation of the human trna pool reveals distinct trna sets that act in cellular proliferation or cell cycle arrest. eLife 2020, 9, 1–28. [Google Scholar] [CrossRef]
- Micalizzi, D.S. , Ebright, R.Y., Haber, D.A.; Maheswaran, S. Translational Regulation of Cancer Metastasis. Cancer Research 2021, 81, 517–524. [Google Scholar] [CrossRef]
- Li, Y.; et al. GC usage of SARS-CoV-2 genes might adapt to the environment of human lung expressed genes. Molecular Genetics and Genomics 2020, 295, 1537–1546. [Google Scholar] [CrossRef]
- Ke, S.; et al. A majority of m6A residues are in the last exons, allowing the potential for 3ʹ UTR regulation. Genes and Development 2015. [Google Scholar] [CrossRef]
- Ke, S.; et al. m6A mRNA modifications are deposited in nascent pre-mRNA and are not required for splicing but do specify cytoplasmic turnover. Genes and Development 2017. [Google Scholar] [CrossRef]
- Li, N.; et al. METTL3 regulates viral m6A RNA modification and host cell innate immune responses during SARS-CoV-2 infection. Cell Reports 2021, 109091. [Google Scholar] [CrossRef]
- Campos, J.H.C.; et al. Direct RNA Sequencing Reveals SARS-CoV-2 m6A Sites and Possible Differential DRACH Motif Methylation among Variants. Viruses 2021, 13, 2108. [Google Scholar] [CrossRef] [PubMed]
- Burgess, H.M.; et al. Targeting the m6A RNA modification pathway blocks SARS-CoV-2 and HCoV-OC43 replication. Genes and Development 2021, 35, 1005–1019. [Google Scholar] [CrossRef] [PubMed]
- Kim, D.; et al. The Architecture of SARS-CoV-2 Transcriptome. Cell 2020. [Google Scholar] [CrossRef] [PubMed]
- Chan, C. , Pham, P., Dedon, P.C.; Begley, T.J. Lifestyle modifications: Coordinating the tRNA epitranscriptome with codon bias to adapt translation during stress responses. Genome Biology 2018, 19, 228. [Google Scholar] [CrossRef] [PubMed]
- Endres, L. , Dedon, P.C.; Begley, T.J. Codon-biased translation can be regulated by wobble-base tRNA modification systems during cellular stress responses. RNA Biology 2015. [Google Scholar] [CrossRef]
- Koh, C.S.; Sarin, L.P. Transfer RNA modification and infection - Implications for pathogenicity and host responses. Biochimica et biophysica acta. Gene regulatory mechanisms 2018, 1861, 419–432. [Google Scholar] [CrossRef]
- Nakai, Y. , Nakai, M.; Yano, T. Sulfur Modifications of the Wobble U 34 in tRNAs and their Intracellular Localization in Eukaryotic Cells. Biomolecules 2017, 7. [Google Scholar]
- Pintó, R.M. , Burns, C.C.; Moratorio, G. Editorial: Codon Usage and Dinucleotide Composition of Virus Genomes: From the Virus-Host Interaction to the Development of Vaccines. Front Microbiol 2021, 12, 791750. [Google Scholar] [CrossRef]
- Posani, E.; et al. Temporal evolution and adaptation of SARS-CoV-2 codon usage. Front Biosci (Landmark Ed) 2022, 27, 13. [Google Scholar] [CrossRef]
- Wu, X.; et al. Optimization and Deoptimization of Codons in SARS-CoV-2 and Related Implications for Vaccine Development. Advanced Science 2023, 10, 2205445. [Google Scholar] [CrossRef]
- Fumagalli, S.E.; et al. Analysis of 3.5 million SARS-CoV-2 sequences reveals unique mutational trends with consistent nucleotide and codon frequencies. Virol J 2023, 20, 31. [Google Scholar] [CrossRef] [PubMed]
- Stapulionis, R.; Deutscher, M.P. A channeled tRNA cycle during mammalian protein synthesis. Proc Natl Acad Sci U S A 1995, 92, 7158–7161. [Google Scholar] [CrossRef] [PubMed]
- Petrushenko, Z.M. , Budkevich, T.V., Shalak, V.F., Negrutskii, B.S.; El’skaya, A.V. Novel complexes of mammalian translation elongation factor eEF1A.GDP with uncharged tRNA and aminoacyl-tRNA synthetase. Implications for tRNA channeling. Eur J Biochem 2002, 269, 4811–4818. [Google Scholar] [CrossRef] [PubMed]
- Cannarozzi, G.; et al. A role for codon order in translation dynamics. Cell 2010, 141, 355–367. [Google Scholar] [CrossRef] [PubMed]
- Orsolic, I., Carrier, A.; Esteller, M. Genetic and epigenetic defects of the RNA modification machinery in cancer. Trends Genet S0168-9525(22)00252–9 (2022). [CrossRef]
- Zhang, Z.; et al. Global analysis of tRNA and translation factor expression reveals a dynamic landscape of translational regulation in human cancers. Commun Biol 2018, 1, 234. [Google Scholar] [CrossRef]
- Frezza, C. Metabolism and cancer: the future is now. Br J Cancer 2020, 122, 133–135. [Google Scholar] [CrossRef]
- Gupta, R.; et al. A tRNA modification balances carbon and nitrogen metabolism by regulating phosphate homeostasis. Elife 2019, 8, e44795. [Google Scholar] [CrossRef]
- Gupta, R.; Laxman, S. tRNA wobble-uridine modifications as amino acid sensors and regulators of cellular metabolic state. Curr Genet 2020, 66, 475–480. [Google Scholar] [CrossRef]
- Gupta, T. , Malkin, M.G.; Huang, S. tRNA Function and Dysregulation in Cancer. Front Cell Dev Biol 2022, 10, 886642. [Google Scholar] [CrossRef]
- Liu, B.; Qian, S.-B. Translational reprogramming in cellular stress response. WIREs RNA 2014, 5, 301–305. [Google Scholar] [CrossRef]
- Domingo, E. Interaction of virus populations with their hosts. Virus as Populations 2020, 123–166. [Google Scholar] [CrossRef]
- Peña, N.; et al. Profiling Selective Packaging of Host RNA and Viral RNA Modification in SARS-CoV-2 Viral Preparations. Frontiers in Cell and Developmental Biology 2022, 10. [Google Scholar] [CrossRef] [PubMed]
- Zhang, K.; et al. Proteolytic cleavage and inactivation of the TRMT1 tRNA modification enzyme by SARS-CoV-2 main protease. Elife 2024, 12, RP90316. [Google Scholar] [CrossRef] [PubMed]
- Lu, J.-L.; Zhou, X.-L. SARS-CoV-2 main protease Nsp5 cleaves and inactivates human tRNA methyltransferase TRMT1. J Mol Cell Biol mjad024 2023, mjad024. [Google Scholar] [CrossRef] [PubMed]
- D’Oliviera, A.; et al. Recognition and Cleavage of Human tRNA Methyltransferase TRMT1 by the SARS-CoV-2 Main Protease. bioRxiv 2023.02.20.529306 (2023). [CrossRef]
- Chan, C.; et al. Dengue virus exploits the host tRNA epitranscriptome to promote viral replication. bioRxiv 2023.11.05.565734 (2023). [CrossRef]
- Johansson, M.J.O. , Xu, F.; Byström, A.S. Elongator—a tRNA modifying complex that promotes efficient translational decoding. Biochimica et Biophysica Acta (BBA) - Gene Regulatory Mechanisms 2018, 1861, 401–408. [Google Scholar] [CrossRef]
- Karlsborn, T. , Tükenmez, H., Chen, C.; Byström, A.S. Familial dysautonomia (FD) patients have reduced levels of the modified wobble nucleoside mcm5s2U in tRNA. Biochemical and Biophysical Research Communications 2014, 454, 441–445. [Google Scholar] [CrossRef]
- Stern-Ginossar, N. , Thompson, S.R., Mathews, M.B.; Mohr, I. Translational Control in Virus-Infected Cells. Cold Spring Harb Perspect Biol 2019, 11, a033001. [Google Scholar] [CrossRef]
- Nunes, A.; et al. Emerging Roles of tRNAs in RNA Virus Infections. Trends Biochem Sci 2020, 45, 794–805. [Google Scholar] [CrossRef]
- Tavares, J.F.; et al. tRNA-modifying enzyme mutations induce codon-specific mistranslation and protein aggregation in yeast. RNA Biol 2021, 18, 563–575. [Google Scholar] [CrossRef] [PubMed]
- Castellano, L.A.; et al. Dengue virus preferentially uses human and mosquito non-optimal codons. Mol Syst Biol (2024). [CrossRef]
- Wilusz, J.E. Controlling translation via modulation of tRNA levels. Wiley Interdiscip Rev RNA 2015, 6, 453–470. [Google Scholar] [CrossRef] [PubMed]
- van Weringh, A.; et al. HIV-1 modulates the tRNA pool to improve translation efficiency. Mol Biol Evol 2011, 28, 1827–1834. [Google Scholar] [CrossRef]
- Felton-Edkins, Z.A.; White, R.J. Multiple mechanisms contribute to the activation of RNA polymerase III transcription in cells transformed by papovaviruses. J Biol Chem 2002, 277, 48182–48191. [Google Scholar] [CrossRef]
- Felton-Edkins, Z.A.; et al. Epstein-Barr virus induces cellular transcription factors to allow active expression of EBER genes by RNA polymerase III. J Biol Chem 2006, 281, 33871–33880. [Google Scholar] [CrossRef]
- Gaynor, R.B. , Feldman, L.T.; Berk, A.J. Transcription of class III genes activated by viral immediate early proteins. Science 1985, 230, 447–450. [Google Scholar] [CrossRef]
- Panning, B.; Smiley, J.R. Activation of RNA polymerase III transcription of human Alu elements by herpes simplex virus. Virology 1994, 202, 408–417. [Google Scholar] [CrossRef]
- Behrens, A. , Rodschinka, G.; Nedialkova, D.D. High-resolution quantitative profiling of tRNA abundance and modification status in eukaryotes by mim-tRNAseq. Mol Cell 2021, 81, 1802–1815. [Google Scholar] [CrossRef]
- Behrens, A.; Nedialkova, D.D. Experimental and computational workflow for the analysis of tRNA pools from eukaryotic cells by mim-tRNAseq. STAR Protoc 2022, 3, 101579. [Google Scholar] [CrossRef]
- Ammann, G. , Berg, M., Dalwigk, J.F.; Kaiser, S.M. Pitfalls in RNA Modification Quantification Using Nucleoside Mass Spectrometry. Acc. Chem. Res. 2023, 56, 3121–3131. [Google Scholar] [CrossRef]
- Amalric, A.; et al. Mass Spectrometry-Based Pipeline for Identifying RNA Modifications Involved in a Functional Process: Application to Cancer Cell Adaptation. Anal. Chem. 2024, 96, 1825–1833. [Google Scholar] [CrossRef] [PubMed]
- Acera Mateos, P. , Zhou, Y., Zarnack, K.; Eyras, E. Concepts and methods for transcriptome-wide prediction of chemical messenger RNA modifications with machine learning. Brief Bioinform 2023, 24, bbad163. [Google Scholar] [CrossRef] [PubMed]
- Thomas, N.K.; et al. Direct Nanopore Sequencing of Individual Full Length tRNA Strands. ACS Nano 2021, 15, 16642–16653. [Google Scholar] [CrossRef] [PubMed]
- Cerneckis, J. , Ming, G.-L., Song, H., He, C.; Shi, Y. The rise of epitranscriptomics: recent developments and future directions. Trends in Pharmacological Sciences 2024, 45, 24–38. [Google Scholar] [CrossRef] [PubMed]
- Yuan, X.; et al. Mass Spectrometry-Based Direct Sequencing of tRNAs De Novo and Quantitative Mapping of Multiple RNA Modifications. J Am Chem Soc (2024). [CrossRef]
- Marco, K.; et al. DORQ-seq: high-throughput quantification of femtomol tRNA pools by combination of cDNA hybridization and Deep sequencing. Nucleic Acids Res gkae765 (2024). [CrossRef]
- Diensthuber, G.; et al. Enhanced detection of RNA modifications and read mapping with high-accuracy nanopore RNA basecalling models. Genome Res gr.278849.123 (2024). 2024. [CrossRef]
- Gokhale, N.S.; Horner, S.M. RNA modifications go viral. PLoS Pathogens 2017, 13. [Google Scholar] [CrossRef]
- Tong, J.; et al. The Emerging Role of RNA Modifications in the Regulation of Antiviral Innate Immunity. Front Microbiol 2022, 13, 845625. [Google Scholar] [CrossRef]
- Ahmed-Belkacem, R.; et al. Potent Inhibition of SARS-CoV-2 nsp14 N7-Methyltransferase by Sulfonamide-Based Bisubstrate Analogues. J Med Chem 2022, 65, 6231–6249. [Google Scholar] [CrossRef] [PubMed]
- Tumu, S. , Patil, A., Towns, W., Dyavaiah, M.; Begley, T.J. The gene-specific codon counting database: a genome-based catalog of one-, two-, three-, four- and five-codon combinations present in Saccharomyces cerevisiae genes. Database : the journal of biological databases and curation 2012, 2012, bas002. [Google Scholar]
- Sabi, R. , Volvovitch Daniel, R.; Tuller, T. stAIcalc: tRNA adaptation index calculator based on species-specific weights. Bioinformatics 2017, 33, 589–591. [Google Scholar] [CrossRef] [PubMed]
- Sturn, A. , Quackenbush, J.; Trajanoski, Z. Genesis: cluster analysis of microarray data. Bioinformatics 2002, 18, 207–208. [Google Scholar] [CrossRef] [PubMed]
- de Hoon, M.J.L. , Imoto, S., Nolan, J.; Miyano, S. Open source clustering software. Bioinformatics 2004, 20, 1453–1454. [Google Scholar] [CrossRef]
- Saldanha, A.J. Java Treeview--extensible visualization of microarray data. Bioinformatics 2004, 20, 3246–3248. [Google Scholar] [CrossRef]
- Wang, M. , Herrmann, C.J., Simonovic, M., Szklarczyk, D.; von Mering, C. Version 4.0 of PaxDb: Protein abundance data, integrated across model organisms, tissues, and cell-lines. PROTEOMICS 2015, 15, 3163–3168. [Google Scholar] [CrossRef]
Figure 1.
A, standard genetic code, tRNA anticodons and their base modifications found in Homo sapiens. U34 modifications are in purple (mcm5s2U), orange (mcm5U) or green (ncm5U). Non-U34 modifications on the anticodon bases are in light blue, including Inosine (I), pseudouridine (Ψ), 2’-O-methylguanosine (Gm), 2’-O-methylcytosine (Cm), and Queuosine (Q). B, position of the multiple modifications on tRNA skeleton. C, U34-modified tRNAs and enzyme complexes involved in U34 tRNA modifications. tRNAArgUCU can be found with both marks either mcm5 or mcm5s2.1.1. The wobble hypothesis and tRNA U34 modifications.
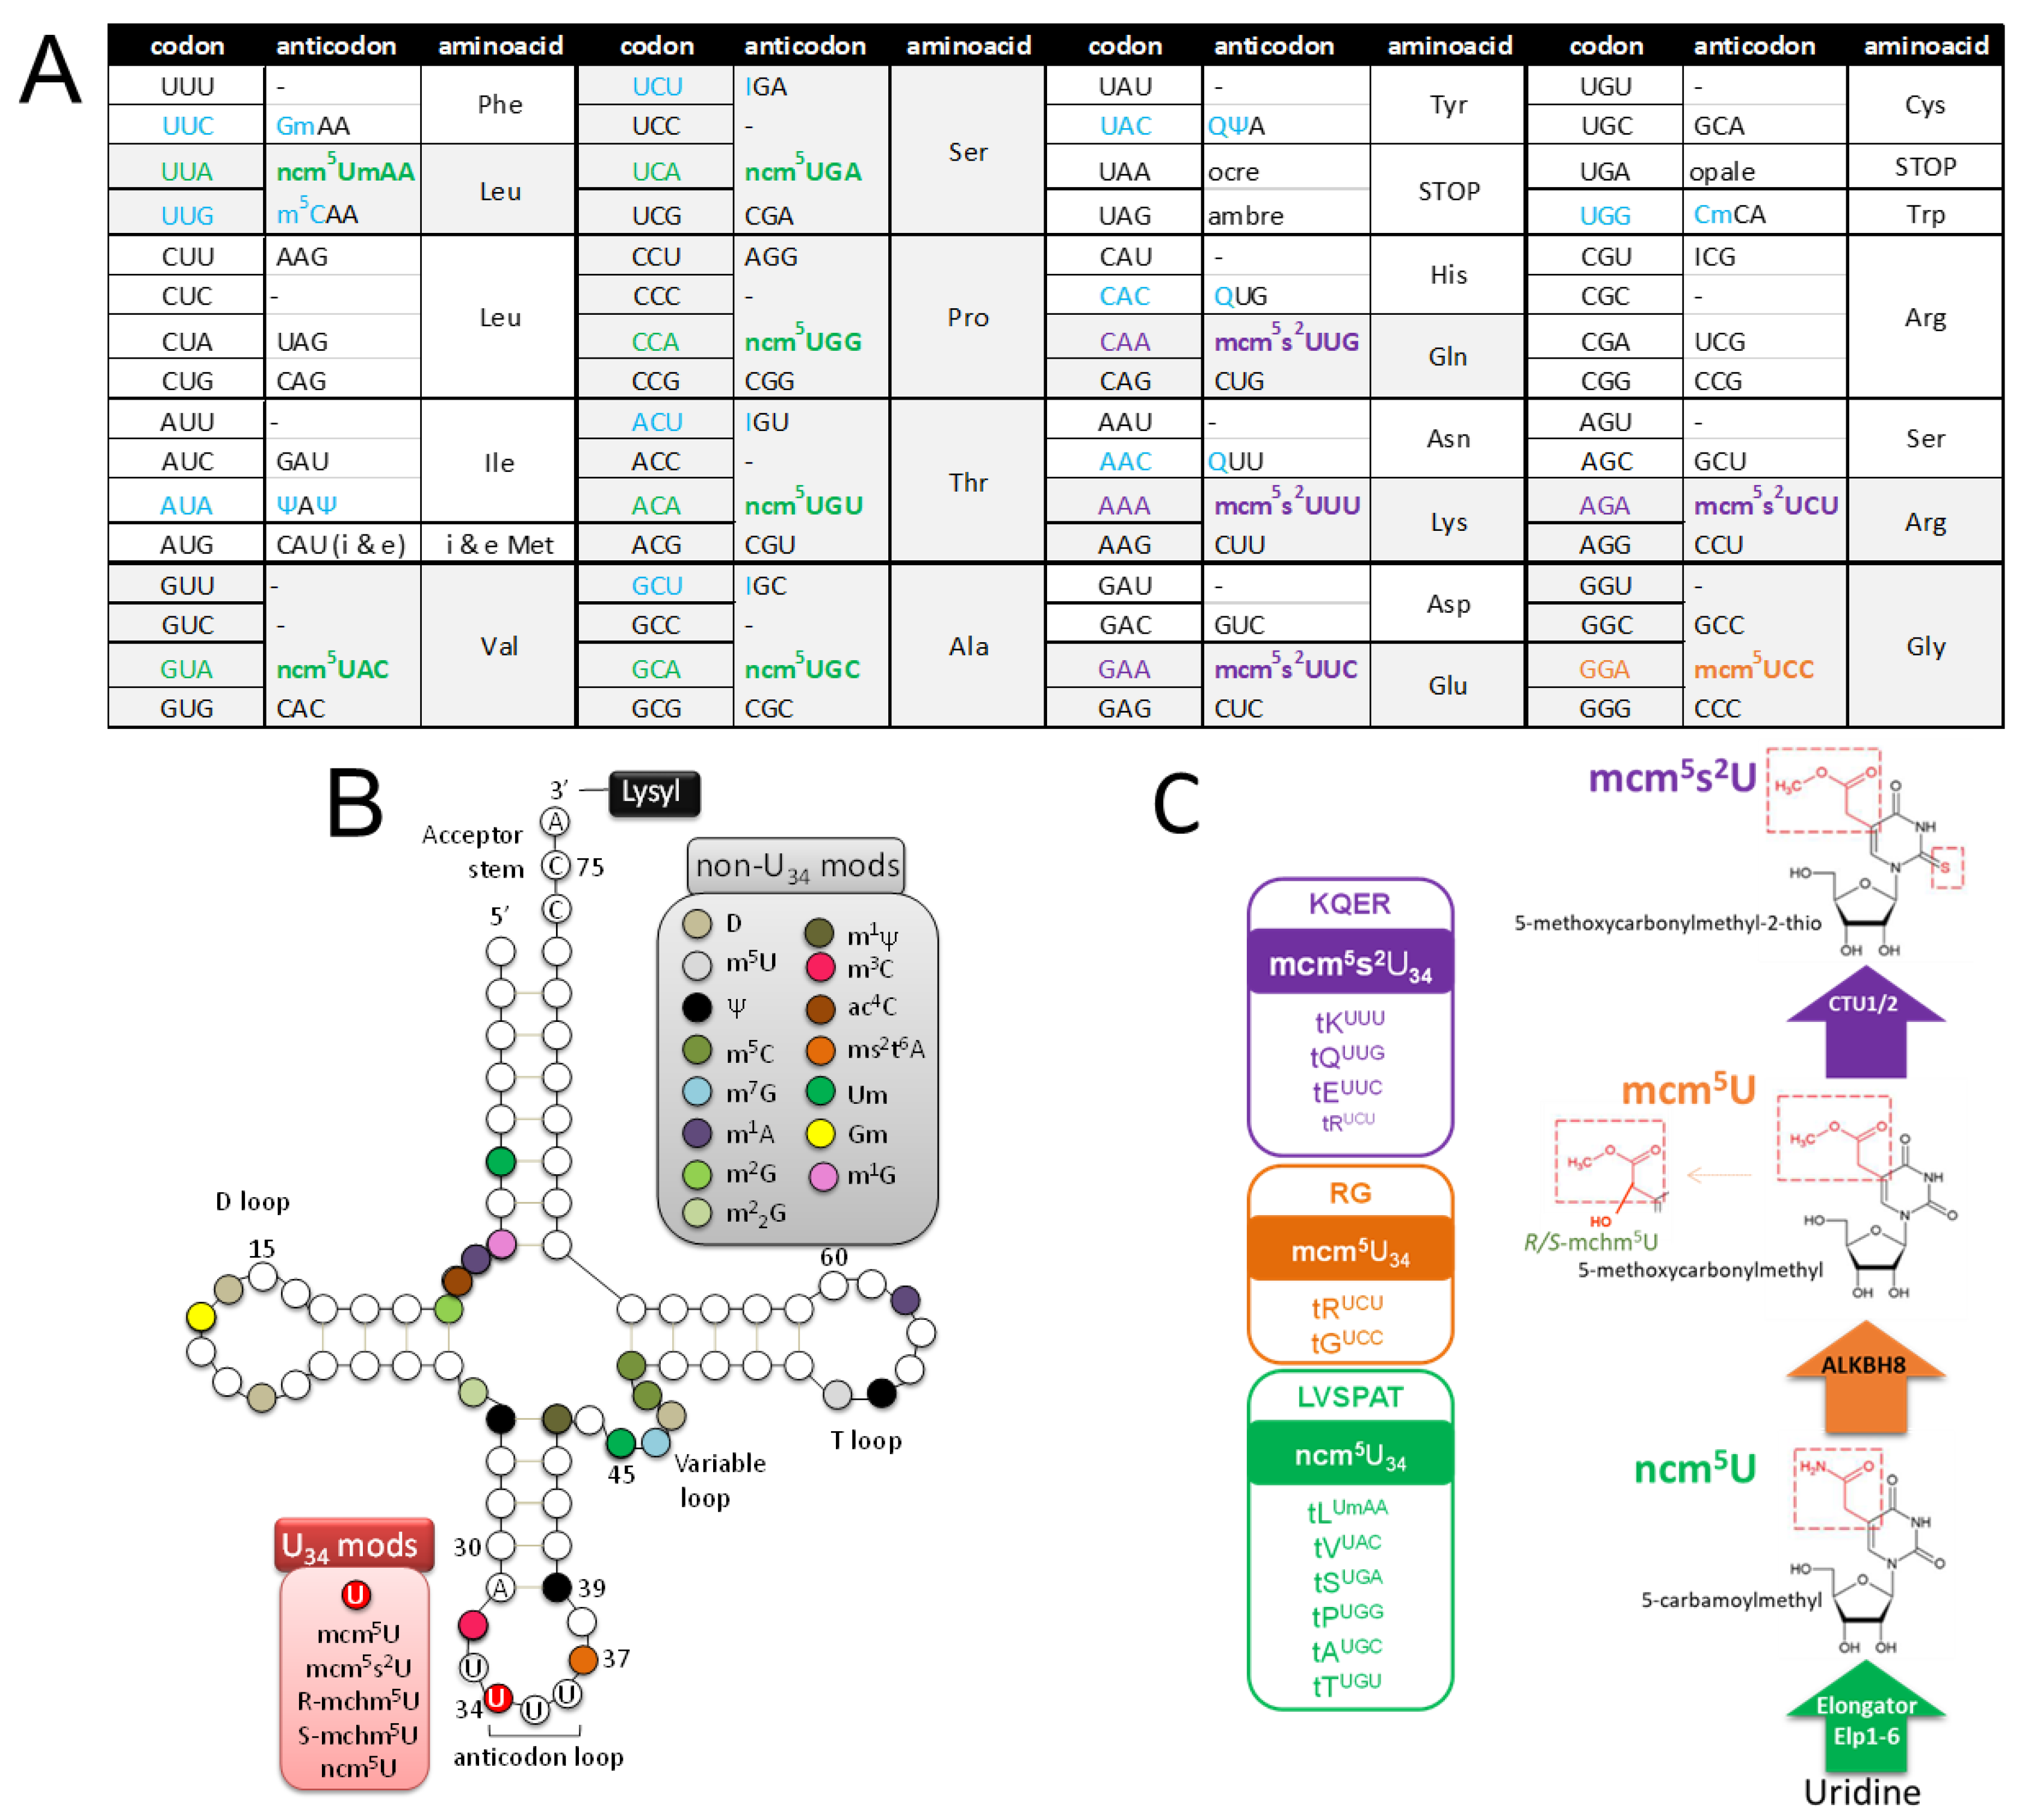
Figure 2.
A, genome organization of SARS-CoV-2 and corresponding Codon Adaptation Index (CAI) with human genome. B, SARS-CoV-2 CAI (ORF-size weighted average) with respect to various species.
Figure 2.
A, genome organization of SARS-CoV-2 and corresponding Codon Adaptation Index (CAI) with human genome. B, SARS-CoV-2 CAI (ORF-size weighted average) with respect to various species.
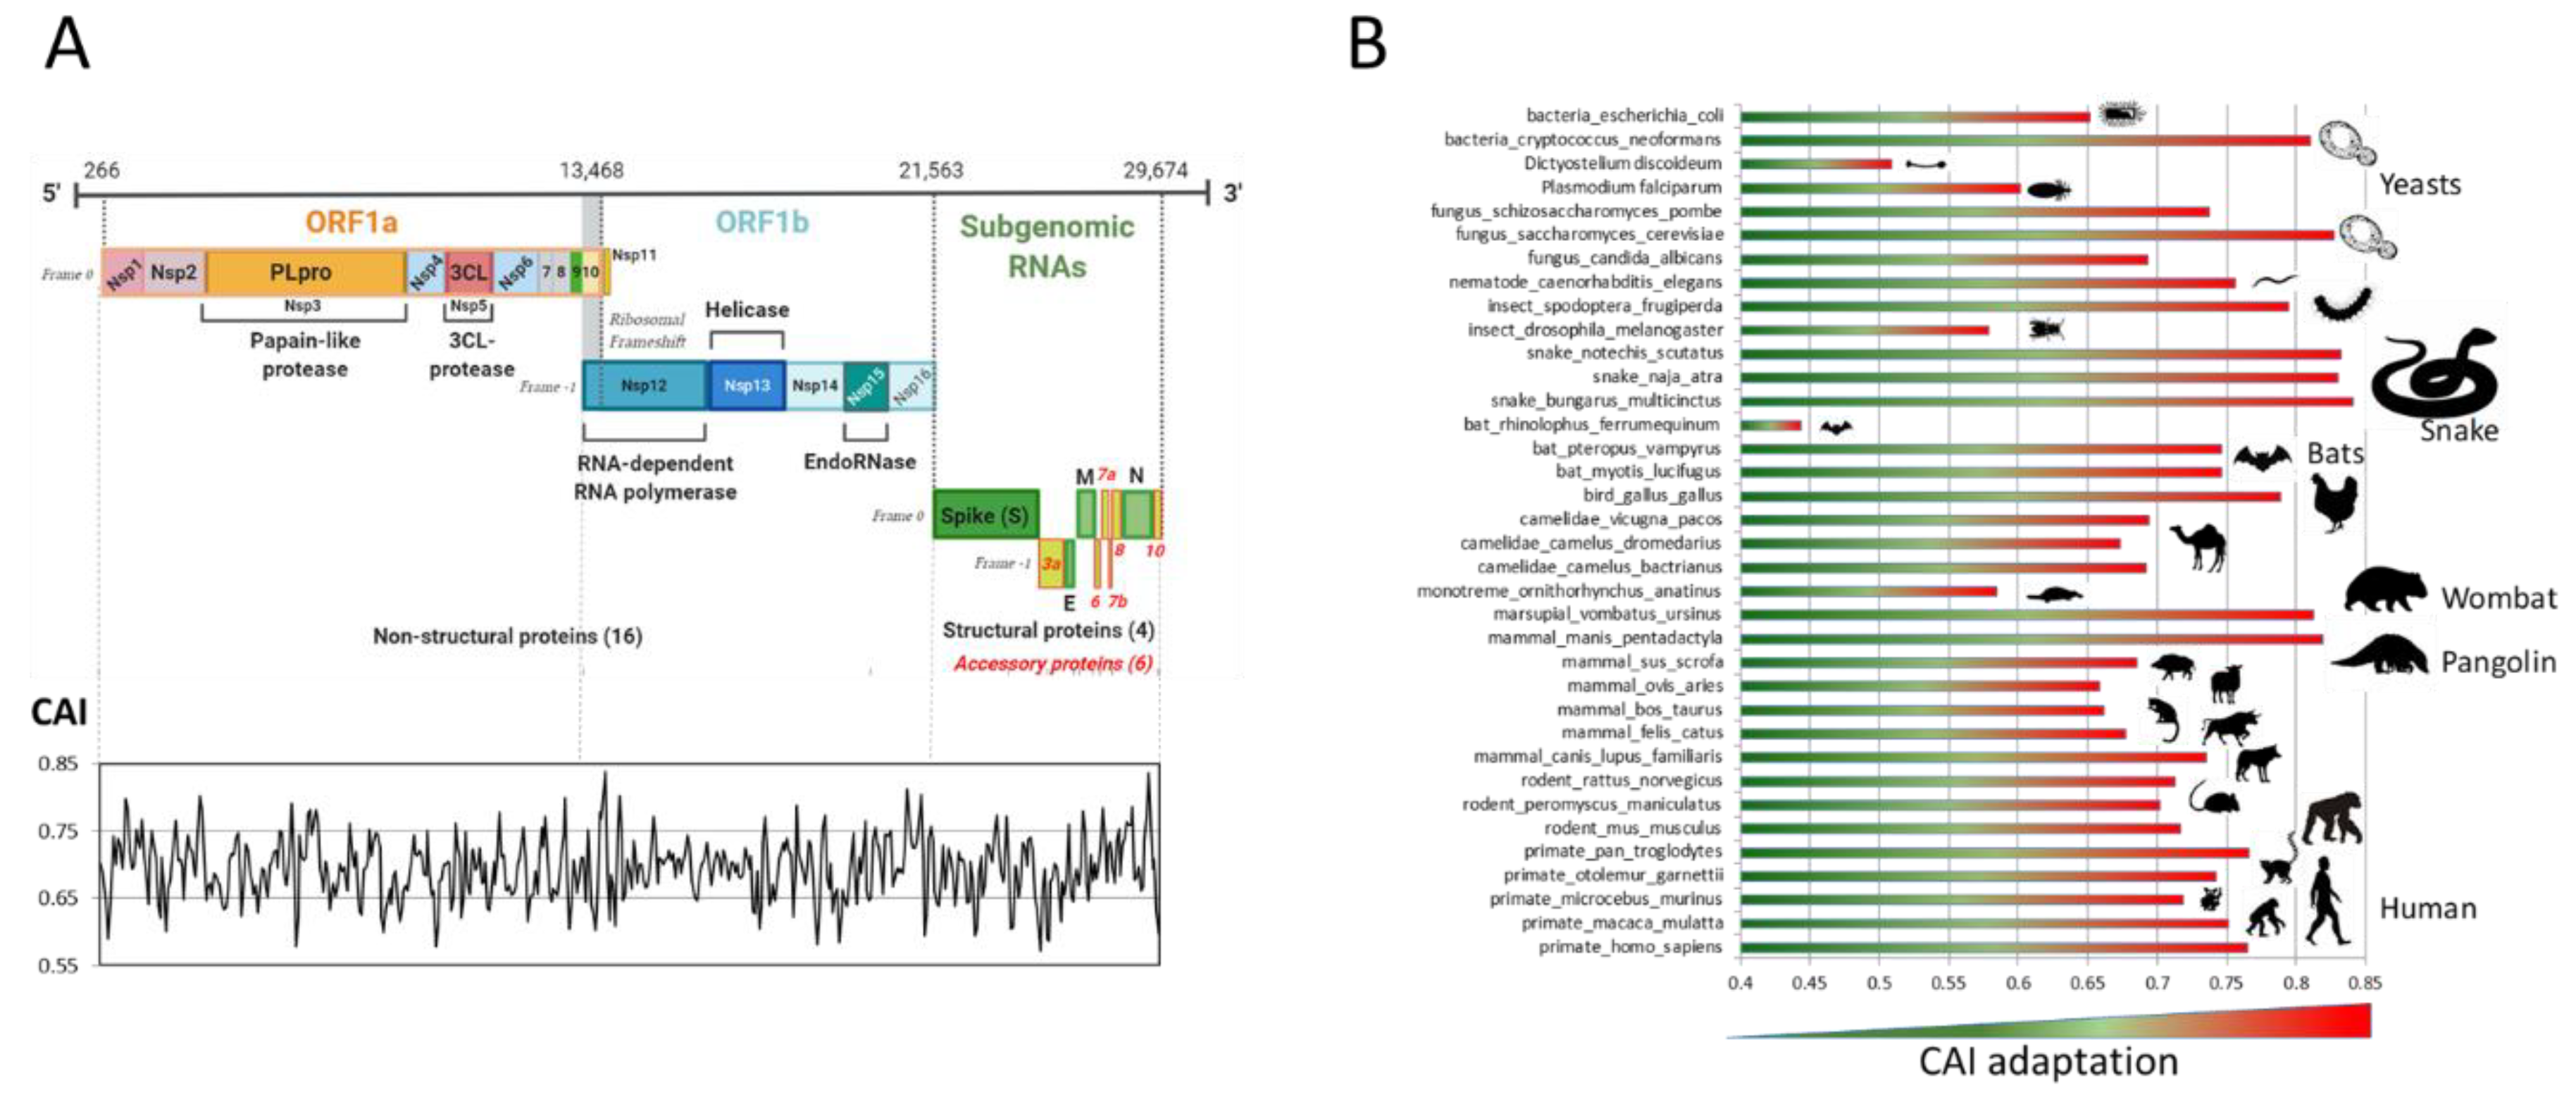
Figure 3.
A, Nc plots of SARS-CoV-2 Wuhan’s isolate individual gene segments (right) along with Flavivirus genomes (PF13, Asian genotype from French Polynesia (2013); MR766 original African genotype from Uganda (1955)) (left) and differentially expressed human genes (DHX9 (or RHA), DDX58 (RIG-I), KAL (Kallmann syndrome protein), IFN-beta (beta-interferon), Tubulin (beta-tubulin), Myosin (Myosin Heavy Chain), Globin (beta-globin)) (center). The dotted line represents the expected Nc values if the codon bias is affected by GC3s only. Black dot represents the position of the SARS-CoV-2 total coding genome. B, Nc plot of Orf1a and Spike gene segments from seven coronaviruses. C, neutrality plot analysis corresponding to virus sequences used in B. GC12 frequencies were plotted against GC3 frequencies. The y-axis (GC12) refers to the average GC frequency at the first and second codon positions. The x-axis (GC3) refers to the GC frequency at the third codon position. The slope value indicates the mutational pressure percentage.
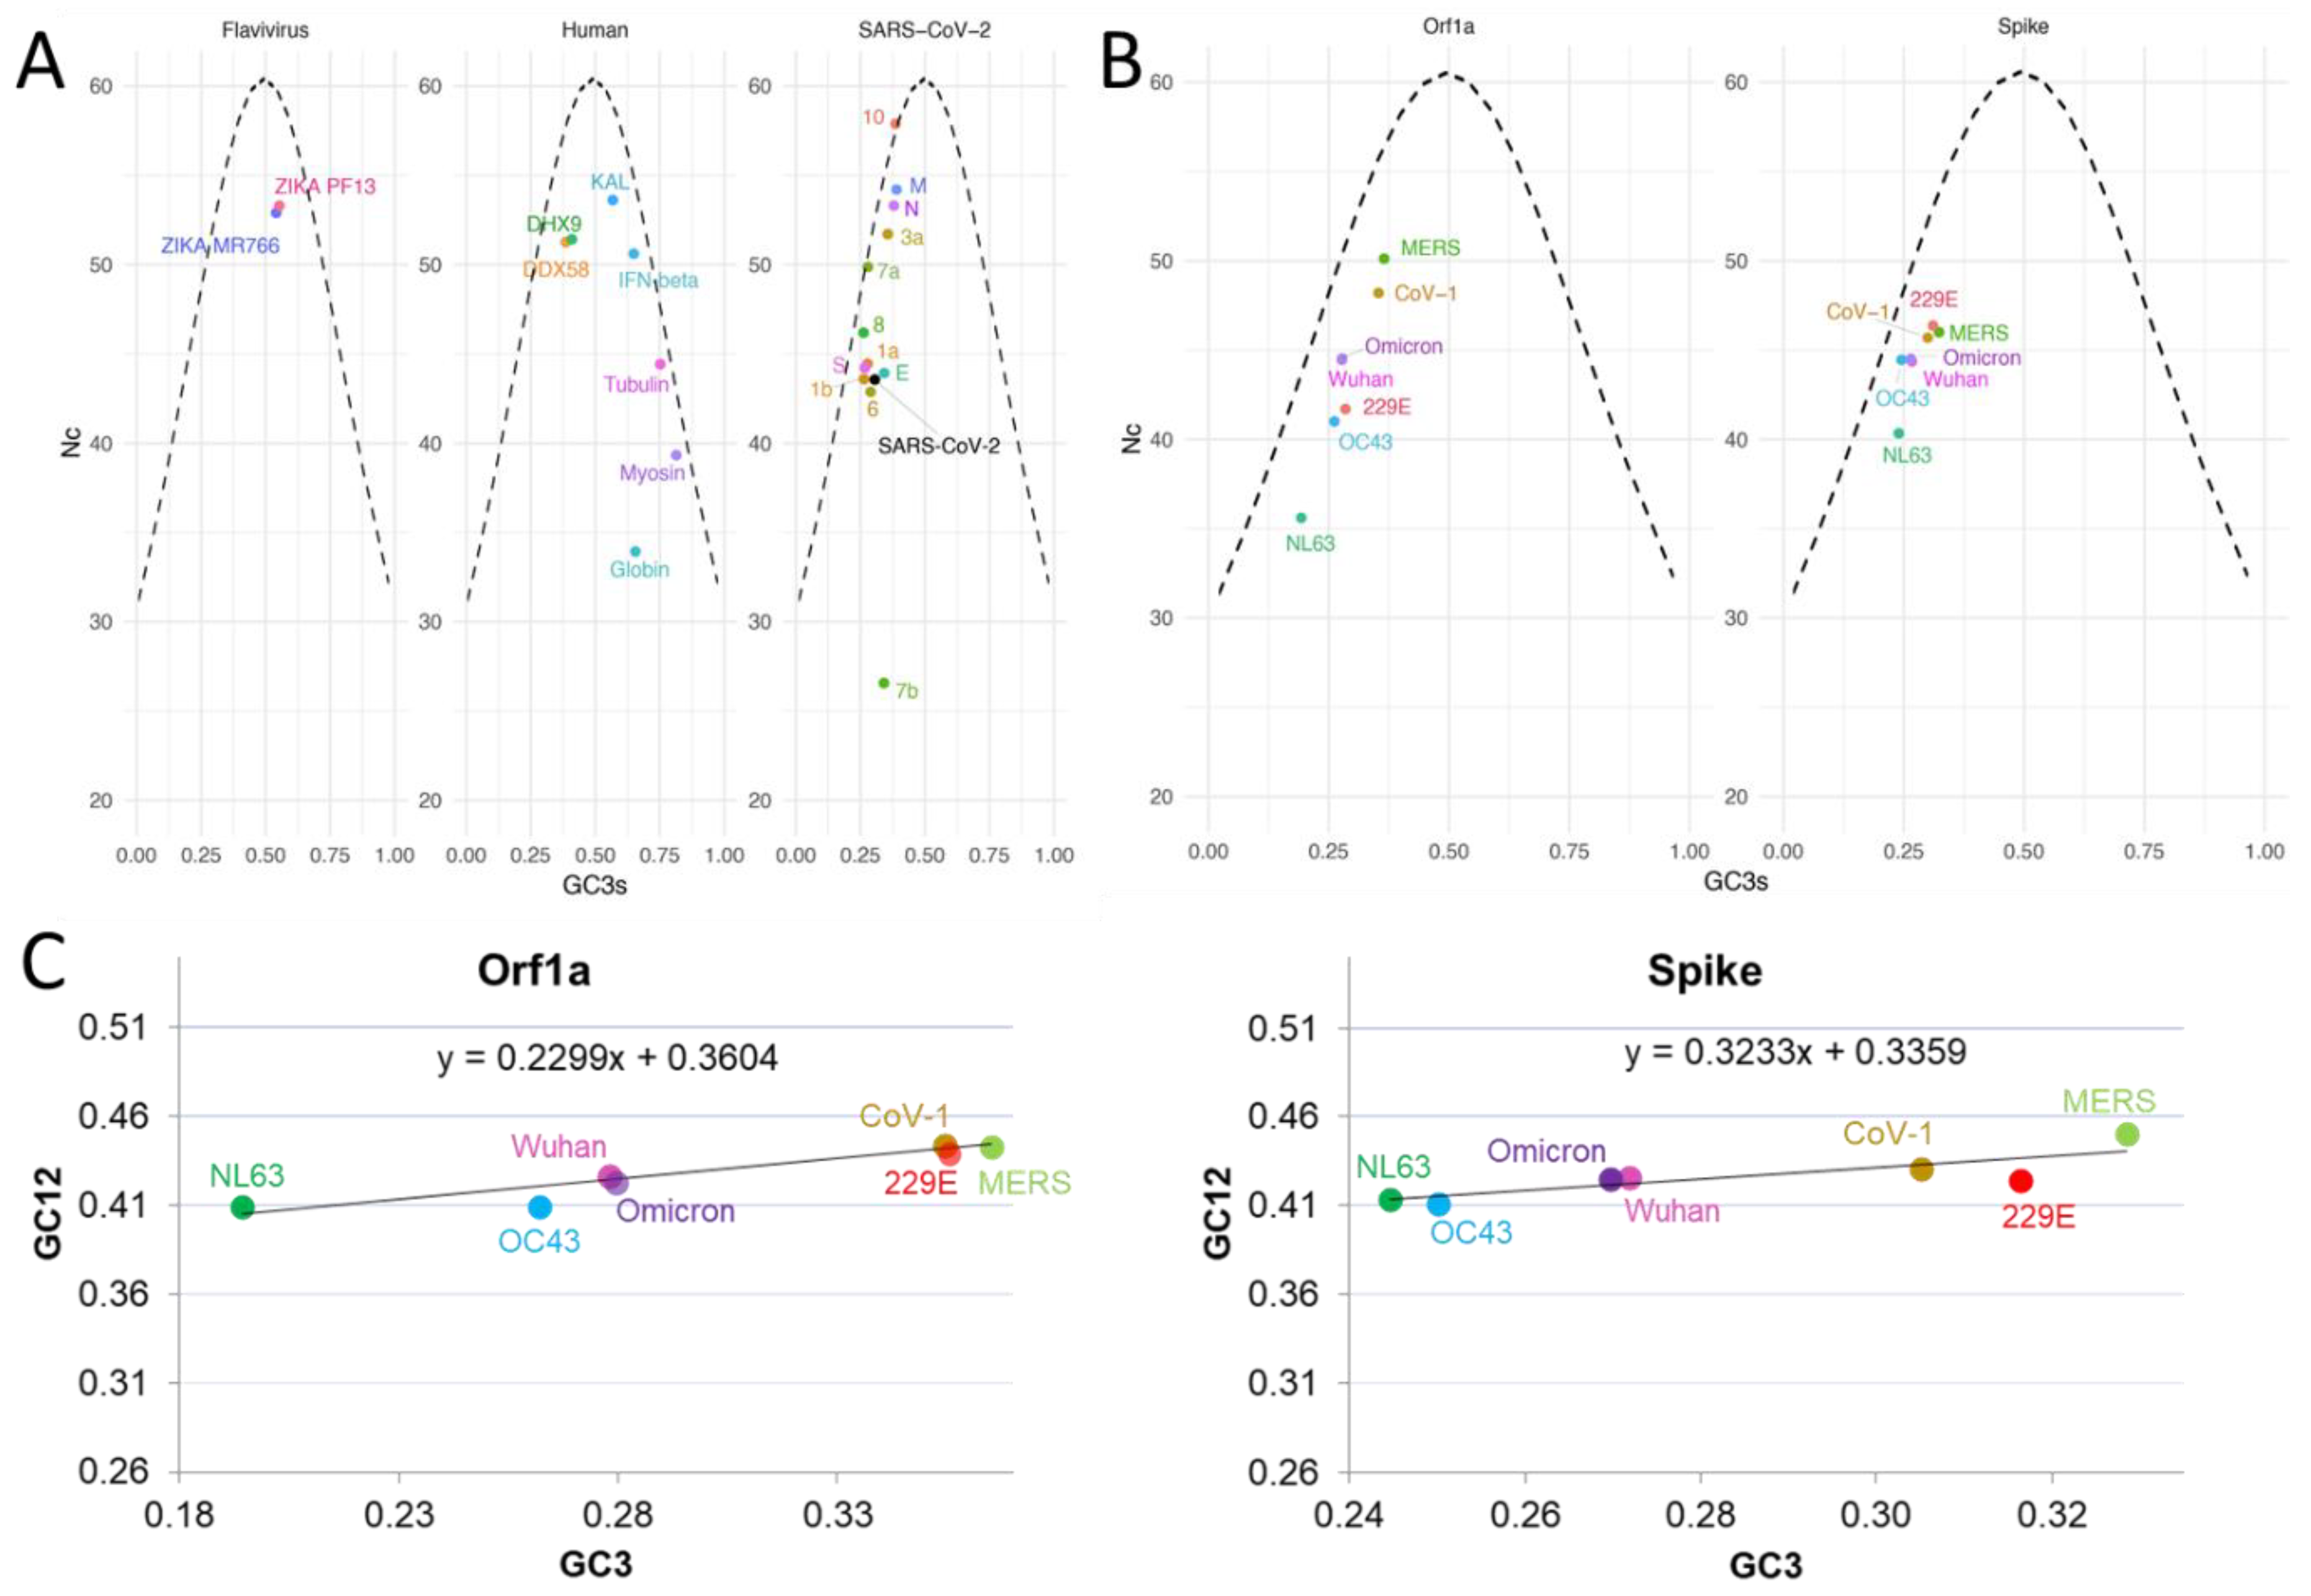
Figure 4.
Hierarchical cluster analysis of RSCU for Human Coronavirus (left) and SARS-CoV-2 (Wuhan reference genome) longest ORFs (right), encoding non-structural genes (Orf1a an Orf1b) and structural gene Spike. Average linkage WPGMA (weighted pair group method with averaging) was used as agglomeration method. U34-sensitive codons are noted with asterisks and their cluster is outlined in yellow.
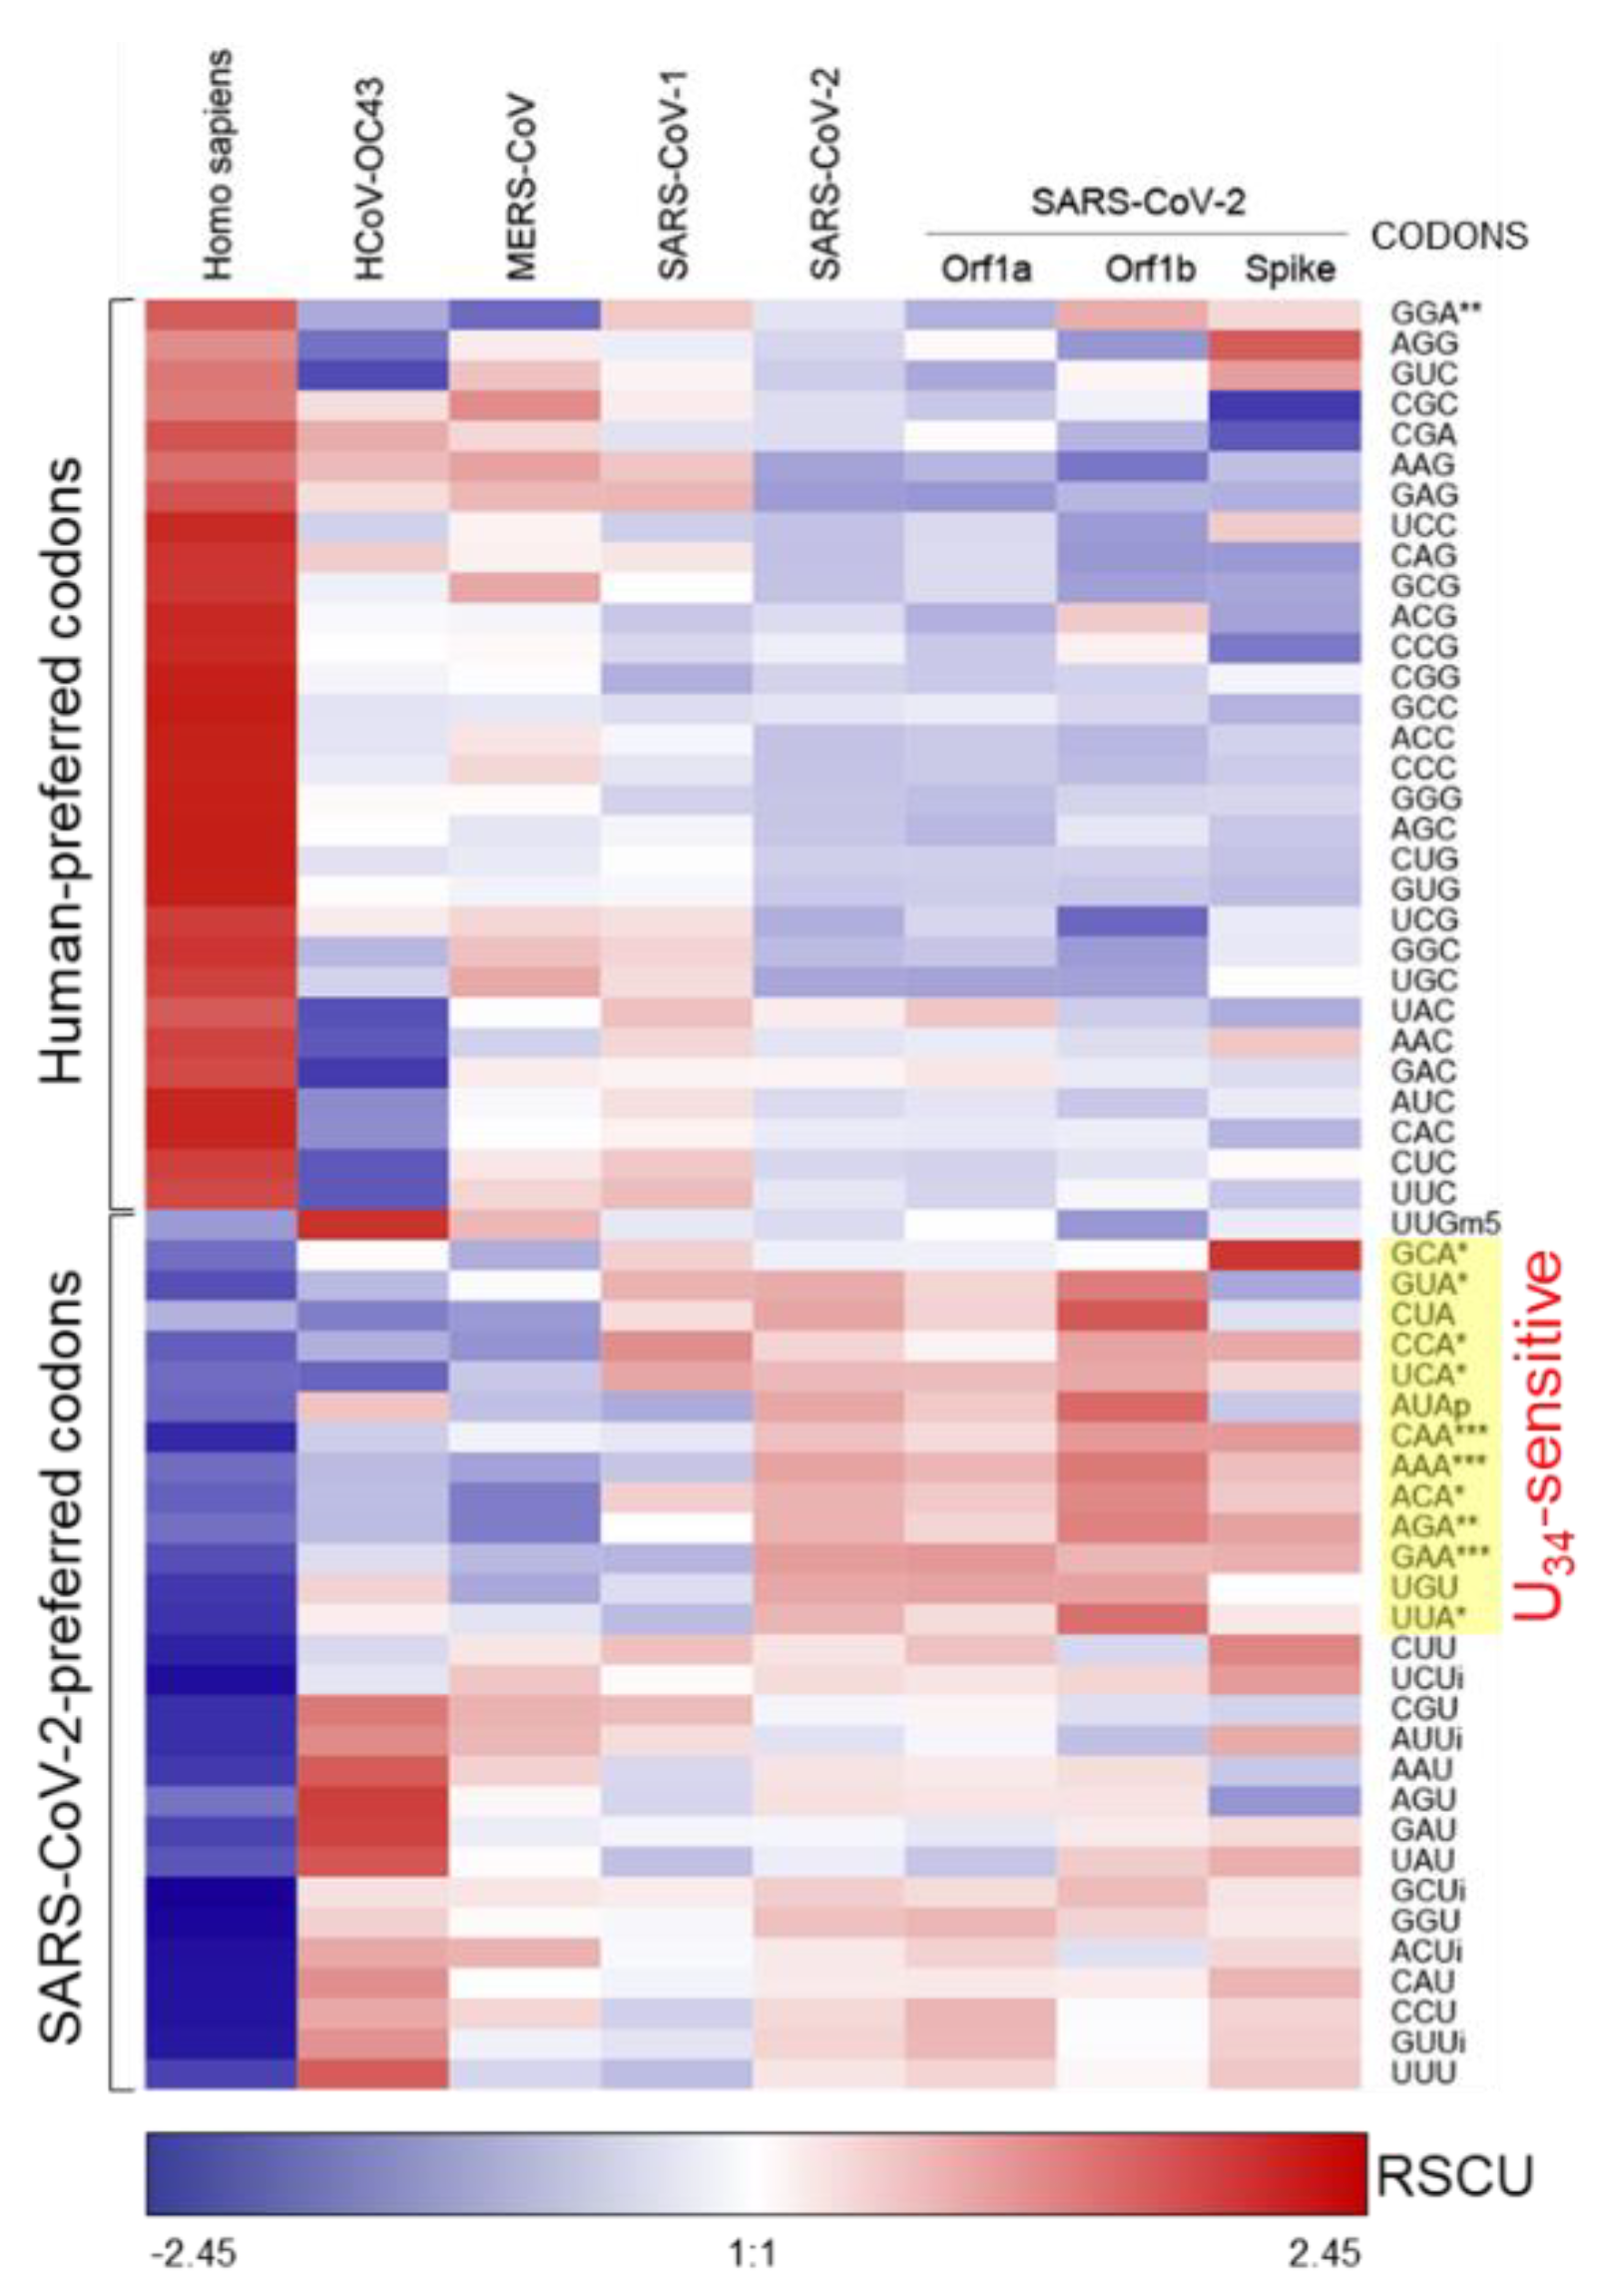
Figure 5.
tRNA Adapatation Index (tAI) of Coronavirus. A, Calculations were performed with stAIcalc software (http://tau-tai.azurewebsites.net) using human tRNA gene copy number retrieved from the genomic tRNA database (http://gtrnadb.ucsc.edu), for non-structural (ORF1ab) or structural (S, E, M, N) ORFs of coronavirus infecting bat (RaTG13) and humans (hCoV 229E, hCoV OC43, SARS-CoV-1, MERS-CoV and SARS-CoV-2). For comparison, tAI of human ORFs encoding highly abundant proteins (Protein Abundance Database (https://pax-db.org)) were calculated. B, correlation between normalized human tRNA gene copy number (GCN) and normalized experimental anticodon tRNA expression level in human primary cells derived from iPSC cells (CM, cardiomyocytes; NPC, neuronal progenitor cells), based on the data from Gao et al. (2024) [101]. Anticodons are colorcoded with respect to tRNA modifications occuring at position 34.
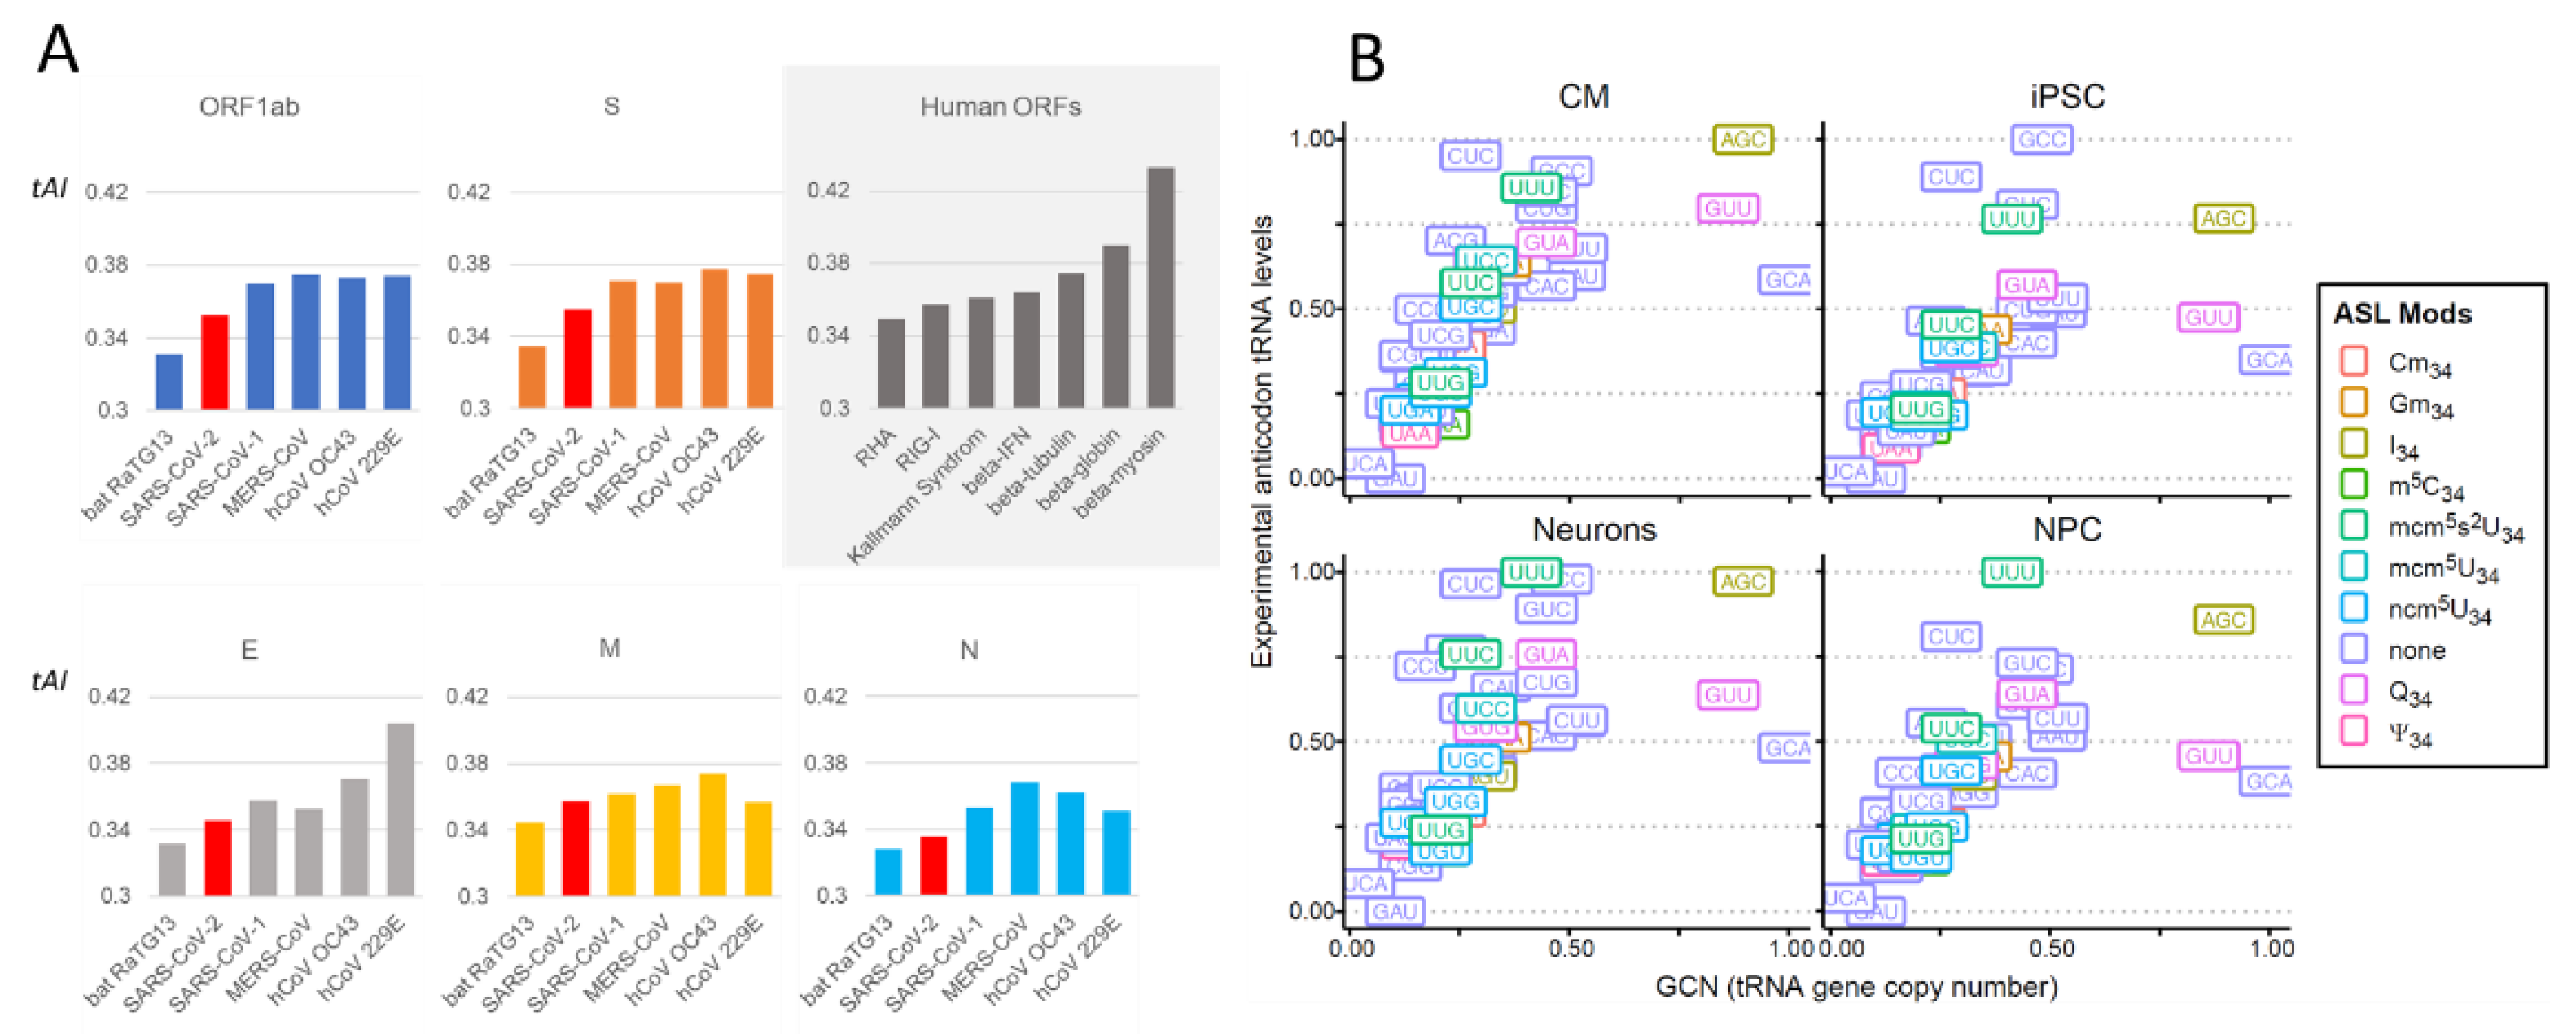
Figure 6.
Insertional furin cleavage site in SARS-CoV-2 Spike gene segment. A, sequence alignment between Wuhan SARS-CoV-2 isolate and bat RaTG13 sequences along with their respective RSCUs and human-related CAI profiles. B, sequence variation of SARS-CoV-2 variants in the furin site vicinity. Codons highlighted in yellow represent codon variations between SARS-CoV-2 and RaTG13 without amino acid change. C, RSCU of Arg codons found in the different ORFs of Wuhan SARS-CoV-2 primary isolate compared to the ArgRSCU of the highly expressed human beta-myosin ORF.
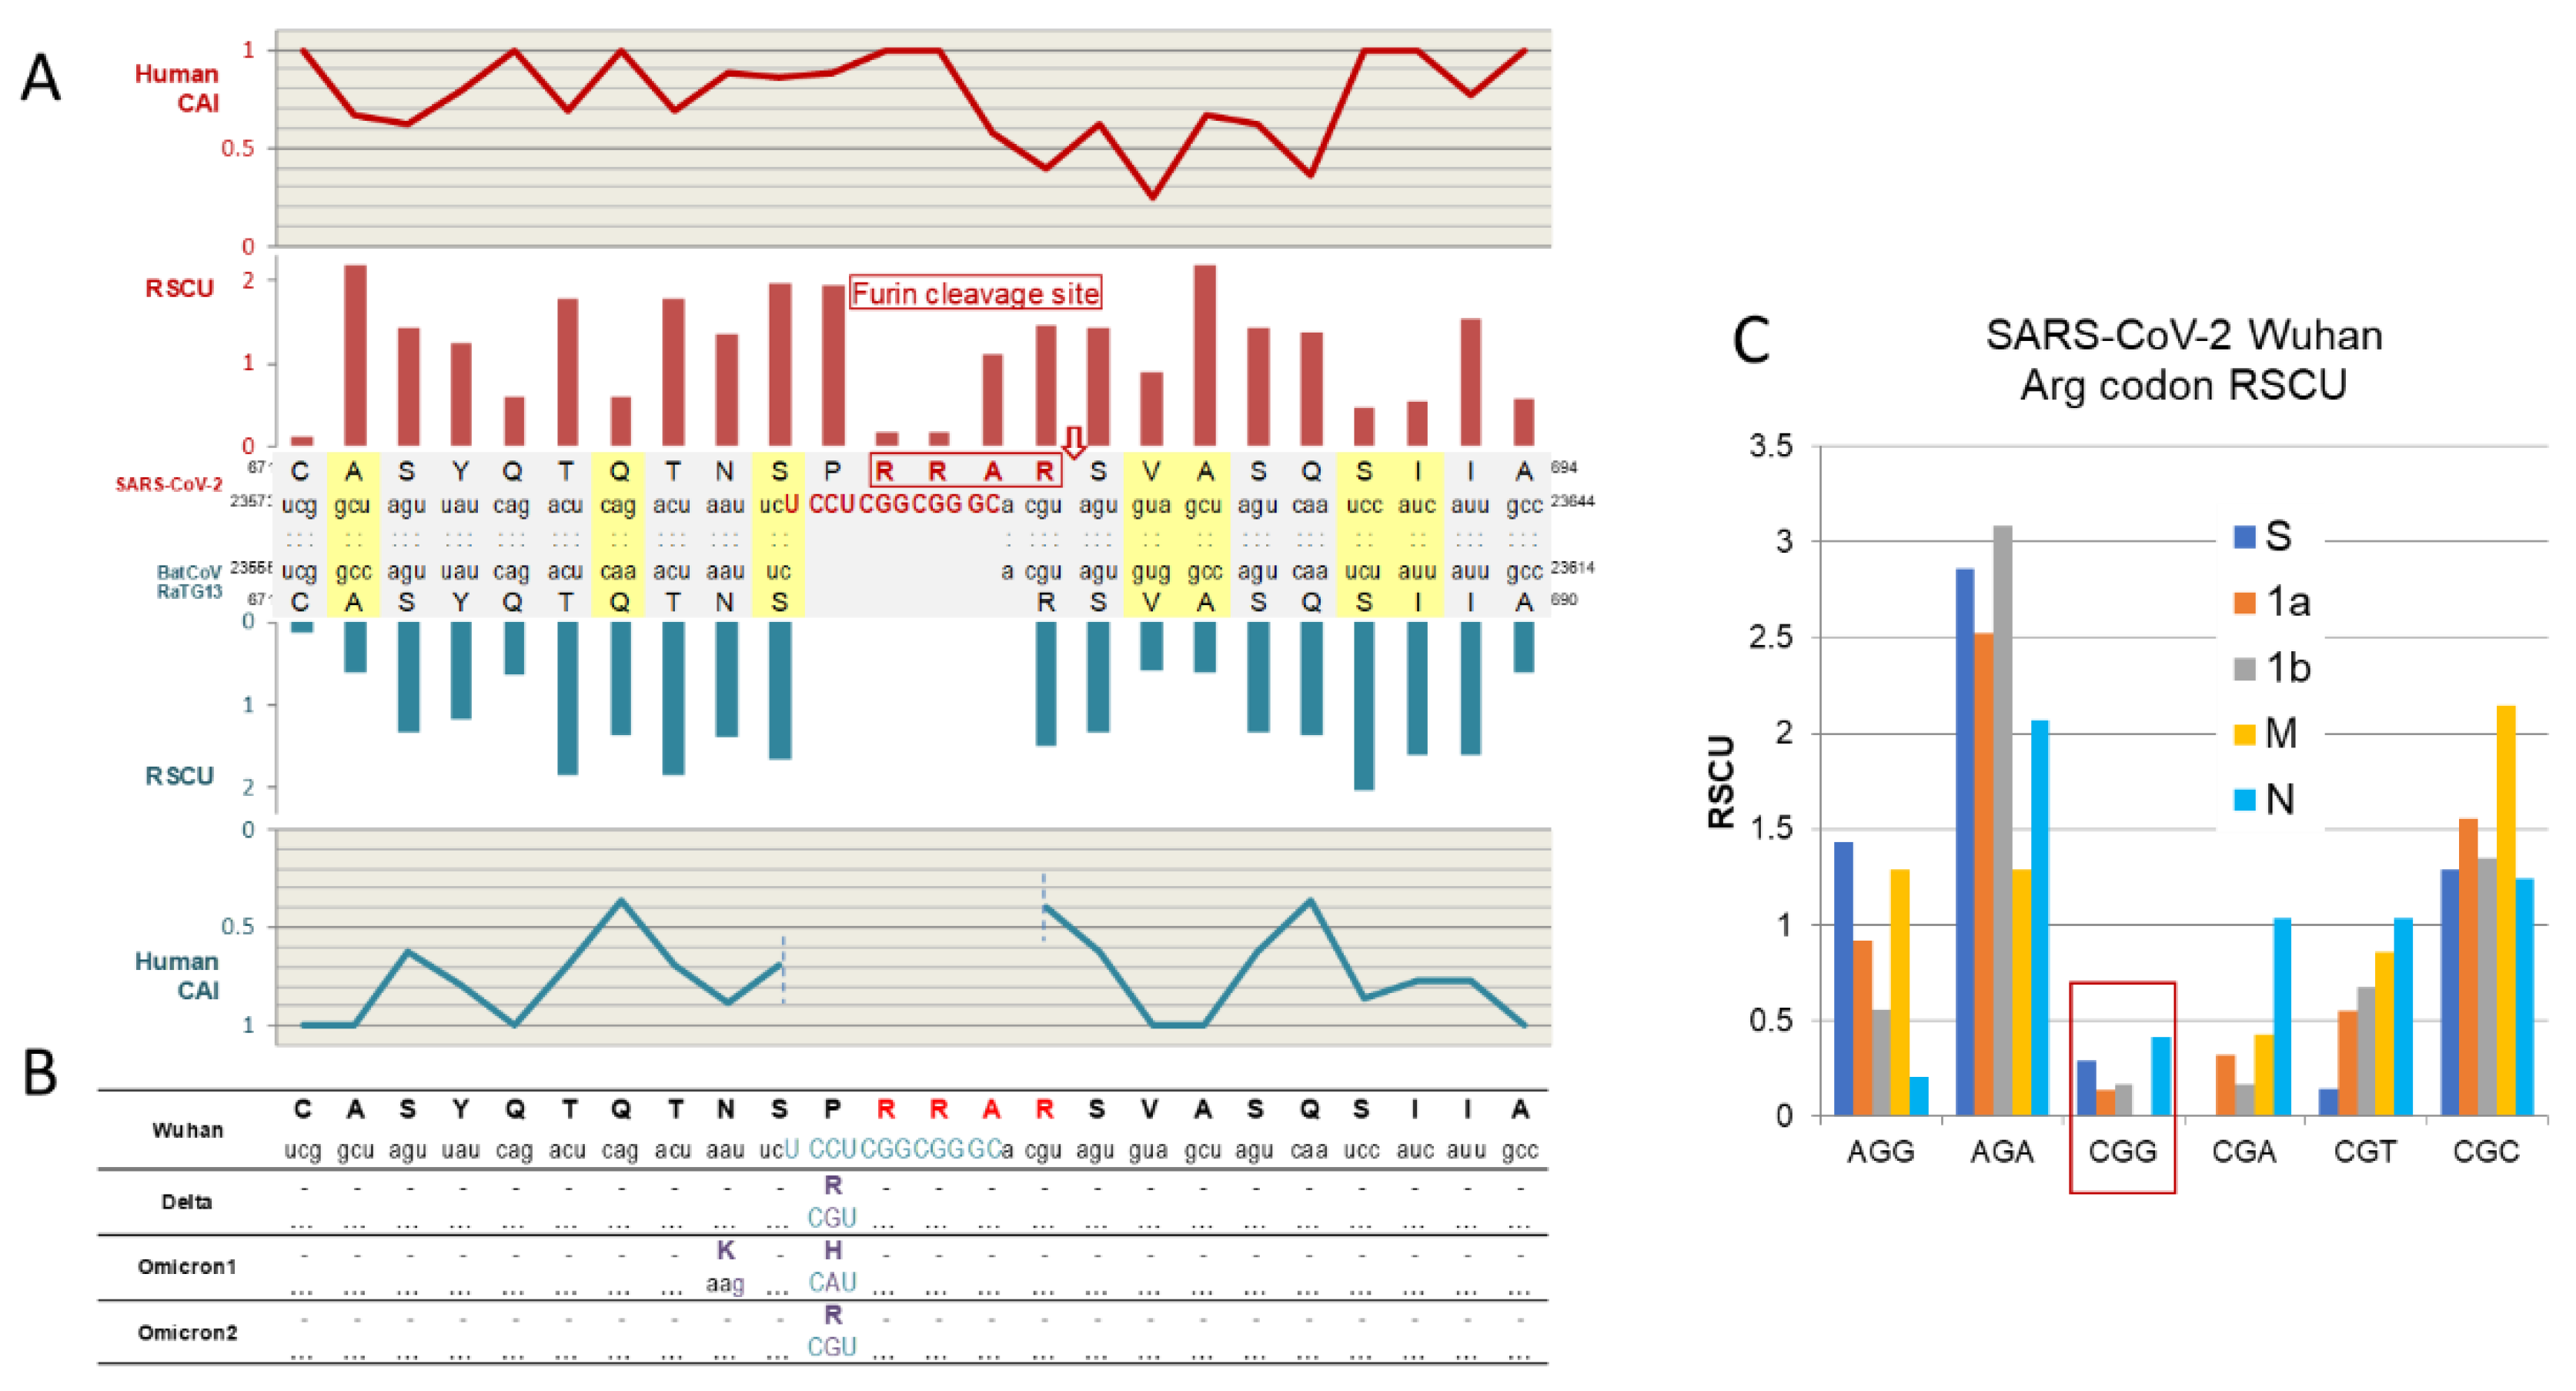
Figure 7.
A. SARS-CoV-2 codon bias variation over time. RSCUs for Spike and Orf1ab were calculated from the various clade sequences extracted from the Fumagalli’s paper [136] and analyzed overtime for each clade by cluster analysis (using Genesis algorithm [180]). Sequence count profiles are shown beneath each clade time scale to trace each clade expansion. B. Comparison of RSCUs at expansion peak of each clade. Cluster analysis was established for both Spike and Orf1ab together (B) or individually (C and D). U34-sensitive codons are highlighted in yellow.
Figure 8.
(A) Compiled variations of tRNA modifications in tRNA subpopulation of SARS-CoV-2-infected VeroE6 cells relative to mock control cells (fold variation relative to non-infected (NI) VeroE6 cells). U34 modifications are shaded in yellow. (B) Fold change variation of tRNA U34 modifications in SARS-CoV-2-infected human Caco2 cells relative to NI cells. (C) Fold change of tRNA levels in SARS-CoV-2-infected human Caco2 cells. In all experiments, cells were infected at an MOI of 0.2.
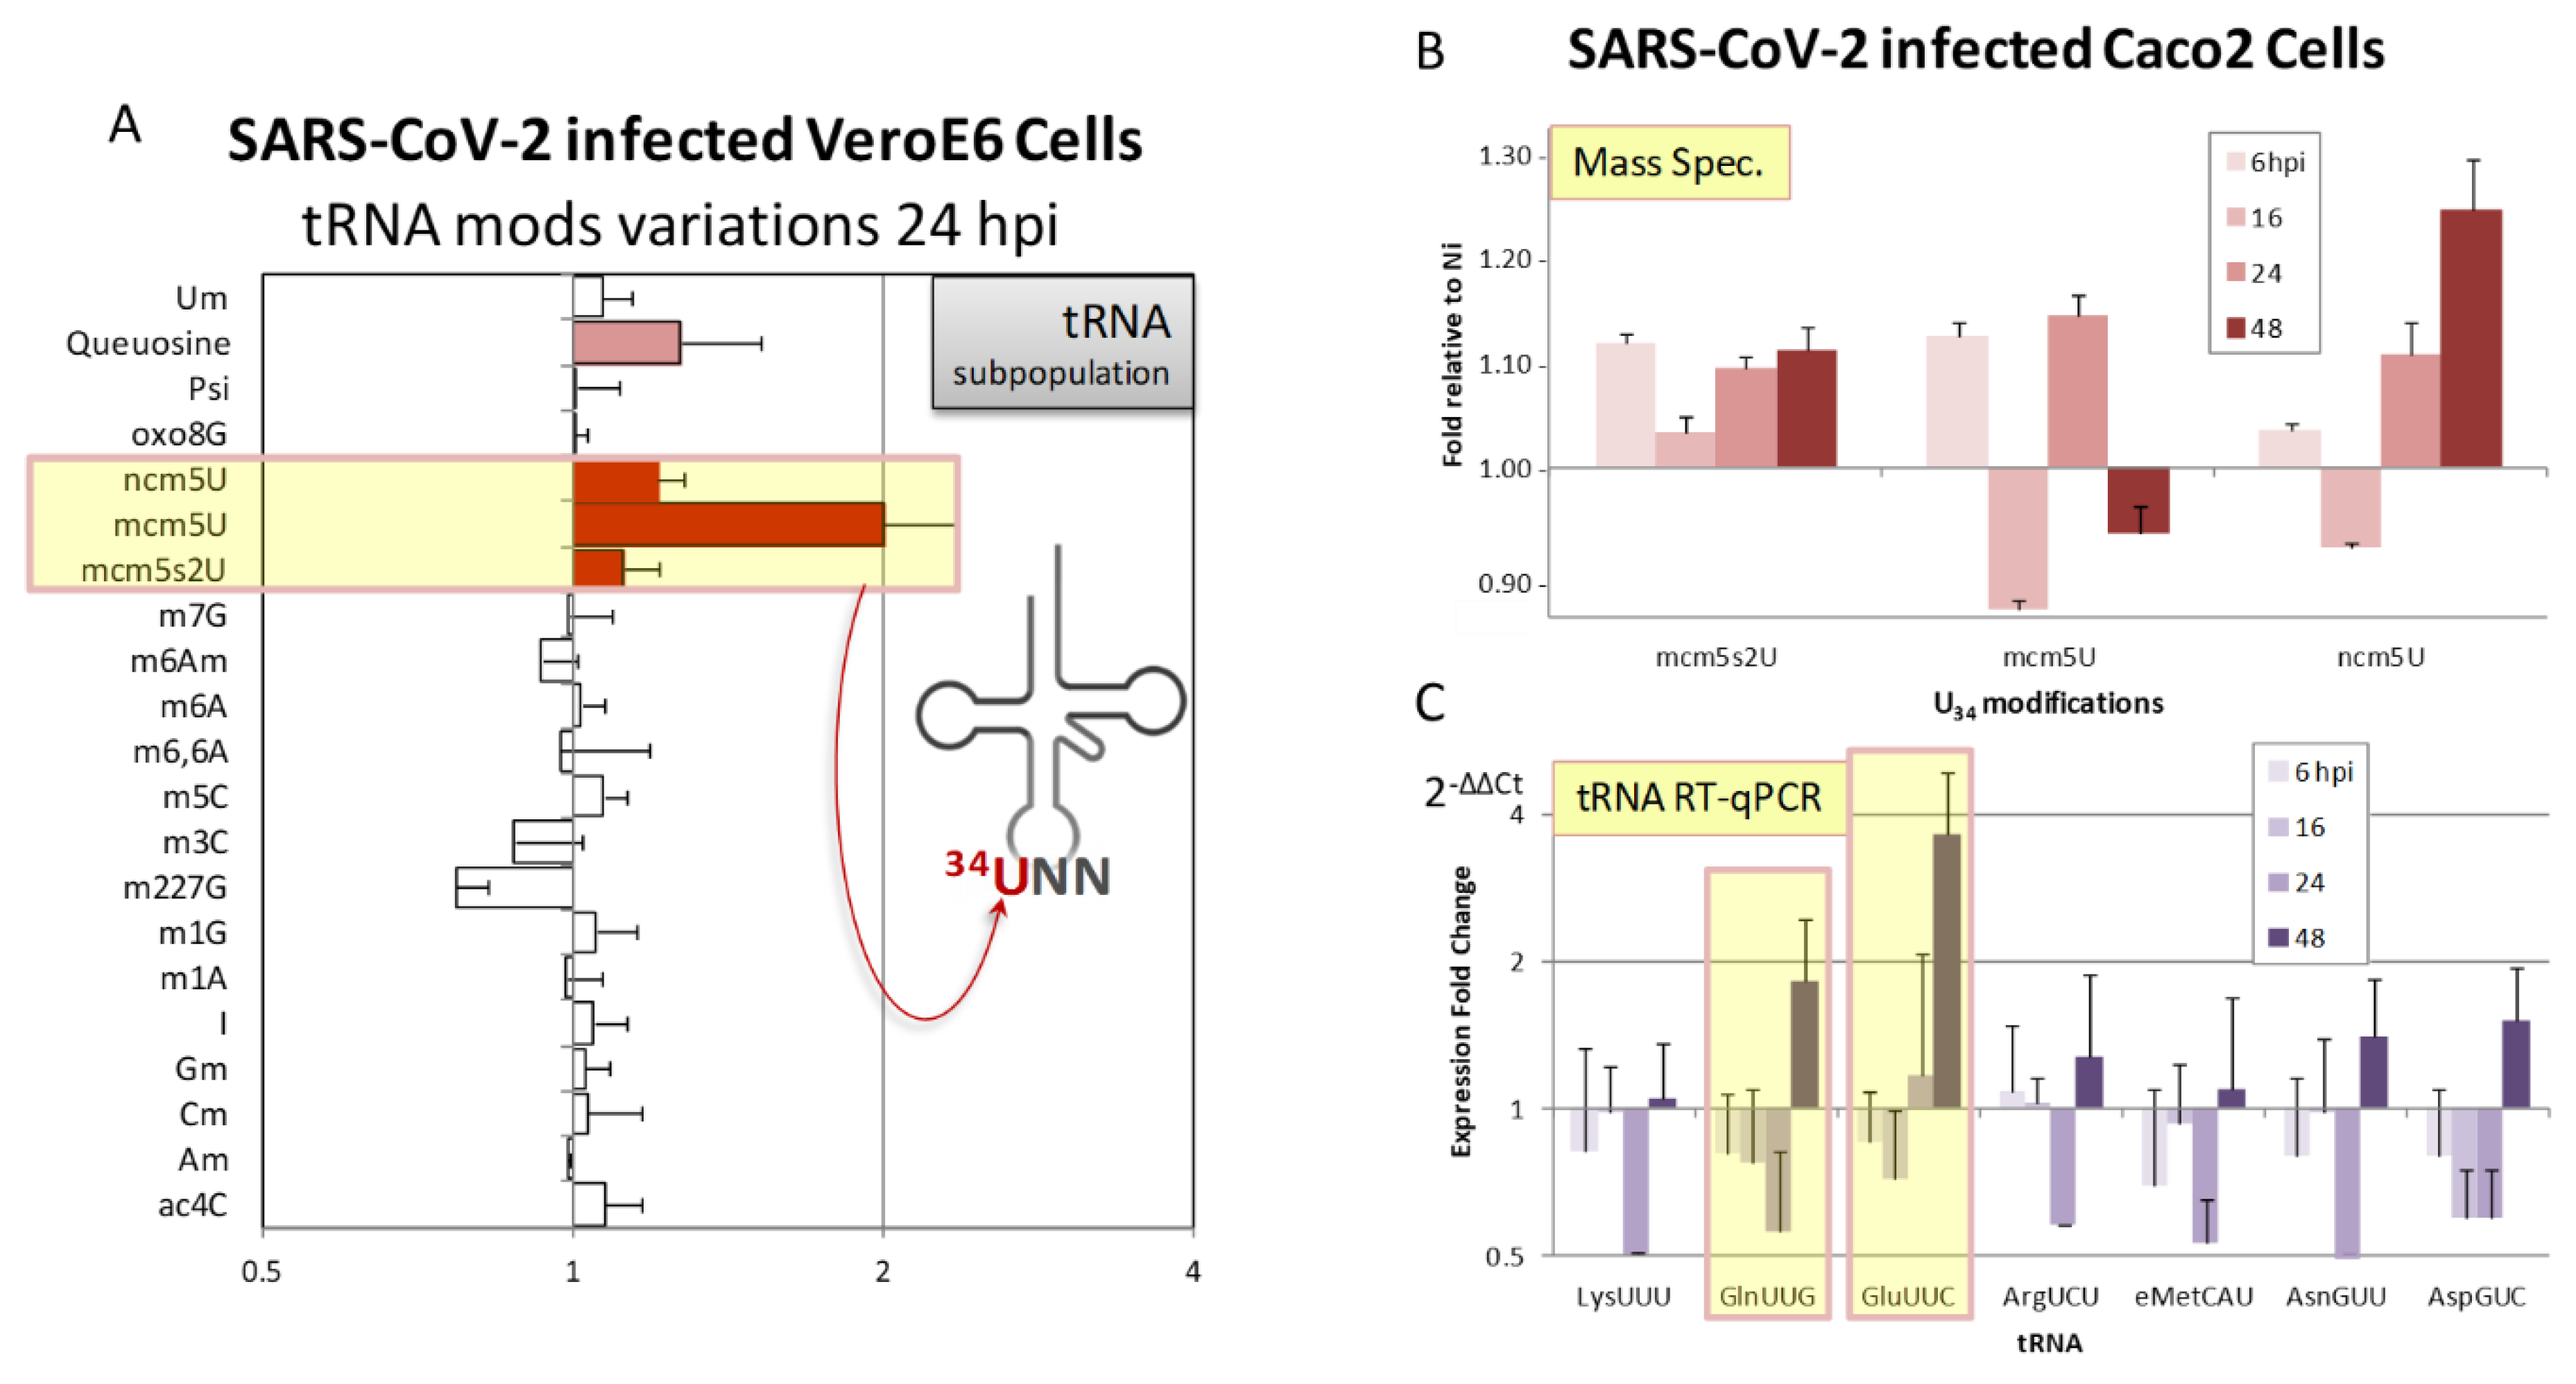
Figure 9.
(A) Primary human fibroblasts from Familial Dysautunomia (FD) patient were transduced by a lentivector expressing ACE2 receptor to allow SARS-CoV-2 entry. (B) tRNA U34 modification levels in wt or FD human primary fibroblasts determined by mass spectrometry analysis performed on tRNA subpopulation expressed in number of modifications per 104 unmodified ribonucleosides (rNs). (C) wt and FD cells previously transduced ACE2-expressing lentivector (VLPACE2, controled in A), were infected with increasing MOI of SARS-CoV-2 (0.05 to 0.2). SARS-CoV-2 infection levels were quantified by RT-qPCR, with GAPDH mRNA used as an internal control for normalization. Each experiment was performed in triplicate.
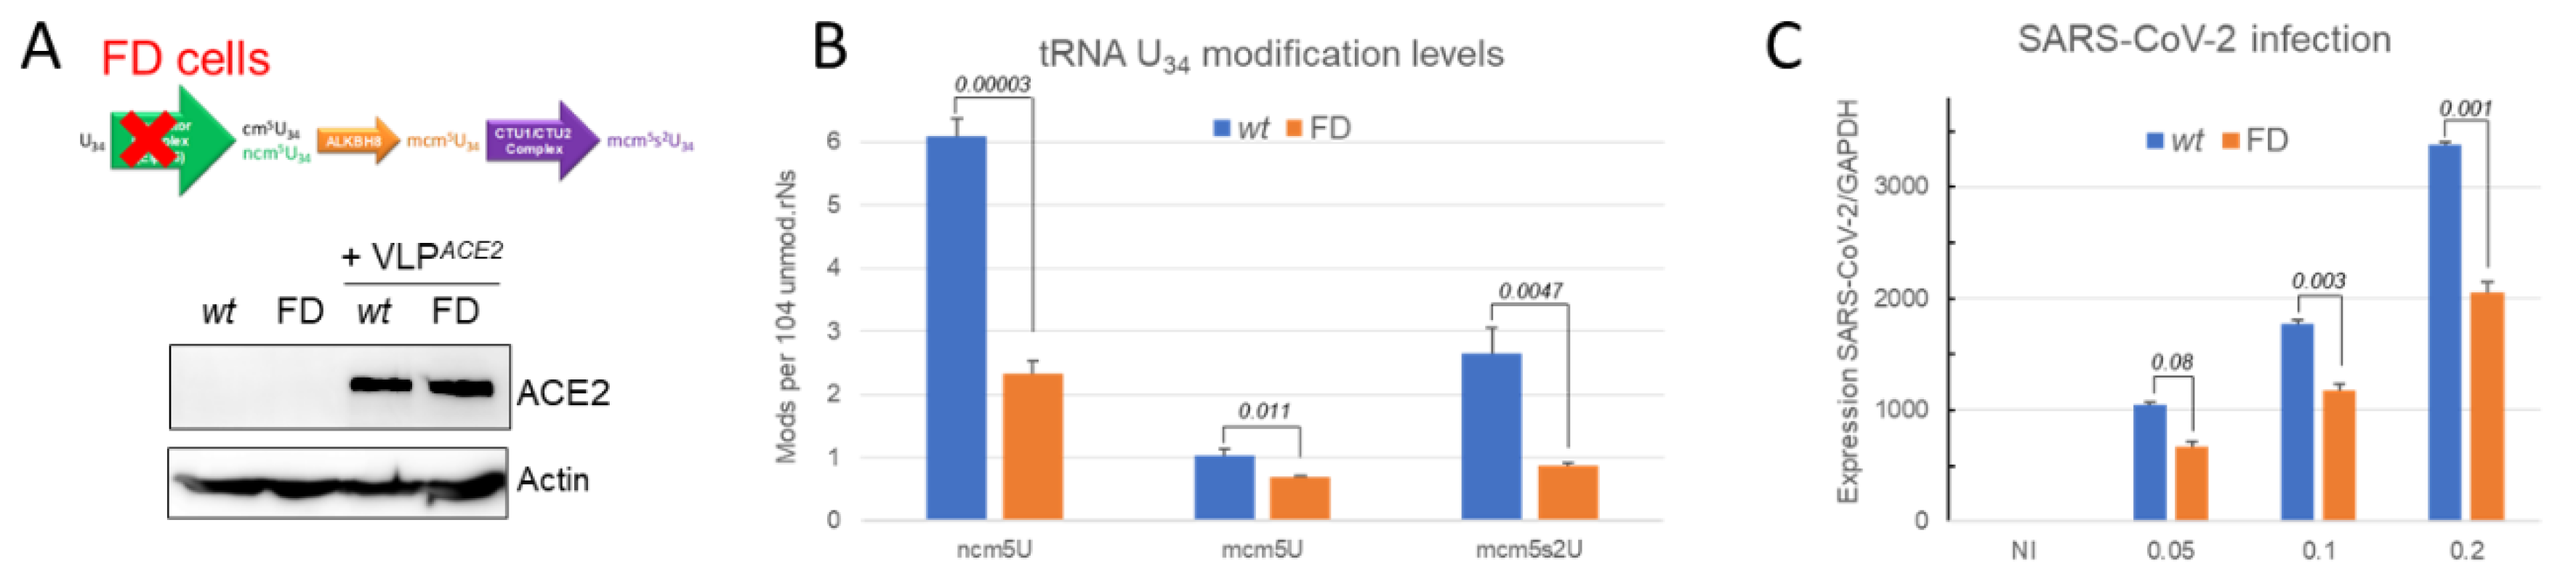
Disclaimer/Publisher’s Note: The statements, opinions and data contained in all publications are solely those of the individual author(s) and contributor(s) and not of MDPI and/or the editor(s). MDPI and/or the editor(s) disclaim responsibility for any injury to people or property resulting from any ideas, methods, instructions or products referred to in the content. |
© 2024 by the authors. Licensee MDPI, Basel, Switzerland. This article is an open access article distributed under the terms and conditions of the Creative Commons Attribution (CC BY) license (http://creativecommons.org/licenses/by/4.0/).
Copyright: This open access article is published under a Creative Commons CC BY 4.0 license, which permit the free download, distribution, and reuse, provided that the author and preprint are cited in any reuse.


