
Submitted:
25 September 2024
Posted:
26 September 2024
You are already at the latest version
Abstract
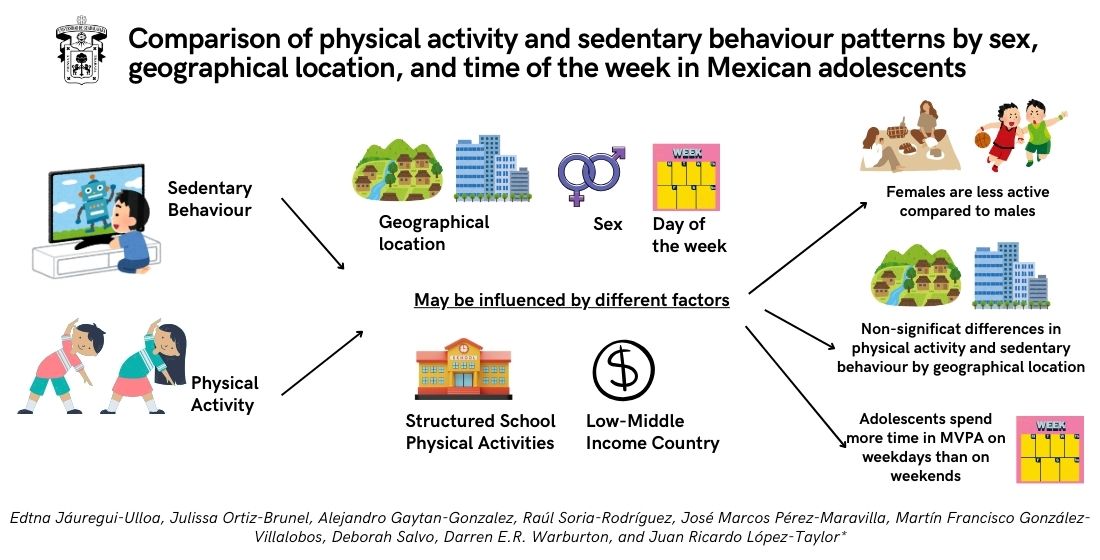
Excess sedentary behaviour (SB) and insufficient physical activity (PA) have been identified as risk factors for cardiometabolic diseases in adolescents, some factors may affect how much time they spent on these activities. This study sought to compare the SB and PA patterns as well as the compliance with PA recommendations by sex, geographical location, and time of the week in Mexican adolescents. In a cross-sectional design, we objectively assessed SB and PA in 106 adolescents (15 to 18 y) through waist-worn accelerometers for one week. The time spent in SB and in PA at different intensities was compared by sex, geographical location and time of the week with two-way and three-way repeated measures MANOVAs, while the compliance with physical activity recommendations (i.e. ≥60 min/day) was compared using chi-squared and McNemar tests. Male participants spent more time in moderate, vigorous, and moderate to vigorous PA than females both in the whole week and in weekdays (all p < 0.05). There was no significant difference in SB nor PA by geographical location (i.e., metropolitan vs non-metropolitan areas). Moreover, all participants spent more time on moderate, vigorous, and moderate to vigorous PA on weekdays than on weekends (p < 0.05). Compliance with international PA recommendations also showed a sex difference (males > females) and change between weekdays and weekends with no difference by geographical location. While geographical location does not seem to be a relevant factor, sex and time of the week appear to influence the SB and PA patterns in Mexican adolescents.
Keywords:
accelerometry
; low-medium income country
; movement behaviours
; youths
1. Introduction
Physical activity provides physiological and psychological benefits, while a sedentary lifestyle is associated with chronic disease [1,2]. Unfortunately, sedentary behaviour (SB) has recently become more common in younger individuals [3,4], and adolescents do not usually meet the World Health Organization (WHO) physical activity guidelines [1,5]. In Mexico, this phenomenon was depicted in the most recent Mexican National Health and Nutrition Survey, where 42.5% of Mexican adolescents (15-19 years) did not meet the international WHO recommendations for physical activity (PA), and almost 91% of adolescents did not meet SB (screen time) guidelines [6,7].
The SB and PA patterns in adolescents can be influenced by several factors like sex, geographical location, and time of the week [8,9,10,11]. For instance, studies report differences by sex, where males tend to be more active than females [12,13]. Consistent evidence also indicates that adolescents in urban areas tend to be more active than those living in rural settings [8,14,15,16,17,18]. Nonetheless, the results regarding SB in urban vs rural areas have been conflicting [14,15]. Regarding the time of the week, studies suggest that adolescents tend to be less active at the end of the week and weekends [14,15] compared to weekdays [14,19,20,21,22]. Similar results about these patterns had been reported in Mexico [6,23,24]. Although the results came from nationally representative samples, the information was collected from self-reported questionnaires ([25,26] and the study that objectively measured SB and PA through accelerometers, did not include a time of the week comparison ([23] thus, these patterns remain understudied in Mexican adolescents.
Since many of the behaviours acquired during adolescence tend to remain in adulthood [27,28,29,30,31], this period of life offers an opportunity for prevention and developing healthy lifestyle habits [32]. Thus, determining how much different factors affect the time adolescents spent in PA at different intensities and their SB, can help identifying areas for intervention in this population and developing public policies based on what factors may affect PA and SB the most, in terms of the time spent in PA and SB and whether adolescents meet the international recommendations for PA.
Therefore, the purpose of this study was threefold: 1) to compare the objectively measured time spent in SB and PA at different intensities by sex and geographic location; 2) to determine whether the SB and PA change between weekdays and weekends by sex and geographic location; and 3) to determine the proportion of compliance with the international recommendations of physical activity in high school students. We hypothesized that all three explanatory variables will affect SB and PA with higher scores in males, urban areas and weekdays in Mexican adolescents.
2. Materials and Methods
2.1. Study’s Design and Participants
This study used a cross-sectional design to identify patterns of physical activity and sedentary behaviours in adolescents at the high school level in the state of Jalisco, Mexico. We aimed to recruit 300 participants following a two-stage non-probabilistic sampling design. We first identified all the high schools that belonged to the University of Guadalajara public education system (n = 55); these high schools were located across the state of Jalisco, Mexico. The principal of each school was contacted, provided with a brief explanation of the study’s objective, and invited to include their high school in the study, of which only ten agreed to participate (18%). In the second stage, we collected and combined the lists of the students who were registered in their first high school year and were between 15 and 19 years old, from which we took a random sample (i.e., n = 300) including both sexes. The research team met with the selected students and their parents to explain the study’s objectives and methods further. After this initial visit, 101 students were not included (100 refused to participate and 1 used a wheelchair), leading to 199 students who agreed to participate and whose parents provided signed informed consent (66% of the expected sample); we did not include students with a physical disability or temporal injury that may affect their usual physical activity or sedentary behaviours. On the second visit, the participants had anthropometric measurements and answered socio-demographic questionnaires. On a third visit, participants started to wear the accelerometer. On the fourth visit, the research team collected the accelerometers from the participants after one week of use. The time between each visit was no longer than one week, except between the third and fourth visit, where more than one week was allowed depending on the logistics and because the data was already stored in the accelerometer. At the end of the study, 93 participants did not comply with the validation data for the accelerometer and were excluded from the analysis, leading to a sample of 106 students (35% of the expected sample) (Figure 1). The data collection took place in 2011.
2.2. Geographical Location
The high schools’ geographical location was categorized as Metropolitan Area (MA) if it was in the state’s capital or in one of the metropolitan municipalities around the state’s capital, and Non-Metropolitan Area (NMA) if it was located anywhere else in the state.
2.3. Anthropometric Measurements
Body height, mass, five skinfolds (triceps, biceps, subscapular, iliac crest, and calf), and two circumferences (waist and hip) were taken following the methodology of the International Society for Advancement of Kinanthropometry [33]. All anthropometrists were standardized in the technique, and they had a technical measurement error of ≤ 10% for skinfolds and ≤ 2% for body mass, height, and circumferences. Body height was measured in a standing position to the nearest 0.1 cm using a portable stadiometer SECA Model BM214. Body mass was measured (to the nearest 0.5 kg) with a digital scale (Tanita HD-313); both height and weight were taken with participants standing on bare feet and wearing their usual clothes but reducing extra weight from jackets, belts, and objects in their pockets. Skinfolds were measured with a Harpenden caliper with a 0.1 mm precision while circumferences were measured with a metallic tape (Lufkin) to the nearest 0.1 cm. The five skinfolds were summed up to get an overall indicator of fatness. The waist-to-hip ratio was calculated as waist circumference/hip circumference. The body mass index (BMI), its age-specific z-score, and categorization were calculated and determined by entering the participants' information into the WHO AnthroPlus software [34], which uses the World Health Organization references for growth for children and adolescents aged 5 to 19 years. The software uses the calculated z-score to categorize the BMI into one of the following categories: Thinness, ≤ −2 SD; Normal weight, > -2 SD but < 1 SD; Overweight, ≥ 1 SD but < 2 SD; and Obesity, ≥ 2 SD [35].
2.4. Physical Activity
The physical activity of adolescents was measured with the ActiGraph GT3X+® and GT3X+s accelerometers (ActiGraph LLC, FL, USA). The device was placed on the anterior superior thorn iliac and fastened with an elastic belt. The accelerometers were initialized at 30 Hz and were programmed to collect data for seven days (from Monday to Monday). Participants wore it over the right hip at all times except during water activities and night sleeping. Data in counts was downloaded at 60 s epoch. Compliance criteria for wearing accelerometers were based on the study of Cooper et al (2015) who used data from the International Children’s Accelerometry Database (ICAD) which considered a valid day if it recorded at least 500 minutes of wearing time (i.e., ≥ 8.3 hours), while non-wear time was defined as a period of at least 90 consecutive minutes with zero counts (Choi et al., 2011). Given the ICAD showed an average of 5.3 valid days, we decided to include the data of participants with at least four weekdays and one weekend day for the analysis. If a participant had five weekdays and two weekend valid days, we randomly selected four and one, respectively. We kept the number of valid days constant to compare the minutes spent during physical activity.
Once we had the dataset with the valid cases, we used the Evenson’s cut-off points to calculate the time spent at different physical activity intensities and in sedentary behaviour based on the counts per minute (CPM) (Evenson et al 2008). Sedentary behaviour (SB) was considered for 0 to 100 CPM, light-intensity physical activity (LPA) was considered for 101 to 2295 CPM, moderate-intensity physical activity (MPA) was considered for 2296 to 4011 CPM, vigorous-intensity physical activity (VPA) was considered for ≥ 4012 CPM, and moderate-to-vigorous intensity physical activity (MVPA) was considered for ≥ 2296 CPM. We chose these cut-off points to keep our analysis consistent with those used in the Cooper et al (2015) study using the ICAD.
With the calculated time spent in SB and PA at different intensities, we calculated their corresponding percentage of wearing time. To make weekdays and weekend days' time comparable, we calculated the average time spent in SB and PA on weekdays (i.e., time spent / 4), leading to the time spent on an average weekday.
The compliance with the international physical activity recommendations was analyzed in three ways. We first identified how many days the participants met the WHO physical activity recommendation of ≥ 60 minutes a day of MVPA [1] then we calculated how many participants reached ≥ 300 minutes of MVPA during the assessed week (i.e., 60 x 5, the recommendation in a cumulative way) and how many participants met the ≥ 60 minutes a day of MVPA by the time of the week based on their weekend day and average weekday.
2.5. Statistical Analyses
The continuous demographic variables were reported as mean ± standard deviation, and their distribution was analyzed using the Shapiro-Wilk test and by examining skewness and kurtosis. The variables that showed a normal distribution were compared by sex and geographical location with independent samples t-test, while the no normally distributed variables were compared by using the Mann-Whitney U-test. The categorical variables were reported as frequencies and percentages and were compared by sex and geographical location using the chi-squared test of independence.
We compared the time spent in SB and PA at different intensities in minutes and percentage of wearing time by sex and geographic location with a two-way MANOVA (2 x 2, sex by geographic location) for the whole week, and three-way repeated measures MANOVA (2 x 2 x 2, sex by geographic location by time of the week) for weekdays and weekend days using the following models:
Two-way MANOVA
Ey = b0 + b1 * S + b2 * G + b3 * S*G
Three-way repeated measures MANOVA
Ey = b0 + b1 * S + b2 * G + b3 * S*G + b4 * T + b5 * S*T + b6 * G*T + b7 * S*G*T
Where Ey is the estimated score from the MANOVA, b0 is the intercept, bi are the coefficients associated with each variable, S is the sex, G is the geographical location, T is the time of the week, and the remaining are the interaction terms for these variables. After running the MANOVAs, we carried out their corresponding factorial ANOVAs with the same design and models as the MANOVAs to identify where the differences were, if any.
The MANOVA results were reported with the Wilk’s lambda (λ) and F-score, the corresponding group comparisons were reported as least squares means ± standard error of the mean (SEM), whereas the weekends vs weekdays differences were reported as mean difference and 95% CI. We included omega squared (ω2) as the effect size statistic for group comparisons. The effect size was considered small, medium, or large for ω2 as 0.01, 0.06, and 0.14, respectively [36]. Any result below the small effect was considered negligible.
The compliance with physical activity recommendations on the average weekday was compared to the compliance on the weekend day with the McNemar test for paired proportions.
The results were deemed statistically significant at an alpha level of 0.05. All analyses were conducted using the SPSS Software (version 29.0.2.0 for Windows, IBM Corp., Armonk, NY, USA), and graphs were drawn in GraphPad Prism (version 10.1.2 for Windows, GraphPad Software, Boston, MA, USA).
3. Results
3.1. Demographics
Table 1 presents the participants’ characteristics by sex and geographic location. There was no statistically significant difference in age, geographical location, or hip circumference between males and females. However, male participants were statistically significantly heavier (both by body weight and BMI), taller, leaner (sum of five skinfolds), and had a larger waist circumference and waist-to-hip ratio than female participants. Similarly, male participants showed a lower proportion of normal BMI and higher on overweight than female participants. None of the demographics showed a statistically significant difference when compared by geographical location.
3.2. Physical Activity by Sex
Total wearing time and time spent on SB and PA at different intensities in minutes by sex are shown in Table 2. The MANOVA suggested that there was a statistically significant effect of sex (Wilk’s λ = 0.80, F(4, 99) = 6.2, p < 0.001) for the six variables in the whole week analysis. Non-statistically significant differences were observed regarding wearing time, SB, or LPA. However, male participants spent more time in MPA, VPA, and MVPA than females, with MPA showing a small to medium effect size, while VPA and MVPA showed a large effect size.
When weekdays and weekend days were compared, the MANOVA also suggested that there was a statistically significant effect of sex (Wilk’s λ = 0.76, F(4, 99) = 7.7, p < 0.001). Wearing time, SB, and LPA did not show statistically significant differences by sex on either time of the week. MPA (small to medium effect), VPA (large effect), and MVPA (medium to large effect) were significantly higher in males than females during weekdays, while MPA did not show a significant sex difference during weekend days; still, VPA (large effect) and MVPA (medium to large effect) were higher in males than females in weekend days.
Table 3 compares the relative time (% of total wearing time) spent in SB and PA at different intensities by sex. The MANOVA suggested a statistically significant effect of sex (Wilk’s λ = 0.80, F(3, 100) = 8.5, p < 0.001) for the whole week. Males spent less time in SB (small to medium effect), and more time in MPA (medium to large effect), VPA, and MVPA (both large effect) than Females, with no significant differences in LPA for the whole week analysis. The MANOVA also suggested a significant effect of sex for the time of the week analysis (Wilk’s λ = 0.76, F(3, 100) = 10.8, p < 0.001). The weekdays, but not the weekend days, showed the same pattern observed in the whole week (except that MVPA effect size was medium to large). In the weekend days, only VPA (large effect) and MVPA (medium to large effect) were statistically significantly different with higher scores in males than females.
3.3. Physical Activity by Geographical Location
Table 4 shows the time spent in SB and PA at different intensities in minutes while Table 5 shows the percentage of wearing time, both compared by geographical location. The MANOVA suggested that there was no statistically significant effect of geographic location for the time spent in SB and different PA intensities for the whole week either in minutes (Wilk’s λ = 0.93, F(4, 99) = 1.9, p = 0.119) nor percentage of wearing time (Wilk’s λ = 0.94, F(3, 100) = 2.0, p = 0.118). The same pattern was observed for the analysis by time of the week in minutes (Wilk’s λ = 0.94, F(4, 99) = 1.5, p = 0.203) and percentage of wearing time (Wilk’s λ = 0.96, F(3, 100) = 1.4, p = 0.249). Most comparisons showed a negligible effect and a few showed a small to medium effect.
3.4. Interaction between Sex and Geographical Location
Table 6 shows the comparisons where a statistically significant interaction was observed. Although the MANOVA did not detect a significant sex by geographical location interaction for the six variables for the whole week (Wilk’s λ = 0.94, F(4, 99) = 1.5, p = 0.208), the ANOVA analyses showed a significant interaction on MPA (p = 0.035) and MVPA (p = 0.041) where males spent more time in MPA and MVPA than females in MA but not NMA high schools. Similarly, males in MA schools spent more time in MPA and MVPA than males in NMA schools, while no significant difference was observed between MA and NMA in females. Neither MANOVA (Wilk’s λ = 0.96, F(3, 100) = 1.3, p = 0.287) nor the ANOVA analyses (lowest p = 0.071) showed a significant sex by geographical location interaction for the percentage of wearing time for the whole week variables.
No statistically significant interactions between sex and geographical location were observed for the minutes spent on weekdays vs weekends in the MANOVA (Wilk’s λ = 0.96, F(4, 99) = 1.1, p = 0.341) or the ANOVA analyses (lowest p = 0.056). However, we reported the interaction for MPA (p = 0.056) and MVPA (p = 0.059) because the p-values were close to the significance threshold. In this analysis, the minutes spent in MPA and MVPA on an average day showed the same pattern as the whole week. Also, as happened in the whole week analysis, neither the MANOVA (Wilk’s λ = 0.97, F(3, 100) = 0.9, p = 0.423) nor the ANOVA analyses (lowest p = 0.098) showed a statistically significant interaction between sex and geographical location for the percentage of wearing time in weekdays and weekend days.
3.5. Physical Activity by Time of the Week
The MANOVA suggested that there was a statistically significant change in SB and PA at different intensities between weekdays and weekend days when the variables were expressed in minutes (Wilk’s λ = 0.76, F(4, 99) = 8.0, p < 0.001) and percentage of wearing time (Wilk’s λ = 0.75, F(3, 100) = 11.1, p < 0.001), with no significant interaction with sex (minutes: Wilk’s λ = 0.99, F(4, 99) = 0.1, p = 0.968; percentage of wearing time: Wilk’s λ = 0.99, F(3, 100) = 0.1, p = 0.971), geographical location (minutes: Wilk’s λ = 0.98, F(4, 99) = 0.6, p = 0.692; percentage of wearing time: Wilk’s λ = 0.99, F(3, 100) = 0.3, p = 0.806), nor interaction between the three components (minutes: Wilk’s λ = 0.98, F(4, 99) = 0.5, p = 0.756; percentage of wearing time: Wilk’s λ = 0.98, F(3, 100) = 0.8, p = 0.495). Moreover, the ANOVA analyses showed no significant interaction (lowest p = 0.201). Since no significant interaction was observed, the changes were reported for the aggregated data, and no differentiation was made by sex or geographical location.
The total wearing time did not change from the average weekday vs the weekend day (mean change [95% CI], -2 min [-28, 24]; p = 0.900). The participants showed a non-significant change in SB (-1 min [-28, 26]; p = 0.946) and LPA (-16 min [-36, 3]; p = 0.097), but spent more time in MPA (10 min [6, 15]; p < 0.001), VPA (5 min [2, 8]; p < 0.001), and MVPA (16 min [9, 22]; p < 0.001) in the average weekday than the weekend day (Figure 2a). The corresponding numbers for the percentage of wearing time are the following: SB (0.1% [-2.1, 2.2]; p = 0.949), LPA (-1.8 % [-3.7, 0.1]; p = 0.066), MPA (1.1 % [0.7, 1.7]; p < 0.001), VPA (0.6 % [0.2, 0.9]; p < 0.001), and MVPA (1.7 % [1.0, 2.4]; p < 0.001) (Figure 2b).
3.6. Compliance with Physical Activity Recommendations
The data showed that 43 participants (40.6%) did not meet the 60 minutes/day recommendation on any day, 27 (25.5%) only in one day, 17 (16.0%) in two days, 8 (7.5%) in three days, 9 (8.5%) in four days, and only 2 (1.9%) met the recommendations on all the five assessed days. Due to the low frequency observed in compliance for two or more days, we combined these categories before carrying out a statistical analysis by sex and geographical location. Table 7 shows these combined categories, the cumulative weekly compliance, and the compliance by weekdays and weekends. All sex comparisons showed a statistically significant difference. Females showed a higher proportion of meeting the recommendation on zero days and a lower proportion of meeting the recommendation on two or more days than males. Similarly, females showed lower weekly compliance, weekdays and weekend days compliance than males. No significant differences were found for geographical location.
The compliance with the physical activity recommendation was higher on the average weekday (24.5%) than on the weekend day (12.3%) in the whole sample (difference [95% CI], 12.2% [3.3, 21.2]; p = 0.009). When the analysis was stratified by sex, males showed significantly higher compliance on the average weekday (39.2%) than on the weekend day (19.6%) (difference: 19.6% [5.2, 34.0]; p = 0.012), and females showed no statistically significant change from weekdays (10.9%) to weekends (5.5%) (difference: 5.4% [-5.1, 16.0]; p = 0.317). For the geographical location analysis, MA high schools showed a higher compliance on weekdays (29.2%) than weekends (15.4%) (difference: 13.8% [2.7, 25.0]; p = 0.020), while NMA high schools did not change from weekdays (17.1%) to weekends (7.3%) (difference: 9.8% [-5.1, 24.6]; p = 0.206).
4. Discussion
Studying the variability in physical activity intensity among adolescents during weekdays and weekends in MA and NMA settings can provide insights into the individual and environmental factors connected to adolescents' physical activity patterns. Our study's findings suggest that factors like sex and day of the week are linked to adolescents' physical activity patterns and sedentary behaviours in Mexican adolescents. For instance, males engaged in more MVPA than females and there is an overall trend to do more MVPA on weekdays than weekends. The time spent in MVPA on the weekends seems to be an area for intervention, as noted by our results and those reported by Corder et al. in the SPEEDY study, where MPA and VPA tend to decrease through the year on weekends but remained relatively stable on weekdays [37]. These conclusions hold significant implications for programs and practices, underscoring the necessity for targeted interventions to promote physical activity, especially among adolescent females and on weekends [31]. Similarly, our study expands on presenting objectively measured physical activity data in a region outside Canada, USA, and Europe to deepen the understanding of physical activity and sedentary behaviour patterns in diverse populations[38], which in turn may help developing strategies and physical activity related public policy tailored to the Mexican population.
It was observed that the geographic location, whether urban (MA) or rural (NMA), was not related to the average level of physical activity or sedentary behaviour determined by accelerometry among high school students. Similar findings were reported by the Mexican National Health and Nutrition Survey (ENSANUT), conducted in Mexico in 2016, which did not identify a statistically significant difference between children (n= 1,843) and adolescents (n= 1,440) in the urban vs rural areas [24]. On the other hand, the HELENA-MEX study shows that adolescents living in urban areas generally displayed higher sedentary behaviour and better fitness and fatness profiles than their rural peers. [23]. The different results found in these studies and ours could be attributable to different definitions of rural and urban areas. For example, the HELENA-MEX study included schools that seem more likely to be representative of rural areas than those in this study (i.e., non-metropolitan areas).
The specific geographic location (when considering the urban vs. rural context) of a school can impact an enrolled student’s average level of physical activity [8,39], for example, compared various public schools in the southwestern United States and observed a greater mean physical activity level in adolescents of moderately urban areas (8.17 min/d) vs. large urban areas (3.78 min/d). However, Franco Arevalo et al. observed an increase in a sedentary lifestyle during the transition from primary education to high school in Spanish students, with no significant difference between rural vs. urban communities [16]. The relationship between these patterns by geographic location can be attributed to several aspects, such as: a) the urban areas have better infrastructure, more accessible access to fitness and sports facilities and social conditions and multipurpose urban environments [40]; (b) physical activity is very often linked to social activities (school and work) in adolescents, which can explain why they are more active on weekdays [41], and c) PA of adolescents may depend on the influence of the family and the social and neighbourhood influences [42].
When calculating the relative activity time for the entire week (5-day period), data showed a higher mean SB in females and a higher mean MVPA in males. This coincides with a study which included ~200,000 Latin American children and adolescents and revealed that males are 8% more likely than females to perform physical activity [12]. The authors attributed this sex difference mainly to sociocultural factors, where boys are more encouraged to participate in higher-intensity activities [12]. In our study, we found that the decrease in MVPA from weekdays to weekends was similar by sex and geographical location (i.e., no interaction), which contrasted with the results by Kallio et al. who reported that the declines in MVPA and increases in sedentary time were greater in boys than girls during the weekend days [43]. These sex differences can be explained by Rosenfeld [13], who reported that males are generally more active than females in almost every age category. They reported that males are motivated to exercise to prevent chronic degenerative diseases and to be more competitive. In contrast, females commonly perform physical activity for emotional support and a sense of well-being.
The distribution of physical activity levels during the week may be essential to determine adolescents' movement patterns. Most adolescents prefer to be active during the week rather than on weekends [41]. This study found that adolescents were more active on weekdays than weekends, which may be influenced by socioeconomic factors, as previous studies reported in adults in the same context [40]. Studies in Mexico show that people are more active and use more active transportation because of work activities [40,44,45,46]. Another factor that can help explain our results that was not explored in this study is that adolescents are more active on weekdays because they have more social interactions with peers and more social activities influenced by the day of the week. Studies found that on Fridays, adolescents become less active [47].
Another explanation is that adolescents who attend school and get more academic duties assigned may have less time to be active outside the school [48], for example, during weekends. This is aligned with our results, where adolescents of both genders were more inactive during weekends than on weekdays. Nevertheless, we did not explore the duties load variable.
In this study, we have some limitations. Firstly, the sample included likely does not represent most adolescent Mexican students, mainly because the sampling happened in one state and the selection was not probabilistic. Similarly, the final sample for the analysis was considerably smaller than expected at the beginning (i.e., 35% of the initial sampling). Secondly, the geographical location was categorized according to the definitions of the educational system (i.e., whether it was located in a metropolitan area or not), and we used this as a proxy for urban and rural areas. However, the non-metropolitan areas might include characteristics of urban settings, which might explain the lack of differences by geographical location. Further studies should explore this possibility. Thus, different terms used to refer to rural and urban settings can affect the comparison of adolescents' levels of movement behaviour patterns [8,18,37]. For example, rural regions can be defined as areas with less than 10,000 population [14], and urban as more than 10,000 population. Rural areas may be micropolitan and rural [8], and urban areas as large, medium, and small [17]. Consequently, exploring the geo-statistics will be very helpful because the income in the communities studied could affect physical activity levels in Mexican adolescents beyond those presented definitions. Thirdly, we focused the analysis on three explanatory variables (i.e., sex, geographical location, and time of the week), which leaves room for residual confounding and alternative explanations to the observed differences or lack of difference. Thus, further research is warranted to analyze a larger sample size and evaluate other factors like socioeconomic and psychosocial variables. Finally, we focused our analysis to the participants current physical activity and compliance with international recommendations; however, this approach could be misleading since people may still benefit from small increases in physical activity and yet not reaching the 60 minutes/day threshold ([49]. We used this approach to keep the results in line with the current metrics to diagnose the effectiveness of physical activity public interventions[50] However, promotion of physical activity should aim to increase the time spent at different intensities and not only to comply with a rigid threshold. Similarly, the intervention in one aspect of physical activity (e.g., increasing MVPA) may have beneficial effects by affecting another (e.g., reducing the sedentary behaviour), this override phenomenon has been reported in children and adolescents [51] and deserves further investigation in the Mexican population.
Previous studies highlight the effects of socioeconomic conditions in adulthood that originated from childhood due to a lack of education and material resources [52]. At the same time, neighbourhood resources, such as exercise facilities, sports fields, and parks, motivate teens to perform more MVPA outside school hours [9]. Finally, it should be considered that social support and self-motivation can also be decisive factors to consider for promoting and continuing physical activity from childhood [53,54], and can be more determinant than the location area where the adolescents live.
5. Conclusions
In this study, we found that geographical location was not a relevant factor in observing differences in the time spent on SB or PA at any intensity. However, sex and time of the week seem more relevant in observing differences in PA of moderate, vigorous, and moderate to vigorous intensities, but not SB nor light PA intensity. Moreover, sex and time of the week consistently affected compliance with PA recommendations in Mexican adolescents. These results suggest that further interventions should aim to promote physical activity in adolescents, given the low compliance with international recommendations with a focus on female teenagers where compliance is even lower. Finally, the time of the week should also be considered as less compliance is observed during weekends.
Author Contributions
Conceptualization, E.J.U. and D.S.; methodology, E.J.U, D.S., and J.R.L.T.; formal analysis, A.G.G, and E.J.U.; investigation and resources, J.O.B, R.S.R, J.M.P.M, and M.F.G.V.; data curation, A.G.G., J.M.P.M., and J.O.B.; writing—original draft preparation, E.J.U., and A.G.G.; writing—review and editing, R.S.R., J.M.P.M., M.F.G.V., D.S., D.E.R.W., and J.R.L.T.; funding acquisition, J.R.L.T. All authors have read and agreed to the published version of the manuscript.
Funding
This research was funded by the Global Health Research Initiative Canada (IDRC) award with the project Unravelling the Emerging Childhood Obesity Epidemic in Mexico: The Nutrition Transition and the Double-edged Sword. Teasdale Corti Grant # 103460-044.
Institutional Review Board Statement
The study was conducted in accordance with the Declaration of Helsinki, and approved by the Ethics Committee of the University Centre of Health Sciences of the University of Guadalajara (Form approval CI-20511).
Informed Consent Statement
Written informed consent was obtained from all participants involved in this study; if the participant was <18 years old, their verbal assent was also obtained before any assessment, even after getting their parents/guardians' informed consent.
Data Availability Statement
The data used for this article is available from the corresponding author upon reasonable request.
Acknowledgments
We acknowledge the staff of the Institute of Applied Sciences for Physical Activity and Sports (ICAAFYD) of the University Health Sciences Centre of the University of Guadalajara for their support in the form of instruments, staff, administration, logistics, transportation, and technical support.
Conflicts of Interest
The authors declare no conflicts of interest.
References
- Bull, F. C.; Al-Ansari, S. S.; Biddle, S.; Borodulin, K.; Buman, M. P.; Cardon, G.; Carty, C.; Chaput, J. P.; Chastin, S.; Chou, R.; et al. World Health Organization 2020 Guidelines on Physical Activity and Sedentary Behaviour. Br J Sports Med 2020, 54, 1451–1462. [Google Scholar] [CrossRef] [PubMed]
- Wang, K.; Li, Y.; Liu, H.; Zhang, T.; Luo, J. Can Physical Activity Counteract the Negative Effects of Sedentary Behavior on the Physical and Mental Health of Children and Adolescents? A Narrative Review. Front Public Health 2024, 12. [Google Scholar] [CrossRef] [PubMed]
- Hills, A. P.; Dengel, D. R.; Lubans, D. R. Supporting Public Health Priorities: Recommendations for Physical Education and Physical Activity Promotion in Schools. Prog Cardiovasc Dis 2015, 57, 368–374. [Google Scholar] [CrossRef] [PubMed]
- Oliveira, R. G. de; Guedes, D. P. Physical Activity, Sedentary Behavior, Cardiorespiratory Fitness and Metabolic Syndrome in Adolescents: Systematic Review and Meta-Analysis of Observational Evidence. PLoS One 2016, 11, e0168503. [Google Scholar] [CrossRef]
- Guthold, R.; Stevens, G. A.; Riley, L. M.; Bull, F. C. Global Trends in Insufficient Physical Activity among Adolescents: A Pooled Analysis of 298 Population-Based Surveys with 1·6 Million Participants. Lancet Child Adolesc Health 2020, 4, 23–35. [Google Scholar] [CrossRef]
- Medina, C.; Jáuregui, A.; Campos-Nonato, I.; Barquera, S. Prevalencia y Tendencias de Actividad Física En Niños y Adolescentes: Resultados de Ensanut 2012 y Ensanut MC 2016. Salud Publica Mex 2018, 60, may–jun). [Google Scholar] [CrossRef]
- Medina, C.; Jáuregui, A.; Hernández, C.; González, C.; Olvera, A. G.; Blas, N.; Campos, I.; Barquera, S. Prevalence of Movement Behaviors in Mexico. Salud Publica Mex 2023, 65. [Google Scholar] [CrossRef]
- Euler, R.; Jimenez, E. Y.; Sanders, S.; Kuhlemeier, A.; Van Horn, M. L.; Cohen, D.; Gonzales-Pacheco, D.; Kong, A. S. Rural–Urban Differences in Baseline Dietary Intake and Physical Activity Levels of Adolescents. Prev Chronic Dis 2019, 16, 180200. [Google Scholar] [CrossRef]
- Qiu, N.; Gao, X.; Zhang, X.; Fu, J.; Wang, Y.; Li, R. Associations between Psychosocial Variables, Availability of Physical Activity Resources in Neighborhood Environment, and Out-of-School Physical Activity among Chinese Adolescents. Int J Environ Res Public Health 2021, 18, 6643. [Google Scholar] [CrossRef]
- Fromel, K.; Kudlacek, M.; Groffik, D.; Svozil, Z.; Simunek, A.; Garbaciak, W. Promoting Healthy Lifestyle and Well-Being in Adolescents through Outdoor Physical Activity. Int J Environ Res Public Health 2017, 14. [Google Scholar] [CrossRef]
- Shao, T.; Zhou, X. Correlates of Physical Activity Habits in Adolescents: A Systematic Review. Front Physiol 2023, 14, 1131195. [Google Scholar] [CrossRef] [PubMed]
- Brazo-Sayavera, J.; Aubert, S.; Barnes, J. D.; González, S. A.; Tremblay, M. S. Gender Differences in Physical Activity and Sedentary Behavior: Results from over 200,000 Latin-American Children and Adolescents. PLoS One 2021, 16. [Google Scholar] [CrossRef] [PubMed]
- Rosenfeld, C. S. Sex-Dependent Differences in Voluntary Physical Activity. J Neurosci Res 2017, 95, (1–2). [Google Scholar] [CrossRef]
- Comte, M.; Hobin, E.; Majumdar, S. R.; Plotnikoff, R. C.; Ball, G. D. C.; McGavock, J. Patterns of Weekday and Weekend Physical Activity in Youth in 2 Canadian Provinces. Applied Physiology, Nutrition and Metabolism 2013, 38, 115–119. [Google Scholar] [CrossRef] [PubMed]
- Corder, K.; Schiff, A.; Kesten, J. M.; Van Sluijs, E. M. F. Development of a Universal Approach to Increase Physical Activity among Adolescents: The GoActive Intervention. BMJ Open 2015, 5. [Google Scholar] [CrossRef] [PubMed]
- Franco Arevalo D, Feu S, de la C. S. E. Diferencias Entre El Medio Rural y Urbano En El Nivel de Actividad Física En La Transición de La Educación Primaria a La Educación Secundaria. Rev Esp Salud Publica 2020, 29, e202005026. [Google Scholar]
- White, B.; García Bengoechea, E.; Spence, J. C.; Coppell, K. J.; Mandic, S. Comparison of Physical Activity Patterns across Large, Medium and Small Urban Areas and Rural Settings in the Otago Region, New Zealand. 2021, 134, 1534.
- Zenic, N.; Taiar, R.; Gilic, B.; Blazevic, M.; Maric, D.; Pojskic, H.; Sekulic, D. Levels and Changes of Physical Activity in Adolescents during the COVID-19 Pandemic: Contextualizing Urban vs. Rural Living Environment. Applied Sciences 2020, 10, 1–14. [Google Scholar] [CrossRef]
- Aibar, A.; Bois, J. E.; Zaragoza Casterad, J.; Generelo, E.; Paillard, T.; Fairclough, S. Weekday and Weekend Physical Activity Patterns of French and Spanish Adolescents. Eur J Sport Sci 2014, 14, 500–509. [Google Scholar] [CrossRef]
- Lätt, E.; Mäestu, J.; Jürimäe, J. Associations of Accumulated Time in Bouts of Sedentary Behavior and Moderate-to-Vigorous Physical Activity With Cardiometabolic Health in 10- to 13-Year-Old Boys. J Phys Act Health 2018, 1–8. [Google Scholar] [CrossRef]
- Treuth, M. S.; Catellier, D. J.; Schmitz, K. H.; Pate, R. R.; Elder, J. P.; McMurray, R. G.; Blew, R. M.; Yang, S.; Webber, L. Weekend and Weekday Patterns of Physical Activity in Overweight and Normal-Weight Adolescent Girls. Obesity 2007, 15, 1782–1788. [Google Scholar] [CrossRef]
- Yang, C. H.; Wang, S.; Wang, W. L.; Belcher, B. R.; Dunton, G. F. Day-Level Associations of Physical Activity and Sedentary Time in Mother–Child Dyads across Three Years: A Multi-Wave Longitudinal Study Using Accelerometers. J Behav Med 2022, 45, 702–715. [Google Scholar] [CrossRef] [PubMed]
- Rivera-Ochoa, M.; Brazo-Sayavera, J.; Vizmanos-Lamotte, B.; Mañas, A.; Ricardo López-Taylor, J.; Gonzalez-Gross, M.; Guadalupe-Grau, A. Health-Related Factors in Rural and Urban Mexican Adolescents: The HELENA-MEX Study. 2020. [CrossRef]
- Shamah-Levy, T. T.; Cuevas-Nasu, L.; Gaona-Pineda, E. B.; Gómez-Acosta, L. M.; Morales-Ruán, M. del C.; Hernández-ávila, M.; Rivera-Dommarco, J. Á. Overweight and Obesity in Children and Adolescents, 2016 Halfway National Health and Nutrition Survey Update. Salud Publica Mex 2018, 60, 244–253. [Google Scholar] [CrossRef] [PubMed]
- Medina, C.; Jáuregui, A. Prevalencia y Tendencias de Actividad Física En Niños y Adolescentes : Resultados de Ensanut 2012 y Ensanut MC 2016. 2018, 60, 263–271.
- Shamah-Levy, T.; Cuevas-Nasu, L.; Rivera-Dommarco, J.; Hernández-Ávila, M. Encuesta Nacional de Salud y Nutrición de Medio Camino 2016.; 2016.
- Barker, A. R.; Gracia-Marco, L.; Ruiz, J. R.; Castillo, M. J.; Aparicio-Ugarriza, R.; González-Gross, M.; Kafatos, A.; Androutsos, O.; Polito, A.; Molnar, D.; et al. Physical Activity, Sedentary Time, TV Viewing, Physical Fitness and Cardiovascular Disease Risk in Adolescents: The HELENA Study. Int J Cardiol 2018, 254, 303–309. [Google Scholar] [CrossRef] [PubMed]
- Ekelund, U.; Luan, J.; Sherar, L. B.; Esliger, D. W.; Griew, P.; Cooper, A. Moderate to Vigorous Physical Activity and Sedentary Time and Cardiometabolic Risk Factors in Children and Adolescents. JAMA - Journal of the American Medical Association 2012, 307, 704–712. [Google Scholar] [CrossRef] [PubMed]
- Gordon-larsen, P.; Nelson, M. C.; Popkin, B. M. Longitudinal Physical Activity and Sedentary Behavior Trends Adolescence to Adulthood. Am J Prev Med 2004, 27, 277–283. [Google Scholar] [CrossRef]
- Kontostoli, E.; Jones, A. P.; Pearson, N.; Foley, L.; Biddle, S. J. H.; Atkin, A. J. The Association of Contemporary Screen Behaviours with Physical Activity, Sedentary Behaviour and Sleep in Adolescents: A Cross-Sectional Analysis of the Millennium Cohort Study. Int J Behav Med 2023, 30, 122–132. [Google Scholar] [CrossRef]
- van Sluijs, E. M. F.; Ekelund, U.; Crochemore-Silva, I.; Guthold, R.; Ha, A.; Lubans, D.; Oyeyemi, A. L.; Ding, D.; Katzmarzyk, P. T. Physical Activity Behaviours in Adolescence: Current Evidence and Opportunities for Intervention. Lancet 2021, 398, 429–442. [Google Scholar] [CrossRef]
- van Sluijs, E. M. F.; Ekelund, U.; Crochemore-Silva, I.; Guthold, R.; Ha, A.; Lubans, D.; Oyeyemi, A. L.; Ding, D.; Katzmarzyk, P. T. Physical Activity Behaviours in Adolescence: Current Evidence and Opportunities for Intervention. The Lancet 2021, 398, 429–442. [Google Scholar] [CrossRef]
- Norton, K.; Olds, T.; Mazza, J. C. Antropométrica : Un Libro de Referencia Sobre Mediciones Corporales Humanas Para La Educación En Deportes y Salud, 2nd ed.; Biosystem, 2000.
- World Health Organization. In WHO Anthro Survey Analyser, 1st ed.; World Health Organization, 2019.
- World Health Organization. WHO Child Growth Standards: Length/Height-for-Age, Weight-for-Age, Weight-for-Length, Weight-for-Height and Body Mass Index-for-Age: Methods and Development, 2006.
- Volker, M. A. Reporting Effect Size Estimates in School Psychology Research. Psychol Sch 2006, 43, 653–672. [Google Scholar] [CrossRef]
- Corder, K.; Craggs, C.; Jones, A. P.; Ekelund, U.; Griffin, S. J.; van Sluijs, E. M. Predictors of Change Differ for Moderate and Vigorous Intensity Physical Activity and for Weekdays and Weekends: A Longitudinal Analysis. International Journal of Behavioral Nutrition and Physical Activity 2013, 10, 69. [Google Scholar] [CrossRef]
- Aubert, S.; Barnes, J. D.; Tremblay, M. S. Evaluation of the Process and Outcomes of the Global Matrix 3.0 of Physical Activity Grades for Children and Youth. J Exerc Sci Fit 2020, 18, 80–88. [Google Scholar] [CrossRef] [PubMed]
- Pfledderer, C. D.; Burns, R. D.; Byun, W.; Carson, R. L.; Welk, G. J.; Brusseau, T. A. School-based Physical Activity Interventions in Rural and Urban/Suburban Communities: A Systematic Review and Meta-analysis. Obesity Reviews 2021, 22. [Google Scholar] [CrossRef] [PubMed]
- Salvo, D.; Torres, C.; Villa, U.; Rivera, J. A.; Sarmiento, O. L.; Reis, R. S.; Pratt, M. Accelerometer-Based Physical Activity Levels among Mexican Adults and Their Relation with Sociodemographic Characteristics and BMI: A Cross-Sectional Study. International Journal of Behavioral Nutrition and Physical Activity 2015, 12, 79. [Google Scholar] [CrossRef] [PubMed]
- Brazendale, K.; Beets, M. W.; Armstrong, B.; Weaver, R. G.; Hunt, E. T.; Pate, R. R.; Brusseau, T. A.; Bohnert, A. M.; Olds, T.; Tassitano, R. M.; et al. Children’s Moderate-to-Vigorous Physical Activity on Weekdays versus Weekend Days: A Multi-Country Analysis. International Journal of Behavioral Nutrition and Physical Activity 2021, 18, 1–13. [Google Scholar] [CrossRef] [PubMed]
- Garcia, J. M.; Sirard, J. R.; Deutsch, N. L.; Weltman, A. The Influence of Friends and Psychosocial Factors on Physical Activity and Screen Time Behavior in Adolescents: A Mixed-Methods Analysis. J Behav Med 2016, 39, 610–623. [Google Scholar] [CrossRef]
- Kallio, J.; Hakonen, H.; Syväoja, H.; Kulmala, J.; Kankaanpää, A.; Ekelund, U.; Tammelin, T. Changes in Physical Activity and Sedentary Time during Adolescence: Gender Differences during Weekdays and Weekend Days. Scand J Med Sci Sports 2020, 30, 1265–1275. [Google Scholar] [CrossRef]
- Adlakha, D.; Salvo, D.; Hipp, A.; Brownson, R. C.; Pratt, M. Is Physical Activity in Middle-Income Countries Driven by Necessity or Choice? Exploring the Roles of Motor-Vehicle Ownership and Socioeconomic Status on Transport-Based Physical Activity in Cuernavaca, Mexico and Chennai, India. J Phys Act Health 2018, 15, S113–S113. [Google Scholar]
- Sallis, J.; Cerin, E.; Kerr, J.; Adams, M.; Sugiyama, T.; Christiansen, L.; Schipperijn, J.; Davey, R.; Salvo, D.; Frank, L.; et al. Built Environment, Physical Activity, and Obesity: Findings from the International Physical Activity and Environment Network (IPEN) Adult Study. Annu Rev Public Health 2020, 41, 119–139. [Google Scholar] [CrossRef]
- Ramirez-Varela, A.; Salvo, D.; Pratt, M.; Milton, K.; Siefken, K.; Bauman, A.; Kohl, H. W.; Lee, I. M.; Heath, G.; Foster, C.; et al. Worldwide Use of the First Set of Physical Activity Country Cards: The Global Observatory for Physical Activity - GoPA! International Journal of Behavioral Nutrition and Physical Activity 2018, 15, 1–14. [Google Scholar] [CrossRef]
- Groffik, D.; Fromel, K.; Badura, P. Composition of Weekly Physical Activity in Adolescents by Level of Physical Activity. BMC Public Health 2020, 20, 1–9. [Google Scholar] [CrossRef]
- Parrish, A.-M.; Okely, A. D.; Salmon, J.; Trost, S.; Hammersley, M.; Murdoch, A. Making ‘Being Less Sedentary Feel Normal’ –Investigating Ways to Reduce Adolescent Sedentary Behaviour at School: A Qualitative Study. International Journal of Behavioral Nutrition and Physical Activity 2023, 20, 85. [Google Scholar] [CrossRef] [PubMed]
- Warburton, D. E. R.; Bredin, S. S. D. Health Benefits of Physical Activity: A Systematic Review of Current Systematic Reviews. Curr Opin Cardiol 2017, 32, 541–556. [Google Scholar] [CrossRef] [PubMed]
- Galaviz, K. I.; Argumedo García, G.; Gaytán González, A.; González-Casanova, I.; Francisco González Villalobos, M.; Jáuregui, A.; Jáuregui Ulloa, E.; Medina, C.; Selene Pacheco Miranda, Y.; Pérez Rodríguez, M.; et al. · 2 ·.
- Feng J; Huang WY; Zheng C; Jiao J; Khan A; Nisar M; Wong SH. The Overflow Effects of Movement Behaviour Change Interventions for Children and Adolescents: A Systematic Review and Meta-Analysis of Randomised Controlled Trials. Sports Med, 2024.
- Makinen, T.; Kestila, L.; Borodulin, K.; Martelin, T.; Rahkonen, O.; Prattala, R. Effects of Childhood Socio-Economic Conditions on Educational Differences in Leisure-Time Physical Activity. The European Journal of Public Health 2010, 20, 346–353. [Google Scholar] [CrossRef] [PubMed]
- Teixeira, P. J.; Carraça, E. V; Markland, D.; Silva, M. N.; Ryan, R. M. Exercise, Physical Activity, and Self-Determination Theory: A Systematic Review. International Journal of Behavioral Nutrition and Physical Activity 2012, 9, 78. [Google Scholar] [CrossRef]
- Haidar, A.; Ranjit, N.; Archer, N.; Hoelscher, D. M. Parental and Peer Social Support Is Associated with Healthier Physical Activity Behaviors in Adolescents: A Cross-Sectional Analysis of Texas School Physical Activity and Nutrition (TX SPAN) Data. BMC Public Health 2019, 19, 640. [Google Scholar] [CrossRef]
Figure 1.
Flowchart depicting the selection process for the schools and participants. The dotted line indicates that the sample of 300 students was taken from the 10 high schools that agreed to participate.
Figure 1.
Flowchart depicting the selection process for the schools and participants. The dotted line indicates that the sample of 300 students was taken from the 10 high schools that agreed to participate.
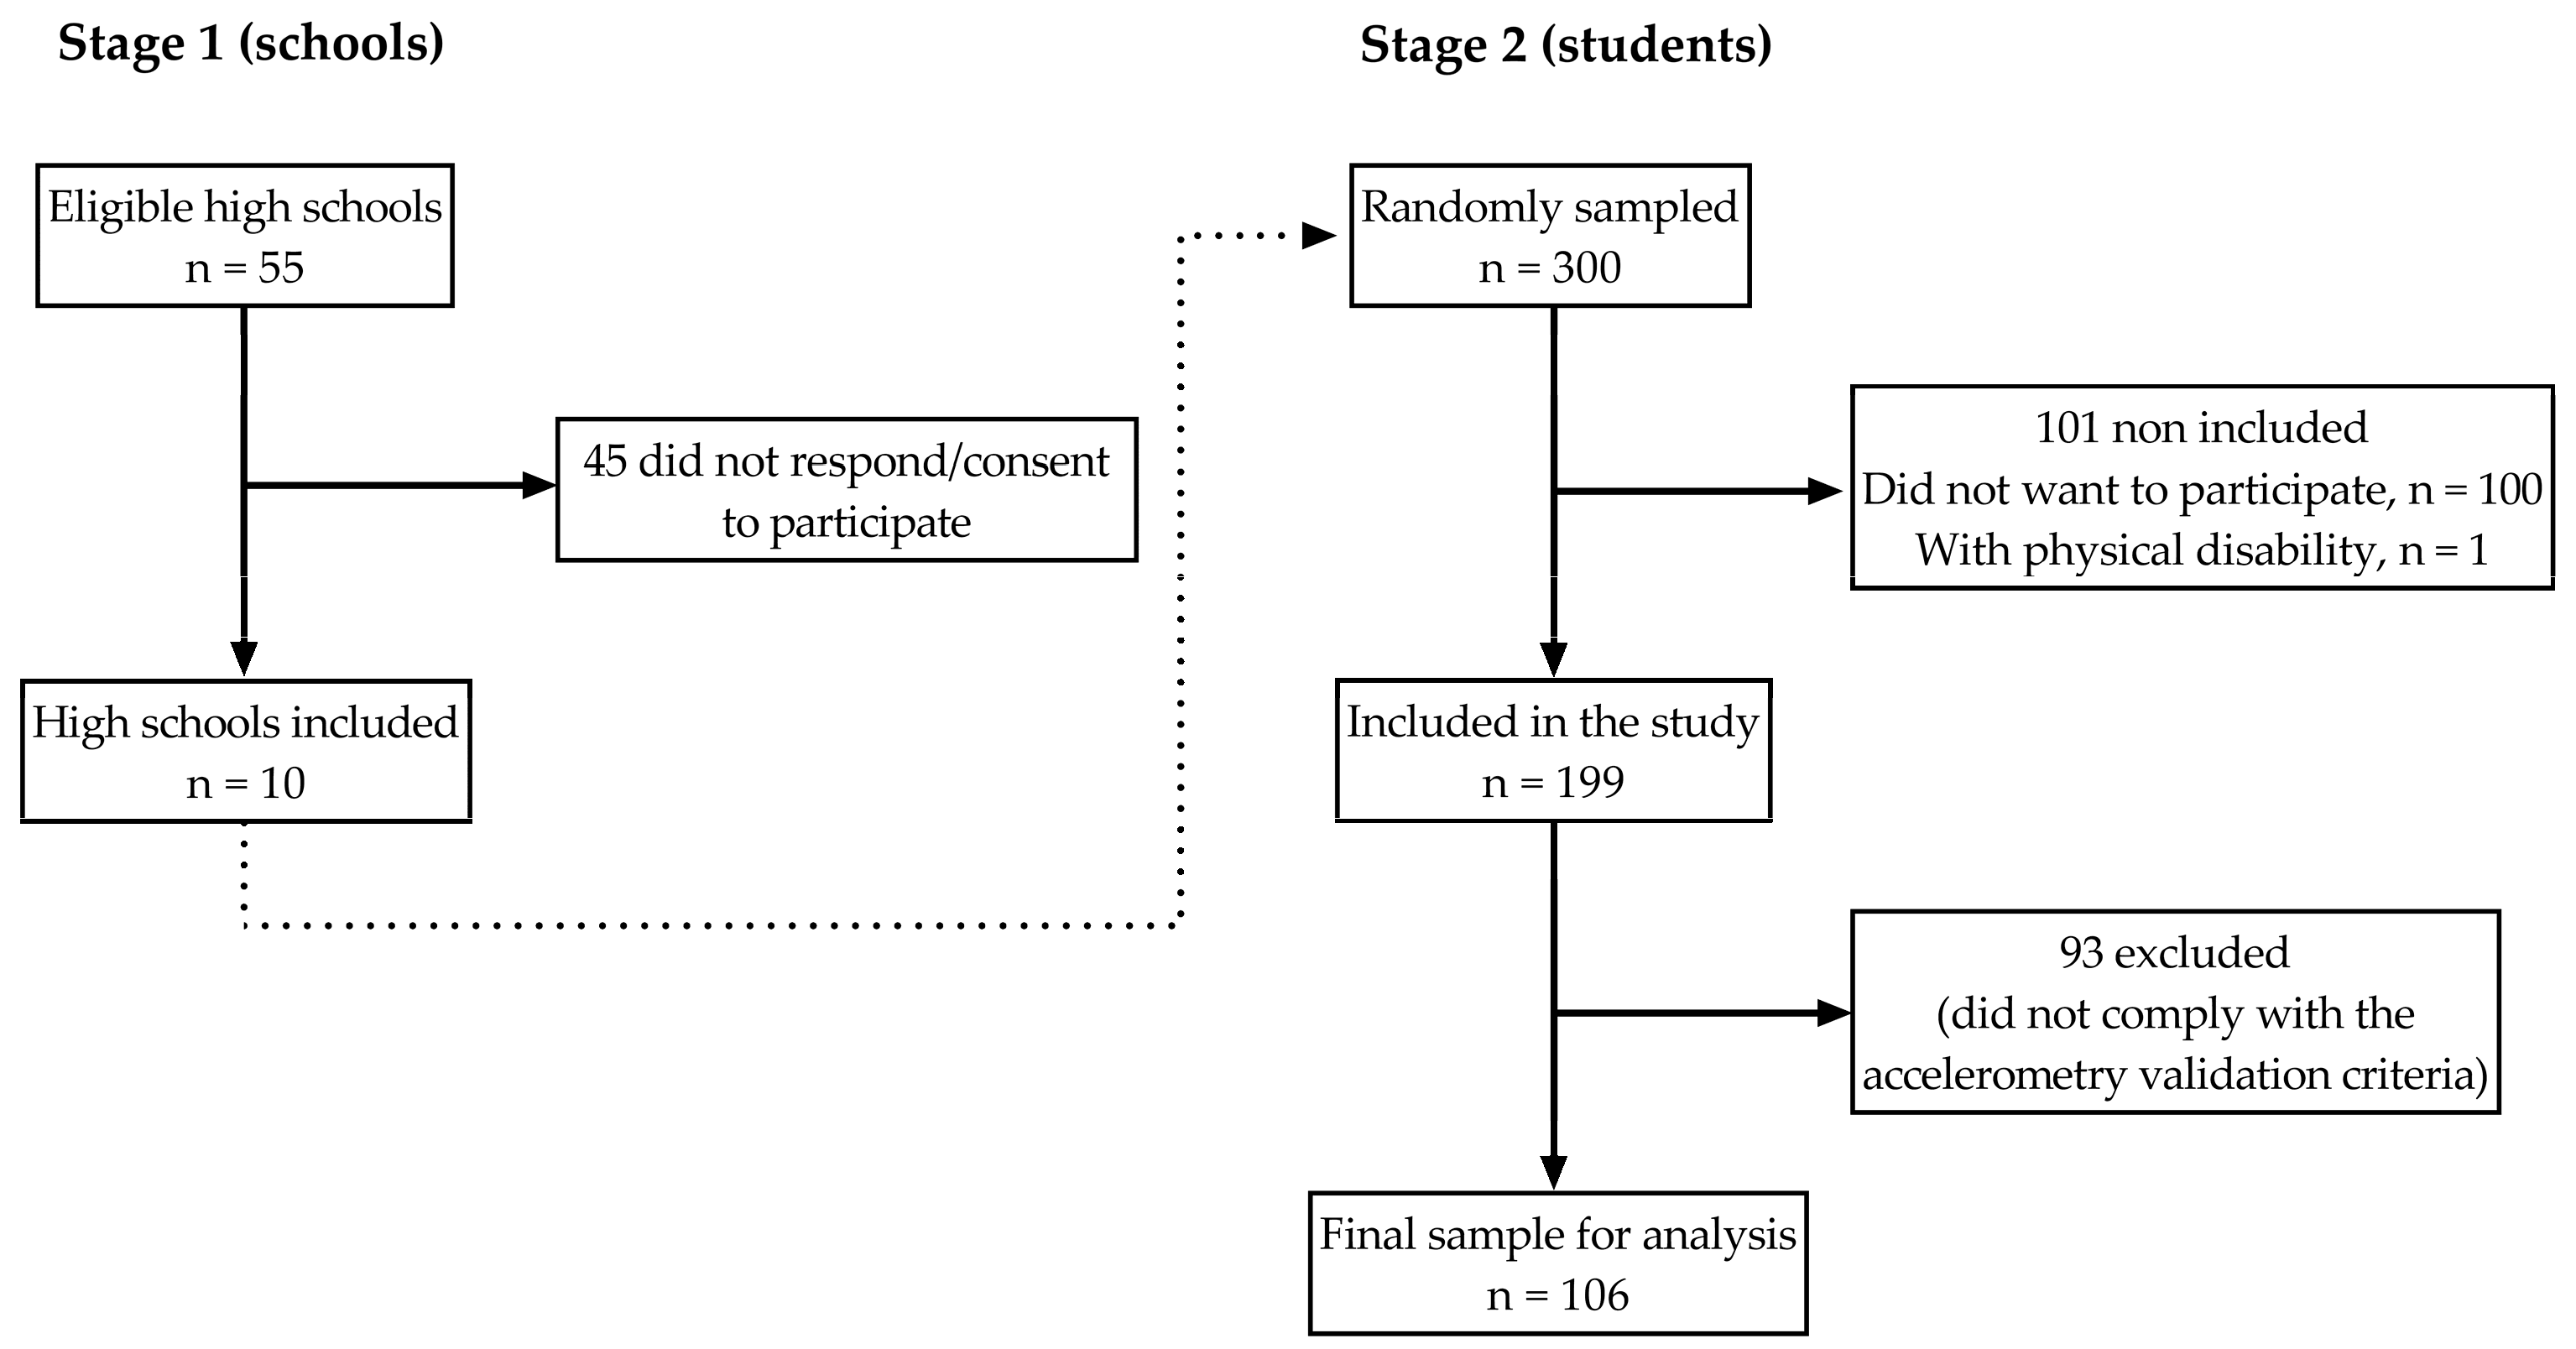
Figure 2.
Changes in time spent in sedentary behaviour and physical activity at different intensities in minutes (a) and percentage of wearing time (b) for the aggregated data. The differences were calculated as weekday – weekend day (i.e., a positive score indicates more time spent during weekdays). The circles represent the mean change, while the whiskers represent the 95% confidence interval for that change. * Denotes a statistically significant change in weekday vs weekend day (p < 0.001). LPA: Light-intensity physical activity; MPA: Moderate-intensity physical activity: MVPA: Moderate-to-vigorous intensity physical activity: SB: Sedentary behaviour: VPA: Vigorous-intensity physical activity.
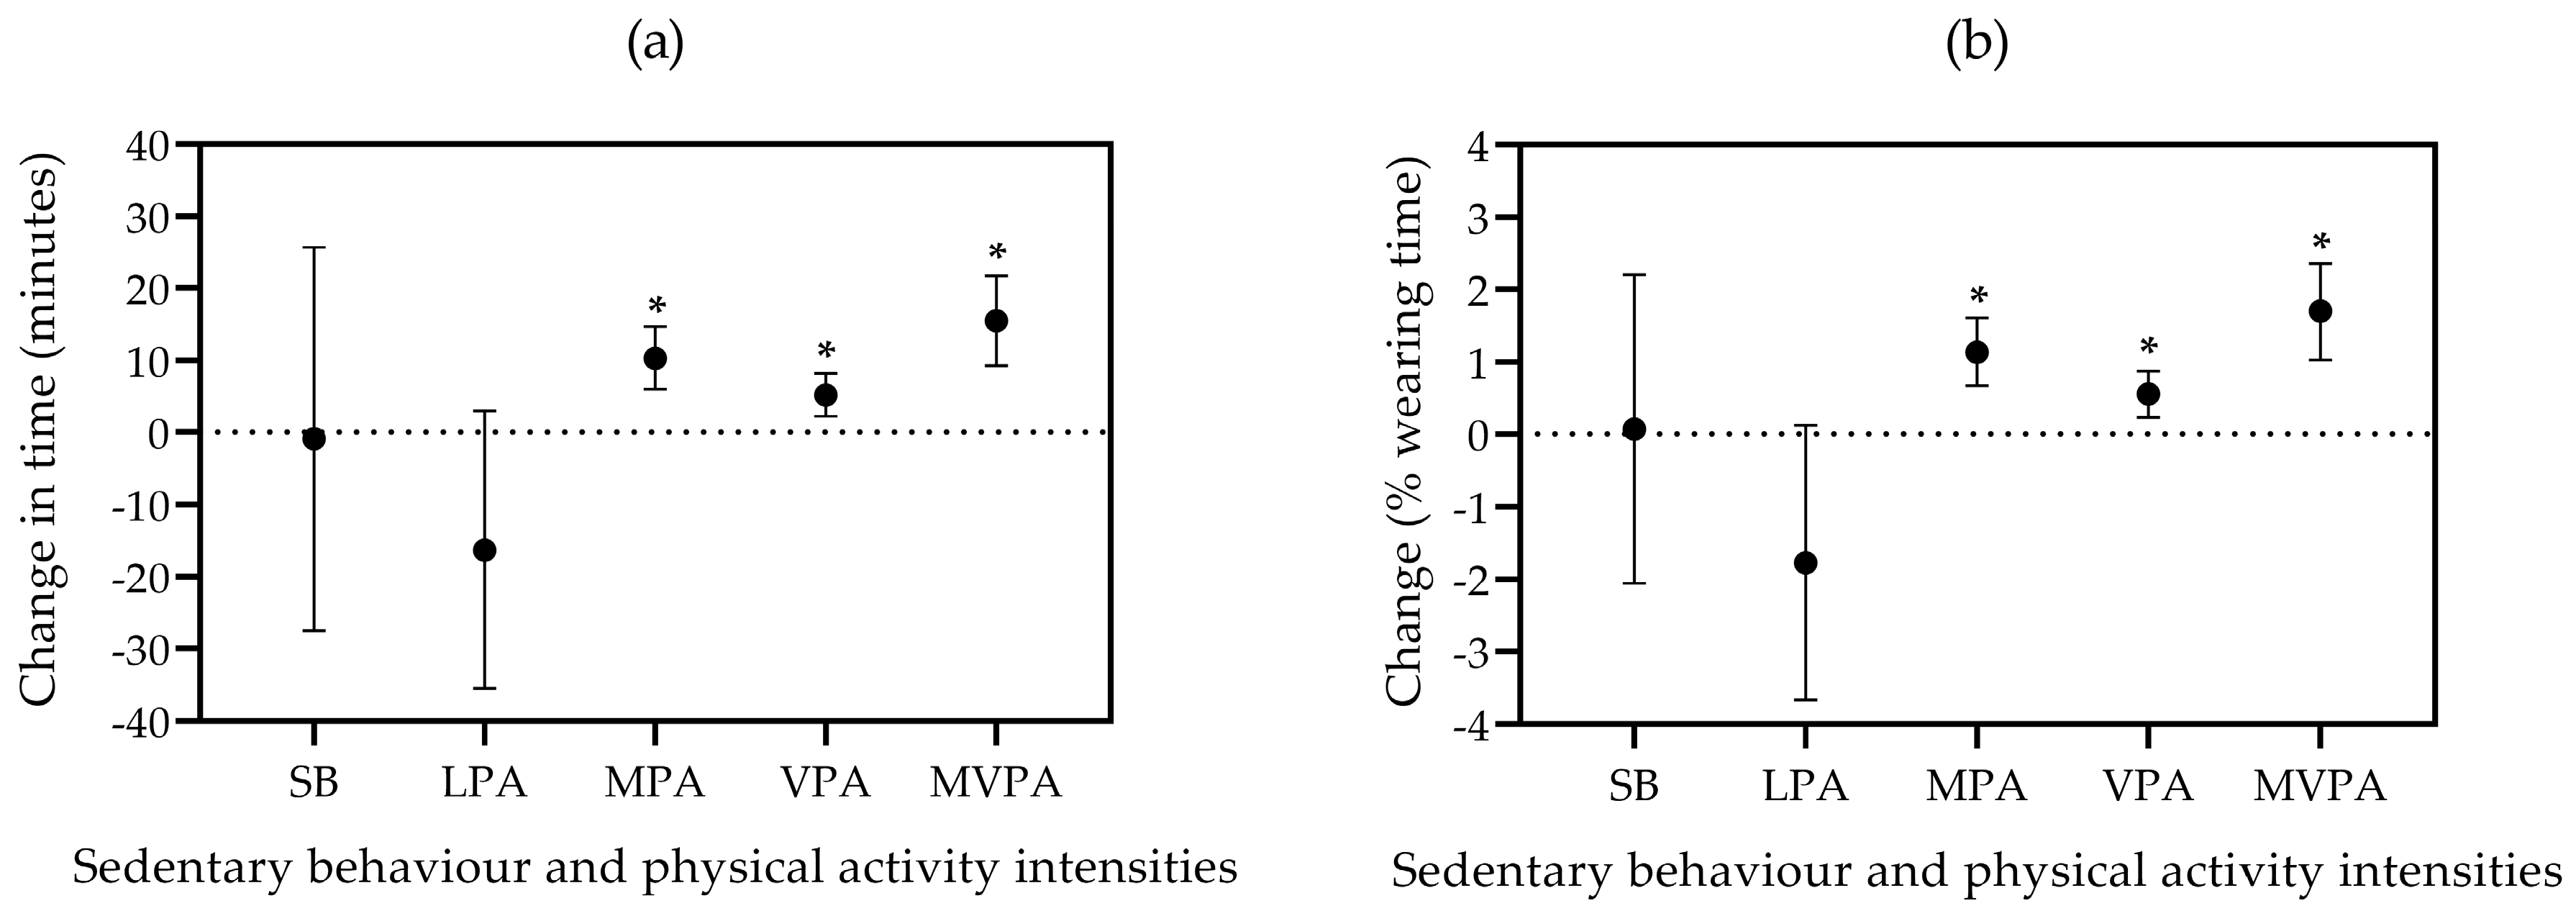

Table 1.
Participants’ characteristics divided by sex and geographical location.
| Sex | |||||
| Males (n = 51) | Females (n = 55) | p-value e | |||
| Age, y a | 15.7 ± 0.8 | 15.6 ± 0.7 | 0.403 f | ||
| Geographical location b MA NMA |
33 (64.7) 18 (35.3) |
32 (58.2) 23 (41.8) |
0.552 g |
||
| Height, cm | 172.9 ± 5.8 | 160.2 ± 6.2 | < 0.001 | ||
| Weight, kg | 70.6 ± 14.0 | 56.7 ± 12.9 | < 0.001 f | ||
| BMI, kg/cm2 | 23.5 ± 4.3 | 22.0 ± 4.5 | 0.031 f | ||
| BMI categories Thinness Normal Overweight Obese |
3 (5.9) 25 (49.0) 12 (23.5) 11 (21.6) |
1 (1.8) 43 (78.2) * 5 (9.1) * 6 (10.9) |
0.019 g |
||
| Sum of five skinfolds, mm c | 71.6 ± 31.8 | 91.1 ± 32.3 | 0.002 f | ||
| Waist circumference, cm | 79.5 ± 9.6 | 70.6 ± 9.4 | < 0.001 | ||
| Hip circumference, cm | 96.2 ± 8.0 | 94.3 ± 9.1 | 0.093 f | ||
| Waist-to-hip ratio | 0.82 ± 0.05 | 0.75 ± 0.04 | < 0.001 | ||
| Geographical location | |||||
| MA (n = 65) | NMA (n = 41) | p-value | |||
| Age, y | 15.3 ± 0.7 | 15.6 ± 0.7 | 0.827 f | ||
| Sex Male Female |
33 (50.8) 32 (49.2) |
18 (43.9) 23 (56.1) |
0.552 g |
||
| Height, cm | 166.6 ± 8.4 | 165.9 ± 9.3 | 0.719 | ||
| Weight, kg | 63.6 ± 14.2 | 63.1 ± 16.6 | 0.878 | ||
| BMI, kg/cm2 | 22.8 ± 4.0 | 22.8 ± 5.1 | 0.982 | ||
| BMI categories Thinness Normal Overweight Obese |
1 (1.5) 43 (66.2) 12 (18.5) 9 (13.8) |
3 (7.3) 25 (61.0) 5 (12.2) 8 (19.5) |
0.327 g |
||
| Sum of five skinfolds, mm d | 80.0 ± 29.8 | 84.2 ± 38.4 | 0.538 | ||
| Waist circumference, cm | 75.3 ± 10.0 | 74.3 ± 11.3 | 0.648 | ||
| Hip circumference, cm | 95.2 ± 8.2 | 95.2 ± 9.3 | 0.977 | ||
| Waist-to-hip ratio | 0.79 ± 0.06 | 0.78 ± 0.6 | 0.367 | ||
| a Reported as mean ± standard deviation. b Reported as frequency count (percentage). c Males n = 49, Females n = 52. d MA n = 61, NMA n = 40. e Calculated from independent samples t-test unless otherwise stated. f Calculated from Mann-Whitney U-test. g Calculated from chi-squared test of independence. * Denotes statistically significant differences by sex within the specified category (p < 0.05). BMI: Body mass index; MA: Metropolitan area; NMA: Non-metropolitan area. | |||||
Table 2.
Wearing time, time spent in sedentary behaviour and in different intensities of physical activity for the whole week, weekdays, and weekends compared by sex (n = 106).
Table 2.
Wearing time, time spent in sedentary behaviour and in different intensities of physical activity for the whole week, weekdays, and weekends compared by sex (n = 106).
| Males (n = 51) | Females (n = 55) | Difference d | p-value | Effect size g | |
| Whole week | |||||
| Wearing time, min a | 4610 ± 53 | 4616 ± 50 | -6 ± 73 | 0.933 e | 0.000 |
| SB, min | 2745 ± 58 | 2884 ± 54 | -140 ± 79 | 0.080 | 0.002 |
| LPA, min | 1600 ± 43 | 1554 ± 40 | 46 ± 58 | 0.433 | 0.000 |
| MPA, min | 174 ± 9 | 145 ± 9 | 28 ± 13 | 0.027 | 0.037 |
| VPA, min | 91 ± 9 | 32 ± 8 | 59 ± 12 | < 0.001 | 0.181 |
| MVPA, min | 265 ± 14 | 177 ± 13 | 88 ± 20 | < 0.001 | 0.153 |
| Weekdays b | |||||
| Wearing time, min | 922 ± 11 | 922 ± 10 | 0 ± 15 | 0.988 f | 0.000 |
| SB, min | 548 ± 12 | 577 ± 11 | -29 ± 16 | 0.070 | 0.022 |
| LPA, min | 318 ± 8 | 307 ± 8 | 11 ± 11 | 0.322 | 0.000 |
| MPA, min | 37 ± 2 | 31 ± 2 | 6 ± 3 | 0.050 | 0.027 |
| VPA, min | 19 ± 2 | 7 ± 2 | 12 ± 3 | < 0.001 | 0.146 |
| MVPA, min | 56 ± 3 | 38 ± 3 | 18 ± 4 | < 0.001 | 0.123 |
| Weekend days c | |||||
| Wearing time, min | 921 ± 20 | 926 ± 18 | -5 ± 27 | 0.848 f | 0.000 |
| SB, min | 553 ± 21 | 575 ± 19 | -22 ± 28 | 0.432 | 0.000 |
| LPA, min | 328 ± 16 | 328 ± 15 | 0 ± 22 | 0.979 | 0.000 |
| MPA, min | 27 ± 3 | 21 ± 3 | 6 ± 4 | 0.146 | 0.011 |
| VPA, min | 14 ± 2 | 3 ± 2 | 11 ± 2 | < 0.001 | 0.165 |
| MVPA, min | 40 ± 4 | 24 ± 4 | 17 ± 5 | 0.002 | 0.078 |
| a Reported as least squares mean ± standard error of the mean; b Time spent in one average weekday; c Time spent in one weekend day; d Some discrepancies are expected because of rounding. e Calculated from a two-way ANOVA for the effect of sex adjusted for geographical location for the whole week variables; f Calculated from a three-way ANOVA for the effect of sex adjusted for geographical location and moment of the week for the weekday and weekernd day variables; g Calculated as omega squared. LPA: Low-intensity physical activity; MPA: Moderate-intensity physical activity; MVPA: Moderate-to-vigorous intensity physical activity; SB; Sedentary behaviour; VPA: Vigorous-intensity physical activity. | |||||
Table 3.
Percentage of wearing time spent in sedentary behaviour and in different intensities of physical activity for the whole week, weekdays, and weekends compared by sex (n = 106).
Table 3.
Percentage of wearing time spent in sedentary behaviour and in different intensities of physical activity for the whole week, weekdays, and weekends compared by sex (n = 106).
| Males (n = 51) | Females (n = 55) | Difference d | p-value | Effect size g | |
| Whole week | |||||
| SB, % a | 59.4 ± 1.0 | 62.5 ± 1.0 | -3.1 ± 1.4 | 0.030 e | 0.036 |
| LPA, % | 34.8 ± 0.9 | 33.6 ± 0.8 | 1.2 ± 1.2 | 0.337 | 0.000 |
| MPA, % | 3.8 ± 0.2 | 3.1 ± 0.2 | 0.6 ± 0.3 | 0.023 | 0.040 |
| VPA, % | 2.0 ± 0.2 | 0.7 ± 0.2 | 1.3 ± 0.3 | < 0.001 | 0.187 |
| MVPA, % | 5.8 ± 0.3 | 3.8 ± 0.3 | 1.9 ± 0.4 | < 0.001 | 0.159 |
| Weekdays b | |||||
| SB, % | 59.3 ± 1.0 | 62.6 ± 1.0 | -3.2 ± 1.4 | 0.022 f | 0.041 |
| LPA, % | 34.6 ± 0.9 | 33.3 ± 0.8 | 1.3 ± 1.2 | 0.276 | 0.002 |
| MPA, % | 4.0 ± 0.2 | 3.4 ± 0.2 | 0.6 ± 0.3 | 0.043 | 0.030 |
| VPA, % | 2.1 ± 0.2 | 0.8 ± 0.2 | 1.3 ± 0.3 | < 0.001 | 0.150 |
| MVPA, % | 6.1 ± 0.4 | 4.2 ± 0.3 | 1.9 ± 0.5 | < 0.001 | 0.126 |
| Weekend days c | |||||
| SB, % | 59.7 ± 1.8 | 62.2 ± 1.7 | -2.5 ± 2.4 | 0.302 f | 0.001 |
| LPA, % | 35.9 ± 1.6 | 35.3 ± 1.5 | 0.6 ± 2.2 | 0.777 | 0.000 |
| MPA, % | 2.9 ± 0.3 | 2.2 ± 0.3 | 0.7 ± 0.4 | 0.114 | 0.015 |
| VPA, % | 1.5 ± 0.2 | 0.3 ± 0.2 | 1.2 ± 0.3 | < 0.001 | 0.180 |
| MVPA, % | 4.4 ± 0.4 | 2.5 ± 0.4 | 1.9 ± 0.6 | < 0.001 | 0.090 |
| a Reported as least squares mean ± standard error of the mean; b Percentage of time spent in one average weekday; c Percentage of time spent in one weekend day; d Some discrepancies are expected because of rounding; e Calculated from a two-way ANOVA for the effect of sex adjusted for geographical location for the whole week variables; f Calculated from a three-way ANOVA for the effect of sex adjusted for geographical location and moment of the week for the weekday and weekend day variables; g Calculated as omega squared. LPA: Low-intensity physical activity; MPA: Moderate-intensity physical activity; MVPA: Moderate-to-vigorous intensity physical activity; SB; Sedentary behaviour; VPA: Vigorous-intensity physical activity. | |||||
Table 4.
Wearing time, time spent in sedentary behaviour, and in different intensities of physical activity for the whole week, weekdays, and weekends compared by geographical location (n = 106).
Table 4.
Wearing time, time spent in sedentary behaviour, and in different intensities of physical activity for the whole week, weekdays, and weekends compared by geographical location (n = 106).
| MA (n = 65) | NMA (n = 41) | Difference d | p-value | Effect size g | |
| Whole week | |||||
| Wearing time, min a | 4655 ± 45 | 4571 ± 57 | 84 ± 73 | 0.250 e | 0.003 |
| SB, min | 2856 ± 49 | 2773 ± 62 | 83 ± 79 | 0.297 | 0.001 |
| LPA, min | 1560 ± 36 | 1595 ± 46 | -35 ± 58 | 0.550 | 0.000 |
| MPA, min | 171 ± 8 | 148 ± 10 | 23 ± 13 | 0.070 | 0.022 |
| VPA, min | 68 ± 8 | 55 ± 10 | 13 ± 12 | 0.285 | 0.001 |
| MVPA, min | 239 ± 12 | 203 ± 15 | 36 ± 20 | 0.070 | 0.022 |
| Weekdays b | |||||
| Wearing time, min | 928 ± 9 | 917 ± 12 | 11 ± 15 | 0.460 f | 0.000 |
| SB, min | 568 ± 10 | 557 ± 13 | 11 ± 16 | 0.487 | 0.000 |
| LPA, min | 308 ± 7 | 317 ± 9 | -8 ± 11 | 0.460 | 0.000 |
| MPA, min | 37 ± 2 | 31 ± 2 | 5 ± 3 | 0.065 | 0.023 |
| VPA, min | 15 ± 2 | 12 ± 2 | 3 ± 3 | 0.278 | 0.002 |
| MVPA, min | 51 ± 3 | 43 ± 4 | 8 ± 4 | 0.067 | 0.023 |
| Weekend days c | |||||
| Wearing time, min | 944 ± 17 | 904 ± 21 | 40 ± 27 | 0.142 f | 0.011 |
| SB, min | 583 ± 18 | 545 ± 22 | 38 ± 28 | 0.183 | 0.008 |
| LPA, min | 327 ± 13 | 328 ± 17 | -1 ± 22 | 0.960 | 0.000 |
| MPA, min | 25 ± 2 | 23 ± 3 | 2 ± 4 | 0.619 | 0.000 |
| VPA, min | 9 ± 1 | 8 ± 2 | 1 ± 2 | 0.715 | 0.000 |
| MVPA, min | 33 ± 3 | 30 ± 4 | 3 ± 5 | 0.595 | 0.000 |
| a Reported as least squares mean ± standard error of the mean; b Time spent in one average weekday; c Time spent in one weekend day; d Some discrepancies are expected because of rounding. e Calculated from a two-way ANOVA for the effect of geographical location adjusted for sex for the whole week variables; f Calculated from a three-way ANOVA for the effect of geographical location adjusted for sex and moment of the week for the weekday and weekend day variables; g Calculated as omega squared. LPA: Low-intensity physical activity; MA: Metropolitan area; MPA: Moderate-intensity physical activity; MVPA: Moderate-to-vigorous intensity physical activity; NMA: Non-metropolitan area; SB; Sedentary behaviour; VPA: Vigorous-intensity physical activity. | |||||
Table 5.
Percentage of wearing time spent in sedentary behaviour, and in different intensities of physical activity for the whole week, weekdays, and weekends compared by geographical location (n = 106).
Table 5.
Percentage of wearing time spent in sedentary behaviour, and in different intensities of physical activity for the whole week, weekdays, and weekends compared by geographical location (n = 106).
| MA (n = 51) | NMA (n = 55) | Difference d | p-value | Effect size f | |
| Whole week | |||||
| SB, % a | 61.3 ± 0.9 | 60.6 ± 1.1 | 0.7 ± 1.4 | 0.637 e | 0.000 |
| LPA, % | 33.6 ± 0.8 | 34.9 ± 1.0 | -1.3 ± 1.2 | 0.279 | 0.002 |
| MPA, % | 3.7 ± 0.2 | 3.2 ± 0.2 | 0.4 ± 0.3 | 0.117 | 0.014 |
| VPA, % | 1.4 ± 0.2 | 1.2 ± 0.2 | 0.2 ± 0.3 | 0.389 | 0.000 |
| MVPA, % | 5.1 ± 0.3 | 4.5 ± 0.3 | 0.7 ± 0.4 | 0.125 | 0.013 |
| Weekdays b | |||||
| SB, % | 61.2 ± 0.9 | 60.8 ± 1.1 | 0.4 ± 1.4 | 0.766 f | 0.000 |
| LPA, % | 33.3 ± 0.7 | 34.5 ± 0.9 | -1.2 ± 1.2 | 0.302 | 0.001 |
| MPA, % | 3.9 ± 0.2 | 3.4 ± 0.2 | 0.5 ± 0.3 | 0.095 | 0.017 |
| VPA, % | 1.6 ± 0.2 | 1.3 ± 0.2 | 0.3 ± 0.3 | 0.338 | 0.000 |
| MVPA, % | 5.5 ± 0.3 | 4.7 ± 0.4 | 0.9 ± 0.5 | 0.099 | 0.017 |
| Weekend days c | |||||
| SB, % | 61.7 ± 1.5 | 60.2 ± 1.9 | 1.5 ± 2.4 | 0.526 f | 0.000 |
| LPA, % | 34.7 ± 1.3 | 36.4 ± 1.7 | -1.7 ± 2.2 | 0.442 | 0.000 |
| MPA, % | 2.6 ± 0.3 | 2.5 ± 0.3 | 0.1 ± 0.4 | 0.750 | 0.000 |
| VPA, % | 0.9 ± 0.2 | 0.9 ± 0.2 | 0.0 ± 0.3 | 0.974 | 0.000 |
| MVPA, % | 3.5 ± 0.3 | 3.4 ± 0.4 | 0.1 ± 0.6 | 0.802 | 0.000 |
| a Reported as least squares mean ± standard error of the mean; b Percentage of time spent in one average weekday; c Percentage of time spent in one weekend day; d Some discrepancies are expected because of rounding. e Calculated from a two-way ANOVA for the effect of geographical location adjusted for sex for the whole week variables; f Calculated from a three-way ANOVA for the effect of geographical location adjusted for sex and moment of the week for the weekday and weekend day variables; g Calculated as omega squared. LPA: Low-intensity physical activity; MA: Metropolitan area; MPA: Moderate-intensity physical activity; MVPA: Moderate-to-vigorous intensity physical activity; NMA: Non-metropolitan area; SB; Sedentary behaviour; VPA: Vigorous-intensity physical activity. | |||||
Table 6.
Comparisons that showed a significant interaction between sex and geographical location.
| Variable | Subgroups a | Comparison within subgroups b | Mean 1 e | Mean 2 | Difference g | P-value |
| Whole week c | ||||||
| MPA, min | MA | Males vs Females | 199 ± 11 f | 144 ± 11 | 55 ± 16 | < 0.001 |
| NMA | Males vs Females | 149 ± 15 | 147 ± 13 | 1 ± 20 | 0.947 | |
| MVPA, min | MA | Males vs Females | 303 ± 17 | 175 ± 17 | 128 ± 24 | < 0.001 |
| NMA | Males vs Females | 226 ± 23 | 179 ± 20 | 47 ± 31 | 0.133 | |
| MPA, min | Males | MA vs NMA | 199 ± 11 | 149 ± 15 | 50 ± 18 | 0.008 |
| Females | MA vs NMA | 144 ± 11 | 147 ± 13 | -4 ± 17 | 0.824 | |
| MVPA, min | Males | MA vs NMA | 303 ± 17 | 226 ± 23 | 77 ± 29 | 0.009 |
| Females | MA vs NMA | 175 ± 17 | 179 ± 20 | -5 ± 27 | 0.864 | |
| Time of the week d | ||||||
| MPA, min | MA | Males vs Females | 36 ± 2 | 25 ± 2 | 11 ± 3 | 0.001 |
| NMA | Males vs Females | 27 ± 3 | 27 ± 3 | 1 ± 4 | 0.878 | |
| MVPA, min | MA | Males vs Females | 55 ± 3 | 30 ± 3 | 24 ± 5 | < 0.001 |
| NMA | Males vs Females | 42 ± 4 | 32 ± 4 | 10 ± 6 | 0.096 | |
| MPA, min | Males | MA vs NMA | 36 ± 2 | 27 ± 3 | 9 ± 4 | 0.025 |
| Females | MA vs NMA | 25 ± 2 | 27 ± 3 | -1 ± 4 | 0.688 | |
| MVPA, min | Males | MA vs NMA | 55 ± 3 | 42 ± 4 | 13 ± 6 | 0.023 |
| Females | MA vs NMA | 30 ± 3 | 32 ± 4 | -2 ± 5 | 0.751 | |
| a Refers to the categories of Sex or Geographical location. b Refers to the categories being compared within each subgroup of Sex or Geographical location. c Corresponds to the aggregated time from the five assessed days (i.e., minutes per week). d Corresponds to the average assessed day from the average weekday and weekend day (i.e., minutes per day). e The mean 1 and mean 2 belong to the first and second categories, which are compared in the third column. f Data reported as least squares means ± SEM. g Some discrepancies are expected due to rounding. MA: Metropolitan area; MPA: Moderate-intensity physical activity; MVPA: Moderate-to-vigorous intensity physical activity; NMA: Non-metropolitan area. | ||||||
Table 7.
Compliance with the physical activity recommendations compared by sex and geographical location.
Table 7.
Compliance with the physical activity recommendations compared by sex and geographical location.
| All | Sex | Geographical location | |||||
| Males | Females | p-value f | MA | NMA | p-value f | ||
| n | 106 | 51 | 55 | 65 | 41 | ||
| Days of compliance a Zero One Two or more |
43 (40.6) e 27 (25.5) 36 (34.0) |
13 (25.5) 10 (19.6) 28 (54.9) |
30 (54.5)* 17 (30.9) 8 (14.5)* |
< 0.001 |
25 (38.5) 15 (23.1) 25 (38.5) |
18 (43.9) 12 (29.3) 11 (26.8) |
0.458 |
| Weekly compliance b < 300 minutes ≥ 300 minutes |
85 (80.2) 21 (19.8) |
33 (64.7) 18 (35.3) |
52 (94.5) 3 (5.5) |
< 0.001 |
49 (75.4) 16 (24.6) |
36 (87.8) 5 (12.2) |
0.140 |
| Weekdays compliance c < 60 minutes ≥ 60 minutes |
80 (75.5) 26 (24.5) |
31 (60.8) 20 (39.2) |
49 (89.1) 6 (10.9) |
0.001 |
46 (70.8) 19 (29.2) |
34 (82.9) 7 (17.1) |
0.173 |
| Weekends compliance d < 60 minutes ≥ 60 minutes |
93 (87.7) 13 (12.3) |
41 (80.4) 10 (19.6) |
52 (94.5) 3 (5.5) |
0.037 |
55 (84.6) 10 (15.4) |
38 (92.7) 3 (7.3) |
0.362 |
| a Represents the number of days the participant met the physical activity recommendations of at least 60 minutes of moderate-to-vigorous physical activity per day. b Represents whether the participant met the recommendation by accumulating the minutes for the whole week (i.e., 5 days x 60 minutes a day). c Represents whether the participant met the recommendation on an average weekday. d Represents whether the participant met the recommendation on the weekend day. e Data expressed as frequency (percentage). f Calculated from a chi-squared test of independence for the comparison by sex and geographical location. * Denotes statistically significant differences by sex within the specified category (p < 0.05). MA: Metropolitan area; NMA: Non-metropolitan area. | |||||||
Disclaimer/Publisher’s Note: The statements, opinions and data contained in all publications are solely those of the individual author(s) and contributor(s) and not of MDPI and/or the editor(s). MDPI and/or the editor(s) disclaim responsibility for any injury to people or property resulting from any ideas, methods, instructions or products referred to in the content. |
© 2024 by the authors. Licensee MDPI, Basel, Switzerland. This article is an open access article distributed under the terms and conditions of the Creative Commons Attribution (CC BY) license (http://creativecommons.org/licenses/by/4.0/).
Copyright: This open access article is published under a Creative Commons CC BY 4.0 license, which permit the free download, distribution, and reuse, provided that the author and preprint are cited in any reuse.


