Submitted:
24 September 2024
Posted:
25 September 2024
You are already at the latest version
Abstract
As motor capacity and rated voltage increase, the demand for motor insulation also increases. Additionally, the electric field distribution at the end of a large-scale hydro generator is extremely non-uniform, and corona discharge readily occurs. This destroys the main insulation, which significantly affects the service life of electrical machinery. Thus, the regulation of the electric field concentration at the end of a large-scale hydro generator needs to be addressed. There are many problems in resistance–capacitance chain model research. Particularly, these models cannot accurately reflect the insulation, corona structure, and electric field distribution in electrical machinery. Additionally, the corner electric field and loss distributions cannot be obtained, leading to a higher calculation error. The electric field distribution at the motor end and the loss distribution were analyzed using the finite-element method. First, by applying the basic principles of electric circuits and electromagnetic field theory, we calculated the electric field distribution at the stator bar end. Second, a 3D model of the stator bar was built using Creo Parametric, yielding a model that is more closely related to the prototype wirebar model. Then, the potential, electric field, and loss distributions around the stator bar were simulated by using COMSOL simulation software. The effects of the circular arc corner, nonlinearity coefficient, anti-corona coating length, and resistivity of the stator bar on the electric field distribution at the motor end were explored.
Keywords:
Motor insulation
; Large-scale hydro generator
; Electric field distribution
; Corona structure simulation
1. Introduction
The important structures of a large-scale hydro generator end are the stator bar, core, main insulation, and anti-corona coating, which constitute bushing-type insulating structures [1,2]. The electric field distribution in this bushing-type structure tends to be non-uniform. When the electric field strength reaches a certain value, a corona discharge occurs, destroying the insulating structure if it occurs over a long period of time. Insulation breakdown significantly affects the motor operation reliability[3,4]. To achieve a uniformly distributed electric field in the large motor outlet, the coil end can be wrapped with a nonlinear silicon carbide anti-corona belt. This improves the electric field distribution and consequently inhibits corona generation[5]. Furthermore, silicon carbide is nonlinear, and its resistivity decreases with increasing electric field strength. This results in an outlet electric field that is automatically homogenized, from which the ratio of corona generation decreases[6]. The main insulating surface of hydro generators has an anti-corona coating. To date, the electric field distribution and anti-corona optimization at the large motor end have been obtained using different computing methods, and this information provides a reference for anti-corona structure design for motors[7,8]. Given this basic structure, additional computing methods have been developed based on the electric circuit and electromagnetic field theory.
Traditional methods of electric field analysis for large motor ends include the link model method and dichotomy shooting method[9]. Both methods yield solutions of differential equations from which the potential distribution of the electric field can be obtained[10]. The advantages of these methods include their simplistic models and low time cost. However, they cannot solve the electric field concentration problem for electrical machinery wirebars with narrower faces and end corners[11]. The solution process for nonlinear anti-corona coatings is complex. However, obtaining accurate results is difficult. Methods of electromagnetic field analysis continue to be widely applied with the advancement of computers[12].
The anti-corona structure of the stator bar has been optimally designed using the finite-element method[13]. The samples were also subjected to control tests. The electric field distribution at the wirebar end was comprehensively analyzed, confirming the enhanced operational efficiency and stability of the electrical machinery[14,15]. According to the finite-element analysis, an approximate solution can be obtained by applying the variational method and discretization theory[16]. In practice, the electromagnetic field can be solved using the following differential equation: This method begins with the partial differential equation boundary-value problem[17]. The differential equation to be solved is addressed via discretization, which yields a functional integrand[18]. After the first type of boundary condition is set, the extreme value of the integrand can be obtained. Therefore, the problem becomes a conditional variance problem[19]. The conditional variance problem is similar to the partial differential equation boundary-value problem[20]. Thus, many electromagnetic field problems can be solved by applying the problem of conditional variance in the finite-element method[21]. To solve the electromagnetic field problem, a differential equation and all the boundary condition information are required[22]. Simulation of the engineering problem allows the actual engineered systems to be converted into a finite-element system with nodes and elements[23]. Subsequently, the finite-element system can be mathematically modeled. The solutions expressed by the nodes and elements can be obtained via numerical simulation[24]. In this mathematical model, except for the nodes and elements, boundary, constraints, and external force loads were included.
In this study, a 3D model of the anti-corona structure in a large hydro generator stator bar end was built using PTC modeling software. The rated capacity and voltage were 120 MW and 15.75 kV, respectively. Then, by conducting finite-element numerical simulation analysis using COMSOL Multiphysics, the end potential, electric field, and loss distribution in the stator bar anti-corona structure were analyzed. Additionally, the effects of the circular arc rotational degree, anti-corona layer length, intrinsic resistivity, and nonlinearity coefficient on the electric field distribution and loss were explored.
2. Stator Bar Simulation
COMSOL Multiphysics is an advanced numerical simulation software package[25]. This was based on the finite-element analysis method. The actual physical phenomenon is modeled via analog simulation using differential equations or an equation solution[26]. COMSOL Multiphysics is widely used to simulate physical processes in various fields of science and engineering. Compared to other electromagnetic field simulation software packages, COMSOL has many advantages. For example, when coupled field analysis is performed, various differential equations can be concurrently applied[27]. This framework has been widely applied, and the differential equations required for a graphical interface can be freely defined. The material properties, boundary conditions, and load can be controlled by setting the parameters. Each built-in physical model can be easily selected and revised. Additionally, there are many mesh-generation functions in this software. The mesh generation of polyhedrons, such as tetrahedrons and hexahedrons, can be performed by the software. Its numerous features allow this platform to smoothly perform calculations and simulations.
The COMSOL Multiphysics platform is powerful. In this study, the AC/DC Module was used[28]. This module applied the steady-state and dynamic electromagnetic fields in 2D and 3D spaces. Additionally, traditional passive and active elements were also incorporated into the circuit model. All model formulas were derived based on Maxwell’s equations, subsets, special cases, and Ohm’s law. By applying a series of predefined physical field interfaces (i.e., special physical field interfaces of low-frequency electromagnetics), the electric, magnetic, and electromagnetic fields were modeled under a steady state and low frequency. The modular workflow can be divided into the following steps: geometrical definition, material selection, appropriate low-frequency electromagnetics and physical field interface selection, boundary and initial condition definition, finite-element network definition, solver, and visualization result selection, all of which were performed using COMSOL Multiphysics. By applying the default settings in the solver, all processes can be automated. Additionally, COMSOL Multiphysics possesses an abundant post-processing function that enables the analysis of various data, images, curves, and animations according to user requirements.
3. Establishment of the Stator Bar Simulation Model
COMSOL Multiphysics software was used to perform the physical field modeling analysis to obtain the simulation model images at the stator bar end.
3.1. Geometric Model Establishment
The shape of the hydro generator stator winding end is the most significant challenge in the alternator design process. In conventional modeling methods, the wirebar structure of actual electrical machinery is not fully considered. Additionally, the anti-corona coating does not involve segmentation assignment processing. The electric field distribution of the simulated wirebar was designed to be consistent with that of the actual wirebar. Because the anti-corona coating structure is very thin, surface interference detection was employed using the conventional thickening mode once the anti-corona coating was set. If interference was detected, the electric field distribution could not be accurately determined. A specific deviation adversely affects the design of the anti-corona structure. To obtain the actual end structure in the stator winding of the hydro generator, a circular arc corner angle was added based on the traditional modeling flat turn angle. The primary insulating structure was obtained by using the thickening method. By applying the shifting and substantialization functions, a 0.32-mm thick anti-corona structure was constructed on the main insulating surface. Additionally, the anti-corona coating was divided into a multi-segment anti-corona structure to enable independent analysis of the anti-corona coating of the wirebar. The boundary condition settings were satisfied. The single-wirebar structure in the actual hydro generator end (15.75 kV rated voltage and 120 MW rated capacity) was obtained. Additionally, the effects of electromagnetic induction on multiroot wirebars were explored. The wirebar was then solved for the entire system. The main parameters of the stator bars are shown in Table 1.
According to the data in Table 1, the modeling process of the stator bar end is as follows:
(1) In the Creo Parametric software, a bias with a β angle was drawn in one plane. The bias length was set to be equal to the wirebar width, Wl. The other plane was generated based on this bias. Then, a cross section of the wirebar was constructed. This cross section was positioned in the initial circular arc and is vertical to it. The center of the wirebar cross section was generated based on the wirebar length and width. Then, this center point was projected into the plane generated based on angle β to obtain the scanning track for the wirebar. This is illustrated in Figure 1.
(2) The center of the plane was scanned, and the cross section was drawn according to the developed path, which is called an entity. Then, the structures of the wirebar ends were obtained. During plane selection, the copper busbar at both ends of the circular arc of the transition corner must be drawn. During the scanning process, a specific torsion angle compensation was required. The scan pattern was drawn based on length Lc and width Wc of the copper busbar. The copper wirebar at the end of the electrical machinery was obtained following the application of the scanning track, as shown in Figure 2.
(3) We generated the main insulating structure of the wirebar end as follows. After the 3D wirebar was established, the main insulating structure with d1 thickness was added to the exterior of the wirebar. Because a thickened removed material was adopted, the corner angle of the circular arc was added. This generated a certain amount of interference, which adversely affected the subsequent simulation. To eliminate this interference, the course of the copper core surface must be duplicated during the establishment of the main insulating structure. By applying the function of substantialization shifting, the main insulating structure of the stator bar was obtained, as shown in Figure 3.
(4) The anti-corona coating structure was generated as follows. Because anti-corona coatings possess different resistivities, different anti-corona coatings were designed. Moreover, the anti-corona coating was very thin relative to the main insulation. The required thicknesses and fractional lengths were obtained by applying curved surface duplicates, shifting, material removal, and segmentation. The following optimization process was also performed. First, a three-segment corona-resistant wirebar structure was created. Subsequently, an assembly modeling method was adopted. After the uniform assembly of the structure, the geometric model of a single stator bar was obtained, as shown in Figure 4.
After building the model, an iron core was applied. The STP file format is the leading format when applying COMSOL software for 3D simulation analysis.
3.2. Physical Field and Material Parameters
COMSOL software possesses an excellent physical field interface. In this study, we developed and simulated a coupled electric-temperature field model. During physical module selection, the current interface in the AC/DC Module and solid heat transfer in the heat transfer module were selected. The current interface was used to calculate the preset initial conditions. When the boundary conditions were set, Ampere’s law was automatically satisfied. The current and electric potential distributions were then calculated. Additionally, the frequency domain, time domain, and small signals were analyzed. The heat conduction and convection processes were simulated using the heat transfer module.
Regarding the material parameters, COMSOL includes a vast basic material library. Common materials can be obtained directly from material libraries. Customer material are also included. If no materials are required, then the basic parameters can be defined by the user. Additionally, a current module was adopted for the simulation. The basic parameters of the materials, such as the conductivity and relative dielectric constant, were considered. Generally, if they are constant, the material attribute values can be manually entered. Regarding the parameters with a function expression form, the material attribute expressions, such as those for analysis and piecewise linear interpolation, can be added to the global definition.
In this study, the anti-corona material was silicon carbide; thus, it was applied as a nonlinear material in the finite-element analysis. As the electric field strength increased, the resistivity decreased. The expression for the silicon carbide resistivity is shown in Equation (1).
 To reflect the nonlinearity of the system, the electric field was defined as ec.normE. The basic material attributes of the system are listed in Table 2.
The resistivity of air is 0 Ω·m. However, if an input material parameter value is set to zero, the simulation results will not converge. Thus, the air resistivity was set to be 2 × 10-11 Ω·m.
3.3. Boundary Conditions and Mesh Generation
When an electric field is simulated, boundary conditions must be established. The boundary conditions of the electromagnetic field were divided into three types. To establish the Dirichlet boundary condition, the potential and grounding system conditions were provided. To ensure that the calculations were realistic, the copper wire was connected to a power-frequency high voltage. The rated voltage and frequency were 15.75 kV and 50 Hz, respectively. The other boundary condition is the grounding condition. The iron core and the low-resistance layer were grounded. The entire wirebar was then coated with an air shed. This completed the establishment of the boundary conditions.
Mesh generation was applied to the entire wirebar, and each subdivided unit was subjected to finite-element analysis. Therefore, mesh generation played a crucial role in the simulation. Using the aforementioned simulation software, automatic and semi-automatic mesh generation functions were established. Tetrahedral mesh generation was adopted for the main insulating and wirebar components. For a relatively thin anti-corona coating, special mesh generation settings are required. In this study, a scanning subdivision method was used to divide the anti-corona coating into small elements. There is a close relationship between mesh generation and calculation accuracy. With a more precise mesh generation scheme, the calculated results tend to be closer to the real structure. However, highly specialized mesh generation exponentially increases the computation time. Nonetheless, a highly specialized mesh generation method was adopted in this study. A 3D scan mesh was used to model the anti-corona coating model. Thus, a more accurate mesh generation result was obtained, as illustrated in Figure 5.
3.4. Research Procedures and Solver Settings
The steady-state, transient-state, and frequency-domain solvers were preset by using the COMSOL Multiphysics platform. Therefore, additional research procedures were used for the calculations. By applying the settings for the material properties and boundary conditions, the multiple physical states and boundary conditions in the model could be effectively and quickly calculated. To calculate the electric field in the stator bar, a frequency-domain solver was chosen. The voltage was set to 50 Hz alternating voltage. The maximum number of iterations was set to 400, at which point the calculations were terminated. Lastly, the 3D stator bar model was simulated.
4. Simulation Results and Analysis for the End of the Stator Bar
The material properties, boundary conditions, and solver were set on the COMSOL platform and a mesh was generated. By applying frequency-domain electric field analysis and an airshed peripheral device, a wirebar with a non-anti-corona structure, a linear anti-corona structure, a two-level nonlinear anti-corona structure, and a three-level nonlinear anti-corona structure were simulated. Under the conditions of the applied rated voltage, the surface potential, 3D electric field, and surface losses of the four structures were simulated and compared.
4.1. Potential Distribution on Wirebar Surface
The potential distribution diagram for each anti-corona structure is shown in Figure 6. For a wirebar without an anti-corona layer structure, the entire insulation surface exhibited high potential. However, the potential near the low-resistance layer changed rapidly. The electric potential jumps to the notch. The electric potential in the wirebar notch with a linear anti-corona layer was smoother than that in the notch with a nonlinear anti-corona layer. When the potential reached 16.3 kV, it began decreasing. The change in potential stopped at the rated voltage. For the wirebars with nonlinear two- and three-layer anti-corona structures, the potential variation exhibited a similar trend. Figure 3, Figure 4, Figure 5 and Figure 6 show that, near the intermediate- and high-resistance overlap positions, the potential increased to a value that was 8.4% higher (i.e., 17.1 kV) than the rated voltage. When it reached the high-resistance anti-corona level, the potential at the end of the wirebar was restored to the rated voltage value. The maximum potential occurred at the end of the intermediate-resistance anti-corona layer. The maximum potentials of wirebars with two- and three-layer anti corona structures were 17.5 and 17.1 kV, respectively.
The 3D surface potential diagrams are direct and clear. However, comparison of the results is difficult. By employing the composition method, we derived a path curve for the anti-corona coating. The 1D potential distribution for each anti-corona structure is shown in Figure 7.
For the 1D structure, in the absence of an anti-corona structure, the outer surface of the main insulating layer was suspended. Additionally, no grounding existed, which is equivalent to one pole of an ungrounded capacitor. The insulation on the outer surface of the wirebar end reached the rated voltage, as shown in Figure 7a, and the potential changed rapidly. For the linear anti-corona structure, we observed a steep slope in the graph, indicating rapid change. The maximum voltage was reached at the start of the intermediate-resistance layer. These abrupt changes in potential were significant. For the nonlinear anti-corona structure, regardless of the presence of two or three anti-corona layers, we observed a slope in the voltage curve; however, the change in voltage was minimal. The potential reached its highest value and then decreased to the rated voltage value. The maximum voltage occurred near the intermediate- and high-resistance layers. This is because, after dressing the anti-corona belt, a resistance-capacitance structure formed between the main insulating anti-corona layer and copper wirebar. This resistance-capacitance structure consisted of a real resistance and an imaginary reactance. After superposition, it was higher than that after the addition of pure conduction. Capacitive current flows through. A capacitance-increasing voltage was generated, which caused the potential in the wirebar to increase.
4.2. Electric Field Distribution in the Wirebar
The 3D electric field distribution diagrams for the four structures are shown in Figure 8. The inception and discharge of the wire-bar corona were primarily induced by the electric field. Corona inception and flashovers are typically caused by tangential electric fields. This electric field strength was low, and the corona inception voltage was high, which ensured the reliability of the voltage test and actual operation. The distribution of the electric field without an anti-corona layer is shown in Figure 8. At the slot outlet, the electric field was relatively concentrated. The highest electric field strength was 86.8 kV/cm, which is significantly higher than the air inception voltage. At the slot outlet, air was ionized to enable corona discharge.
The electric field distribution of the wirebar with a linear anti-corona field is shown in Figure 9. This figure shows that the electric field distribution remained concentrated at the slot outlet. However, the maximum field strength was 18.3 k V/cm, which was lower than that for the structure with no anti-corona layer. Although the maximum electric field strength was relatively lower, the concentration at the slot outlet was still evident. This fails to meet the requirements of an anti-corona coating.
The electric field distribution of the wirebar surface with two nonlinear anti-corona layers is shown in Figure 10. The field strength tended to be the highest at the wirebar end, which corresponds to the low- and intermediate-resistance sections at the slot outlet. The highest field strength value was 3.37 kV/cm, which is two times higher than that in the intermediate-resistance section. The electric field distribution of the wirebar surface with three nonlinear anti-corona layers is shown in Figure 11. The electric field distribution was more uniform in the intermediate-resistance section. We also observed a concentrated electric field in the area between the intermediate- and high-resistance sections. This is because the capacitor current can flow easily through this area, which results in a concentrated electric field. Additionally, this area became superheated, causing thermal damage. The highest electric field strength value for the structure with three nonlinear anti-corona layers was 2.80 kV/cm. This was 16% lower than that for the structure with two nonlinear anti-corona layers. Thus, the field distribution conditions were improved.
From identical curve positions, the electric field distributions for the anti-corona structures are shown in Figure 12.
In the absence of an anti-corona wirebar structure, sudden changes in the electric field occur at the slot outlet. After increasing to 26 kV/cm, the electric field strength rapidly decreased. Particularly, the electric field strength of the linear anti-corona structure abruptly decreased to 10.4 kV/cm. For the two-layer anti-corona structure, the highest field strength decreased to 5.62 kV/cm. However, the electric field strength rapidly increased near the end of the intermediate-resistance region. For the three-layer anti-corona structure, the maximum field strength was 4.5 kV/cm, which was 20% lower than that for the two nonlinear anti-corona layers.
4.3. Surface Loss Distribution
Another major property of anti-corona structures is their maximum surface loss density. At the end of the wirebar, if the surface loss density is too high, the anti-corona coating burns and carbonizes, damaging the bar. The surface loss density in the multi-layer anti-corona coating did not exceed 0.6 W/cm2. The surface loss density for the end of the wirebar is shown in Figure 13. The maximum heating area was observed at the head end of the first anti-corona section. The anti-corona structures, maximum temperatures, and surface loss densities were different.
As shown in Figure 13 and Figure 14, if no anti-corona coating or a linear anti-corona coating was used, the wirebar loss would be concentrated around the junction of low resistance and intermediate resistance, i.e., near the slot outlet. The maximum surface loss values for these two structures were 3.79 × 10⁷ and 8.16 × 10⁵ W/cm2, respectively. The insulating structure for the wirebar was easily degraded following heating, which resulted in damage.
As shown in Figure 15 and Figure 16, which depict nonlinear anti-corona structures, the surface loss values were accurately calculated. Higher loss values were mainly distributed on the short side of the corner. In the two-layer anti-corona structure, the surface loss was concentrated on the arc turning into an inward corner. The maximum surface loss was 2.06 W/cm2. The highest field strength value for the three-layer anti-corona structure appeared at the slot outlet. At the corner, there was no evident upward loss trend, as the surface loss decreased to 0.48 W/cm2. Particularly, it decreased by approximately one order of magnitude relative to the two-layer anti-corona structure. Additionally, there was no obvious concentrated surface loss at the interfaces of the intermediate resistance and the intermediate and high resistances.
5. Conclusion
In this study, a large hydro generator stator bar with a 15.75-kV rated voltage was modeled and simulated using Creo Parametric software. The potential, electric field, and loss distributions of wirebar with different structures were analyzed and compared. The conclusions are as follows:
(1) Electric potential mutation occurs in the absence of an anti-corona and in the presence of a linear anti-corona structure. The electric potential of the nonlinear anti-corona structure increased, corresponding to an 8.4% increase, which exceeded the rated voltage.
(2) The electric field was most concentrated at the slot outlet for all structures. For the three-layer nonlinear anti-corona structure, the electric field at the end was more uniform, and the maximum electric field was reduced to 2.8 kV/cm.
(3) Under the conditions of no anti-corona structure and a linear anti-corona structure, the surface loss reached 3.79 × 10⁷ and 8.16 × 10⁵ W/cm2, respectively. After the three-layer nonlinear anti-corona structure was added, the surface loss decreased to 0.48 W/cm2. Thus, the anti-corona effect is ideal.
Author Contributions
Conceptualization, Y.C. and G.Y.; methodology, G.Y.; software, Y.C.; validation, G.Y.; formal analysis, G.Y.; investigation, Y.C.; resources, Y.C.; data curation, G.Y.; writing—original draft preparation, G.Y.; writing—review and editing, G.Y.; visualization, Y.C.; supervision, Y.C.; project administration, Y.C.; funding acquisition, Y.C. All authors have read and agreed to the published version of the manuscript.
Funding
This research was aided by the key area campaign of regular universities in Guangdong province, No. 2021ZDZX1058. The Feature Innovation project of regular universities in Guangdong province, No. 2022KTSCX194. The offshore wind power joint funding project in Guangdong province, No. 2023A1515240063. The key area campaign of regular universities in Guangdong province, No. 2024ZDZX4074.
Institutional Review Board Statement
Not applicable.
Informed Consent Statement
Not applicable.
Data Availability Statement
Data is contained within the article.
Conflicts of Interest
There are no conflicts of interest.
References
- Borges, JWR. ; Fonseca, WD.; Brasil, FD.; Araujo, RCF. Steady-state multiphysics analysis of stator bar using finite element method. International Journal of Applied Electromagnetics and Mechanics 2021, 65, 513–526. [Google Scholar] [CrossRef]
- Araujo, RCF. ; De Oliveira, RMS.; Barros, FJB. Automatic PRPD image Recognition of Multiple Simultaneous Partial Discharge Sources in On-Line Hydro-Generator Stator Bars. Energies. 2022, 15, 326. [Google Scholar] [CrossRef]
- Sena, AJC. ; De Oliveira, RMS.; Do Nascimento, JAS. Frequency Resolved Partial Discharge Based on Spectral Pulse Counting. Energies. 2021, 14, 6864. [Google Scholar] [CrossRef]
- Yin, XZ.; Zeng, JB.; Guan, QB. Shielding Strategies for Electric Field Minimization in Current Transformers: A Finite Element Combined Design of Experiment Approach. Energies. 2023, 16, 7247. [Google Scholar] [CrossRef]
- He, X.Z.; Rytoluoto, I.; Anyszka, R.; Mahtabani, A.; Saarimaki, E. Silica Surface-Modification for Tailoring the Charge Trapping Properties of PP/POE Based Dielectric Nanocomposites for HVDC Cable Application. IEEE Access 2020, 8, 87719–87734. [Google Scholar] [CrossRef]
- Zeng, X.; Zhang, S.; Ren, CH.; Shao, T. Physics informed neural networks for electric field distribution characteristics analysis. Journal of Physics D-applied Physics. 2023, 56, 165202. [Google Scholar] [CrossRef]
- Xiang, YB.; Rao, PP.; Feng, WK.; Ouyang, PH. Evaluation of time history distribution characteristics of lightning electromagnetic field in heterogeneous soil. ACTA Geophysica. 2023, 72, 793–805. [Google Scholar] [CrossRef]
- Li,L. ; Li, Q. Electric Field Improvement for High-Voltage Bushings. Polymers 2023, 15, 40. [Google Scholar]
- Zhao, HN.; Yu, SB. Analysis of rotor fatigue characteristics of permanent magnet synchronous motor spindle in eccentric state. International Journal of Applied Electromagnetics and Mechanics. 2023, 73, 81–96. [Google Scholar] [CrossRef]
- Aziz, E.; Aouabed, F.; Abdellah, H.; Dineva, A. Case Study: Optimizing Grading Ring Design for High Voltage Polymeric Insulators in Power Transmission Systems for Enhanced Electric Field and Voltage Distribution by Using a Finite Element Method. Energies 2023, 16, 5235. [Google Scholar] [CrossRef]
- Du, ZP.; Jiang, ZY.; Deng, ZX.; Huang, JC. A closed-form expression of electric polarizability for elliptical apertures excited by nonuniform electric field. Physica Scripta. 2023, 98, 115532. [Google Scholar] [CrossRef]
- Sieni, E.; Dettin, M.; Zamuner, A.; Conconi, MT.; Bazzoio, B.; Balducci, C. Finite Element Evaluation of the Electric Field Distribution in a Non-homogeneous Environment. Bioengineering-Basel. 2023, 10, 1062. [Google Scholar] [CrossRef] [PubMed]
- Liao, W.; Yang, Q.; ke, K.; Qiu, ZH.; Lei, YQ. Non-Intrusive Voltage-inversion Measurement Method for Overhead Transmission Lines Based on Near-End Electric-field Integration. Energies. 2023, 16, 3415. [Google Scholar] [CrossRef]
- Zhu, XQ.; LI, YH.; Zhou, YX. Improvement of the electrical treeing resistance of polymers through the self-arrangement effect of the voltage stabilizer caused by dielectrophoresis under non-uniform electric field. Applied Physics Letters. 2023, 123, 104101. [Google Scholar] [CrossRef]
- Ghayedi, M.; Jasinski, M. Electric Field Distribution on Zinc Oxide Pills in Gapless Surge Arresters Using Finite Element Method and Evolutionary Optimization Algorithms in HVAC Systems. Sustainability. 2023, 15, 7892. [Google Scholar] [CrossRef]
- Xu, SX.; Li, Q.; Meng, W.; Tang, Q.; Li, L.; Hu, JL. The Electric Field Evaluation for Vibrating Rain Droplets on the Overhead Line Conductors. Energies. 2023, 16, 4557. [Google Scholar] [CrossRef]
- Wang, H.; Zhang, L. Vibration Scale Model of a Converter Transformer Based on the Finite Element and Similarity Principle and Its Preparation. Processes. 2023, 11, 1969. [Google Scholar] [CrossRef]
- Liao, ZH.; Xu, JL.; Wan, BQ. Finite element analysis of total electric field distribution on the roof of flat-roofed buildings near HVDC lines. Electrical Engineering. 2023, 10, 1153–1162. [Google Scholar] [CrossRef]
- Zhang, JH.; Shi, JL.; Zhang, J. Analysis of the Surface Eectric Field Distribution of a 10kV Faulty Composite Insulator. Electronics. 2022, 11, 3740. [Google Scholar] [CrossRef]
- Johri, P.; Reddy, CC.; Kumar, C. Electric Field Dynamics in PILC Side of Dry Type MV Heat-Shrink Transition Joints. IEEE Transactions on Power Delivery. 2022, 37, 1888–1896. [Google Scholar] [CrossRef]
- Han, WX.; Yang, G. A Data-Driven Model of Cable Insulation Defect Based on Convolutional Neural Networks. Applied Sciences-Basel. 2022, 12, 8374. [Google Scholar] [CrossRef]
- Ciuprina, G.; Sabariego, RV. Numerical Stability of Dual Full-Wave Formulations With Electric Circuit Element Boundary Conditions. IEEE Transactions on Magnetics. 2024, 60, 7401504. [Google Scholar] [CrossRef]
- Ahmed, R.; Abd Rahman, R.; Jamal, A. Field-Dependent Pollution Model under Polluted Environments for Outdoor Polymeric Insulators. Polymers. 2022, 14, 516. [Google Scholar] [CrossRef] [PubMed]
- Soloviev, AN.; Do, BT.; Chebanenko, VA.; Parinov, IA. Flexural Vibrations of a Composite Piezoactive Bimorph in an Alternating Magnetic Field: Applied Theory and Finite-Element Simulation. Mechanics of Composite Materials. 2022, 58, 471–482. [Google Scholar] [CrossRef]
- Zhang, JJ.; Wang, XQ.; Chen, XH.; Du, H.; Weng, GJ. Finite element analysis of the magnetoelectric effect on hybrid magnetoelectric composites. Composite Structures. 2022, 296, 115876. [Google Scholar] [CrossRef]
- Pauly, S.; Schulz, A.; Walker, M.; Gorath, M.; Baumgaertner, K.; Tovar, GEM. Modeling and Experimental Study of a Remote Microwave Plasma Source for High-Rate Etching. Chemie Ingenieur Technik. 2022, 94, 410–416. [Google Scholar] [CrossRef]
- Mhamdi, B.; Benmahamed, Y.; Teguar, M.; Taha, IBM. ; Ghoneim, SSM. Multi-Objective Optimization of 400kV Composite Insulator Corona Ring Design. IEEE Access. 2022, 10, 27579–27590. [Google Scholar] [CrossRef]
- Li, WY.; Wang, YL.; Ding, Y.; Yin, Y. Optimization Design of Packaging Insulation for Half-Bridge SiC Mosfet Power Module Based on Multi-Physics Simulation. Energies. 2022, 15, 4884. [Google Scholar] [CrossRef]
Figure 1.
Scanning trajectory of stator bar.
Figure 2.
Copper core of stator bar.
Figure 3.
Main insulating structure of stator bar.
Figure 4.
Anti-corona stator bar structure.
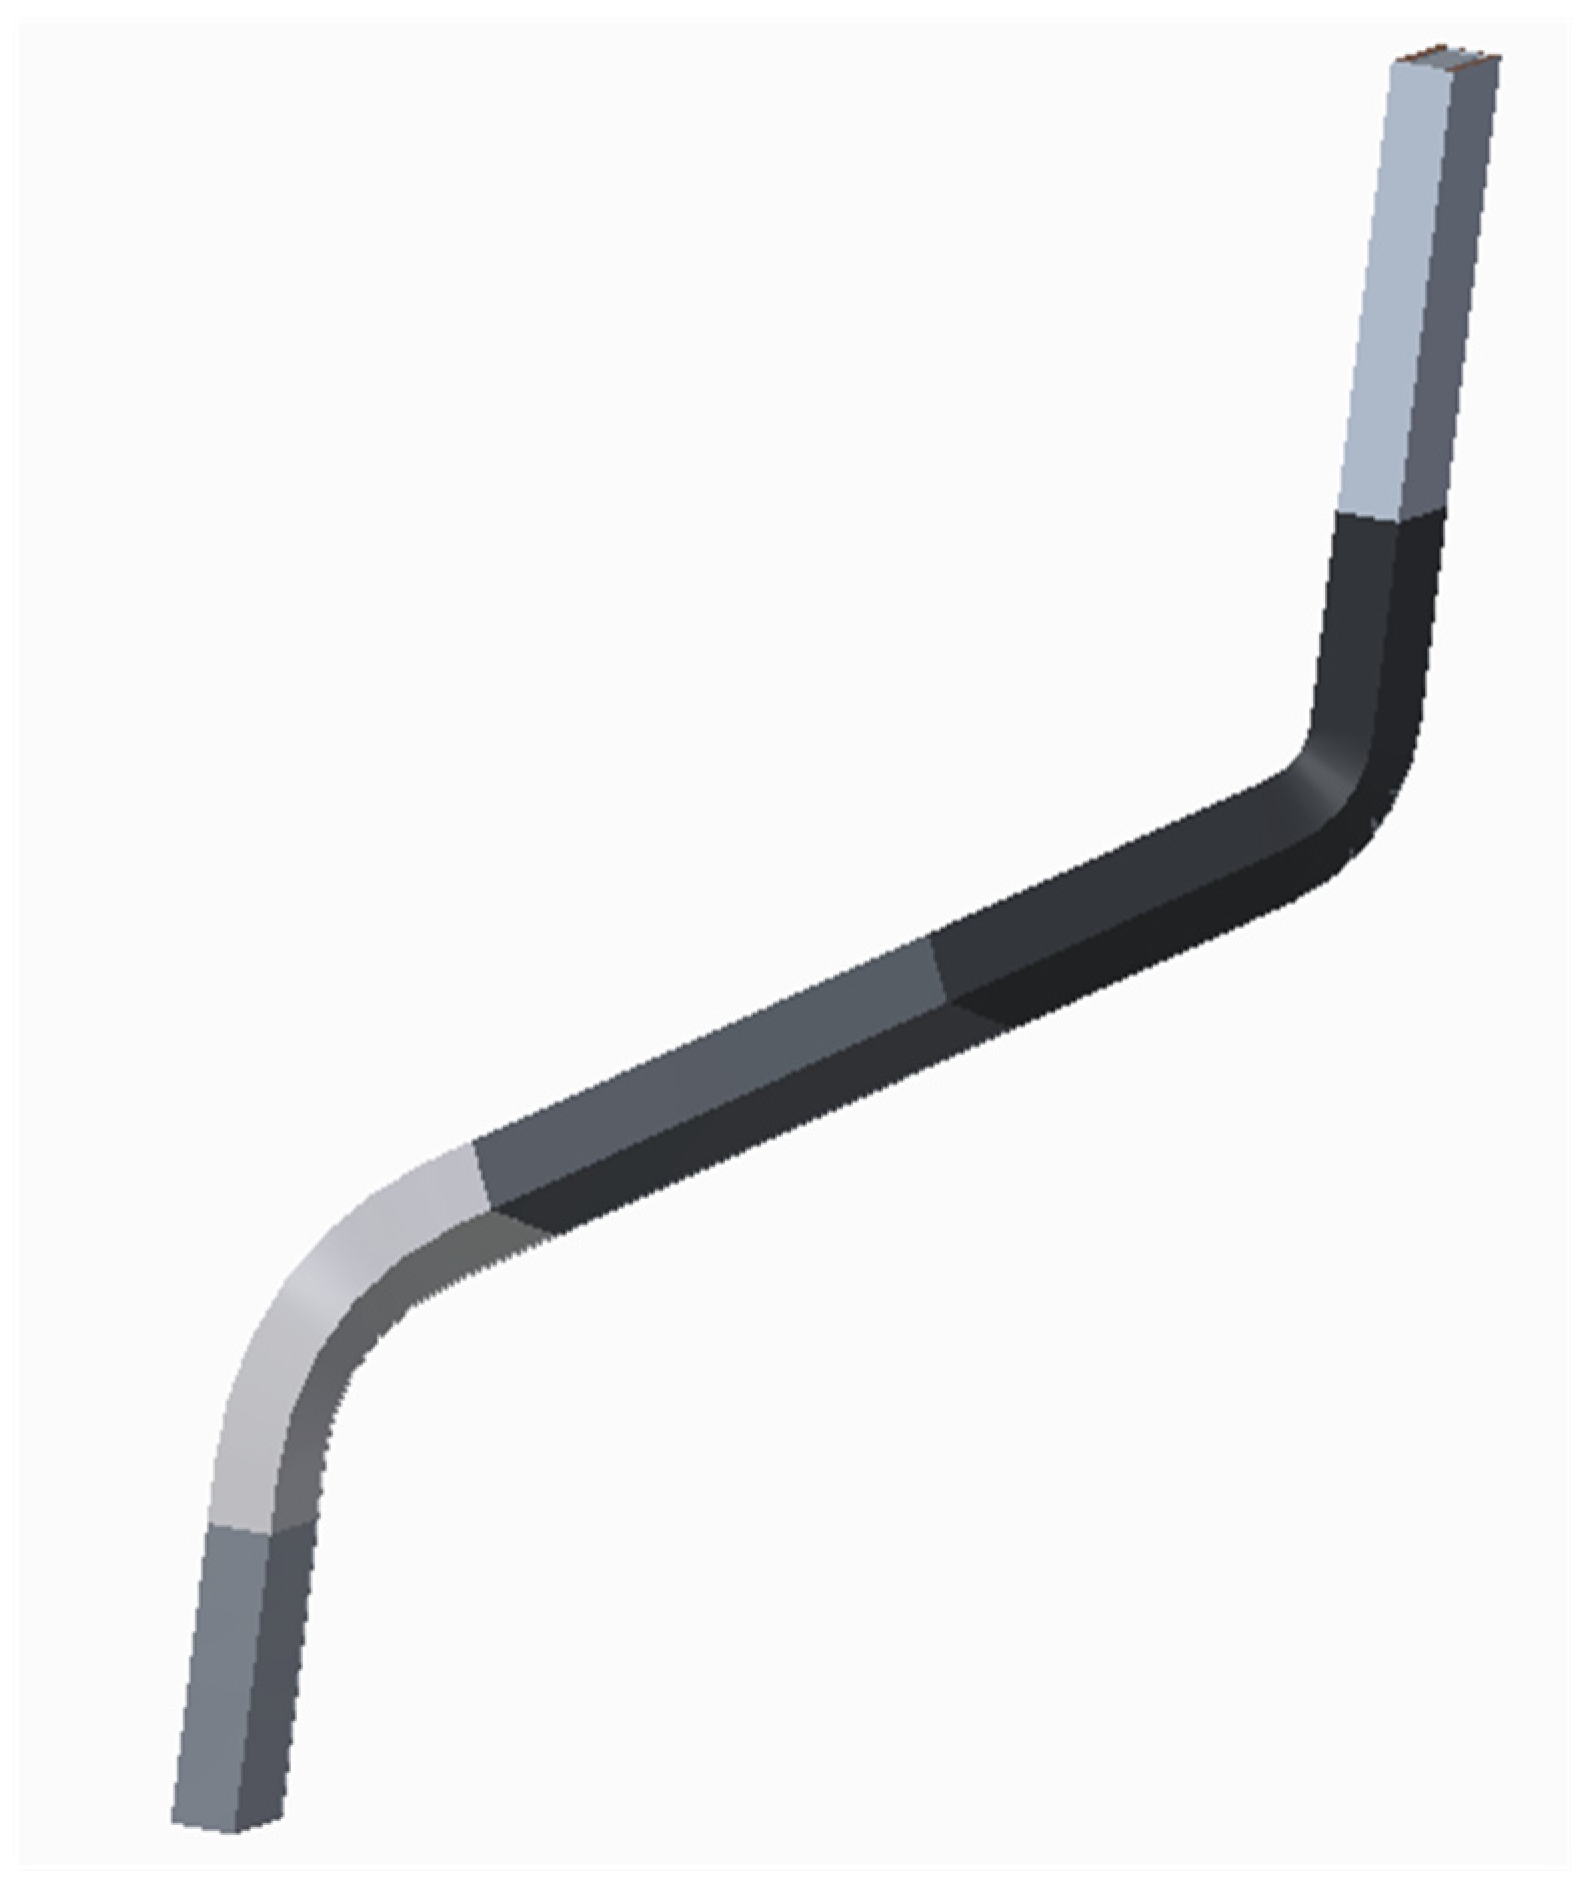
Figure 5.
3D mesh generation of stator bar.
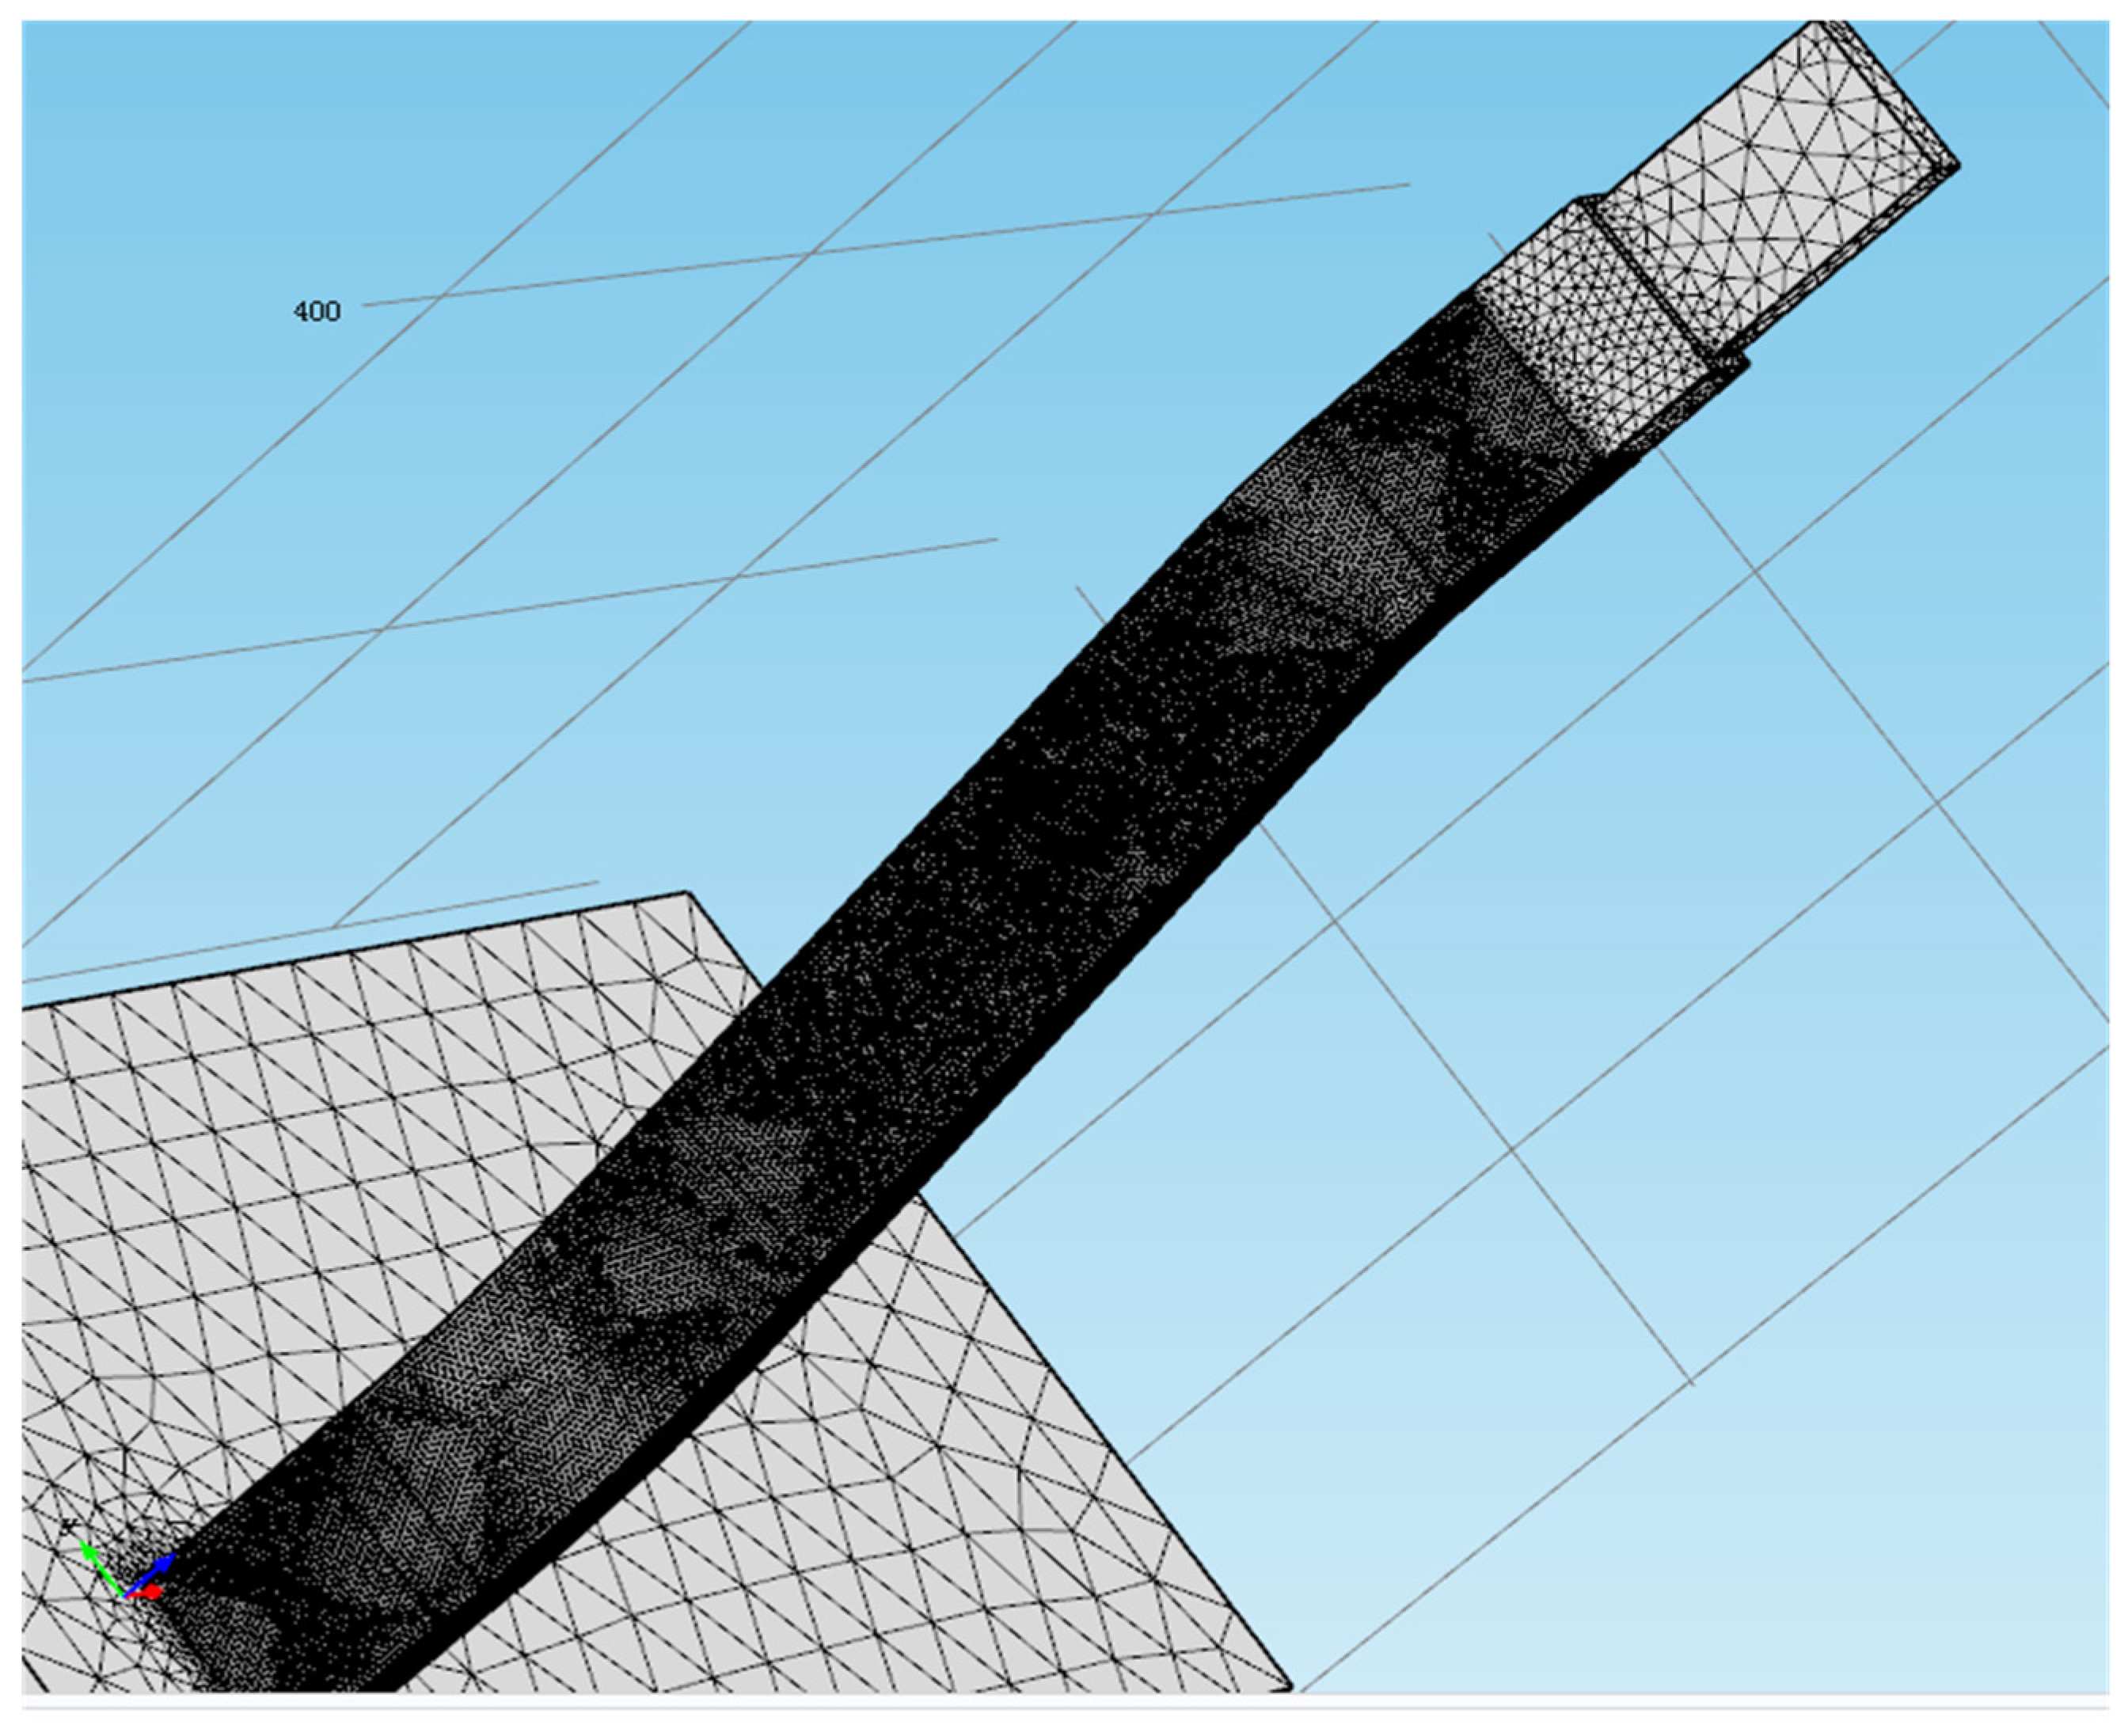
Figure 6.
3D surface potential distributions for different structures.
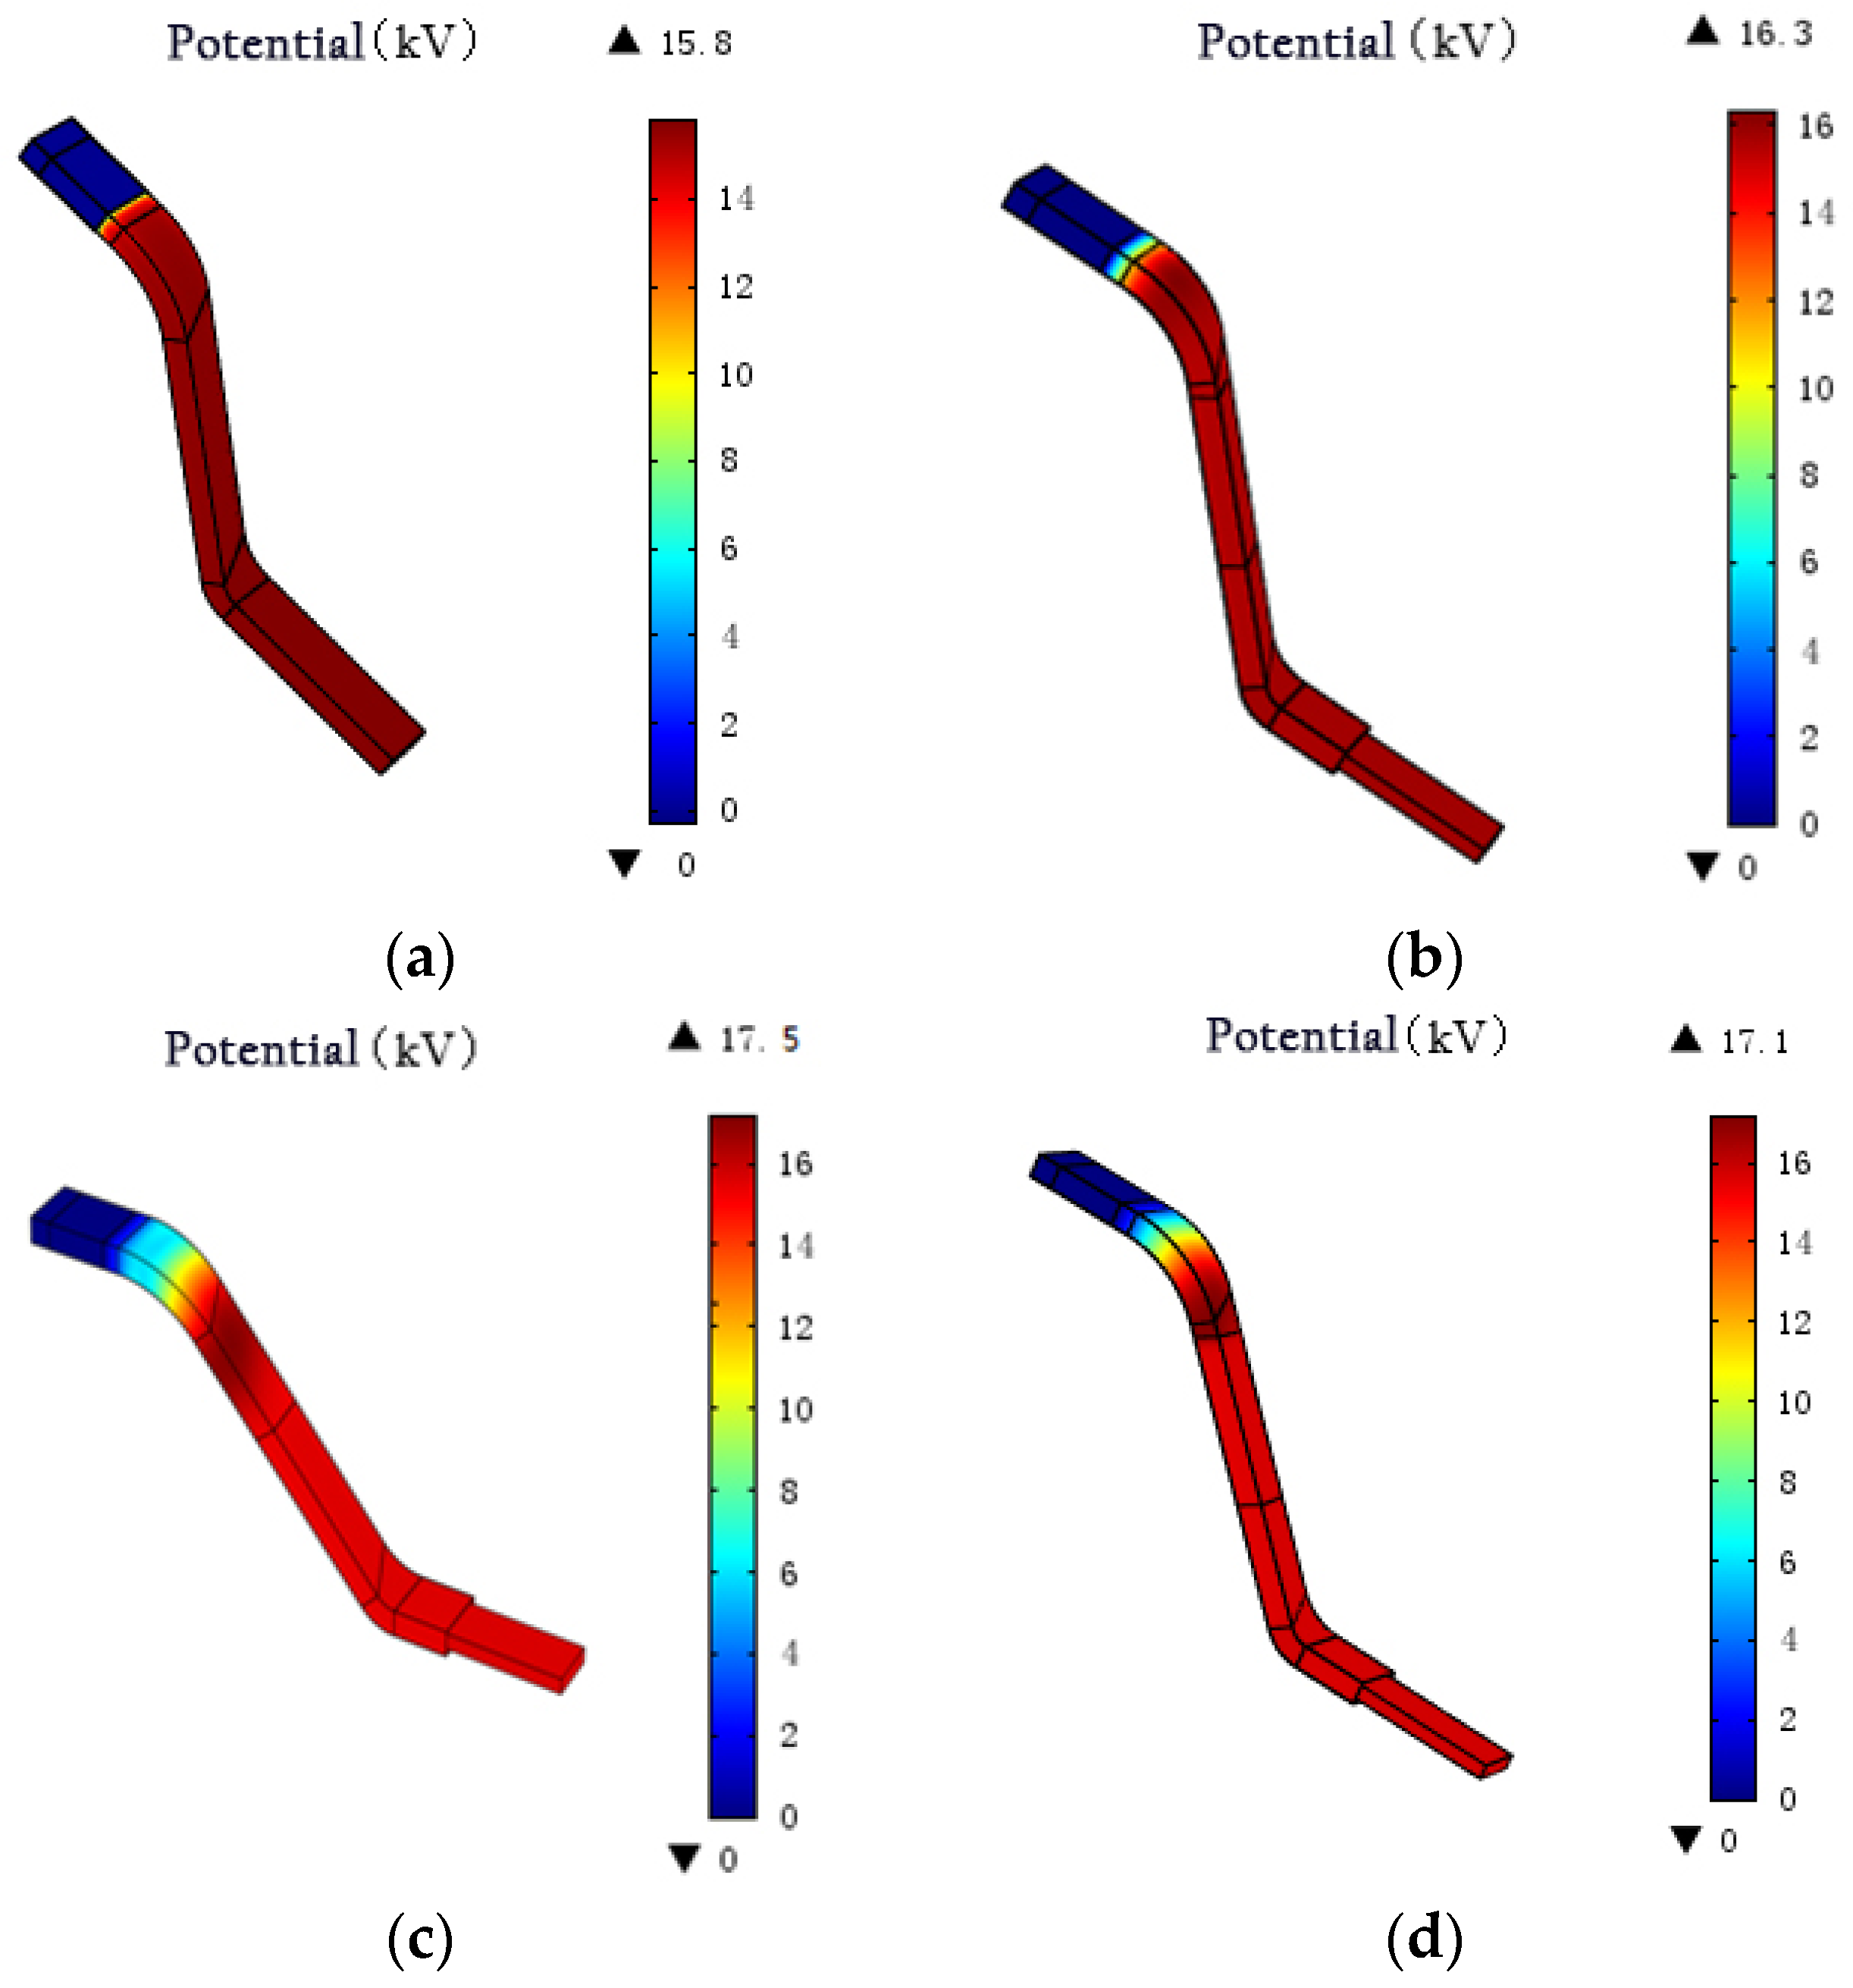
Figure 7.
1D surface potential distributions for different structures.
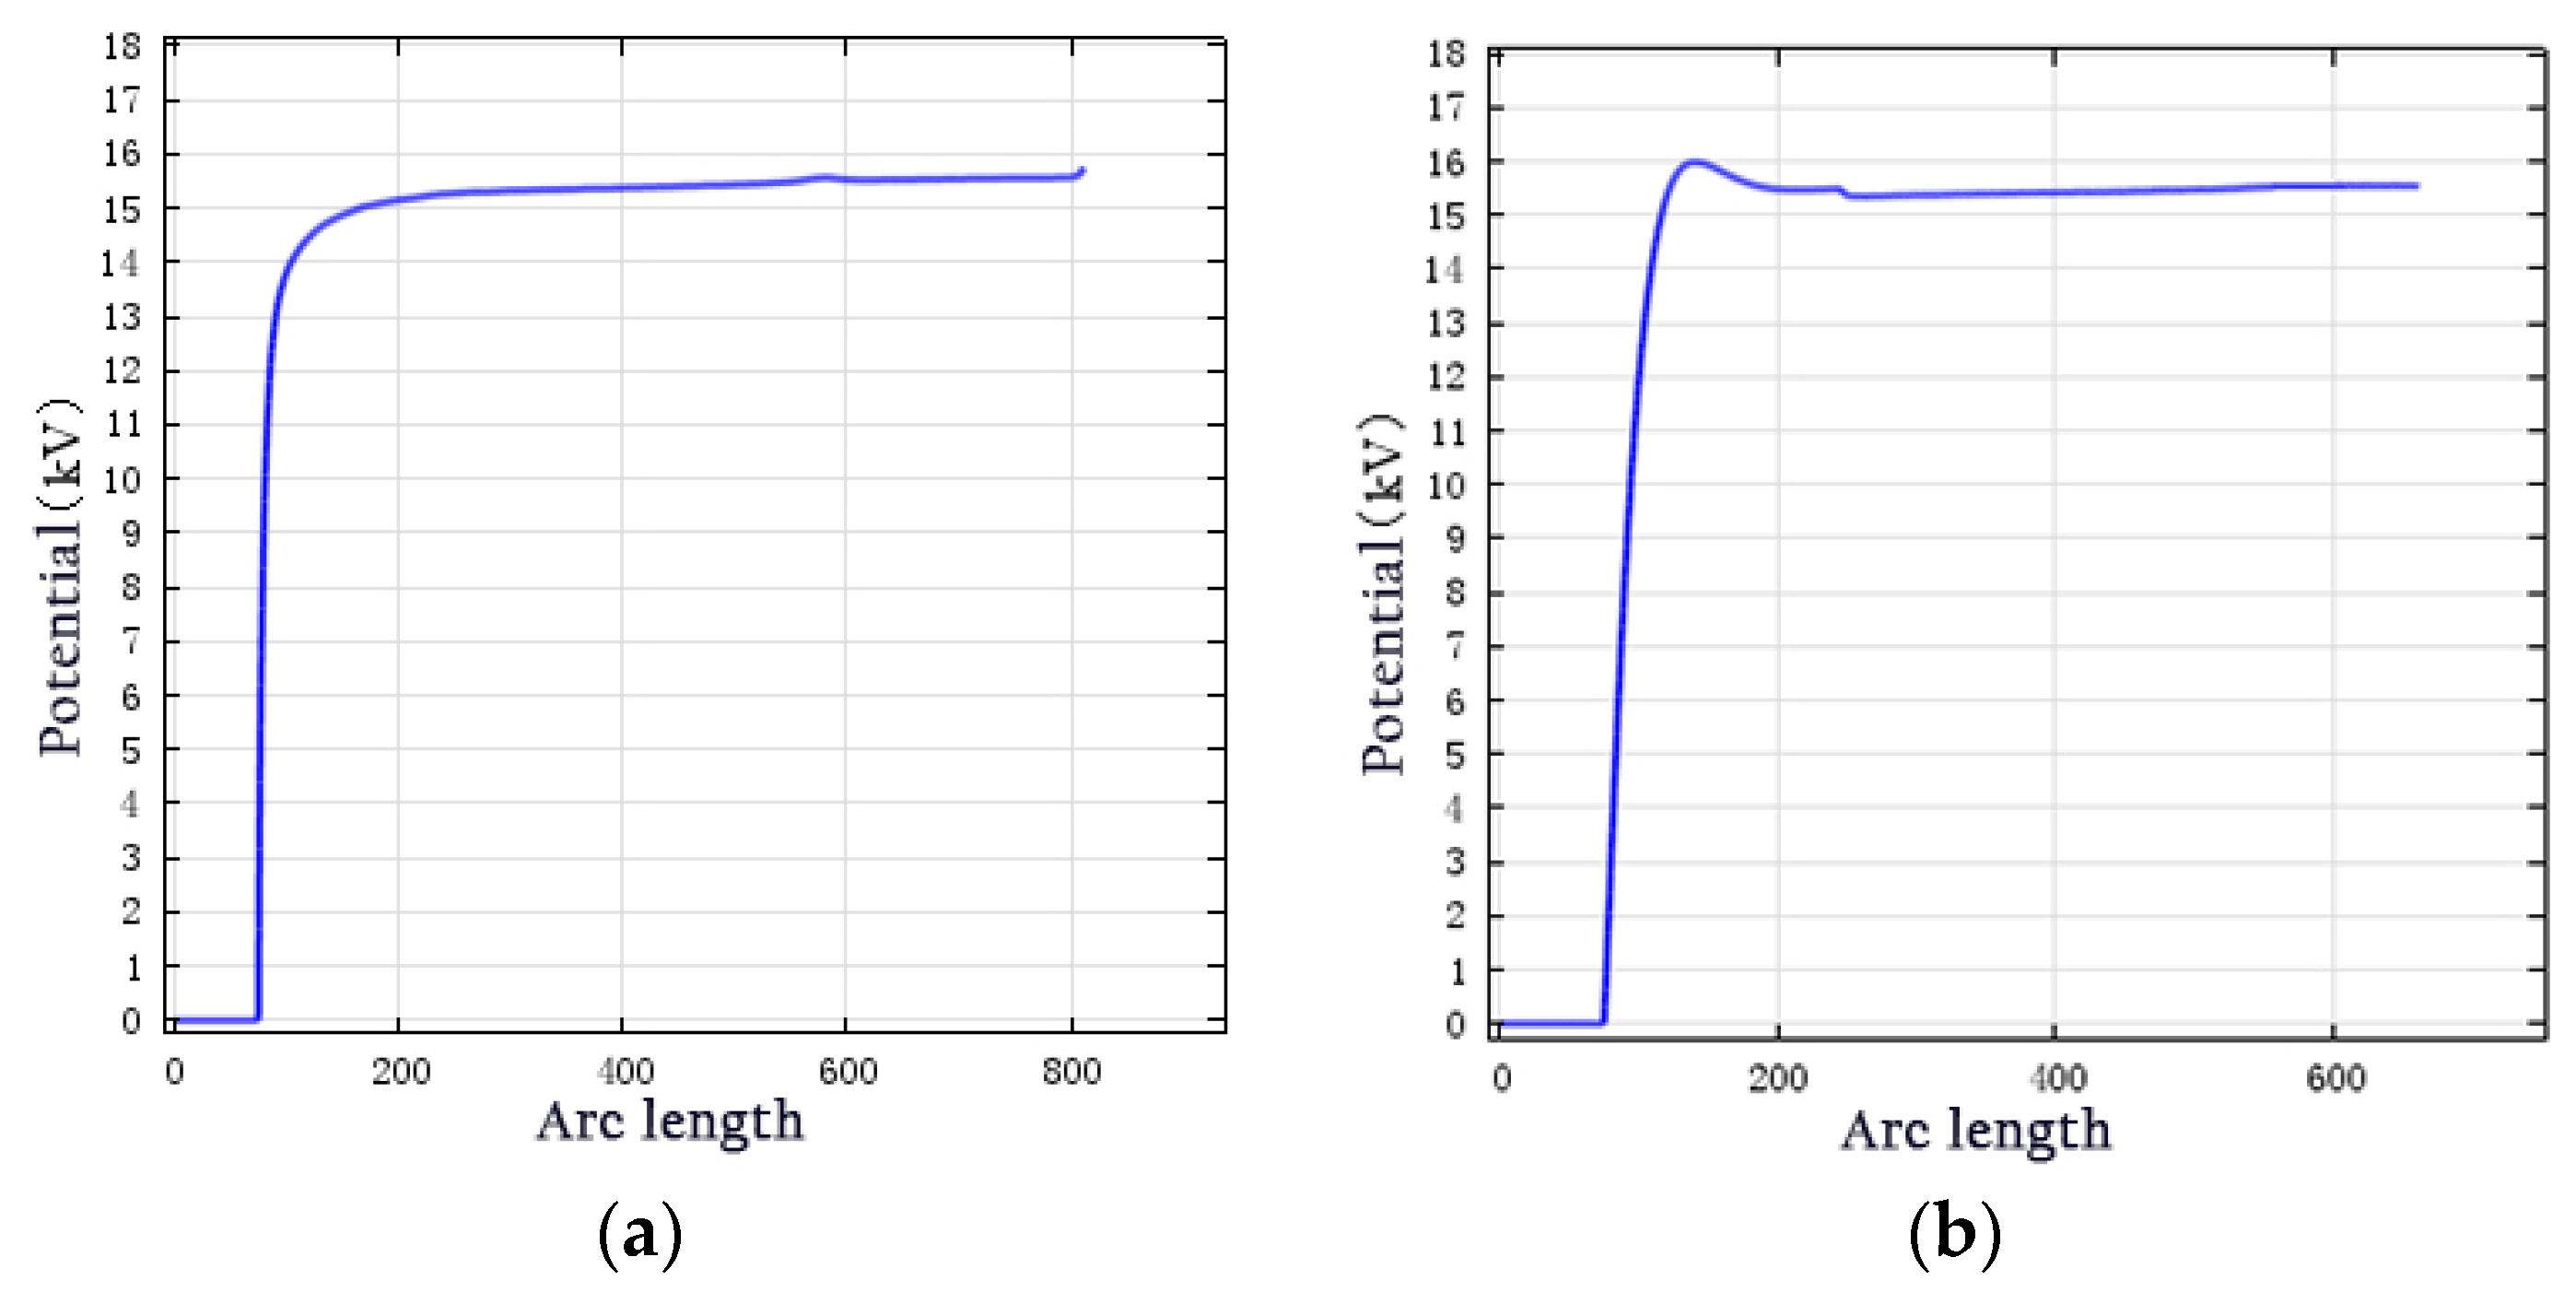
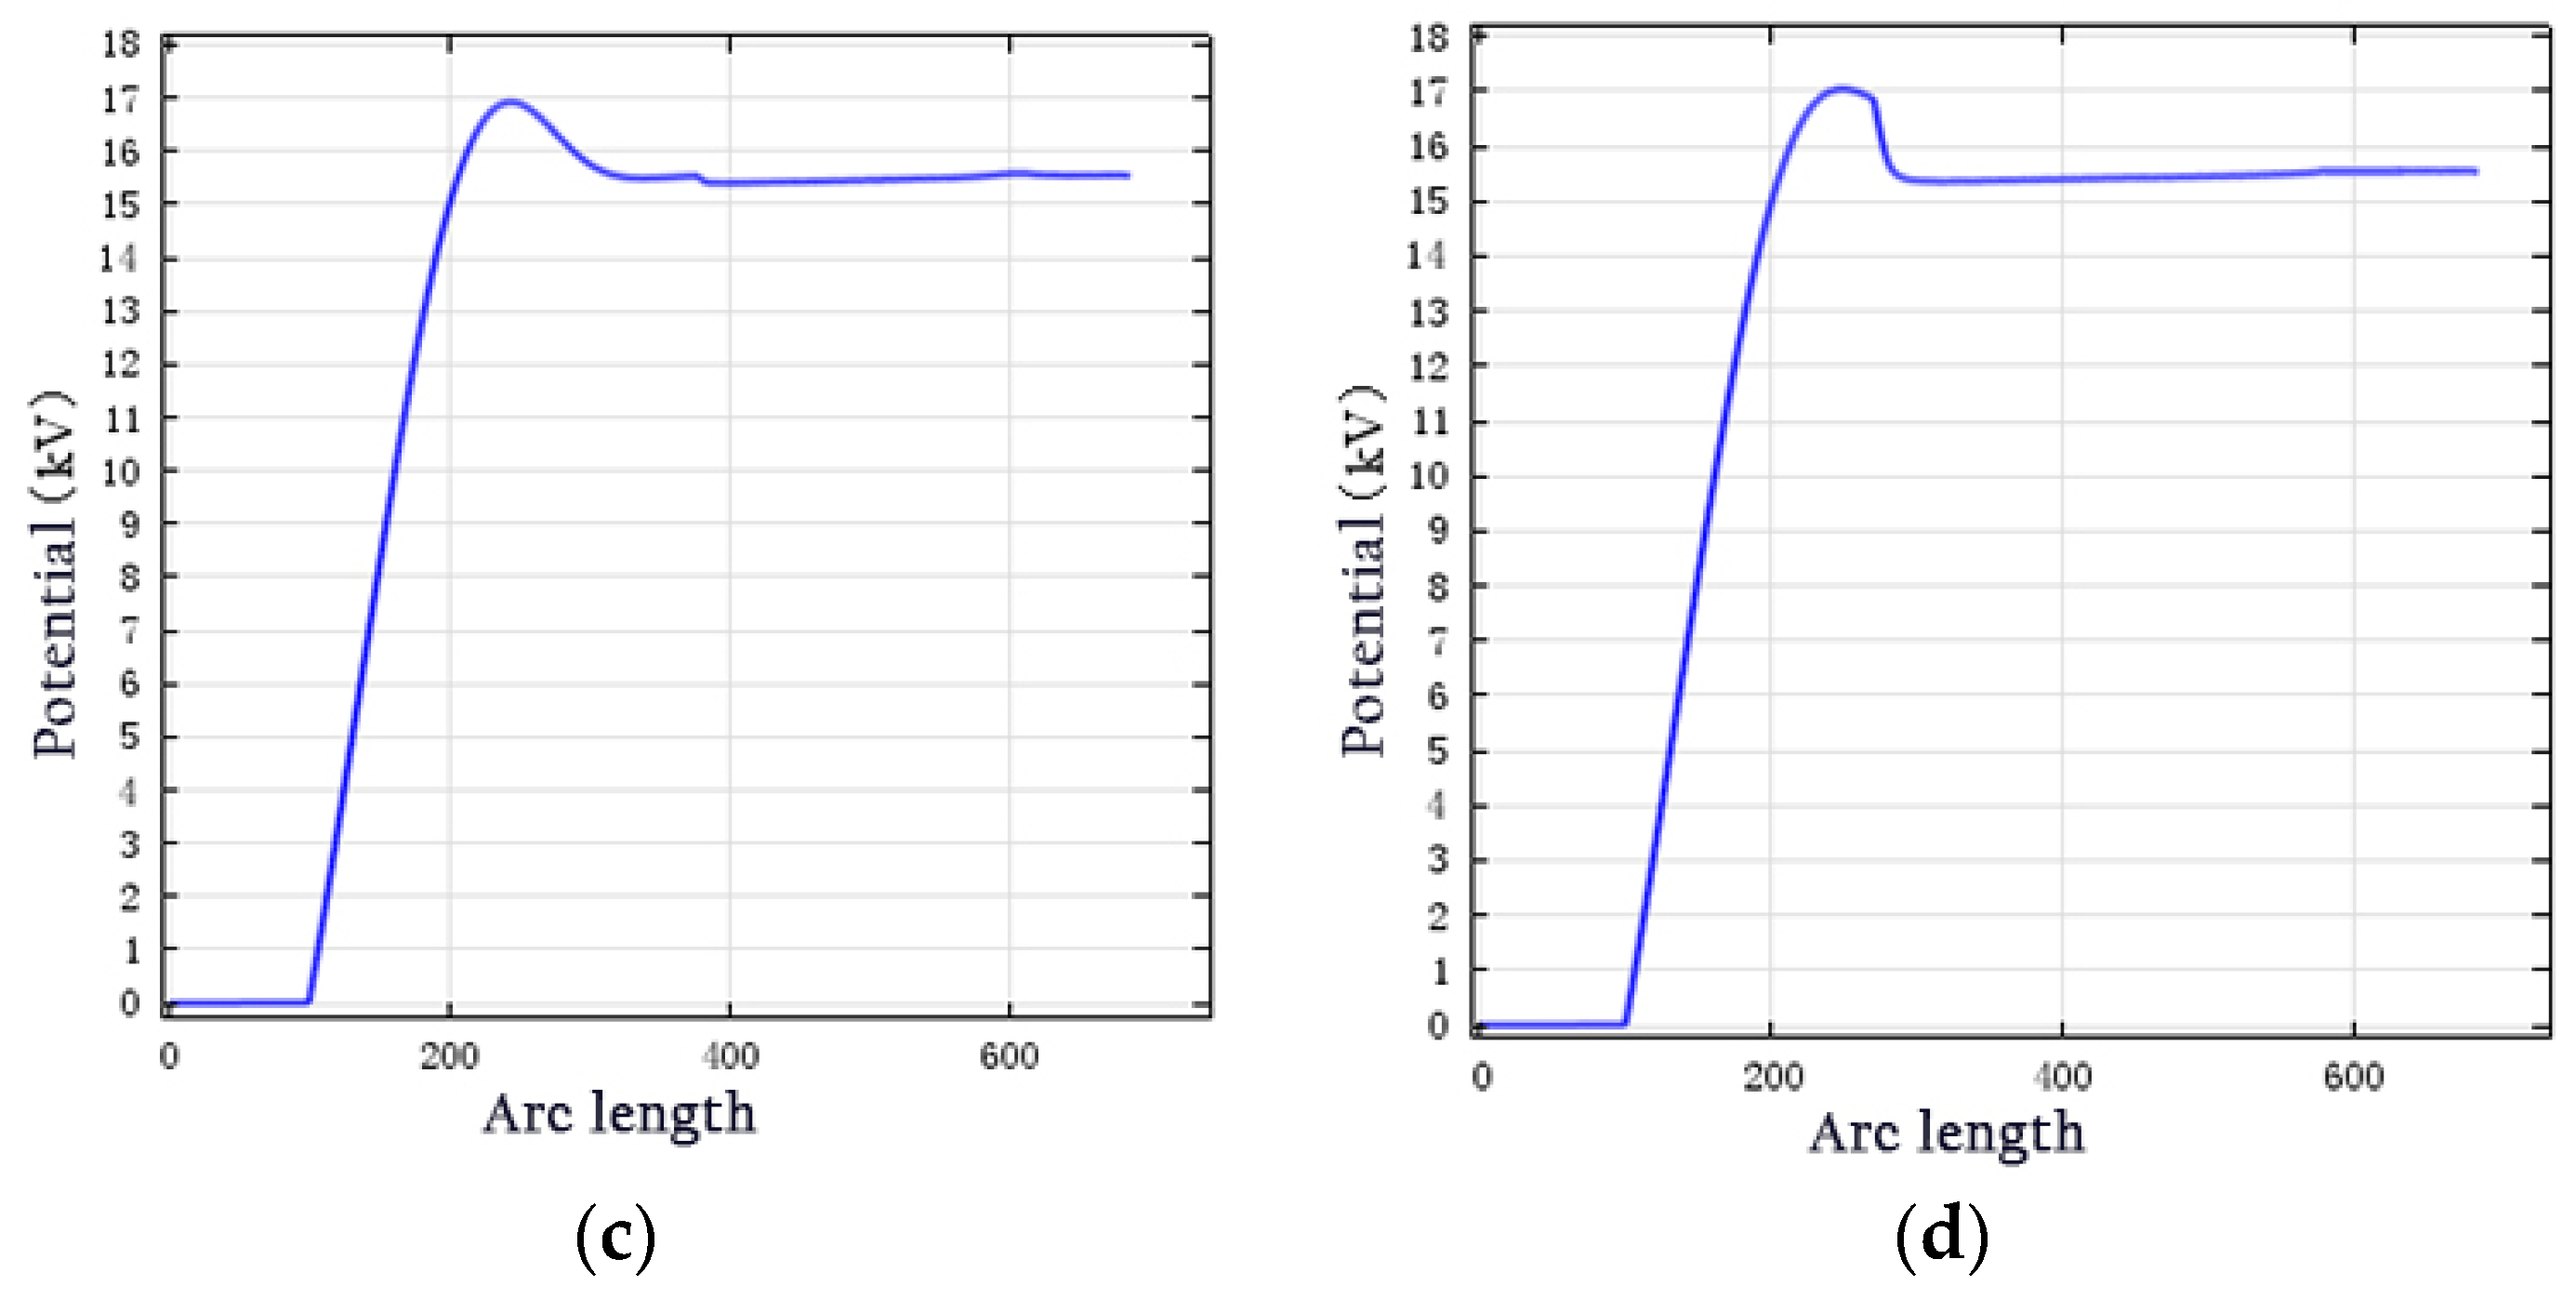
Figure 8.
Electric field distribution without anti-corona coating.
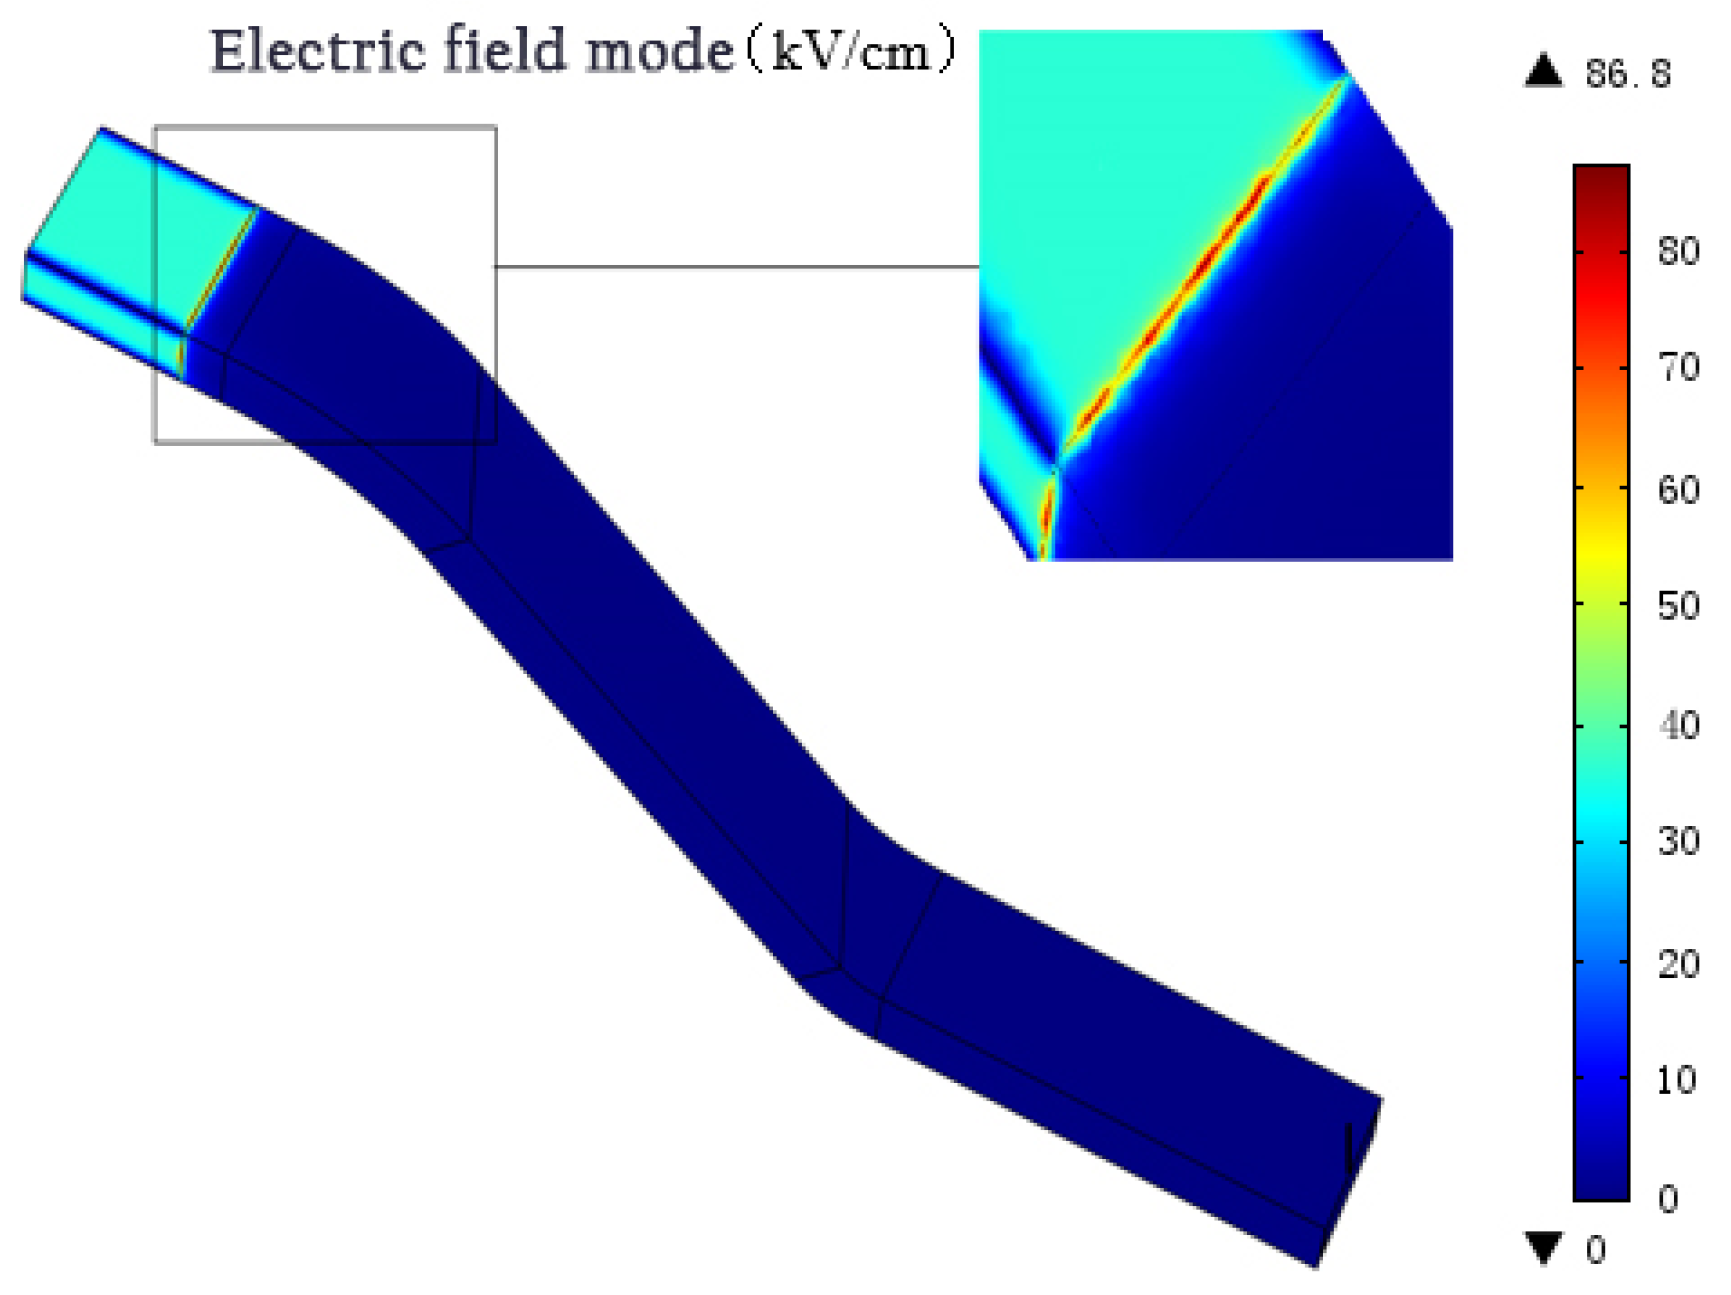
Figure 9.
Electric field distribution for linear anti-corona coating.
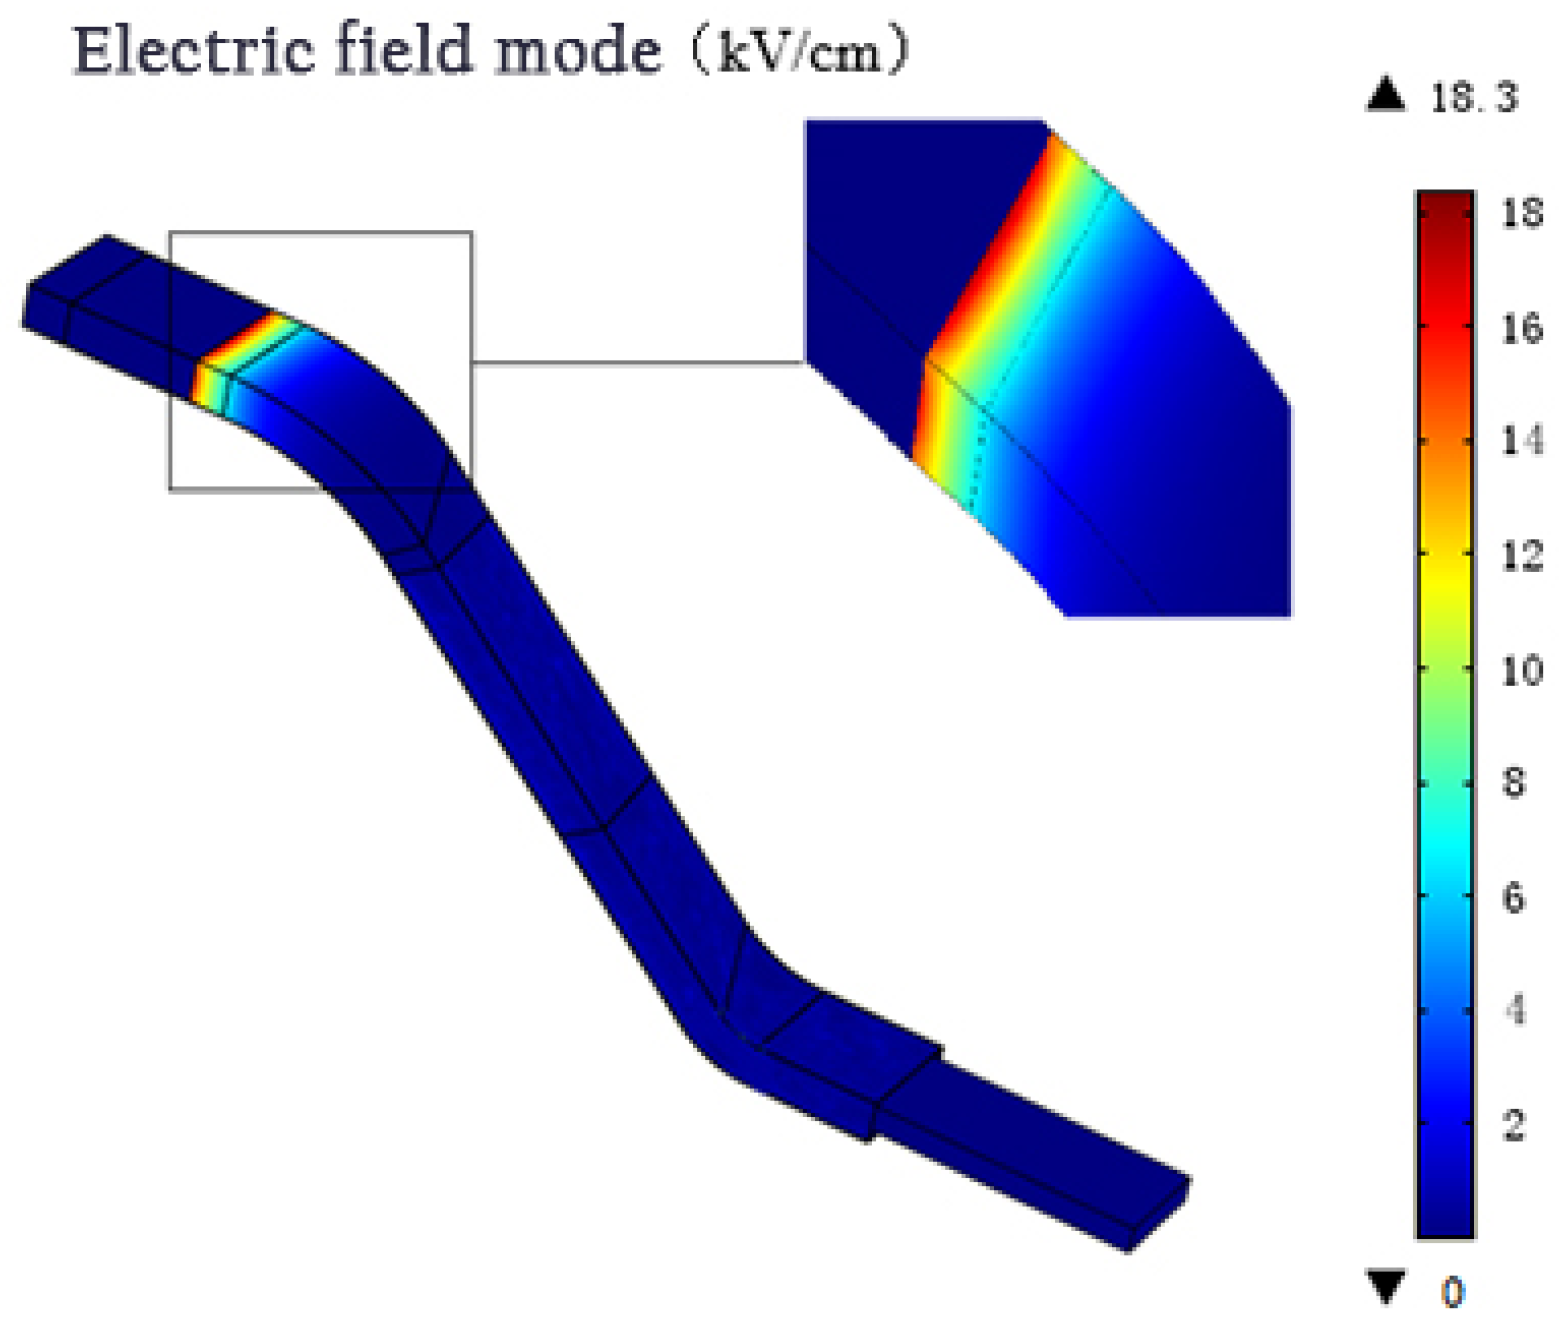
Figure 10.
Electric field distributions for the two nonlinear anti-corona coatings.

Figure 11.
Electric field distributions for the three nonlinear anti-corona coatings.
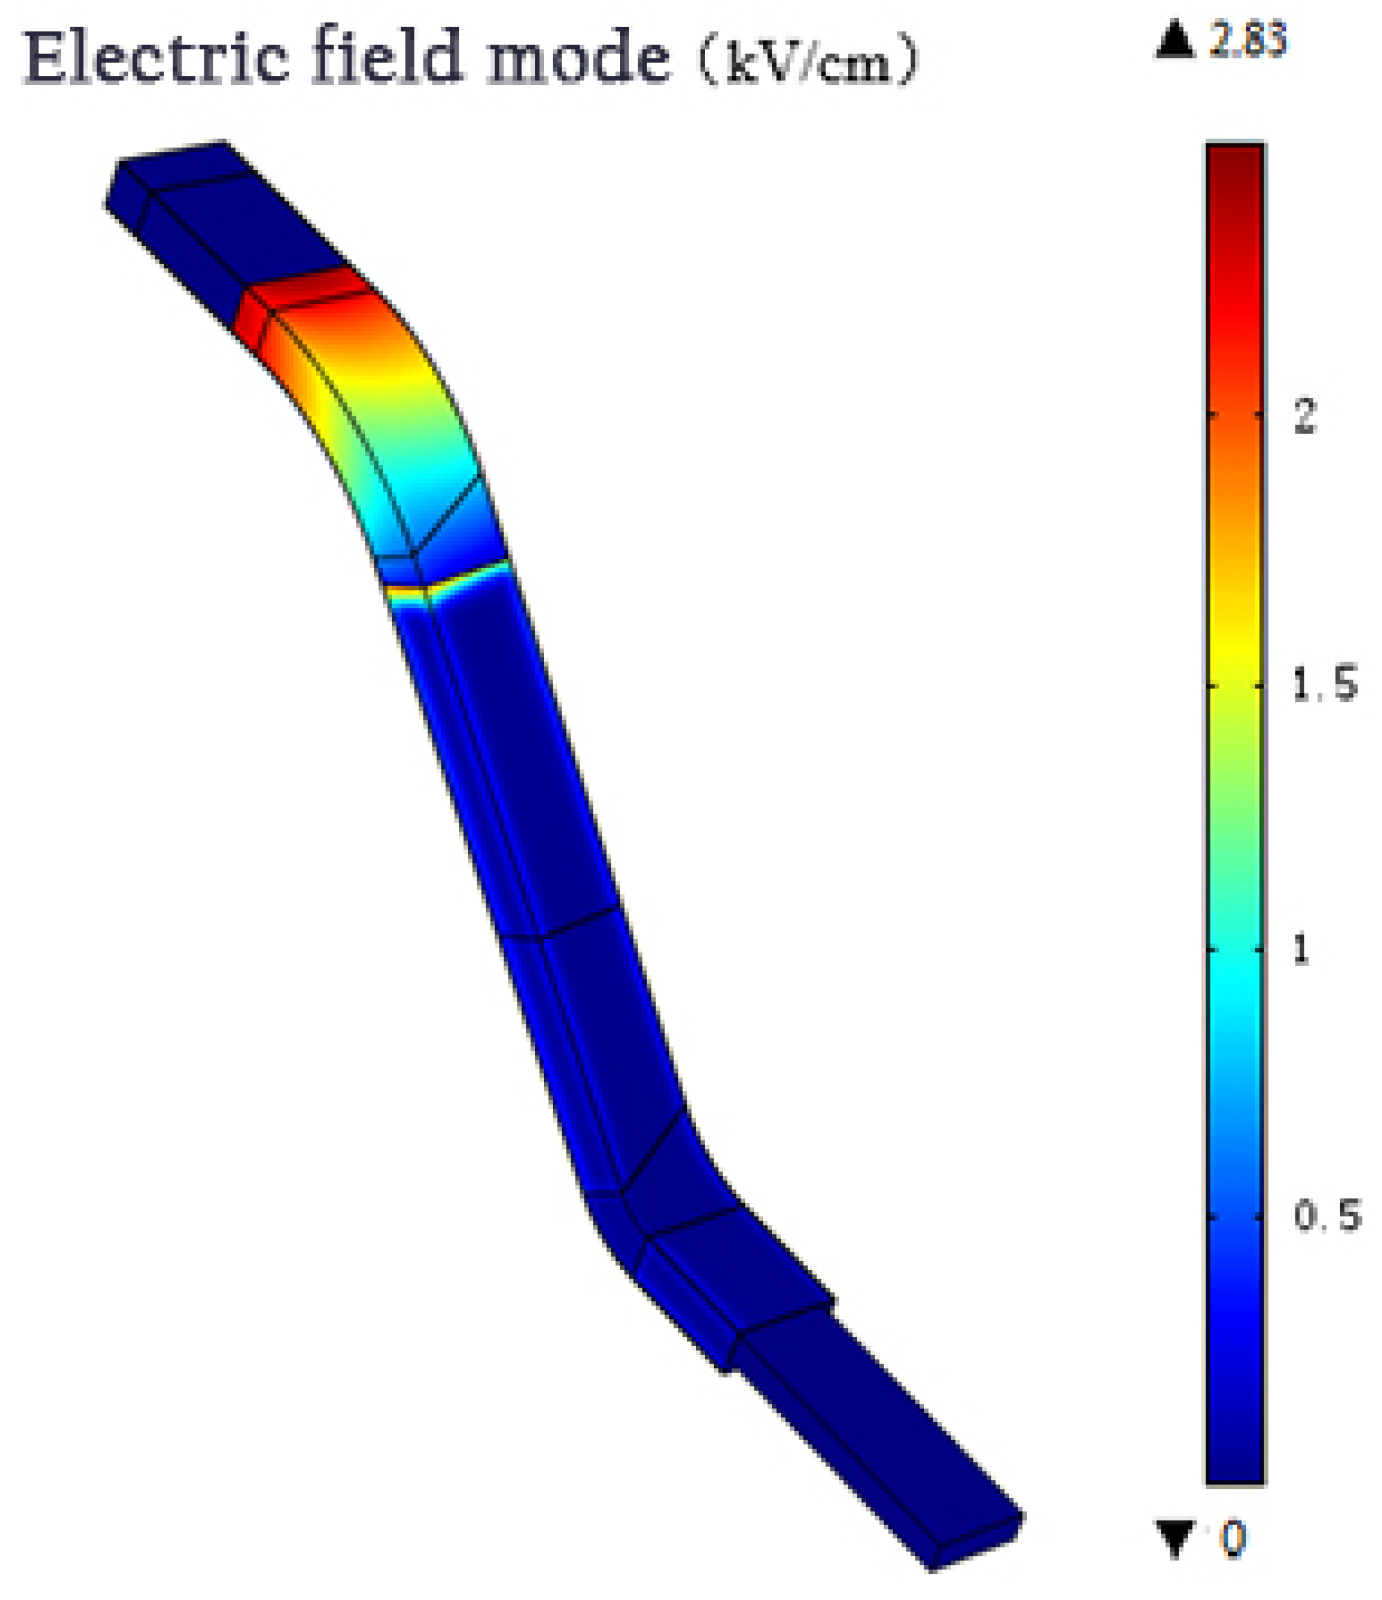
Figure 12.
1D electric field distributions for different structures.
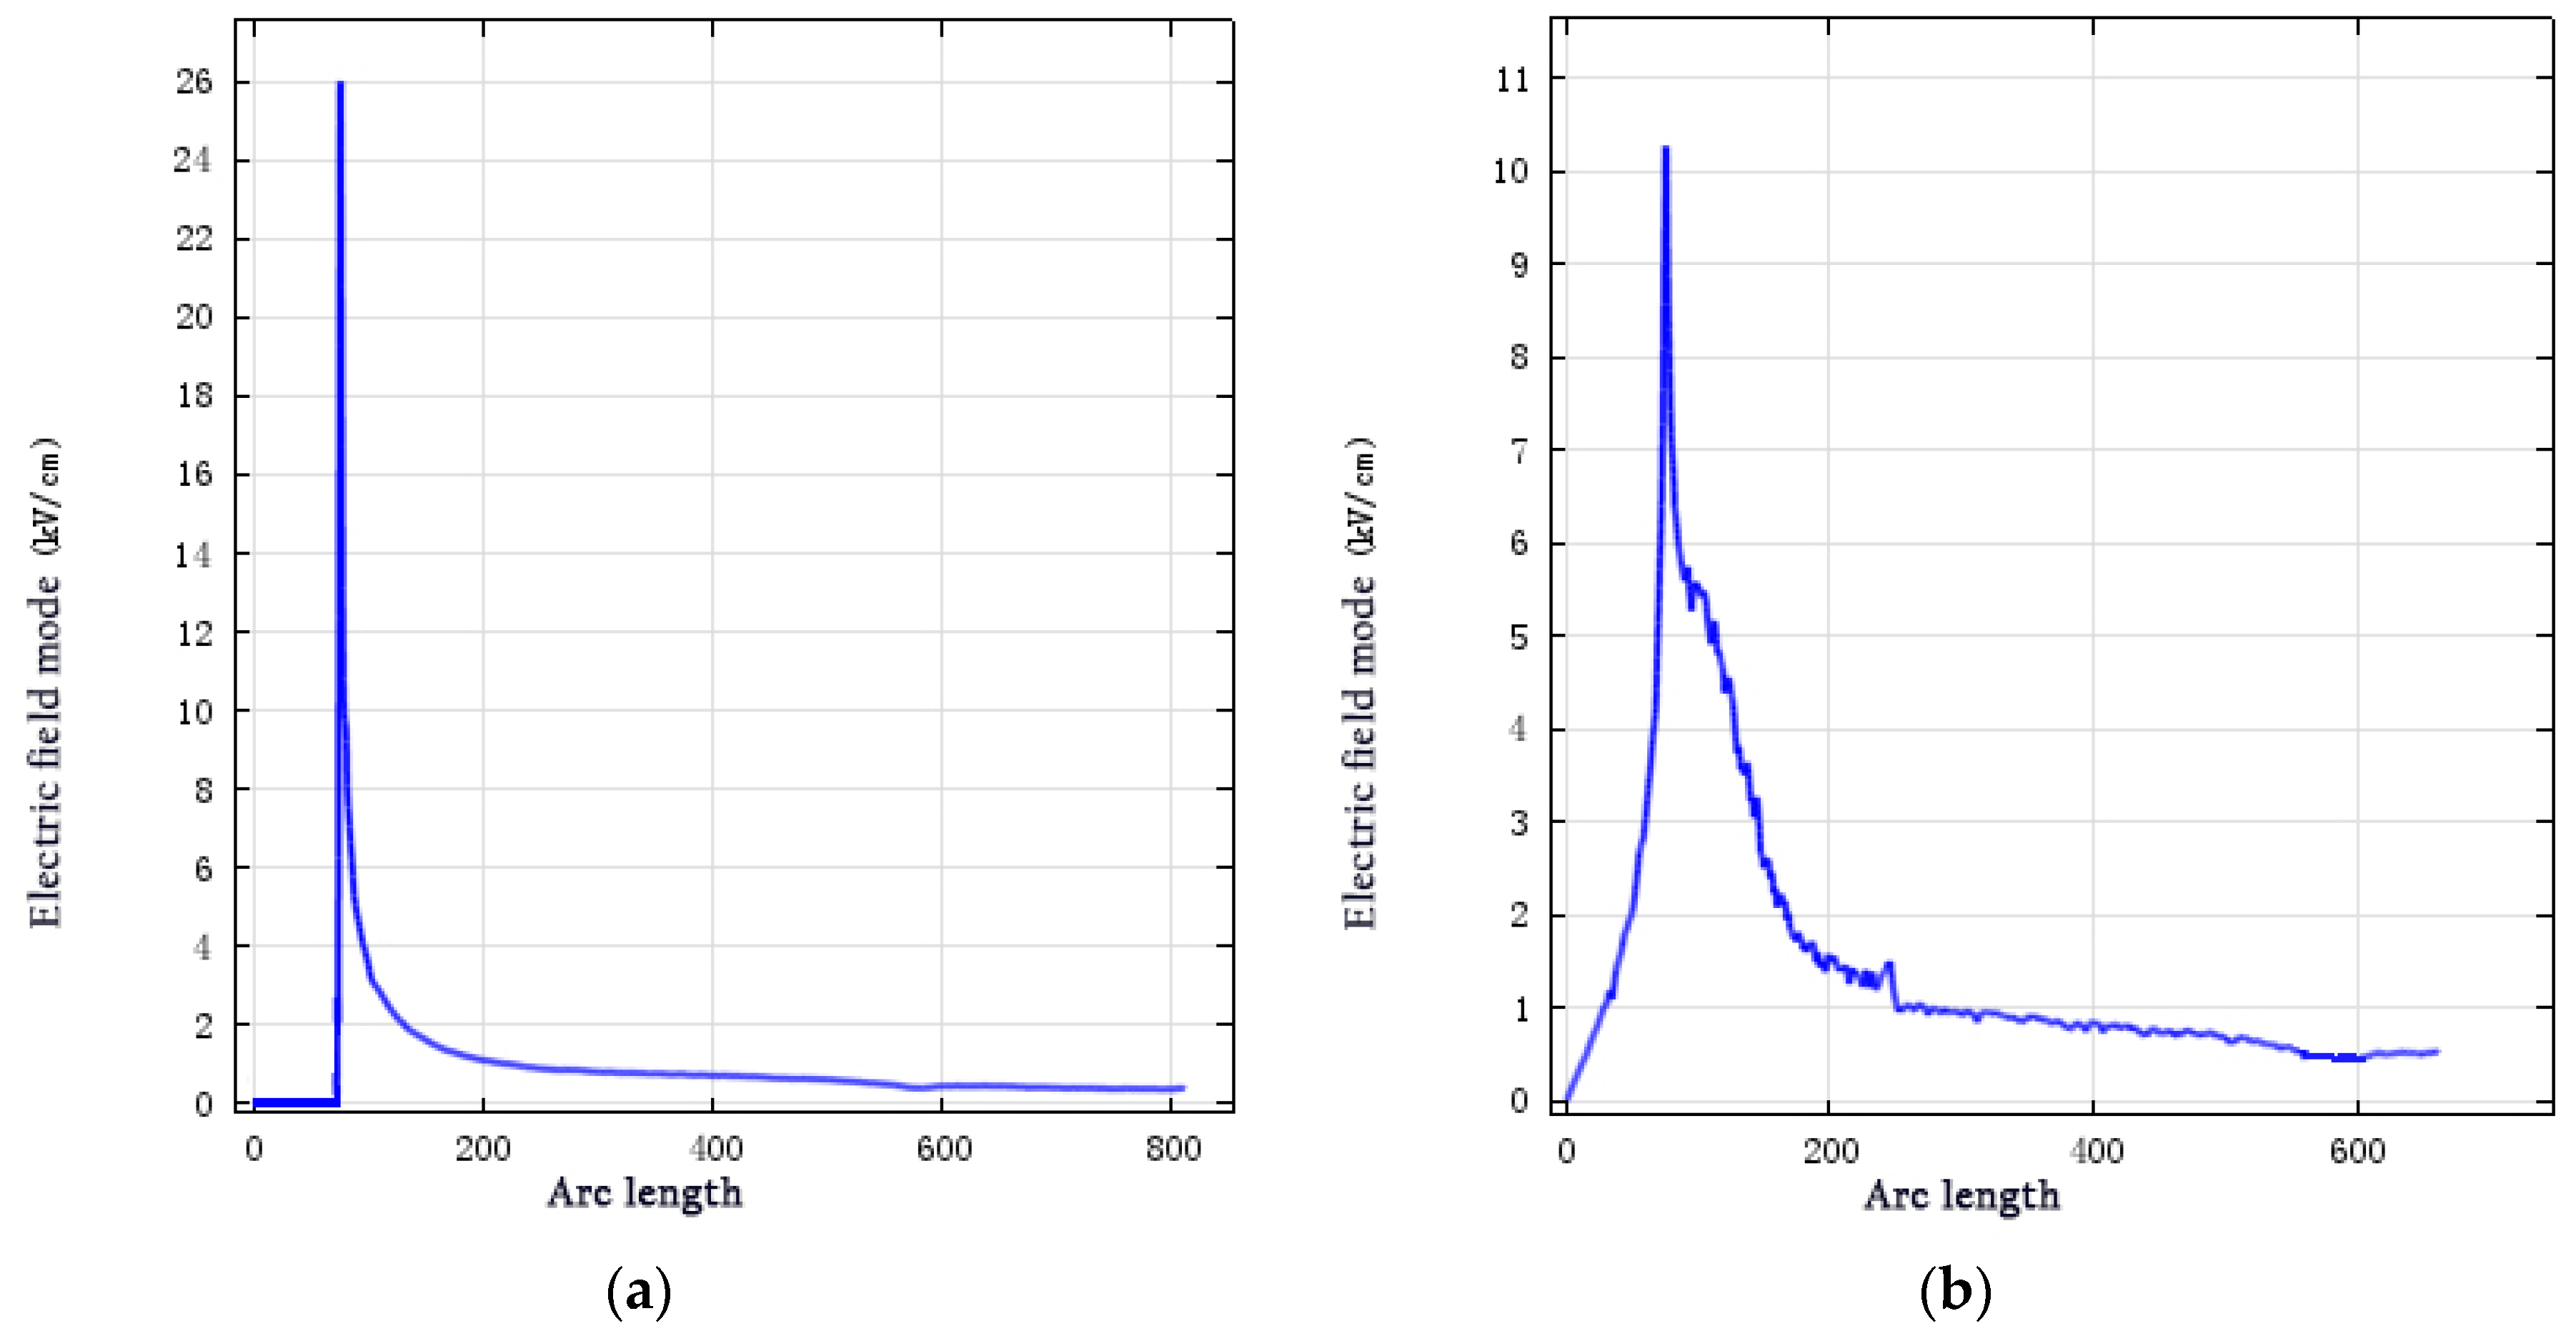
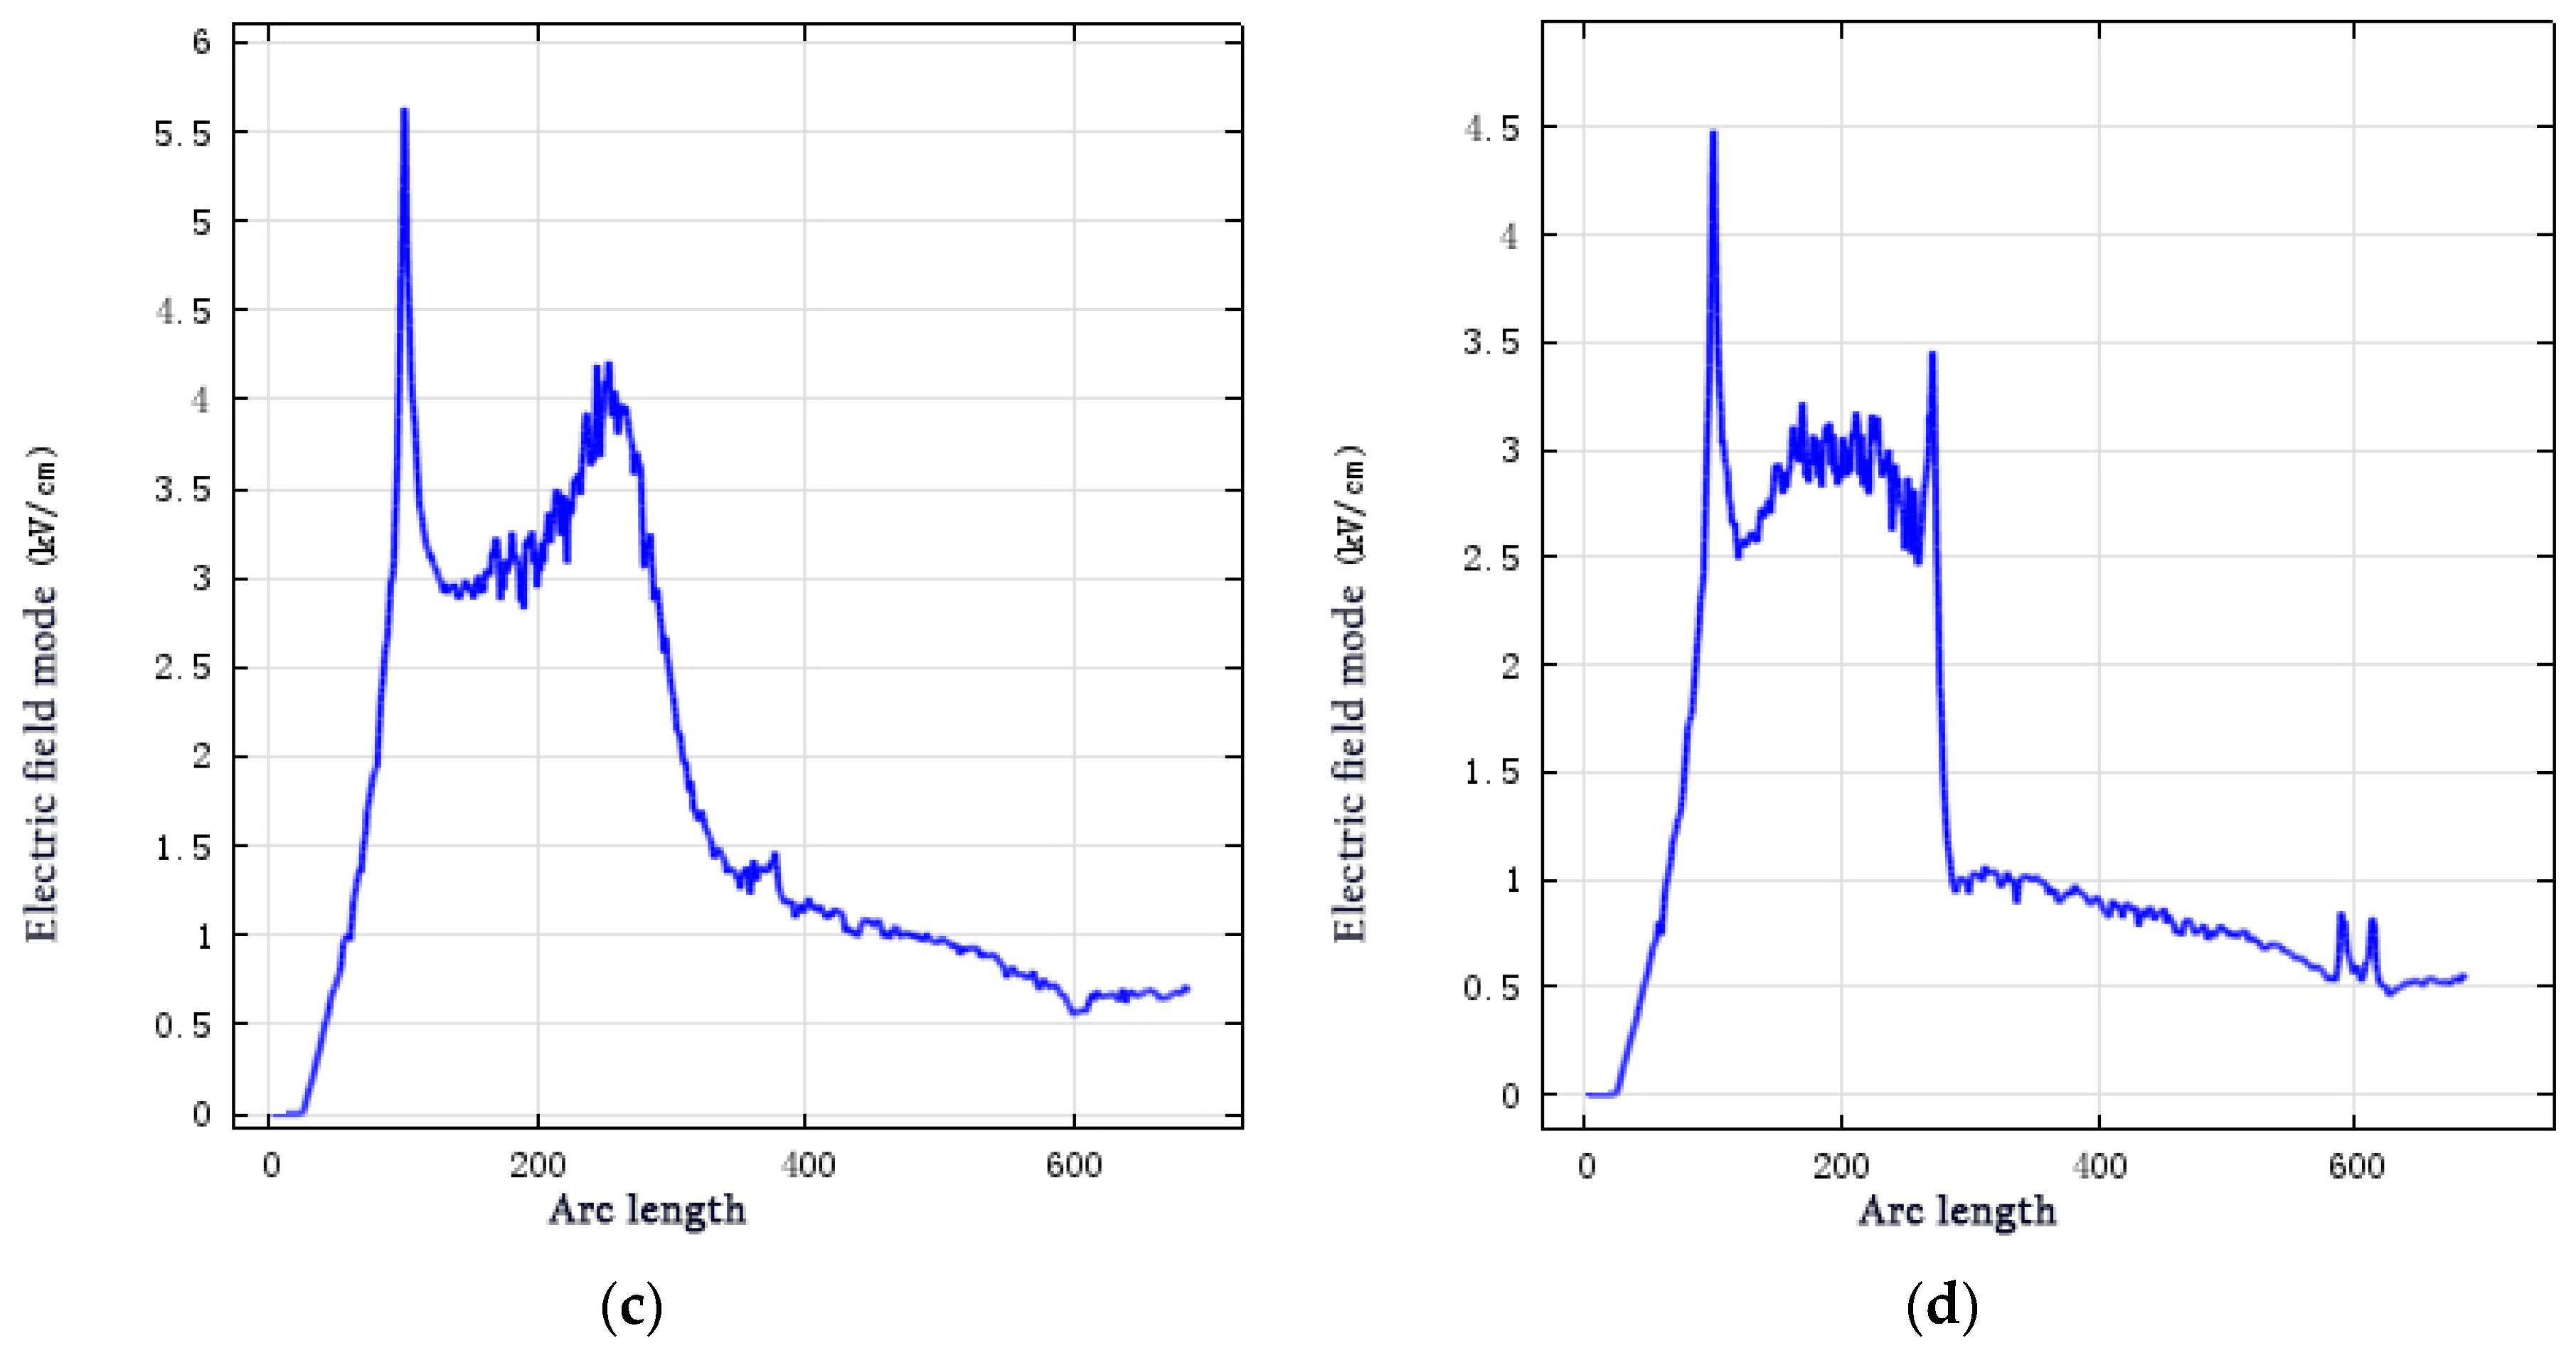
Figure 13.
Surface loss distribution without anti-corona coating.
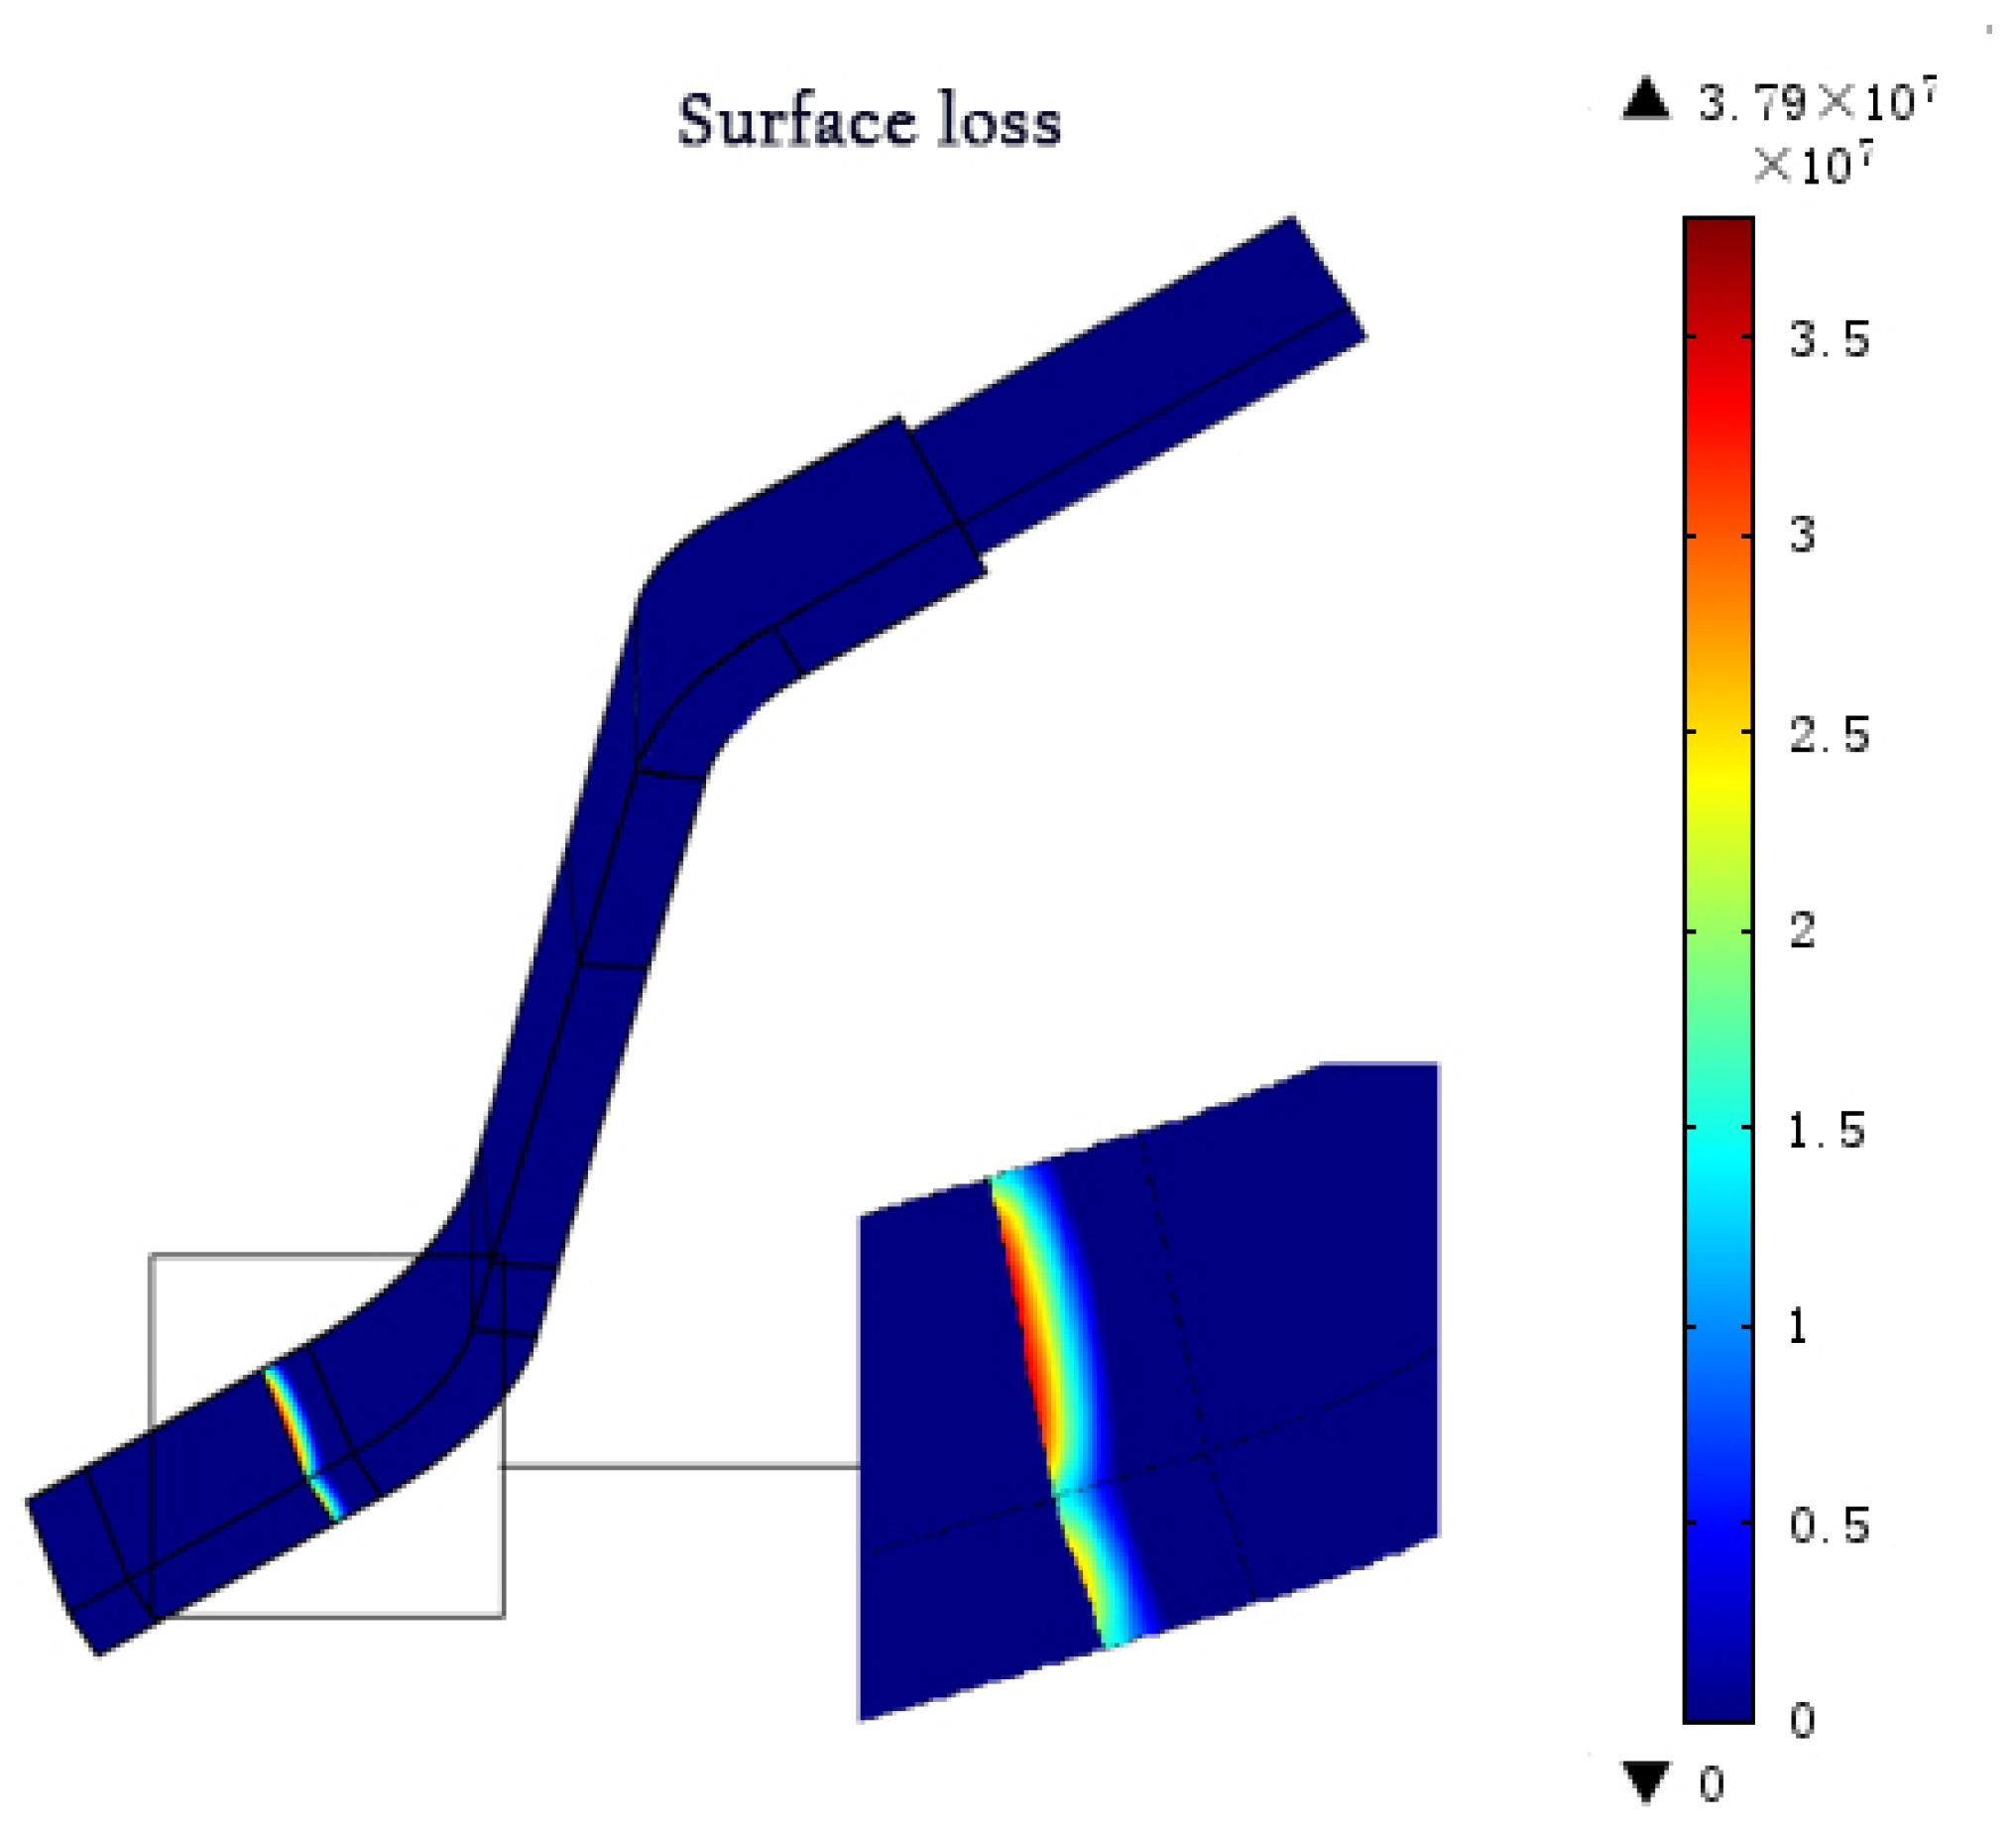
Figure 14.
Surface loss distribution with a linear anti-corona coating.
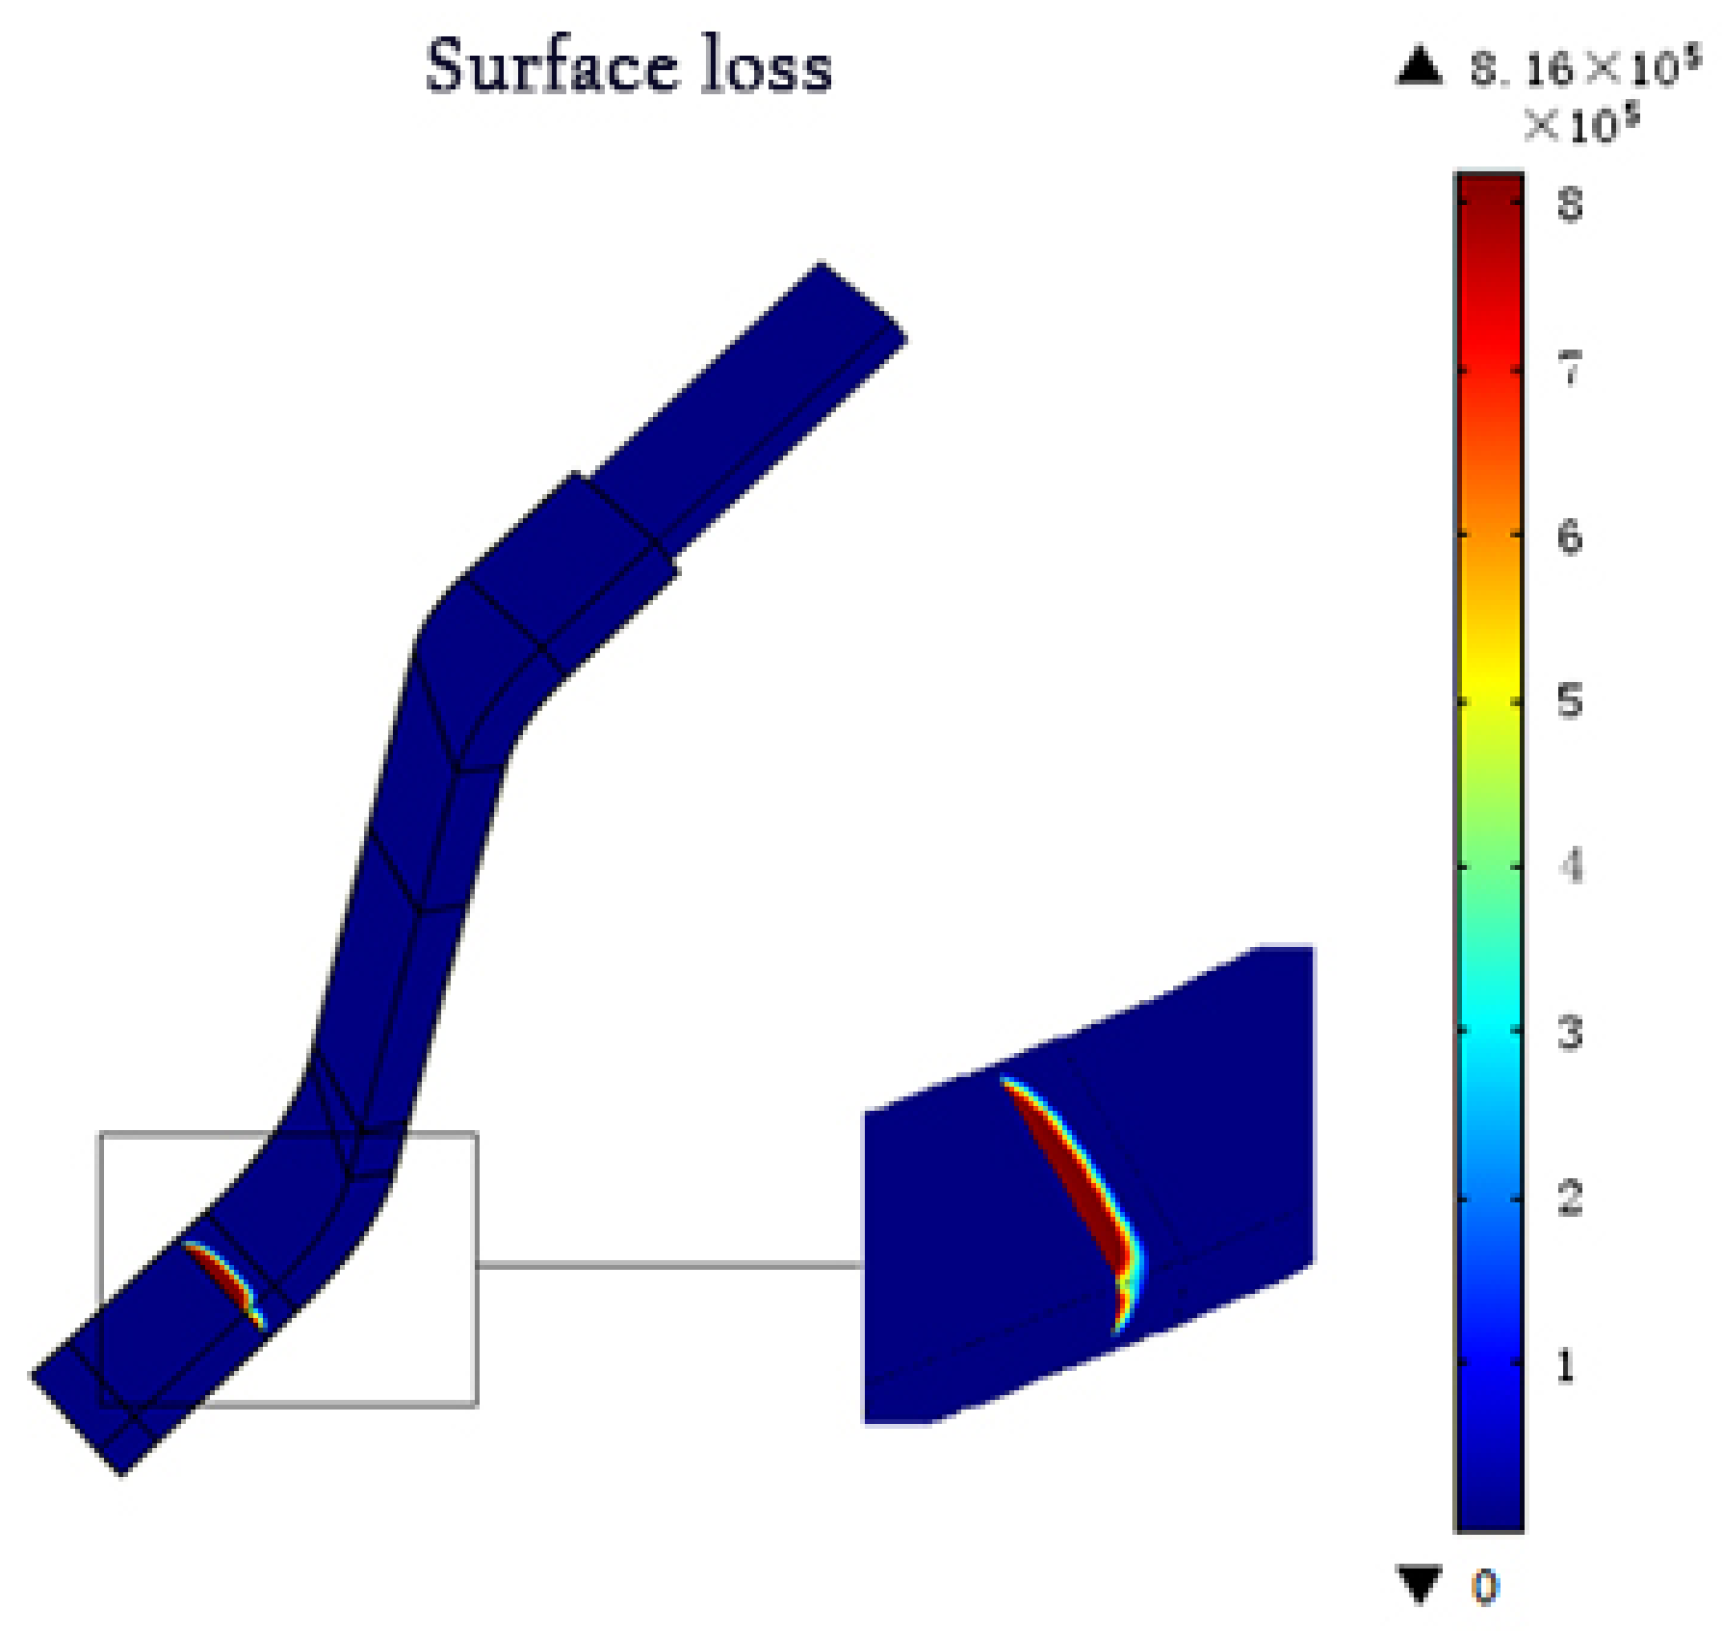
Figure 15.
Surface loss distribution with two nonlinear anti-corona coatings.
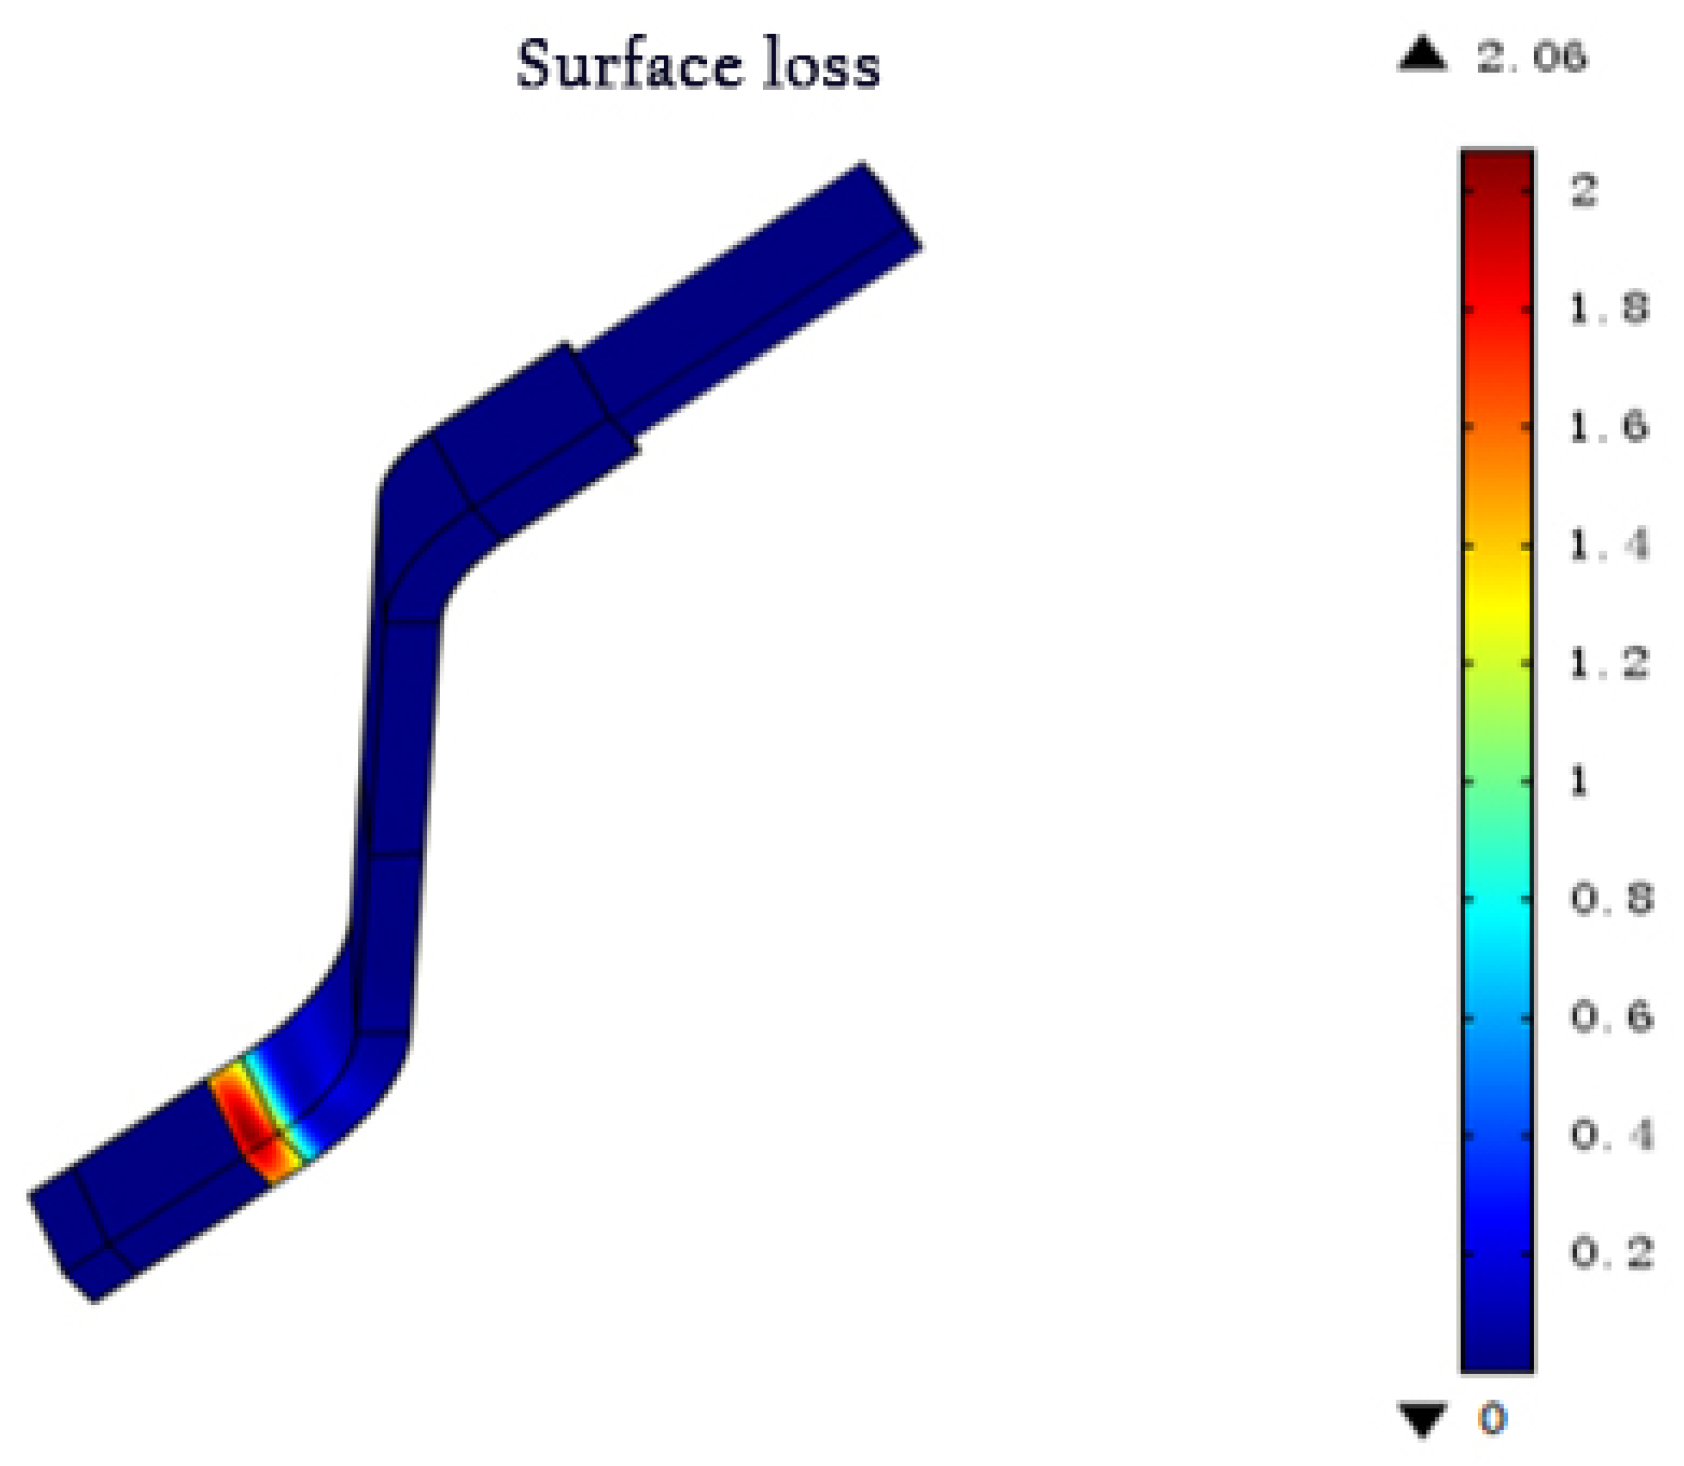
Figure 16.
Surface loss distribution with three nonlinear anti-corona coatings.
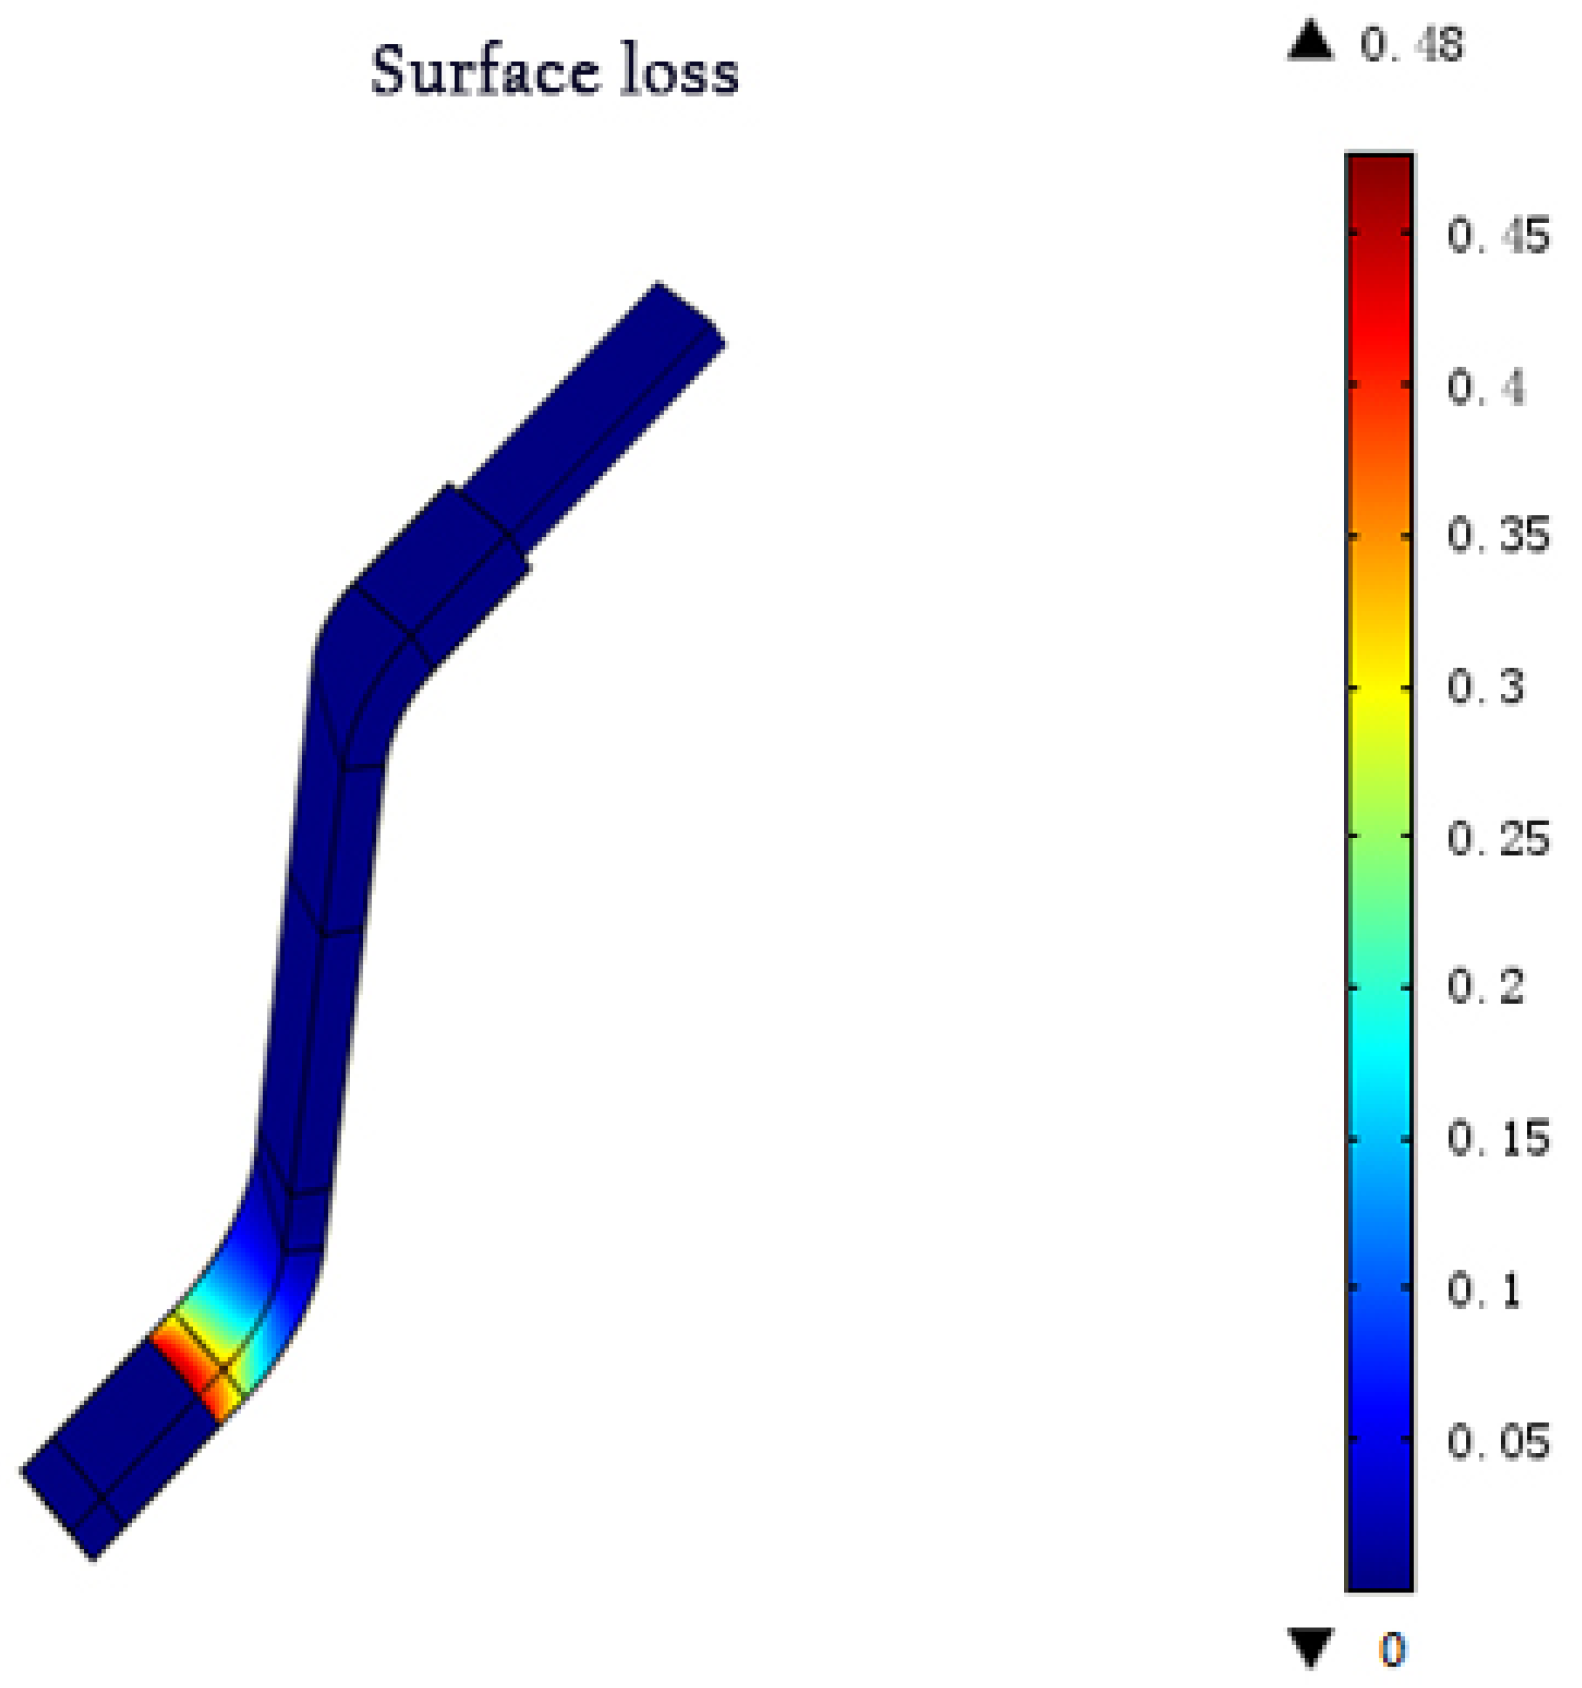

Table 1.
Main parameters of stator bar.
| Parameters | Numerical value | Parameters | Numerical value |
| Elevation at the end: α (degree) | 30 | Arc street corner degree: β (degree) | 25 |
| Copper bar width: Wc (mm) | 14.9 | Copper bar length: Lc (mm) | 63 |
| wirebar width: Wl (mm) | 340.46 | wirebar length: Hl (mm) | 629.8 |
| Main insulation thickness: d1 (mm) | 4.36 | Anti-corona coating thickness: d2 (mm) | 0.32 |
| Low resistance length: L1 (mm) | 100 | Middle resistance length: L2 (mm) | 170.48 |
| Middle and high resistance length: L3 (mm) | 183.12 | High resistance length: L4 (mm) | 232.58 |
Table 2.
Basic parameters of anti-corona structure materials.
| Materials | Relative dielectric constant | Intrinsic resistivity (Ω·m) | Nonlinear coefficient (cm/kV) |
| Iron core | 1 | 1.02 × 10⁻⁷ | |
| Copper core | 1 | 5.99 × 10⁻⁷ | |
| Air | 1 | 2 × 10-11 | |
| Main insulation | 4 | 2 × 10¹⁴ | |
| Low resistance anti-corona coating | 12 | 2 × 10⁻² | |
| Intermediate-resistance anti-corona coating | 12 | 1.25 × 10⁶ | 0.5 |
| Intermediate- and high-resistance anti-corona coating | 12 | 2 × 10⁸ | 0.7 |
| High-resistance anti-corona coating | 12 | 1 × 10¹⁰ | 0.9 |
Disclaimer/Publisher’s Note: The statements, opinions and data contained in all publications are solely those of the individual author(s) and contributor(s) and not of MDPI and/or the editor(s). MDPI and/or the editor(s) disclaim responsibility for any injury to people or property resulting from any ideas, methods, instructions or products referred to in the content. |
© 2024 by the authors. Licensee MDPI, Basel, Switzerland. This article is an open access article distributed under the terms and conditions of the Creative Commons Attribution (CC BY) license (http://creativecommons.org/licenses/by/4.0/).
Copyright: This open access article is published under a Creative Commons CC BY 4.0 license, which permit the free download, distribution, and reuse, provided that the author and preprint are cited in any reuse.


