Submitted:
23 September 2024
Posted:
25 September 2024
You are already at the latest version
Abstract
Despite the role of metabolism in breast cancer metastasis, we still cannot predict which breast tumors will progress to distal metastatic lesions or remain dormant. This work uses metabolic imaging to study breast cancer cell lines (4T1, 4T07, and 67NR) with differing metastatic potential in a 3D collagen gel bioreactor system. Within the bioreactor, hyperpolarized magnetic resonance spectroscopy (HP-MRS) is used to image lactate/pyruvate ratios, while fluorescence lifetime imaging microscopy (FLIM) of endogenous metabolites measures metabolism at the cellular scale. HP-MRS results showed no lactate peak for 67NR and a comparatively large lactate/pyruvate ratio for both 4T1 and 4T07 cell lines, suggestive of greater pyruvate utilization with greater metastatic potential. Similar patterns were observed using FLIM with significant increases in FAD intensity, redox ratio, and NAD(P)H lifetime. The lactate/pyruvate ratio was strongly correlated to NAD(P)H lifetime, consistent with the role of NADH as an electron donor for the glycolytic pathway, suggestive of an overall upregulation of metabolism (both glycolytic and oxidative), for the 4T07 and 4T1 cell lines compared to the non-metastatic 67NR cell line. These findings support a complementary role for HP-MRS and FLIM enabled by a novel collagen gel bioreactor system to investigate metastatic potential and cancer metabolism.
Keywords:
breast cancer
; metastatic potential
; metabolism
; FLIM
; MRSI
; hyperpolarized
; carbon-13
1. Introduction
Breast cancer is the second leading cause of cancer death in women in the U.S. [1] Primary breast cancer itself is not deadly; it is only when the cancer spreads to other vital parts of the body (i.e. it metastasizes) that it becomes lethal. Metastatic breast cancer tends to travel to the lungs, bones, and brain, among other areas. However, not all breast tumors are metastatic. Additionally, some tumors have a tendency to spread cells to other areas of the body, and then those cells remain dormant for a period of time (a year to several decades) before they escape from dormancy and form secondary tumors. [2,3] These are referred to here as metastatically dormant. During primary breast surgery (typically a lumpectomy or mastectomy), the sentinel axillary lymph nodes are checked and if they are found positive for cancer, then metastasis has likely occurred and additional treatment such as radiation or chemotherapy is recommended. However, many patients who are diagnosed at an early stage, with small tumors and no indication of regional lymph node metastases, can still have a high level of recurrence (>25% to 30%) after more than 10 to 15 years. [4]
Current clinical imaging methods cannot determine which breast tumors will become metastatic or metastatically dormant and which are not metastatic at all. This study utilizes a unique previously-reported in vitro platform [5] for investigating image markers of metabolism at multiple spatial scales in murine breast cancer cell lines from metastatic, metastatically dormant, and nonmetastatic breast tumors cultured in 3D collagen hydrogels mimicking the tumor extra-cellular matrix (ECM). Metabolic signatures are measured using two different methods, at the cellular scale using fluorescence lifetime imaging microscopy (FLIM) and at the whole-tumor scale using hyperpolarized (HP) [1-13C] pyruvate MR spectroscopy (HP-MRS). By imaging metabolism at multiple scales and within an ECM that mimics the tumor micro-environment, we are able to compare signatures at both the cellular level (microscopy) and the clinical level (noninvasive whole-sample imaging).
Normal tissues in the presence of oxygen prefer oxidative phosphorylation to metabolize glucose to pyruvate by glycolysis, and most of this pyruvate is then oxidized to CO2 in the mitochondria via the tricarboxylic acid cycle. However, in the absence of oxygen, cells normally undergo anaerobic glycolysis where most of the pyruvate generated by glycolysis is converted to lactate. However, cancer cells are known to undergo aerobic glycolysis and convert most glucose to lactate whether or not oxygen is present, a phenomena first discovered by Otto Warburg and termed the Warburg Effect. [6,7] HP [1-13C] pyruvate has been used in several tumor models including sarcoma, glioblastoma, lymphoma, and prostate demonstrating elevated levels of lactate in the tumor regions compared to normal tissue. [8,9] Conversion between pyruvate and lactate occurs by the reaction
facilitated by lactate dehydrogenase (LDH). The ratio of lactate-to-pyruvate in vivo has been used as a surrogate measure of metabolism along the glycolysis pathway and to calculate the cytosolic ratio of the oxidized to reduced form ([NAD+]/[NADH]) of nicotinamide adenine dinucleotide (NADH). [10]
pyruvate + NADH + H+ ⟺ lactate + NAD+
The rate of 13C-label exchange between the injected pyruvate and the endogenous lactate pool will be influenced by delivery of pyruvate to the tissue via perfusion, expression of LDH and the monocarboxylate transporters (MCTs) that move pyruvate into the cytosol, and the intracellular concentrations of pyruvate and lactate and the coenzymes NADH and NAD+; all of which will determine the activity of LDH in the cell [11]. Specific to breast cancer, the factors influencing the lactate/pyruvate ratio appear to vary by tumor type. For example, hyperpolarized 13C-labelled pyruvate MRS studies of T47D (Luminal A) human breast cancer cells showed that MCT1 was rate-limiting [12], whereas in two murine breast cancer models, lactate labeling was correlated with total LDH activity in the tumor but not MCT1 expression [13]. In experiments on cells from tumors with differing malignancies, triple-negative breast cancer cells (MDA-MB-231) showed lower lactate labeling than hormone receptor-positive cells (MCF-7 cells) [14]. Lactate labeling in these cells was shown not to depend on MCT or LDH expression but on the glucose and glutamine concentrations in the cell media. In a similar comparison of highly metastatic (4T1) and metastatically dormant murine breast cancer models (4T07), lactate labeling was slightly (but not significantly) higher in the highly metastatic model [13]. The complexity of these findings speaks to the need for an improved understanding of breast cancer cell metabolism and the impact of the multiple influences on measured hyperpolarized 13C-labelled pyruvate MRS and magnetic resonance spectroscopic imaging (MRSI) in the translational setting.
Advances in multiphoton microscopy (MPM) also enable interrogation of the breast tumor microenvironment and metabolism at the cellular scale. [15] Both the fluorescence intensity and the temporal decay of fluorescence are used in FLIM. MPM has been used to image endogenous fluorophores in breast tissue including tryptophan, flavin adenine dinucleotide (FAD), NADH and Nicotinamide Adenine Dinucleotide Phosphate (NADPH) – hereafter NAD(P)H since the two forms cannot be distinguished with endogenous fluorescence - as well as endogenous second harmonic generation (SHG) signals from fibrillar collagen. [16] Longer FAD and NAD(P)H lifetimes, i.e. the time for the fluorophore to return to its ground state after excitation, indicated the presence of ductal carcinoma in situ in fixed histopathological sections of human breast tissue. [17] The metabolic basis for these findings is that FAD acts as an electron carrier in the production of ATP through oxidative phosphorylation, while NADH carries electrons in the production of ATP during glycolysis. The intensity and time decay of both molecules are sensitive to the immediate chemical environment due to their concentration and fluorophore enzymatic states with longer decay attributed to the enzymatically bound fractions. Since NAD(P)H and FAD each represent a different redox state, quantification of their intensity ratio is a surrogate of cell and tissue chemical redox condition. Concentration based redox ratios have been used to differentiate normal from cancerous tissue as well as levels of cancer progression and response to treatment. [18,19,20,21,22,23,24,25,26,27]
In this study, we combine the HP-MRS and FLIM methods using a novel bioreactor design that is compatible with optical microscopy and MRS to analyze the metabolism of murine breast cancer cell lines in 3D collagen cell cultures [5]. The main hypothesis of this work is that controlled studies with HP-MRS will show differences in lactate/pyruvate ratio with breast cancer metastatic potential of the cell lines. A secondary hypothesis is that independent measures of cellular-scale FAD and NAD(P)H intensities and lifetimes using FLIM will correlate with metastatic potential and lactate/pyruvate ratio measured with HP pyruvate MRS, thus providing a complementary assay that can facilitate interpretation and translation of these methods to the understanding of metabolism in clinical breast cancer studies.
2. Methods
2.1. Cell Culture in the Bioreactor
Consisted of highly metastatic (4T1), metastatic-dormant (4T07) and non-metastatic (67NR) murine breast tumor cell lines, previously characterized by Miller et. al. [28], which were purchased from ATCC. The cells were cultured in RPMI 1640 media with 10% fetal bovine serum at 37 °C with 5% CO2 in a 3D collagen gel bioreactor system. The 3D Bioreactor System was designed for both FLIM and HP-MRS as shown in Figure 1. [5] A detailed description of the bioreactor design is provided in reference 5. Briefly, the MR-compatible device contained an optical window to enable sequential imaging of the same collagen gel using multiphoton FLIM and HP-MRS. The bioreactor contains ports for temperature monitoring, injection of contrast agents, and heated water flow for temperature control.
For all experiments, cells were cultured in 3D collagen gels (1.5 mL) prepared on the day of imaging at a concentration of 8 million cells/gel with a final gel concentration of 2 mg/mL. [29] FLIM and HP-MRS were performed in the same gels, in the same imaging day. The collagen gels were prepared and polymerized directly in the bioreactor chamber and 9 gels (3 of each of the 4T1, 4T07, and 67NR cell lines) were imaged sequentially FLIM and HP-MRS in the same day.
2.2. Fluorescence Lifetime Imaging Microscopy
Was performed at the microscale using a custom built MPM. The laser illumination was provided by a wavelength tunable Mai-Tai Deep See Ti:Sapphire laser (Spectra Physics, Palo Alto, CA) tuned to 740 nm (with a 450/70 nm filter) to image NAD(P)H and 890 nm (with a 562/40 nm filter) to image FAD. Photons were detected by a Gallium Arsenide Phosphide photomultiplier tube H7422P-40 (GaAsP-PMT; Hamamatsu Photonics, Hamamatsu, Japan). WiscScan software (LOCI, UW-Madison) was used to drive the scanning and data acquisition. Time correlated single photon counting (TCSPC) was performed using an SPC-830 photon counting board with DC-100 control electronics (Becker and Hickl, Berlin, Germany). Each fluorescence lifetime image was collected for 150 seconds using a 20x VC air objective (Nikon).
Free and bound NAD(P)H can be separately imaged by FLIM. [30] For each FLIM imaging session, three measurements were collected at different locations within the gel and averaged, and one HP-MRS measurement was collected for the entire gel. The FLIM data was fitted and analyzed using SPC Image (Becker and Hickl). The lifetime data was analyzed using SPCImage software to generate color maps of the weighted average of the parameter of interest (τm, τ1, τ2, α1, α2) fit to a two-term exponential model. [30] The average lifetime component (τ mean, or τm) is calculated by τm = α1×τ1 + α2×τ2 where τ1 and τ2 are the short and long lifetime components, respectively and α1 and α2 are the fractional contribution of each lifetime component (Figure 2). In this work, the redox ratio is calculated from the intensity data as FAD/(FAD+NAD(P)H).
2.3. Hyperpolarized Pyruvate MRS
Dynamic nuclear polarization (DNP) was used to transfer polarization from electron spins of paramagnetic centers in a glassy frozen solution to neighboring nuclear spins [31]. The 13C labeled compound (>99% neat [1- 13C]-Pyruvic Acid (PA)) was mixed with a free radical in a glassing solvent to produce an amorphous solid when cooled to ~ 1K inside a 3.35T magnet. PA is commonly used for HP MR by dissolution DNP because it is a highly concentrated, self-glassy compound, and has a long T1 relaxation time [32]. Specifically, thirty µL of [1- 13C] PA (Cambridge Isotope Laboratories Inc., Tewksbury, MA) and 15 mM trityl radical (Ox063, GE Healthcare) were polarized at 1.4 K in a Hypersense polarizer (Oxford Instruments) for ~1 hour. A total of 4 mL of solvent containing 1.2mL 426 mM NaOH, 1.4mL 400 mM Tris buffer and 1.4mL 250mg/L EDTA was used to dissolute the sample. The [1-13C] PA was drawn off and rapidly injected into the sample volume of the bioreactor. A dual tuned 1H/13C volume coil (Doty Scientific, Columbia, SC) was used to acquire dynamic global spectra (flip angle = 10°, repetition time [TR] = 3000 ms) with transmit and receive frequencies centered on the expected pyruvate resonance. Ratios of lactate to pyruvate (Lac/Pyr) were calculated from the Gaussian fit of the respective peak areas via prior knowledge and the AMARES algorithm within the jMRUI v5.2 software package [33], after zero-filling (4096) and the summation of the entire time course of the HP-MRS spectra.
2.4. Data and Statistical Analysis
Results were represented as mean±SD over the 3 repeated cell cultures, and differences between groups were assessed using ANOVA and Tukey’s honestly significant test, with p≤0.05 considered to be the threshold for statistical significance. Spearman correlations were used for comparing associations between measures and across methods.
3. Results
To assess differences in metabolism across three triple negative breast cancer (TNBC) cell lines (4T1, 4T07, and 67NR) with different metastatic potential, cells were cultured within 3D collagen gels in the bioreactor system (Figure 1). Endpoints for both HP-MRS and FLIM are summarized in Table 1 for each of the 3 replicates per cell line. Lactate production was not detected for the 67NR (non-metastatic) cell line, but was detected for the 4T07 (metastatic dormant) and 4T1 (metastatic) cell lines with the Lac/Pyr ratio increasing with increasing murine breast cancer cell metastatic potential (Figure 3a). Lac/Pyr for the highly metastatic 4T1 cell line was significantly greater than for the non-metastatic 67NR cell line (p = 0.02) but not for 4T1 vs. 4T07 (4.3 × 10⁻³ vs. 1.8 × 10⁻³, p= 0.15).
The Redox Ratio (Figure 3b) was significantly elevated in the metastatic-dormant 4T07 cell line vs. the non-metastatic 67NR cell line (0.384 vs. 0.246, p<0.01). The Redox Ratio for the 4T1 (highly metastatic) is qualitatively higher than for the 67NR cell line (0.327 vs. 0.246) but not significantly different from either 67NR (p=0.07) or the 4T07 (p = 0.2) cell lines. The FAD intensity is significantly different between all three cell lines. FAD intensity is elevated in the 4T07 vs. the 67NR cell line (302.9 vs. 136.1, p <0.01) and in the 4T07 (metastatic-dormant) vs. the highly metastatic 4T1 cell line (302.9 vs. 228.7, p = 0.021). FAD lifetime (τm) was significantly longer in the 4T07 cell line compared to 67NR (948.9 vs. 715.1, p < 0.001) and 4T1 (948.9 vs. 854.3, p = 0.021) (Figure 3c). The FAD intensity seems to be driving the pattern observed for the Redox Ratio (Figure 3b, Table 1) since the NAD(P)H intensity did not differ between any cell line (ANOVA p-value = 0.95). There was a trend toward greater NAD(P)H lifetime for both metastatic cell lines compared to the non-metastatic 67NR cell line (Figure 3d), though neither was significantly different (ANOVA p-value = 0.092).
Consistent with the trend towards increased NAD(P)H lifetime in 4T07 and 4T1, the Lac/Pyr Ratio correlated strongly with increasing NAD(P)H lifetime (R = 0.86, p = 0.003) across all measurements (N = 9) suggesting that a large fraction of the enzyme-bound fraction measured by FLIM was associated with aerobic glycolysis (Table 2). The Lac/Pyr ratio also trended with increasing Redox Ratio (R = 0.63, p=0.071) suggesting a more reduced chemical environment and a shift towards glycolysis in cell lines with higher Lac/Pyr ratio.
4. Discussion
Few studies have combined multiscale modalities to investigate cancer cell metabolism. The current work balances a translational approach that leverages advances in hyperpolarization to directly probe pyruvate substrate metabolism in concert with FLIM measures in the same cell culture under the same environmental conditions. The complementary information of the multi-modal bioreactor revealed differences in pyruvate utilization and FLIM patterns unique to the highly metastatic and metastatically dormant cell lines. Lac/Pyr ratio was elevated in both metastatic cell lines (4T1 and 4T07), but less so in the metastatic-dormant cell line (4T07), relative to the non-malignant cell line (67NR). A different pattern was observed for the Redox Ratio in which the metastatically dormant 4T07 cell line was significantly higher, a pattern that was largely driven by the FAD intensity suggesting substantial oxidative metabolism in both 4T07 and 4T1 metastatic cell lines. Another study of the same cell lines found that the Redox Ratio was higher in the 4T1 cell line and comparable to 67NR at normoxia with a dramatic increase in the redox ratio observed under acute hypoxic conditions, especially in 4T1 and 4T07 compared to the 67NR cell line. [34] Our findings, studied here under normoxia, found 4T07 had a qualitatively higher Redox Ratio than 4T1 with a significantly higher FAD mean intensity and a much lower Redox Ratio for 67NR compared to both 4T1 and 4T07. In our study, Redox Ratio, mean and NAD(P)H lifetime tended to be elevated in both metastatic cell lines suggesting an overall higher fraction of enzyme-bound NAD(P)H. Also in our work, the complementary findings from HP-MRS of elevated Lac/Pyr in the highly metastatic (4T1) cell line in concert with lower FAD intensity, suggests greater reliance on aerobic glycolysis by the highly metastatic 4T1 cell line as compared to the metastatic-stable 4T07 cell line, which exhibits an overall elevated metabolism (both glycolytic and oxidative) compared to the non-metastatic cell line (67NR).
Moreover, strong correlations of Lac/Pyr ratio with NAD(P)H lifetime and redox ratio substantially support interpretation of Lac/Pyr ratio as indicative of increased aerobic glycolysis. Increased NAD(P)H lifetime is consistent with increased LDH enzyme activity and increased Redox Ratio is consistent with increased cellular NADH, both expected with a shift towards aerobic glycolysis.
The results presented here show preliminary data which indicate different metabolic signatures between nonmetastatic (67NR), and metastatic (4T07 and 4T01) breast cancer cell lines. Normal cell metabolism involves oxidative phosphorylation. When oxygen is limited, as during exercise, cells switch to glycolysis and convert most of the glucose to lactate. Cancer cells tend to switch to glycolysis even when oxygen is present (Warburg effect). The switch to glycolysis is an evolved trait that enables tumors to maintain high proliferation despite resistance from their environment, and under transient hypoxia during metastasis. It is possible that highly metastatic cells switch to aerobic glycolysis because they require more rapid ATP production and can achieve this through a greater emphasis on glycolytic metabolism. Although glycolysis produces less ATP per mol glucose, it has a higher horsepower (energy produced per volume of enzymes). This upregulation of glycolysis is apparent in the metastatic cell line (4T1) compared to either the nonmetastatic (67NR) or dormant (4T07) cell line indicated by the increased pyruvate to lactate conversion measured by HP-MRS in concert with lower FAD intensity.
NAD(P)H and FAD are natural biomarkers that emit endogenous fluorescence and play different roles in the energy metabolism of the cell. NADH is involved in cellular processes such as glycolysis in the cytosol as well as catabolic processes for energy metabolism within the mitochondria. It is interesting in our study that FAD intensity was the most significant marker of differences with metastatic potential between the breast cancer cell lines studied. This points to potential differences in mitochondrial metabolism that impact metastatic potential warranting more careful and direct study. Mitochondria produce reactive oxygen species (ROS) as byproducts of oxidative phosphorylation that play a role in cancer cell signaling, survival, and metastasis. A prior study of the 4T07 and 4T1 cell lines, also under normoxic conditions, showed a non-significant trend towards increased ROS in 4T07 vs. 4T1 [35]. Moreover, rapid cancer cell proliferation can impact mitochondrial fusion, fission, and mutations in mitochondrial DNA (mtDNA) all of which are associated with increased metastatic potential [36,37].
There are several important limitations to this work. The sample size is somewhat small, partly due to the throughput in running complex repeated studies with HP-MRS under the controlled cell culture conditions required. One advantage of the FLIM technique is that the workflow and throughput is generally less complex and therefore faster than for HP-MRS. The HP-MRS results can therefore inform on which FLIM measures might be of greatest relevance to glycolytic vs. oxidative phosphorylation, e.g. FAD and NADH lifetime in our study, to improve sample size and interpretation of FLIM measurements.
Also, this work was conducted under normoxic conditions, with 5% CO2 gas mix. It is likely that different levels of hypoxia will elicit changes in metabolism that are important in the tumor setting. The balance of glycolytic and oxidative phosphorylation is likely to be a dynamic process that is sensitive to oxygen availability, which may explain the discordance between Redox Ratio results for 4T1 and 67NR cell lines in our study compared to the hypoxic conditions studied in Ref. [34]. Nonetheless, the bioreactor design is fully capable of providing different partial pressure of oxygen (pO2) conditions through the media flow by bubbling different gas mixes prior to circulating through the chamber containing the collagen gel cell culture and should be an area of future work. A fiber optic system for monitoring pO2 (PreSens, Regensburg, Germany) is also built into the design. Future studies will investigate metabolism under different pO2 conditions.
Finally, MCT1 expression may differ by cell line and was not investigated in this work. It is likely that the 4T1 cell line has greater MCT1 expression that may be partly driving the greater pyruvate uptake [12]. Thus, the observed shift to aerobic glycolysis is likely a combination of pyruvate uptake and greater LDH enzyme activity (and thus greater NAD(P)H utilization). However, it should be noted that the strong correlation between the Lac/Pyr ratio and NAD(P)H lifetime supports increased enzyme utilization through greater bound fraction of NADH. Future studies should routinely measure MCT1 expression in cell lines to improve understanding of the balance of enzyme activity and cellular uptake.
5. Conclusion
Our results suggest promising differences in metabolism in murine breast cancer cells with differing metastatic potential. The complementary use of HP-MRS and FLIM shows the promise of multimodal and multiscale imaging for investigating cancer cell metabolism under controlled environmental conditions.
Acknowledgments
We thank Brett Morris, David Inman, Joseph Szulczewski and Matthew Conklin for useful discussions that informed our interpretation of the experiments performed in this work. We acknowledge funding from the Morgridge Institue for Research Postdoctoral Program (SEB), NIH U54 CA268069 (SMP, KWE), R01CA197556 (SMP), the UW Carbone Cancer Center - CCSG P30CA014520 (SBF), T32 CA009206 fellowship to Dr. Paul Begovatz, and the Office of the Vice Chancellor for Research and Graduate Education at the University of Wisconsin–Madison (SBF), and the Wisconsin Alumni Research Foundation (SBF).
References
- Breast Cancer Facts and Figures 2017-2018. American Cancer Society. www.cancer.org.
- Meltzer A. Dormancy and breast cancer. J Surg Oncol. 1990 Mar;43(3):181-8. [CrossRef]
- Páez D, Labonte MJ, Bohanes P, Zhang W, Benhanim L, Ning Y, Wakatsuki T, Loupakis F, Lenz HJ. Cancer dormancy: a model of early dissemination and late cancer recurrence. Clin Cancer Res. 2012 Feb 1;18(3):645-53. [CrossRef]
- Brackstone M, Townson JL, Chambers AF. Tumour dormancy in breast cancer: an update. Breast Cancer Res. 2007;9(3):208. [CrossRef]
- Cox BL, Erickson-Bhatt S, Szulczewski JM, Squirrell JM, Ludwig KD, Macdonald EB, Swader R, Ponik SM, Eliceiri KW, Fain SB. A novel bioreactor for combined magnetic resonance spectroscopy and optical imaging of metabolism in 3D cell cultures. Magn Reson Med. 2019 May;81(5):3379-3391. [CrossRef]
- Warburg O. On the origin of cancer cells. Science. 1956 Feb 24;123(3191):309-14. [CrossRef]
- Vander Heiden MG, Cantley LC, Thompson CB. Understanding the Warburg effect: the metabolic requirements of cell proliferation. Science. 2009 May 22;324(5930):1029-33. [CrossRef]
- Dafni H, Ronen SM. Dynamic nuclear polarization in metabolic imaging of metastasis: common sense, hypersense and compressed sensing. Cancer Biomark. 2010;7(4):189-99. [CrossRef]
- Brindle KM. Imaging metabolism with hyperpolarized (13)C-labeled cell substrates. J Am Chem Soc. 2015 May 27;137(20):6418-27. [CrossRef]
- Christensen CE, Karlsson M, Winther JR, Jensen PR, Lerche MH. Non-invasive in-cell determination of free cytosolic [NAD+]/[NADH] ratios using hyperpolarized glucose show large variations in metabolic phenotypes. J Biol Chem. 2014 Jan 24;289(4):2344-52. [CrossRef]
- Witney T.H., Kettunen M.I., Hu D.E., Gallagher F.A., Bohndiek S.E., Napolitano R., Brindle K.M. Detecting Treatment Response in a Model of Human Breast Adenocarcinoma Using Hyperpolarised [1-13C]Pyruvate and [1,4-13C2]Fumarate. Br. J. Cancer. 2010;103:1400–1406. [CrossRef]
- Harris T., Eliyahu G., Frydman L., Degani H. Kinetics of Hyperpolarized 13C1-Pyruvate Transport and Metabolism in Living Human Breast Cancer Cells. Proc. Natl. Acad. Sci. USA. 2009;106:18131–18136. [CrossRef]
- Macdonald E.B., Begovatz P., Barton G.P., Erickson-Bhatt S., Inman D.R., Cox B.L., Eliceiri K.W., Strigel R.M., Ponik S.M., Fain S.B. Hyperpolarized 13C Magnetic Resonance Spectroscopic Imaging of Pyruvate Metabolism in Murine Breast Cancer Models of Different Metastatic Potential. Metabolites. 2021;11:274. [CrossRef]
- Grashei M., Biechl P., Schilling F., Otto A.M. Conversion of Hyperpolarized [1-13 C]Pyruvate in Breast Cancer Cells Depends on Their Malignancy, Metabolic Program and Nutrient Microenvironment. Cancers. 2022;14:1845. Sidani M1, Wyckoff J, Xue C, Segall JE, Condeelis J. Probing the microenvironment of mammary tumors using multiphoton microscopy. J Mammary Gland Biol Neoplasia. 2006 Apr;11(2):151-63. [CrossRef]
- Sidani M1, Wyckoff J, Xue C, Segall JE, Condeelis J. Probing the microenvironment of mammary tumors using multiphoton microscopy. J Mammary Gland Biol Neoplasia. 2006 Apr;11(2):151-63. [CrossRef]
- Provenzano PP1, Rueden CT, Trier SM, Yan L, Ponik SM, Inman DR, Keely PJ, Eliceiri KW. Nonlinear optical imaging and spectral-lifetime computational analysis of endogenous and exogenous fluorophores in breast cancer. J Biomed Opt. 2008 May-Jun;13(3):031220. [CrossRef]
- Conklin MW, Provenzano PP, Eliceiri KW, Sullivan R, Keely PJ. Fluorescence lifetime imaging of endogenous fluorophores in histopathology sections reveals differences between normal and tumor epithelium in carcinoma in situ of the breast. Cell Biochem Biophys. 2009;53(3):145-57. [CrossRef]
- Li LZ, Xu HN, Ranji M, Nioka S, Chance B. Mitochondrial redox imaging for cancer diagnostic and therapeutic studies. J Innov Opt Health Sci. 2009 Oct;2(4):325-341. [CrossRef]
- Ostrander JH, McMahon CM, Lem S, Millon SR, Brown JQ, Seewaldt VL, Ramanujam N. Optical redox ratio differentiates breast cancer cell lines based on estrogen receptor status. Cancer Res. 2010 Jun 1;70(11):4759-66. [CrossRef]
- Walsh A, Cook RS, Rexer B, Arteaga CL, Skala MC. Optical imaging of metabolism in HER2 overexpressing breast cancer cells. Biomed Opt Express. 2012 Jan 1;3(1):75-85. [CrossRef]
- Xu HN, Zheng G, Tchou J, Nioka S, Li LZ. Characterizing the metabolic heterogeneity in human breast cancer xenografts by 3D high resolution fluorescence imaging. Springerplus. 2013 Dec;2(1):73. [CrossRef]
- Walsh AJ, Cook RS, Sanders ME, Aurisicchio L, Ciliberto G, Arteaga CL, Skala MC. Quantitative optical imaging of primary tumor organoid metabolism predicts drug response in breast cancer. Cancer Res. 2014 Sep 15;74(18):5184-94. [CrossRef]
- Cannon TM, Shah AT, Walsh AJ, Skala MC. High-throughput measurements of the optical redox ratio using a commercial microplate reader. J Biomed Opt. 2015 Jan;20(1):010503. [CrossRef]
- Sun N, Xu HN, Luo Q, Li LZ. Potential Indexing of the Invasiveness of Breast Cancer Cells by Mitochondrial Redox Ratios. Adv Exp Med Biol. 2016;923:121-127. [CrossRef]
- Alhallak K, Rebello LG, Muldoon TJ, Quinn KP, Rajaram N. Optical redox ratio identifies metastatic potential-dependent changes in breast cancer cell metabolism. Biomed Opt Express. 2016 Oct 3;7(11):4364-4374. [CrossRef]
- Cannon TM, Shah AT, Skala MC. Autofluorescence imaging captures heterogeneous drug response differences between 2D and 3D breast cancer cultures. Biomed Opt Express. 2017 Feb 28;8(3):1911-1925. [CrossRef]
- Hou J, Williams J, Botvinick EL, Potma EO, Tromberg BJ. Visualization of Breast Cancer Metabolism Using Multimodal Nonlinear Optical Microscopy of Cellular Lipids and Redox State. Cancer Res. 2018 May 15;78(10):2503-2512. [CrossRef]
- Aslakson CJ, Miller FR. Selective events in the metastatic process defined by analysis of the sequential dissemination of subpopulations of a mouse mammary tumor. Cancer Res. 1992 Mar 15;52(6):1399-405.
- Burkel B, Morris BA, Ponik SM, Riching KM, Eliceiri KW, Keely PJ. Preparation of 3D Collagen Gels and Microchannels for the Study of 3D Interactions In Vivo. J Vis Exp. 2016 May 9;(111). [CrossRef]
- Becker W. Fluorescence lifetime imaging--techniques and applications. J Microsc. 2012 Aug;247(2):119-36. [CrossRef]
- Ardenkjaer-Larsen JH, Fridlund B, Gram A, Hansson G, Hansson L, Lerche MH, Servin R, Thaning M, Golman K. Proc Natl Acad Sci U S A. 2003 Sep 2;100(18):10158-63. [CrossRef]
- Rowland IJ, Peterson ET, Gordon JW, Fain SB. Curr Pharm Biotechnol. 2010 Sep 1;11(6):709-19. Review. [CrossRef]
- Naressi A, Couturier C, Devos JM, Janssen M, Mangeat C, de Beer R, Graveron-Demilly D. Java-based graphical user interface for the MRUI quantitation package. MAGMA. 2001 May;12(2-3):141-52. [CrossRef]
- Alhallak K, Rebello LG, Muldoon TJ, Quinn KP, Rajaram N. Optical redox ratio identifies metastatic potential-dependent changes in breast cancer cell metabolism. Biomed Opt Express. 2016 Oct 3;7(11):4364-4374. [CrossRef]
- Morris BA, Burkel B, Ponik SM, Fan J, Condeelis JS, Aguirre-Ghiso JA, Castracane J, Denu JM, Keely PJ. Collagen Matrix Density Drives the Metabolic Shift in Breast Cancer Cells. EBioMedicine. 2016 Nov;13:146-156. [CrossRef]
- Xing, J., Qi, L., Liu, X. et al. Roles of mitochondrial fusion and fission in breast cancer progression: a systematic review. World J Surg Onc 20, 331 (2022). [CrossRef]
- Zakic T, Kalezic A, Drvendzija Z, Udicki M, Ivkovic Kapicl T, Srdic Galic B, Korac A, Jankovic A, Korac B. Breast Cancer: Mitochondria-Centered Metabolic Alterations in Tumor and Associated Adipose Tissue. Cells. 2024 Jan 15;13(2):155. [CrossRef]
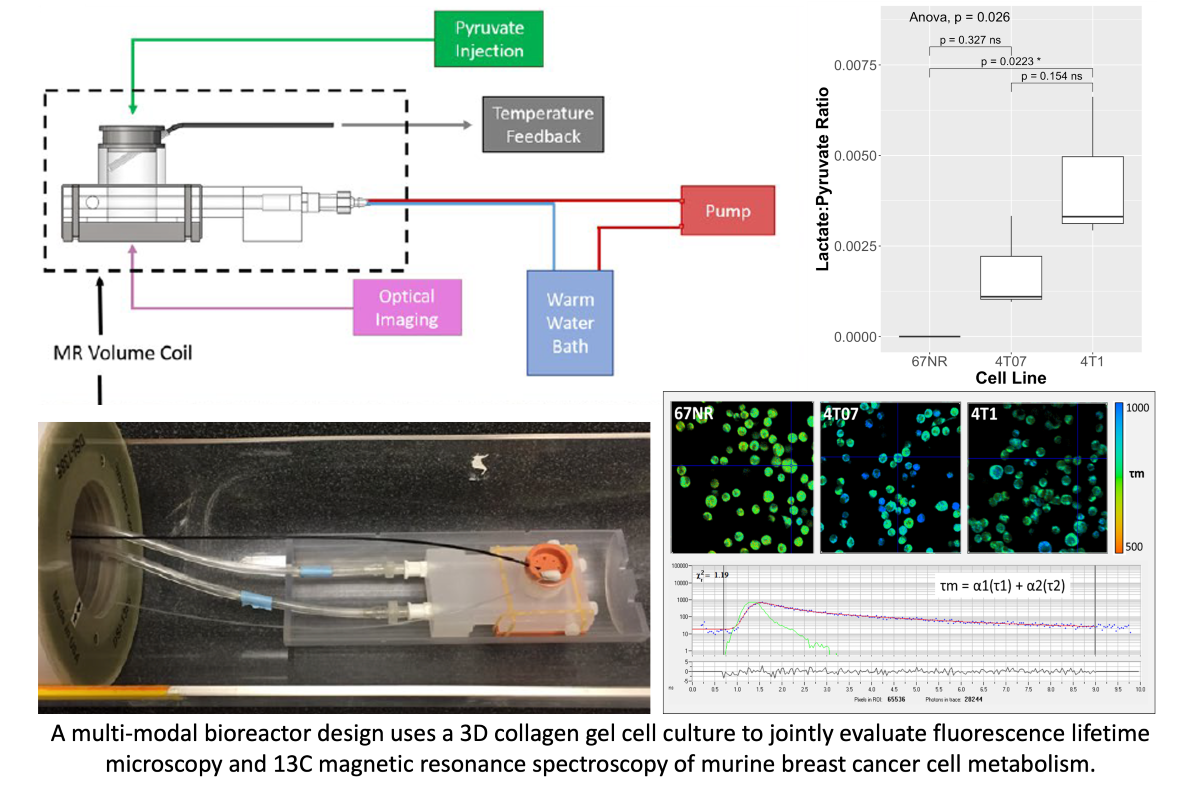
Figure 1.
(A) The multi-modal bioreactor design uses a 3D collagen gel cell culture in the MRI-compatible bioreactor chamber with (B) a transparent portal in the base that can be placed on a fluorescence microscope stage for fluorescence lifetime imaging microscopy (FLIM Setup). (C) The bioreactor system in the MRI setup adjacent to the volume coil used for signal excitation and detection. (D) Culture media flow was constantly maintained (green arrow) with temperature control maintained by water bath flow around the culture volume (blue arrow). Hyperpolarized metabolic substrates (13C1-pyruvate in this case) was injected via bolus infusion into base of the culture chamber (red arrow).
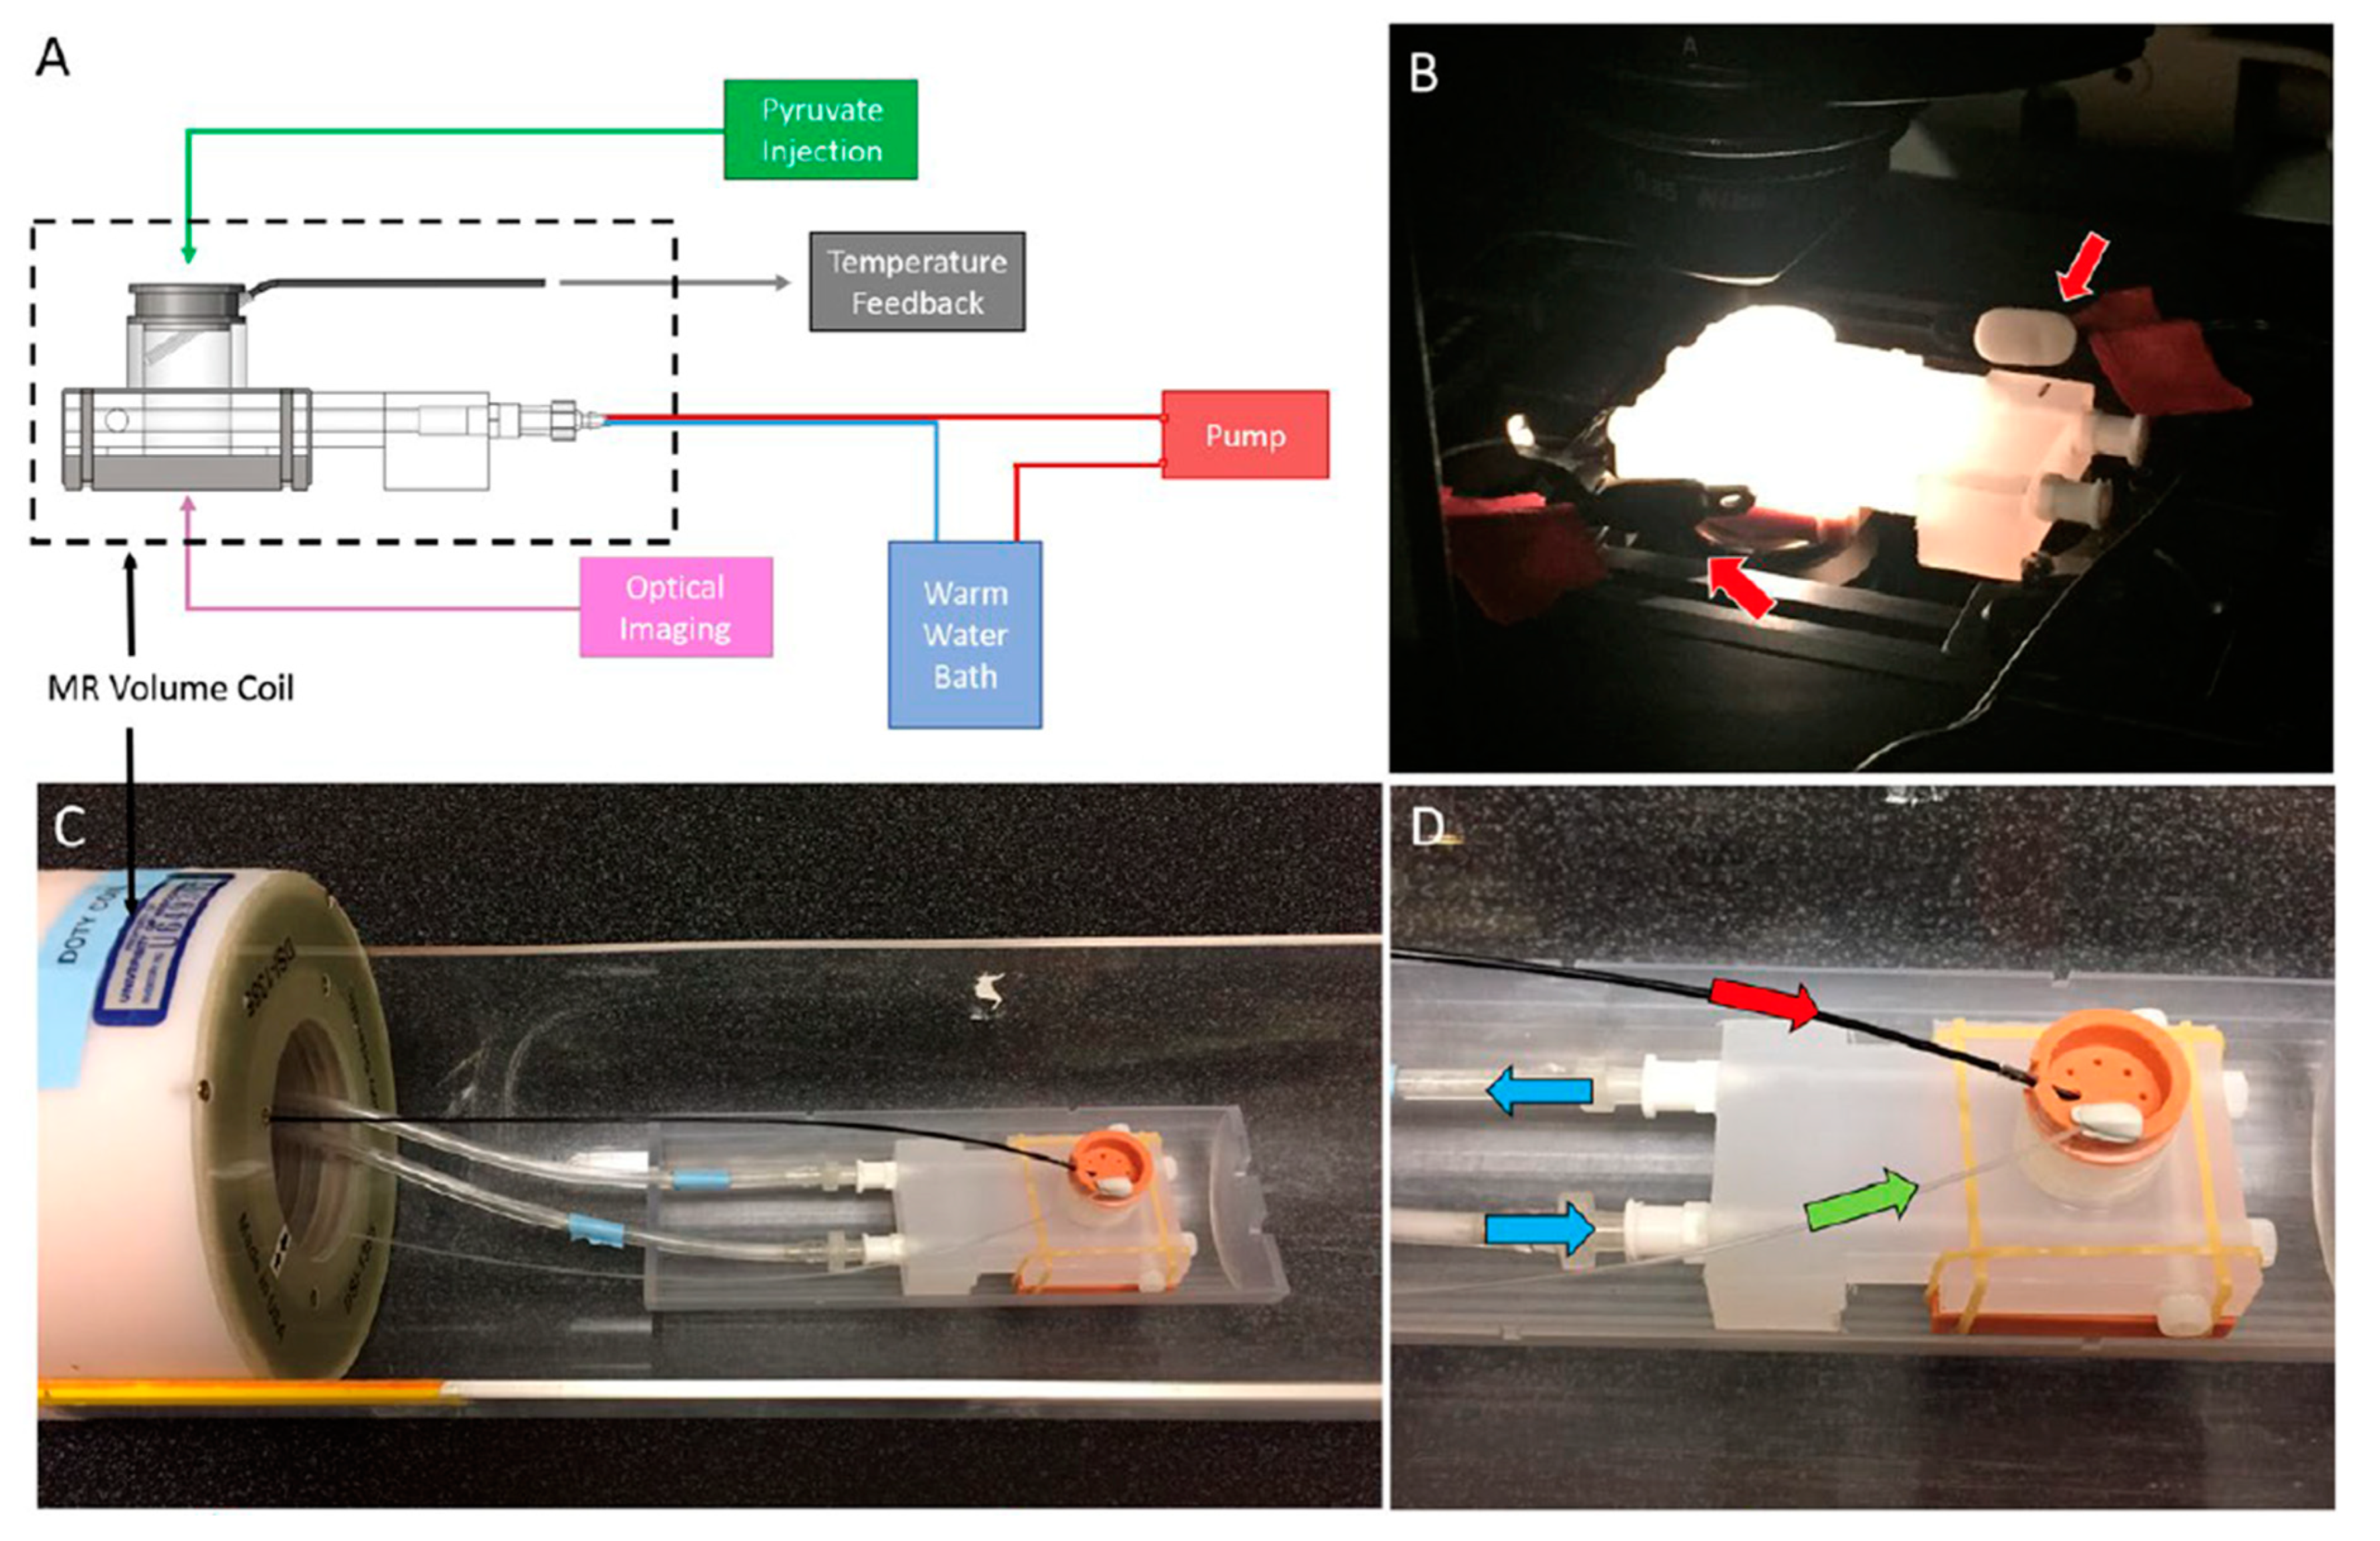
Figure 2.
(Top) Example fluorescence lifetime imaging microscopy (FLIM) images showing mean lifetime (τm) from nonmetastatic (67NR), metastatically dormant (4T07), and metastatic (4T1) murine breast cancer cells (upper images). Cells were imaged at 740 nm wavelength with a 450/70 nm filter. The color-coded images in the first and second rows show that the 67NR cells have a shorter τm (more yellow in color) compared to a longer τm in 4T07 and 4T1 cells (more blue in color). (Bottom) Example photon lifetime distribution from a single pixel displayed by the SPCImage software.
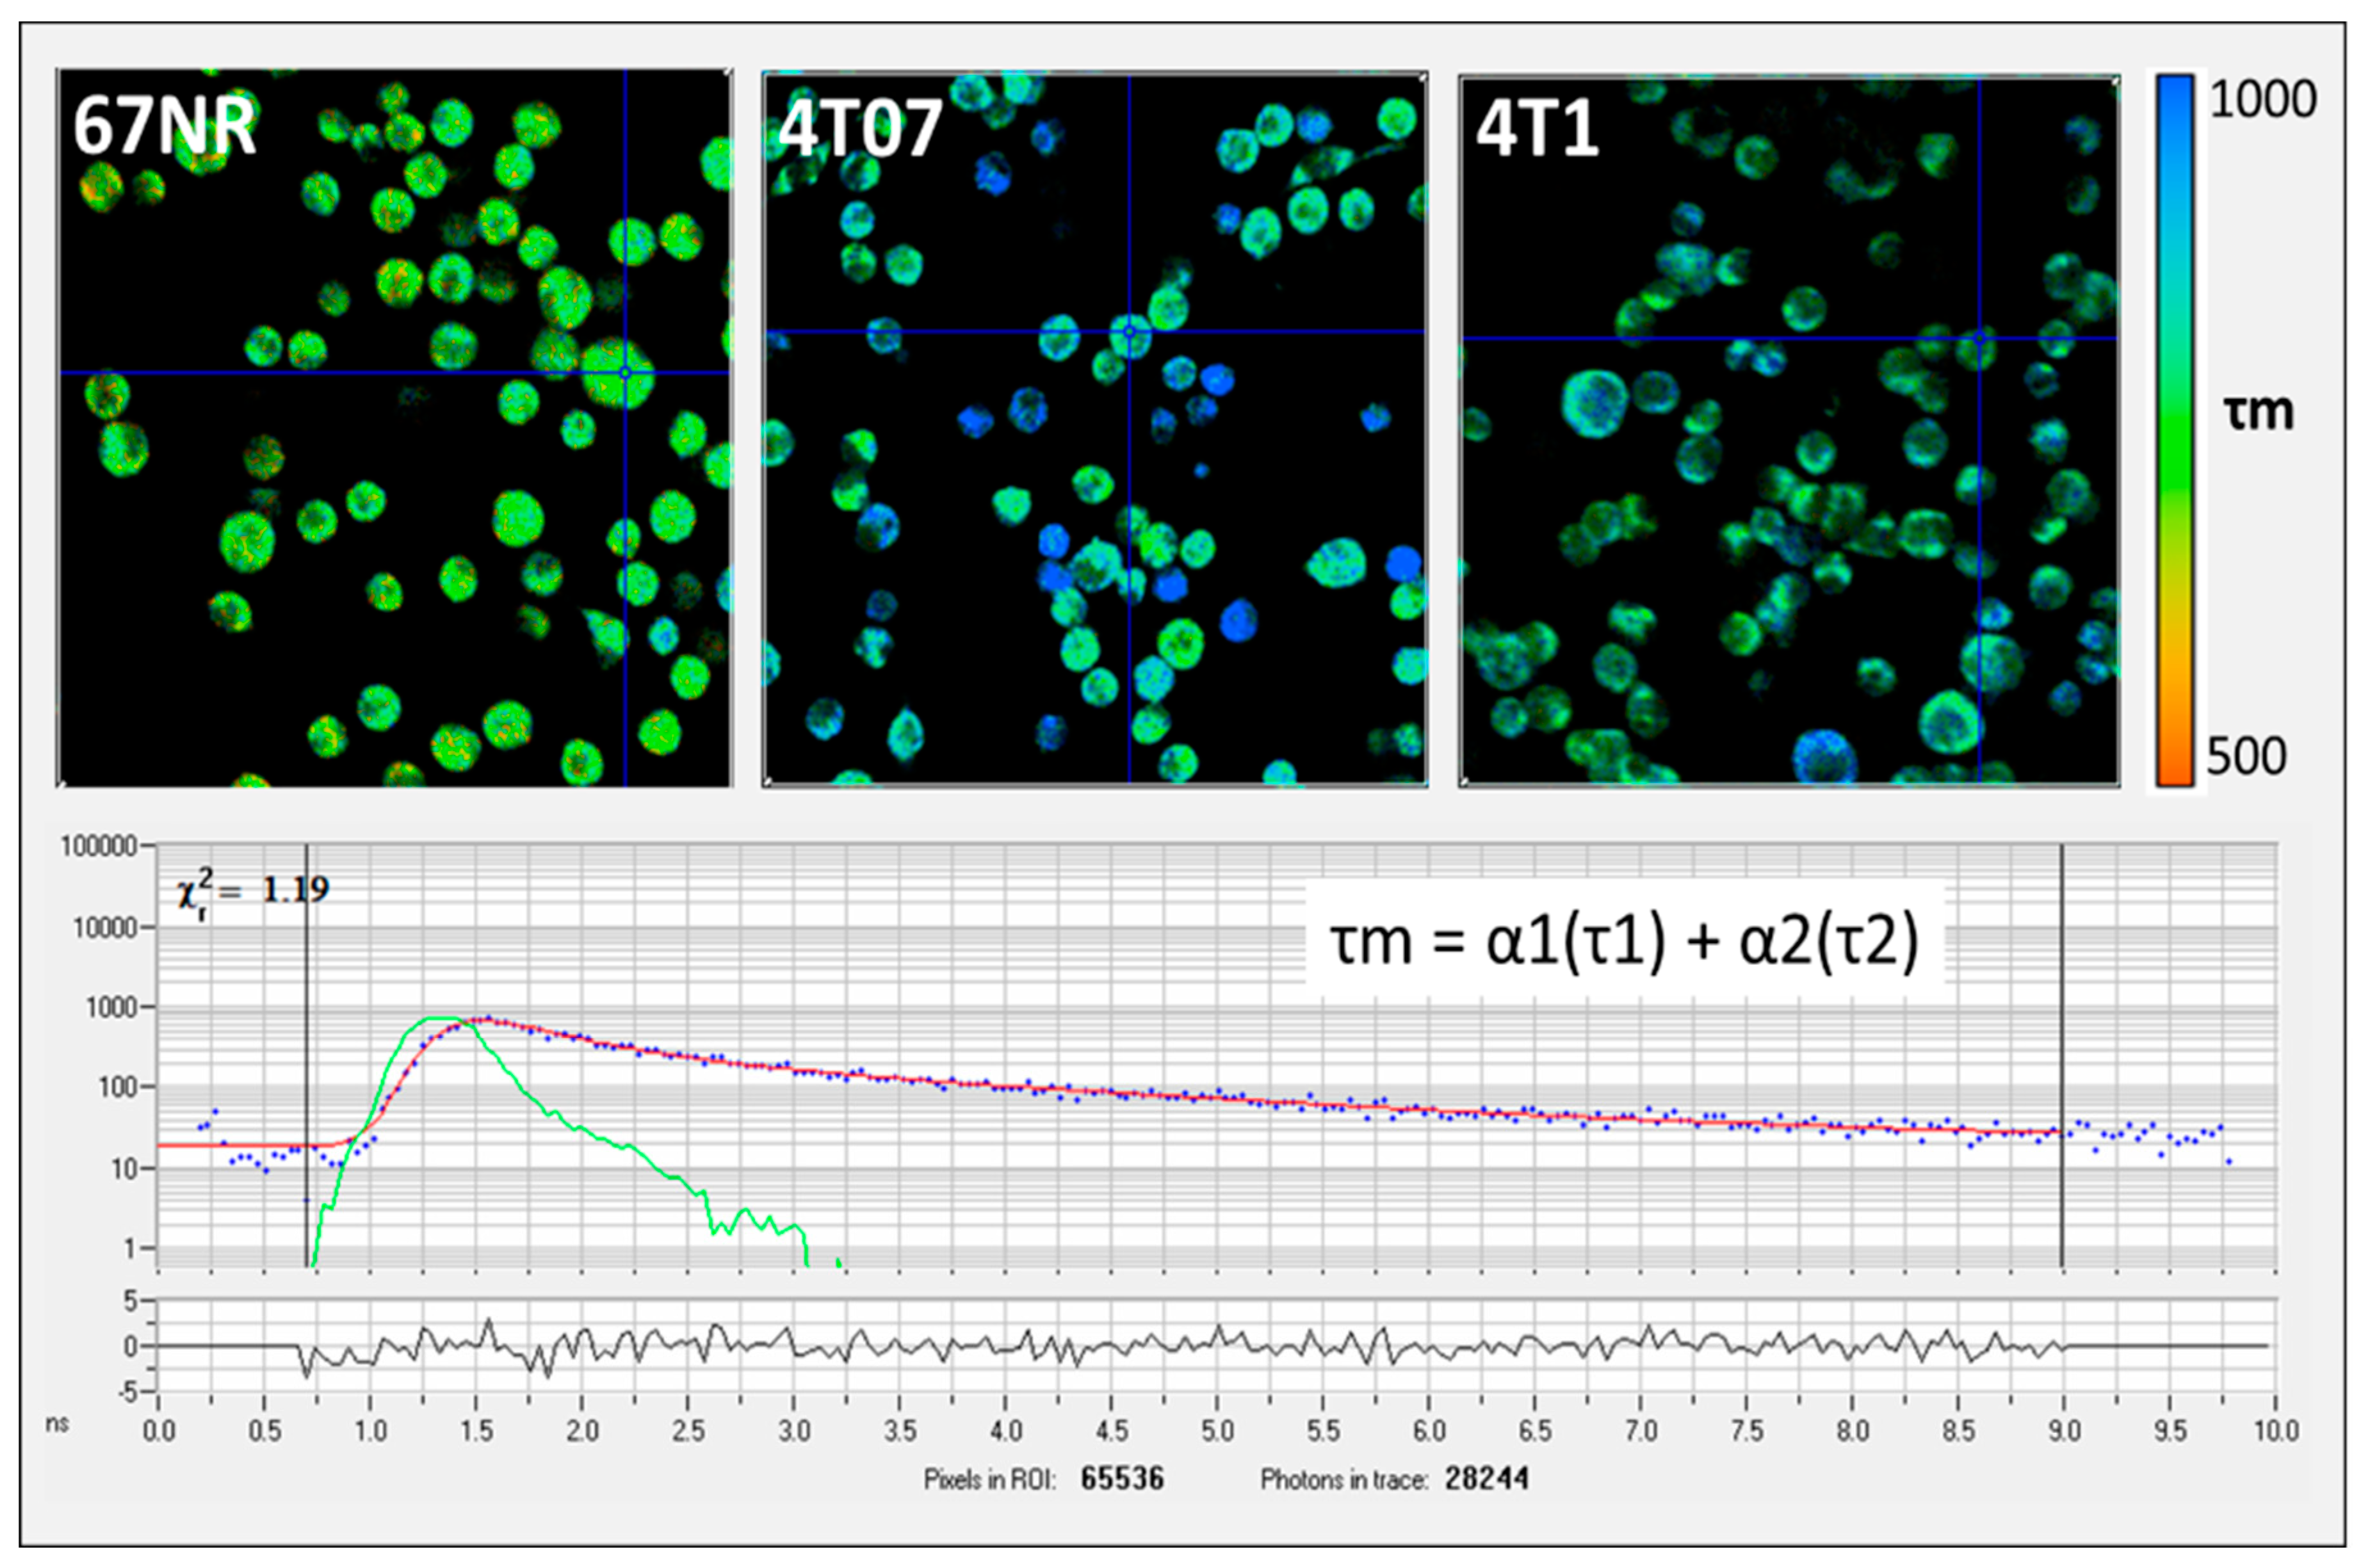
Figure 3.
(a) Elevated lactate/pyruvate (Lac/Pyr) ratio was found for the 4T1 (highly metastatic) vs. 67NR (non-metastatic) cell lines, in contrast to (b) where elevated Redox Ratio and (c) FAD Intensity was found for 4T07 (metastatic-dormant) vs. both 4T1 (highly metastatic) and 67NR (non-metastatic) cell lines. (d) NADH lifetimes trended higher for both 4T07 (metastatic-dormant) and 4T1 (highly metastatic) cell lines compared to the 67NR (non-metastatic) cell line. 3 replicates were performed in parallel for each cell line, for a total of N = 9 data points per cell-line. The * indicates statistical significance at p<0.05, **p<0.01, and ***p<0.001.
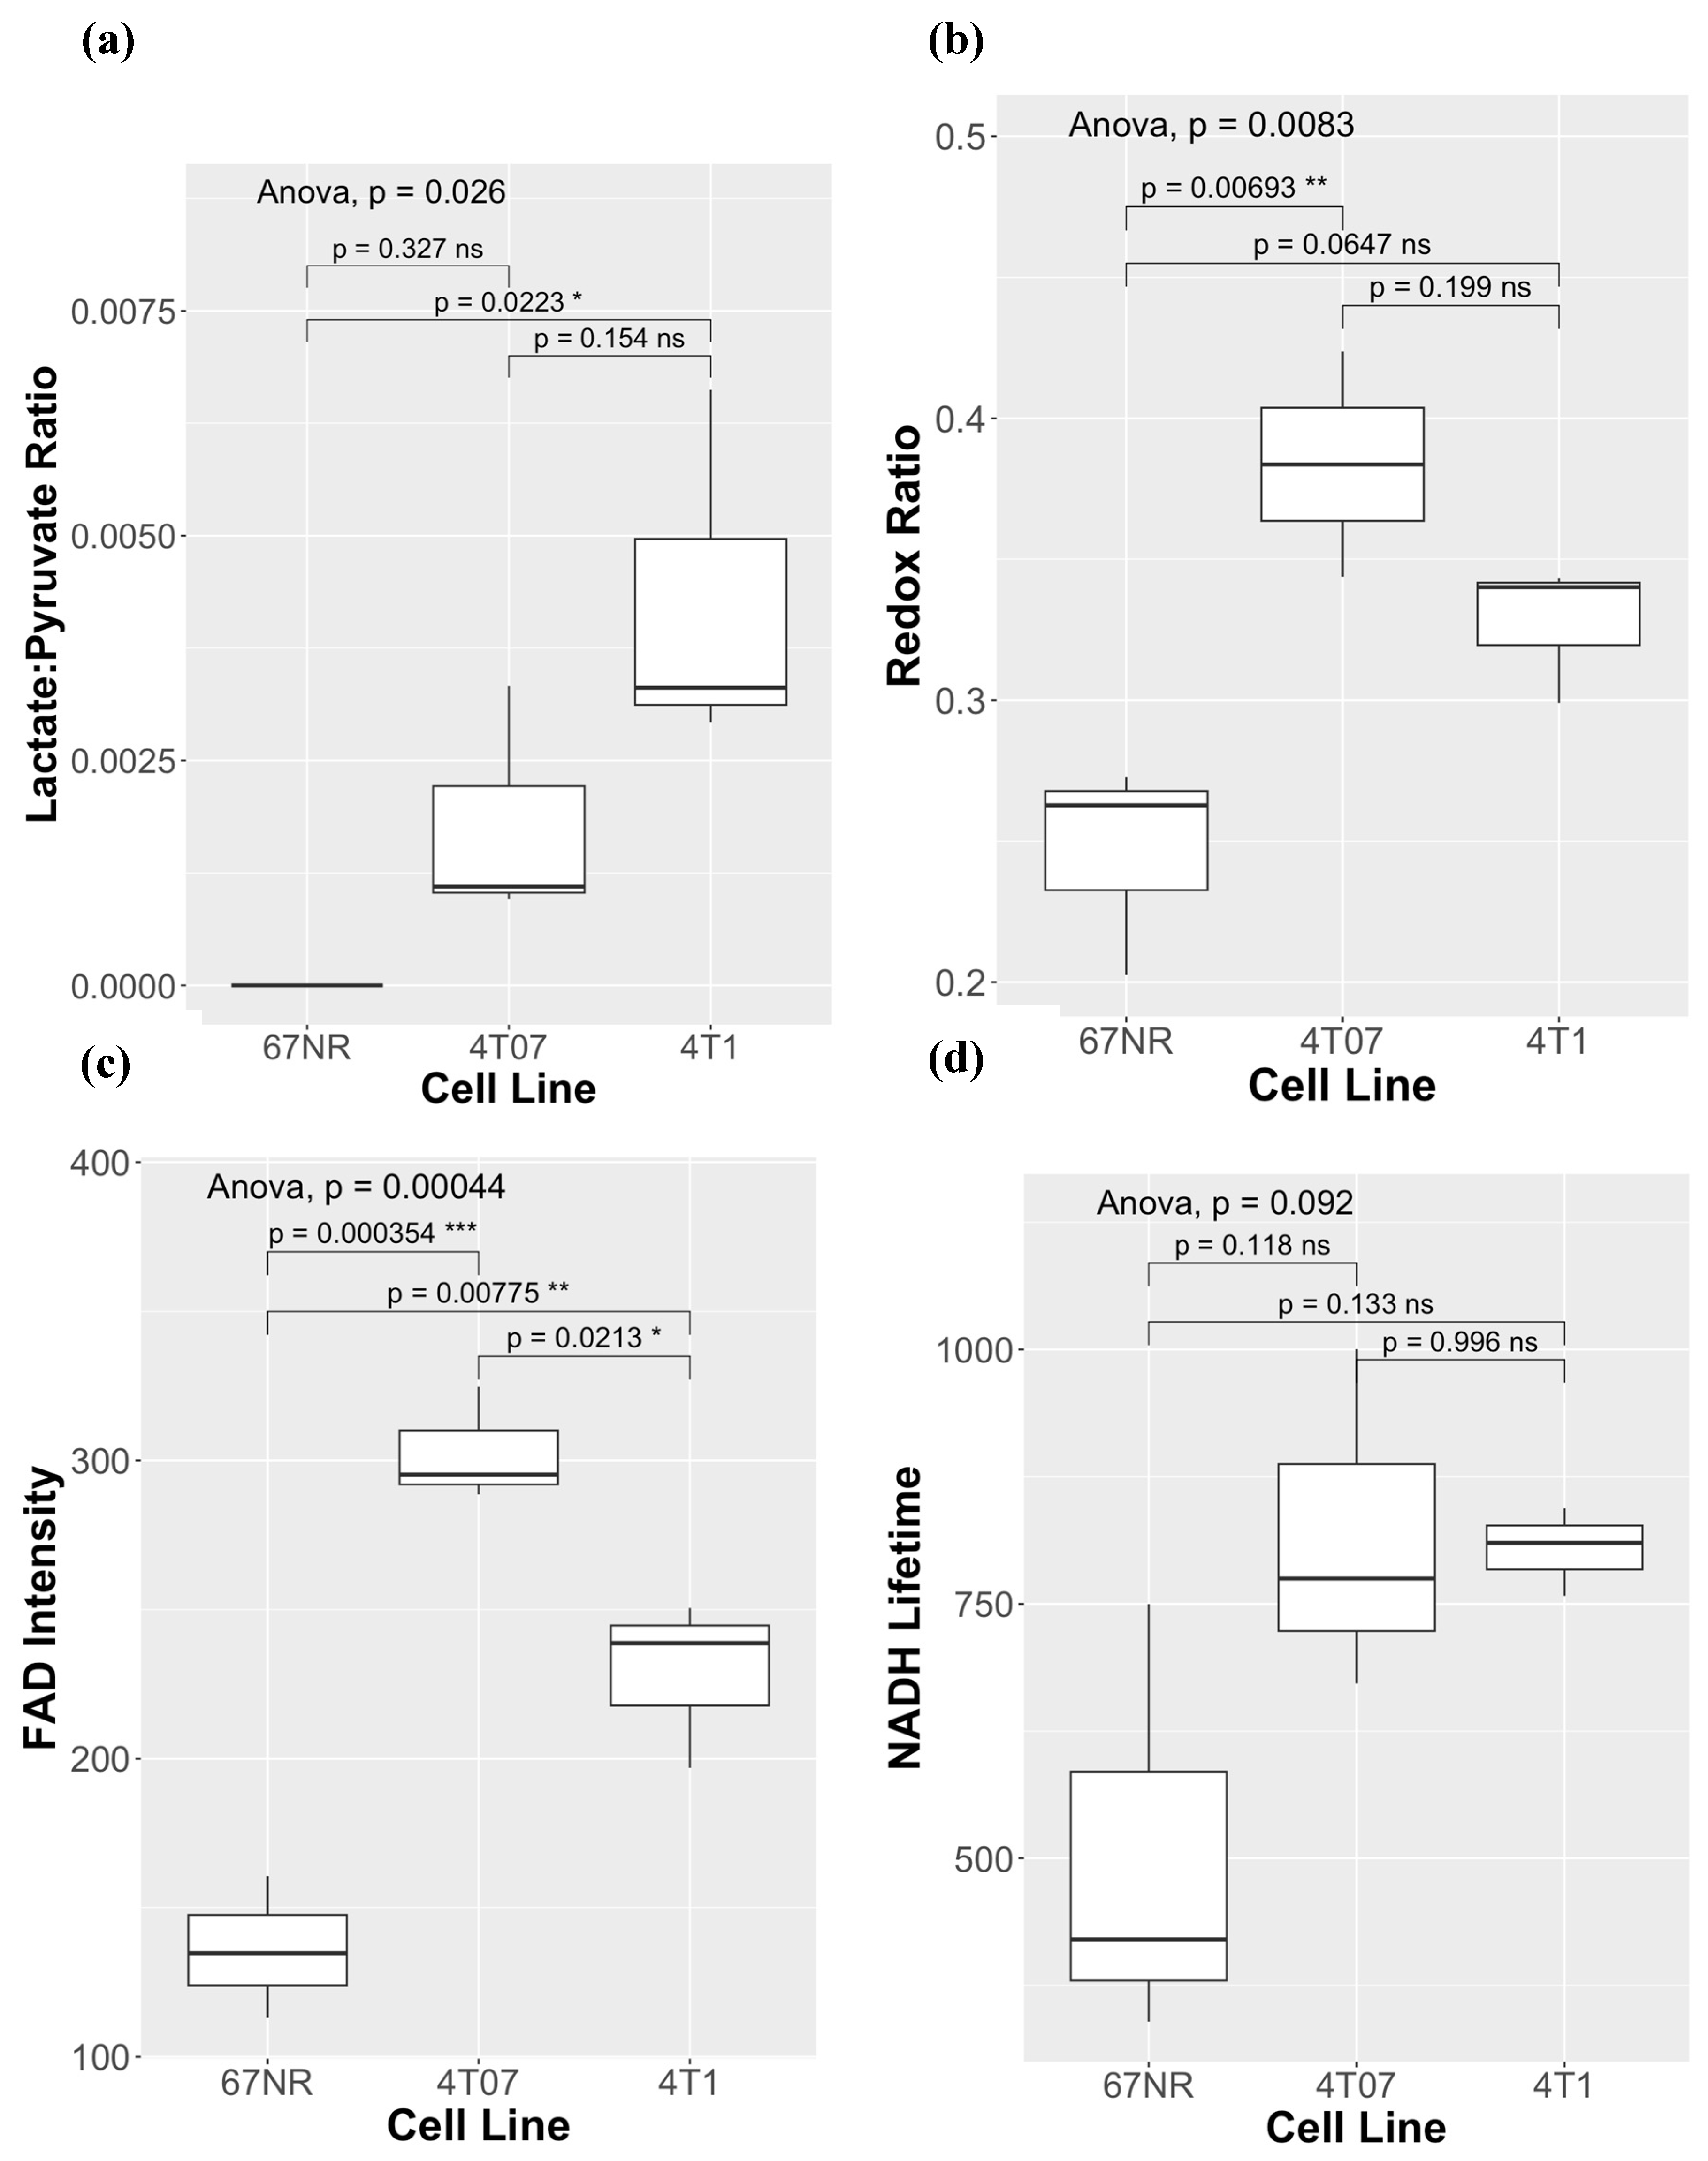

Table 1.
Summary results of HP-MRS and FLIM comparison.
| NADH | FAD | |||||
|---|---|---|---|---|---|---|
| Cell Line | Lac/Pyr Ratio | Redox Ratio | Intensity |
Lifetime (Tau Mean, ps) |
Intensity |
Lifetime (Tau Mean, ps) |
| 4T1 | 0.00293 | 0.299 | 613.58 | 757.8 | 250.56 | 751.8 |
| 4T1 | 0.00331 | 0.343 | 347.40 | 810.1 | 196.88 | 835.2 |
| 4T1 | 0.00662 | 0.340 | 416.14 | 844.2 | 238.73 | 975.8 |
| Mean (SD) | 0.00429 (0.0020) | 0.327 (0.02) | 459.04 (138.2) | 804.0 (43.5) | 228.7 (28.2) | 854.3 (113.2) |
| 4T07 | 0.00333 | 0.424 | 432.05 | 1000.3 | 324.82 | 964.1 |
| 4T07 | 0.0011 | 0.344 | 520.70 | 671.9 | 288.71 | 910.8 |
| 4T07 | 0.00096 | 0.384 | 438.34 | 774.9 | 295.24 | 971.7 |
| Mean (SD) | 0.00180 (0.0013) | 0.384 (0.04) | 463.70 (49.5) | 815.7 (168.0) | 302.9 (19.2) | 948.9 (33.2) |
| 67NR | 0 | 0.273 | 464.36 | 749.8 | 134.70 | 813.2 |
| 67NR | 0 | 0.263 | 414.45 | 339.5 | 160.55 | 396.9 |
| 67NR | 0 | 0.203 | 448.20 | 420.1 | 113.11 | 935.1 |
| Mean (SD) | 0 (0) | 0.246 (0.04) | 442.33 (25.5) | 503.1 (217.4) | 136.1 (23.8) | 715.1 (282.2) |
Table 2.
Spearman correlation values for HP-MRS and fluorescence microscopy measures (*indicates significant association, +indicates trend).
Table 2.
Spearman correlation values for HP-MRS and fluorescence microscopy measures (*indicates significant association, +indicates trend).
| Comparison HP-MRS Lac/Pyr Ratio vs. |
Spearman Correlation Coefficient | p-value |
|---|---|---|
| Redox Ratio | 0.63 | 0.071+ |
| NADH Intensity | -0.25 | 0.51 |
| NADH Lifetime | 0.86 | 0.0026* |
| FAD intensity | 0.59 | 0.092 |
| FAD Lifetime | 0.49 | 0.18 |
Disclaimer/Publisher’s Note: The statements, opinions and data contained in all publications are solely those of the individual author(s) and contributor(s) and not of MDPI and/or the editor(s). MDPI and/or the editor(s) disclaim responsibility for any injury to people or property resulting from any ideas, methods, instructions or products referred to in the content. |
© 2024 by the authors. Licensee MDPI, Basel, Switzerland. This article is an open access article distributed under the terms and conditions of the Creative Commons Attribution (CC BY) license (http://creativecommons.org/licenses/by/4.0/).
Copyright: This open access article is published under a Creative Commons CC BY 4.0 license, which permit the free download, distribution, and reuse, provided that the author and preprint are cited in any reuse.


