
Submitted:
23 September 2024
Posted:
24 September 2024
Read the latest preprint version here
Abstract
Optimal upper extremity motor control and range of motion are necessary to achieve even the basic Activities of Daily Living (ADL) function. Stroke, with resulting hemiparesis, can significantly and negatively impact an individual’s ADL function. Functional Independence Measure (FIM) self-care score can provide assessment of what aspects and to what degree ADL functions are impaired. FIM self-care assessment can also track changes in ADL function during stroke recovery and rehabilitation. Recently, sensor-acquired 3D motion analysis of stroke patients’ upper extremity has shown promise as a potential alternative to assess ADL function. This observational study evaluates whether the sensor-acquired upper extremity reachable workspace (RWS) measure correlates with clinician-evaluated FIM self-care score in stroke patients. Seventeen patients with stroke were enrolled in the study. FIM self-care, NeuroQoL upper extremity, and reachable workspace outcome measures (relative surface area, RSA) were collected upon rehabilitation hospital admission, at discharge, and at 3-month visit. Pearson and Spearman’s rank correlation coefficients as well as multiple linear regression analyses were used to determine the relationships between FIM self-care, NeuroQoL, and reachable workspace RSAs. Moderately strong correlation between total reachable workspace RSA and total FIM self-care score at discharge and at 3-month were noted (r=0.619, r=0.661, p<0.05), and similarly strong correlation was also noted with the upper extremity NeuroQoL total score (r=0.690, r=0.815, p<0.05). Multiple linear regression analyses revealed a change in bilateral total RSA of 0.1 unit from admission to 3-month follow up correlated with respective change in FIM self-care score of 2.011 points (95%CI: 0.663-3.360). Longitudinal improvement in ADL function during stroke rehabilitation and recovery process is correlated with improvement in reachable workspace.
Keywords:
Stroke
; Reachable Workspace
; Upper Extremity
; Activities of Daily Living
; Function
1. Introduction
Stroke resulting hemiplegia of upper and lower extremities can significantly impact an individual’s mobility and activities of daily living (ADL) functions. It is reported that the majority of stroke patients (~85%) suffer from upper extremity impairment affecting their ADLs [1]. Significant physical impairment and disability of upper extremity after stroke leads to loss of functional independence for the affected patient, decreased ability to perform basic self-care, and reduced quality of life [2]. For some patients with stroke after their acute medical hospitalization, additional comprehensive inpatient rehabilitation may be needed to facilitate recovery after stroke and optimize rehabilitation efforts [3]. Therefore, accurate and clinically meaningful assessment of stroke patients’ upper extremity function and quantifying change over time are important in stroke rehabilitation.
Standard of care during rehabilitation includes tracking outcome measures such as the Functional Independence Measure (FIM) or other similar outcome measures upon admission and at discharge from the rehabilitation hospitalization. FIM instrument was developed in 1983 and until recently has served as the mainstay standard functional outcome measure to evaluate patients with various physical impairments [4]. Recently in the U.S., Quality Indicator (QI), has been adopted as the standard measure for post-acute care rehabilitation [5]; however, the underlying conceptual basis for both FIM and QI remains similar in that both assess/grade the functional status of an individual based on the level of assistance that person requires (based on clinician evaluation) [6]. Patient reported outcome (PRO) measures can further shed light on patient’s own experience of functional impairment as well as self-perceived impact on daily functional activities. NeuroQoL (Quality of Life in Neurological Disorders) questionnaire is one of several available self-reported assessments of functional impairment that can help quantify a patient’s perceived function as well as facilitate tracking any clinically meaningful changes [7].
With advances in health-related technologies, clinicians are increasingly exploring ways to leverage the use of these tools in health care applications. In rehabilitation realm, unobtrusive, simple, and low-cost motion capture sensor systems (such as Kinect, Microsoft, Redmond, WA, USA) have been utilized to assess patient’s upper extremity range of motion, and in conjunction with kinematic modeling and software programs, able to reconstruct an individual’s three-dimensional (3D) upper extremity reachable workspace (RWS) [8].
At this time, the validity and reliability of the upper extremity RWS outcome measure (relative surface area, RSA) has been extensively investigated and demonstrated its clinical usefulness in various neuromusculoskeletal conditions including muscular dystrophies, neuropathies, orthopedic conditions, and in elderly populations (20+ research publications to date by our group) [9,10,11]. Potential application and utility of RWS outcome measure in stroke population have also been recently demonstrated [12,13]. In a study by our group with 41 stroke patients, the total RSA of the paretic side correlated well with the Fugl-Meyer Assessment Upper Extremity (FMA-UE; R2=0.68, p<0.01), the Motricity Index for Upper Extremity (MI-UE; R2=0.65, p<0.01), and the Disabilities of the Arm, Shoulder, and Hand questionnaire (QuickDASH; R2=0.42, p<0.01) [12]. Furthermore, the RSA demonstrated its potential as a surrogate marker to reliably track the recovery of UE mobility post stroke. Increases in total RSA were observed with higher Brunnström recovery stages - a clinical measure of the recovery of coordinated movement after stroke [12]. In another study of 58 hemi-paretic stroke patients, the RWS ratio demonstrated very high correlations with the FMA-UE total and the proximal scores (FMA-UE total: r = 0.81, P < .001; proximal: r = 0.89, P < .001) [13]. However, thus far the RWS correlations with actual UE function in daily living, as measured by an ADL functional measure (clinician-evaluated FIM instrument) and a patient-reported outcome (PRO) measure such as NeuroQoL upper extremity, have not yet been examined.
In this paper, in order to further extend its practical application and characterize the clinical meaningfulness of reachable workspace outcome measure as it relates to actual daily living functions, we focus our attention on correlations between reachable workspace RSA and clinician-assessed upper extremity ADL measure (FIM, self-care) as well as patient’s self-reported assessment of ADL function (NeuroQoL, upper extremity), in a cohort of stroke patients with varying degrees of hemiparesis undergoing rehabilitation program. It is also important to determine whether a functional outcome measure is sensitive enough to detect clinically meaningful change over time. Therefore, this study also examines whether longitudinal changes in FIM self-care as observed in recovering stroke patients with upper extremity hemiparesis is similarly reflected by changes in reachable workspace RSA (from longitudinal data collected at admission, discharge, and at 3-month).
2. Materials and Methods
2.1. Overall Study Protocol
This longitudinal observation study followed the STROBE guidelines for research [14]. The study recruited participants aged ≥ 18 years, from August 2017 to October 2019 admitted to a university hospital acute rehabilitation unit. FIM self-care score, NeuroQoL upper extremity score, and reachable workspace RSA data (from both stroke-affected and unaffected arms) were collected at three time points: upon admission, at discharge, and at the 3-month follow up visit. The study protocol was approved by the Institutional Review Board (IRB) for conduct of ethical research, and written informed consent was obtained before the start of the study procedures.
2.2. Study Participants
A total of 22 participants potentially eligible were screened and 17 participants, who met all the inclusion criteria, with stroke as the primary admission diagnosis, were enrolled in the study. Only those participants who were able to understand and follow all study instructions were enrolled. Consecutive participants admitted to the rehabilitation unit during the study period were screened, and those meeting all inclusion criteria were enrolled; no formal power analysis was performed. Demographic, baseline anthropometric, relevant clinical information, and study outcome measures were collected at the time of admission to the rehabilitation unit. Subsequent study measures were collected for 15 patients at discharge (2 patients were unavailable for RSA data collection at the time of discharge) and at 3-month follow up, data from 13 patients were collected (2 patients were lost to follow up). Measurement errors were minimized by using a single evaluator throughout the study.
2.3. Outcome Measures
2.3.1. Functional Independence Measure (FIM Self-Care)
The FIM instrument is a valid and reliable tool to assess an individual’s ability to perform ADLs [15]. Typically, patient function is assessed by a clinician using the FIM at the start and at the end of a rehabilitation episode of care. Inter-rater reliability of FIM has been established at an acceptable psychometric performance level (Intra-class correlation coefficient, ICC ranging from 0.86-0.88 [16]. The concurrent validity with Barthel Index (ICC>0.83) have shown strong construct validity between Barthel Index and items on the FIM that measure functional limitation [15]. There are six subsections in the FIM: Self-care, Sphincter Control, Transfers, Locomotion, Communication, and Social Cognition. For the purposes of this study, focus will be on the self-care section of FIM as the more relevant upper extremity functional measurement. The FIM self-care section includes six elements of functional assessment: Eating, Grooming, Upper Body Dressing, Lower Body Dressing, Bathing, and Toileting. FIM score can range from 1 to 7, with 1 being categorized as requiring total assistance and 7 being complete independence [17]. Therefore, the range of total score available for the FIM self-care section would be 6-42, with higher score indicating higher function.
2.3.2. NeuroQoL (Upper Extremity Function)
NeuroQOL is a validated questionnaire-based PRO (patient reported outcome) and a self-report of health-related quality of life in 17 domains for adults and 11 for children with various neurological disorders including stroke [18,19,20]. Specifically, the NeuroQoL upper extremity function domain questionnaire assesses fine motor and ADL function. The questionnaire comprises of 20-item questions with scaled scores to evaluate severity of upper extremity functional impairment to perform various ADLs involving manual and upper extremity reach-related functions [18]. The participant answers the questionnaire on how they would self-assess their performance regarding a given task: 1. Unable to do; 2. With much difficulty; 3. With some difficulty; 4. With a little difficulty, or 5. Without any difficulty. Each response is assigned a number ranging from 1-5 depending on the respective response to the question. These numbers determine the raw score. The range of total scores would be 0-100, with a higher score indicating higher function.
2.3.3. Upper Extremity Reachable Workspace Protocol and Analysis
The upper extremity reachable workspace (RWS) measurement was performed using the Kinect 2.0 sensor following previously published protocols [8]. The method has demonstrated excellent reliability and validity across numerous studies in various patient populations by multiple different investigators [9,10,11]. Briefly, participants performed a set of standardized movements designed to assess reachability of outstretched arm to various locations in 3D space within each arm’s reach while the sensor tracked the arm movement, lasting about 1.5 minutes per arm (Figure 1). Each arm is tested separately, and respective RWS measure is obtained. Following the previously published and established protocol for analysis [8,9,10,11], the frontal RWS envelope was split into four different quadrants with the shoulder joint serving as the origin: Q1 to Q4 and posterior inferior-lateral quadrant, designated as Q5. As previously described, to allow for comparison between patients, absolute total, and each quadrant’s reachable workspace surface envelope areas (m2) were normalized by each individual’s arm length to obtain the relative surface area, RSA [8]. The RSA results are displayed both numerically and visually with spatial mapping, with each frontal quadrant maximum value of 0.25 (four frontal quadrants sum to 1.0) and with addition of one posterior inferior-lateral quadrant contributing (0.25), results in a maximum value of 1.25 ‘for a total of five RSA quadrants’. For this study, the RSA values of each individual arm separately as well as an average of both arms from each study participant were used for analyses.
Reachable workspace system set up with a participant undergoing arm movement protocol in front of the video guide and Kinect sensor (A). An individual’s reachable workspace reconstructed from the collected arm movement tracing, and the visual output of relative surface area (RSA) envelope shown with four frontal quadrants Q1-4 (B) and one posterior inferior-lateral quadrant Q5 (C): Q1-4 are frontal quadrants viewed from front (B); Q1, medial upper quadrant; Q2, medial lower quadrant; Q3, lateral upper quadrant; Q4, lateral lower quadrant; and Q5 lateral view (right side shown for all).
2.4. Statistical Analysis
The demographic and clinical characteristics of the study participants are presented as the mean and standard deviation for all continuous variables, and for the dichotomous variable, such as sex, is presented as frequency and percentage. Pearson and Spearman’s rank correlation coefficients were used to determine the cross-sectional relationships between RSA and clinical outcome measures, including FIM self-care and NeuroQoL. Multiple linear regression was performed to investigate which quadrant, or combination of quadrants, or total of all quadrants (Q1-Q5) is correlated with the change in clinical outcome measures of interest. Statistical analyses were conducted using SPSS version 29 (SPSS Inc., Chicago, IL, USA), with a p-value of <0.05 as the level of statistical significance. Additionally, all statistical significance was assessed through evaluating if the Benjamini-Hochberg adjusted p-values were less than 0.05 to correct for multiple comparisons [21]. Missing data was not included in the final data analysis.
3. Results
3.1. Study Participants
Baseline information of the participants and available clinical information are presented in Table 1. Seventeen participants at baseline demonstrated an average age of 62.76 years old (SD=12.46). Slightly less than half of the participants were male (41.2%, n=7). Data from discharge and 3-month follow up showed an average age of 62.60 years old (SD=12.96) and 65.23 (SD=11.68) respectively. The initial mean National Institutes of Health Stroke Scale (NIHSS) was 9 for the available 15 of 17 participants, with a range of 2-20. The mean FIM self-care was 17.71 (SD=5.57) at admission which increased to 30.53 (SD=7.03) at discharge and further increased to 37.15 (SD =5.72) at 3-month follow up. The mean NeuroQoL upper extremity score was 69.06 (SD=16.32) at admission which increased to 76.73 (SD=14.45) and further increased to 82.15 (SD=14.91) at 3-month follow up.
3.2. Reachble Workspace (at Admission, Discharge, and 3-Month Post Stroke)
Reachable workspace data (RSAs) from each arm and average of both arms were obtained for analyses. Extensive RSA data comprised of each quadrant (Q1-5) and the combined total RSA for each arm at admission, discharge, and at 3-month follow up, as well as bilateral averaged RSA data, are available for review (data shown for paretic arm, Table 2). Overall, as expected the RSAs of the unaffected arm remained stable throughout the course of the study, while the stroke-affected paretic arm’s RSAs showed significant initial reduction at admission with gradual improvement on discharge and at 3-month follow up (Figure 2). The study cohort’s mean RSAs of paretic and bilateral arms by each quadrant and total RSA at admission, discharge, and 3-month are shown in Figure 3.
Graphical visualization of bilateral relative surface area (RSA) of an example subject at admission (A), discharge (B), and 3-month follow up (C) are shown. Top panels show RSAs of the unaffected left arm and the bottom panels show RSAs of the stroke-affected right side, gradually improving over time.
Changes in reachable workspace post stroke from admission, to discharge, to 3-month follow up. Bar graph of the mean RSAs from the stroke-affected arm, showing individual quadrant’s RSAs (Q1-5) and total RSA (A). Bar graph of the mean RSAs of averaged bilateral arm data, showing individual quadrant’s RSAs (Q1-5) and total RSA (B).
3.3. Reachable Workspace (RSA) Correlation with FIM Self-Care and NeuroQoL
There is a moderate to fairly strong positive correlation between the individual quadrant RSAs and total RSA to FIM self-care score at admission (Table 3; Pearson correlation coefficient, r=0.574 for Q1, r=0.833 for Q2, r=0.636 for Q3, r=0.822 for Q4, r=0.821 for Q5, and r=0.812 for Total RSA, p<0.05). The correlation between total RSA and total FIM self-care score remain moderately strong at discharge and 3-month follow up visit (r=0.619, r=0.661, respectively, p<0.05). For individual quadrant results, Q2, Q4, and Q5 show strong correlation with upper body dressing, lower body dressing, and toileting on admission, while Q1 and Q3 with less strong correlation. At discharge, both Q4 and Q5 show correlation with upper and lower body dressing. At 3-month follow up, Q2 shows correlation with bathing and toileting while Q5 correlates well with bathing and upper body dressing. There is also a fairly strong positive correlation between the total RSA and the NeuroQoL upper extremity total score at discharge and 3-month (r=0.690, r=0.815, respectively, p<0.01).
3.4. Regression Analyses Evaluating Longitudinal RSA Change Compared to FIM Self-Care Change
Multiple linear regression was used to test if changes in RSA significantly correlated with FIM self-care changes over time. Evaluating changes from admission to discharge, regression analyses examining various RSA changes (each quadrant, total, upper, lower, medial, lateral, and other quadrant combinations) with FIM self-care changes (each component ADL activities and total) showed an overall positive relationship between the changes in bilateral RSAs compared to the changes in FIM self-care; but, only Q4 and total FIM self-care score reached statistical significance (β=8.045, p<0.02) (data not shown).
However, when looking at changes from admission to 3-month follow up, significant correlations were found in all quadrant’s and total RSA changes (except Q3) with total FIM self-care change (Q1 r=0.663, p<0.01; Q2 r=0.762, p<0.00; Q3 r=0.523, p<0.07; Q4 r=0.782, p<0.001; Q5 r=0.714, p<0.01; Total RSA r=0.786, p<0.001 respectively) (Table 4, Figure 4). Additionally, multiple linear regression analyses examining various RSA changes (total, each quadrant, and combinations) from admission to 3-month follow up with FIM self-care changes (total and each of the component ADLs) showed statistically significant correlations as shown in detail (Table 5): for example, ∆Total FIM Self-Care and ∆ Average of Two Arms Q1 β=5.813, p<0.046; ∆Total FIM Self-Care and ∆ Average of Two Arms Q2 β=12.918, p<0.014; ∆Total FIM Self-Care and ∆ Average of Two Arms Q4 β=10.305, p<0.01; ∆Total FIM Self-Care and ∆ Average of Two Arms Q5 β=7.662, p<0.006; ∆Total FIM Self-Care and ∆ Average of Two Arms Lateral Q3Q4Q5 β=1.908, p<0.012; ∆Total FIM Self-Care and ∆ Average of Two Arms Total RSA Q1-Q5 β=2.011, p<0.008. Results of the analyses show that comparing two subpopulations, differing in change of total RSA (average of the sum of Q1 to Q5 bilaterally) from baseline to 3-month follow up by 0.1 units, who are otherwise similar with respect to baseline FIM self-care score, an estimated average difference in total FIM self-care score of 2.011 points is noted (95%CI: 0.663 points, 3.360 points). This result is found to be statistically significant at the p=0.008 level.
4. Discussion
With sudden loss or serious impairment of hemi-body motor control resulting from a stroke, patients with stroke typically experience significant limitation in their ability to perform even the basic functions of daily activities. Impairment of upper extremity function, even on one side, can have a drastic impact on performance of many ADL functions, some affected more than others. These coordinated movements of both upper extremities to varying degrees are often necessary for efficient and successful performance of ADLs. Despite drastic initial negative impact on ADL functions soon after a stroke, with rehabilitation interventions and therapy, along with adaptive compensation strategies that occur in the context of natural stroke progression and recovery process, most patients with stroke regain some functions over time as seen by improvements in clinician-evaluated FIM scores. Similarly, this study’s stroke cohort’s FIM self-care score also improved over time, after inpatient stroke rehabilitation and at 3-month follow up.
The results of this study demonstrate for the first time that the change in stroke patients’ reachable workspace (RSA) correlates well with the observed change in FIM self-care score from admission to 3-month follow up. Specifically, in the study’s cohort of stroke patients after rehabilitation program and undergoing functional recovery process, a 0.1 improvement in the average of total reachable workspace RSA bilaterally (approx. 8% improvement in overall upper extremity reachability of the stroke-affected paretic arm) correlates to a 2.011 point improvement in FIM self-care score. Furthermore, stroke patients’ self-assessment of upper extremity function (and clinically meaningful ADL functional aspects to patients themselves) as noted by NeuroQoL, correlated very well with reachable workspace RSAs. Together, the study’s findings suggest that longitudinal tracking of reachable workspace RSA through an unobtrusive and relatively quick sensor-based evaluation is feasible in stroke patients and can provide clinically-meaningful functional outcome regarding real-life upper extremity ADL functions.
This is an important finding of the study since measuring and quantitatively tracking meaningful change in real-life ADL function has been challenging, as even the most basic daily living functional activities involve complex interplay of component upper extremity motions at multiple joints working in a coordinated fashion to accomplish a given task. Until now an individual’s ability to perform multiple functional tasks have traditionally relied on clinical assessment by an experienced therapist or clinician to determine the FIM self-care score (or a similar tool such as QI), which takes into account complex movements that require both proximal and distal upper extremity range of motion, muscle strength, motor control, and dexterity. However, since adequate range of motion and motor control proximally at the shoulder is necessary to locate the distal upper extremity in 3D space (within an individual’s reach) to accomplish various functional tasks, an upper extremity functional measure that incorporates both shoulder motion and reachability may serve as a viable surrogate marker for ADL function8. The importance of shoulder range of motion to achieve various daily-life functions has been reported previously. According to Safaee-Rad et al., the necessary shoulder complex motion for someone to eat includes shoulder flexion to 36 degrees, abduction to 22 degrees, medial rotation to 18 degrees, and horizontal adduction of 87 degrees [22]. Furthermore, according to Matsen et al., one must have a shoulder extension of 38 degrees, and horizontal abduction of 86 degrees in order to reach perineum for hygiene tasks [23]. As shown in the study, longitudinal improvements in overall FIM self-care and NeuroQoL at 3-month follow up were closely reflected by improvements in RSA, providing added support for the validity and clinical meaningfulness of the reachable workspace outcome measure in stroke patients.
However, in stroke, it is important to keep in mind that even when one upper extremity is impaired, the unaffected upper extremity may be utilized to accomplish many of the ADL functions. Additionally, as stroke recovery progresses, learned utilization of compensatory maneuvers in the paretic arm along with using unaffected arm, an individual may be able to accomplish the necessary tasks albeit it in an atypical way. Therefore, evaluating the combined reachable workspace of bilateral upper extremity in addition to the impaired extremity would be important to correlate with actual ADL functions.
In the previous study evaluating the initial feasibility and clinical applicability of reachable workspace in stroke population, the RSA only in the stroke-affected paretic arm and its correlation to various upper extremity impairment measures were examined [13]. When comparing sensor-captured upper extremity motion measure such as RWS to functional assessments like FIM and NeuroQol which incorporates many different bilateral ADL tasks, the global nature of bilateral upper extremity movement needs to be considered. When a stroke patient has limitations of self-care, compensation by the unaffected arm will instinctively come into play and will ultimately be used to affect the functional assessment score or self-reported measure of function. To account for this bilateral aspects of upper extremity function, combined RSAs from bilateral arms may be able to better estimate ADL function in stroke patients, and indeed this is supported by the study’s findings.
Additionally, the relative degree of functional impairment in the stroke-affected paretic distal upper extremity (hand dexterity or fine motor control) will significantly impact an individual’s ability to perform ADL tasks. Although the reachable workspace outcome measure does not directly assess the distal hand function, it nevertheless appears to serve as a surrogate measure that correlates relatively well with overall upper extremity function. This may be the case in general, as motor control and range of motion proximally at the shoulder improve post stroke, the likelihood of improved distal hand function also increases through the typical stages of stroke recovery. Indeed, this correlation between RSA and distal hand function was also noted in stroke population by Lee et al. in their study [13].
Another novel aspect of this study has been the incorporation of the posterior inferior-lateral quadrant, Q5, in the characterization of an individual’s functional reachable workspace. Up until now, frontal four quadrants, Q1-4, have been utilized to describe an individual’s reachable workspace. However, the study shows that incorporating this reachability into posterior inferior-lateral space (Q5) is important and allows for a fuller and more realistic characterization of the shoulder joint and distal arm movements that are necessary for dressing, reaching back, and toileting functional tasks. This study’s findings confirm that Q5 RSA is correlated with both the FIM self-care scores and the self-reported upper extremity function by NeuroQoL.
An interesting finding of the study is that NeuroQol at admission post stroke did not correlate well with RSA, but the correlation steadily improved and got stronger over time. By discharge and at 3-month follow up, essentially all reachable workspace quadrants and total RSA correlated extremely well with NeuroQoL (r=0.815, p<0.001). At this time, it is not completely clear as to why the initial admission NeuroQoL does not closely match the RSA, given the severe degree of upper extremity impairment that a patient experiences right after the stroke and the accompanying severely limited reachable workspace. However, the authors surmise that a patient who undergoes such a sudden loss of previously normal functioning upper extremity (due to the sudden nature of stroke), may not be able to fully grasp the extent of functional limitations in the beginning stages of stroke, and therefore, a self-reported questionnaire outcome such as NeuroQoL obtained so early in the stroke process may not be representative of the actual functional impairment experienced by the patient.
The limitations of this study include relatively small sample size; however, despite that, the primary study questions regarding reachable workspace RSA and its relationship to FIM self-care and NeuroQoL were able to be adequately addressed in the study. In the future, a study with larger sample size and with longer follow up may be able to provide additional information through subgroup analyses of patients with differing degrees of stroke severity or in different stages of stroke recovery and be able to further characterize the longitudinal sensitivity of RSA to ADL functional changes. Another limitation of the study may be lack of a valid, reliable, and sensitive distal upper extremity outcome measure (hand/manual dexterity measure which the outcome field lacks) that can complement the proximal upper extremity reachable workspace outcome measure to address the upper extremity functional assessment more fully and accurately. In the future, developing this combination of proximal and distal upper extremity functional outcome modules which can combine to provide a more detailed characterization of the upper extremity function may be a productive research direction. Additionally, the quality of upper extremity movement can be collected during sensor-acquisition of arm motion; however, incorporation of this information (such as tremor, ataxia, or spasticity) effectively with reachable workspace has not yet been fully developed. Lastly, the utility of FIM instrument to assess a patient’s function in clinical settings is declining as the newer Quality Indicator (QI) has become the standard measure in the U.S. Therefore, the applicability of the study’s findings correlating RSA with FIM self-care may not be as directly impactful. However, since both FIM and QI stem from similar underlying conceptual basis that grade the functional status of an individual based on the level of assistance that person requires for various ADLs, this study’s findings likely can be extended to QI. Further studies specifically looking at correlation between RSA and QI may be needed to confirm.
5. Conclusions
In conclusion, upper extremity ADL functional changes that occur post stroke and during stages of motor recovery can be determined by reachable workspace outcome measure. Relatively quick to obtain and unobtrusive, a sensor-acquired upper extremity reachable workspace measure shows promise as a clinically meaningful and sensitive outcome measure capable of evaluating ADL functional impairment and disability in stroke patients.
Author Contributions
Conceptualization, V.C., and J.J.H.; methodology, V.C. and J.J.H.; formal analysis, V.C., J.M.L., and S.A.L.; investigation, V.C. and J.J.H.; data curation, V.C. and J.J.H.; writing—original draft preparation, V.C. and J.J.H.; writing—review and editing, V.C., J.M.L., S.A.L., and J.J.H.; supervision, J.J.H.; project administration, J.J.H.; funding acquisition, J.J.H. All authors have read and agreed to the published version of the manuscript.
Funding
This research was funded by the Department of Physical Medicine and Rehabilitation at University of California at Irvine School of Medicine.
Institutional Review Board Statement
The study was conducted according to the guidelines of the STROBE and approved by the Institutional Review Board of University of California Irvine (protocol code 2016-2862 and date of approval 06/16/2016).
Informed Consent Statement
Informed consent was obtained from all subjects involved in the study.
Data Availability Statement
The data presented in this study are available on request from the corresponding author. The data are not publicly available due to privacy.
Conflicts of Interest
V.C. is a consultant for Bioniks. J.J.H. is a consultant for Sanofi, Fulcrum Therapeutics, Avidity Biosciences, and Bioniks. The other authors have no conflict of interest to declare.
References
- Jørgensen, H.S.; Nakayama, H.; Raaschou, H.O.; Olson, T.S. Stroke. Neurologic and functional recovery, the Copenhagen stroke study. Phys Med Rehabil Clin N Am 1999, 10, 887–906. [Google Scholar] [CrossRef]
- Nichols-Larsen, D.S.; Clark, P.C.; Zeringue, A.; Greenspan, A.; Blanton, S. Factors influencing stroke survivors’ quality of life during subacute recovery. Stroke 2005, 36, 1480–1484. [Google Scholar] [CrossRef] [PubMed]
- Jette, D.U.; Warren, R.L.; Wirtalla, C. The relation between therapy intensity and outcomes of rehabilitation in skilled nursing facilities. Arch Phys Med Rehabil. 2005, 86, 373–379. [Google Scholar] [CrossRef]
- Keith, R.A.; Granger, C.V.; Hamilton, B.B.; Sherwin, F.S. The functional independence measure: A new tool for rehabilitation. Adv Clin Rehabil. 1987, 1, 6–18. [Google Scholar]
- Westby, M.D.; Klemm, A.; Li, L.C.; Jones, C.A. Emerging Role of Quality Indicators in Physical Therapist Practice and Health Service Delivery. Phys Ther. 2016, 96, 90–100. [Google Scholar] [CrossRef]
- Vaughn, R.M.; Gangwani, R.; Mark, J.I.; Cassidy, J.M. Preliminary Associations Between Quality Indicators, Motor Status, And Self-efficacy in Early Stroke Rehabilitation. Stroke 2022, 53, ATP70. [Google Scholar] [CrossRef]
- Kozlowski, A.J.; Cella, D.; Nitsch, K.P.; Heinemann, A.W. Evaluating Individual Change With the Quality of Life in Neurological Disorders (Neuro-QoL) Short Forms. Arch Phys Med Rehabil. 2016, 97, 650–654. [Google Scholar] [CrossRef]
- Kurillo, G.; Chen, A.; Bajcsy, R.; Han, J.J. Evaluation of upper extremity reachable workspace using Kinect camera. Technol Health Care. 2013, 21, 641–656. [Google Scholar] [CrossRef]
- Han, J.J.; Kurillo, G.; Abresch, R.T.; De Bie, E.; Nicorici, A.; Bajcsy, R. Upper extremity 3-dimensional reachable workspace analysis in dystrophinopathy using Kinect. Muscle Nerve. 2015, 52, 344–355. [Google Scholar] [CrossRef]
- Hatch, M.N.; Kurillo, G.; Chan, V.; Han, J.J. Motion sensor-acquired reachable workspace correlates with patient-reported upper extremity activities of daily living (ADL) function in facioscapulohumeral dystrophy. Muscle Nerve. 2021, 63, 250–257. [Google Scholar] [CrossRef]
- Chan, V.; Thai, R.; Vartanian, R.; Kim, M.S.; Hatch, M.N.; Koh, J.; Han, J.J. Sensor acquired reachable workspace in the elderly population: A cross-sectional observational study. Medicine (Baltimore). 2022, 101, e29575. [Google Scholar] [CrossRef]
- Lee, Y.M.; Lee, S.; Uhm, K.E.; Kurillo, G.; Han, J.J.; Lee, J. Upper Limb Three-Dimensional Reachable Workspace Analysis Using the Kinect Sensor in Hemiplegic Stroke Patients: A Cross-Sectional Observational Study. Am J Phys Med Rehabil. 2020, 99, 397–403. [Google Scholar] [CrossRef]
- Okuyama, K.; Kawakami, M.; Tsuchimoto, S.; Ogura, M.; Okada, K.; Mizuno, K.; Ushiba, J.; Liu, M. Depth Sensor-Based Assessment of Reachable Work Space for Visualizing and Quantifying Paretic Upper Extremity Motor Function in People With Stroke. Phys Ther. 2020, 100, 870–879. [Google Scholar] [CrossRef]
- Vandenbroucke, J.P.; von Elm, E.; Altman, D.G.; et al. Strengthening the Reporting of Observational Studies in Epidemiology (STROBE): Explanation and elaboration. PLoS Med 2007, 4, e297. [Google Scholar] [CrossRef]
- Ottenbacher, K.J.; Hsu, Y.; Granger, C.V.; Fiedler, R.C. The reliability of the functional independence measure: A quantitative review. Arch Phys Med Rehabil. 1996, 77, 1226–1232. [Google Scholar] [CrossRef]
- Gosman-Hedström, G.; Svensson, E. Parallel reliability of the functional independence measure and the Barthel ADL index. Disabil Rehabil. 2000, 22, 702–715. [Google Scholar] [CrossRef]
- Linacre, J.M.; Heinemann, A.W.; Wright, B.D.; Granger, C.V.; Hamilton, B.B. The structure and stability of the Functional Independence Measure. Arch Phys Med Rehabil. 1994, 75, 127–132. [Google Scholar] [CrossRef]
- Cella, D.; Lai, J.S.; Nowinski, C.J.; Victorson, D.; Peterman, A.; Miller, D.; Bethoux, F.; Heinemann, A.; Rubin, S.; Cavazos, J.E.; et al. Neuro-QOL: Brief measures of health-related quality of life for clinical research in neurology. Neurology. 2012, 78, 1860–1867. [Google Scholar] [CrossRef]
- Kozlowski, A.J.; Singh, R.; Victorson, D.; Miskovic, A.; Lai, J.S.; Harvey, R.L.; Cella, D.; Heinemann, A.W. Agreement Between Responses From Community-Dwelling Persons With Stroke and Their Proxies on the NIH Neurological Quality of Life (Neuro-QoL) Short Forms. Arch Phys Med Rehabil. 2015, 96, 1986–1992. [Google Scholar] [CrossRef]
- Sangha, R.S.; Caprio, F.Z.; Askew, R.; Corado, C.; Bernstein, R.; Curran, Y.; Ruff, I.; Cella, D.; Naidech, A.M.; Prabhakaran, S. Quality of life in patients with TIA and minor ischemic stroke. Neurology. 2015, 85, 1957–1963. [Google Scholar] [CrossRef]
- Benjamini, Y.; Hochberg, Y. Controlling the False Discovery Rate: A Practical and Powerful Approach to Multiple Testing. Journal of the Royal Statistical Society. Series B (Methodological) 1995, 57, 289–300. [Google Scholar] [CrossRef]
- Safaee-Rad, R.; Shwedyk, E.; Quanbury, A.O.; Cooper, J.E. Normal functional range of motion of upper limb joints during performance of three feeding activities. Arch Phys Med Rehabil. 1990, 71, 505–509. [Google Scholar]
- Norkin, C.; White, D. Measurement of Joint Motion: A Guide to Goniometry, 4th ed.; F.A. Davis Company: Philadelphia, 2009; pp. 85–88. [Google Scholar]
Figure 1.
Reachable workspace with component quadrants.
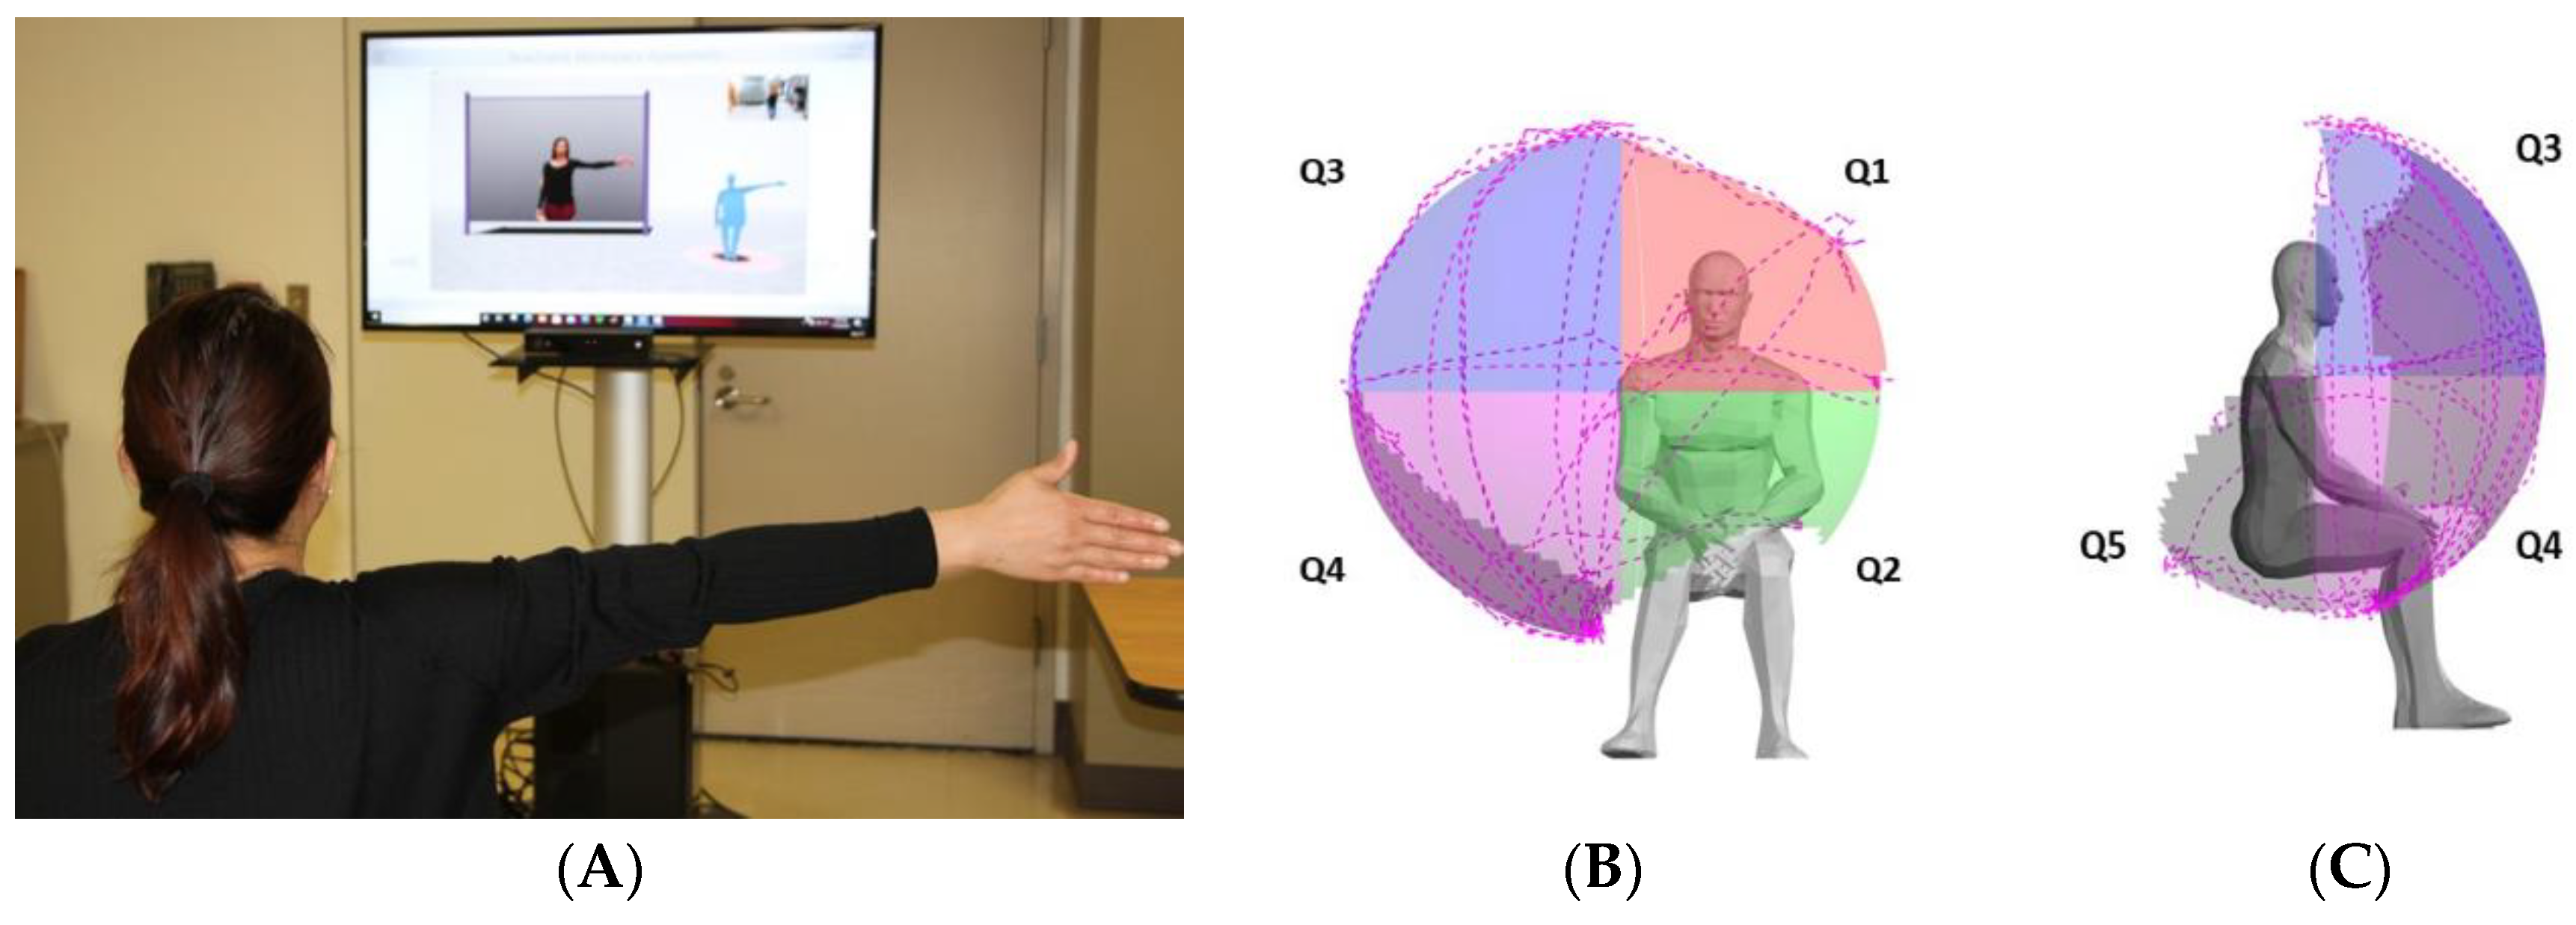
Figure 2.
Reachable workspace upon admission, discharge, and 3-month post stroke.
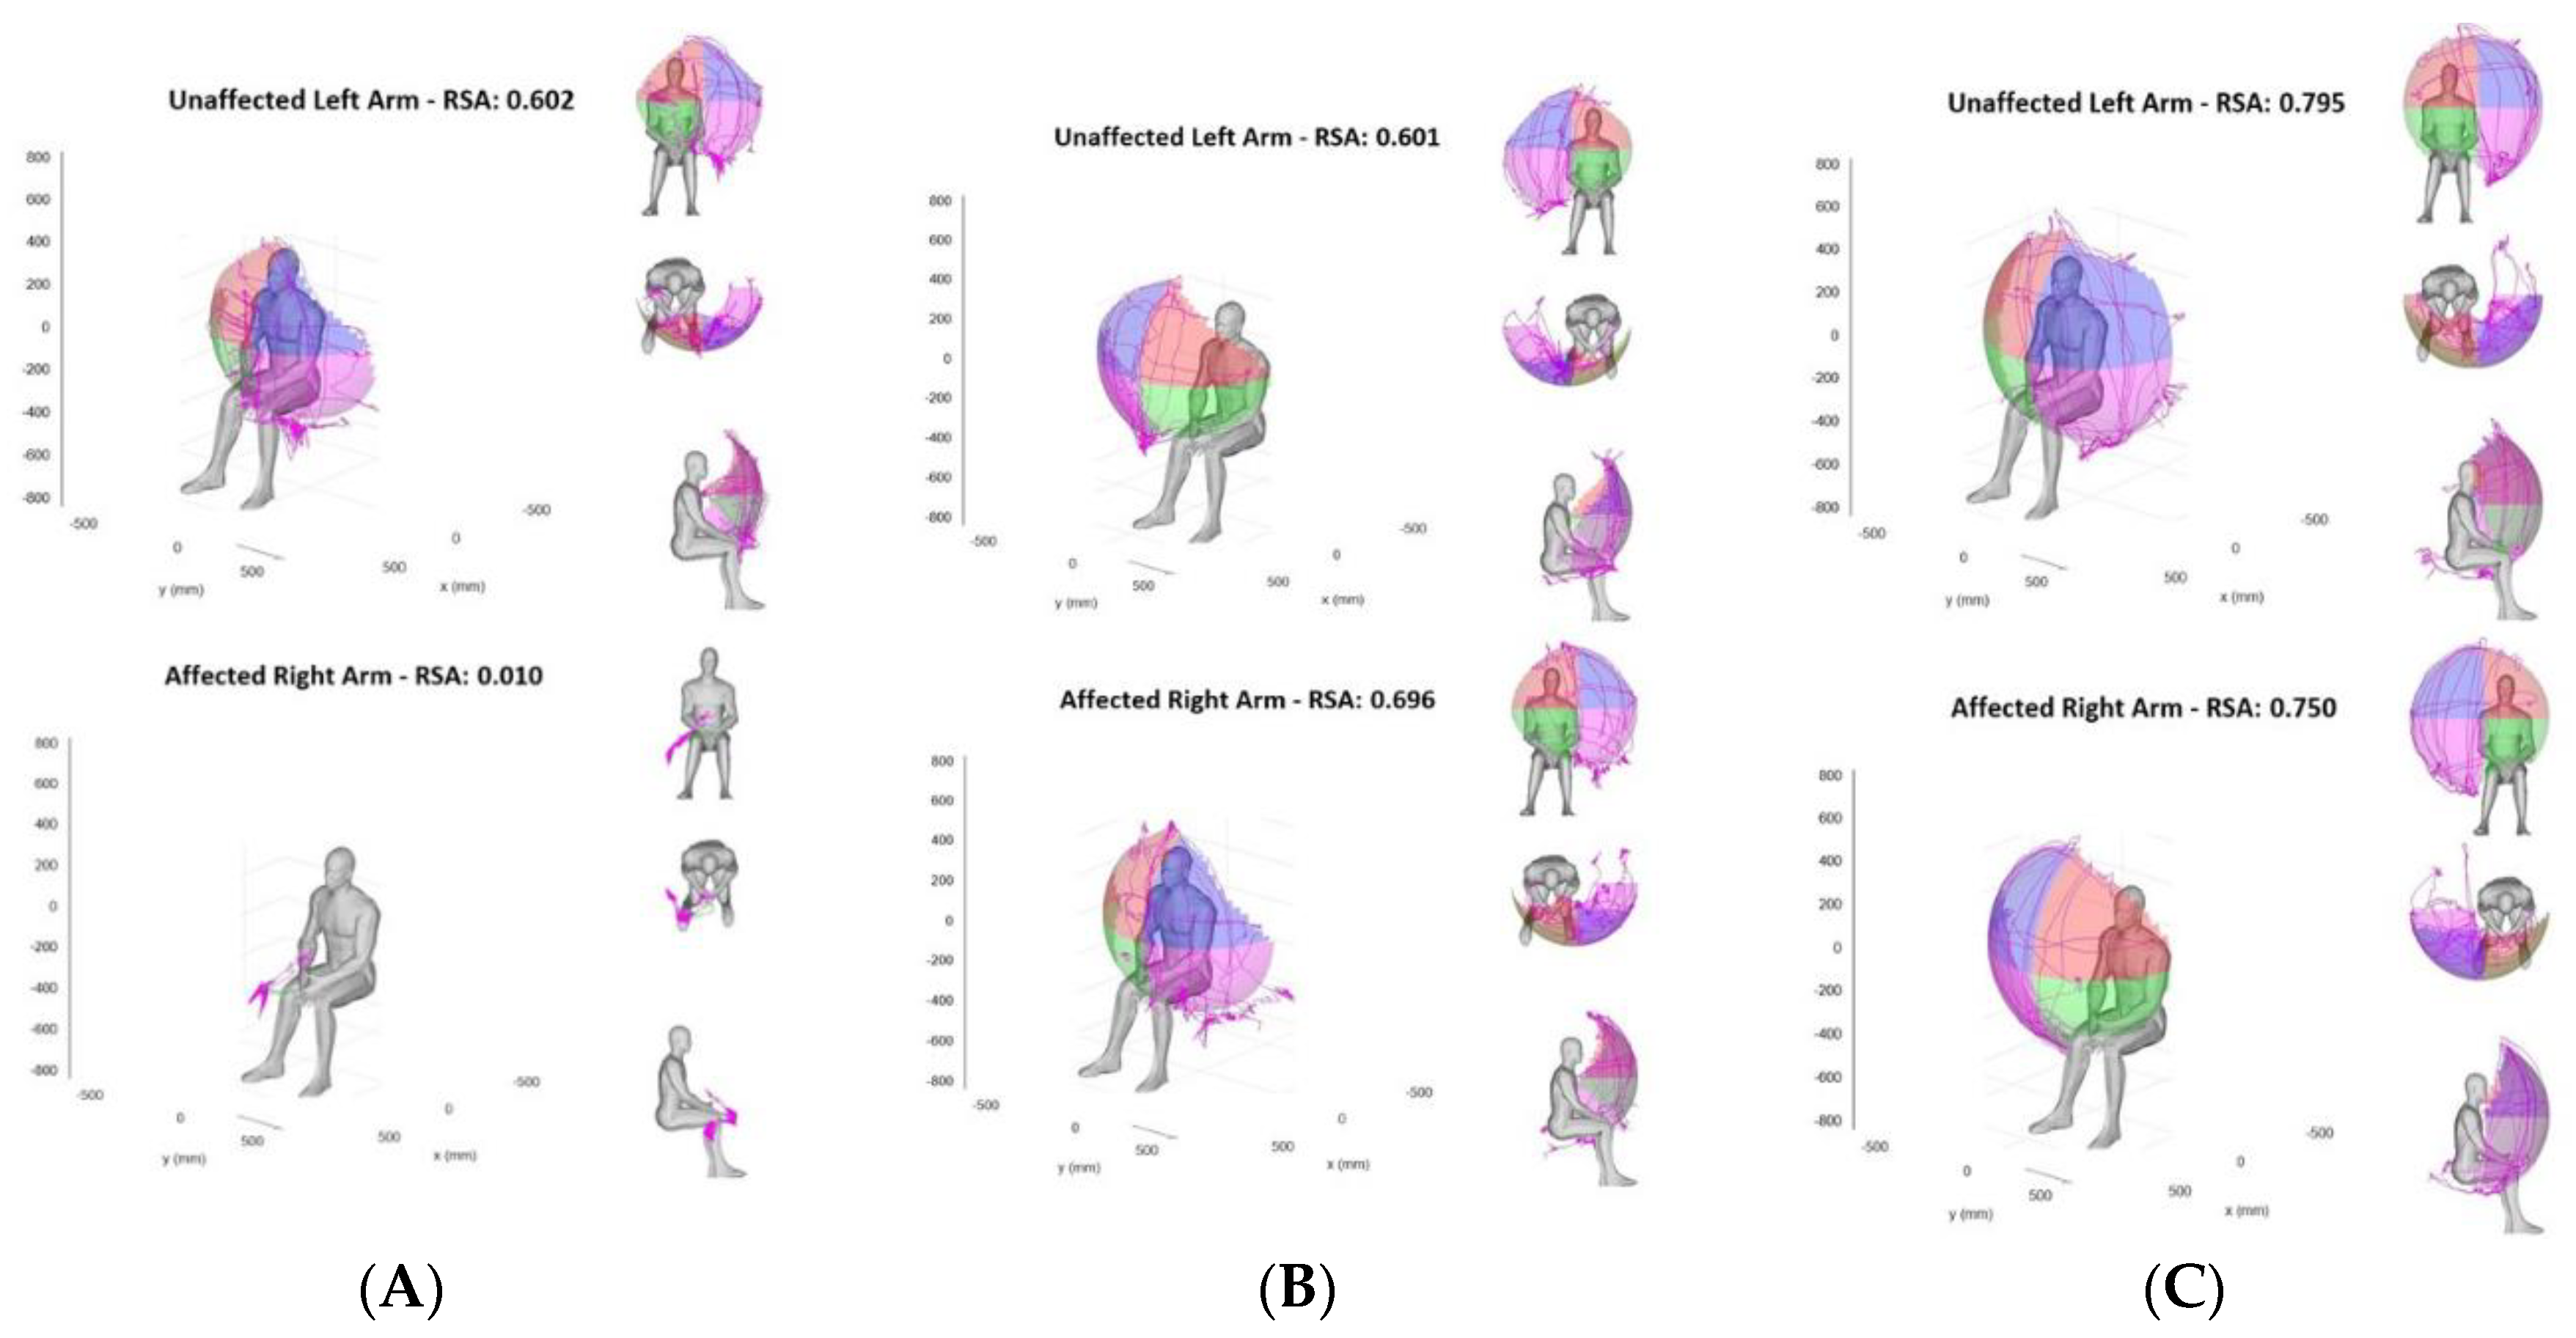
Figure 3.
Stroke-affected paretic arm and bilateral arms reachable workspace change longitudinally.
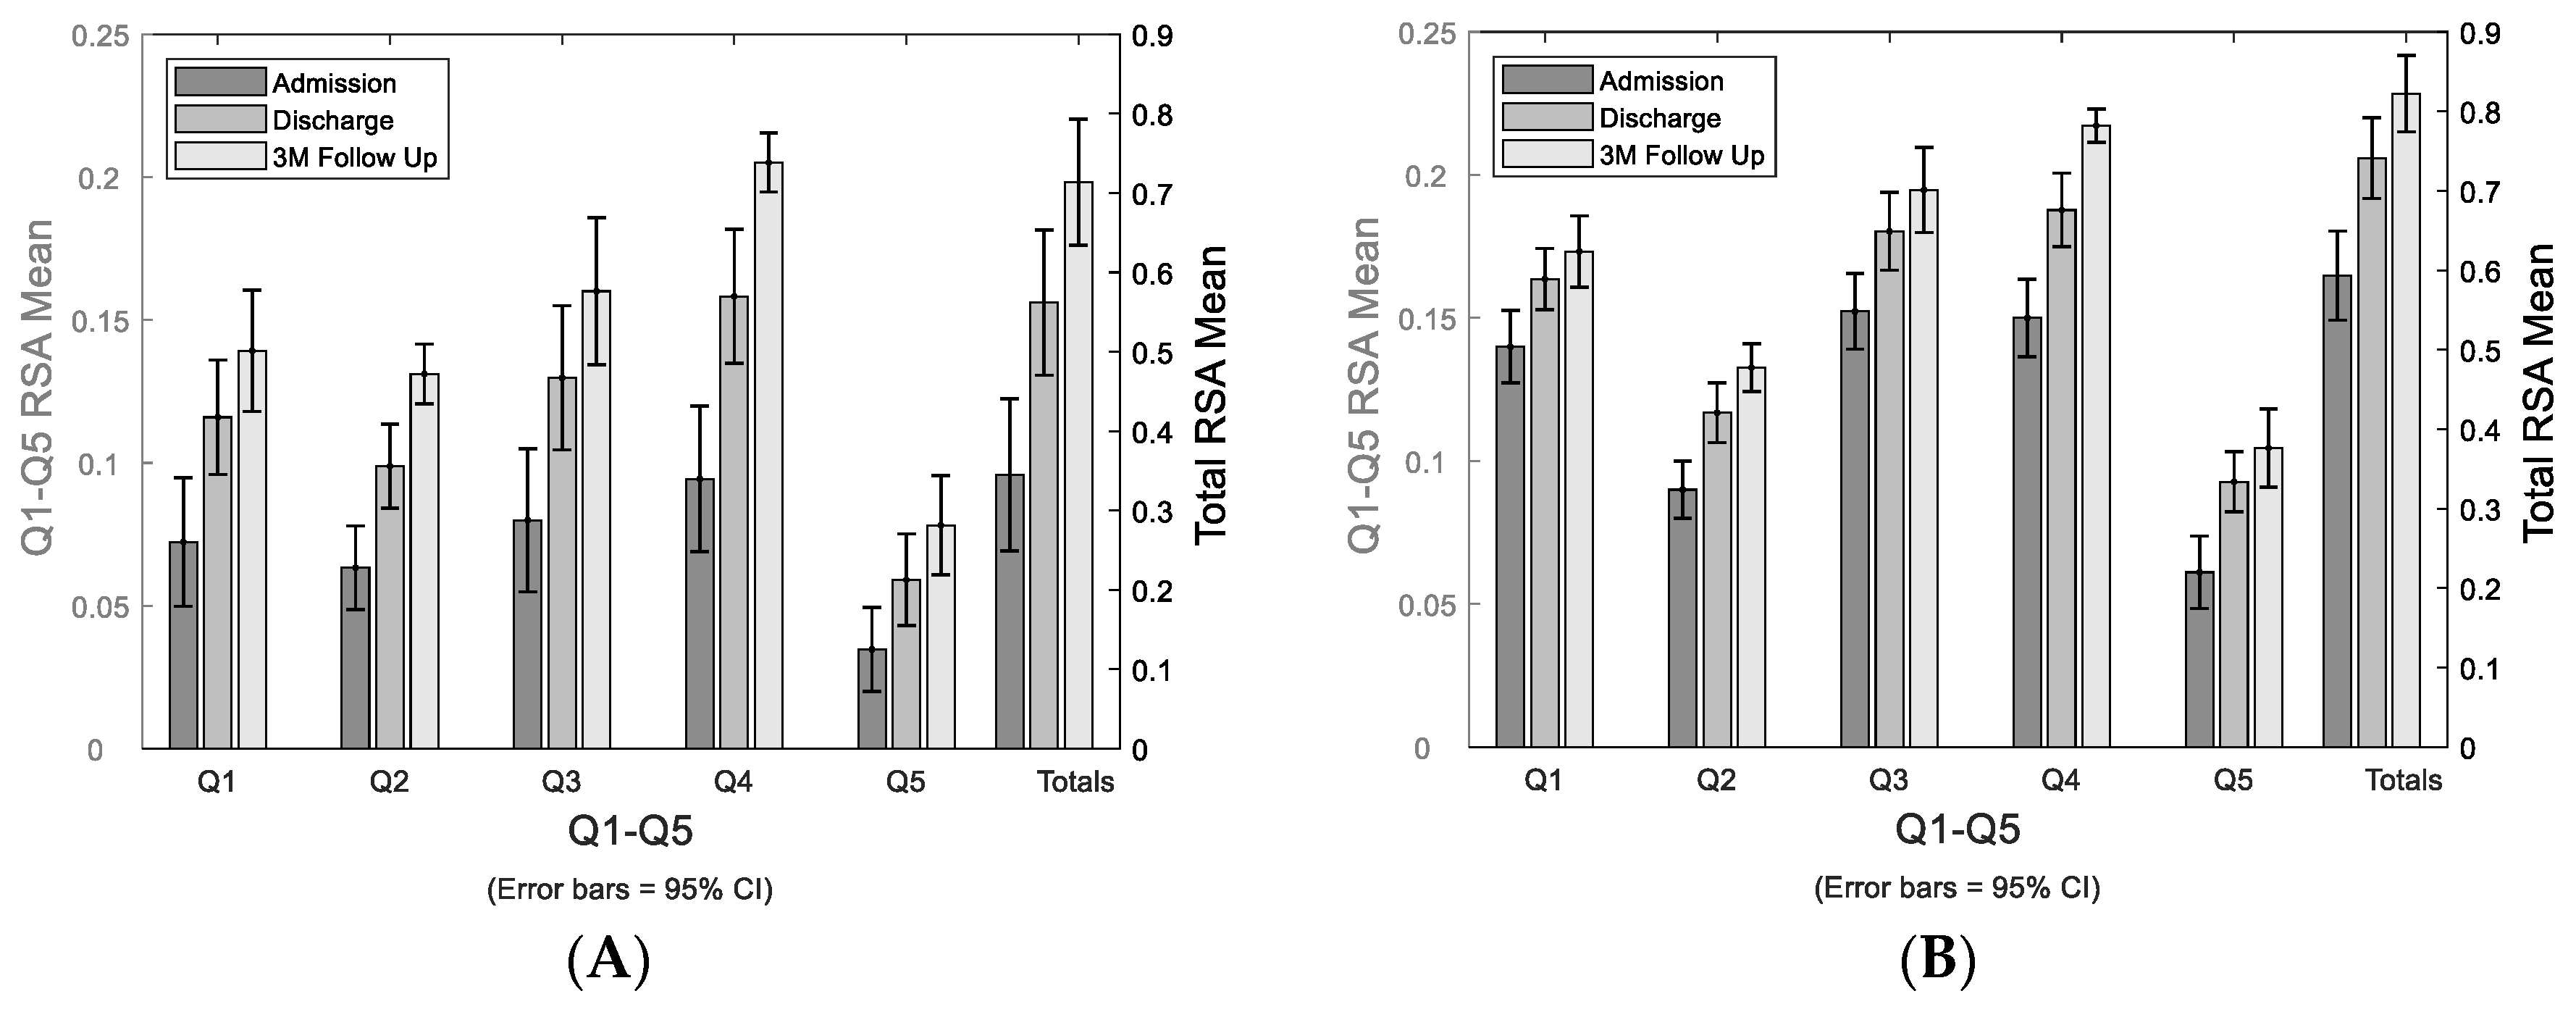
Figure 4.
Correlation between RSA change and FIM self-care (FIMSC) change post stroke. Correlations between ∆RSA (Q1-5 and Total) and ∆FIMSC from admission to discharge (A), and from admission to 3-month follow up (B).
Figure 4.
Correlation between RSA change and FIM self-care (FIMSC) change post stroke. Correlations between ∆RSA (Q1-5 and Total) and ∆FIMSC from admission to discharge (A), and from admission to 3-month follow up (B).
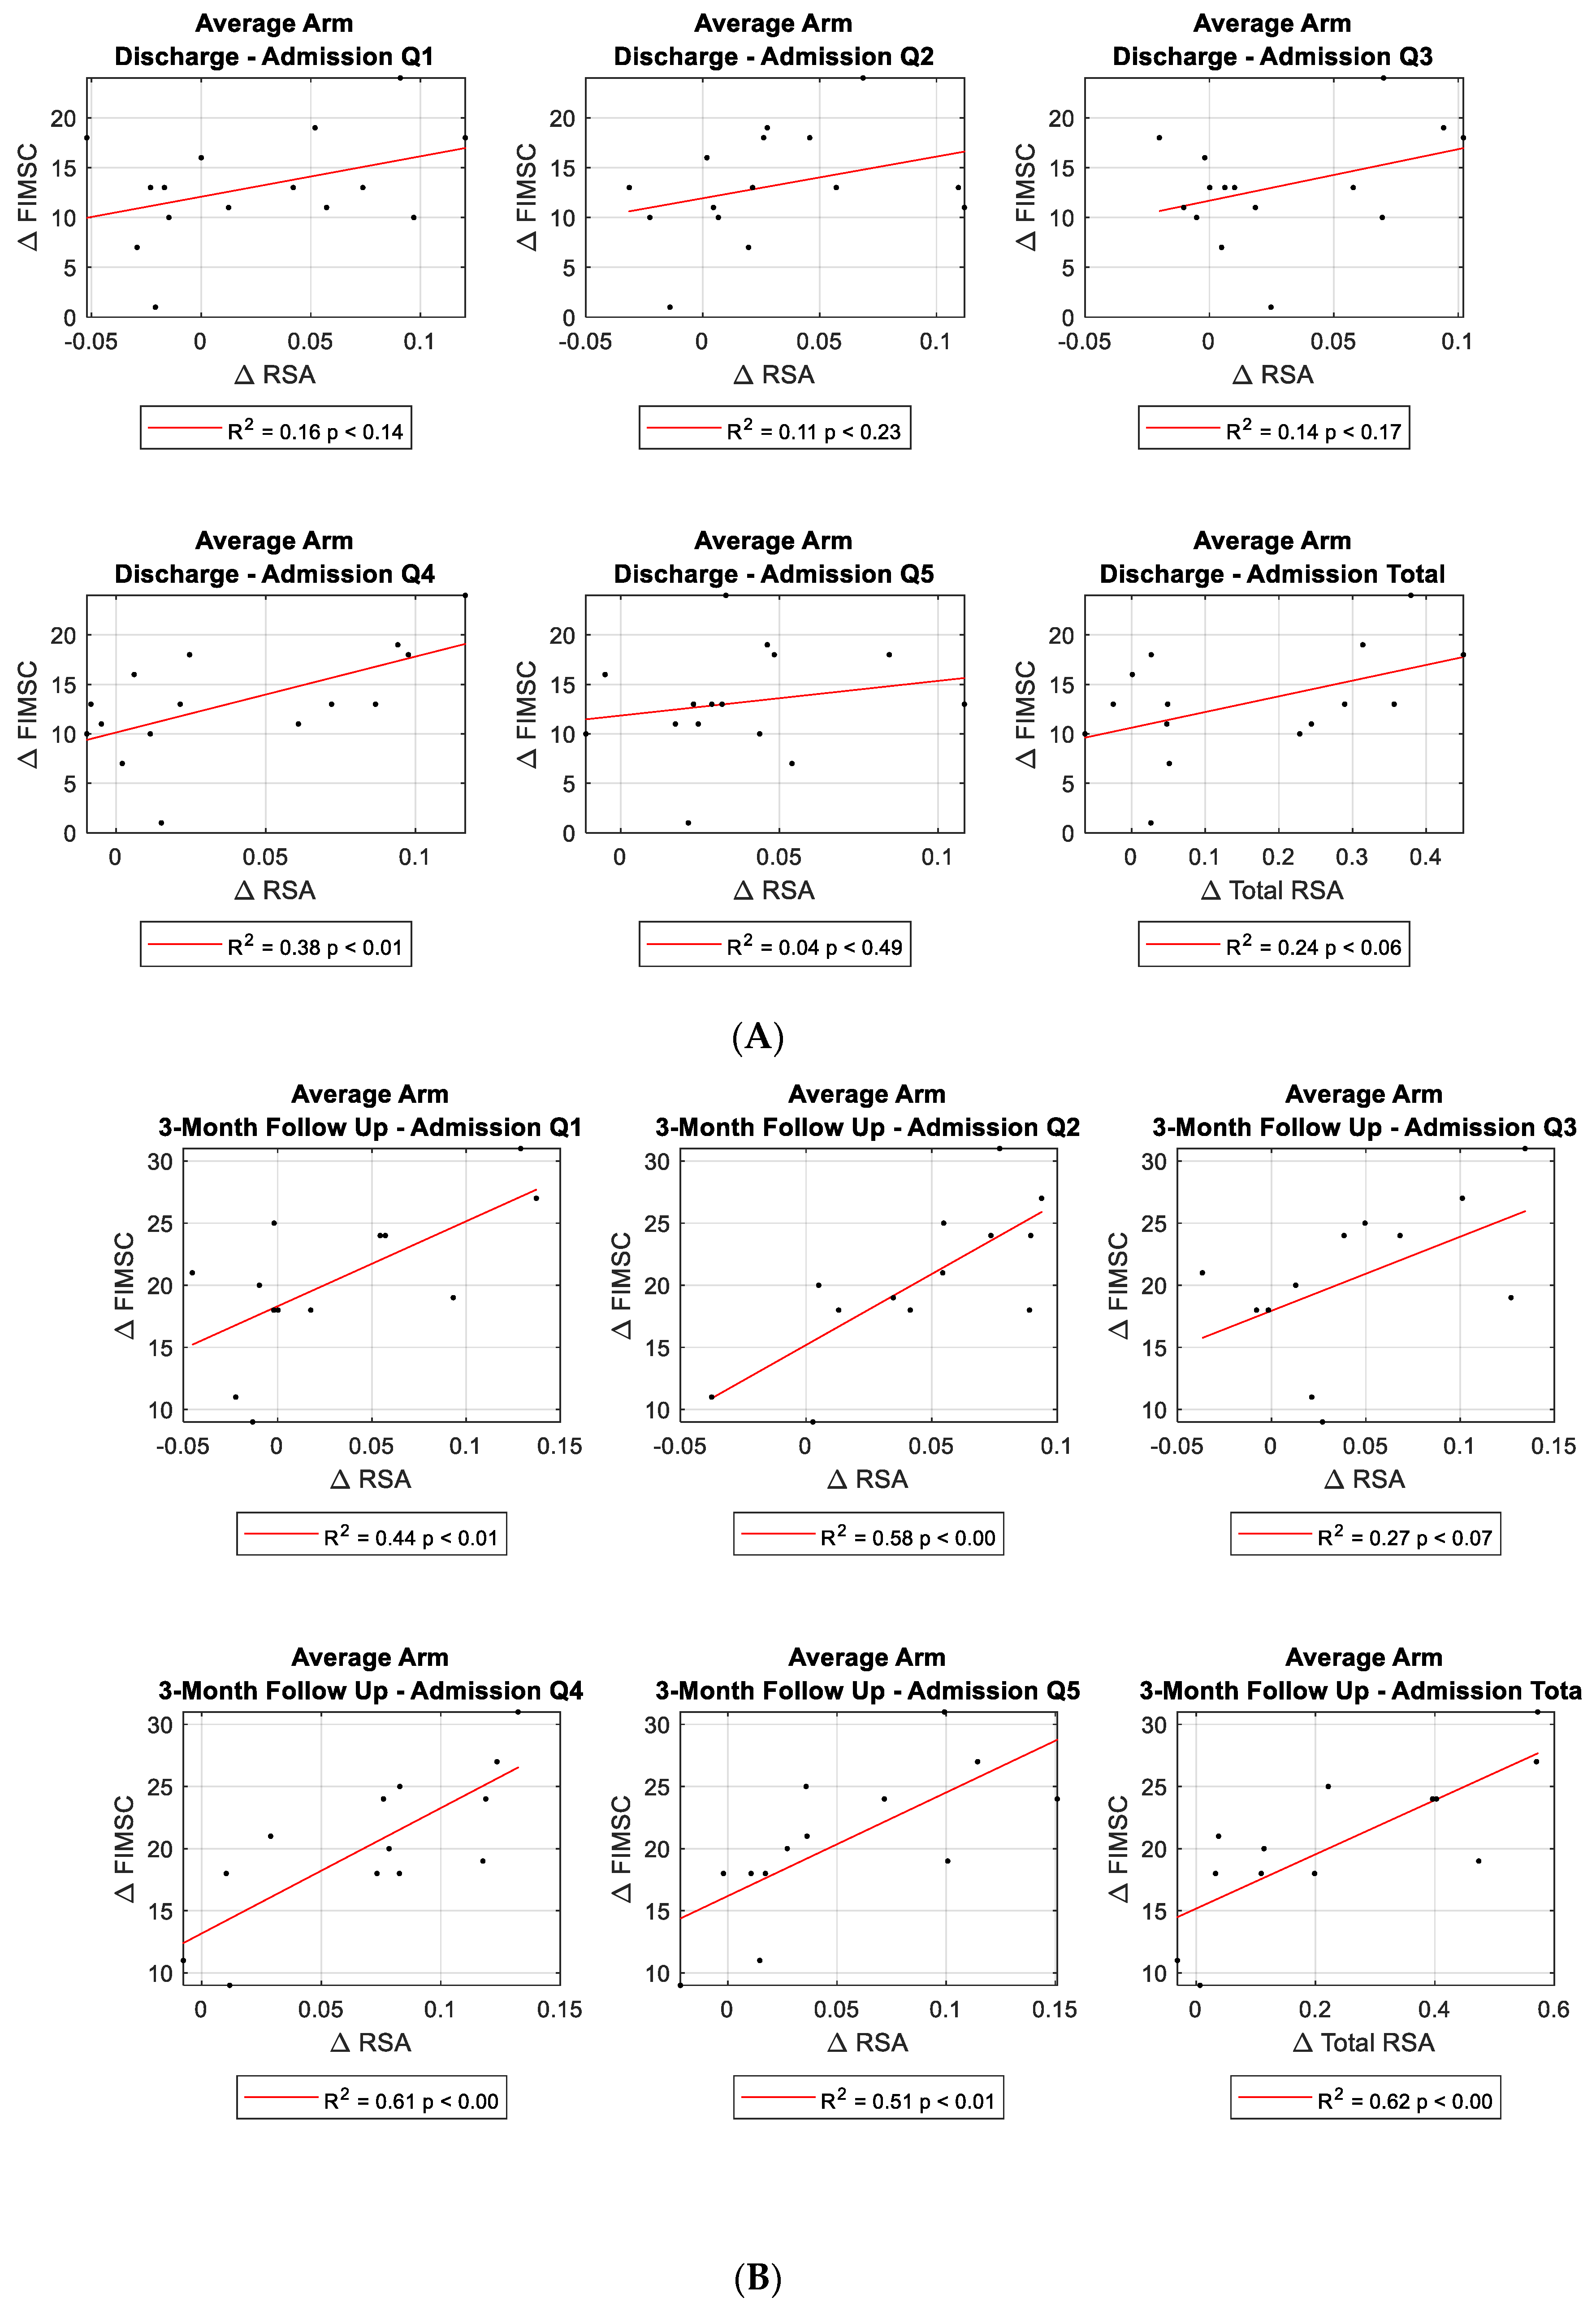

Table 1.
Demographic characteristics of the study participants (N=17) at admission, (N=15) at discharge, and (N=13) at 3-month follow up.
Table 1.
Demographic characteristics of the study participants (N=17) at admission, (N=15) at discharge, and (N=13) at 3-month follow up.
| Admission (N=17) | Discharge (N=15) | 3-Month Follow UP (N=13) | |
| Age, yrs. (Mean ± SD) | 62.76 ± 12.46 | 62.60 ± 12.96 | 65.23 ± 11.68 |
| Age range, yrs. (min, max) | 41, 84 | 41, 84 | 45, 84 |
| Sex (n, %) | 7 (41.2%) male | 6 (40%) male | 6 (46.2%) male |
| 10 (58.8%) female | 9 (60%) female | 7 (53.8%) female | |
| Initial NIHSS, mean (min, max) | 9 (2,20) * | ||
| Self-Care FIM (Mean ± SD) | 17.71 ± 5.57 | 30.53 ± 7.03 | 37.15 ± 5.72 |
| NeuroQOL (Mean ± SD) | 69.06 ± 16.32 | 76.73 ± 14.45 | 82.15 ± 14.91 |
| LOS Rehabilitation (Mean ± SD) | 18.87 ± 12.06 | ||
| Type of Stroke, n Ischemic |
13 |
12 |
10 |
| Hemorrhagic | 4 | 3 | 3 |
| Hemiplegic side, n | |||
| Right | 7 | 6 | 5 |
| Left | 10 | 9 | 8 |
SD = standard deviation. NIHSS = National Institutes of Health Stroke Scale. LOS = Length of stay for inpatient stroke rehabilitation. *12 participants only. Missing data of five patients transferred from outside facility or without initial NIHSS.
Table 2.
The mean relative surface area (RSA) of stroke-affected arm by individual and total quadrants at admission, discharge, and 3-month follow up. .
Table 2.
The mean relative surface area (RSA) of stroke-affected arm by individual and total quadrants at admission, discharge, and 3-month follow up. .
| Affected Side RSA | Admission (N=17) | Discharge (N=15) | 3m Follow Up (N=13) |
| (Mean ± SD) | (Mean ± SD) | (Mean ± SD) | |
| Quadrant 1 | 0.072 ± 0.090 | 0.116 ± 0.075 | 0.139 ± 0.073 |
| Quadrant 2 | 0.063 ± 0.059 | 0.099 ± 0.055 | 0.131 ± 0.036 |
| Quadrant 3 | 0.080 ± 0.100 | 0.130 ± 0.094 | 0.160 ± 0.089 |
| Quadrant 4 | 0.094 ± 0.102 | 0.158 ± 0.088 | 0.205 ± 0.036 |
| Quadrant 5 | 0.035 ± 0.059 | 0.059 ± 0.060 | 0.078 ± 0.060 |
| Total (Q1-Q5) | 0.345 ± 0.384 | 0.562 ± 0.343 | 0.714 ± 0.275 |
Table 3.
Correlation between bilateral arms average RSA and FIM Self-Care assessment and NeuroQoL at Admission, Discharge and 3-month follow up.
Table 3.
Correlation between bilateral arms average RSA and FIM Self-Care assessment and NeuroQoL at Admission, Discharge and 3-month follow up.
| FIM Self-Care at Admission (N=17) | RSA Q1 | RSA Q2 | RSA Q3 | RSA Q4 | RSA Q5 | Total RSA Q1-Q5 | ||||||
| ρ | P value | ρ | P value | ρ | P value | ρ | P value | ρ | P value | ρ | P value | |
| Eating | 0.133 | 0.611 | 0.500 | 0.041* | 0.098 | 0.707 | 0.331 | 0.194 | 0.496 | 0.043* | 0.304 | 0.236 |
| Grooming | 0.740 | 0.777 | 0.226 | 0.384 | 0.050 | 0.848 | 0.281 | 0.274 | 0.318 | 0.213 | 0.196 | 0.450 |
| Bathing | 0.395 | 0.117 | 0.516 | 0.034* | 0.645 | 0.005*† | 0.740 | <.001*† | 0.538 | 0.026* | 0.650 | 0.005*† |
| UB Dressing | 0.535 | 0.027* | 0.813 | <.001*† | 0.452 | 0.068 | 0.859 | <.001*† | 0.858 | <.001*† | 0.782 | <.001*† |
| LB Dressing | 0.500 | 0.041* | 0.700 | 0.002*† | 0.542 | 0.025 | 0.854 | <.001*† | 0.611 | 0.009*† | 0.763 | <.001*† |
| Toileting | 0.508 | 0.037* | 0.716 | 0.001*† | 0.630 | 0.007*† | 0.737 | <.001*† | 0.678 | 0.003*† | 0.693 | 0.002*† |
| r | P value | r | P value | r | P value | r | P value | r | P value | r | P value | |
| Total FIM Self-Care Score | 0.574 | 0.016* | 0.833 | <.001*† | 0.636 | 0.006*† | 0.822 | <.001*† | 0.821 | <.001*† | 0.812 | <.001*† |
| UE NeuroQoL Total Score | 0.245 | 0.343 | 0.468 | 0.058 | 0.276 | 0.284 | 0.235 | 0.363 | 0.360 | 0.156 | 0.342 | 0.180 |
| FIM Self-Care at Discharge (N=15) | RSA Q1 | RSA Q2 | RSA Q3 | RSA Q4 | RSA Q5 | Total RSA Q1-Q5 | ||||||
| ρ | P value | ρ | P value | ρ | P value | ρ | P value | ρ | P value | ρ | P value | |
| Eating | 0.394 | 0.146 | 0.318 | 0.248 | 0.377 | 0.166 | 0.468 | 0.078 | 0.537 | 0.039* | 0.485 | 0.067 |
| Grooming | 0.529 | 0.043* | 0.523 | 0.045* | 0.512 | 0.051 | 0.668 | 0.006*† | 0.427 | 0.113 | 0.589 | 0.021* |
| Bathing | 0.399 | 0.140 | 0.619 | 0.014*† | 0.253 | 0.364 | 0.382 | 0.160 | 0.211 | 0.449 | 0.393 | 0.147 |
| UB Dressing | 0.585 | 0.022* | 0.572 | 0.026* | 0.572 | 0.026* | 0.659 | 0.008*† | 0.723 | 0.002*† | 0.721 | 0.002*† |
| LB Dressing | 0.601 | 0.018* | 0.577 | 0.024* | 0.573 | 0.026* | 0.700 | 0.004*† | 0.704 | 0.003*† | 0.737 | 0.002*† |
| Toileting | 0.334 | 0.223 | 0.561 | 0.030* | 0.202 | 0.470 | 0.504 | 0.055 | 0.370 | 0.175 | 0.457 | 0.087 |
| r | P value | r | P value | r | P value | r | P value | r | P value | r | P value | |
| Total FIM Self-Care Score | 0.595 | 0.019* | 0.677 | 0.006*† | 0.379 | 0.164 | 0.576 | 0.025* | 0.511 | 0.052 | 0.619 | 0.014*† |
| UE NeuroQoL Total Score | 0.582 | 0.023* | 0.820 | <.001*† | 0.384 | 0.158 | 0.618 | 0.014*† | 0.671 | 0.006*† | 0.690 | 0.004*† |
| FIM Self-Care at 3-month follow up (N=13) | RSA Q1 | RSA Q2 | RSA Q3 | RSA Q4 | RSA Q5 | Total RSA Q1-Q5 | ||||||
| ρ | P value | ρ | P value | ρ | P value | ρ | P value | ρ | P value | ρ | P value | |
| Eating | 0.759 | 0.003*† | 0.632 | 0.020* | 0.585 | 0.036* | 0.774 | 0.002*† | 0.774 | 0.002*† | 0.774 | 0.002*† |
| Grooming | 0.146 | 0.633 | 0.537 | 0.059 | 0.049 | 0.874 | 0.098 | 0.751 | 0.195 | 0.523 | 0.195 | 0.523 |
| Bathing | 0.491 | 0.089 | 0.668 | 0.012*† | 0.437 | 0.136 | 0.400 | 0.175 | 0.714 | 0.006*† | 0.641 | 0.018* |
| UB Dressing | 0.503 | 0.080 | 0.403 | 0.173 | 0.436 | 0.136 | 0.584 | 0.036* | 0.725 | 0.005*† | 0.617 | 0.025* |
| LB Dressing | 0.309 | 0.304 | 0.528 | 0.064 | 0.225 | 0.459 | 0.494 | 0.086 | 0.595 | 0.032* | 0.427 | 0.146 |
| Toileting | 0.167 | 0.586 | 0.748 | 0.003*† | 0.060 | 0.847 | 0.373 | 0.210 | 0.382 | 0.198 | 0.340 | 0.256 |
| r | P value | r | P value | r | P value | r | P value | r | P value | r | P value | |
| Total FIM Self-Care Score | 0.479 | 0.097 | 0.626 | 0.022* | 0.420 | 0.154 | 0.667 | 0.013*† | 0.771 | 0.002*† | 0.661 | 0.014*† |
| UE NeuroQoL Total Score | 0.668 | 0.013*† | 0.562 | 0.046* | 0.664 | 0.013*† | 0.867 | <.001*† | 0.828 | <.001*† | 0.815 | <.001*† |
ρ = Spearman’s rank correlation coefficient, r = Pearson correlation coefficient. *Statistically significant (*p<0.05). †P values significant after Benjamini-Hochberg’s correction with False Discovery Rate at 5%. UB: upper body, LB: lower body, UE: upper extremity.
Table 4.
Correlation between ∆bilateral arms average RSA and ∆FIM Self-Care assessment from Admission to Discharge and to 3 month follow up.
Table 4.
Correlation between ∆bilateral arms average RSA and ∆FIM Self-Care assessment from Admission to Discharge and to 3 month follow up.
|
∆ FIM Self-Care |
∆RSA Q1 | ∆RSA Q2 | ∆RSA Q3 | ∆RSA Q4 | ∆RSA Q5 | ∆RSA Q1-Q5 | ||||||
| r | P value | r | P value | r | P value | r | P value | r | P value | r | P value | |
| Admission to Discharge | 0.397 | 0.143 | 0.329 | 0.231 | 0.375 | 0.169 | 0.617 | 0.014*† | 0.195 | 0.486 | 0.492 | 0.063 |
| Admission to 3M Follow Up | 0.663 | 0.013*† | 0.762 | 0.002*† | 0.523 | 0.067 | 0.782 | 0.002*† | 0.714 | 0.006*† | 0.786 | 0.001*† |
r = Pearson correlation coefficient. *Statistically significant (* p<0.05). † P values significant after Benjamini-Hochberg’s correction with False Discovery Rate at 5%.
Table 5.
Multiple linear regression analysis of ∆RSA of bilateral arms correlation with ∆FIM Self-Care from Admission to 3-month follow up.
Table 5.
Multiple linear regression analysis of ∆RSA of bilateral arms correlation with ∆FIM Self-Care from Admission to 3-month follow up.
| Quadrant RSA from Admission to 3-month follow up (N=13) | ∆Eating | ∆Grooming | ∆Bathing | ∆UB Dressing | ∆LB Dressing | ∆Toileting | ∆FIM SelfCare | |||||||
| β | p value | β | p value | β | p value | β | p value | β | p value | β | p value | β | p value | |
| ∆ Bilateral Arms Q1 | 0.705 | 0.097 | -0.060 | 0.810 | 0.817 | 0.269 | 1.327 | 0.112 | 1.468 | 0.056 | 0.415 | 0.515 | 5.813 | 0.046* |
| ∆ Bilateral Arms Q2 | 0.920 | 0.174 | -0.015 | 0.967 | 1.682 | 0.165 | 1.972 | 0.281 | 1.956 | 0.128 | 0.432 | 0.672 | 12.918 | 0.014*† |
| ∆ Bilateral Arms Q3 | 0.424 | 0.391 | -0.092 | 0.729 | 0.821 | 0.319 | 1.126 | 0.175 | 1.532 | 0.063 | 0.563 | 0.399 | 4.918 | 0.118 |
| ∆ Bilateral Arms Q4 | 0.313 | 0.581 | -0.026 | 0.932 | 1.919 | 0.066 | 1.974 | 0.097 | 2.465 | 0.014*† | 0.823 | 0.384 | 10.305 | 0.010*† |
| ∆ Bilateral Arms Q5 | 0.894 | 0.058 | 0.141 | 0.614 | 1.615 | 0.035* | 2.077 | 0.007*† | 1.822 | 0.021 | 0.690 | 0.300 | 7.662 | 0.006*† |
| ∆ Bilateral Arms Upper Q1Q3 | 0.306 | 0.194 | -0.040 | 0.764 | 0.436 | 0.277 | 0.650 | 0.129 | 0.796 | 0.050 | 0.258 | 0.442 | 2.854 | 0.066 |
| ∆ Bilateral Arms Lower Q2Q4 | 0.290 | 0.564 | 0.055 | 0.832 | 0.348 | 0.672 | 0.361 | 0.674 | 0.653 | 0.457 | 0.110 | 0.874 | 2.238 | 0.495 |
| ∆ Bilateral Arms Medial Q1Q2 | 0.415 | 0.002*† | -0.066 | 0.473 | 0.321 | 0.247 | 0.321 | 0.235 | 0.345 | 0.221 | 0.040 | 0.856 | 1.486 | 0.147 |
| ∆ Bilateral Arms Lateral Q3Q4Q5 | 0.300 | 0.010*† | 0.017 | 0.829 | 0.413 | 0.046* | 0.445 | 0.032* | 0.466 | 0.028* | 0.158 | 0.371 | 1.908 | 0.012*† |
| ∆ Bilateral Arms Total RSA Q1toQ5 | 0.169 | 0.147 | -0.004 | 0.954 | 0.328 | 0.099 | 0.497 | 0.031* | 0.470 | 0.017* | 0.159 | 0.362 | 2.011 | 0.008*† |
β = standardized beta coefficients. *Statistically significant (*p<0.05). †P values significant after Benjamini-Hochberg’s correction with False Discovery Rate at 5%. UB: upper body, LB: lower body.
Disclaimer/Publisher’s Note: The statements, opinions and data contained in all publications are solely those of the individual author(s) and contributor(s) and not of MDPI and/or the editor(s). MDPI and/or the editor(s) disclaim responsibility for any injury to people or property resulting from any ideas, methods, instructions or products referred to in the content. |
© 2024 by the authors. Licensee MDPI, Basel, Switzerland. This article is an open access article distributed under the terms and conditions of the Creative Commons Attribution (CC BY) license (http://creativecommons.org/licenses/by/4.0/).
Copyright: This open access article is published under a Creative Commons CC BY 4.0 license, which permit the free download, distribution, and reuse, provided that the author and preprint are cited in any reuse.


