Submitted:
18 September 2024
Posted:
19 September 2024
You are already at the latest version
Abstract
This study evaluated metabolites and lipid composition in the calf muscles of Type 2 Diabetes Mellitus (T2DM) patients and age-matched healthy controls using multi-dimensional MR Spectroscopic Imaging. We also explored the association between muscle metabolites, lipids, and intra-abdominal fat in T2DM. Participants included 12 T2DM patients (60.3 ± 8.6 years), 9 age-matched healthy controls (AMHC) (60.9 ± 7.8 years), and 10 young healthy controls (YHC) (28.3 ± 1.8 years). We acquired 2D MR spectra of calf muscles using an enhanced accelerated 5D echo-planar correlated spectroscopic imaging (EP-COSI) technique, and abdominal MRI with breath-hold 6-point Dixon sequence. In YHC, choline levels were lower in the gastrocnemius (GAS) and soleus (SOL) muscles but higher in the tibialis anterior (TA) compared to AMHC. YHC also showed higher unsaturation index (U.I.) of extramyocellular lipids (EMCL) in TA, intramyocellular lipids (IMCL) in GAS, carnosine in SOL, and taurine and creatine in TA. T2DM patients exhibited higher choline in TA and myo-inositol in SOL than AMHC, while Triglyceride fats (TGFR2) in TA was lower. Correlation analysis indicated associations between IMCL U.I. and various metabolites in muscles with liver, pancreas, and abdominal fat estimates in T2DM. These findings may elucidate the impact of dysfunctional adipose tissues in T2DM.
Keywords:
MR spectroscopic imaging
; calf muscle lipids and metabolites
; intra-abdominal fat
; type 2 diabetes mellitus
1. Introduction
Skeletal muscle represents the primary site for postprandial glucose disposal [1]. Lipids are important for energy production, with about two-thirds of resting skeletal muscle energy production coming from lipid oxidation. The accumulation of lipids inside muscle cells is a key energy source for physical activity. However, while this may be beneficial for athletes, excess accumulation, particularly in diseases such as diabetes and ageing muscle, can lead to lipotoxicity [2]. Lipotoxicity results from the ability of fatty acids (FA) to act as detergents, to affect acid-base homeostasis, and produce highly bioactive lipids, such as ceramides. Larger accumulation of lipids inside muscle cells leads to impaired mitochondrial oxidative phosphorylation in ageing and also in subjects with diabetes [3]. This process can then lead to fat infiltration in muscle which is associated with frailty and muscle loss [4]. Type 2 diabetes (T2DM) is a chronic metabolic condition where every aspect of the body’s metabolism is altered [5]. Insulin resistance (IR) is a common feature of T2DM and an early metabolic abnormality [6]. Insulin resistance leads to impaired glucose absorption, promotes hepatic gluconeogenesis, manifests a serious breakdown in lipid dynamics, and is associated with the metabolic syndrome, especially with its effects on the liver and muscle [7]. It is known that lipids are stored as triglycerides in the adipose tissues or in lipid droplets in the cytoplasm of non-adipose cells. Insulin resistance promotes hydrolysis of triglycerides, release of free fatty acids, reduced esterification and re-esterification of fatty acids in adipose tissues (AT), reduces glucose uptake in muscle cells, impairs glycogen synthesis, and increases gluconeogenesis, lipogenesis, and synthesis of CRP in the liver [8,9]. This promotes ectopic accumulation of lipids in non-adipocyte tissue such as skeletal muscle, abdominal visceral and hepatic fat depots and pancreatic beta cells [10,11] along with macrophage infiltration and inflammation [12]. This fat deposition in non-adipose tissues leads to further IR [13] and oxidative stress, and has deleterious effects including tissue damage (lipotoxicity) [14]. In addition, ageing is also associated with larger accumulation of lipids within skeletal muscle leading to muscle loss [2]. Two pools of lipids are found in skeletal muscle tissues: intra-myocellular lipids (IMCL), stored in spheroid droplets in muscle cells adjacent to mitochondria and extra-myocellular lipids (EMCL), distributed over large regions of muscle fascia. There is also a large interest in understanding the fat composition within these lipid pools. The effects of fatty acid on metabolic signaling and energy metabolism are modulated by degree of unsaturation [15]. Monounsaturated fatty acids and polyunsaturated fatty acids are synthesized by the desaturation of saturated fatty acids by an oxidative reaction catalyzed by the iron-containing microsomal enzyme stearoyl CoA desaturase. Therefore, this enzyme determines the degree of desaturation, and its activity, accordingly, has profound effects on lipid metabolism [15]. There is also recent evidence that the accumulation of saturated IMCL is associated with insulin resistance [16,17]. It has also been shown that IMCL content in different muscle compartments exhibit differences in muscle cellular adaptation for differences in the type of exercise and muscle fiber types [18].
In addition to the lipid metabolism, there is also clinical interest in the detection and estimation of metabolites including choline, carnosine, taurine, myo-Insositol and creatine. Creatine supplementation has been shown to increase the muscle creatine and phosphocreatine (PCr) content which is essential for high-intensity exercise performance [19,20]. Choline plays an important role in phospholipid synthesis and triglyceride metabolism contributing to structure and function of cell membranes and muscle cells [21]. Low concentration of choline is associated with several metabolic changes involving anti-fibrotic effects [22] including muscle wasting [23], and also plays a role in muscle contraction [24]. It has also been shown that inositol is involved in excitation – contraction coupling in skeletal muscle [25]. Taurine is required for proper muscle functioning and has the potential to reduce muscle inflammation and improve muscle strength [26]. Recently taurine deficiency has been shown to be associated with accelerated ageing [27]. Inositols via its major isomers (myo-inositol and D-chiro-inositol) participate in both insulin signaling and glucose metabolism [28] by influencing distinct pathways. For the first time, we also report the feasibility of detecting myo-Inositol in vivo in skeletal muscle.
Over the last few years there has been steady progress in advancing in vivo magnetic resonance spectroscopy (MRS) methodology for quantification of lipids and other metabolites in skeletal muscle [29]. One-dimensional MRS techniques result in severe overlap of lipid resonances and also hinders detection of wide range of metabolites at lower field strengths [30,31]. On the other hand, two-dimensional (2D) localized correlated spectroscopy (L-COSY) techniques have been demonstrated to minimize this problem of spectral overlap by spreading resonances into a second dimension, thereby improving the dispersion of spectral resonances [30,31,32]. The L-COSY techniques permit estimating the IMCL and EMCL content in a specific compartment, and also allow quantitative assessment of lipid unsaturation in vivo. However, single voxel 2D MRS techniques are limited to single muscle compartment with limited spatial coverage and is not efficient. Recently using a multi-voxel 2D COSY technique, Nagarajan et al. reported differences in changes in myolipid metabolism between type I (slow twitch) and type II (fast twitch) muscle fibers, with type I fibers having higher IMCL content relative to type II (fast twitch) muscle fibers in obesity, perhaps related to IR [33,34]. The 2D EPSI spectra can resolve the overlapping peaks of various lipid resonances and also the metabolites including Choline, Creatine, Taurine, and myo-Inositol.
Central obesity is a major player in T2DM [35,36] and it is therefore important to assess the abdominal fat tissues in various compartments within the abdomen. Similar to IMCL in skeletal muscle, triglycerides in adipose tissue and liver are found to be associated with insulin resistance [37]. Non-alcoholic fatty liver disease (NAFLD), a common liver disease characterized by hepatic triglyceride accumulation and chronically elevated serum aminotransferase levels, reported to have high prevalence in patients with T2DM [38]. In addition to liver, there is also emerging evidence on nonalcoholic fatty pancreas disease (NAFPD) for describing fat accumulation in pancreatic cells. Some cross--sectional studies have shown that pancreatic fat content increased in subjects with T2DM [39]. In adults, NAFPD has been associated with obesity, metabolic syndrome, and insulin resistance / T2DM [40,41].
In this study, a major goal was to validate lipid pools (IMCL, EMCL, unsaturation index) and more metabolites using a novel accelerated five-dimensional (5D) echo-planar correlated spectroscopic imaging (EP-COSI) in the calf muscles of T2DM patients and age-matched healthy controls, and to correlate the lipid and metabolite ratios with the abdominal and ectopic fat in liver and pancreas.
2. Materials and Methods
2.1. Human Subjects
Twelve T2DM patients (5 male, 7 females; age = 60.3 ± 8.6 years; BMI = 28.1 ± 6.3 kg/m2), 9 age-matched healthy controls (AMHC) (6 males, 3 females; age = 60.9 ± 7.8 years; BMI = 25.3 ± 2.8 kg/m2), and 10 young healthy controls (YHC) (9 male, 1 female; age = 28.3 ± 1.8 years; BMI = 24.4 ± 3.3 kg/m2) were enrolled in the study. All the subjects provided informed consent in accordance with the institutional review board (IRB) at the University of California at Los Angeles.
The T2DM subjects were recruited from the UCLA Gonda Diabetic Center and from the Southern California area. The AMHC were recruited from the UCLA community, and the general community and family members of the patient subjects. The medical history of T2DM patients was assessed. The exclusion criteria for this study were as follows: history of cardiovascular or neuromuscular disease, HbA1c% > 9.0%, treatment with any medications that alter insulin sensitivity, documented diabetic micro- and macro-angiopathy, severe renal or hepatic disease, malignancy, or chronic inflammatory diseases such as rheumatoid arthritis. Other exclusions included subjects with claustrophobia, metallic implants such as pacemakers, defibrillators and aneurysm clips and certain prostheses contraindicated for MRI. Study inclusion criteria for healthy controls were good health with sedentary lifestyles, without a family history of diabetes, and women with regular menstrual cycles.
2.2. Clinical and Biochemical Data
All T2DM subjects underwent blood sample collection at fasting, and assessment of anthropometry by standardized methodologies. The collected data included age, gender, BMI, and levels of the serum creatinine (Cre), aspartate aminotransferase (AST), alanine aminotransferase (ALT), total bilirubin (TB), alkaline phosphatase (ALP), fasting glucose (Glc), glycated hemoglobin (HbA1c), total cholesterol (TC), triglyceride (TG), high-density lipoprotein (HDL), and low-density lipoprotein (LDL).
2.3. MRI / MR Spectroscopic Imaging
MRI / MRS imaging was performed on a 3T Prisma MR scanner (Siemens Medical Solutions, Erlangen, Germany) running on the VE11C platform.
2.3.1. MR Spectroscopic Imaging of Calf Muscles
MR spectra of calf muscles were acquired using a 15 channel ‘receive’ and a single channel ‘transmit’ knee coil in the feet first supine position. An enhanced version of the accelerated 5D EP-COSI technique was used to obtain spectra from the right calf of each subject with the largest diameter of the calf muscle positioned in the middle of the coil [42]. The standard 5D EP-COSI sequence which uses (90°–180°-Δt1 -90°-t2) for localization was modified by employing a pair of adiabatic full passage pulses at the refocusing 1800 RF pulse. Position of the volume of interest (VOI) was determined using the axial, coronal and sagittal images to assure the coverage of soleus, tibialis anterior and gastrocnemius muscle regions. Interference from vascular structures and gross adipose tissue deposits was minimized by appropriate positioning of the VOI. Anatomical MRI studies included the following scans: a three-plane localizer MRI (Repetition time/Echo time (TR/TE) = 14/5 ms, field of view (FOV) = 45 × 45 cm2, a 320 × 160 data matrix, one average) and a T1-weighted (T1W) axial, coronal and sagittal spin-echo MRI (TR/TE = 600/2.7 ms, FOV = 16 × 16 cm2, 320 × 256 data matrix, one average). The following parameters were used for acquiring the accelerated 5D EP-COSI acquisition with a maximum echo sampling scheme: TR/TE = 1500/35 ms, average = 1, matrix size = 16 x 16 x 8, voxel resolution = 3.37 cm3, 64 Δt1 increments, 512 bipolar echo pair, acceleration factor = 8 along ky, kz and t1 dimensions, F1 and F2 bandwidths of 1250 Hz and 1190 Hz respectively with scan time of ~25 min. Outer volume saturation bands were included outside the PRESS volume of interest and manual B0 shimming was performed to minimize B0 inhomogeneity over the localized VOI to achieve a line width of ~12-14 Hz. A fully sampled non-water-suppressed (NWS) scan was acquired with only the first t1 increment to be used for eddy current correction and as a reference for coil combination, adding 30 seconds to the total scanning duration.
2.3.2. Abdominal Fat Imaging
Abdominal MRI was performed using a 3D GRE VIBE 6-point Dixon sequence. The acquisition parameters were voxel size = 1.187 x 1.187 x 3 mm3, matrix size = 320x240, TR=8.85 ms, bandwidth = 1080 Hz/px, flip angle = 500 and shortest possible TEs (equidistant with TE1 = 1.23 ms and an echo time shift of 1.23 ms), a GRAPPA (GeneRalized Autocalibrating Partially Parallel Acquisitions) acceleration factor of 2, and one average. Fifty-two slices were acquired between vertebral levels T12 and L5. Using the water-only and fat-only images extracted from the multi-point Dixon data, fat fraction and water fraction were calculated by the in-line MR image reconstruction software as parametric maps. A gold-standard single-voxel 1H MRS of the liver was performed using a 15-second breath-hold, T2-corrected multi-echo spectroscopic sequence (HISTO, High speed multiple echo acquisition) as described in [43].
2.4. Data Processing and Analysis
2.4.1. Spectroscopic Data Processing
The acquired undersampled data were reconstructed using a using a Group Sparsity-based compressed sensing algorithm [42]. The reconstruction was performed over each coil separately, and the individual coil reconstructions were combined as a sum-of-squares. Reconstructed data were further post-processed using a series of steps comprising scaling, spatial reordering, phase correction, resolving averages and oversampling [42], with a custom MATLAB-based program.
For the 2D spectra recorded in the soleus, tibialis anterior, and gastrocnemius muscles regions of each subject, absolute volumes for the following metabolites were quantified using peak integration. Intramyocellular lipids: IMCL1 and IMCL2 ((5.3 ppm, 2.7 ppm) and (5.3 ppm, 2.0 ppm), extramyocellular lipids: EMCL1 and EMCL2 (5.45 ppm, 2.85 ppm) and (5.45 ppm, 2.15 ppm), choline, Ch_d (3.2 ppm, 3.2 ppm), creatine, Cr_d (3.0 ppm, 3.0 ppm), Cr_3.9 (3.9 ppm, 3.9 ppm), carnosine, Car (8.0 ppm, 8.0 ppm), taurine, Tau (3.4 ppm, 3.4 ppm), myo-inositol, mI (3.5 ppm, 3.5 ppm), triglyceryl fats, TGFR1 (5.4 ppm, 4.3 ppm) and TGFR2 (4.3 ppm, 5.4 ppm), unsaturated fatty acids, Unsat_CH = CH, FAT_5.4 (5.4 ppm, 5.4 ppm), and poly-methylene protons of fat, FAT_1.4 (1.4 ppm, 1.4 ppm). We identified the diagonal peak at [3.5 ppm, 3.5ppm] as myo-Inositol based on earlier ex vivo magic angle spinning spectroscopy of muscle tissues [44].
Since total muscle creatine (Cr_d) content does not change with T2DM, it was used as an internal reference for the other peaks in the muscle spectrum. The peak ratios were calculated by dividing the absolute peak volume by that of the Cr_d peak. The unsaturation indices (UI) of IMCL and EMCL were estimated using the ratio of the cross-peaks, IMCL1/IMCL2 and EMCL1/EMCL2, respectively [29,30,43]. Average EMCL (Avg EMCL) and IMCL (Avg IMCL) were calculated from EMCL1, EMCL2 and IMCL1, IMCL2 respectively.
2.4.2. Abdominal Fat Segmentation
We used an image analysis software slice-O-matic (Ver. 5.0, Tomovision, Canada) to quantify subcutaneous adipose tissues (SAT), visceral adipose tissues (VAT), and total abdominal fat (TAT). A single trained observer (MKS) guided by an experienced radiologist (ERF/SR) performed the image analysis. The VAT and SAT areas (cm2) were computed automatically from the respective tissue regions in each slice by summing the pixels from the given tissue and multiplying by the pixel surface area. Finally, tissue volume (cm3) for each slice was calculated by multiplying the tissue area (cm2) by slice thickness.
2.4.3. Liver and Pancreatic Fat
Hepatic fat fraction (HFF) was measured by ROIs selected in homogeneous sections of the liver. To calculate pancreatic fat fraction (PFF), ROIs were placed in the head (caput, PFFHead) and body/tail (corpus + cauda, PFFBody+Tail) of the pancreas. Pancreatic regions were segmented into two parts: head and body/tail. To avoid segmentation error, we did not calculate PFF separately in body and tail. The mean pixel value obtained through the software was scaled down by a factor of 1000 to counteract scaling performed during image acquisition on the MRI scanner.
For HISTO, fat fraction values (HFF_MRS) and R2 (1/T2) relaxation rate of water (R2_WAT) were calculated using the vendor-provided software package as described in [43].
2.5. Statistical Analyses
All statistical analyses were performed with SPSS (V25.0, IBM, Chicago, IL) software. A p value < 0.1 was considered statistically significant. The independent sample t-tests were performed to assess differences in lipids and metabolite ratios between T2DM and AMHC, and between AMHC and YHC groups. Pearson’s correlation was used to determine the association between MRS lipids/metabolites and MRI-based fat estimates, and also, between MRI/MRS parameters and blood chemistry in the T2DM and AMHC groups.
3. Results
The 5D EP-COSI technique allows wider coverage of the calf muscle, differentiating spectral characteristics of muscle metabolites and lipids in various muscle compartments, soleus (SOL), tibialis anterior (TA), and gastrocnemius (GAS) (Figure 1A). Differences among these regions can be seen in Figure 1B, in which the diagonal peak of carnosine (8 ppm) was present in all soleus muscles whereas the diagonal peak of creatine at 3.9 was split into a doublet in the tibialis anterior and gastrocnemius muscle regions but remained a single peak in the soleus. The doublet is due to residual dipolar coupling in the type 2 muscle fibers. Extracted 2D COSY spectra are shown from the SOL, TA and GAS muscle regions in T2DM and age-matched HC and young HC subjects.
The mean age was similar between the T2DM and AMHC groups (60.25 ± 8.59 vs. 60.89 ± 7.82 years). The subjects in the T2DM group had a higher BMI compared to those in AMHC and YHC group (28.08 ± 6.35 vs. 25.30 ± 2.83 vs. 24.41 ± 3.28 kg/m2), but not statistically significant.
3.1. Calf Muscle MRS (YHC vs. AMHC)
The Choline levels in gastrocnemius and soleus were significantly lower in YHC compared to AMHC groups (Table 1). However, TA choline in YHC was more than 2-fold higher than in AMHC group. EMCL1 and IMCL2 in the soleus were lower in YHC compared to AMHC. However, the unsaturation index of EMCL in TA and IMCL in GAS was higher in YHC than in AMHC. Carnosine levels in the soleus and Taurine levels in the TA were higher, and myoinositol in GAS and TA were lower in YHC than AMHC. YHC had lower levels of creatine in GAS and higher levels of creatine in TA compared to AMHC. The TGFR1 was 5-fold higher in YHC group compared to AMHC.
3.2. Calf Muscle MRS and Abdominal MRI (T2DM vs AMHC)
The T2DM subjects had more than 2-fold higher (1.13 ± 0.91 vs. 0.58 ± 0.22) levels of Choline in TA muscle compared with the AMHC group (Table 1). Myoinositol in the soleus muscle of T2DM was higher (0.07 ± 0.02 vs. 0.05 ± 0.02) than in AMHC group. TGFR2 in TA muscle was significantly lower (0.02 ± 0.01 vs. 0.03 ± 0.01) in T2DM compared with AMHC subjects. The unsaturation index of IMCL and EMCL in GAS, SOL, and TA muscles was lower in T2DM than in AMHC but was not statistically significant. Similarly, Creatine levels were higher in T2DM compared with AMHC, but did not reach statistical significance. The fat in the liver, pancreas, and abdomen was higher in T2DM subjects compared with AMHC subjects (Figure 2).
3.3. Association between MRS and MRI Fat Measures in T2DM,
Table 2 and Table 3 show the Pearson’s correlations of IMCL unsaturation index and carnosine, taurine, and myoinositol in gastrocnemius, soleus, and tibialis anterior muscles with estimates of liver, pancreas, and abdominal fat in the T2DM subjects. Carnosine in all the muscle groups were significantly associated with VAT and TAT, whereas Carnosine in only GAS was associated with SAT. Myo-Inositol in GAS was significantly associated with liver and pancreatic fat fraction.
Table 4 lists all the lipids, metabolites, and fat estimates that were significantly associated with blood markers. The magnitude of all these associations were high (> 0.5). To highlight a few, IMCL unsaturation index in TA was negatively associated with HbA1c and CHOLDLCAL. SAT volume was associated with Glc and CHOHDL whereas VAT was significantly associated with ALT. Liver fat fraction estimated by both MRI and MRS were significantly associated with ALT.
4. Discussion
There is a large interest in understanding the ectopic fat accumulation in progressive metabolic diseases [44]. Quantification of IMCL and EMCL during ageing and diabetes is of large clinical interest due to its association with inflammation and muscle loss [4]. The contribution of individual muscle compartments with different combination of fiber types and its association with skeletal muscle metabolism is not known. In that context, there is a large interest in implementation of advanced MRS methodology for investigating various muscle compartments.
Even though conventional one-dimensional MRSI techniques can provide information on distribution of IMCL / EMCL in various compartments [47], it is a challenge to investigate the composition of the lipids at clinical field strengths. In this context, there is also clinical interest in understanding the role of saturated and unsaturated lipids within these lipid pools in the development of insulin resistance [16,17]. To address this issue, we earlier implemented single voxel based localized 2D MRS techniques to separate the overlapping lipid pools and also to resolve various metabolites [30,31]. However, single voxel-based techniques have limited spatial coverage involving acquisition from one muscle compartment. In this study, we implemented spatially resolved 2D MRS by accelerated 5D EP-COSI along with body composition imaging to estimate the lipids and metabolites in young and old healthy subjects along with diabetic subjects. We were able to measure the lipid composition within IMCL and EMCL along with various metabolites including choline, carnosine, and taurine. Recent work has shown that circulating Taurine deficiency may be a driver of aging [27]. In that context, in vivo detection of Taurine in skeletal muscle will open new possibilities of trials with Taurine. We also identified the diagonal peak at [3.5ppm, 3.5ppm] as myo-Inositol based on the earlier ex vivo HRMAS of muscle tissues.
We also evaluated the body composition including subcutaneous fat (SAT), visceral fat (VAT), hepatic fat fraction (HFF) and pancreatic fat fraction (PFF) in age-matched healthy controls and diabetic subjects. We observed lower unsaturation of IMCL and EMCL in GAS, SOL, and TA in T2DM compared to AHMC group though not statistically significant. It is known that the fatty acid synthase enzymes can become defective in diabetes [15]. We also observed higher choline levels in both T2DM and AHMC group compared to YHC. Choline is an essential micronutrient and plays an important role in several metabolic pathways. Low concentration of Choline is also associated with muscle wasting [22]. We also observed higher levels of myoinositol in the T2DM group. It is known that inositols are involved in the in excitation-contraction of coupling in skeletal muscle [24]. The higher choline and inositol levels in the T2DM group might be due to compensatory mechanisms to protect muscle loss.
The correlation analysis revealed an association between IMCL unsaturation index and abdominal fat content. In light of the close relation between IMCL and insulin sensitivity, these results can help to explain the impact of dysfunctional adipose tissue in T2DM. Both EP-COSI and Dixon MRI showed the same trends in differentiating T2DM and healthy controls. However, given the small sample size in this study, we didn’t observe any significant differences between the two groups. In AMHC, visceral fat was correlated with IMCL, which was also found in previous studies in lean and obese children [48]. We did not see the correlation in the T2DM group.
In a recent study by Sarma et al. adipose tissue distribution including SAT, VAT, HFF and PFF in T2DM patients and these findings were compared with nondiabetic age-matched adults and young healthy subjects [43]. There was a high correlation between hepatic fat fraction estimated by 6-point Dixon MRI and HISTO-MRS. Increased SAT and VAT reaffirmed that central obesity is connected with the evolution of T2DM favoring insulin resistance. VAT was greater in the T2DM group than AMHC and YHC, but the difference between groups was larger for the YHC. In addition, almost equal percentages of SAT and VAT were observed in T2DM suggesting that the VAT accumulation may play an important role in the etiology of T2DM. The T2DM patients had significantly greater hepatic fat content than both AHMC and YHC subjects, indicating that T2DM is associated with increased fat accumulation in the liver. The HFF percentage was 44.6% higher in individuals with T2DM compared to age-matched healthy controls and 64.4% higher compared to young healthy controls.
A limitation of the present study is that it was a cross sectional investigation using a small number of subjects. While we noted significant differences in VAT, HFF, and PFF of T2DM patients in comparison to AMHC, large cohort studies will be required to determine whether the observed changes are of primary importance in the development of insulin resistance, impaired glucose tolerance, and progression to T2DM. However, this preliminary study using 5D EPCOSI in conjunction with body composition imaging reveals important differences between T2DM and healthy subjects.
Author Contributions
Conceptualization, and designed the experiments, M.A.T.; methodology, M.K.S. and M.A.T.; data curation, M.K.S., and A. S.; data analysis, M.K.S., A.S., and S.A.S.; writing—original draft preparation, M.K.S.; writing—review and editing, M.A.T., A.S., S.A.S., S.S.V., C.H.D., E.R.F., and S.R; funding acquisition, M.A.T. All authors reviewed and approved of the final manuscript.
Funding
This research was supported by research grant from the National Institute of Biomedical Imaging and Bioengineering (NIBIB) (R21EB02088302).
Institutional Review Board Statement
The study was conducted in accordance with the Declaration of Helsinki, and approved by the Institutional Review Board of David Geffen School of Medicine at UCLA (protocol code IRB#13-000251 and date of approval: March 3, 2016).
Informed Consent Statement
Informed consent was obtained from all subjects involved in the study.
Data Availability Statement
The datasets used and/or analyzed during the current study are available from the corresponding author upon reasonable request.
Acknowledgments
We acknowledge the scientific support of Dr. Theodore Hahn, Dr. Cathy Lee, Dr. Neil Wilson, Dr. Zohaib Iqbal, Mr. Shivam Agarwal, Mr. Daniel Kohanghadash, Ms. Kavya Umachandran and Mr. Edward Xu.
Conflicts of Interest
The authors declare no conflict of interest.
References
- Merz, K.E. and D.C. Thurmond, Role of skeletal muscle in insulin resistance and glucose uptake. Comprehensive Physiology, 2011. 10(3): p. 785-809. [CrossRef]
- Rivas, D.A., et al., Diminished anabolic signaling response to insulin induced by intramuscular lipid accumulation is associated with inflammation in aging but not obesity. American Journal of Physiology-Regulatory, Integrative and Comparative Physiology, 2016. 310(7): p. R561-R569. [CrossRef]
- Roden, M., Muscle triglycerides and mitochondrial function: possible mechanisms for the development of type 2 diabetes. International journal of obesity, 2005. 29(2): p. S111-S115. [CrossRef]
- Correa-de-Araujo, R., et al., Myosteatosis in the context of skeletal muscle function deficit: an interdisciplinary workshop at the National Institute on Aging. Frontiers in physiology, 2020. 11: p. 963. [CrossRef]
- McLachlan, S. and N.R.F. Collaboration, Worldwide trends in diabetes since 1980: pooled analysis of 751 population-based measurement studies with over 4.4 million participants. The Lancet, 2016. 387(10027). [CrossRef]
- Reaven, G.M., Role of insulin resistance in human disease. Diabetes, 1988. 37(12): p. 1595-1607. [CrossRef]
- Kim, M.K., Clinical characteristics of OGTT-derived hepatic-and muscle insulin resistance in healthy young men. Journal of exercise nutrition & biochemistry, 2014. 18(4): p. 385. [CrossRef]
- Meshkani, R. and K. Adeli, Hepatic insulin resistance, metabolic syndrome and cardiovascular disease. Clinical biochemistry, 2009. 42(13-14): p. 1331-1346. [CrossRef]
- Petersen, K.F. and G.I. Shulman, Etiology of insulin resistance. The American journal of medicine, 2006. 119(5): p. S10-S16. [CrossRef]
- Cusi, K., The role of adipose tissue and lipotoxicity in the pathogenesis of type 2 diabetes. Current diabetes reports, 2010. 10: p. 306-315. [CrossRef]
- Mantatzis, M., et al., Abdominal adipose tissue distribution on MRI and diabetes. Academic Radiology, 2014. 21(5): p. 667-674. [CrossRef]
- Medina-Gomez, G., S. Gray, and A. Vidal-Puig, Adipogenesis and lipotoxicity: role of peroxisome proliferator-activated receptor γ (PPARγ) and PPARγcoactivator-1 (PGC1). Public health nutrition, 2007. 10(10A): p. 1132-1137. [CrossRef]
- Hwang, J.-H., et al., Increased intrahepatic triglyceride is associated with peripheral insulin resistance: in vivo MR imaging and spectroscopy studies. American Journal of Physiology-Endocrinology and Metabolism, 2007. 293(6): p. E1663-E1669. [CrossRef]
- Gastaldelli, A., et al., Insulin resistance, adipose depots and gut: interactions and pathological implications. Digestive and Liver Disease, 2010. 42(5): p. 310-319. [CrossRef]
- Vessby, B., et al., Desaturation and elongation of fatty acids and insulin action. Annals of the New York Academy of Sciences, 2002. 967(1): p. 183-195. [CrossRef]
- Savage, D.B., et al., Accumulation of saturated intramyocellular lipid is associated with insulin resistance [S]. Journal of lipid research, 2019. 60(7): p. 1323-1332. [CrossRef]
- Boesch C., et al. Observation of intramyocellular lipids by 1H magnetic resonance spectroscopy. Ann N.Y. Acad Sci 2000;904:p.25-. [CrossRef]
- Nakagawa, Y. and M. Hattori, Intramyocellular lipids of muscle type in athletes of different sport disciplines. Open Access Journal of Sports Medicine, 2017: p. 161-166. [CrossRef]
- Casey, A., et al., Creatine ingestion favorably affects performance and muscle metabolism during maximal exercise in humans. American Journal of Physiology-Endocrinology and Metabolism, 1996. 271(1): p. E31-E37. [CrossRef]
- Greenhaff, P.L., et al., Influence of oral creatine supplementation of muscle torque during repeated bouts of maximal voluntary exercise in man. Clinical Science, 1993. 84(5): p. 565-571. [CrossRef]
- Cai, C.X., et al., Nutritional and dietary interventions for nonalcoholic fatty liver disease, in Dietary Interventions in Liver Disease. 2019, Elsevier. p. 357-372. [CrossRef]
- da Costa, K.-A., et al., Elevated serum creatine phosphokinase in choline-deficient humans: mechanistic studies in C2C12 mouse myoblasts. The American journal of clinical nutrition, 2004. 80(1): p. 163-170. [CrossRef]
- Alves, F.M., et al., Choline administration attenuates aspects of the dystrophic pathology in mdx mice. Clinical Nutrition Experimental, 2019. 24: p. 83-91. [CrossRef]
- Zhao, D., M.A. Frohman, and J.K. Blusztajn, Generation of choline for acetylcholine synthesis by phospholipase D isoforms. BMC neuroscience, 2001. 2: p. 1-10. [CrossRef]
- Volpe, P., et al., Role of inositol 1, 4, 5--trisphosphate in excitation--contraction coupling in skeletal muscle. FEBS letters, 1986. 197(1-2): p. 1-4. [CrossRef]
- Merckx, C. and B. De Paepe, The role of taurine in skeletal muscle functioning and its potential as a supportive treatment for duchenne muscular dystrophy. Metabolites, 2022. 12(2): p. 193. [CrossRef]
- Singh, P., et al., Taurine deficiency as a driver of aging. Science, 2023. 380(6649): p. eabn9257. [CrossRef]
- Bevilacqua, A. and M. Bizzarri, Inositols in insulin signaling and glucose metabolism. International journal of endocrinology, 2018. 2018(1): p. 1968450. [CrossRef]
- Krššák, M., et al., Proton magnetic resonance spectroscopy in skeletal muscle: Experts’ consensus recommendations. NMR in Biomedicine, 2021. 34(5): p. e4266. [CrossRef]
- Velan, S.S., et al., Investigation of muscle lipid metabolism by localized one--and two--dimensional MRS techniques using a clinical 3T MRI/MRS scanner. Journal of Magnetic Resonance Imaging: An Official Journal of the International Society for Magnetic Resonance in Medicine, 2007. 25(1): p. 192-199. [CrossRef]
- Velan, S.S., et al., Distinct patterns of fat metabolism in skeletal muscle of normal-weight, overweight, and obese humans. American Journal of Physiology-Regulatory, Integrative and Comparative Physiology, 2008. 295(4): p. R1060-R1065. [CrossRef]
- Thomas, M.A., et al., Localized two--dimensional shift correlated MR spectroscopy of human brain. Magnetic Resonance in Medicine: An Official Journal of the International Society for Magnetic Resonance in Medicine, 2001. 46(1): p. 58-67. [CrossRef]
- Nagarajan, R., et al., Assessment of lipid and metabolite changes in obese calf muscle using multi-echo echo-planar correlated spectroscopic imaging. Scientific reports, 2017. 7(1): p. 17338. [CrossRef]
- Machann J., et al., Follow up whole-body assessment of adipose tissue compartments during a lifestyle intervention in a large cohort at increased risk for type 2 diabetes. Radiology 2010;257:p.353-363. [CrossRef]
- Bozzetto, L., et al., Liver fat in obesity: role of type 2 diabetes mellitus and adipose tissue distribution. European journal of clinical investigation, 2011. 41(1): p. 39-44. [CrossRef]
- Gallagher, D., et al., Adipose tissue distribution is different in type 2 diabetes. The American journal of clinical nutrition, 2009. 89(3): p. 807-814. [CrossRef]
- Papaetis, G.S., P. Papakyriakou, and T.N. Panagiotou, State of the art paper Central obesity, type 2 diabetes and insulin: exploring a pathway full of thorns. Archives of Medical Science, 2015. 11(3): p. 463-482. [CrossRef]
- Angulo, P., Nonalcoholic fatty liver disease. New England Journal of Medicine, 2002. 346(16): p. 1221-1231. [CrossRef]
- Al-Mrabeh, A., et al., Quantification of intrapancreatic fat in type 2 diabetes by MRI. PloS one, 2017. 12(4): p. e0174660. [CrossRef]
- Lee, J.S., et al., Clinical implications of fatty pancreas: correlations between fatty pancreas and metabolic syndrome. World journal of gastroenterology: WJG, 2009. 15(15): p. 1869. [CrossRef]
- Ou, H.-Y., et al., The association between nonalcoholic fatty pancreas disease and diabetes. PloS one, 2013. 8(5): p. e62561. [CrossRef]
- Wilson, N.E., et al., Correlated spectroscopic imaging of calf muscle in three spatial dimensions using group sparse reconstruction of undersampled single and multichannel data. Magnetic resonance in medicine, 2015. 74(5): p. 1199-1208. [CrossRef]
- Sarma, M.K., et al., Noninvasive assessment of abdominal adipose tissues and quantification of hepatic and pancreatic fat fractions in type 2 diabetes mellitus. Magnetic resonance imaging, 2020. 72: p. 95-102. [CrossRef]
- Chen, J.H., et al., Resolution of creatine and phosphocreatine 1H signals in isolated human skeletal muscle using HR--MAS 1H NMR. Magnetic Resonance in Medicine: An Official Journal of the International Society for Magnetic Resonance in Medicine, 2008. 59(6): p. 1221-1224. [CrossRef]
- Srikanthan, P., et al., Characterization of intra-myocellular lipids using 2D localized correlated spectroscopy and abdominal fat using MRI in type 2 diabetes. Magnetic resonance insights, 2012. 5: p. MRI. S10489. [CrossRef]
- Ferrara, D., et al., Impact of different ectopic fat depots on cardiovascular and metabolic diseases. Journal of cellular physiology, 2019. 234(12): p. 21630-21641. [CrossRef]
- Vermathen, P., et al., Skeletal muscle 1H MRSI before and after prolonged exercise. I. muscle specific depletion of intramyocellular lipids. Magnetic resonance in medicine, 2012. 68(5): p. 1357-1367. [CrossRef]
- Brumbaugh, D.E., et al., Intramyocellular lipid is associated with visceral adiposity, markers of insulin resistance, and cardiovascular risk in prepubertal children: the EPOCH study. The Journal of Clinical Endocrinology & Metabolism, 2012. 97(7): p. E1099-E1105. [CrossRef]
Figure 1.
(A) Axial localization of the volume of interest (VOI) in the calf muscle of a 55 year-old type-2 diabetic patient. (B) Multi-voxel COSY spectra in a 4 x 5 region covering the tibialis anterior (red), soleus (blue), and gastrocnemius (yellow) muscles. (C) Extracted spectra within the soleus, tiabialis anterior, and gastrocnemius calf muscles in one young and one age-matched healthy control and a T2DM patient. Note the diagonal peak of carnosine (8 ppm) present in the soleus muscles from all three individuals. The diagonal creatine peak at 3.9 is split into a doublet in all tibialis anterior muscles, whereas it remains a single peak in the soleus. IMCL and EMCL are indicated in red text.

Figure 2.
MRI/MRS-based hepatic, abdominal, and pancreatic fat in T2DM and AMHC groups.
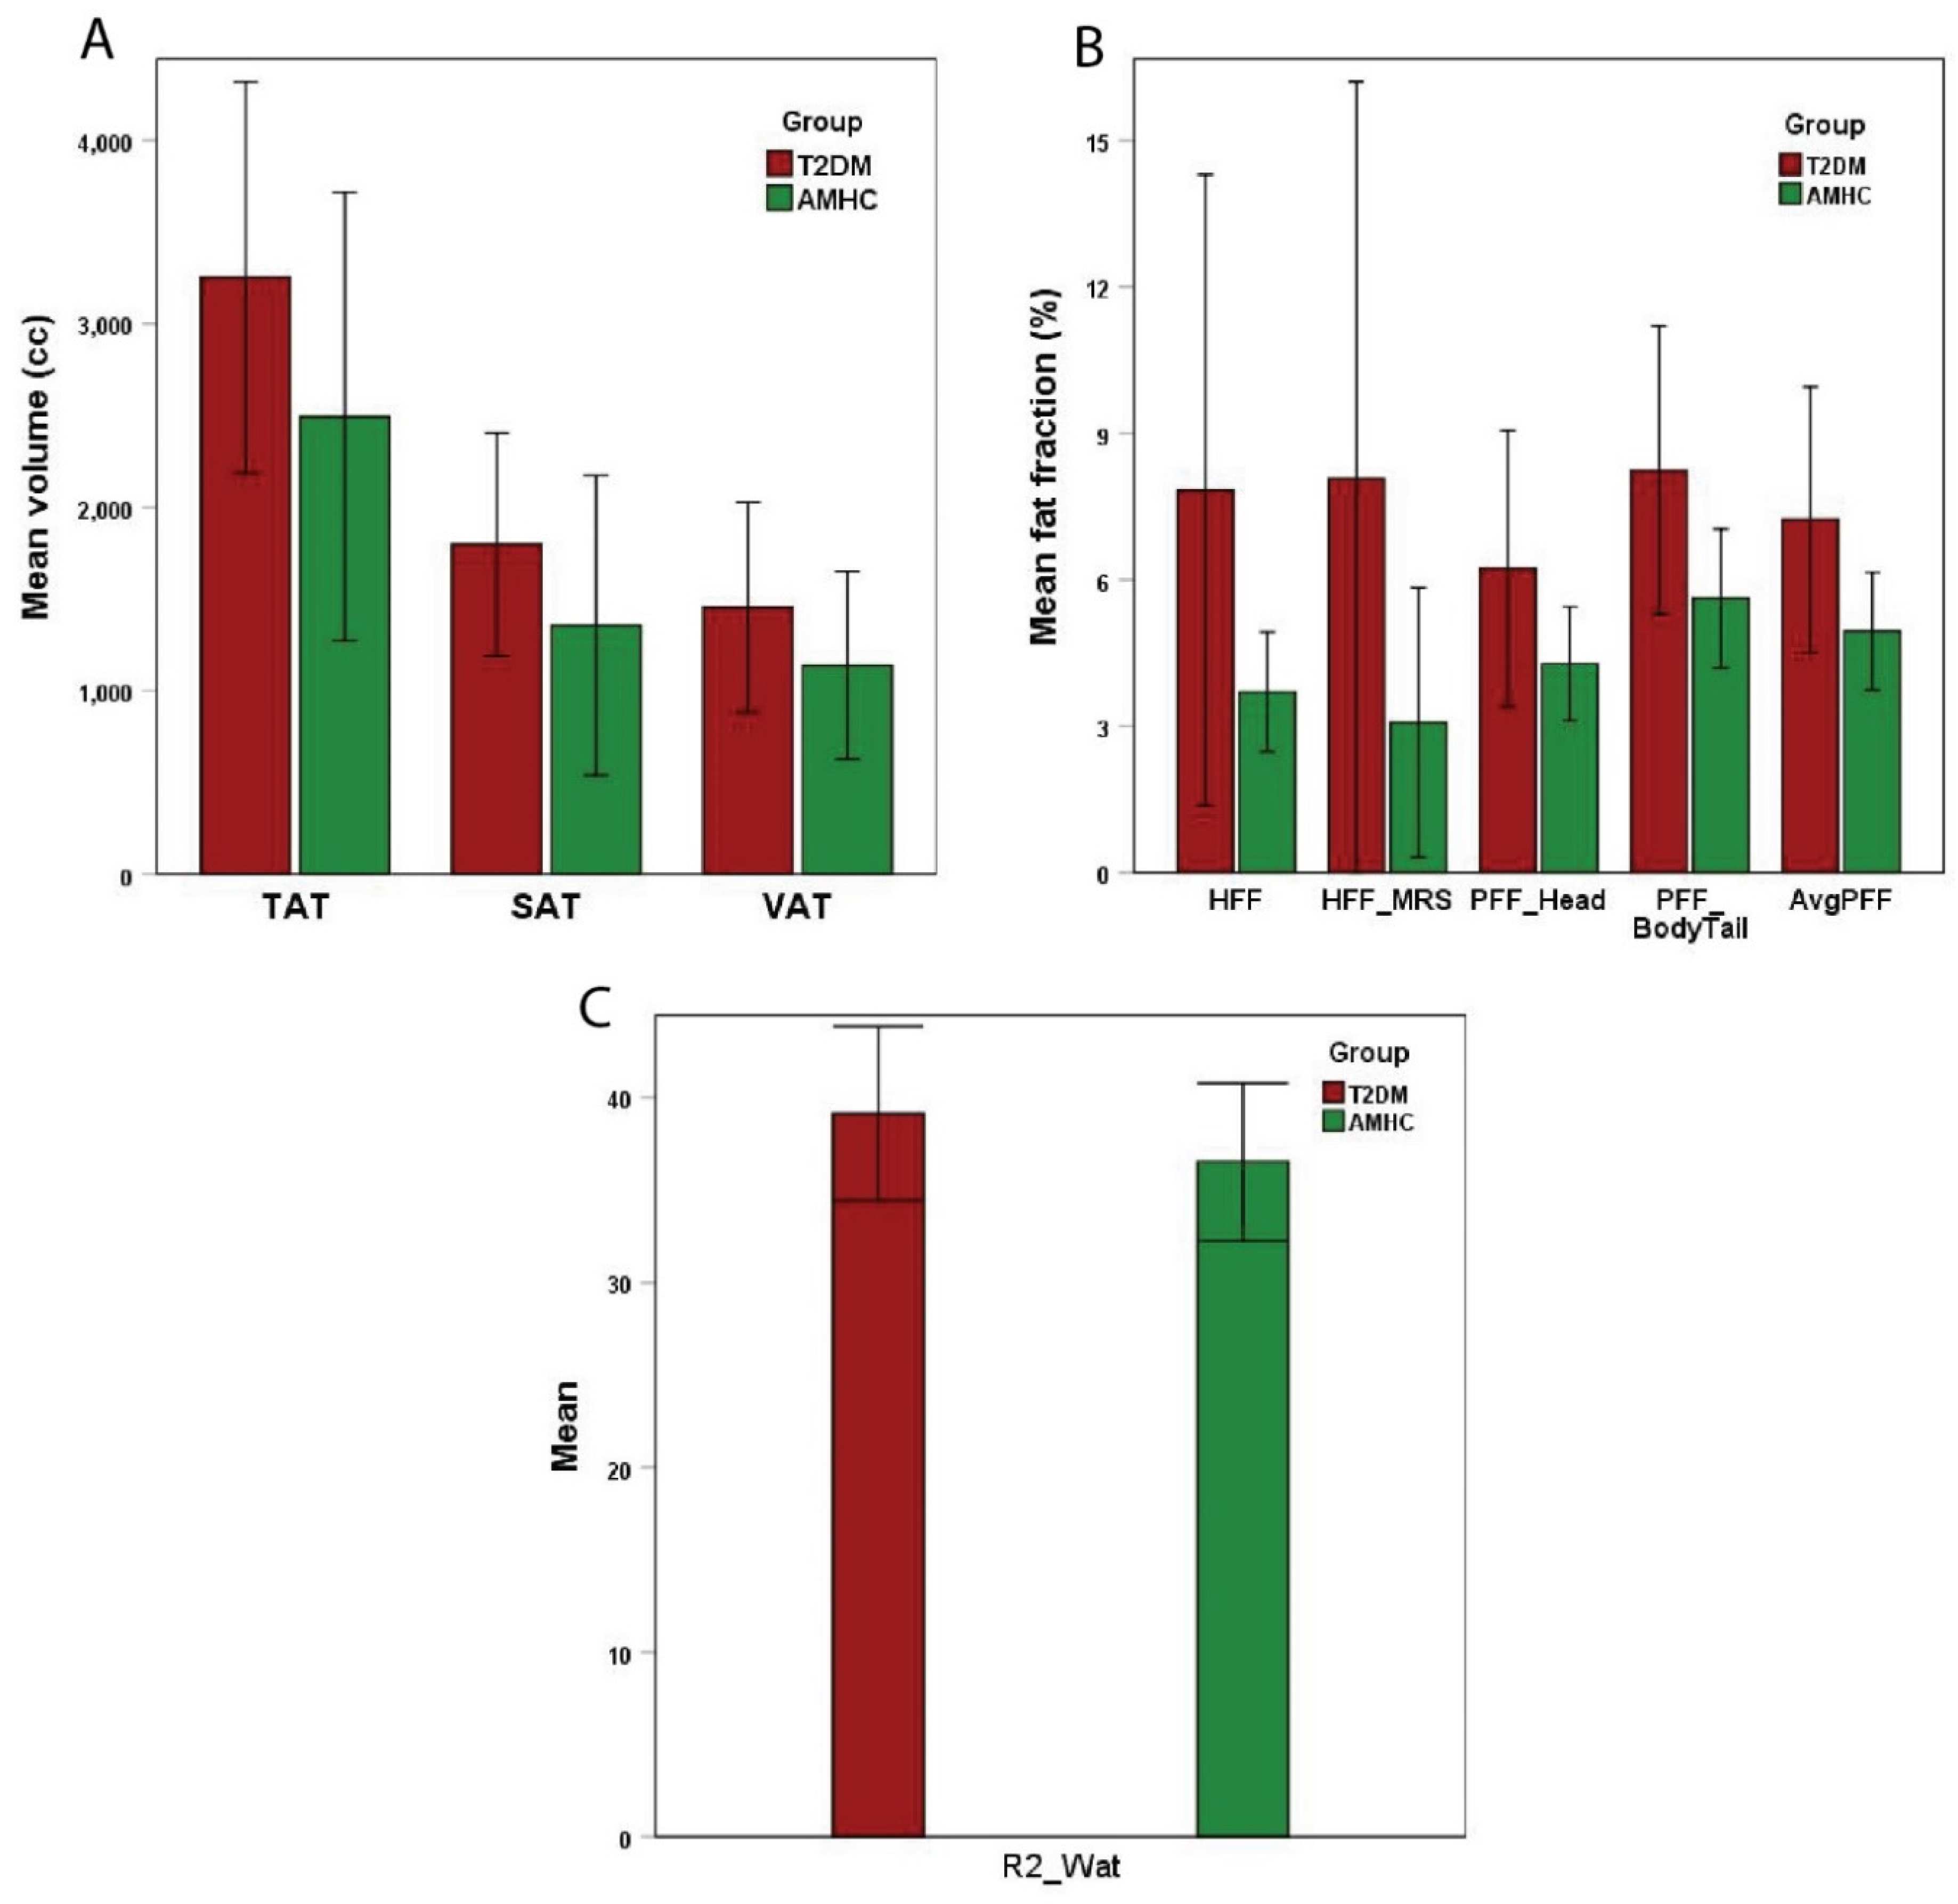

Table 1.
Lipids and metabolite ratios within soleus, tibialis anterior, and gastrocnemius muscles in T2DM, AMHC, and YHC groups.
Table 1.
Lipids and metabolite ratios within soleus, tibialis anterior, and gastrocnemius muscles in T2DM, AMHC, and YHC groups.
| Metabolites ↓ | Muscle | T2DM Mean ± SD |
AMHC Mean ± SD |
YHC Mean ± SD |
P value T2DM vs. AMHC |
P value AMHC vs. YHC |
|---|---|---|---|---|---|---|
| Ch_d | GAS SOL TA |
1.15 ± 0.28 1.00 ± 0.32 1.13 ± 0.91 |
1.02 ± 0.13 1.21 ± 0.54 0.58 ± 0.22 |
0.63 ± 0.36 0.43 ± 0.30 1.26 ± 1.01 |
0.274 0.280 0.097 |
0.013 0.001 0.066 |
| EMCL1 | GAS SOL TA |
0.07 ± 0.05 0.11 ± 0.06 0.12 ± 0.07 |
0.07 ± 0.05 0.08 ± 0.06 0.12 ± 0.07 |
0.09 ± 0.08 0.04 ± 0.02 0.15 ± 0.14 |
0.910 0.368 0.994 |
0.524 0.049 0.660 |
| EMCL2 | GAS SOL TA |
0.12 ± 0.09 0.15 ± 0.09 0.20 ± 0.12 |
0.11 ± 0.05 0.14 ± 0.09 0.21 ± 0.13 |
0.16 ± 0.12 0.10 ± 0.07 0.28 ± 0.26 |
0.815 0.735 0.926 |
0.296 0.294 0.497 |
| Avg EMCL | GAS SOL TA |
0.09 ± 0.07 0.13 ± 0.07 0.16 ± 0.08 |
0.09 ± 0.05 0.11 ± 0.07 0.17 ± 0.10 |
0.12 ± 0.09 0.07 ± 0.05 0.22 ± 0.20 |
0.847 0.549 0.940 |
0.367 0.141 0.550 |
| EMCL UI | GAS SOL TA |
1.68 ± 0.68 1.59 ± 0.91 1.36 ± 0.41 |
1.72 ± 0.52 1.89 ± 0.85 1.51 ± 0.53 |
1.87 ± 0.48 2.49 ± 0.75 2.00 ± 0.59 |
0.895 0.452 0.478 |
0.580 0.119 0.076 |
| IMCL1 | GAS SOL TA |
0.02 ± 0.02 0.02 ± 0.02 0.01 ± 0.01 |
0.01 ± 0.01 0.02 ± 0.01 0.01 ± 0.01 |
0.01 ± 0.00 0.01 ± 0.01 0.02 ± 0.02 |
0.410 0.248 0.817 |
0.111 0.106 0.191 |
| IMCL2 | GAS SOL TA |
0.02 ± 0.03 0.04 ± 0.03 0.02 ± 0.01 |
0.01 ± 0.00 0.02 ± 0.01 0.02 ± 0.01 |
0.02 ± 0.01 0.02 ± 0.01 0.02 ± 0.01 |
0.385 0.275 0.888 |
0.591 0.027 0.172 |
| Avg IMCL | GAS SOL TA |
0.02 ± 0.02 0.03 ± 0.03 0.02 ± 0.01 |
0.01 ± 0.00 0.02 ± 0.01 0.01 ± 0.01 |
0.01 ± 0.01 0.01 ± 0.01 0.02 ± 0.01 |
0.386 0.252 0.832 |
0.835 0.037 0.121 |
| IMCL UI | GAS SOL TA |
1.31 ± 0.46 1.52 ± 0.53 1.48 ± 0.68 |
1.34 ± 0.49 1.79 ± 0.81 1.66 ± 1.18 |
2.16 ± 1.10 1.85 ± 0.66 1.76 ± 1.23 |
0.902 0.369 0.684 |
0.074 0.856 0.859 |
| Car | GAS SOL TA |
0.01 ± 0.01 0.01 ± 0.01 0.01 ± 0.02 |
0.01 ± 0.01 0.02 ± 0.01 0.01 ± 0.02 |
0.01 ± 0.01 0.02 ± 0.01 0.02 ± 0.01 |
0.894 0.597 0.938 |
0.345 0.077 0.300 |
| Tau | GAS SOL TA |
0.19 ± 0.24 0.16 ± 0.09 0.33 ± 0.79 |
0.13 ± 0.06 0.14 ± 0.06 0.11 ± 0.11 |
0.10 ± 0.09 0.16 ± 0.07 0.34 ± 0.33 |
0.538 0.570 0.430 |
0.371 0.451 0.061 |
| mI | GAS SOL TA |
0.06 ± 0.03 0.07 ± 0.02 0.10 ± 0.10 |
0.05 ± 0.02 0.05 ± 0.02 0.06 ± 0.05 |
0.03 ± 0.02 0.07 ± 0.07 0.25 ± 0.26 |
0.257 0.067 0.336 |
0.009 0.501 0.049 |
| Cr_3.9 | GAS SOL TA |
0.37 ± 0.13 0.29 ± 0.07 0.46 ± 0.48 |
0.30 ± 0.08 0.29 ± 0.06 0.27 ± 0.23 |
0.21 ± 0.10 0.43 ± 0.30 0.82 ± 0.64 |
0.233 0.941 0.292 |
0.060 0.170 0.026 |
| TGFR1 | GAS SOL TA |
0.03 ± 0.02 0.07 ± 0.06 0.14 ± 0.09 |
0.03 ± 0.03 0.11 ± 0.16 0.22 ± 0.18 |
0.16 ± 0.17 0.06 ± 0.08 0.29 ± 0.35 |
0.989 0.400 0.211 |
0.062 0.407 0.633 |
| TGFR2 | GAS SOL TA |
0.02 ± 0.02 0.01 ± 0.01 0.02 ± 0.01 |
0.02 ± 0.01 0.01 ± 0.01 0.03 ± 0.01 |
0.03 ± 0.03 0.02 ± 0.02 0.04 ± 0.03 |
0.941 0.622 0.030 |
0.142 0.754 0.252 |
| FAT_1.4 | GAS SOL TA |
11.85 ± 5.62 15.11 ± 6.69 15.77 ± 6.15 |
11.10 ± 5.36 10.76 ± 4.35 18.54 ± 5.85 |
9.63 ± 5.45 11.11 ± 9.34 21.84 ± 11.39 |
0.790 0.107 0.310 |
0.594 0.920 0.447 |
| FAT_5.4 | GAS SOL TA |
0.86 ± 0.46 1.17 ± 0.45 1.22 ± 0.44 |
0.73 ± 0.35 0.96 ± 0.41 1.81 ± 0.80 |
0.563 0.282 0.043 |
Statististically significant (p < 0.1) differences are highlighted in bold.
Table 2.
Pearson’s correlation (r) between based liver, muscle, abdominal, and pancreatic fat and MRS lipids/metabolites in the T2DM group.
Table 2.
Pearson’s correlation (r) between based liver, muscle, abdominal, and pancreatic fat and MRS lipids/metabolites in the T2DM group.
| IMCL_UI | Carnosine | |||||
|---|---|---|---|---|---|---|
| GAS r, p value |
SOL r, p value |
TA r, p value |
GAS r, p value |
SOL r, p value |
TA r, p value |
|
| SAT | -0.36, p=0.379 | 0.15, p=0.705 | -0.06, p=0.886 | 0.75, p=0.034 | 0.44, p=0.234 | 0.40, p=0.281 |
| VAT | 0.11, p=0.797 | 0.29, p=0.449 | -0.16, p=0.705 | 0.83, p=0.012 | 0.71, p=0.033 | 0.69, p=0.041 |
| TAT | -0.13, p=0.755 | 0.24, p=0.535 | -0.12, p=0.775 | 0.85, p=0.007 | 0.63, p=0.068 | 0.60, p=0.089 |
| HFF | 0.07, p=0.872 | 0.45, p=0.230 | 0.35, p=0.395 | 0.44, p=0.274 | 0.30, p=0.44 | 0.05, p=0.901 |
| PFFHead | 0.63, p=0.129 | 0.25, p=0.559 | 0.57, p=0.179 | 0.10, p=0.838 | 0.12, p=0.774 | -0.16, p=0.7 |
| PFFBody+Tail | 0.30, p=0.508 | 0.64, p=0.086 | 0.58, p=0.177 | 0.54, p=0.213 | 0.57, p=0.136 | 0.20, p=0.635 |
| AvgPFF | 0.50, p=0.252 | 0.48, p=0.234 | 0.61, p=0.143 | 0.34, p=0.457 | 0.38, p=0.36 | 0.02, p=0.955 |
| HFF_MRS | 0.03, p=0.944 | 0.40, p=0.282 | 0.22, p=0.598 | 0.57, p=0.141 | 0.39, p=0.296 | 0.21, p=0.582 |
| R2_WAT | -0.09, p=0.831 | -0.53, p=0.141 | -0.59, p=0.127 | 0.10, p=0.823 | 0.04, p=0.91 | 0.31, p=0.416 |
Statististically significant (p < 0.1) associations are highlighted in bold.
Table 3.
Pearson’s correlation (r) between based liver, muscle, abdominal, and pancreatic fat and MRS lipids/metabolites in the T2DM group.
Table 3.
Pearson’s correlation (r) between based liver, muscle, abdominal, and pancreatic fat and MRS lipids/metabolites in the T2DM group.
| Taurine (Tau) | Myo-inositol (mI) | |||||
|---|---|---|---|---|---|---|
| GAS r, p value |
SOL r, p value |
TA r, p value |
GAS r, p value |
SOL r, p value |
TA r, p value |
|
| SAT | -0.22, p=0.601 | -0.14, p=0.722 | -0.38, p=0.311 | 0.07, p=0.864 | -0.12, p=0.762 | 0.04, p=0.921 |
| VAT | -0.23, p=0.582 | 0.24, p=0.540 | 0.03, p=0.944 | 0.34, p=0.411 | 0.02, p=0.969 | 0.17, p=0.656 |
| TAT | -0.25, p=0.559 | 0.05, p=0.902 | -0.20, p=0.601 | 0.23, p=0.590 | -0.06, p=0.880 | 0.12, p=0.768 |
| HFF | -0.18, p=0.678 | -0.05, p=0.904 | -0.16, p=0.687 | 0.64, p=0.087 | -0.22, p=0.575 | -0.22, p=0.567 |
| PFFHead | -0.22, p=0.637 | -0.23, p=0.593 | -0.30, p=0.476 | 0.57, p=0.184 | -0.33, p=0.422 | -0.46, p=0.253 |
| PFFBody+Tail | -0.18, p=0.705 | 0.24, p=0.576 | -0.41, p=0.319 | 0.85, p=0.016 | 0.21, p=0.615 | -0.42, p=0.300 |
| AvgPFF | -0.21, p=0.649 | 0.01, p=0.980 | -0.37, p=0.361 | 0.76, p=0.048 | -0.06, p=0.892 | -0.47, p=0.244 |
| HFF_MRS | -0.23, p=0.585 | -0.01, p=0.971 | -0.13, p=0.731 | 0.57, p=0.144 | -0.19, p=0.625 | -0.11, p=0.773 |
| R2_WAT | -0.34, p=0.408 | -0.32, p=0.407 | -0.03, p=0.943 | -0.64, p=0.087 | -0.38, p=0.318 | 0.23, p=0.561 |
Statististically significant (p < 0.1) associations are highlighted in bold.
Table 4.
Pearson’s correlation of lipid/metabolites and body fat with blood chemistry in the T2DM group. HbA1c: Hemoglobin A1C; Cre: creatinine; Glc: glucose; AST: aspartate aminotransferase; ALT: alanine aminotransferase; CHO: cholesterol; CHOLDL: low-density lipoprotein cholesterol; CHOHDL: high-density lipoprotein cholesterol; NHDLCHO: non-high-density lipoprotein cholesterol; AP: alkaline phosphatase; TB: total bilirubin.
| Blood chemistry | Lipid/metabolites and body fat | Correlation coefficient (r), p value |
|---|---|---|
| HbA1c | EMCL2 (TA) avgEMCL (TA) EMCLUI (SOL) IMCLUI (TA) Car (SOL) Car (TA) Cr_3.9 (SOL) TGFR1 (TA) R2_WAT |
0.73, p=0.039 0.70, p=0.055 0.64, p=0.065 -0.63, p=0.094 0.59, p=0.098 0.65, p=0.056 0.60, p=0.088 0.77, p=0.015 0.62, p=0.073 |
| Triglycerides | Ch_d (SOL) | 0.59, p=0.096 |
| CHOLDL | Ch_d (GAS) IMCLUI (TA) mI (GAS) Cr_3.9 (GAS) R2_WAT |
-0.62, p=0.098 -0.74, p=0.037 -0.68, p=0.062 -0.72, p=0.045 0.94, p=0.0001 |
| Cre | EMCLUI (GAS) EMCLUI (SOL) avgIMCL (GAS) |
0.77, p=0.071 -0.76, p=0.048 -0.89, p=0.044 |
| Glc | Ch_d (SOL) EMCL1 (TA) IMCLUI (GAS) SAT |
0.70, p=0.082 0.75, p=0.085 0.78, p=0.067 -0.71, p=0.075 |
| CHO | mI (SOL) R2_WAT |
-0.79, p=0.061 0.95, p=0.004 |
| CHOHDL | EMCLUI (TA) Cr_3.9 (SOL) TGFR1 (SOL) SAT TAT |
0.80, p=0.058 -0.96, p=0.003 0.83, p=0.043 0.83, p=0.042 0.84, p=0.037 |
| NHDLCHO | EMCL2 (TA) R2_WAT |
0.85, p=0.068 0.97, p=0.001 |
| AST | EMCL1 (GAS) EMCL1 (SOL) EMCL2 (GAS) avgEMCL (GAS) IMCLUI (TA) Car (SOL) Tau (GAS) TGFR1 (GAS) FAT_1.4 (SOL) |
-0.91, p=0.095 -0.82, p=0.09 -0.94, p=0.063 -0.95, p=0.055 0.86, p=0.06 0.90, p=0.036 0.93, p=0.066 -0.92, p=0.084 -0.89, p=0.042 |
| ALT | EMCLUI (GAS) IMCL2 (TA) VAT HFF HFF_MRS |
0.93, p=0.066 -0.97, p=0.033 0.96, p=0.011 0.88, p=0.049 0.90, p=0.038 |
| AP | TGFR1 (TA) R2_WAT |
0.92, p=0.028 0.91, p=0.034 |
| TB | EMCLUI (SOL) IMCL2 (GAS) Cr_3.9 (SOL) |
-0.87, p=0.057 -0.99, p=0.083 -0.84, p=0.076 |
Disclaimer/Publisher’s Note: The statements, opinions and data contained in all publications are solely those of the individual author(s) and contributor(s) and not of MDPI and/or the editor(s). MDPI and/or the editor(s) disclaim responsibility for any injury to people or property resulting from any ideas, methods, instructions or products referred to in the content. |
© 2024 by the authors. Licensee MDPI, Basel, Switzerland. This article is an open access article distributed under the terms and conditions of the Creative Commons Attribution (CC BY) license (http://creativecommons.org/licenses/by/4.0/).
Copyright: This open access article is published under a Creative Commons CC BY 4.0 license, which permit the free download, distribution, and reuse, provided that the author and preprint are cited in any reuse.


