Submitted:
14 September 2024
Posted:
17 September 2024
You are already at the latest version
Abstract
It is generally assumed that spirochetemia does not take place at the early localized stage of Lyme disease. This misassumption is due to the lack of sensitive and specific methods for detection. This paper reports that separation of the platelet-rich plasma immediately after venous blood collection to prevent the spirochetes from invading the lymphocytes in the test tube is crucial in molecular detection of a single Borrelia burgdorferi cell spun down in platelet pellets. In 2023, we tested the venous blood specimens of 145 people residing in Lyme disease-endemic areas in the United States. In 98 of them, who were suspected of having early localized Lyme disease irrespective of the absence or presence of a skin lesion, we found 33 specimens (33.7%) positive for B. burgdorferi, including 17 positive for FlaB gene only, 15 positive for both FlaB gene and 16S rRNA gene, and 1 positive for 16S rRNA gene only. Eight (17.0%) of the 47 asymptomatic resident controls were positive for FlaB PCR only. FlaB is a more sensitive chromosomal target than the 16S rRNA gene for the detection of 1-3 B. burgdorferi cells in 1 mL of platelet-rich plasma due to spirochetes gaining or retaining FlaB paralogs at the early localized stage of Lyme disease.
Keywords:
sanger sequencing
; spirochetemia
; early localized Lyme disease
; FlaB paralogs
; SNP in FlaB gene
; single Borrelia burgdorferi cell
; platelet-rich plasma
1. Introduction
Lyme disease, a systemic bacterial infection caused by Borrelia burgdorferi, is the most common tickborne disease in the United States. Released 2010–2018 insurance records suggest that each year approximately 476,000 Americans are diagnosed and treated for Lyme disease [1] although the true number of Lyme disease patients is unknown due to the lack of reliable sensitive and specific laboratory diagnostic tools. It is generally believed that at the early stage of infection this disease can be treated successfully with a proper course of antibiotics, but the spirochete bacteria may disseminate from the site of the tick bite to other regions of the body if not timely and properly treated [2].
It has been assumed that the B. burgdorferi spirochetes begin to invade the blood at the stage 2 of Lyme disease [3,4,5] 3 to 12 weeks after the initial infection [6], and that during the early localized infection stage, the number of B. burgdorferi cells simply increases in the dermal tissue in preparation for dissemination [7]. However, this assumption is not based on facts. Animal experiments showed that blood-borne dissemination of B. burgdorferi can be detected at day 2 after intradermal inoculation [8]. Like Leptospira interrogans, which enters the blood stream rapidly after invasion into the human body through the skin and mucosa [9], B. burgdorferi spirochetemia can occur in early infections based on epidemiological studies [10]. The key to diagnosing Lyme disease spirochetemia at the “early localized” stage of infection is to develop a highly sensitive, no-false-positive blood test for the detection of Lyme disease spirochetes in low single-digit numbers.
As previously reported, using DNA extracted from the platelet pellet obtained by differential centrifugation for nested PCR followed by Sanger sequencing of the PCR products can diagnose spirochetemias with a bacterial density as low as 25 per mL of whole blood [11]. However, B. burgdorferi can actively attach to and invade human lymphocytes during co-incubation of the spirochetes and the blood cells in vitro [12]. If there were only a few B. burgdorferi bacteria in the whole blood specimen, delayed exclusion of the blood cells from the platelet-rich plasma might lead to loss of all the spirochetes to the buffy coat by allowing the highly mobile spirochetes to attach to the lymphocytes prior to blood centrifugation.
This paper reports that immediate separation of the platelet-rich plasma after venous blood collection, using the entire DNA extracted from the platelet pellet for nested PCR and targeting the newly found duplicated paralogs of the FlaB gene for PCR amplification can increase the chances of detecting a single B. burgdorferi spirochete in 1 mL of platelet-rich plasma. While plasmid gene duplication and loss by adaptation to multiple host species are well known phenomena in the life cycle of B. burgdorferi [13,14], FlaB gene duplication in the B. burgdorferi chromosome has not been previously reported.
2. Materials and Methods
2.1. Patients and Specimens
Per agreement, DiaSorin, Inc., Stillwater, MN, enrolled the patients and healthy donor controls and performed the initial specimen preparation for a research project after informed consent was obtained in accordance with applicable regulations in compliance with 21 CFR 812. A total of 98 symptomatic patients clinically suspected of having early localized Lyme disease and 47 asymptomatic residents serving as controls were included in this study. The patients clinically suspected of having early localized Lyme disease were defined as people residing in a known Lyme disease-endemic area in the United States who developed a recent onset of fatigue, skin rash, fever, muscle aches, neck pain, joint pain, or lymphadenopathy during the Lyme disease season in 2023. Their venous blood specimens were drawn for testing when any of these symptoms and signs first appeared. The asymptomatic resident controls, also referred to as healthy donors, were people residing in the same communities with the symptomatic patients during the Lyme disease season in 2023.
2.2. Platelet-Rich Plasma Preparation
Specimen collection was performed under the participating collection site’s IRB approved protocols, under informed consent. At the participating collection sites, about 3 mL of the patient’s venous blood was drawn into a lavender top tube containing EDTA as anticoagulant. After the whole blood was mixed well for ~ 5 minutes, the rubber stopper was removed and replaced with a plastic over cap. The whole blood specimen was centrifuged for 15 minutes at 400x g within 30 minutes after blood collection; and 1 mL of platelet-rich plasma above the buffy coat was transferred into a labeled plastic vial with screw cap. If the blood collection site did not have centrifugation equipment to produce the platelet-rich plasma, the whole blood specimens were placed in an ice bath immediately and transported to another facility in ice packs for processing on the same day to prevent the spirochetes from invading lymphocytes in the test tube at ambient temperature. All platelet-rich plasma specimens were stored at -20°C before being sent to Milford Molecular Diagnostics Laboratory blind-coded by numbers in dry ice via overnight delivery.
2.3. Preparation of Total Platelet Fraction DNA for B. burgdorferi FlaB and 16S rRNA Gene PCR
At Milford Molecular Diagnostics Laboratory, the frozen platelet-rich plasma was defrosted and the entire thawed specimen was centrifuged in a 1.5 ml Eppendorf tube at ~16,000× g for 10 min. After the supernatant was discarded, the pellet was suspended in 300 μL of 0.5 M ammonium hydroxide. The mixture was heated at 97°C for 5 min with closed cap, followed by 10 min with open cap. After the mixture was cooled down to room temperature, 30 µL of 3 M sodium acetate and 700 µL of ice-cold 95% ethanol were added into each tube. The suspension of the crude DNA along with the proteins precipitated was divided into two equal parts in Eppendorf tubes for split sample testing without further purification, one labeled for B. burgdorferi FlaB gene and the other for borrelial 16S rRNA gene PCR amplification. All tubes were put in a -20˚C freezer. After 1 hour, the contents of the tubes were centrifuged at ~16,000× g for 5 min, and each pellet was washed with 700 µL of ice-cold 70% ethanol.
2.4. PCR
2.4.1. Primary PCR Amplification
All Eppendorf tubes containing the 70% ethanol-washed pellets were put in an 85°C heating block for 2 min with opened cap to evaporate the residual ethanol. Into each tube, 25 µL of complete “FlaB primary PCR mixture” or 25 µL of complete “borrelial 16S rRNA gene primary PCR mixture” was added. The tubes were heated with closed caps at 85°C for another 3 min, then vortexed to dissolve the nucleic acids into the PCR mixture. After centrifugation at ~16,000× g for 5 min, the entire liquid portion in the centrifuge tube was transferred to a 0.2 mL PCR tube. The thermocycling steps were programmed to 30 cycles at 85 °C for 30 s, 50 °C for 30 s, and 65 °C for 1 min after an initial heating for 10 min at 85 °C, with a final extension at 65 °C for 10 min.
The 25 µL of complete “FlaB primary PCR mixture” contained 20 μL of ready-to-use LoTemp® PCR mix (HiFi DNA Tech, LLC, Trumbull, CT, USA), 3 µL of molecular grade water, 1 μL of 10 μmolar FlaB outer forward (FOF) primer (5’-GCATCACTTTCAGGGTCTCA-3’), and 1 μL of 10 μmolar FlaB outer reverse (FOR) primer (5’-TGGGGAACTTGATTAGCCTG-3’) to amplify a 503-bp segment of B. burgdorferi FlaB gene [15].
The 25 µL of complete “borrelial 16S rRNA gene primary PCR mixture” contained 20 μL of ready-to-use LoTemp® PCR mix, 3 µL of molecular grade water, 1 μL of 10 μmolar M1 forward primer (5’-ACGATGCACACTTGGTGTTAA-3’), and 1 μL of 10 μmolar M2 reverse primer (5’-TCCGACTTATCACCGGCAGTC-3’) to amplify a 357/358-bp segment of borrelial 16S rRNA gene [11].
DNA extracts from the cultured cells of Borrelia burgdorferi (ATCC 53210) and of Borrelia coriaceae (ATCC 43381) were used as the positive control for FlaB amplification and as the positive control for borrelial 16S rRNA gene amplification, respectfully.
2.4.2. Nested PCR Amplification
Transferring of post-PCR materials from one test tube to another was accomplished by using a micro-glass rod in a 32” PCR workstation (AirClean Systems, Raleigh, NC, USA) to avoid aerosols, which often occur in routine micropipetting.
A trace (about 0.2 μL) of each of the primary PCR products was transferred by a calibrated micro-glass rod to another 25 μL complete PCR mixture containing 20 μL of ready-to-use LoTemp® PCR mix, 1 μL of 10 μmolar forward primer, and 1 μL of 10 μmolar reverse primer and 3 μL of molecular grade water for nested PCR or same-nested PCR amplification with identical thermocycling steps as for the primary PCR.
The primers for the FlaB nested PCR amplification were the FlaB inner forward (FIF) primer (5’-CTTTAAGAGTTCATGTTGGAG-3’) and the FlaB inner reverse (FIR) primer (5’-TCATTGCCATTGCAGATTGT-3’) to amplify a 447-bp segment of B. burgdorferi FlaB gene [15].
The primers used for the 16S rRNA gene nested PCR amplification were the same M1 and M2 primers used in the borrelial 16S rRNA gene primary PCR mixture [11].
All nested PCR products, including those of the positive controls and negative controls, were tested by agarose gel electrophoresis. The nested PCR products showing a DNA band at agarose gel electrophoresis without further purification were subjected to bidirectional Sanger sequencing to verify the authenticity of the PCR-amplified products.
Based on studies reported by other investigators, the limit of detection of 16S rRNA gene in human blood samples by nested PCR assays was approximately 2 (≥1.93) template copies per reaction [16].
2.5. DNA Sequencing
A trace (about 0.2 μL) of the nested PCR product showing a band at agarose gel electrophoresis was transferred by a calibrated micro-glass rod into a Sanger reaction tube containing 1 μL of 10 μmolar sequencing primer, 1 μL of BigDye® Terminator (v 1.1/Sequencing Standard Kit), 3.5 μL 5× buffer, and 14.5 μL molecular grade water in a total volume of 20 μL for 20 enzymatic primer extension/termination reaction cycles according to the protocol supplied by the manufacturer (Applied Biosystems, Foster City, CA, USA). After a dye-terminator cleanup, the reaction mixture was loaded in an automated ABI SeqStudio for sequencing. Sequence alignments were performed against the standard sequences stored in the GenBank database by on-line BLAST alignment analysis.
2.6. Validation of Methodology
To verify that Milford Molecular Diagnostics Laboratory is capable of using the described method to detect borrelial spirochetes causing clinical Lyme disease in platelet-rich plasma specimens before launching this research project, DiaSorin, Inc. sent 20 blind-coded human platelet-rich plasma specimens, some of which were spiked with cultured cells of Borrelia burgdorferi, Borrelia miyamotoi, a mixture of the two, and none of the two, to Milford Molecular Diagnostics Laboratory. Milford Molecular Diagnostics Laboratory was required to identify all the blind-coded specimens correctly without cross contamination.
3. Results
3.1. Total DNA Nested PCR Detection of Spirochetemia in Early Localized Lyme Disease
3.1.1. Detection of B. Burgdorferi in Low Single-Digit Numbers by Chromosomal DNA Nested PCR
The overall results of split sample testing on the venous blood specimens of 98 patients clinically suspected of having early localized Lyme disease showed that 65 specimens were negative for both FlaB gene and 16S rRNA gene PCR amplifications and that 33 specimens (33.7%) were PCR-positive, including 17 specimens positive for FlaB gene only, and 15 specimens positive for both FlaB gene and 16S rRNA gene. One specimen was positive for 16S rRNA gene only, indicating that this specimen contained only two copies of B. burgdorferi chromosome and both copies were aliquoted for 16S rRNA gene PCR amplification by chance during sample splitting. Split sample testing on the venous blood specimens of 47 asymptomatic resident controls showed 8 positives (17.0%), all positive for FlaB PCR only.
3.1.2. Decoupling of FlaB Gene from 16S rRNA Gene in Split Sample PCR Testing
When tested in groups of 10, many specimens in each group only showed a FlaB gene PCR product without a concomitant 16S rRNA gene amplification. The results of 20 selected consecutive PCRs from the symptomatic patients and from the asymptomatic resident controls, respectively, are presented in Figure 1. This decoupling of two chromosomal gene amplifications in split sample PCR testing suggested that there were more copies of the FlaB gene than the 16S rRNA gene in one chromosome and this gene copy number difference became apparent only when split sample nested PCR testing of the specimens containing spirochetes in low single-digit numbers was carried out.
3.1.3. Decoupling of FlaB Gene from 16S rRNA Gene Does Not Occur in Cultured B. burgdorferi PCRs
Two-fold serial dilutions of a DNA extract from cultured B. burgdorferi cells (ATCC 53210) were made and used as the templates for FlaB gene and 16S rRNA gene nested PCRs in parallel. Since the FlaB gene and 16S rRNA gene nested PCRs both invariably ended at the same dilution (Figure 5), the data indicated that the chromosome of cultured B. burgdorferi indeed contains a single 16S rRNA gene and a single FlaB gene as reported in literature.
3.2. Duplicated FlaB Gene Paralogs in B. burgdorferi Spirochetes Invading Blood during Early Localized Lyme Disease
Six (one in Figure 3, four in Figure 6 and one in Figure 7) of the 41 positive specimens showed 8 single-nucleotide mutations or substitutions (summarized in Figure 9) all of which have not been annotated in the GenBank sequence database in the 447-base segment of the FlaB DNA selected for PCR amplification and sequencing. Six of these 8 single-nucleotide mutations occurred as SNPs with two overlapping peaks in duplicated FlaB paralogs pointed by arrows (four in Figure 6 Panels A, F and H, and two in Figure 7), and two as single-nucleotide substitutions that resulted in one silent mutation (Figure 3) and one missense mutation (Figure 6 Panel D). Two of the SNPs (one in Figure 6 Panel H and one in Figure 7 as paralogs) also resulted in missense mutations.
Nucleotide mutations or substitutions in FlaB were found in 5 of the 32 (15%) FlaB-positive specimens derived from symptomatic patients, and in 1 of 8 (12%) FlaB-positive specimens derived from asymptomatic resident controls.
All the SNPs and nucleotide substitutions referred to above were verified by bidirectional Sanger sequencing in in Figure 3 and Figure 4, and in Figure 6, Figure 7 and Figure 8 presented as follows.
The positions of the amino acid codons of the FlaB gene segment affected by single-nucleotide mutations described above and their relationship to the outer and inner PCR primers are summarized in Figure 9.
3.3. Sequence of the 503-Base Segment of the FlaB Gene in the Cultured B. burgdorferi Cells (ATCC 53210)
In bacterial genetics, the DNA sequence of a gene in Borrelia burgdorferi strain B31 is considered the “wild type”. Any base changes in a gene sequence from the wild type are mutations. Since the FlaB gene in B. burgdorferi strain 31 cultured cells is well characterized, the amplicons generated by the PCR primers listed in Figure 9 and their sequences were used as the wild type comparator sequences for investigation of the FlaB gene complex found in the spirochetes in the positive samples. The bidirectional sequencing electropherograms of the 503-base wild type B. burgdorferi FlaB gene sequence defined by both outer PCR primers are presented in Figure 10 and Figure 11 as reference.
4. Discussion
The results of this study confirm that if the platelet-rich plasma of the patients is separated immediately from the red cells and the white cells after venous blood collection before the spirochetes can attach to the lymphocytes in the test tube [12] and the entire DNA content extracted from the platelet pellet obtained by differential centrifugation is used to initiate a primary PCR, Sanger sequencing of the nested PCR products can accurately diagnose spirochetemia at the early localized stage of Lyme disease when the density of spirochetes is in the low single-digit numbers (1-3) per mL of platelet-rich plasma. A highly sensitive reliable nucleic acid-based blood test is also needed for identification of the post-treatment Lyme disease syndrome patients whose infected tissues continue releasing a small number of spirochetes into the circulating blood [11]. In contrast to metagenomic (next-generation) sequencing detection of B. burgdorferi cell-free DNAs [17] that can be continuously detected even after the B burgdorferi cells have been eliminated by antibiotics [18,19], Sanger sequencing of a segment of the chromosomal DNA of B. burgdorferi cells spun down in the pellet of the platelet fraction can diagnose active infections in patients with persistent Lyme disease. Dead bacteria in the circulating blood are quickly removed and digested by the reticuloendothelial system (RES), particularly in the liver and the spleen [20]. In practice, next-generation sequencing is unable to detect B. burgdorferi cell-free DNA in the plasma of patients with active EM rashes and is considered unlikely to be helpful in diagnosing early localized Lyme disease [21].
The finding of 33 spirochetemic cases (33.7%) among 98 symptomatic patients clinically suspected of having early localized Lyme disease was a surprise because it is generally assumed that spirochetemia only begins at the “early disseminated stage” [3,4,5]. Since spirochetemia can occur at the early localized Lyme disease even without an erythema migrans, a highly sensitive and specific diagnostic laboratory test for detecting very low-density B. burgdorferi cells in the blood specimen is needed to diagnose Lyme disease patients for early, proper treatment to prevent deep tissue damages.
Another unexpected finding is that 25 of the 41 split samples tested positive for FlaB gene without a concomitant 16S rRNA gene PCR amplification. Since the chromosome of the cultured “wild type” B. burgdorferi is known to contain a single copy of FlaB gene [22] and a single copy of 16S rRNA gene [23], a 1:1 gene ratio, which is also supported by simultaneously testing these two genes on double serial dilutions of the DNA extract from cultured B. burgdorferi cells (Figure 5), the B. burgdorferi spirochetes invading the blood of the patients at the early localized stage of Lyme disease must have developed more than one copy of FlaB gene in the chromosome through gene duplication to account for the split sample discordance between these two gene PCR test results (Figure 1).
Other investigators also reported that when the synovial fluid DNA of Lyme disease patients was tested for both the 16S rRNA gene and flagellin gene, the PCR targeting the 16S rRNA gene yielded amplification in only 8 cases while the PCR targeting the flagellin gene yielded amplification in 9 cases, a phenomenon referred to as “target imbalance”. Such target imbalance could not be demonstrated when serial dilutions of B. burgdorferi DNA extracted from cultured organisms were tested [24], as observed in the current study.
The findings of 6 SNPs in the form of 2 overlapping nucleotide peaks in 4 of the 40 specimens positive for FlaB gene PCR (Figure 5 Panels A, F and H, and Figure 7) provided evidence for gene duplication in the chromosomal FlaB gene of the B. burgdorferi cells invading the blood of the patients during the early localized stage of Lyme disease. Since duplicate genes initially have identical sequences but diverge in coding and regulatory regions during subsequent evolution [25,26,27,28], the spirochetes in the other 36 FlaB-positive specimens without a SNP in their FlaB gene sequence probably also had more than one identical FlaB gene copy in the form of paralogs in their chromosome at the early stage of duplication. When duplicated paralogs with an identical sequence were amplified by a pair of PCR primers, only one PCR amplicon would be generated for Sanger sequencing.
Using PCR amplification of chromosomal genes for laboratory diagnosis of B. burgdorferi spirochetemia at the early localized stage of Lyme disease has been hampered by its low sensitivity [29]. When agarose gel electrophoresis is used as the tool for detection, approximately 104 copies of target DNA are required as the template to generate a PCR product band after a 25-30 PCR cycles amplification [30] because in testing for a pathogen’s genomic DNA in human specimens PCR amplification never reaches its theoretical 100% efficiency due to the presence of PCR inhibitors among many other interfering factors [31,32].
In the current nested PCR study, the primary PCR mixture contained all the PCR inhibitors, especially the mitochondrial DNA, derived from the platelets isolated from about 2 mL of whole blood. The primary PCR needed at least two copies [16] of target DNA to initiate an exponential amplification to deliver the required copy number of target DNA in about 0.2 µL for the nested PCR to generate a visible product band at agarose gel electrophoresis after 30 cycles of nested PCR amplification. When each of the two split sample primary PCR mixtures contained only one copy of B. burgdorferi chromosome, the split sample nested PCR testing would generate a negative 16S rRNA gene amplification and a positive FlaB gene amplification because each chromosome contained only one copy of 16S rRNA gene and at least two copies of FlaB gene, one in the form of paralog. It required at least 3 copies of chromosome, one copy aliquoted to the FlaB gene amplification and two copies aliquoted to the 16S rRNA gene amplification, to generate a positive FlaB gene PCR and a positive 16S rRNA gene PCR. When there was only one copy of chromosome in the entire platelet-rich plasma specimen, the specimen would test positive for B. burgdorferi if this single copy of chromosome was aliquoted for the FlaB primary PCR during sample splitting. However, if this single copy of chromosome was aliquoted for the 16S rRNA gene primary PCR by chance during sample splitting, the same specimen would generate a false-negative result.
If the entire platelet pellet DNA extract containing a single copy of B. burgdorferi chromosome were used to initiate a primary FlaB PCR without sample splitting, the false-negative result would be avoided. However, the FlaB gene PCR primers are designed specifically for B. burgdorferi assays, and will fail to amplify the FlaB genes of the relapsing fever Borrelia species, including the FlaB gene of Borrelia miyamotoi. Since the 16S rRNA gene PCR primers used in this study are designed to amplify a highly conserved segment of the 16S rRNA gene of all known pathogenic Borrelia species [33], a split sample testing to include the 16S rRNA gene PCR can detect spirochetemia caused by a relapsing fever Borrelia species, a B. burgdorferi sensu lato species, or a mixture of the two [11,34]. The trade-off for ensuring detection of a single B. burgdorferi cell by allocating the entire DNA extract to a FlaB gene nested PCR without a concomitant 16S rRNA gene PCR is to risk missing spirochetemic cases caused by a tick-borne relapsing fever Borrelia species.
The biological significance of the duplicate FlaB gene paralogs is totally unknown. The Borrelia burgdorferi spirochetes may gain these FlaB gene paralogs at certain stage of their life cycle and lose the paralogs when the spirochetes are cultured in artificial media in the test tube. Since almost all DNA sequencing works on Borrelia burgdorferi were carried out on pure cultures, no FlaB gene paralog sequences have been published.
The finding of 1-2 B. burgdorferi cells in 1 mL of platelet-rich plasma among asymptomatic people residing in Lyme disease-endemic areas in the United States is not a surprise since spirochetemia among asymptomatic patients in early Lyme disease has been reported to be 22.9% by blood cultures [35].
5. Conclusions
This study shows that B. burgdorferi cells causing spirochetemia at the early localized stage of Lyme disease have more than one copy of FlaB gene due to the presence of FlaB paralogs. Targeting a 447-base segment of the FlaB gene for nested PCR amplification followed by Sanger sequencing of the PCR product for verification can detect a single B. burgdorferi cell spun down in the platelet pellet derived from about 2 mL of whole blood with 100% specificity. Since the highly mobile B. burgdorferi spirochetes can invade co-incubated lymphocytes in the test tube at ambient temperature, the spirochetes along with the platelets must be separated from the whole blood by differential centrifugation as soon as possible after blood collection to prevent losing the limited number of spirochetes to the buffy coat.
Author Contributions
Not applicable.
Funding
DiaSorin: Inc. paid Milford Molecular Diagnostics Laboratory a fee to perform the tests described in this article.
Acknowledgments
The author thanks Ashli Rode and her colleagues in DiaSorin, Inc. for supplying the platelet-rich plasma specimens used in this study. The author also thanks Wilda Garayua for her technical assistance.
Conflicts of Interest
Sin Hang Lee is Director of the Milford Molecular Diagnostics Laboratory, a CLIA-certified laboratory specialized in developing DNA sequencing-based diagnostic tests implementable in community hospital laboratories.
References
- Kugeler, K. J., Schwartz, A. M., Delorey, M. J., Mead, P. S., & Hinckley, A. F. (2021). Estimating the Frequency of Lyme Disease Diagnoses, United States, 2010-2018. Emerging infectious diseases, 27(2), 616–619. [CrossRef]
- Steere, A. C., Strle, F., Wormser, G. P., Hu, L. T., Branda, J. A., Hovius, J. W., Li, X., & Mead, P. S. (2016). Lyme borreliosis. Nature reviews. Disease primers, 2, 16090. [CrossRef]
- Shapiro E., D. (2014). Borrelia burgdorferi (Lyme disease). Pediatrics in review, 35(12), 500–509. [CrossRef]
- Medline Plus. Lyme Disease. Available online: https://medlineplus.gov/ency/article/001319.htm.
- U.S. Center for Disease Control and Prevention. Available online: https://emergency.cdc.gov/coca/ppt/2021/052021_transcript.pdf.
- Skar GL, Simonsen KA. Lyme Disease. [Updated 2023 Nov 15]. In: StatPearls [Internet]. Treasure Island (FL): StatPearls Publishing; 2023 Jan. Available online: https://www.ncbi.nlm.nih.gov/books/NBK431066/.
- Hyde J., A. (2017). Borrelia burgdorferi Keeps Moving and Carries on: A Review of Borrelial Dissemination and Invasion. Frontiers in immunology, 8, 114. [CrossRef]
- Barthold, S. W., Persing, D. H., Armstrong, A. L., & Peeples, R. A. (1991). Kinetics of Borrelia burgdorferi dissemination and evolution of disease after intradermal inoculation of mice. The American journal of pathology, 139(2), 263–273.
- Seguro, A. C., & Andrade, L. (2013). Pathophysiology of leptospirosis. Shock (Augusta, Ga.), 39 Suppl 1, 17–23. [CrossRef]
- Schmid G., P. (1989). Epidemiology and clinical similarities of human spirochetal diseases. Reviews of infectious diseases, 11 Suppl 6, S1460–S1469. [CrossRef]
- Lee, S. H., Vigliotti, J. S., Vigliotti, V. S., Jones, W., Moorcroft, T. A., & Lantsman, K. (2014). DNA sequencing diagnosis of off-season spirochetemia with low bacterial density in Borrelia burgdorferi and Borrelia miyamotoi infections. International journal of molecular sciences, 15(7), 11364–11386. [CrossRef]
- Dorward, D. W., Fischer, E. R., & Brooks, D. M. (1997). Invasion and cytopathic killing of human lymphocytes by spirochetes causing Lyme disease. Clinical infectious diseases: an official publication of the Infectious Diseases Society of America, 25 Suppl 1, S2–S8. [CrossRef]
- Qiu, W. G., & Martin, C. L. (2014). Evolutionary genomics of Borrelia burgdorferi sensu lato: findings, hypotheses, and the rise of hybrids. Infection, genetics and evolution: journal of molecular epidemiology and evolutionary genetics in infectious diseases, 27, 576–593. [CrossRef]
- Casjens, S. R., Mongodin, E. F., Qiu, W. G., Luft, B. J., Schutzer, S. E., Gilcrease, E. B., Huang, W. M., Vujadinovic, M., Aron, J. K., Vargas, L. C., Freeman, S., Radune, D., Weidman, J. F., Dimitrov, G. I., Khouri, H. M., Sosa, J. E., Halpin, R. A., Dunn, J. J., & Fraser, C. M. (2012). Genome stability of Lyme disease spirochetes: comparative genomics of Borrelia burgdorferi plasmids. PloS one, 7(3), e33280. [CrossRef]
- Wills, M. K. B., Kirby, A. M., & Lloyd, V. K. (2018). Detecting the Lyme Disease Spirochete, Borrelia Burgdorferi, in Ticks Using Nested PCR. Journal of visualized experiments: JoVE, (132), 56471. [CrossRef]
- Massung, R. F., Slater, K., Owens, J. H., Nicholson, W. L., Mather, T. N., Solberg, V. B., & Olson, J. G. (1998). Nested PCR assay for detection of granulocytic ehrlichiae. Journal of clinical microbiology, 36(4), 1090–1095. [CrossRef]
- Branda, J. A., Lemieux, J. E., Blair, L., Ahmed, A. A., Hong, D. K., Bercovici, S., Blauwkamp, T. A., Hollemon, D., Ho, C., Strle, K., Damle, N. S., Lepore, T. J., & Pollock, N. R. (2021). Detection of Borrelia burgdorferi Cell-free DNA in Human Plasma Samples for Improved Diagnosis of Early Lyme Borreliosis. Clinical infectious diseases: an official publication of the Infectious Diseases Society of America, 73(7), e2355–e2361. [CrossRef]
- Iyer, R., Mukherjee, P., Wang, K., Simons, J., Wormser, G. P., & Schwartz, I. (2013). Detection of Borrelia burgdorferi nucleic acids after antibiotic treatment does not confirm viability. Journal of clinical microbiology, 51(3), 857–862. [CrossRef]
- U.S. Centers for Disease Control and Prevention. Lyme Disease Frequently Asked Questions (FAQ). Available online: https://stacks.cdc.gov/view/cdc/120282/cdc_120282_DS1.pdf.
- Minasyan, H. (2016). Mechanisms and pathways for the clearance of bacteria from blood circulation in health and disease. Pathophysiology: the official journal of the International Society for Pathophysiology, 23(2), 61–66. [CrossRef]
- Handel, A. S., Ho, C., Hollemon, D. D., Hong, D. K., & Beneri, C. (2019). 231. Microbial cell-free DNA Sequencing to Detect Borrelia burgdorferi DNA in the Plasma of Pediatric Patients with Lyme Disease. Open Forum Infectious Diseases, 6(Suppl 2), S133. [CrossRef]
- Wallich, R., Moter, S. E., Simon, M. M., Ebnet, K., Heiberger, A., & Kramer, M. D. (1990). The Borrelia burgdorferi flagellum-associated 41-kilodalton antigen (flagellin): molecular cloning, expression, and amplification of the gene. Infection and immunity, 58(6), 1711–1719. [CrossRef]
- Schwartz, J. J., Gazumyan, A., & Schwartz, I. (1992). rRNA gene organization in the Lyme disease spirochete, Borrelia burgdorferi. Journal of bacteriology, 174(11), 3757–3765. [CrossRef]
- Persing, D. H., Rutledge, B. J., Rys, P. N., Podzorski, D. S., Mitchell, P. D., Reed, K. D., Liu, B., Fikrig, E., & Malawista, S. E. (1994). Target imbalance: disparity of Borrelia burgdorferi genetic material in synovial fluid from Lyme arthritis patients. The Journal of infectious diseases, 169(3), 668–672. [CrossRef]
- Duprey, A., Nasser, W., Léonard, S., Brochier-Armanet, C., & Reverchon, S. (2016). Transcriptional start site turnover in the evolution of bacterial paralogous genes - the pelE-pelD virulence genes in Dickeya. The FEBS journal, 283(22), 4192–4207. [CrossRef]
- Xu, G., Guo, C., Shan, H., & Kong, H. (2012). Divergence of duplicate genes in exon-intron structure. Proceedings of the National Academy of Sciences of the United States of America, 109(4), 1187–1192. [CrossRef]
- Gao, D., Ko, D. C., Tian, X., Yang, G., & Wang, L. (2015). Expression Divergence of Duplicate Genes in the Protein Kinase Superfamily in Pacific Oyster. Evolutionary bioinformatics online, 11(Suppl 1), 57–65. [CrossRef]
- Reece-Hoyes, J. S., Pons, C., Diallo, A., Mori, A., Shrestha, S., Kadreppa, S., Nelson, J., Diprima, S., Dricot, A., Lajoie, B. R., Ribeiro, P. S., Weirauch, M. T., Hill, D. E., Hughes, T. R., Myers, C. L., & Walhout, A. J. (2013). Extensive rewiring and complex evolutionary dynamics in a C. elegans multiparameter transcription factor network. Molecular cell, 51(1), 116–127. [CrossRef]
- Aguero-Rosenfeld, M. E., Wang, G., Schwartz, I., & Wormser, G. P. (2005). Diagnosis of lyme borreliosis. Clinical microbiology reviews, 18(3), 484–509. [CrossRef]
- New England BioLab Inc. Guidelines for PCR Optimization with Taq DNA Polymerase. Available online: https://www.neb.com/en-us/tools-and-resources/usage-guidelines/guidelines-for-pcr-optimization-with-taq-dna-polymerase.
- Roux, G., Ravel, C., Varlet-Marie, E., Jendrowiak, R., Bastien, P., & Sterkers, Y. (2019). Inhibition of polymerase chain reaction: Pathogen-specific controls are better than human gene amplification. PloS one, 14(9), e0219276. [CrossRef]
- Svec, D., Tichopad, A., Novosadova, V., Pfaffl, M. W., & Kubista, M. (2015). How good is a PCR efficiency estimate: Recommendations for precise and robust qPCR efficiency assessments. Biomolecular detection and quantification, 3, 9–16. [CrossRef]
- Lee, S. H., Healy, J. E., & Lambert, J. S. (2019). Single Core Genome Sequencing for Detection of both Borrelia burgdorferi Sensu Lato and Relapsing Fever Borrelia Species. International journal of environmental research and public health, 16(10), 1779. [CrossRef]
- Lee, S. H., Vigliotti, J. S., Vigliotti, V. S., Jones, W., & Shearer, D. M. (2014). Detection of borreliae in archived sera from patients with clinically suspect Lyme disease. International journal of molecular sciences, 15(3), 4284–4298. [CrossRef]
- Wormser, G. P., McKenna, D., Carlin, J., Nadelman, R. B., Cavaliere, L. F., Holmgren, D., Byrne, D. W., & Nowakowski, J. (2005). Brief communication: hematogenous dissemination in early Lyme disease. Annals of internal medicine, 142(9), 751–755. [CrossRef]
Figure 1.
Images of agarose gel electrophoresis of nested PCR products showing split sample testing results on 20 blood specimens taken from 98 symptomatic patients suspected of having early localized Lyme disease and 20 blood specimens taken from 47 asymptomatic residents living in the same communities during a Lyme disease season. The left panels show a 447-bp FlaB nested PCR band in 13 specimens. But only 3 of the 13 FlaB-positive samples were associated with a concomitant 357-bp 16S rRNA gene nested PCR band in the right panels, and were all in the group of symptomatic patients. Lane numbers = specimen No. N = negative water control. P = DNA extract from cultured B. burgdorferi cells (ATCC 53210) in the left panels, and DNA extract from cultured B. coriaceae cells (ATCC 43381) in the right panels. .
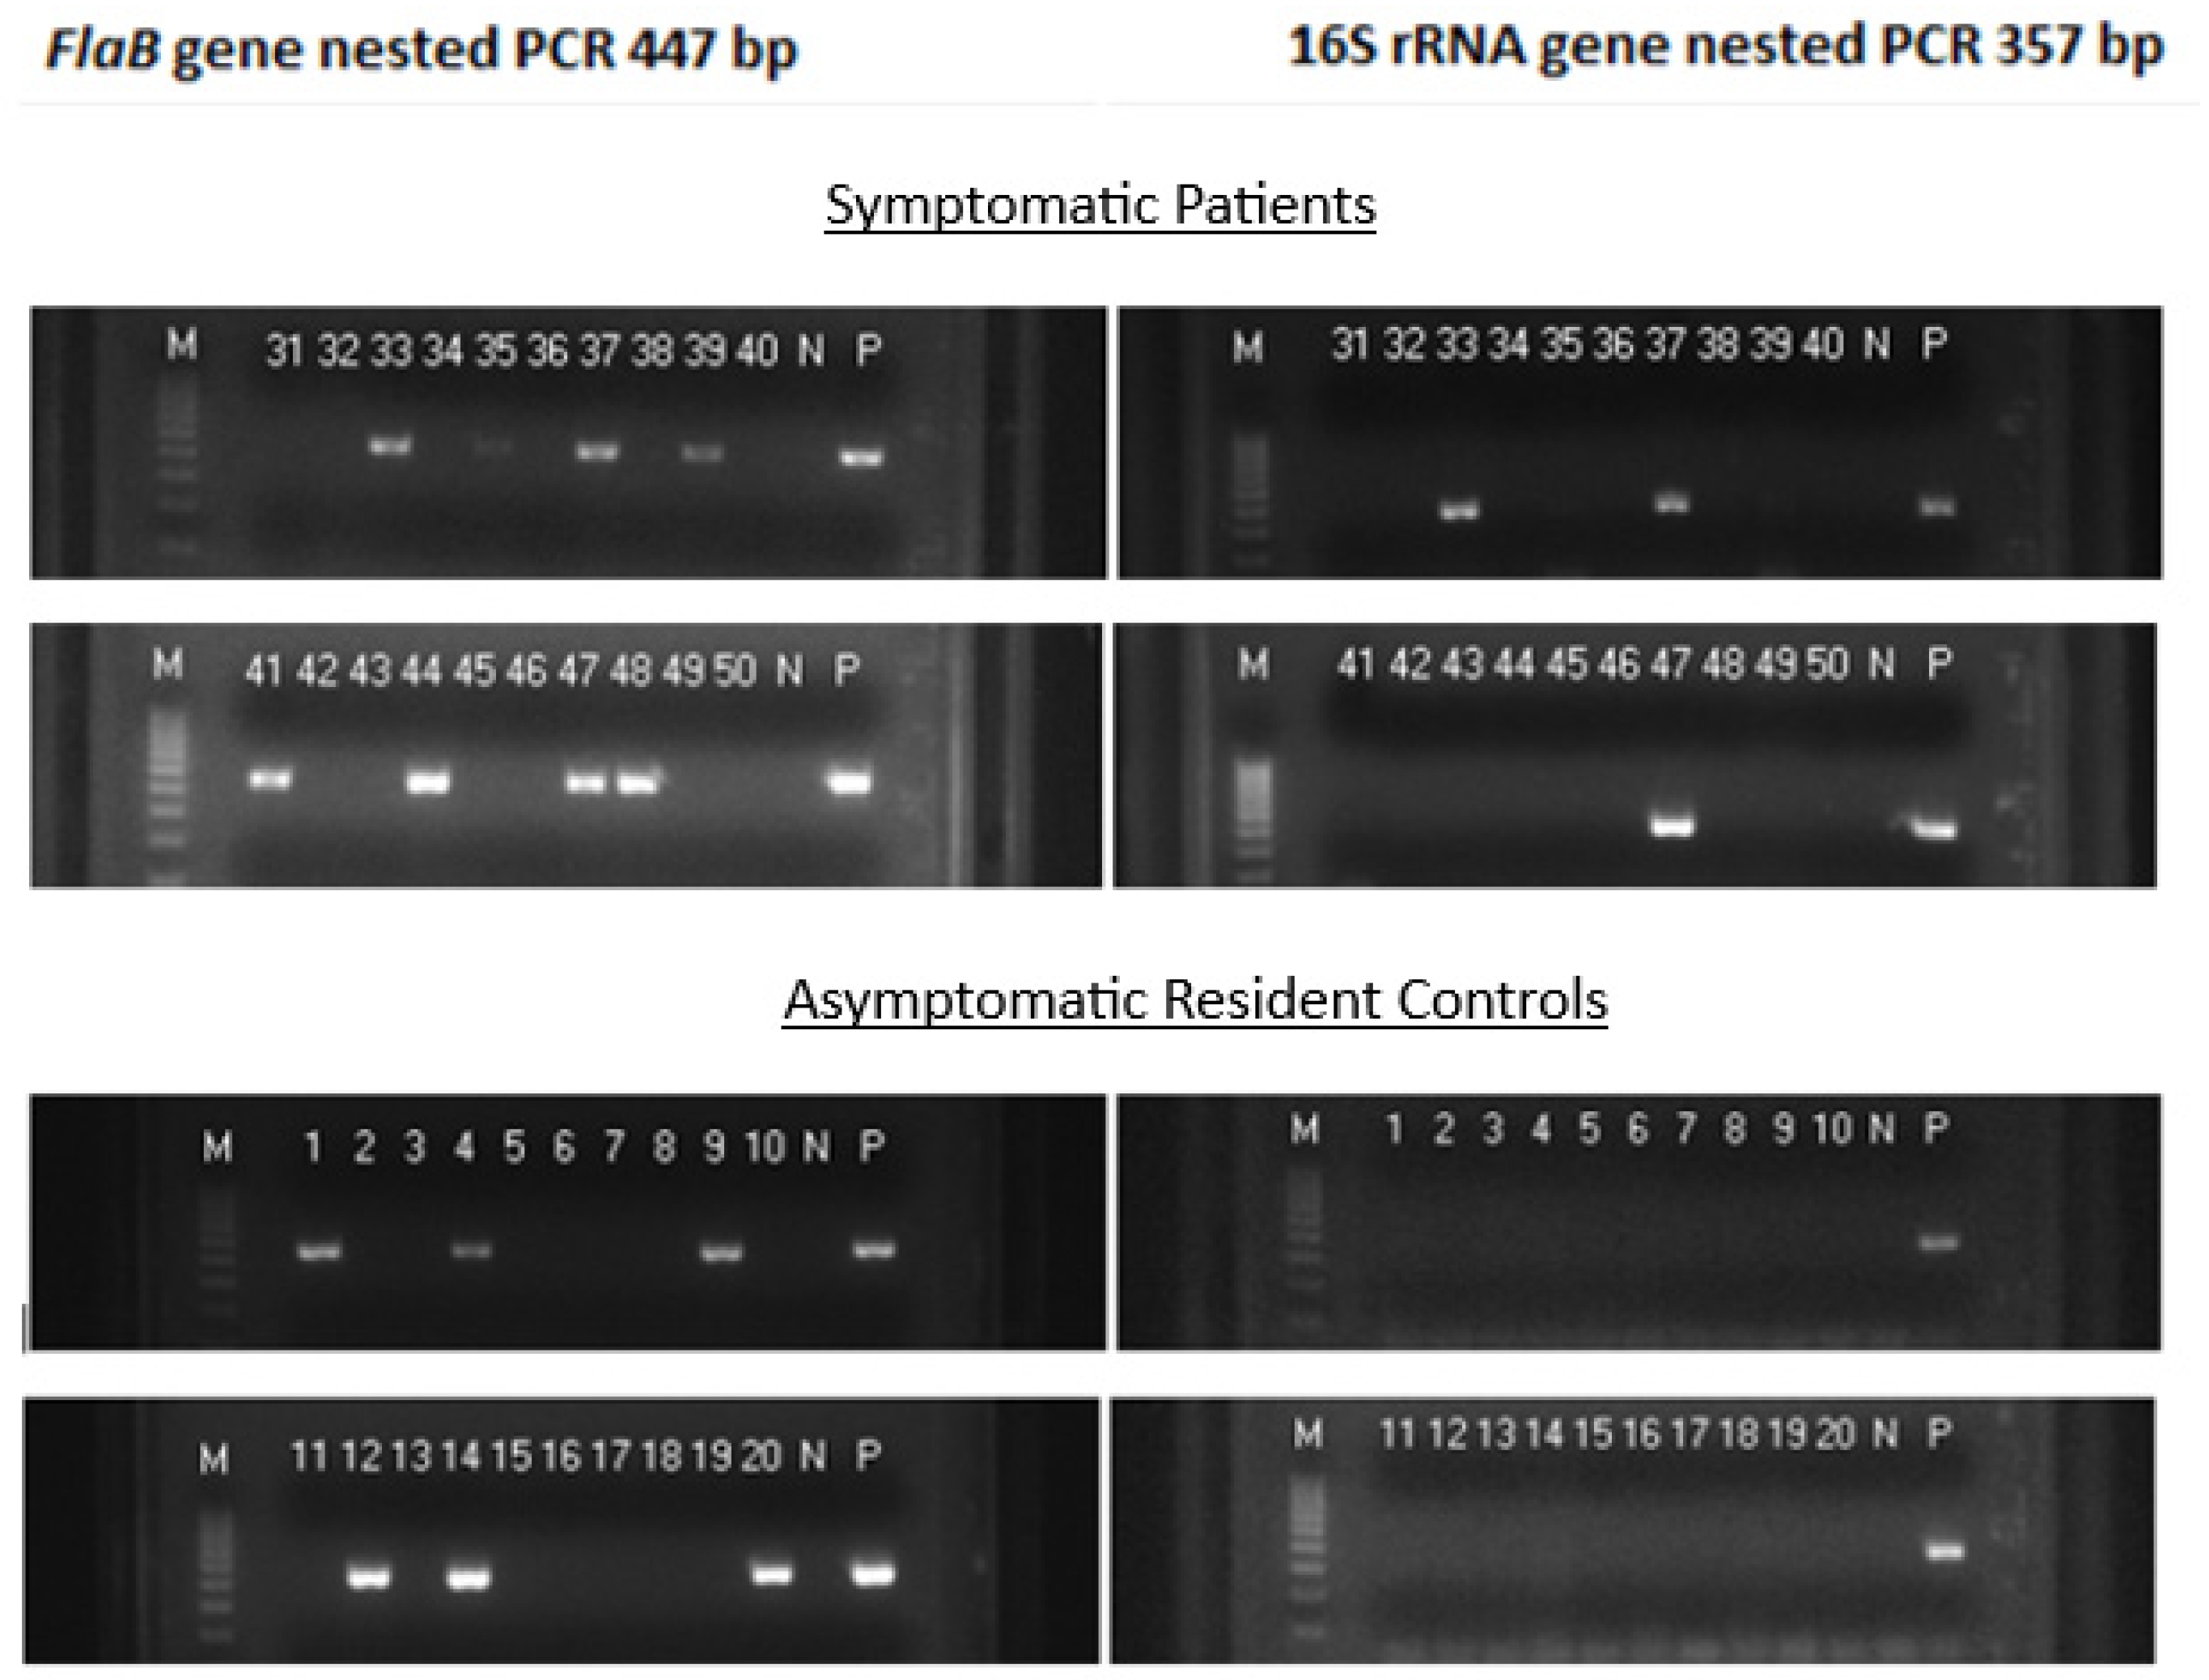
Figure 2.
Image of an electropherogram showing part of a 357-base B. burgdorferi 16S rRNA gene sequence (100% sequence ID match with B. burgdorferi sensu stricto 16S rRNA gene per GenBank sequence database).
Figure 2.
Image of an electropherogram showing part of a 357-base B. burgdorferi 16S rRNA gene sequence (100% sequence ID match with B. burgdorferi sensu stricto 16S rRNA gene per GenBank sequence database).
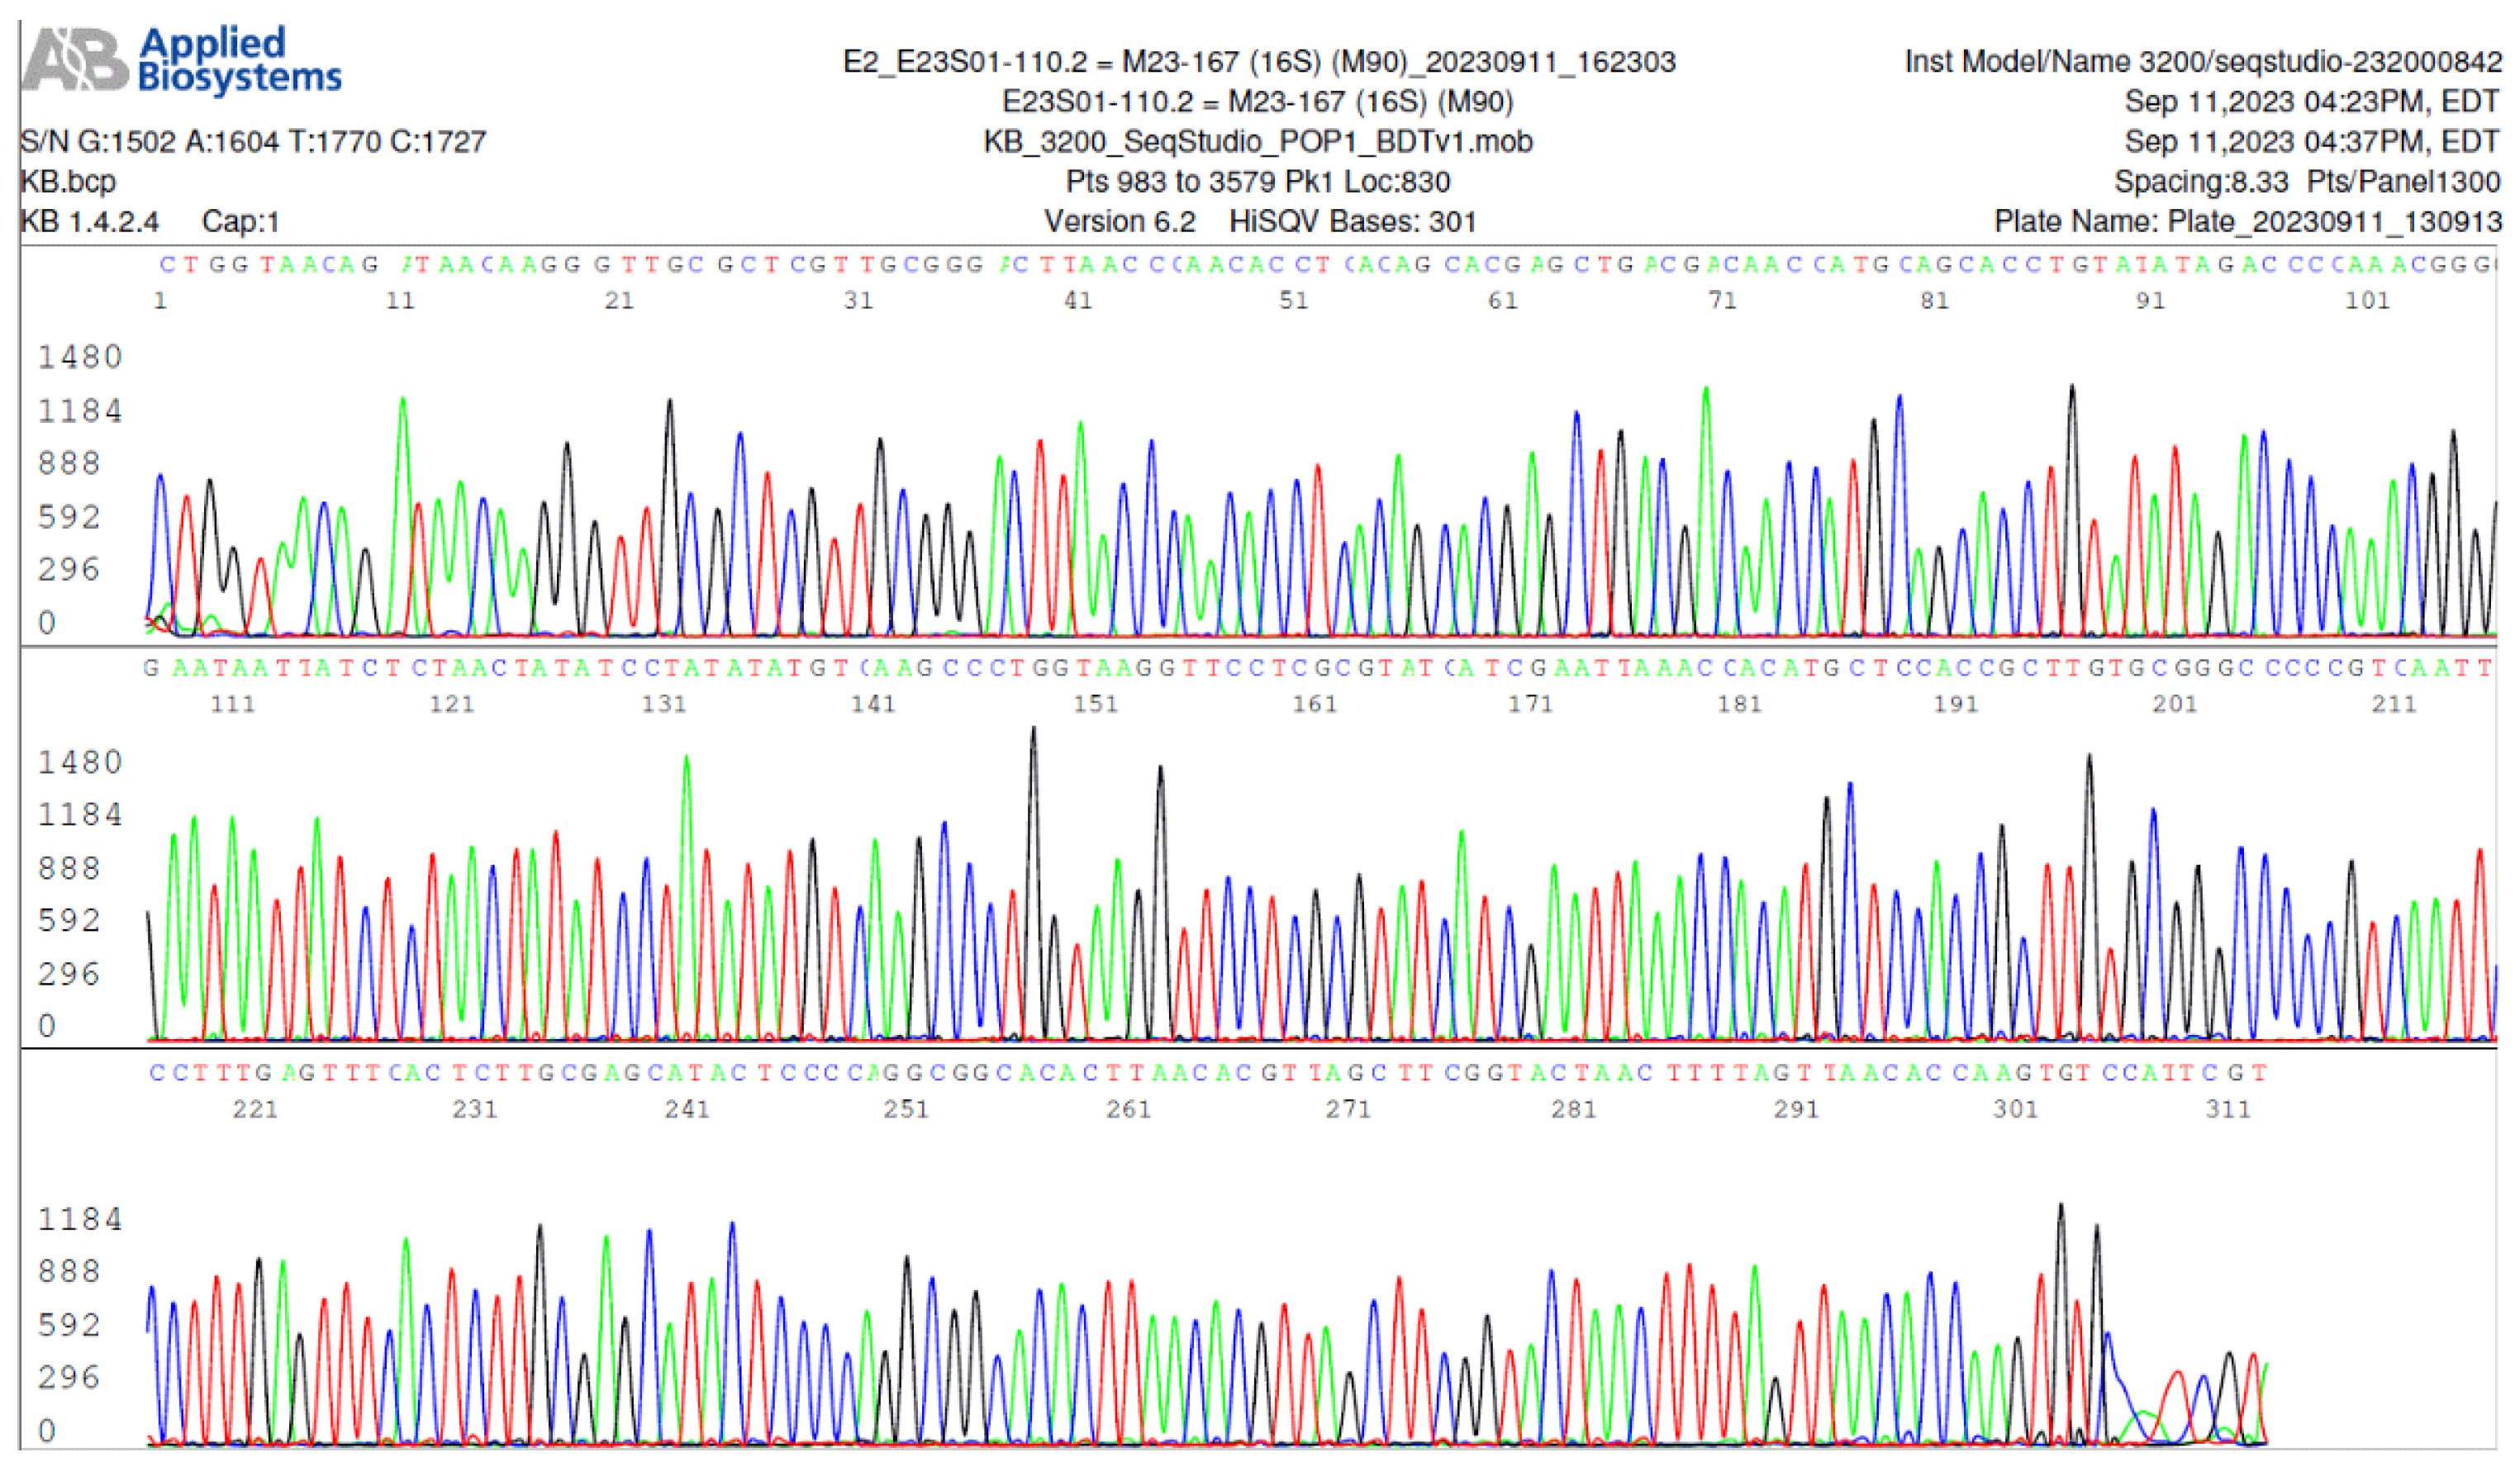
Figure 3.
Image of a FlaB gene forward sequencing electropherogram, using the FlaB inner forward (FIF) nested PCR primer as the sequencing primer, showing an A-to-G (indicated by an arrow) single-nucleotide silent mutation in the 447-bp FlaB gene PCR amplicon. In this FlaB protein, the 306th amino acid alanine was encoded by codon GCG instead of GCA as annotated in the GenBank database for all wild-type B. burgdorferi sensu lato isolates.
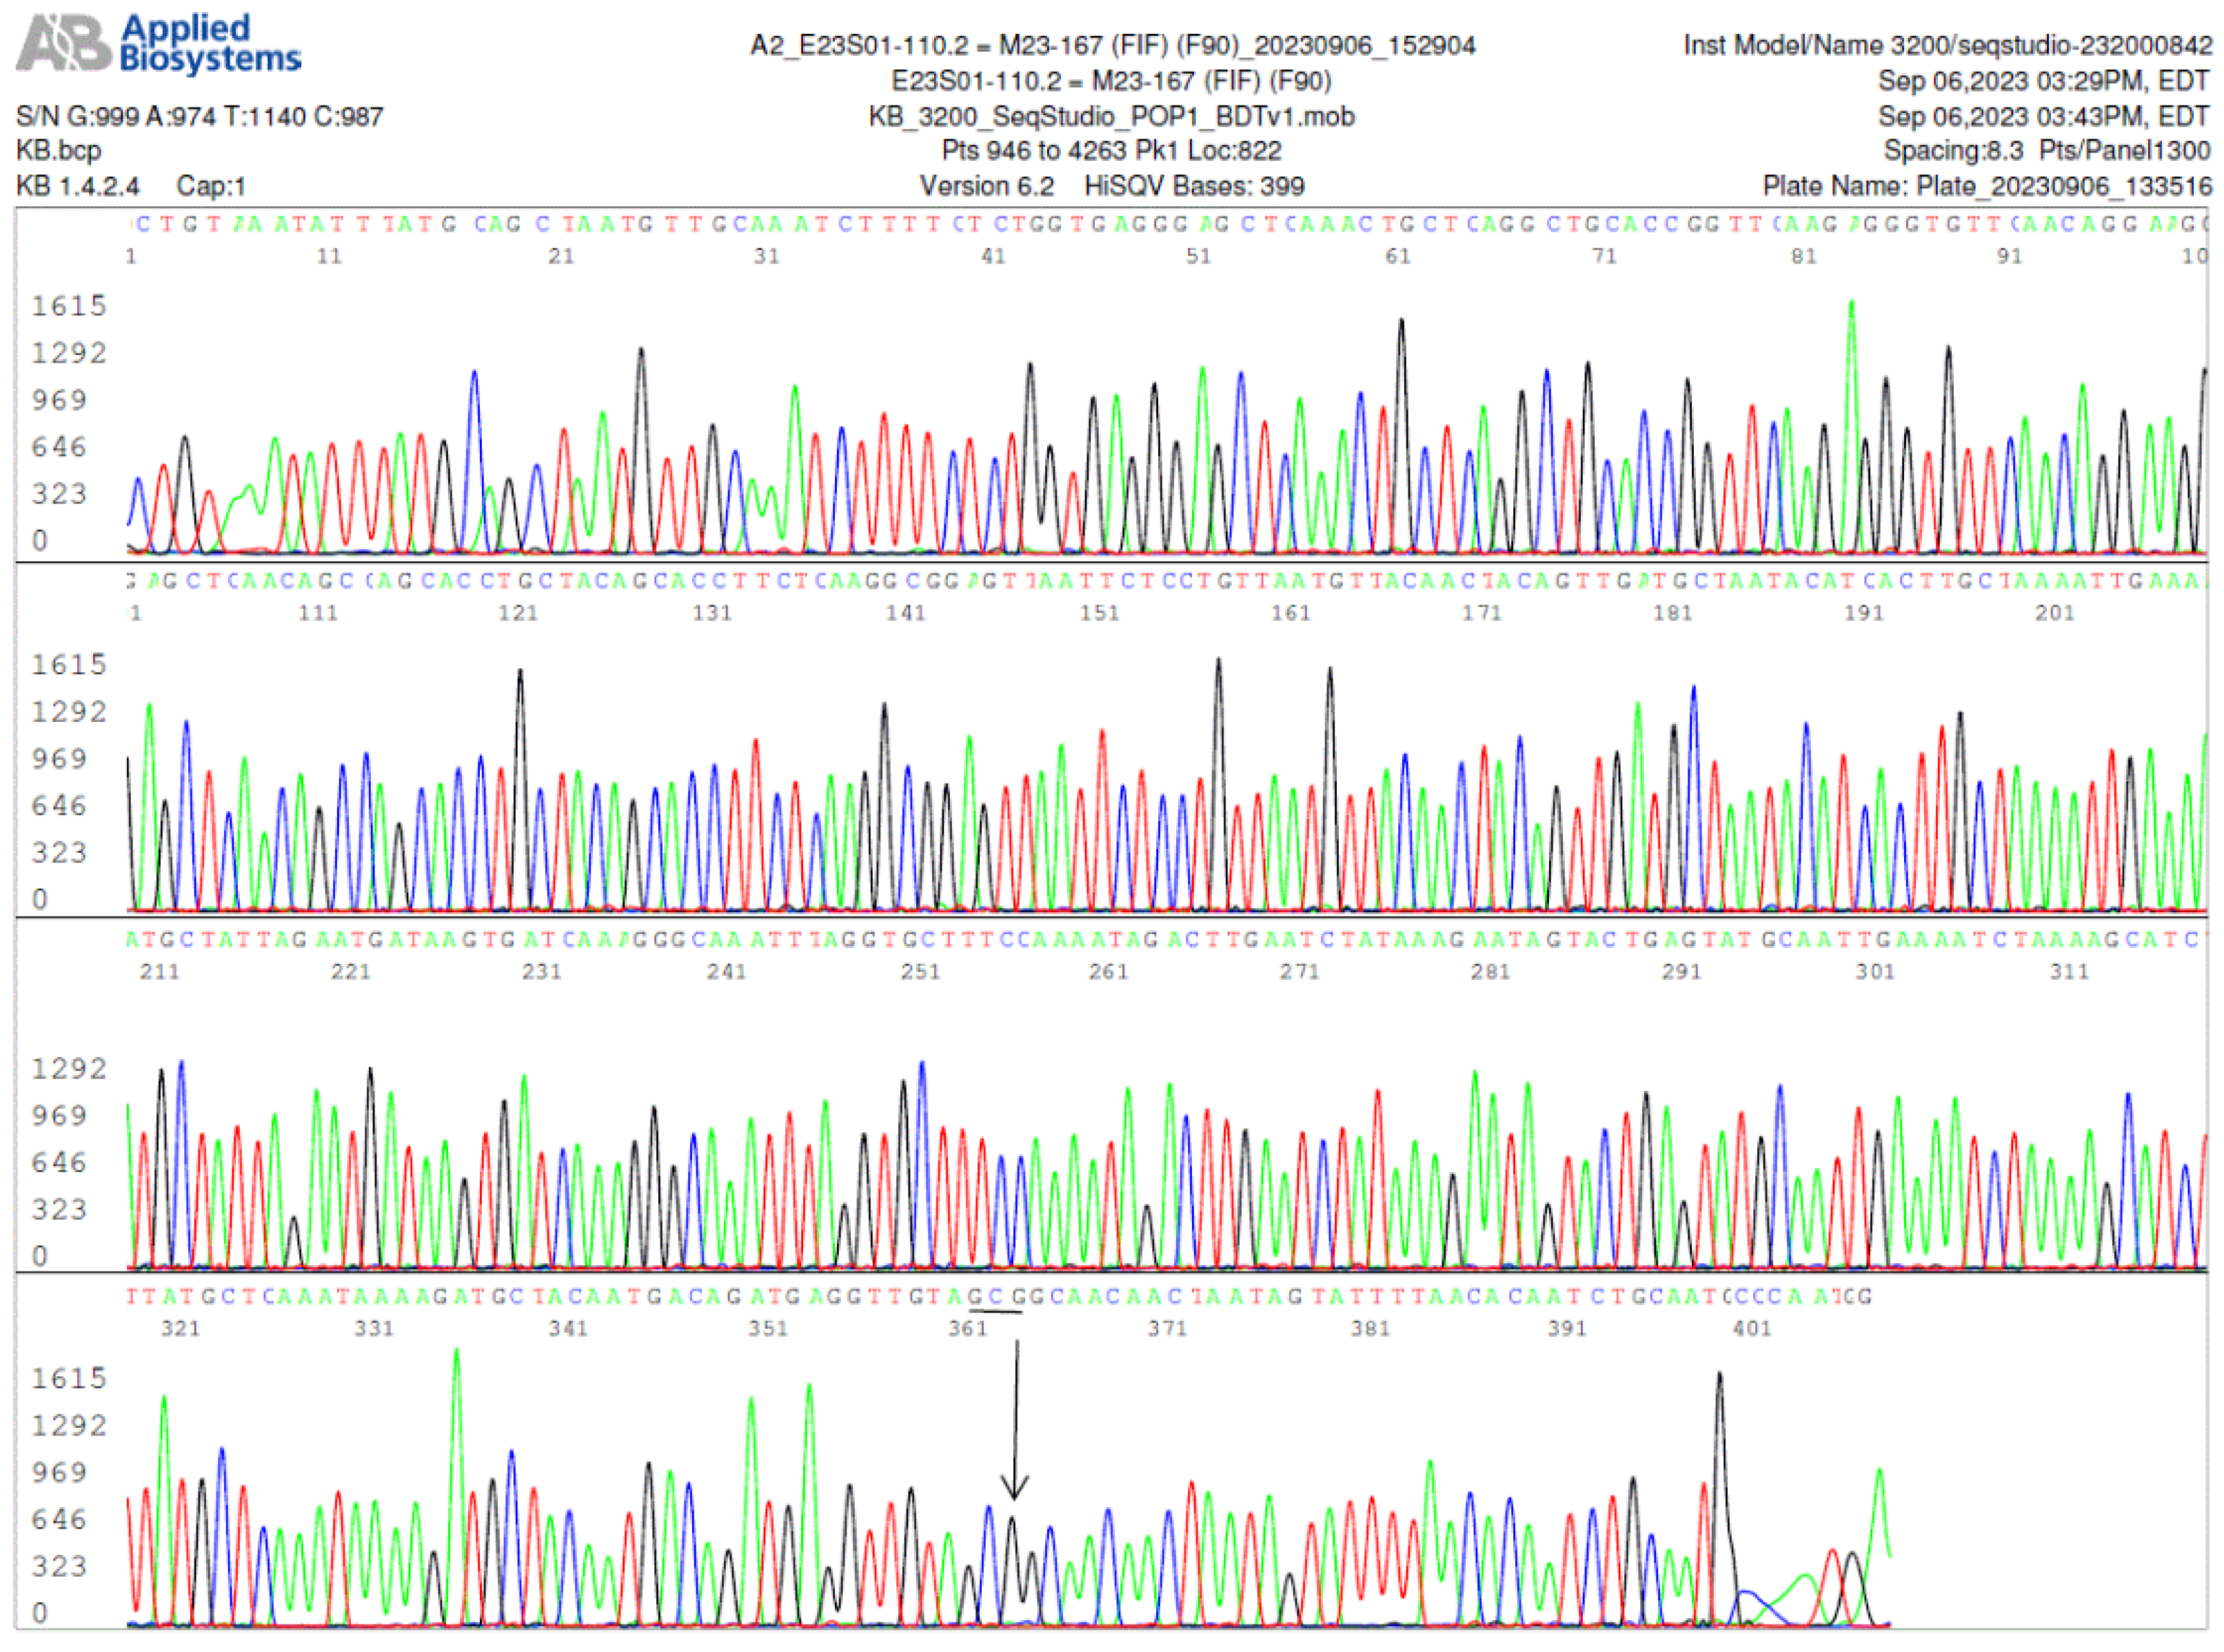
Figure 4.
Image of a FlaB gene reverse sequencing, using the FlaB inner reverse (FIR) nested PCR primer as the sequencing primer, of the same nested PCR product used to generate the electropherogram shown in Figure 3, confirming the A-to-G mutation in the FlaB gene (the reverse complementary base C is indicated by an arrow).
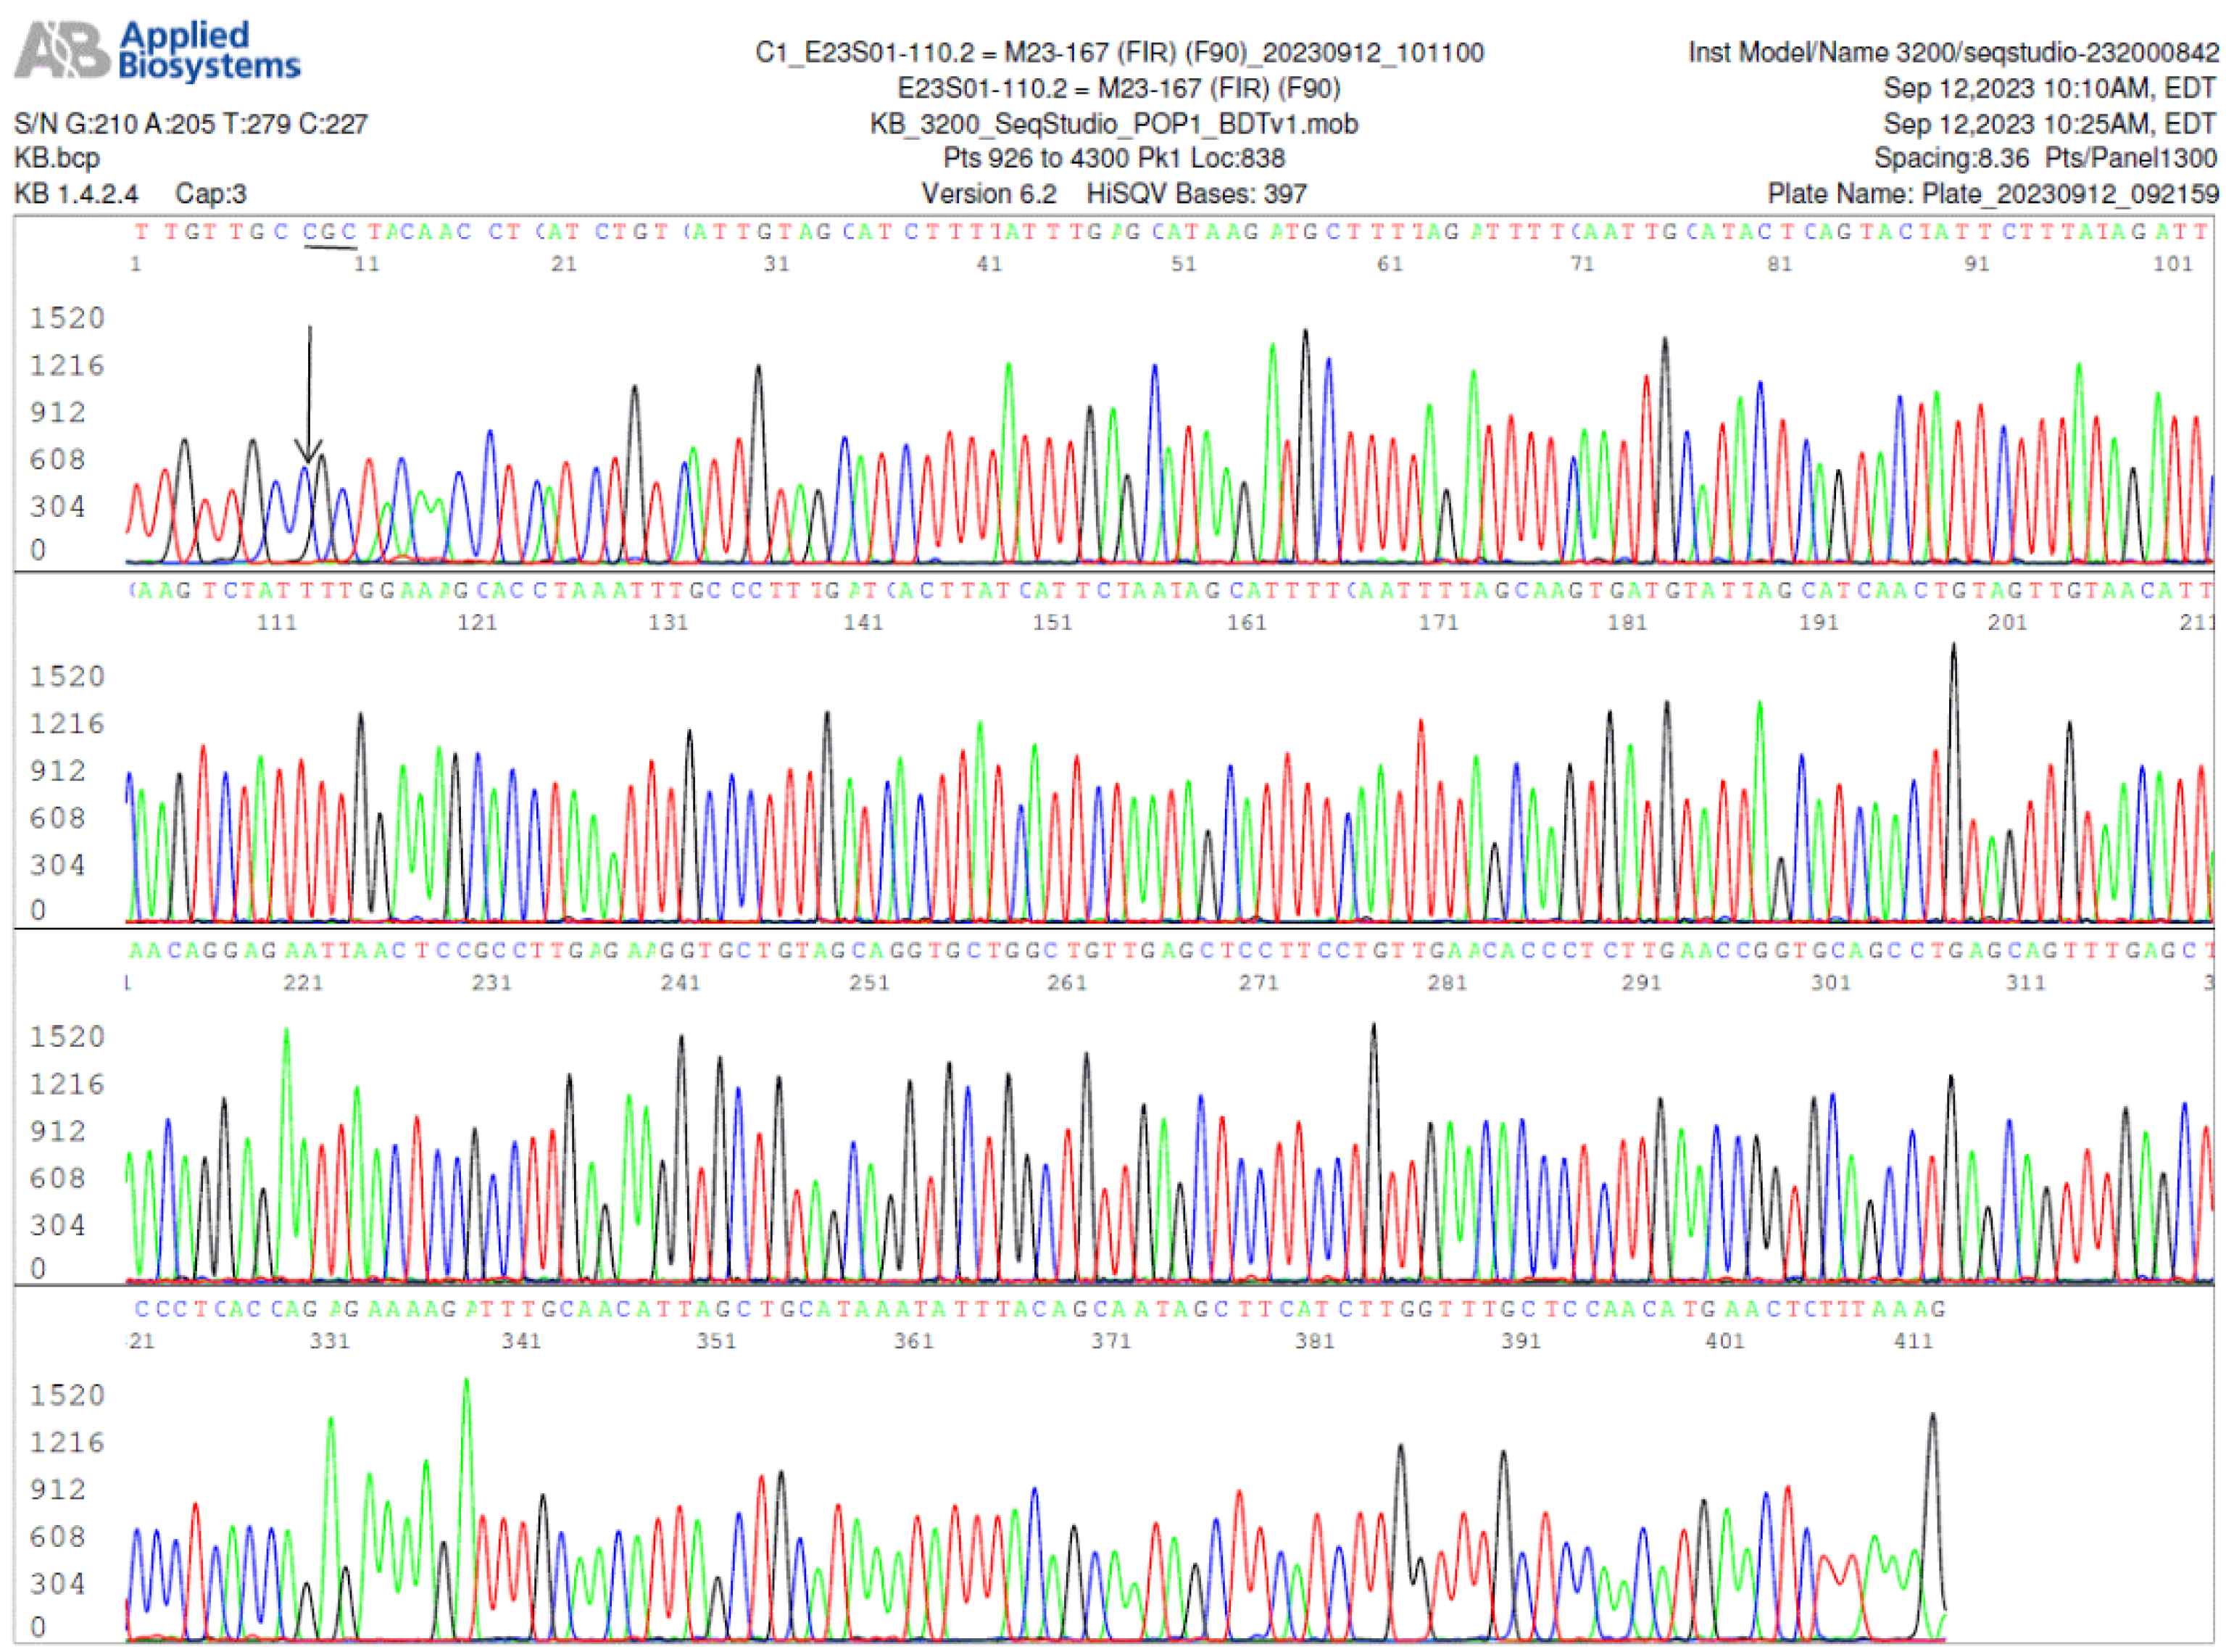
Figure 5.
Images of agarose gel electrophoresis of FlaB gene (left panel) and 16S rRNA gene (right panel) primary and nested PCR products using 2-fold serial dilutions of ATCC 53210 cultured B. burgdorferi DNA in TE buffer as the templates. All primary PCRs were initiated with 1 µL of DNA in decreasing concentrations. For Lanes 1 products, the primary PCR template was 1 µL of solution pipetted from a stock of 100 µL, which contained the DNA extracted from about 51,200 spirochetes (~512 borrelial chromosomes per µL). The total volume in each PCR mixture was 25 µL. Both primary and nested PCRs were amplified 30 cycles. A trace (about 0.2 µL) was transferred from the primary PCR products to initiate the nested PCRs. The sizes of the FlaB primary PCR and nested PCR amplicons were 503 bp and 447 bp, respectively. The sizes of the 16S rRNA gene primary and nested PCR amplicons were both 357 bp because these were same-nested PCRs (using the same pair of primers for both the primary and the nested PCRs). As illustrated in these two gel panels, both the FlaB and 16S rRNA gene nested PCRs had their endpoints in Lane 10 (~1 chromosome/µL used to initiate the primary PCR). After the 9th dilution (Lane 10), the concentrations of chromosome copies dropped to ≤100/100 µL; and 1 µL pipetted from these diluted solutions may contain a chromosome for initiating a PCR amplification only by chance (Lanes 12) due to Poisson distribution.
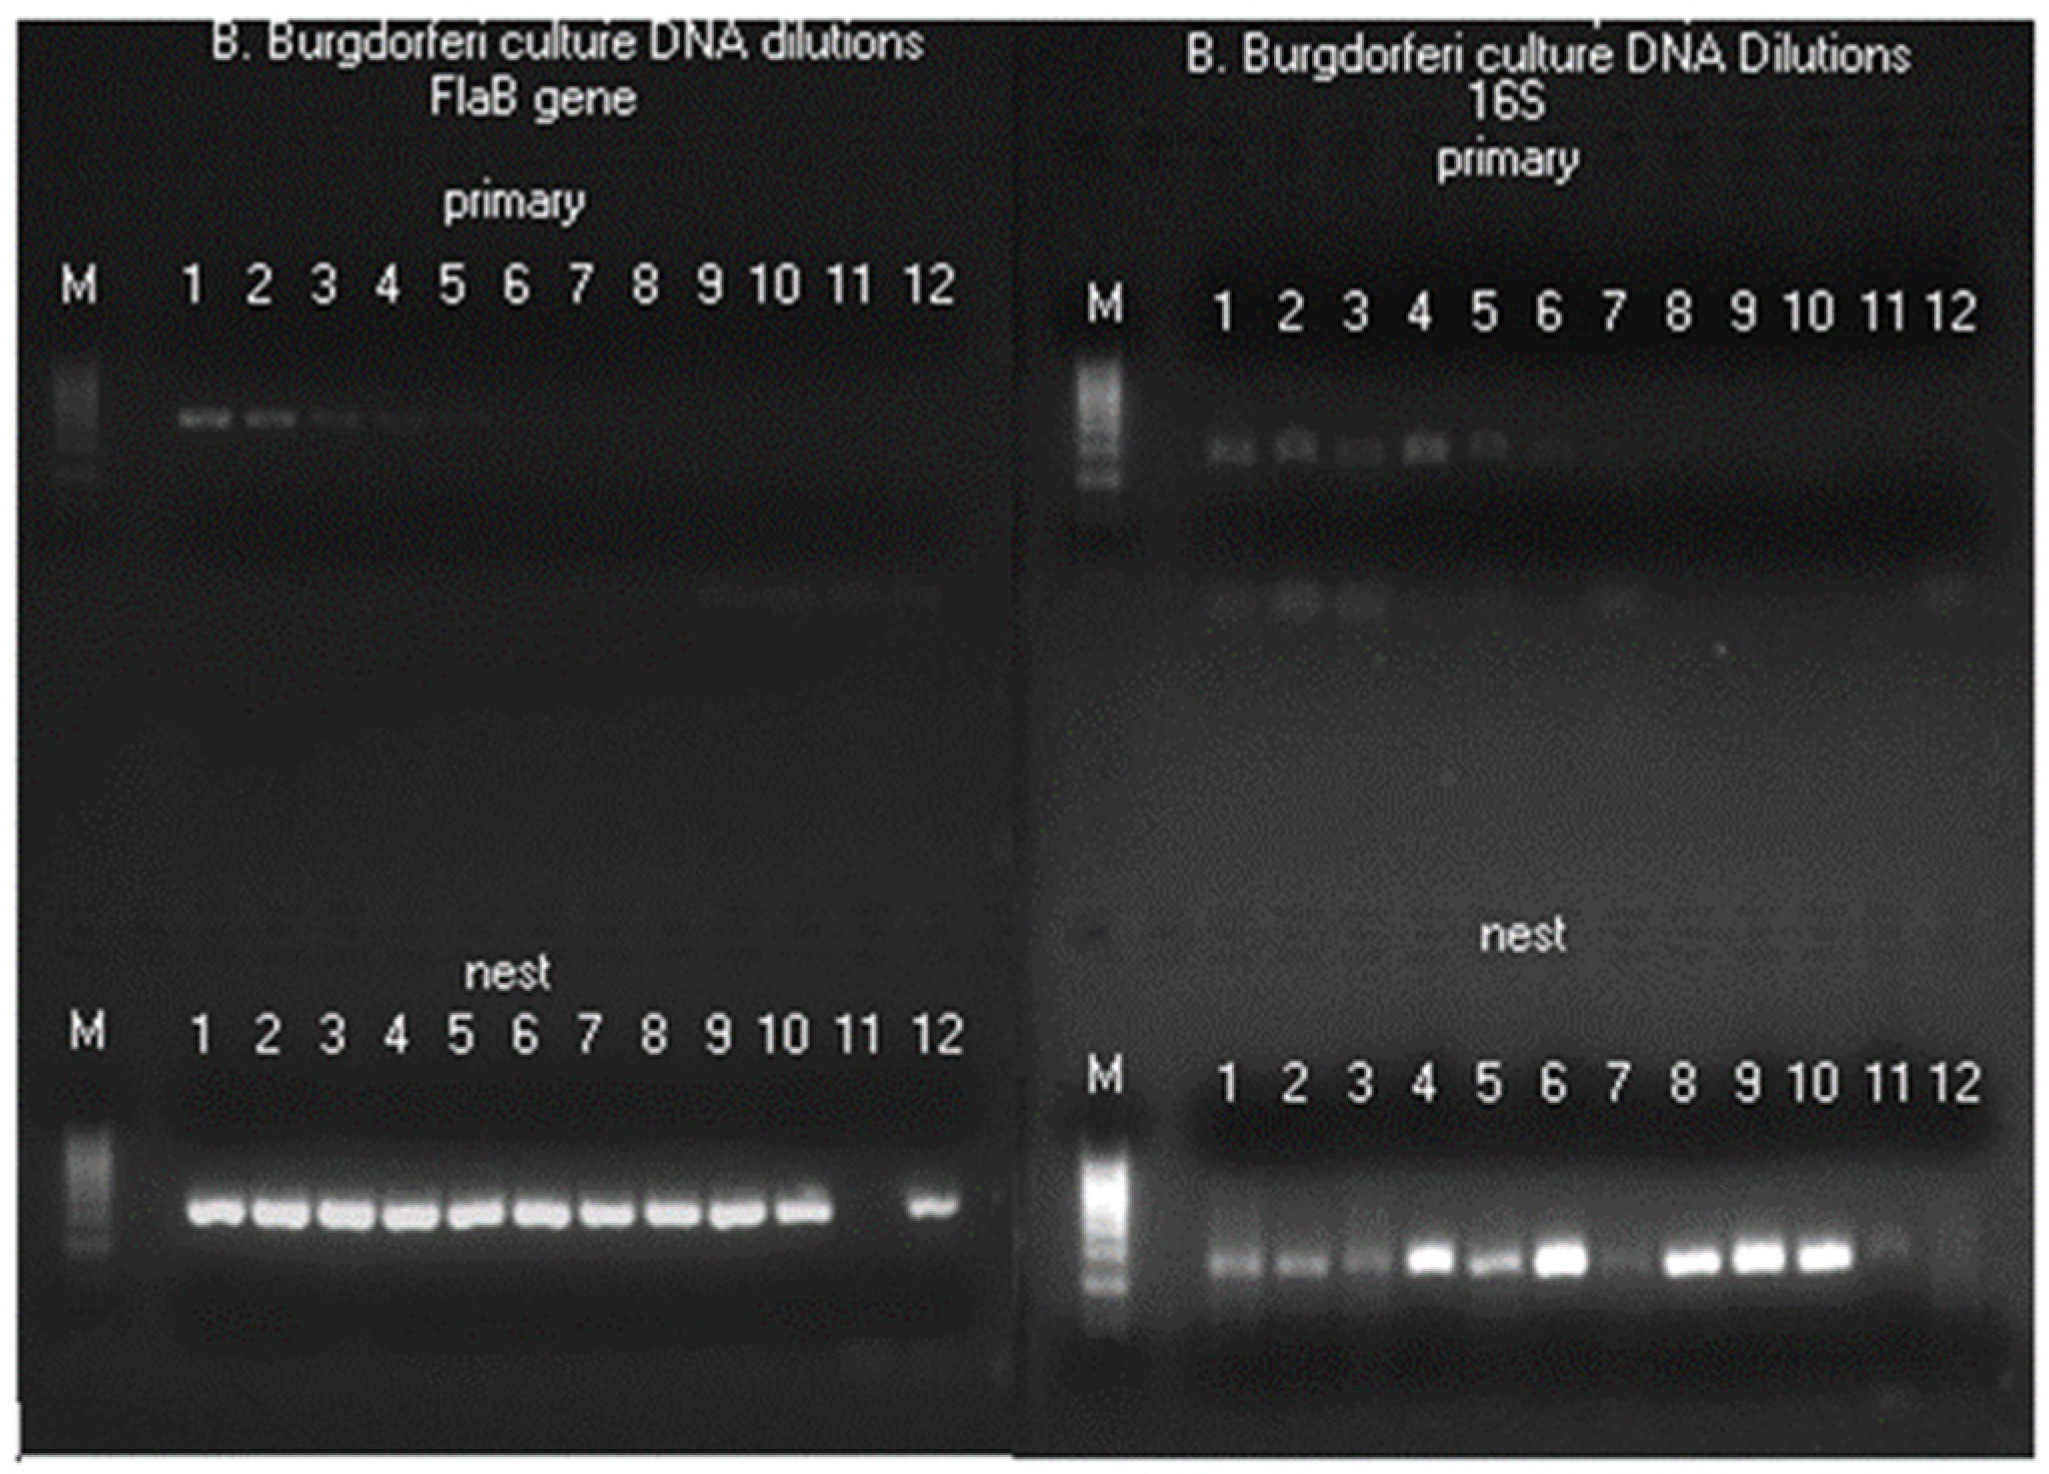
Figure 6.
Panels (A to I) of bidirectional Sanger sequences excised from 9 electropherograms showing 5 B. burgdorferi FlaB gene single-nucleotide mutations (all indicated by arrows) in 4 patient blood specimens. Panel A: There were two copies of FlaB gene with a silent mutation. In one copy, the codon for the 216th amino acid glutamine was CAA as annotated in the GenBank sequence database. In the other copy, the glutamine codon was CAG (not annotated in the GenBank database). Panels B and C: Reverse complement sequencing of the same nested PCR product used for Panel A, confirming the 216th amino acid glutamine was encoded by 2 codons CAG (Panel B) and CAA (Panel C), called by the computer base-caller as CTG and TTG in reverse complement when the sequencing was repeated. Panel D: There was a C-to-G single-nucleotide missense mutation. The 228th amino acid alanine encoded by codon GCA has been converted to glycine encoded by codon GGA (not annotated in the GenBank database). Panel E: Reverse complement sequencing of the same nested PCR product used for Panel D, confirming the 228th amino acid codon was GGA. Panel F: There were two copies of FlaB gene with a silent nutation. In one copy, the codon for the 208th amino acid alanine was GCT. In the other copy, the codon was GCC (not annotated in the GenBank database). Panel G. Reverse complement sequencing of the same nested PCR product used for Panel F, confirming the 208th amino acid alanine was encoded by both GCT and GCC. Panel H: There were two C/T SNPs in the underlined codon TCT, encoding the 199th amino acid serine. When the third nucleotide of the codon changed from T to C, the result was a silent mutation. When the second nucleotide changed from C to T, it caused a missense mutation, turning the amino acid serine into phenylalanine encoded by codon TTT or TTC (a phenylalanine in this position has not been annotated in the GenBank database). Panel I: Reverse complement sequencing of the same nested PCR product used for Panel H, confirming the two C/T SNPs in the codon encoding the 199th amino acid. The existence of two SNPs in one codon verified by Sanger sequencing raised the possibility of more than one duplicated FlaB paralog in a chromosome.
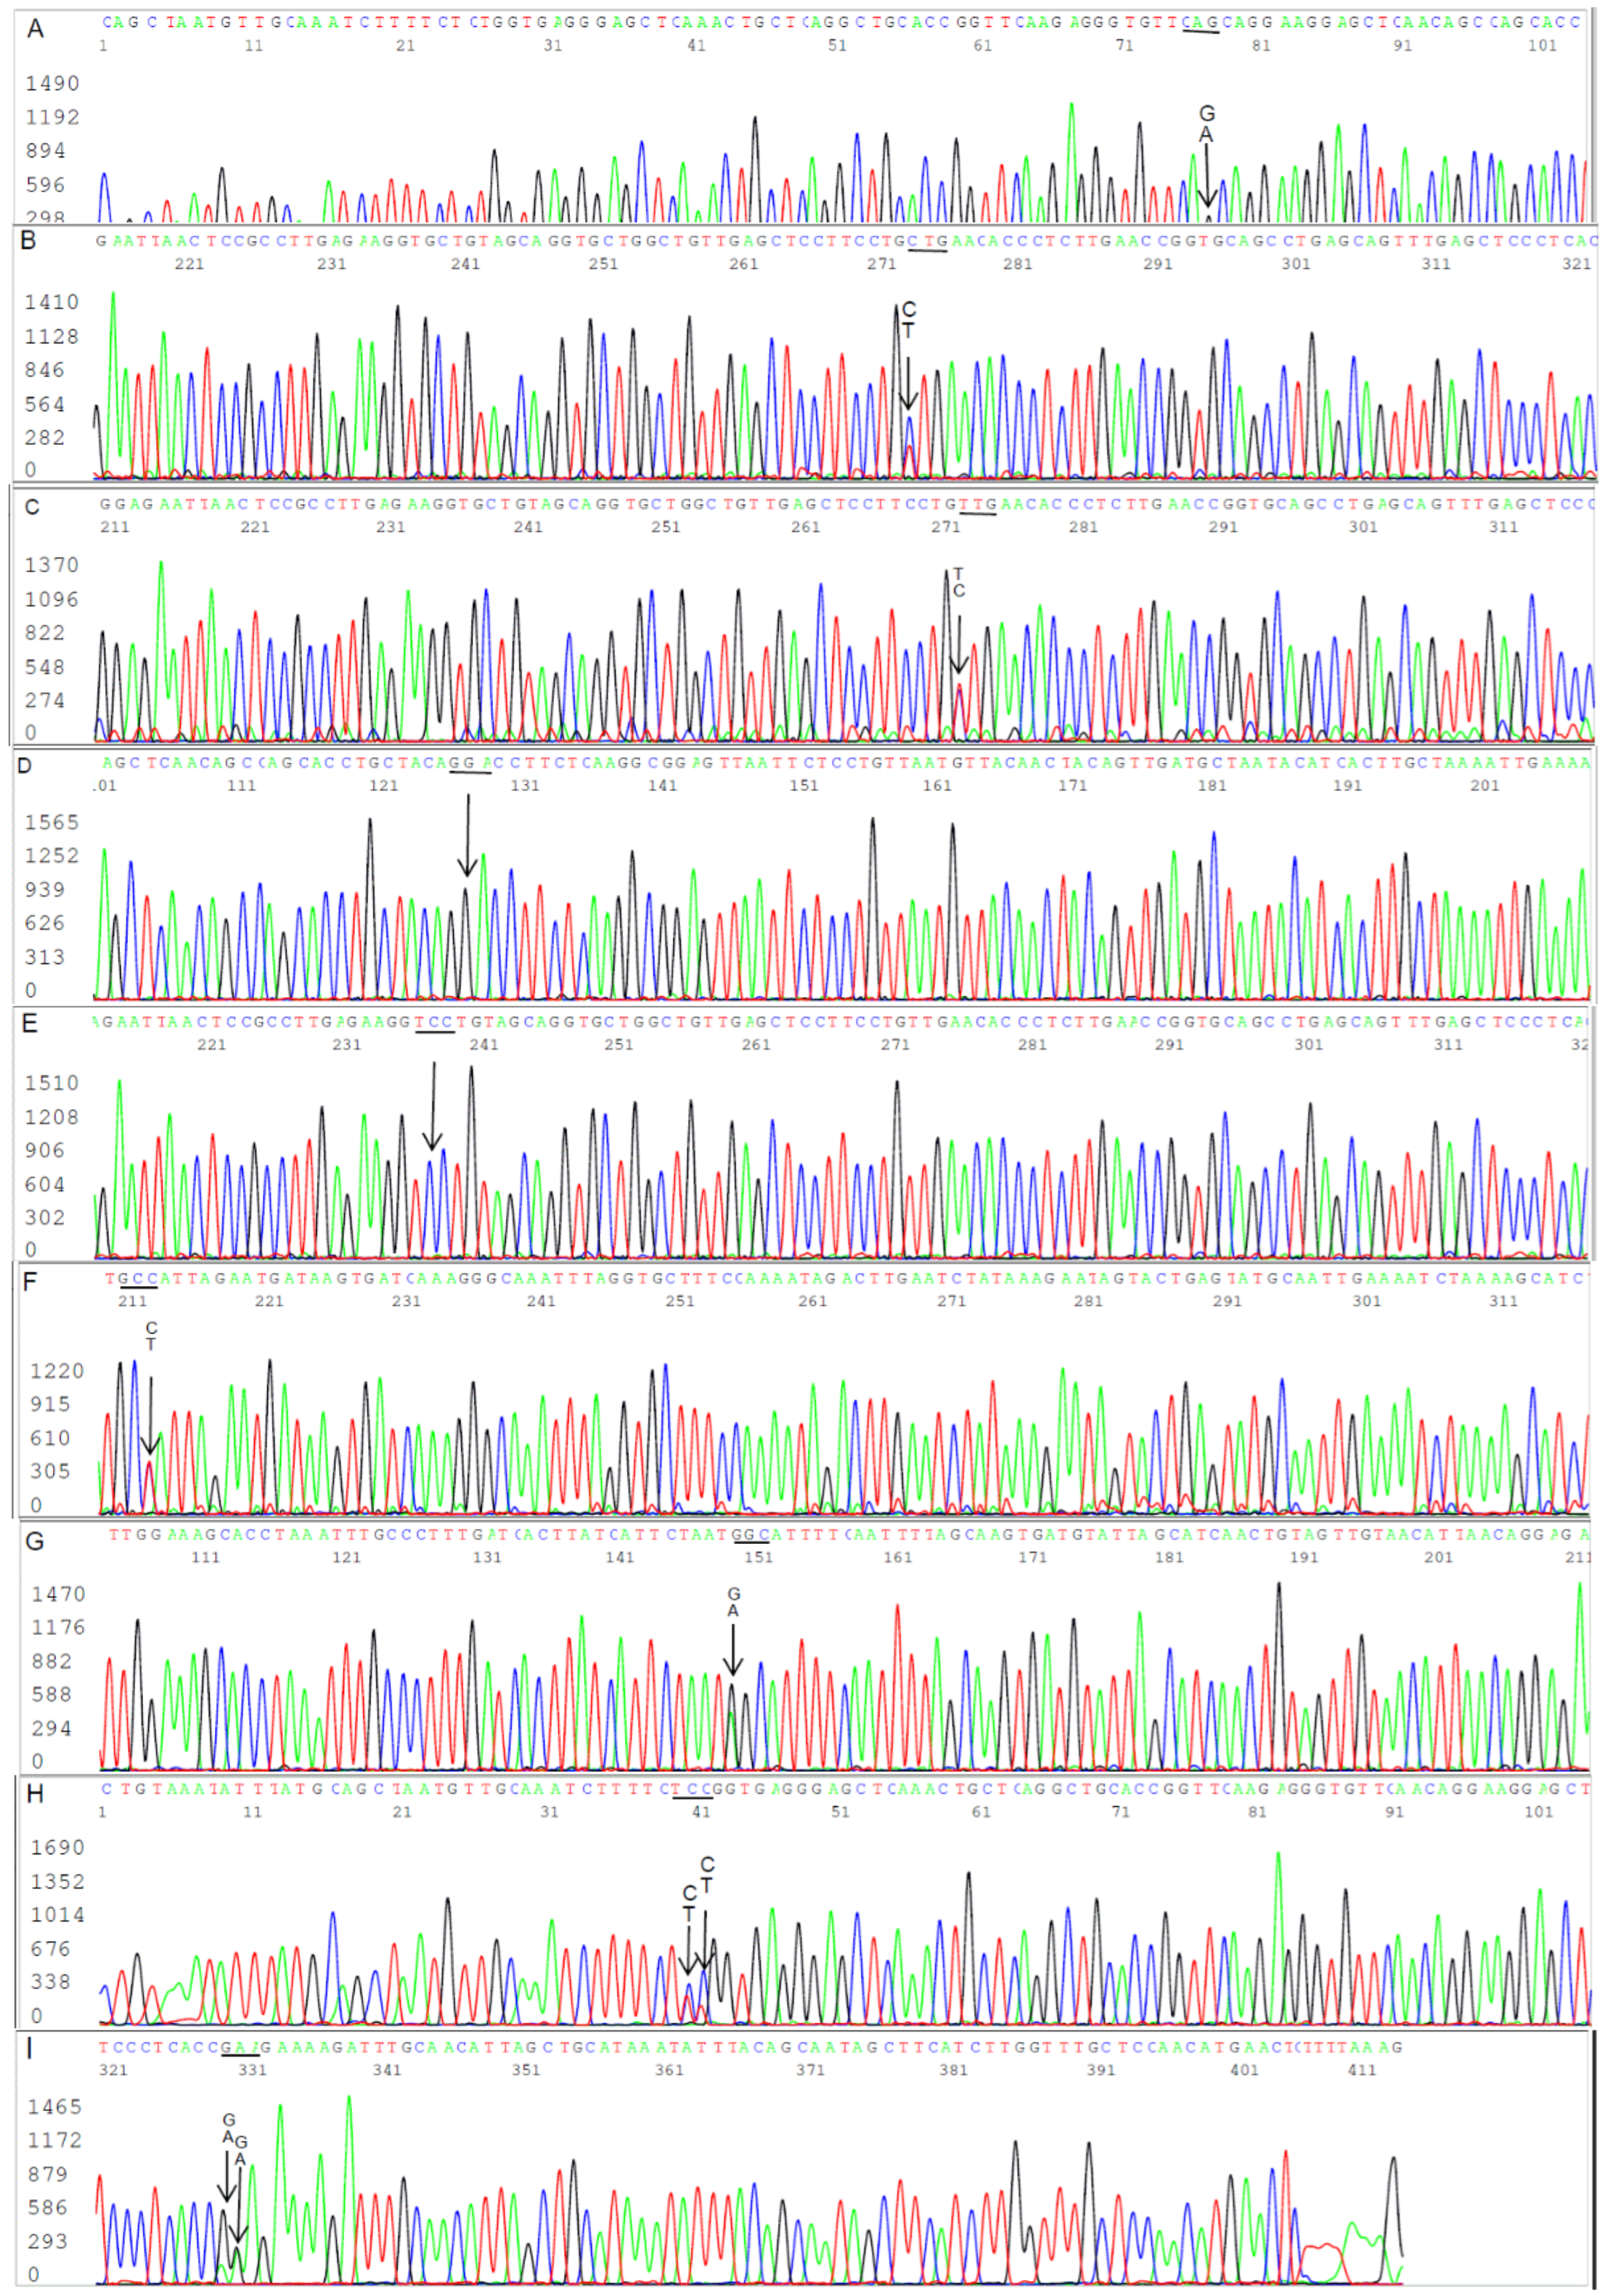
Figure 7.
This electropherogram shows a forward sequencing of the FlaB nested PCR product illustrated in Lane 4 of the asymptomatic resident controls (Figure 1, left panel). In this specimen, there were more than one paralogous FlaB gene in the B. burgdorferi chromosome. The first T/C SNP in this electropherogram indicates that there were at least two copies of FlaB gene in one of which the 205th amino acid threonine was encoded by codon ACT, and in the other the 205th amino acid threonine was encoded by codon ACC, a silent mutation, which has not been annotated in the GenBank sequence database. In addition, there was another A/G SNP at position 371, indicating that there was another duplicated paralog in which the 310th amino acid asparagine encoded by codon AAT was changed to aspartate encoded by codon GAT, a missense mutation. A strain of Borrelia burgdorferi containing a flagellin B protein with aspartate in its 310th amino acid position has not been annotated in the GenBank database.
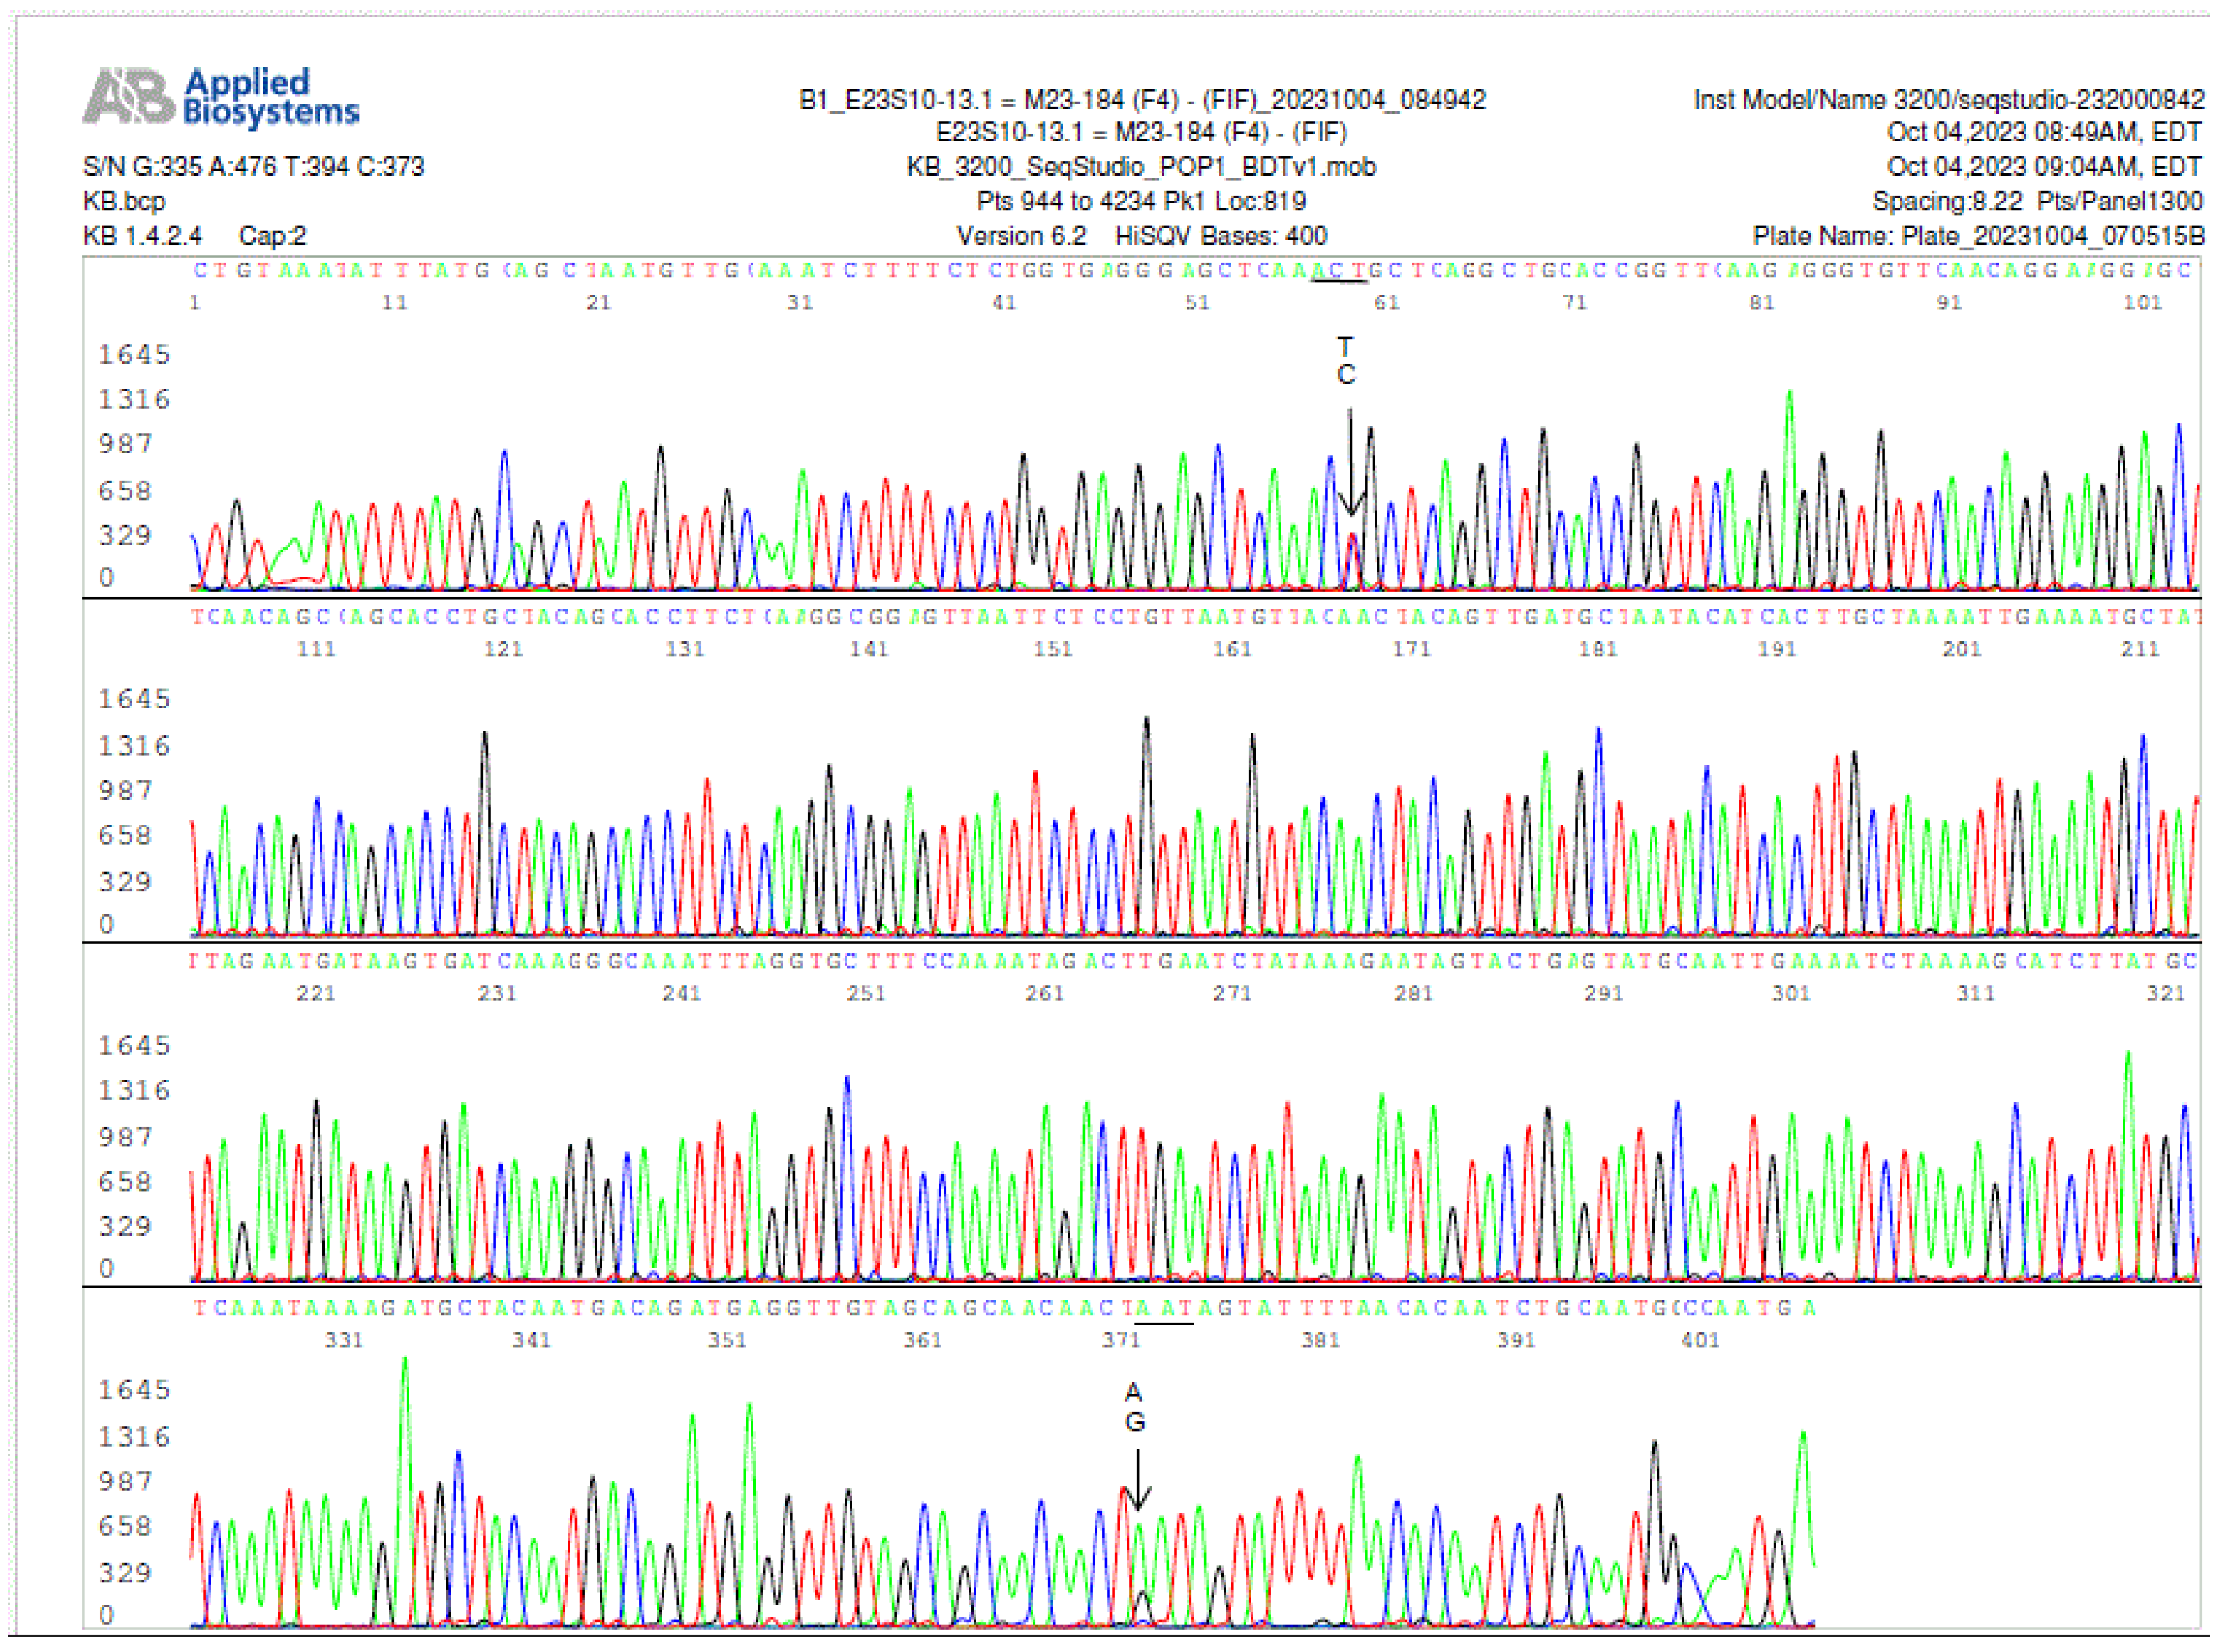
Figure 7.
a. Electropherogram of re-sequencing of the nested PCR product used to generate the sequence shown in Figure 7, confirming an A/G SNP in position 358, pointed by a GA arrow. The computer base-caller called the codon as GAT in the repeated sequencing instead of AAT. The computer base-caller failed to consistently determine whether “A” or “G” was the dominant base in this position even though the “G” peak appears lower than the “A” peak in the A/G SNP in the electropherograms. Sanger sequencing is designed for qualitative analysis, peak heights in Sanger sequencing analysis are not necessarily quantitative and may not indicate the amount of DNA.
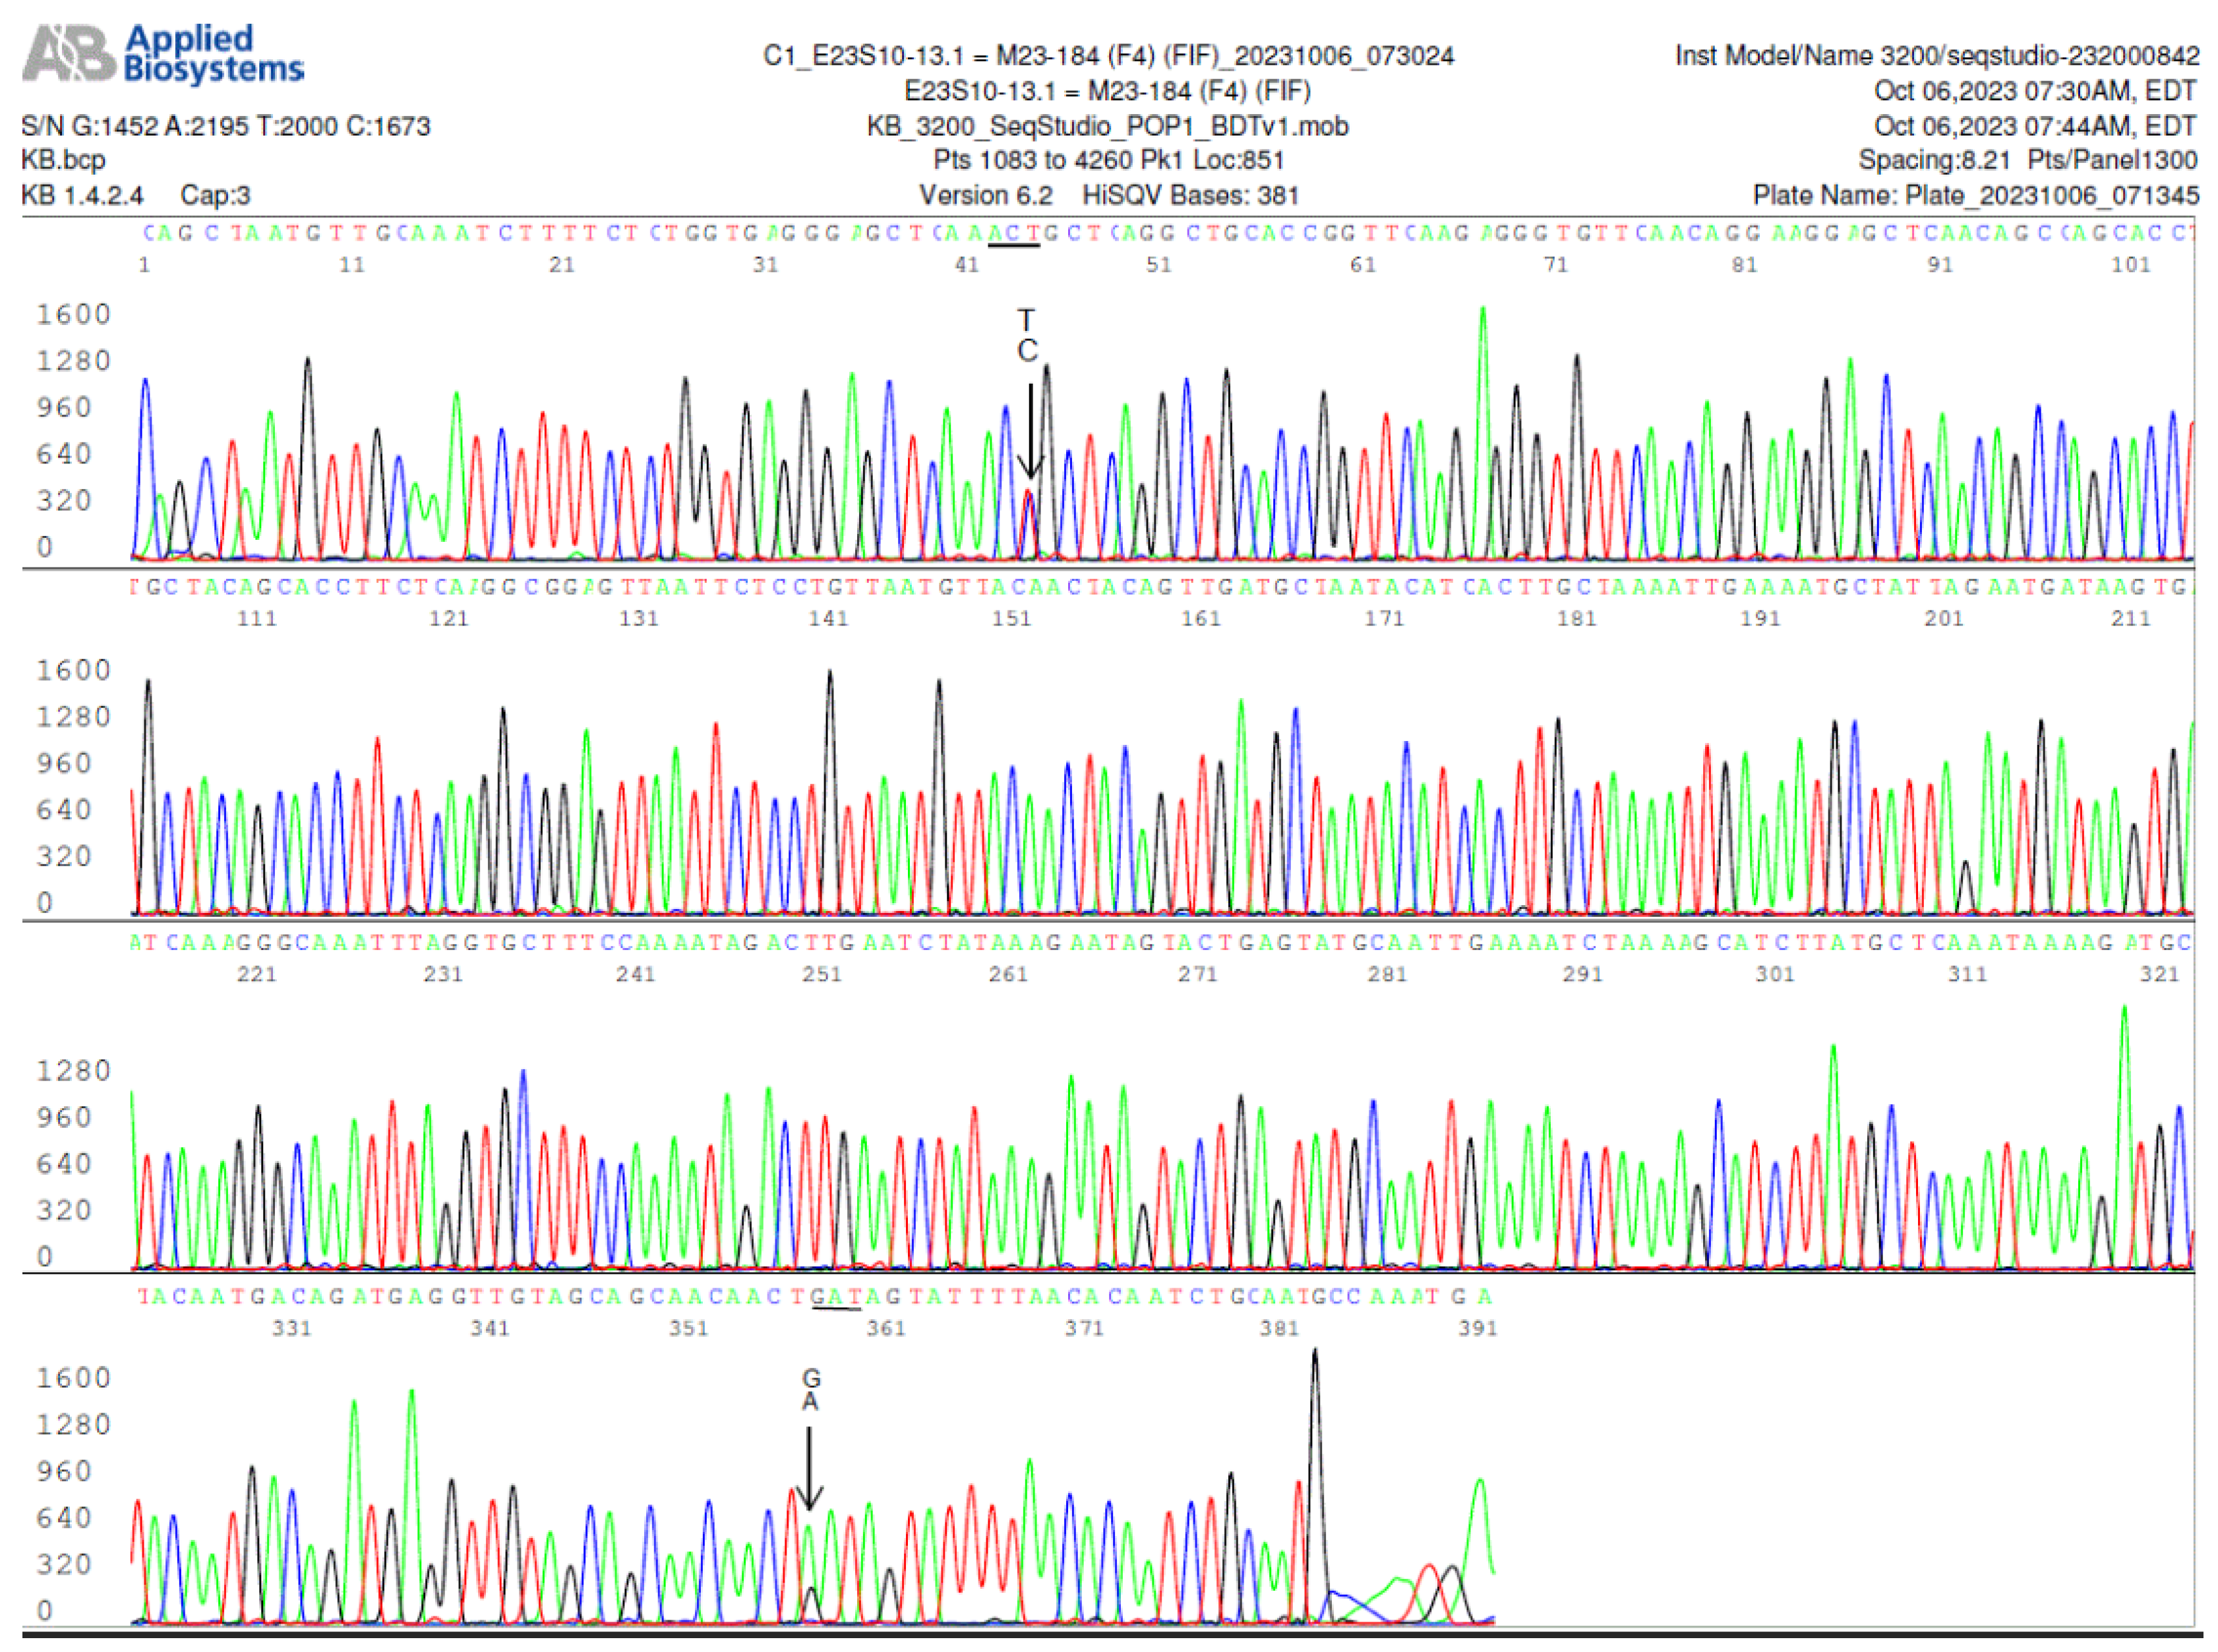
Figure 8.
Electropherogram of reverse primer sequencing of the same nested PCR product used to generate the electropherograms shown in Figure 7 and Figure 7a. A small “C” peak in position 5 under the “T” peak pointed by a TC arrow confirms the A/G SNP observed in Figure 7.
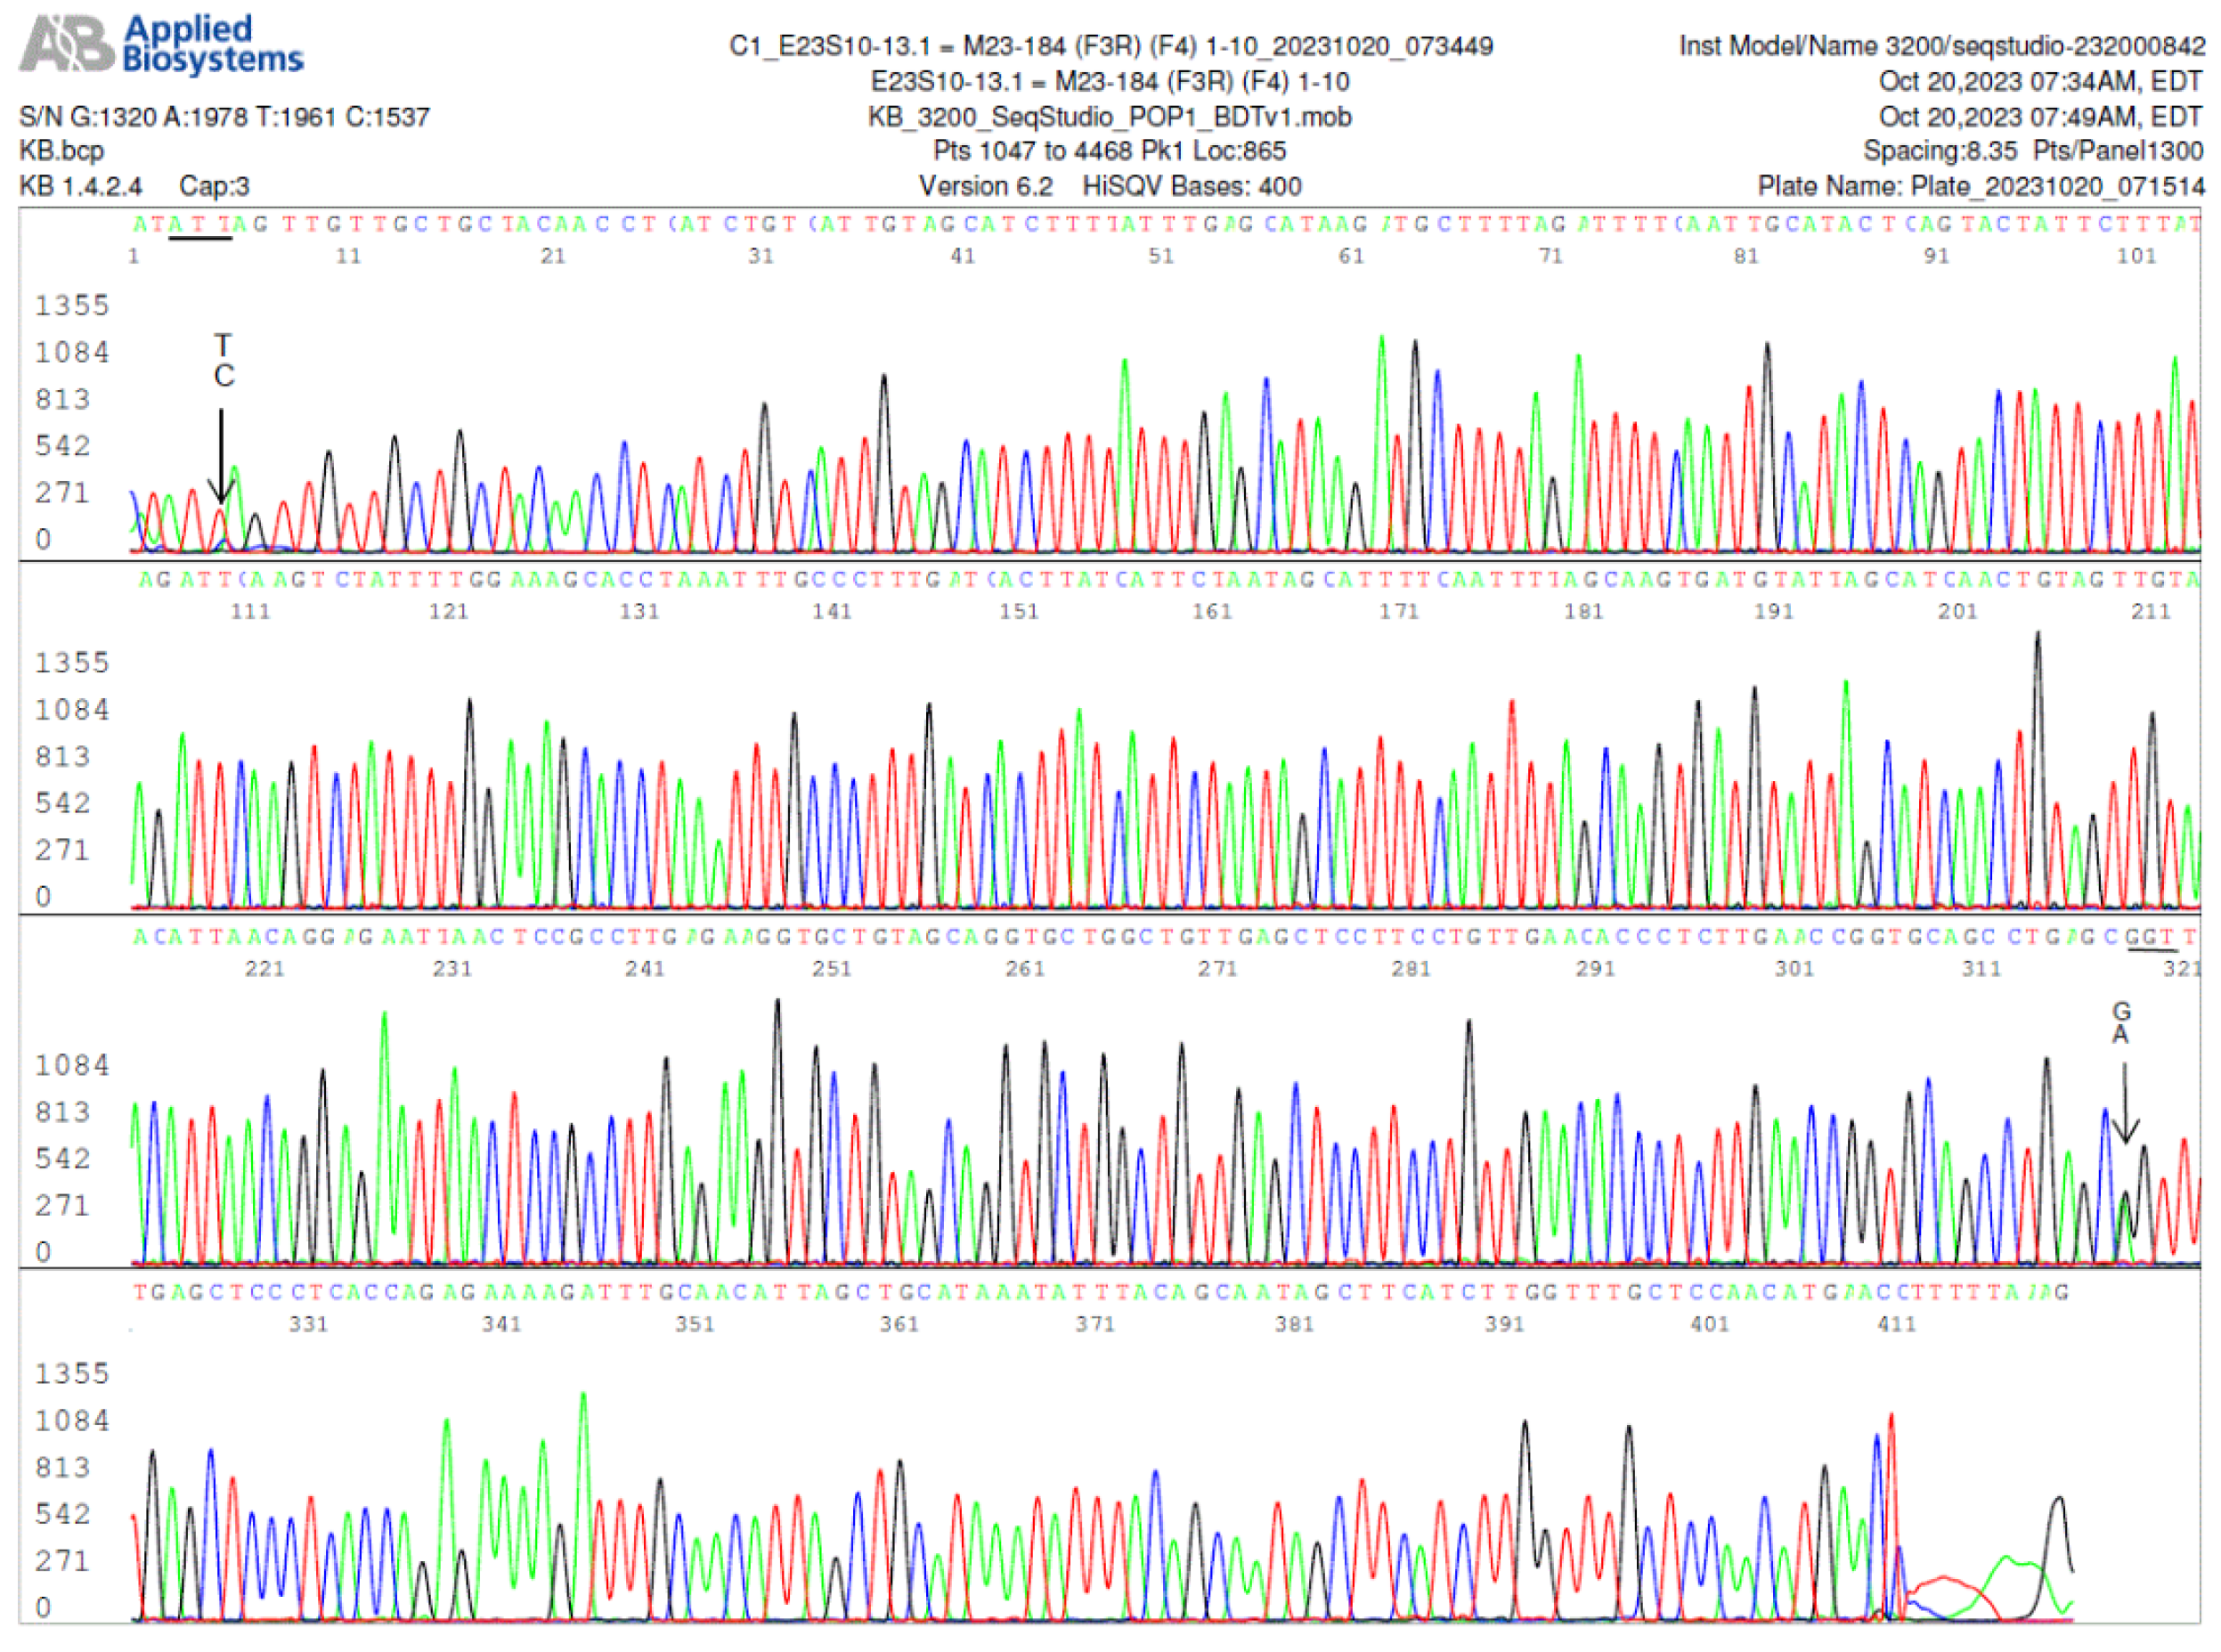
Figure 9.
A modified BLAST report from the GenBank including a 503-base Query sequence defined by the FlaB outer forward (FOF) PCR primer (marked by an underlined arrow) and the FlaB outer reverse (FOR) PCR primer (underlined) showing the positions of the 8 newly discovered single-nucleotide mutations or SNPs (red letters in the 7 underlined codons) in the 447-base segment of the B. burgdorferi FlaB gene flanked by the FlaB inner forward (FIF) nested PCR primer (highlighted gray with arrow) and the FlaB inner reverse (FIR) nested PCR primer (highlighted gray). A single-nucleotide change in the 3 codons highlighted yellow resulted in missense mutations. The single-nucleotide changes in the 4 unhighlighted codons are silent mutations. The first yellow-highlighted codon encoding the 199th amino acid of the FlaB protein had two SNPs one of which also resulted in a silent mutation (see Figure 6 Panel H).
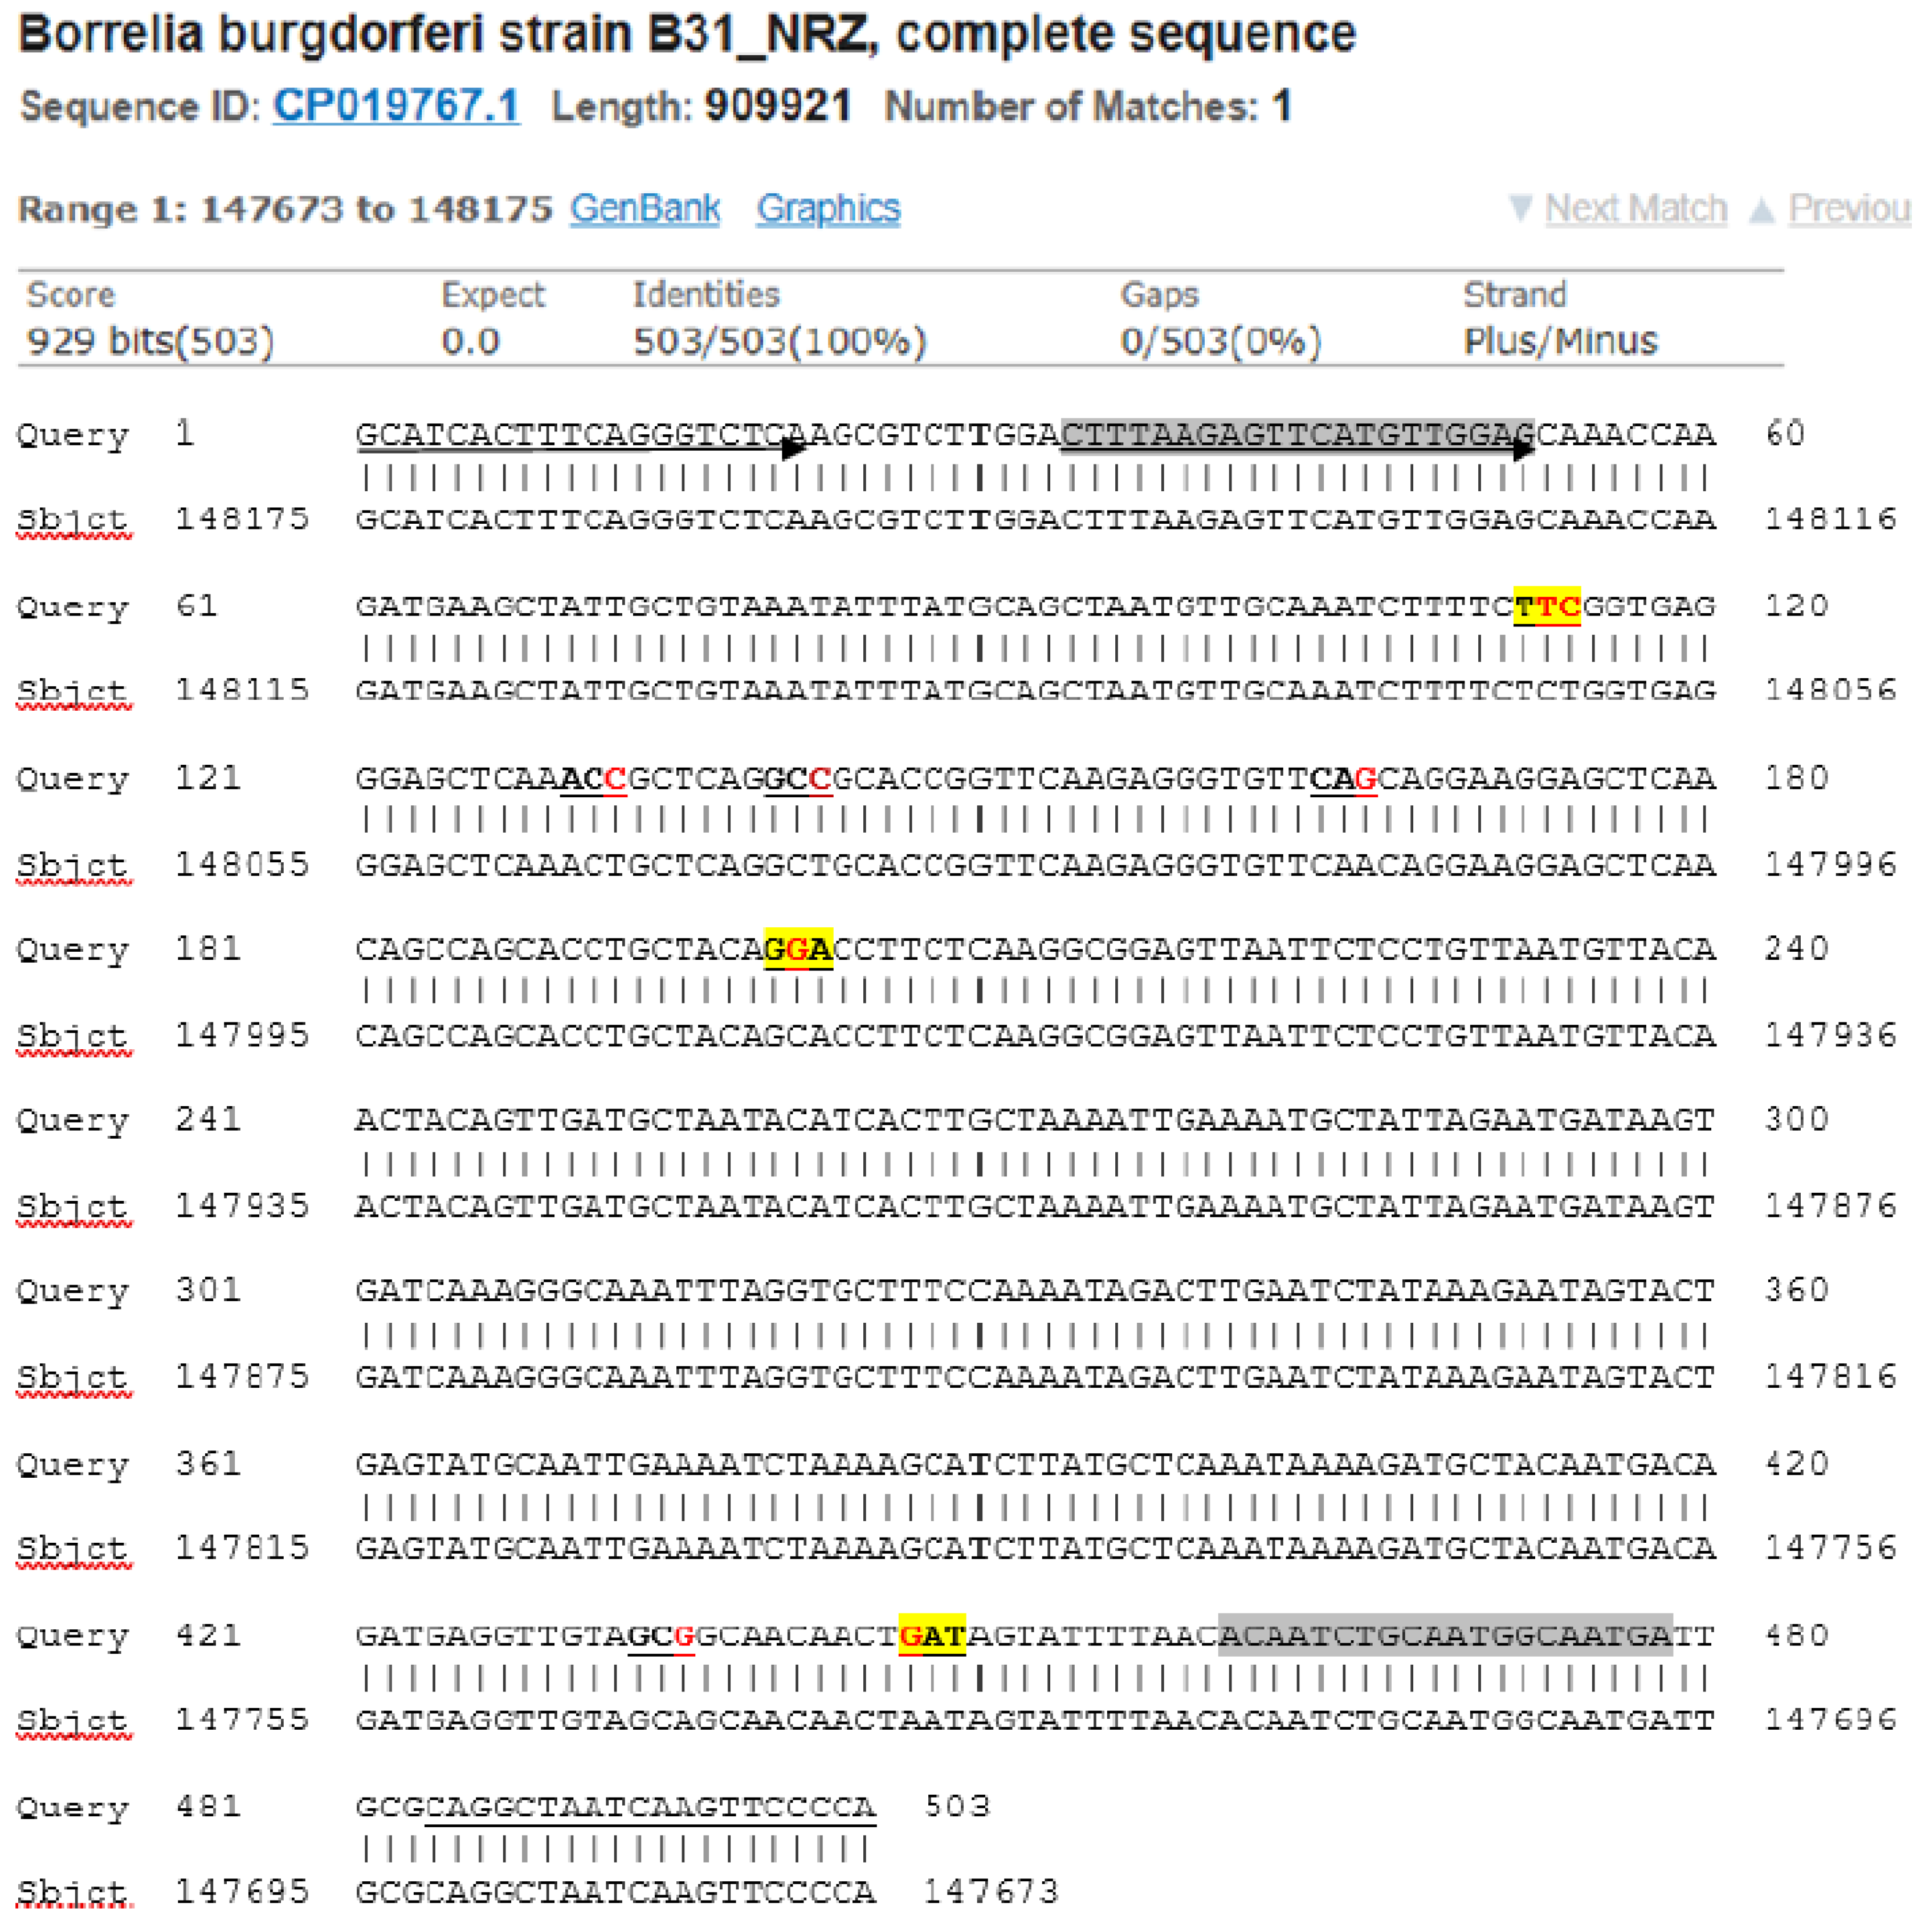
Figure 10.
This is an electropherogram of the forward primer sequencing of the FOF/FOR primer PCR amplification product derived from the DNA extract of the ATCC 53210 cultured B. burgdorferi cells. The 503-bp primary PCR product was reamplified in a same-nested PCR by a pair of FOF/FOR PCR primers and the same-nested PCR product was sequenced with the forward FOF primer without purification.

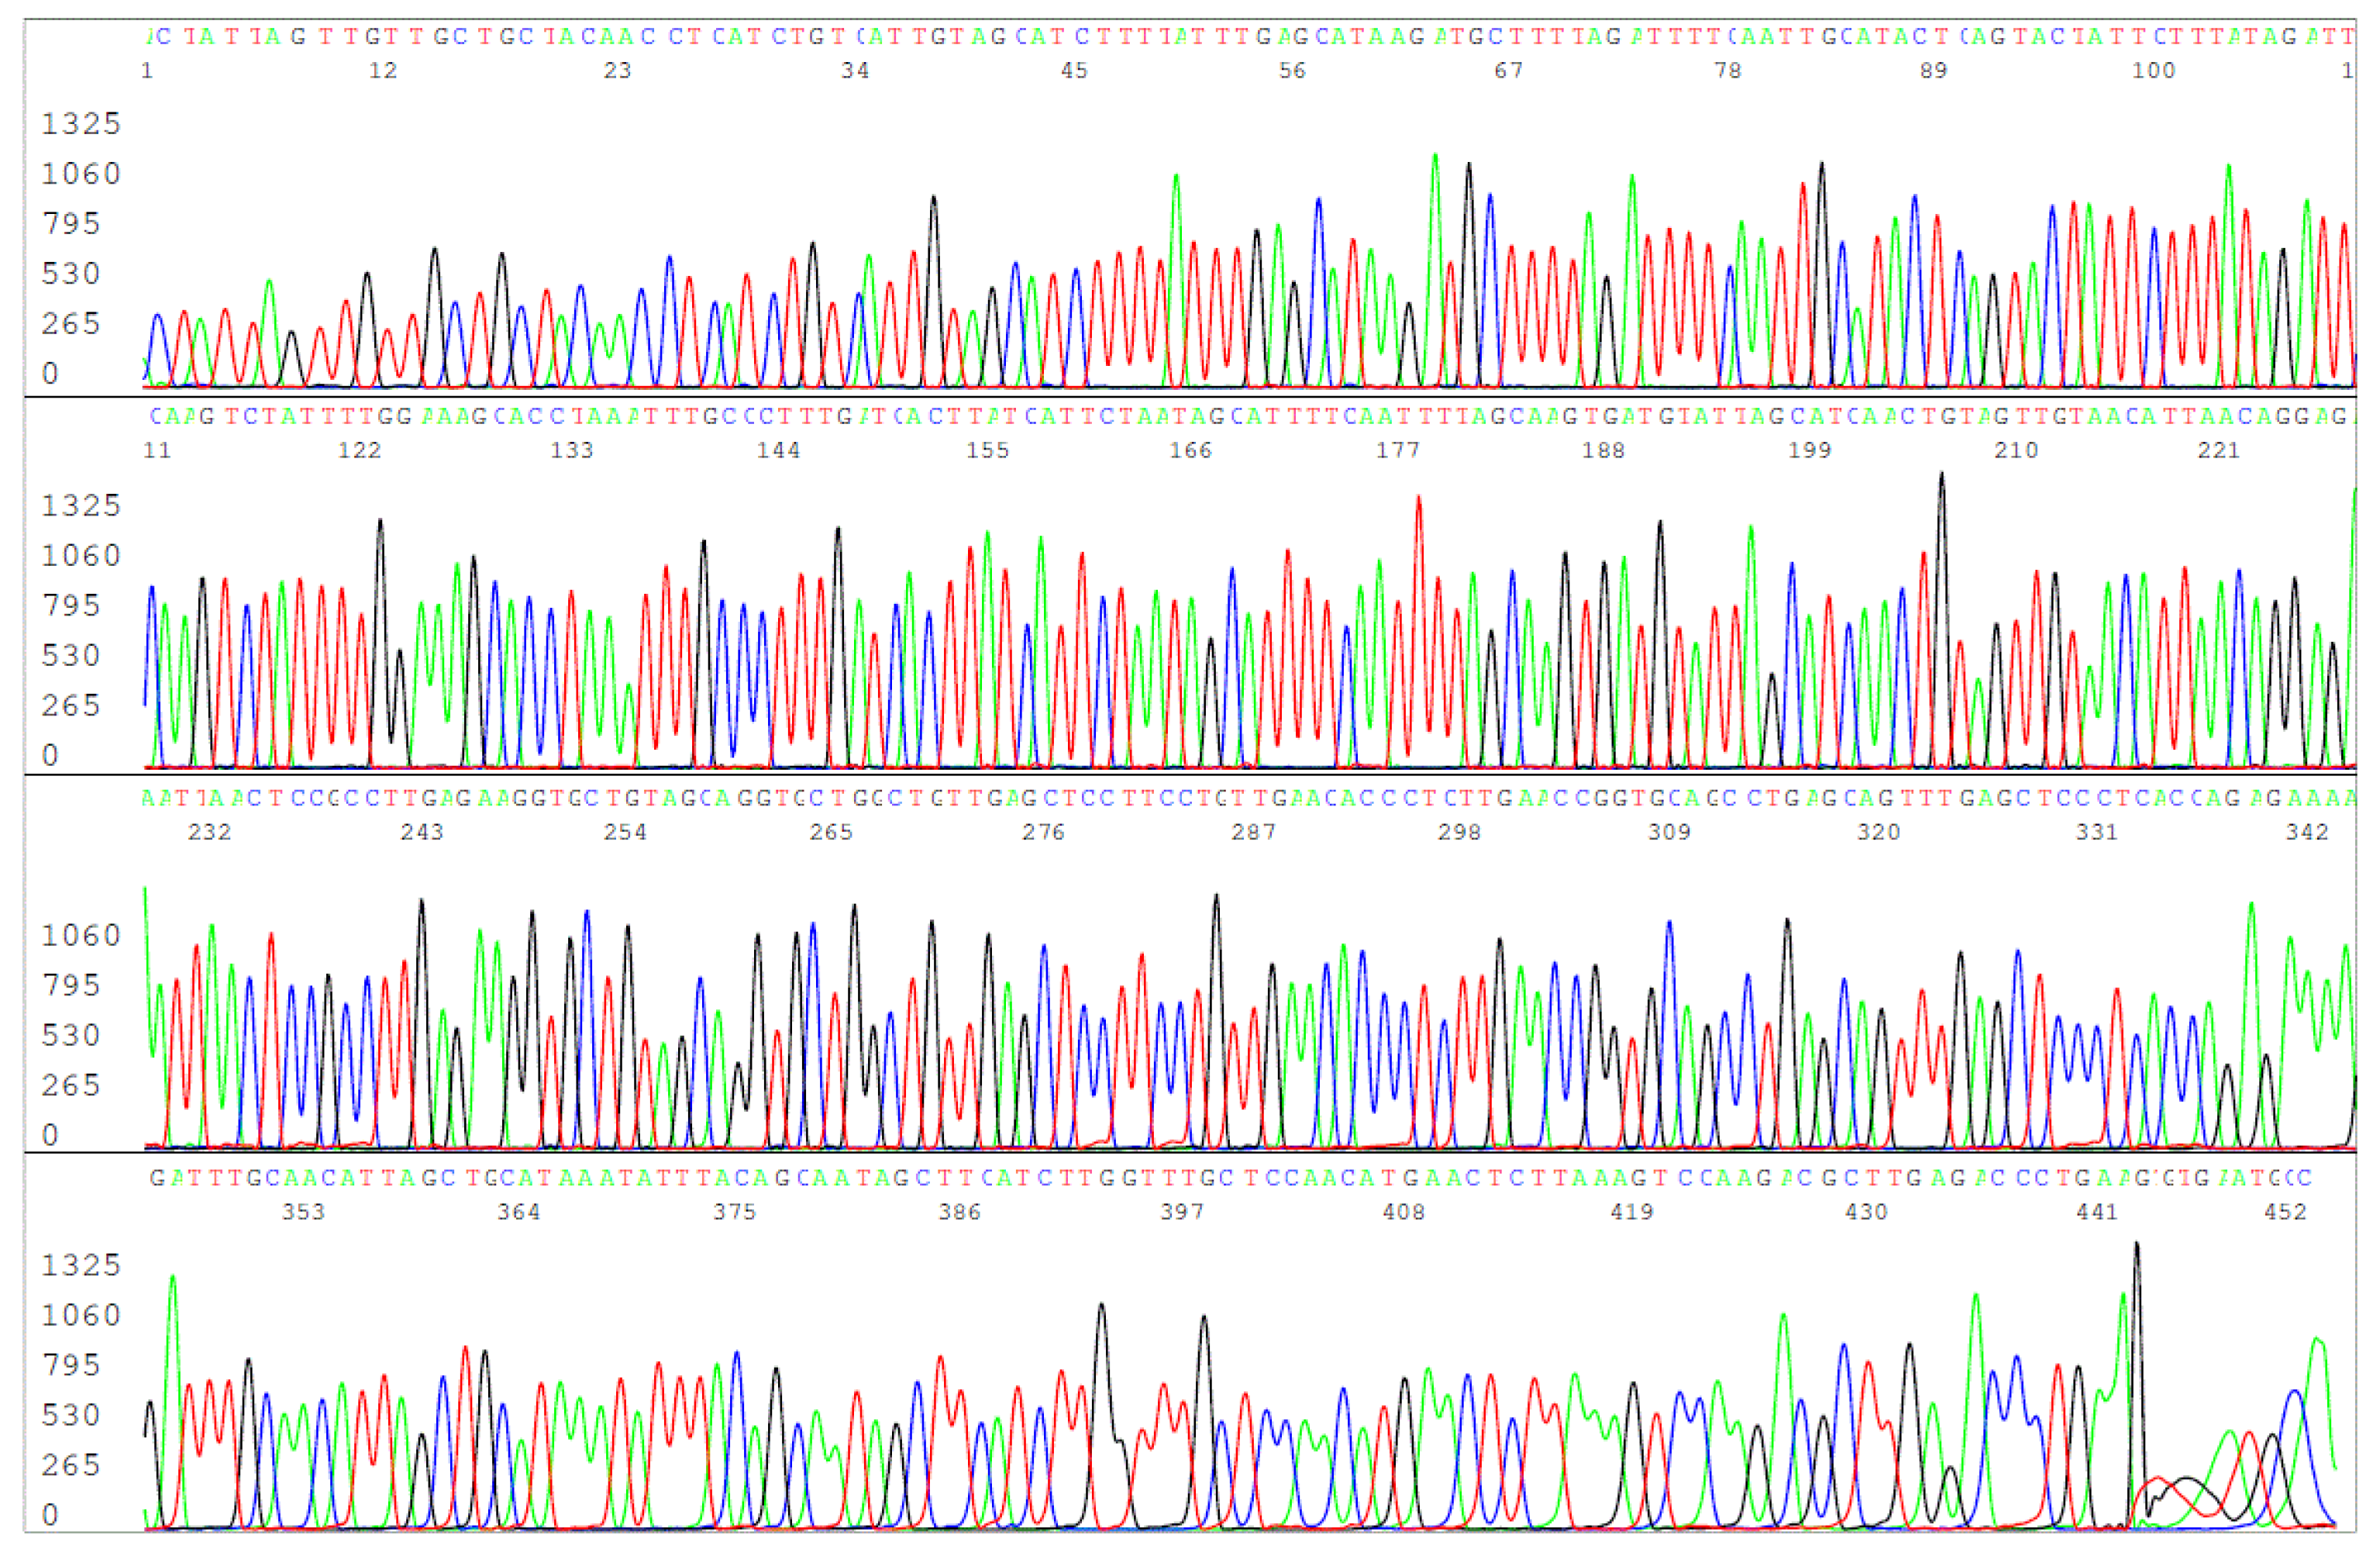
Figure 11.
Reverse complement sequencing of the 503-bp FOF/FOR primer same-nested PCR product used to generate the sequence illustrated in Figure 10, using the reverse FOR PCR primer as the sequencing primer.
Figure 11.
Reverse complement sequencing of the 503-bp FOF/FOR primer same-nested PCR product used to generate the sequence illustrated in Figure 10, using the reverse FOR PCR primer as the sequencing primer.
Disclaimer/Publisher’s Note: The statements, opinions and data contained in all publications are solely those of the individual author(s) and contributor(s) and not of MDPI and/or the editor(s). MDPI and/or the editor(s) disclaim responsibility for any injury to people or property resulting from any ideas, methods, instructions or products referred to in the content. |
© 2024 by the author. Licensee MDPI, Basel, Switzerland. This article is an open access article distributed under the terms and conditions of the Creative Commons Attribution (CC BY) license (https://creativecommons.org/licenses/by/4.0/).
Copyright: This open access article is published under a Creative Commons CC BY 4.0 license, which permit the free download, distribution, and reuse, provided that the author and preprint are cited in any reuse.


