Submitted:
15 September 2024
Posted:
16 September 2024
You are already at the latest version
Abstract
This paper presents the results of investigations on the kinetic of Brilliant Blue FCF (BB) discoloration reactions in aqueous solutions with different ozone concentrations and pH conditions. Kinetic studies involve knowledge of the structure and properties of the dye and ozone, as well as the experimental conditions. In general, scientists admit that the predominant oxidation pathway is direct (by free oxygen atoms) or indirect (by free hydroxyl radicals), it will depend on influencing factors such as: the physicochemical properties of the dye, the pH of the aqueous solution, ozone concentration, reaction time and the contact mode with/without stirring. In the experimental research, two pathways were chosen following CBB = f(t): 1. constant dye concentration and different ozone concentration on the concentration range (100 - 250 mg/L) at three pH media (acidic, neutral and basic) with and without stirring; 2. Constant concentration of ozone and different dye in the range of concentrations (2.5 - 10 mg/L) under the conditions of point 1. With obtained experimental data the curves CBB = f(t) were drawn and were processed by the integral method of classical kinetic based on first and second order equations. Unfortunately, this simple procedure this not yield any minim full results and any pH level. The rate constants been negative and/or the reaction order been dependent on initial conditions. Due to its structure, the BB dye has several chromophore groups, thus multiple attack centers, resulting in more oxidation by-products, which is why the 1H - NMR spectrum of BB discoloration with ozone was recorded.
Keywords:
Brilliant Blue
; discoloration
; ozonation
; kinetic modelling
1. Introduction
Brilliant Blue FCF (abbreviated BB, also known as E133, Blue #1, Acid Blue 9, Alphazurine FG, E133, Erioglaucine disodium salt, FD&C; BLUE No. 1) is a common food dye for diary, ice-cream, candies, drinks, etc. and is often used also in the cosmetic and textile sector [1]. Brilliant Blue FCF (BB) is a triphenylmethane dye being composed of three hydrocarbon rings linked to a central carbon atom [2].
The BB molecule (Figure 1) has both polar and non-polar components, which can lead to complex behavior. The negative charge originates from its sulfonic groups [1,3]. The dye molecule contains chromophore groups (benzene rings) and auxochrome groups (organic functionalities) [4]. It is soluble in water (30 mg/mL), and ethanol (3 mg/mL) [5]. It has been estimated that 10 - 15% of all the industrial dyes produced are lost through their release into the effluent. Discharge of BB into water resources even in low amounts can affect aquatic life and the entire food chain either by direct chemical/biological effect or by reducing the light transmission [6]. In the relevant literature [7,8,9,10,11] there are various physical/(bio)chemical procedures for removing / discoloring BB from wastewater, to establish the best balance between the scientific result and the economical implication. The BB dye was selected for the study because it was found hardly degradable by the conventional process that is causing serious disposal problems [12].
The application of ozone in the discoloration of aqueous systems requires knowledge of physical and chemical properties of ozone to explain its mechanism of reaction, process efficiency, discoloration yield, consumption of reagents during the process. A significant role in knowing the discoloration mechanism is also played by studying the dynamics of the process.
The selection of ozone as a bleaching agent is based on the oxidizing capacity (ε0 = 2.08 V) to organic substances.
The ozone decomposition in aqueous solution generates free oxygen atoms (O∙) and free hydroxyl radicals (OH∙). The generation of free (OH∙) radicals which is a stronger oxidant (ε0 = 2.56V), will be promoted by hydroxide ions in an alkaline pH range, but also by some of oxidation by-products (e.g., formic acid) [13]. Ozone reacts with participation of one oxygen atom and two others are separate as O2, which is why it becomes a selective oxidant, acting on organic compounds containing species with high electron density (double bonds C = C, N = N, aromatic rings activated, some functional groups). Hydroxyl radicals react rapidly and non-selective with many dissolved compounds [14]. Ozonation will act by oxidation on the chromophore group of the dye, changing the intensity of the VIS absorption spectra at λmax [15], thus causing the formation of simple, intermediate, colorless, and easily biodegradable structures in the post-oxidation stage [16].
Ideally, an ozonation process under optimal condition of ozone concentration, pH condition, pressure and temperature can lead to the oxidation of organic / inorganic compounds to the highest oxidation states, producing complete mineralization to CO2 and H2O, depending on the molecular selectivity and destruction rates [4,17].
Ozonation will provide a partial oxidation leading to oxidation by-products (aldehydes, ketones, organic acids, etc.) some of them by-products being allergenic, toxic or even carcinogenic, such as e.g., aromatic amines [2,17,18]. In this context, another original part of the study consists in the identification by 1H-NMR of four degradation by-products of BB ozonation.
The kinetic study of ozonation helps to better understanding the oxidation mechanism and process dynamics.[19]
The aim of this study was to provide a complete analysis on rate of BB discoloration process by oxidation with different concentrations of high excess ozone, at three pH values (pH = 7.00 initial of BB aqueous solution, pH = 4.00 for acid solution and pH = 10.00 for alkaline solution) with/without stirring during their contact. The experimental data of BB concentration variation over time by its interaction with ozone or the evaluation of the dynamics process and check it’s by the integral method, the classic kinetic equations of first and second order were used. A pertinent interpretation of the obtained results could not be achieved. It was difficult to check the classical models under conditions of excess ozone because of the stoichiometry of the reactions during ozonation are not know. On the other hand, the high reactivity of ozone, in the alkaline and acid media, made it difficult to monitoring the dynamics of the process. Moreover, when the substrate is a large molecule, it can break it multiple times, so the global process can be describe as a system of consecutive chemical reactions. Taking into account these considerations and the multiple possibilities of ozone attack on BB, a kinetic modeling of the discoloration reaction at pH = 7.00 and CO3 = 100 mg/L under stirring conditions is the version proposed in this paper. To the best of authors knowledge, this is the first attempt to build an analytical model for the ozonation process based on diffusion and a successive chained reaction system.
2. Materials and Methods
The Brilliant Blue (analytical grade, Sigma Aldrich, Cas Number 3844-45-9) - Initial dye concentration (the dye stock) was set at 500 mg/L by dissolving into distilled water. Working concentration of the dye was 5 mg/L.
The ozone was obtained by OZONOSAN ALPHA-PLUS Generator utilizing 99.5% oxygen gas feed (oxygen of medical use). The ozone generator is equipped with UV-Photometer for continuous measurement of ozone concentration (100, 150, 200, 250 mg O3/L gaseous mixture, high flow 1-10 L/min. Under a constant oxygen flow rate (measured by the generator mass flow controller), the pre-determined ozone dose was constant during each ozonation. To estimate the ozonation kinetics, different values of ozone - BB contact time were pre-determined (between 0 - 10 min) and the residual dye concentration was immediately determined.
The batch experiments were conducted using HEILDORPH VIBRAMAX 100 orbital shaker. The pH of the solutions was adjusted by adding H2SO4 0.1M for acidification respectively NaOH 0.1 M, for alkalizing the BB aqueous solutions. The pH values were measured with ORION 290A pH-meter.
The BB residual concentrations of aqueous samples were analyzed by CINTRA 404 UV/VIS Spectrometer. The maximum absorption wavelength of 630 nm was chosen to be used in the quantitative assessment of discoloration.
The experiment was conducted at room temperature:
- using the same concentration of BB solution (5mg/L);
- adding different doses of ozone (100 - 250 mg O3/ L gaseous mixture) at the BB solution;
- in different contact time (0 - 10 min at pH = 7, 0 - 1.5 min at pH = 4 and 0 - 1 min at pH = 10);
- with continuously stirring (200 rpm) / without stirring;
1H-NMR spectra were recorded on a Bruker Advance III Ultrashield Plus 500 MHz spectrometer, operating at 11.74 T, corresponding to the resonance frequency of 500.13 MHz for the 1H nucleus, equipped with a direct detection four nuclei probe head and field gradients on z axis. Samples were analyzed in 5 mm NMR tubes (Norell 507). Typical parameters for 1H NMR spectra were: 45º pulse, 8.3 s acquisition times, 8.01 kHz spectral window, 512 scans, 20 K data points, delay time 1 s. The average acquisition time of the 1H NMR spectra was approximately 1h 20 minutes.
Ozonation of dye samples - Each time a working volume (0.1 L) of BB aqueous solution was added into the glass recipient. Ozone - oxygen mixture gas was supplied at various doses ranging 100 - 250 mg O3/ L gaseous mixture followed by aeration for 5 min to remove residual ozone. The ozone/oxygen gaseous mixture was introduced in the reaction glass recipient through a glass micro tube from the bottom. Ozone mass transfer was achieved through micro bubble generation. A mechanical stirrer was used to achieve sufficient recirculation of the dye solution, so a favorable gas transfer rate was expected
3. Results and Discussions
3.1. Preliminary Results and Discussion
The reaction kinetics of BB aqueous solution discoloration by ozone was studied by estimating the variation of dye concentration during the mutual interaction. In order to determine the probable reaction order the experiment was done with four ozone concentrations (100, 150, 200 and 250 mg/L), three different selected pH values (pH = 4.0, pH = 7.0 and pH = 10.0), with / without stirring*. In the Figure 2, Figure 3 and Figure 4 the variation in time of BB concentration during the ozonation with and without stirring, at all three pH values are presented.
In all the cases (with or without stirring) the reaction rate is higher at higher ozone concentrations.
In this kinetic study - based on the variation in time of the BB concentration –the applicability of the reaction order using integral method for either classical kinetic models of first and second order were verified. The experimental data are presented in the Table 1.
From the variation of CtBB= f(t) were observed:
- -
- the version with stirring is more efficient than the one without stirring;
- -
- at pH = 4.0 the complete discoloration occurs after 1.25 min (for O3 concentration of 100 and 150 mg/L) and after 0.50 min respectively (for O3 concentration of 200 and 250 mg/L);
- -
- at pH = 7.0 the complete discoloration occurs after 10 min (for O3 concentration of 100 and 150 mg/L) and after 1 min respectively (for O3 concentration of 200 and 250 mg/L);
- -
- at pH = 10.0 the final concentration of BB is much lower in a shorter time (0.2 min) compared to previous studied pH values due to OH radical oxidation efficiency is increased.
In acidic and basic media, respectively, the reactions are fast and the application of the integral method for classical kinetic models of first and second - order cannot be interpreted (Table 1, negative rate constants).
These conclusions indicate that in the ozonation process factors such as: pH, ozone concentration, stirring are important with an effect on the reaction mechanism. In addition, considering that BB discoloration occurs with multiple possibilities of ozone attack (mainly chromophore groups), it is important to take this aspect into account as well, for this purpose, the 1H-NMR mass spectrum (Figure 5) of a sample of BB with ozone was recorded.
An oxidation variant is also presented in accordance with the results obtained in the mass spectrum.
3.2. 1H-NMR Spectroscopy
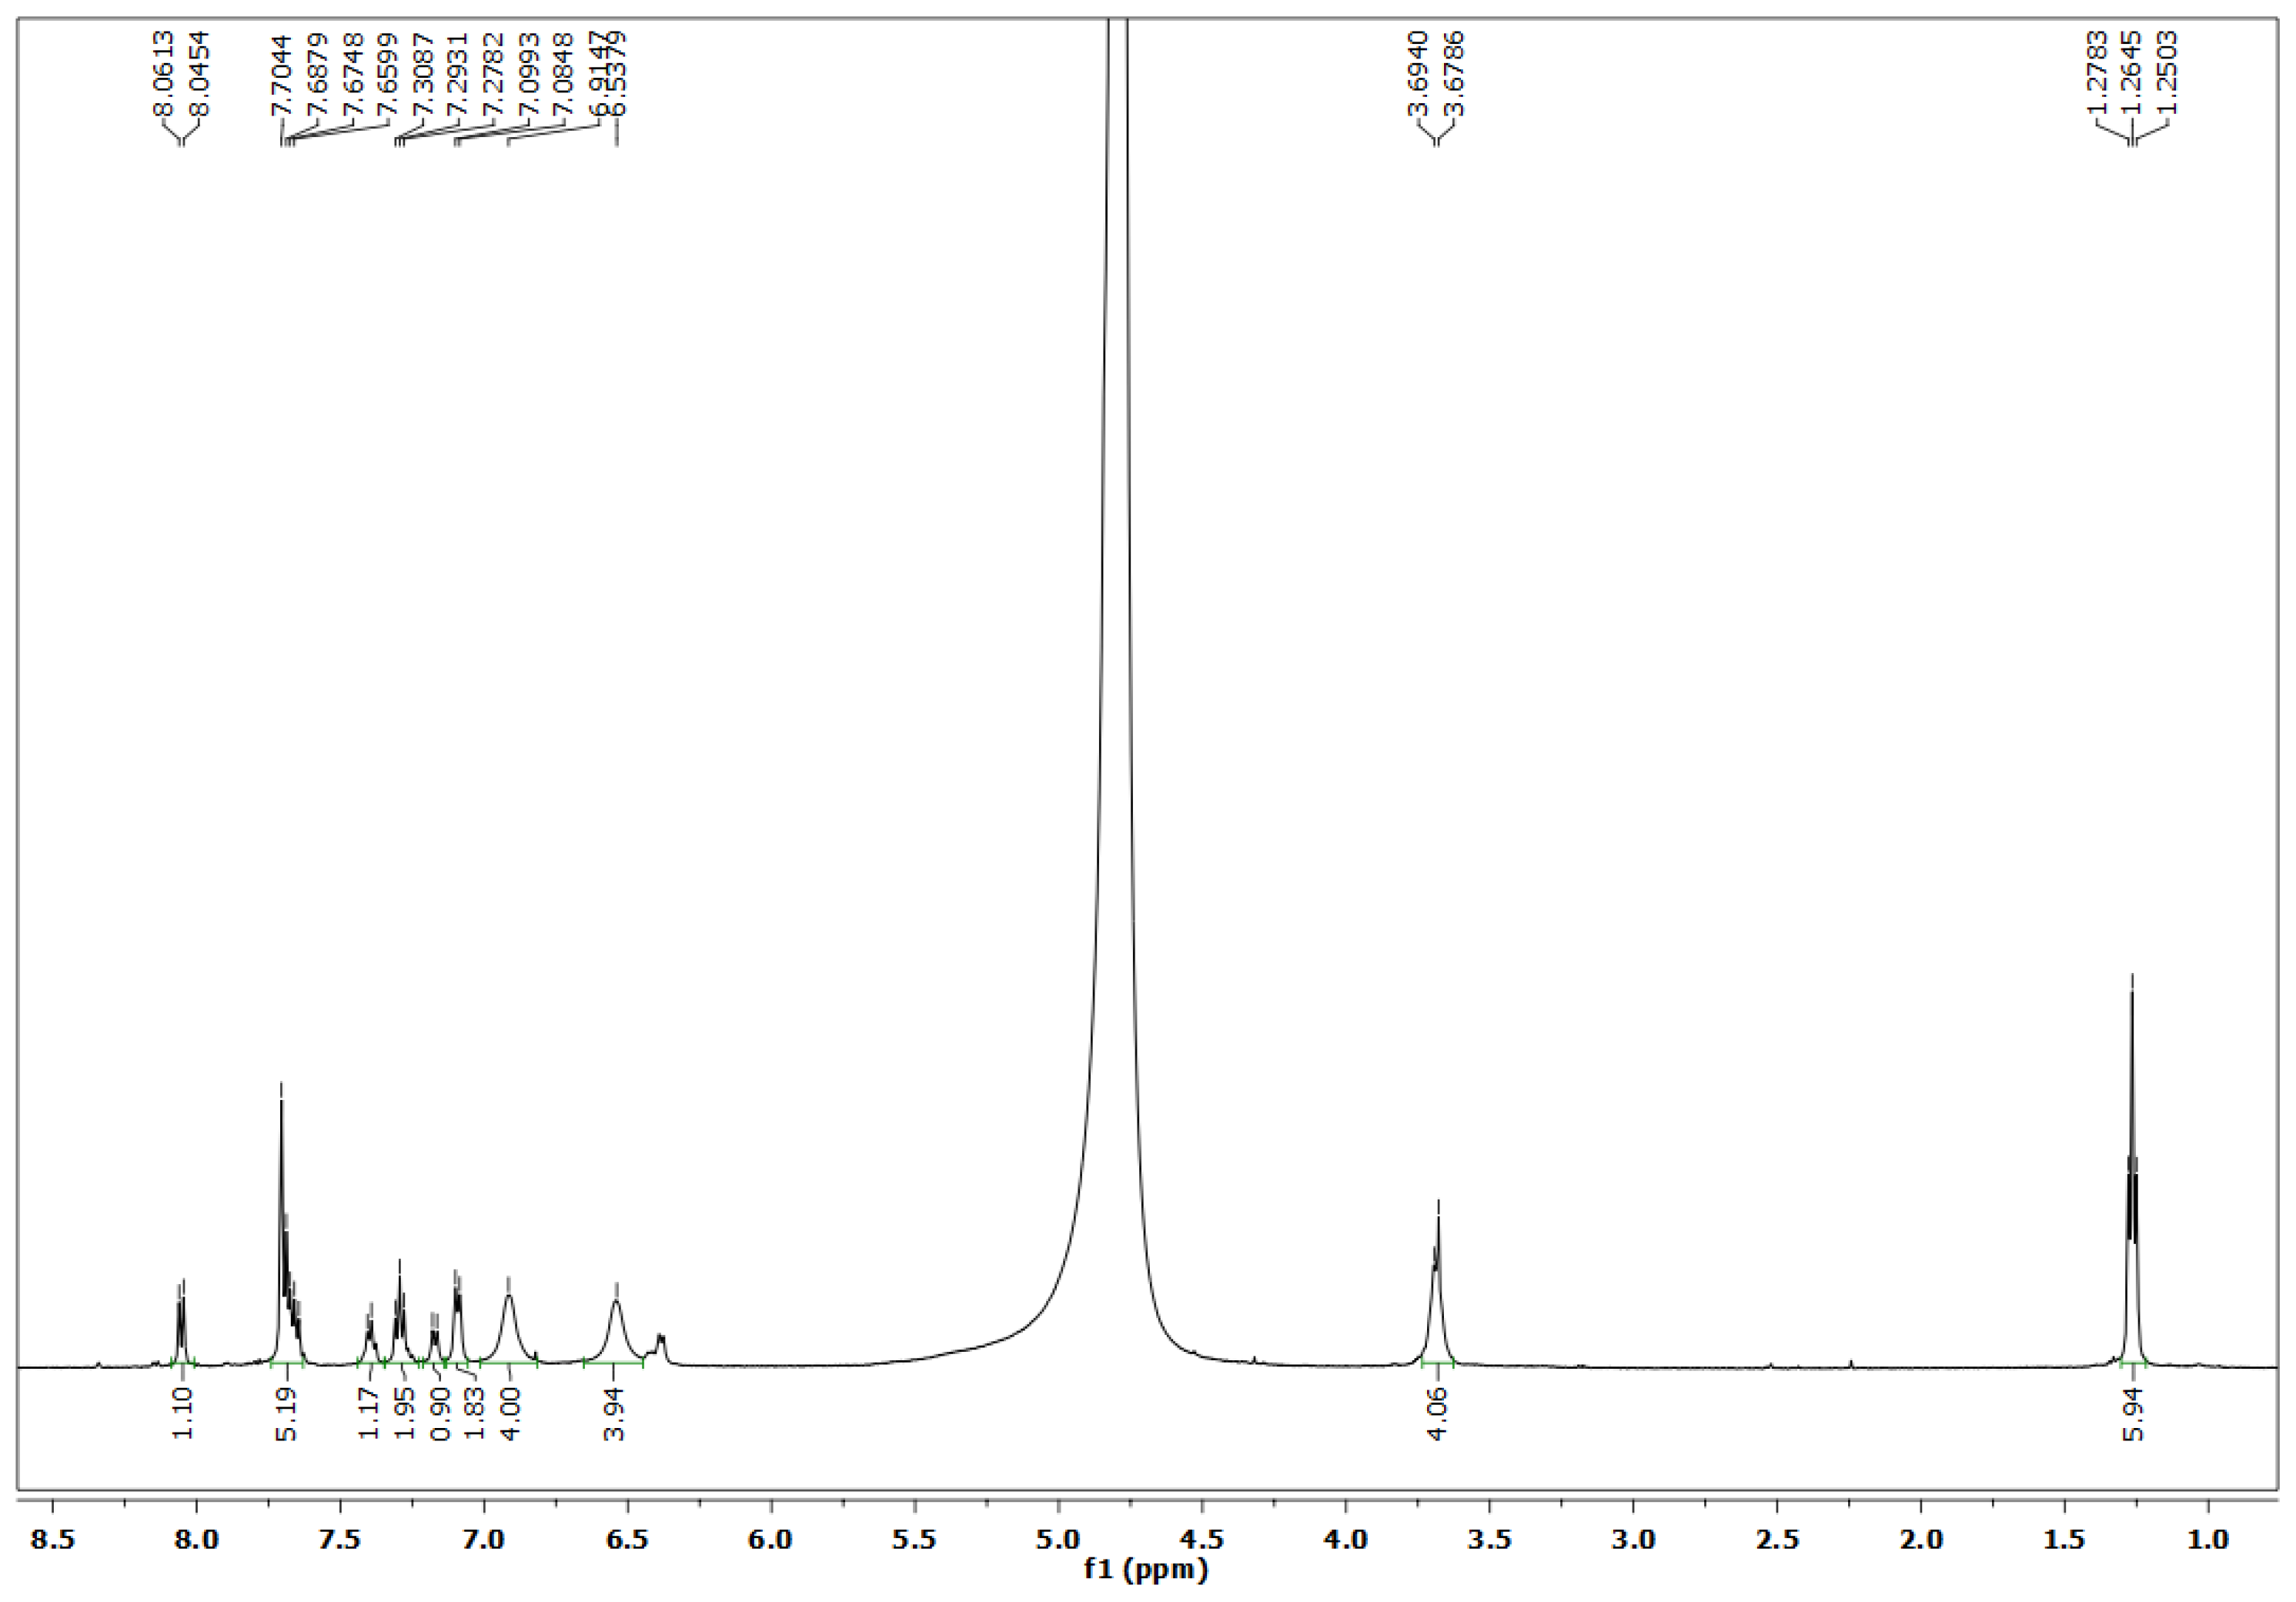
1H-NMR (500.13 MHz, D2O, δ pmm, J Hz): 8.06 (d, 1H, H-3, 7.95 Hz), 7.70-7.64 (m, 5H, H-4, H-14 and H-16), 7.39 (t, 1H, H-5, 7.45 Hz), 7.29 (t, 2H, H-17, 7.97 Hz), 7.17 (d, 1H, H-6, 7.85 Hz), 7.09 (d, 2H, H-18, 7.15 Hz), 7.00-6.80 (m, 4H, H-8 and H-12), 6.64-6.44 (m, 4H, H-9 and H-11), 4.87-4.75 (m, 4H, CH2 benzylic – overlapped with water signal), 3.78-3.61 (m, 4H, CH2 from ethyl), 1.27-1.25 (m, 6H, CH3 from ethyl).
During the ozonation the aqueous dye solution of Brilliant Blue changes color from blue to light brow.
Ozone can oxidize the BB via tow pathways:
1). Direct oxidation with free oxygen radicals from ozone decay. The ozone-treated compounds form ozonide, which, in the presence of water dissolves into aldehydes and ketones.

2). The generation of free radical intermediates such the OH· radical, which is a powerful, effective and non-selective oxidizing agent.
O3 + H2O → 2HO2·
O3 + HO2·→ HO· + 2O2
In case of ozonation of BB dye only the radical mechanism will be considered.
A proposed degradation pathways of the BB in aqueous solution using ozone is illustrated in Scheme 1 [2]
It should be mentioned that, based on initial conditions the last reaction step may not can be kinetically observable.
Corroborating the data obtained using NMR spectroscopy with the literature data [2] the existence of four degradation by-products in the ozonized mixture is confirmed:
1H-NMR (500.13 MHz, D2O, δ pmm, J Hz): 8.14 (m, 1H, H-2), 7.90-7.89 (m, 2H, H-4 and H-6, overlapped with other aromatic signals from compounds resulting from Brilliant Blue degradation), 7.78 (t, 1H, H-5, 7.85 Hz), 4.32 (s, 1H, H-7), 3.05 (q, 2H, CH2 from ethyl, 7.40 Hz), 1.28 (t, 3H, CH3 from ethyl, 7.40 Hz).
1H-NMR (500.13 MHz, D2O, δ pmm, J Hz): 7.90-7.89 (m, 1H, H-6, overlapped with other aromatic signals from compounds resulting from Brilliant Blue degradation), 7.63-7.62 (m, 3H, H-3, H-4 and H-5), 7.30-7.26 (m, 4H, H-9 and H-13), 7.08-7.06 (m, 4H, H-10 and H-12), 5.35 (s, 1H, H-7).
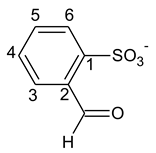
1H-NMR (500.13 MHz, D2O, δ pmm, J Hz): 10.03 (s, 1H, CHO), 8.00 (m, 1H, H-4), 7.95 (m, 1H, H-5), 7.90-7.89 (m, 1H, H-3 and H-6, overlapped with other aromatic signals from compounds resulting from Brilliant Blue degradation).
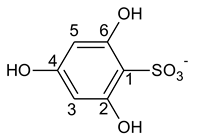
1H-NMR (500.13 MHz, D2O, δ pmm, J Hz): 6.39 (s, 2H, H-3 and H-5).
Several studies described the oxidation by-products being more toxic than the initial dye solution [2,4,5,20].
Thus, the idea of kinetic modelling is motivated by the structure complexity of the dye and its multiple splitting possibilities depending on the attack conditions, as there are too many unknowns and the stoichiometry of the reactions is not known either.
3.3. Kinetic Modelling
3.3.1. Specifying the Kinetic Model
In order to build a complex model for the ozonation of BB, it was necessary to accept simplifying assumptions:
- There are a finite number of reaction sites on the BB molecule;
- The reactivities of these sites are sufficiently different sot that they are attacked in succession (that is, no two sites can be attacked at the same time). This means that the ozone molecule reacts with the initial chromophore at its most reactive site, then with the first ozonation by-product at its most reactive site, etc.;
- The first attack destroys the chromophore, so the rate of discoloration is proportional to the rate of BB decay;
- Each ozonation step follows an apparent second-order kinetics (first order with respect to both ozone and substrate).
Under these simplifying assumptions, the global ozonation process can be described by the following reaction chain (1):
where are, respectively, the initial chromophore and its successive decomposition by-products. Moreover, as discussed later, it is possible that the actual reaction pathway changes with reaction conditions (e.g., initial ozone or BB concentrations, pH value, temperature, etc.).
As each reaction is assumed to follow a second-order kinetic (first order with respect of each reactant), chain (1) can be described by the following system of differential Equations (2):
A solution of this system can be obtained as a family of trajectories, the most useful of which expresses the concentration of each intermediate as a function of the concentration of the original chromophore . This family of trajectories is the solution of the reduced system (3), which is readily solved by a succession of integration and substitution steps, as each equation is linear and inhomogeneous with variable coefficients.
The general solution of system (3) with initial condition can be show by complete induction over n, to be of the form:
Based on reaction chain (1) and mathematical model (2), the rate of ozone consumption can be expressed as:
as the intrinsic decomposition of ozone in aqueous solutions (in the absence of organic compounds) has been found to be negligibly slow at acidic or neutral pH values [21]. This can be further manipulated to yield:
where is the number of secondary ozonation steps (that is, after the destruction of the original chromophore).
Upon substitution of (4), this finally becomes:
3.3.2. Mass Transfer Modelling
Mass transfer modelling is based on the double layer theory. According to this theory, the mass transfer pathway is broken into four regions: bulk gas, gas diffusion layer, liquid diffusion layer and bulk liquid. A detailed description of the double layer theory is beyond the scope of this work, and can be found in any standard textbook on mass transfer and diffusion - reaction kinetics [22].
Each region has its own mass transfer regime:
- Bulk gas is considered to be homogeneous, so that the partial pressure of the gaseous reagent is a function on time alone. As notated air is continuously fed in the reactor, is taken to be constant;
- In the gas diffusion layer mass transfer is considered to be stationary. Consequently, the total flow of ozone across this region is given by the integrated form of Fick’s equation:where is the mass transfer coefficient of ozone in the gas phase, and and are the partial pressures of ozone in the bulk gas and at gas - liquid interface, respectively.
- The liquid diffusion layer is treated analogously, so the ozone flow across this layer is given by:where is the mass transfer coefficient of ozone in the liquid phase, and and are the partial pressures of ozone in the bulk liquid and at gas - liquid interface, respectively.
- Finally, bulk liquid is considered to be homogeneous, so , the bulk liquid ozone concentration is taken to be a function of time alone. Its value is controlled by both reaction rate an ozone intake from the gas phase, through the stationary condition.
Assuming gas - liquid equilibrium at the interface, the stationarity condition across the diffusion pathway yields the following expression for the ozone intake in the liquid phase:
where is the global mass transfer coefficient of ozone, is Henry’s law constant for ozone, while and retain their above - mentioned meanings.
The overall reaction - diffusion model is obtained by imposing an overall stationarity condition on the ozone flow across the whole gas - liquid system. This successively yields:
Solving this equation for and substituting in the rate law for initial chromophore decay yields:
It is easy to show (by direct integration) that the inverse solution (i.e., of this equation can be expressed as:
where , and are aggregate parameters, depending on partial ozone pressure in the gas phase, global mass transfer coefficient of ozone, Henry’s law constant for ozone in water and rate constants for all reactions in chain (1).
As a further simplifying assumption, the ratio
is assumed to be independent of i. This amounts to assuming that the difference between activation energies in successive steps of chain (1) is approximately constant. Under this hypothesis, the reaction - diffusion model finally becomes:
which, upon treating and as reactivity and chain - length meta - parameters respectively, is a multi - linear model with component functions
In order to validate model (6), the underlying experimental data should carry sufficient kinetic information. Upon inspecting the available data, it was decided to select the following sets for BB decay data measured at pH = 7, with stirring, different BB and ozone concentrations: 1. C0 = 2.5 mg/L, CO3 = 100 mg/L; 2. C0 = 5.0 mg/L, CO3 = 100 mg/L; 3. C0 = 7.5 mg/L, CO3 = 100 mg/L; 4. C0 = 10.0 mg/L, CO3 = 100 mg/L; 5 C0 = 5.0 mg/L, CO3 = 150 mg/L.
The remaining data sets were excluded either because they were too small (too few data points to support a meaningful regression) or because the kinetic information they carried was too scarce (the initial chromophore decayed almost entirely before the first data point was even measured). As all parameters of model (6) are aggregates of several unknown quantities, it is not possible to assign any meaning to them. The only consistency criterion than can be inferred from their structure is that β0 should be positive, as it is a product of physical quantities for which only positive values are meaningful. Apart from that, there is no a priori condition that can be imposed on either the sing or the value of any other parameter. This is why these values are not reported in this work. Parameter estimation was performed based on model (6) by ordinary linear regression and the results (in the form of a calculated kinetic curve) are plotted along the experimental data, in Figure 6 through 6.
Figure 1 depicts the experimental and calculated kinetic curves over the entire time range of the experiment. It can be seen that model (6) fits very well the underlying data set. It should be, however, noted that the data set itself provides no information about the first 15 s of the process, where, as it seems, about 85% of the initial chromophore decays. Therefore, the regression model is based only on data in the time range [15 s, 600 s] which covers the decay of less than 15% of the original chromophore. Figure 7 provides a closer look at the relationship between model (6) and experimental data over the relevant time range. As it can be clearly seen, even at this much smaller scale, the agreement between model and data is very good.
Similar observations can be made in relation to all other data sets. Figure 8, Figure 9 and Figure 10 depict the relationships between calculated and experimental kinetic curves measured at pH = 7, initial ozone concentration in the gas phase 100 mg/mL and initial chromophore concentrations 5 mg/mL, 7.5 mg/mL and 10 mg/mL, respectively. In all cases, it is clear that model (6) and experimental data are in very good agreement. Also depicted on these plots are the reactivity and chain-length meta-parameter values (α and N, respectively). As it can be seen, both the optimal values for these parameters change slightly with the initial chromophore concentration. More precisely, the chain-length parameter decreases from 3 (at initial chromophore concentration C0 = 2.5 mg/mL) to 2 (at higher initial chromophore concentrations). A possible explanation for this is that, as the initial concentration of the substrate increases, less and less ozone is left available for subsequent attacks on primary and secondary ozonation by-products, so the number of consecutive reactions in chain (1) decreases. The change in reactivity parameter, on the other hand, may indicate a corresponding change in the reaction pathway itself, which may translate in a change in chemical identity for intermediate products B1, B2, . . . , Bn in reaction chain (1).
Finally, Figure 11 shows the model-vs-data relationship for the data set measured at C0 = 5 mg/mL, pH = 7 and gas phase ozone concentration 150 mg/mL.
As Figure 11 clearly shows, model (6) and experimental data are in very good agreement. The chain-length parameter is as low as before (the liquid phase ozone excess is still insufficient to promote further reactions down chain (1)), but the reactivity parameter is even lower than before. A possible explanation if its decrease (which implies larger differences between activation energies in consecutive reactions of chain (1)) is that, at higher ozone concentrations, multiple sites on the initial chromophore may be attacked simultaneously, leading to an apparent increase in its reactivity with respect to that of further by-products, which react with ozone at fewer (possibly, only one) site(s).
4. Conclusions
The results obtained in this study allowed the following assessments to be made for the discoloration process of BB by ozonation:
The ozonation process of the BB dye can yield biodiversity of by-products depending on initial conditions due the structural complexity of the substrate;
Classical kinetic models are not applicable as be initial by-products can be further ozonated, so the real process must involve a sequence of chained reactions;
1H-NMR spectroscopy analysis was performed at the discoloration time. As the results clearly show decolorization does not indicate complete mineralization. Consequently, the process must be continued for a sufficient time after discoloration to ensure that no new toxic, yet colorless, by-products remained in the system;
BB discoloration take place through successive reactions that offer a possibility of modeling the process by taking into account both ozone diffusion from gas to liquid and the chained reaction system in the bulk liquid phase.
References
- National Center for Biotechnology Information, “www.pubchem.ncbi.nlm.nih.gov,” National Center for Biotechnology Information. PubChem Database. Brilliant Blue FCF, CID=19700, [Online]. Available: https://pubchem.ncbi.nlm.nih.gov/compound/BrilliantBlue-FCF. [Accessed 19 10 2019].
- Cardoso da Silva, J. C., Bispo G. L., Pavanelli S. P., de Casia Franco Afonso R. J., and Augusti R., Ozonation of the food dye Brilliant Blue in aqueous medium: monitoring and characterization of products by direct infusion electrospray ionization coupled to high - resolution mass spectrometry, Rapid Commun. Mass Spectrom 2012; 26, pp 1305 - 1310. [CrossRef]
- Lewis R. J., Sr., and I. N. Sax, Sax’s dangerous properties of industrial materials, Wiley & Sons, Inc., Hoboken, N. J., 2004, pp. 1749.
- Chu W., and Ma, C. W., Quantitative Prediction of Direct and Indirect Dye Ozonation Kinetics, Water Research, 2000; 34(12), pp 3153 - 3160. [CrossRef]
- Sabnis R. W., Handbook of biological dyes and stains. Synthesis and industrial applications, New Jersey: John Wiley & Sons, Inc., Hoboken; 2010.
- Zeinab A. A., Ogarite A. Y., and Mouhiaddine M. E. J., Kinetic study of acid blue 1 discoloration with persulfate, Journal of Chemical Technology and Metallurgy, 2017, 52(5), pp. 812 - 824.
- Forgacs E., Cserhati T., and Oros G., Removal of synthetic dyes from wastewaters: a review, Environment international 2004, 30(7), pp 953 - 971. [CrossRef]
- Gupta V. K., Khamparia S., Tyagi I., Jaspal D., and Malviya A., Decoloration of mixture of dyes: A critical review, Global J. Environ. Sci. Manage, 2015; 1(1), pp 71 - 91.
- Shindhal T.,. Rakholiya P,. Varjani S, Pandey A.,. Ngo H. H, Guo W.,. Ng H. Y, and Taherzadeh M. J., A critical review on advances in the practices and perspectives for the treatment of dye industry wastewater, Bioengineering, 2021, 12(1), pp 70 - 87. [CrossRef]
- Ardila - Leal L. D.,. Potou - Pinales R. A, Pedroza Rodriquez A. M., and. Quevedo – Hidalgo B. E, A brief history of colour the environmental impact of synthetic dyes and removal by using Laccases, Molecules, 2021, 26, pp. 3813. [CrossRef]
- Al - Tohamy R., Ali S. S., Li F.,. Okasha K. M, Mahmoud Y. A. G.,. Elsamahy T,. Jiao H, Fu Y., and Sun J., A critical review on the treatment of dye - containing wastewater: Ecotoxicological and health concerns of textile dyes and possible remediation approaches for environmental safety, Ecotoxicology and Environmental Safety, 2022, 231, pp. 113160. [CrossRef]
- Michelsen D. L., Powell W. W., Woodby R. M., Fulk L. L., and Boardman G. D., Pretreatment of Textile Dye Concentrates using Fenton’s Reagent and Ozonation Prior to Biodegradation, Chemical Oxidation: Technology for the Nineti, AATCC; 1992, p. 135-150.
- 13Warnatz. J., Maas U., and Dibble R. W., Combustion. Physical and Chemical Fundamentals, Modeling and Simulation, Experiments, Pollutant Formation, 4th ed., Germany: SpringerVerlag Berlin Heidelberg; 1996, 1999, 2001, and 2006.
- 14Ikehata. K., . Naghashkarand N. J. J., and Gamal El-Din M., Degradation of aqueous pharmaceuticals by ozonation and advanced oxidation processes: A Review, Journal of the International Ozone Association, 2006; 28(6) pp 353 - 414. [CrossRef]
- Tiwari B. K., Muthukumarappan K., Donnel C. P. O., and Cullen P. J., Modelling colour degradation of orange juice by ozone treatment using response surface methodology, Journal of Food Engineering, 2008, 88(4), pp. 553 - 560. [CrossRef]
- Marcvart M., Constantin C., and Stoica L., Discoloration of food dyes from aqueous media by ozonization. Case study: Brilliant Blue, U.P.B. Sci. Bull., Series B, 2019; 81(3), pp 119-130.
- Hung - Yee S., and Ching-Rong H., Degradation of commercial azo dyes in water using ozonation and UV enhanced ozonation process, Chemosphere 1995, 31(8) pp 3813 - 3825. [CrossRef]
- Shu H. Y., and Chang M. C., Decolorization of six azo dyes by O3, UV/O3 and UV/H2O2 processes, Dyes Pigm. 2005; 65, pp 25 - 31. [CrossRef]
- Urs von Gunten, Ozonation of drinking water: Part I. Oxidation kinetics and product formation, Water Research, 2003; 37, pp. 1443 - 1467. [CrossRef]
- Marcvart Tiron M.,. Lucaciu I. E, Nita - Lazar M., and Gheorghe S., Considerations on the Toxicity of Brilliant Blue FCF aqueous solutions before and after ozonation, Revista de Chimie, 2020; 71(4), pp 356 - 365. [CrossRef]
- Sakamoto - Lopes M., Braga - Moruzzi R., Tomazini - Conceição F., Gabriel - Silva M. S., and Pereira - Antunes M. L., Factors and mass ratio analyses for Reactive Blue 19 dye decolorization using ozone: an experimental and analytical modelling approach. Engenharia Sanitaria e Ambiental, 2019; 24, pp 431 - 438.
- Missen R.W., Mims C.A., and Saville B.A.. Introduction to Chemical Reaction Engineering and Kinetics. John Wiley & Sons.; 1999. [CrossRef]
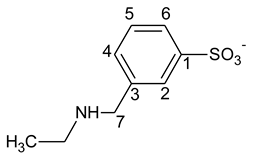
Figure 1.
Chemical structure of the BB molecule.
Figure 2.
Variation ofCtBB = f(t) during the BB-O3 interaction at pH = 4.0, in a time interval of 0 - 1.5 min, C0BB = 5 mg/L, a) with stirring (200 min-1), b) without stirring.
Figure 2.
Variation ofCtBB = f(t) during the BB-O3 interaction at pH = 4.0, in a time interval of 0 - 1.5 min, C0BB = 5 mg/L, a) with stirring (200 min-1), b) without stirring.
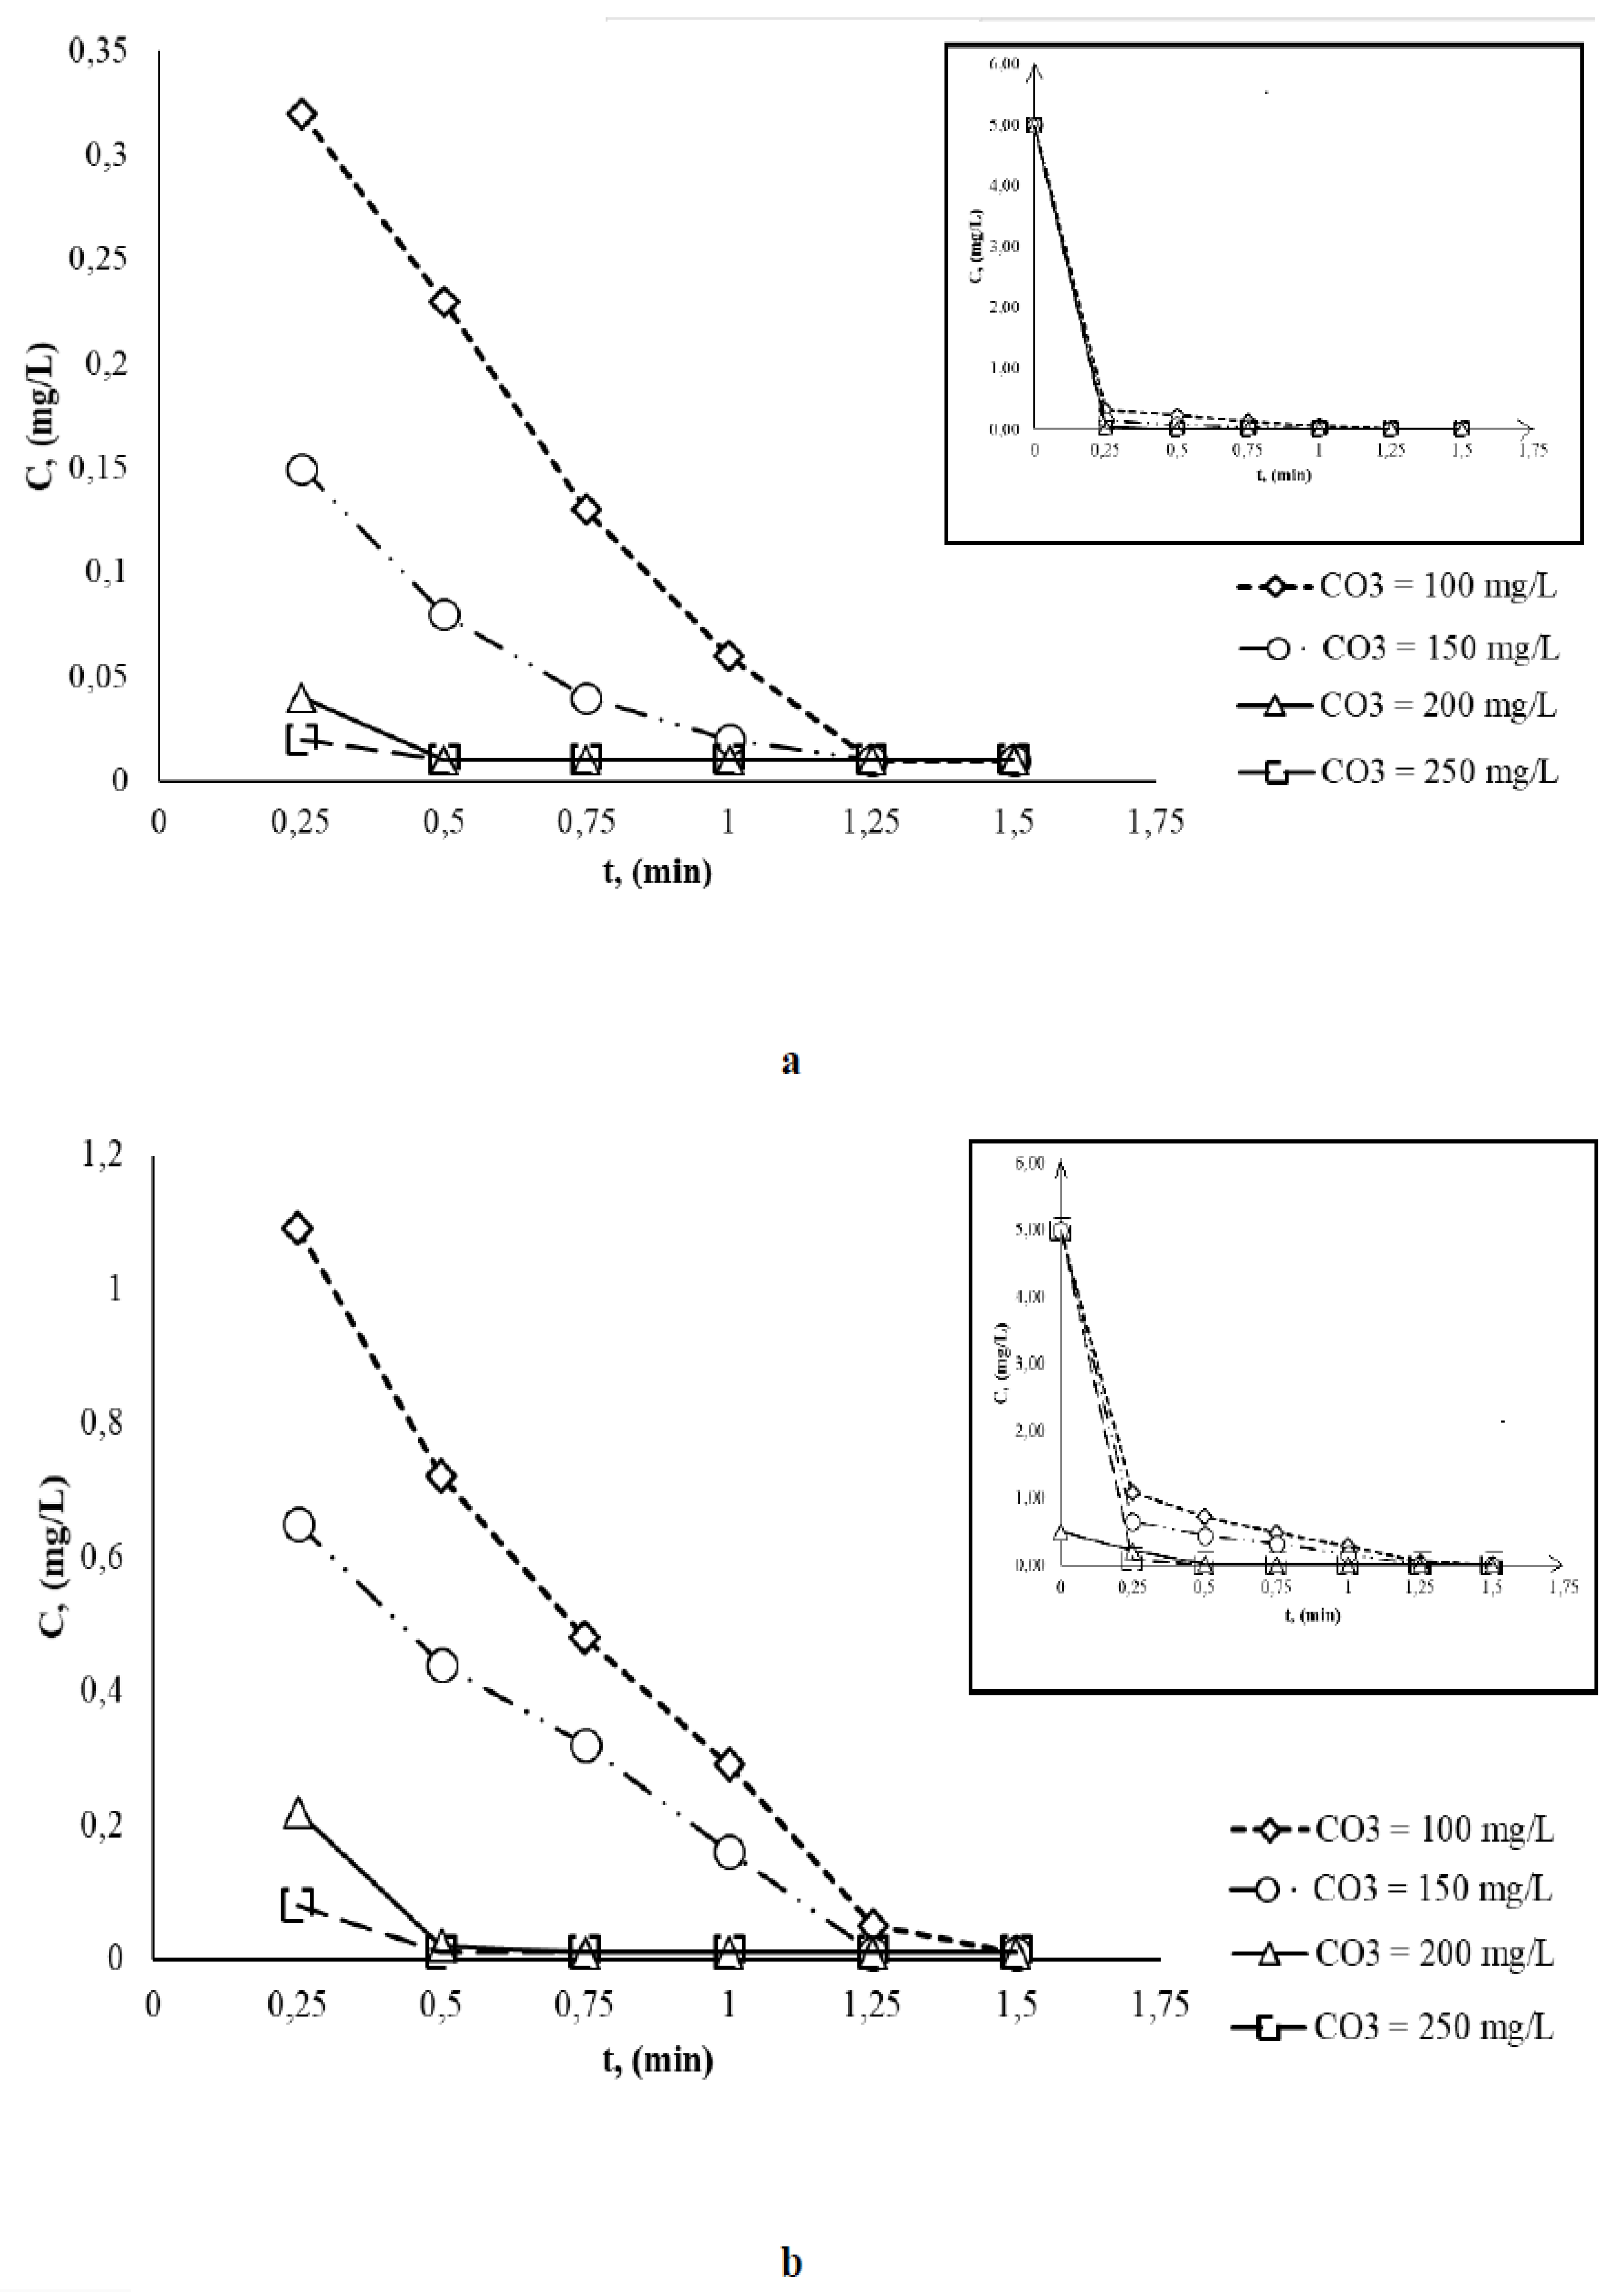
Figure 3.
Variation of CtBB = f(t) during the BB-O3 interaction at pH = 7.0, in a time interval of 0 - 10 min, C0BB = 5 mg/L, a) with stirring (200 rpm), b) without stirring.
Figure 3.
Variation of CtBB = f(t) during the BB-O3 interaction at pH = 7.0, in a time interval of 0 - 10 min, C0BB = 5 mg/L, a) with stirring (200 rpm), b) without stirring.
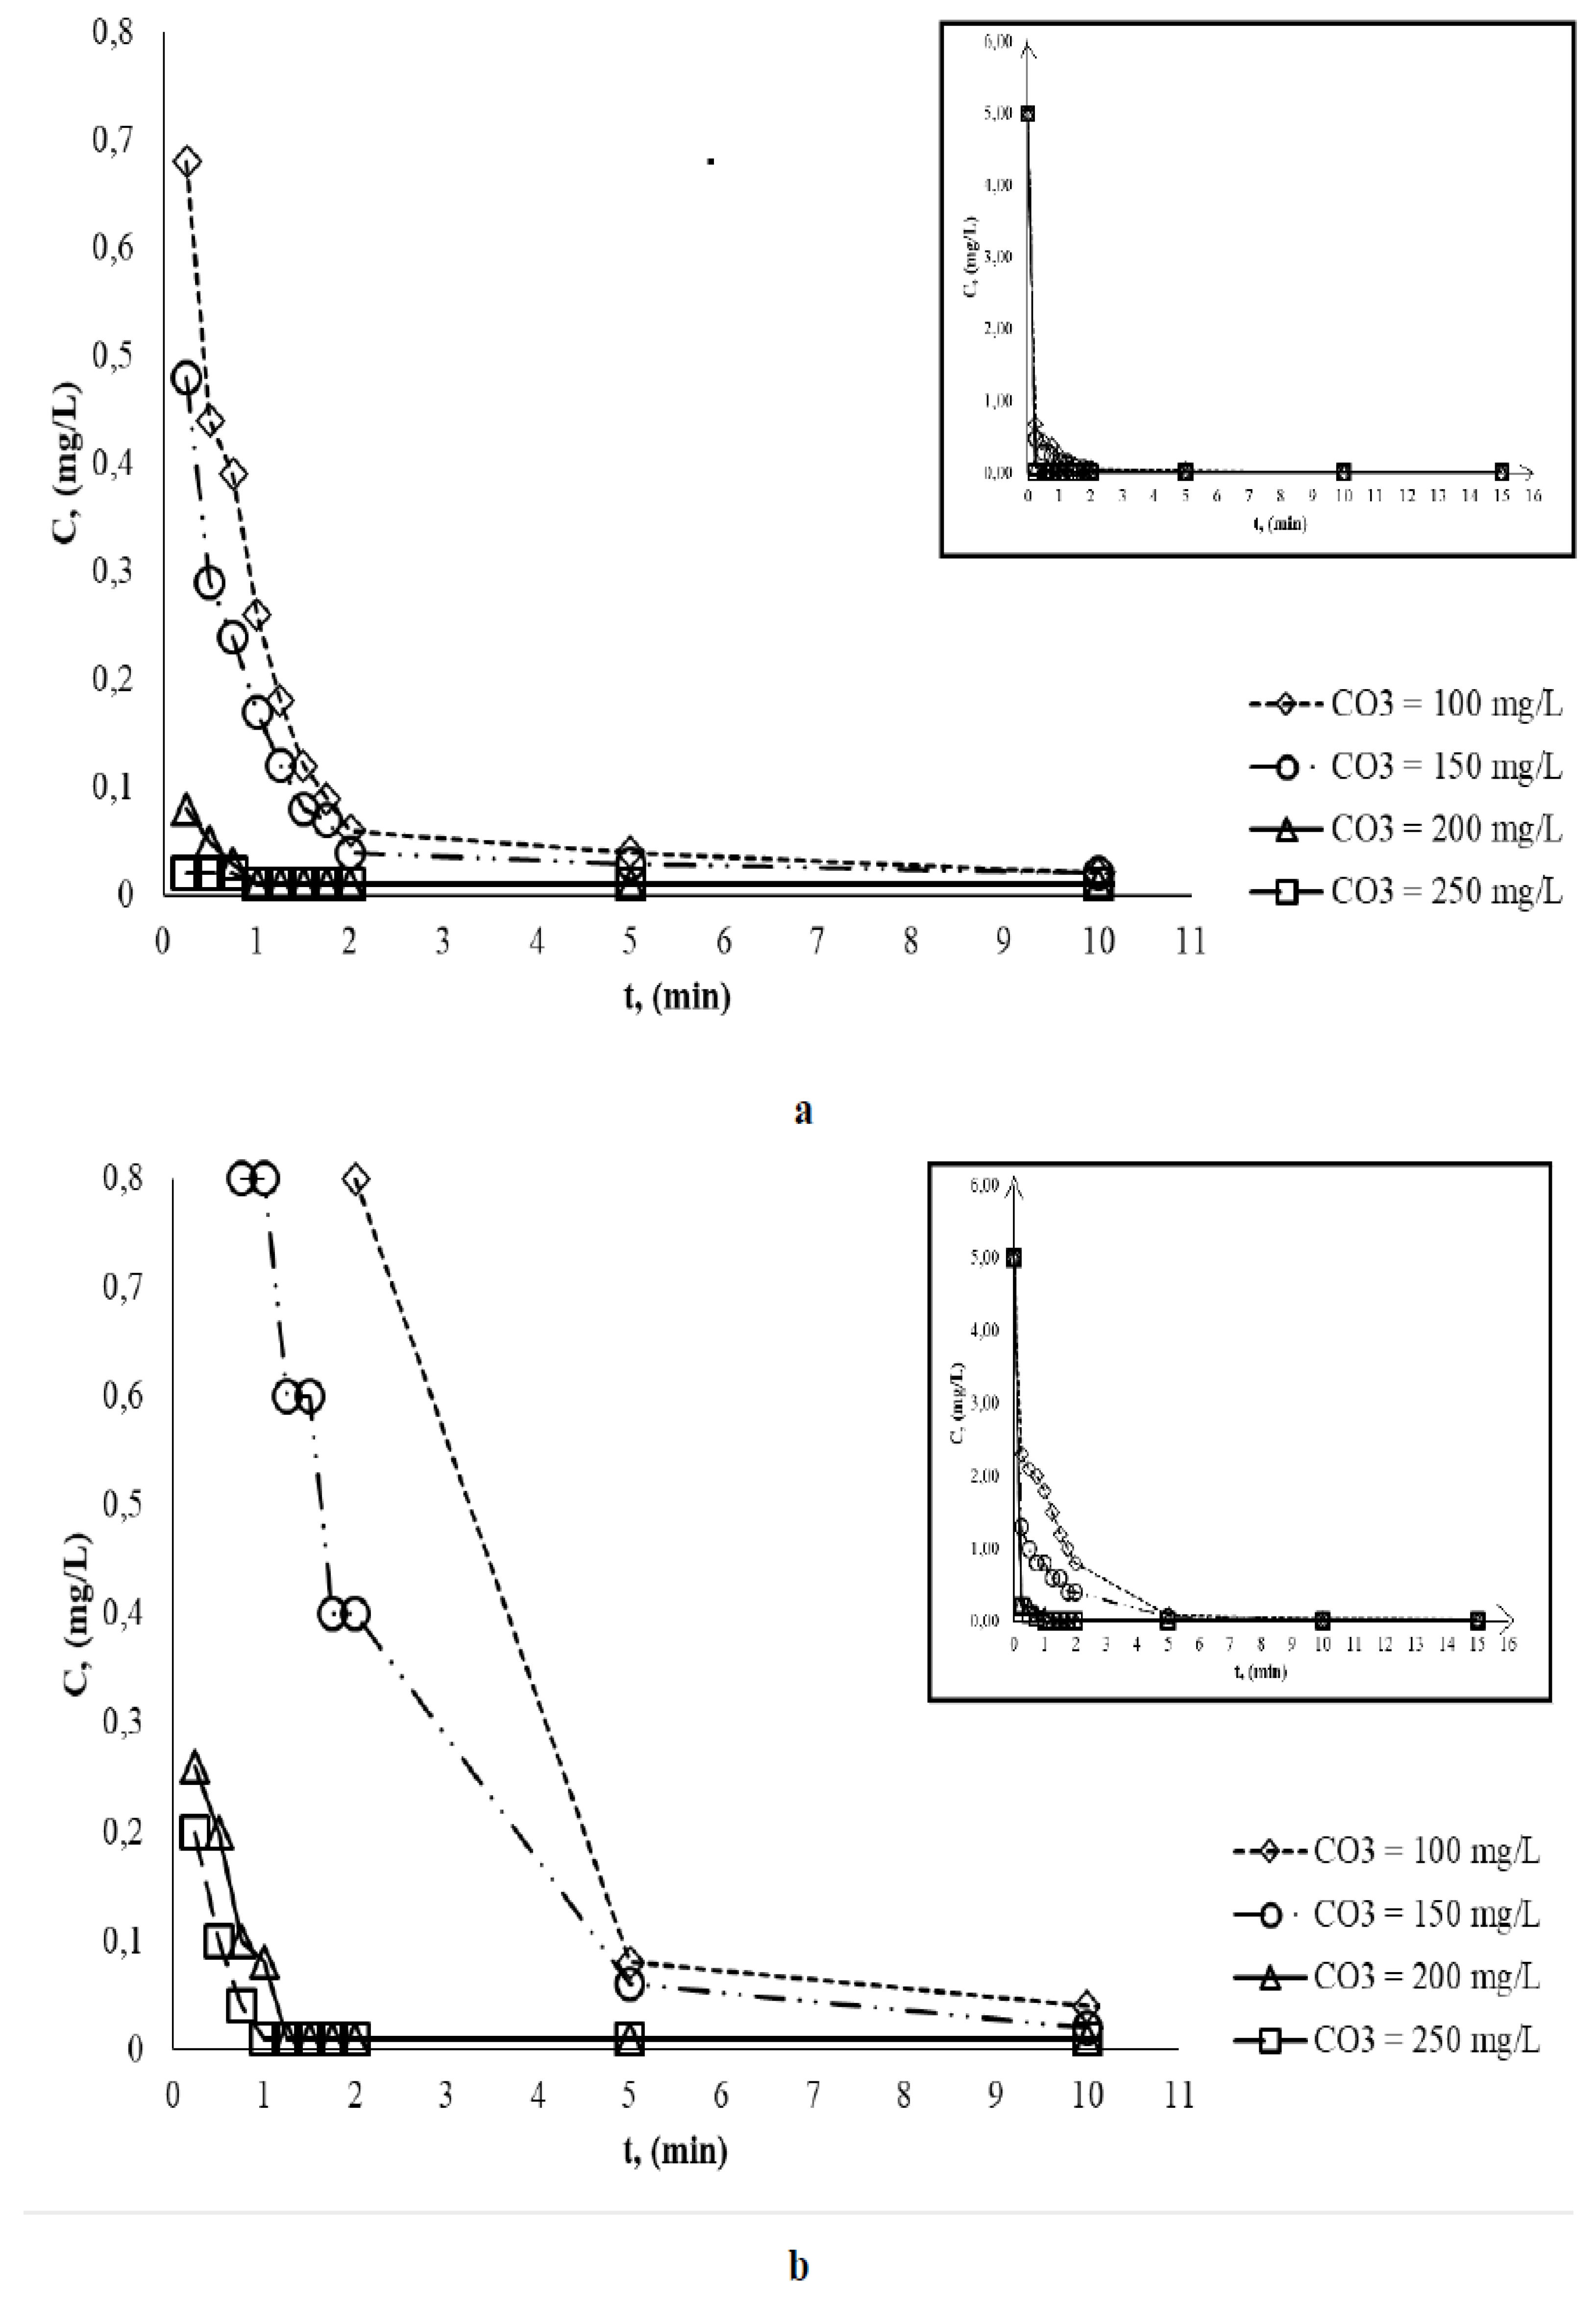
Figure 4.
Variation of CtBB = f(t) during the BB-O3 interaction at pH = 10.0, in a time interval of 0 - 1 min, C0BB = 5 mg/L, a) with stirring (200 rpm), b) without stirring.
Figure 4.
Variation of CtBB = f(t) during the BB-O3 interaction at pH = 10.0, in a time interval of 0 - 1 min, C0BB = 5 mg/L, a) with stirring (200 rpm), b) without stirring.
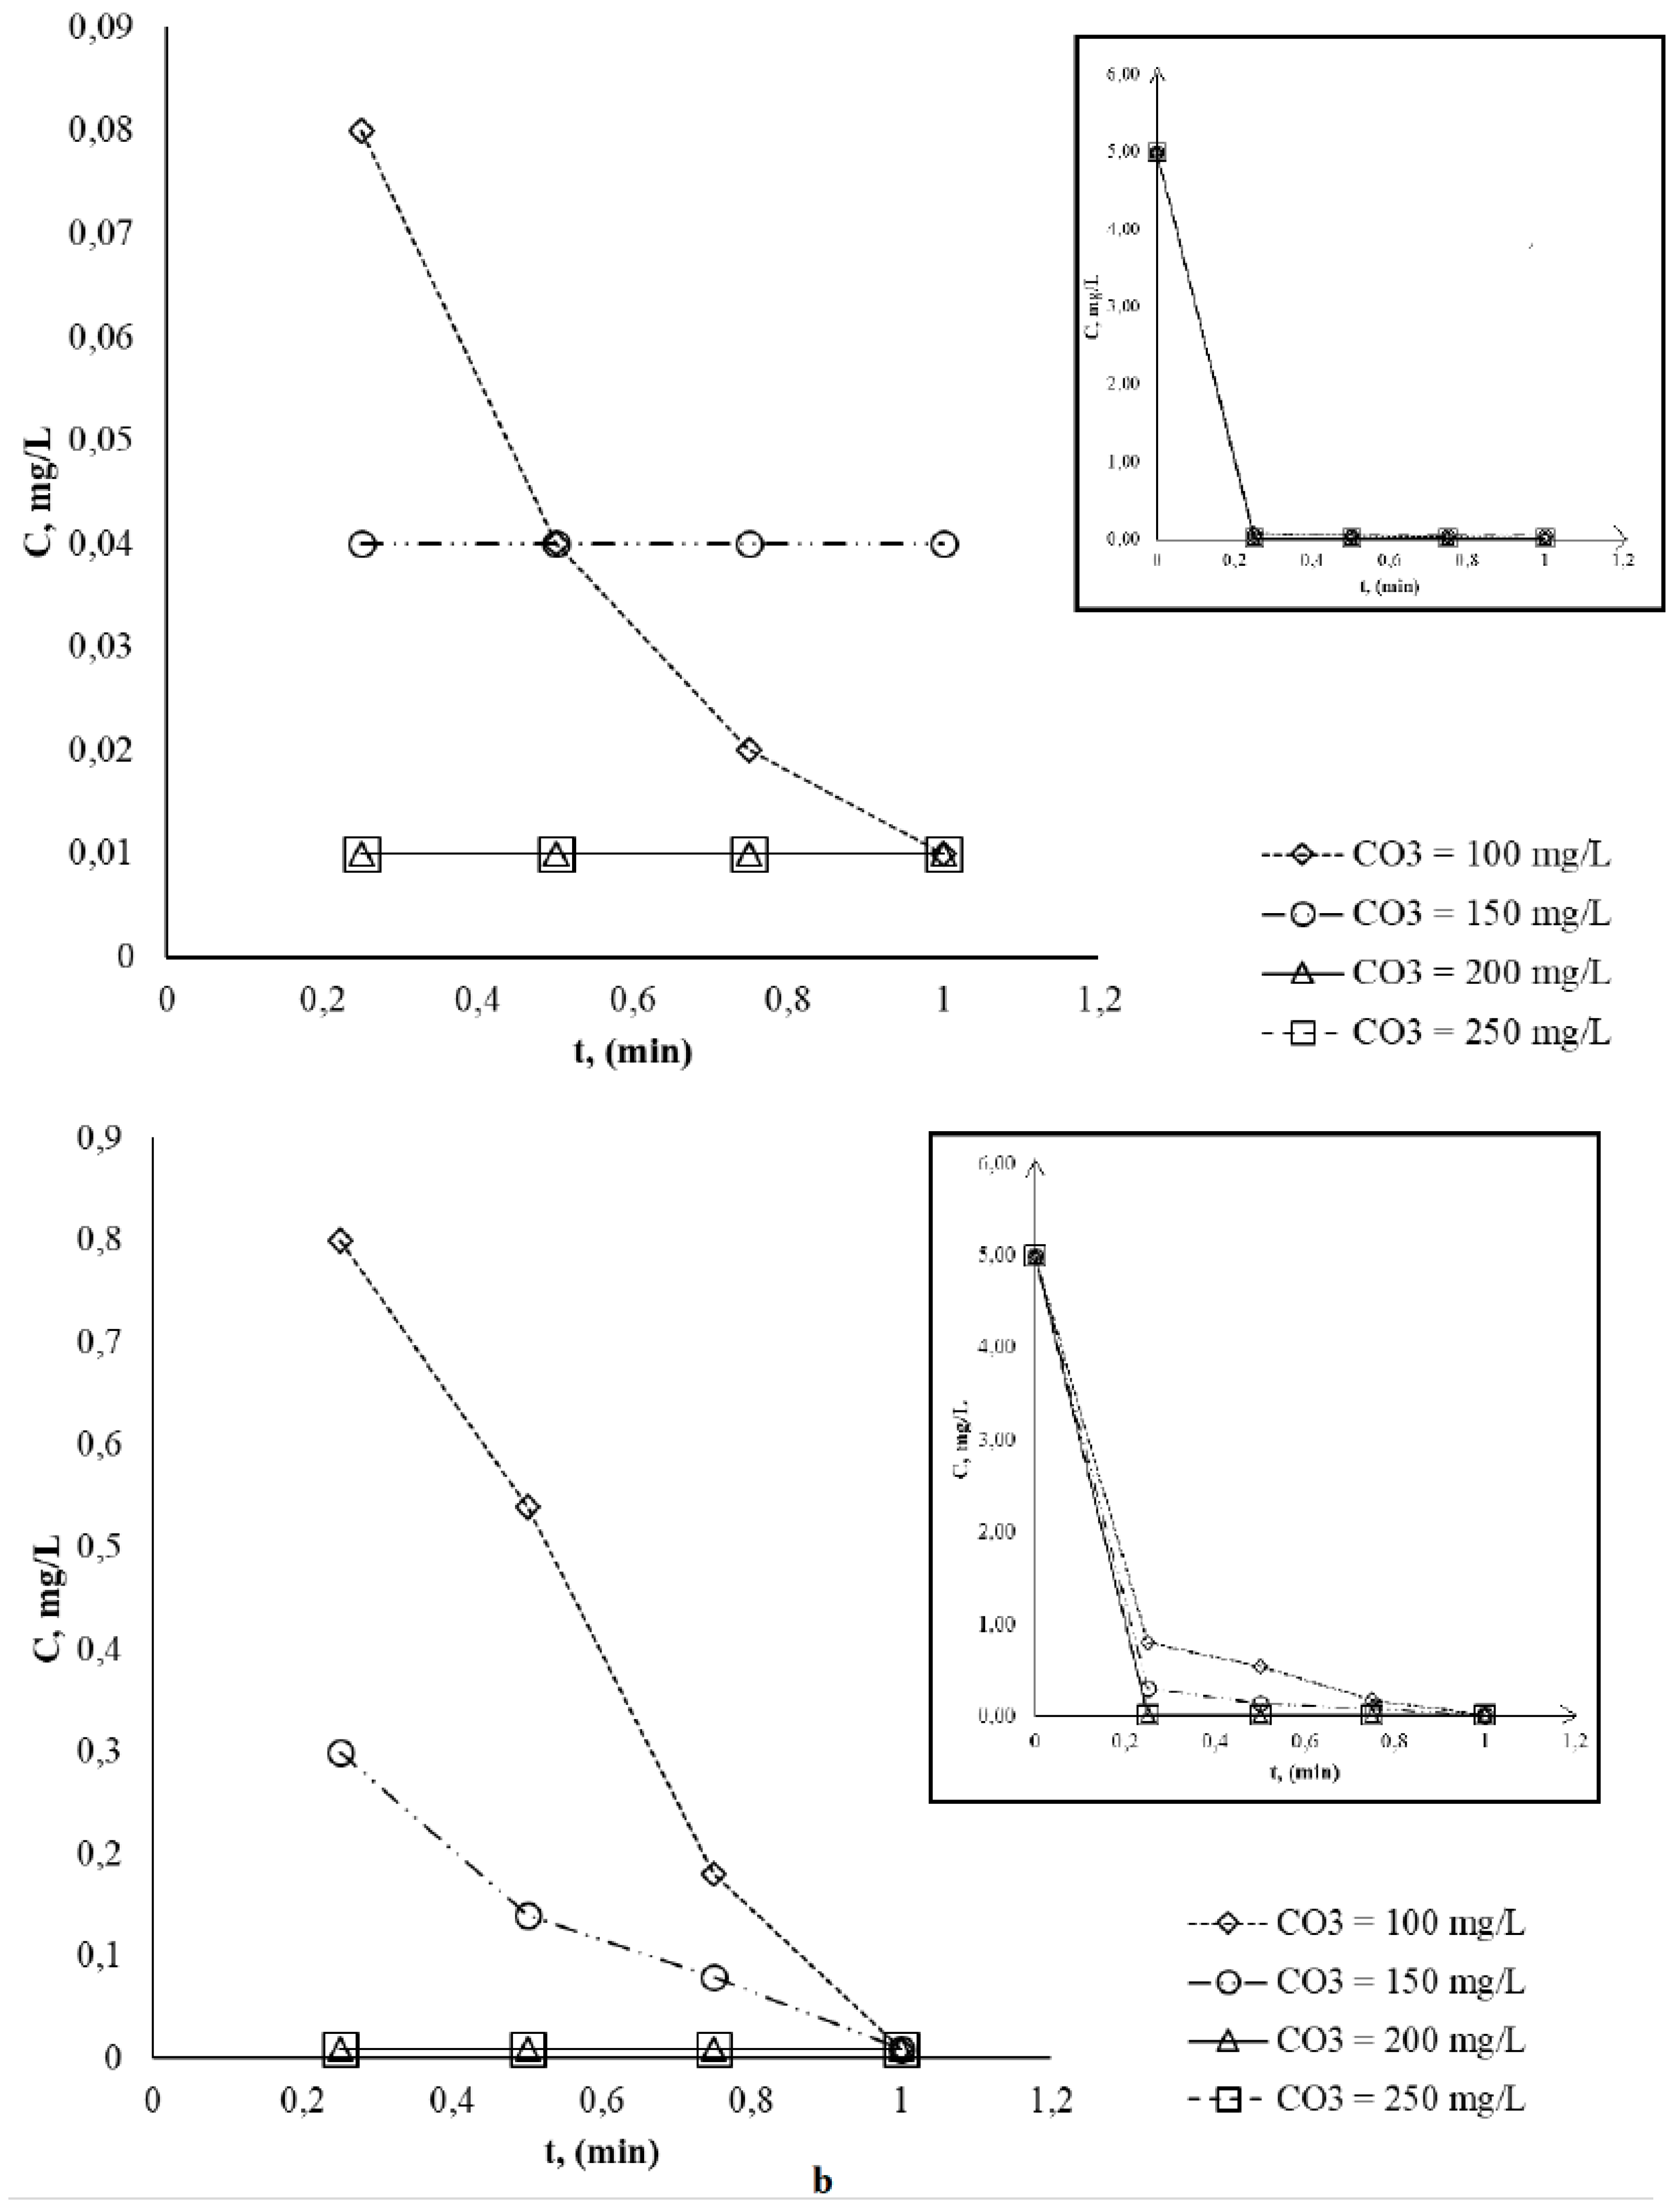
Figure 5.
1H-NMR spectrum of Brilliant Blue.
Scheme 1.
Proposed pathway of BB degradation from aqueous solutions by ozonation.
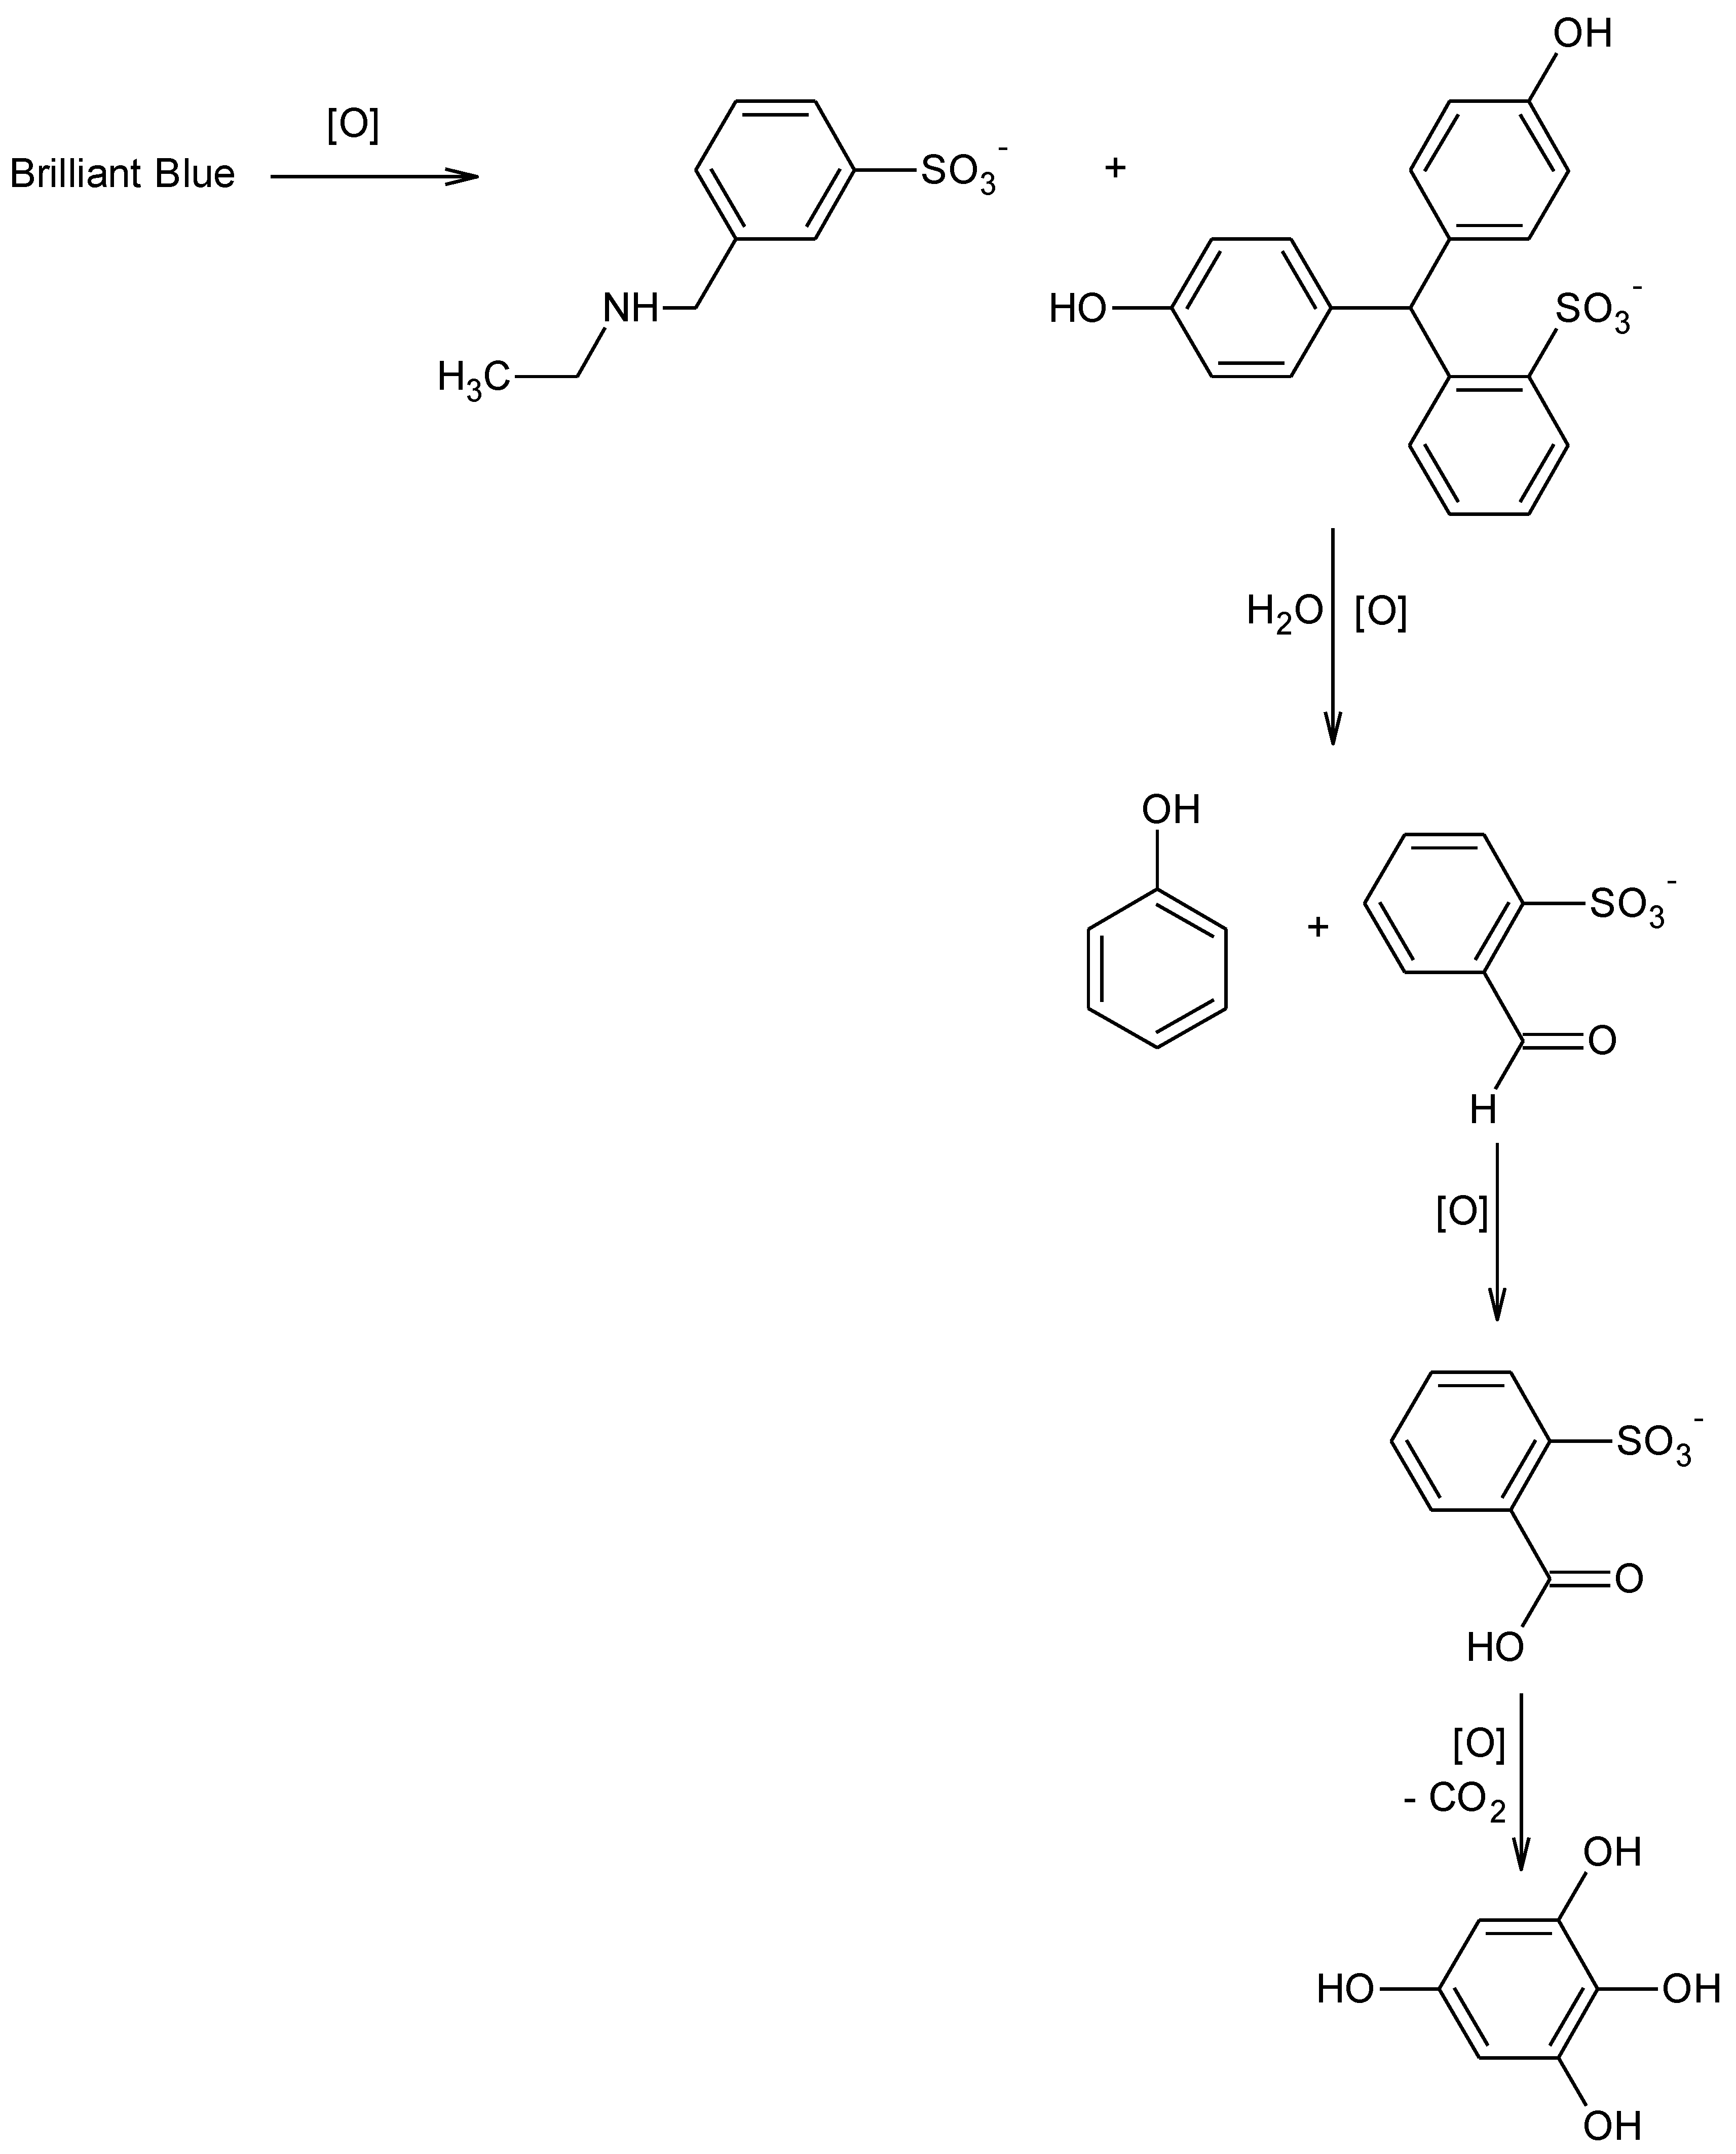
Figure 6.
Experimental and calculated kinetic curve for BB decay at pH = 7, initial chromophore concentration 2.5 mg/L and gas-phase ozone concentration 100 mg/L, full time range.
Figure 6.
Experimental and calculated kinetic curve for BB decay at pH = 7, initial chromophore concentration 2.5 mg/L and gas-phase ozone concentration 100 mg/L, full time range.
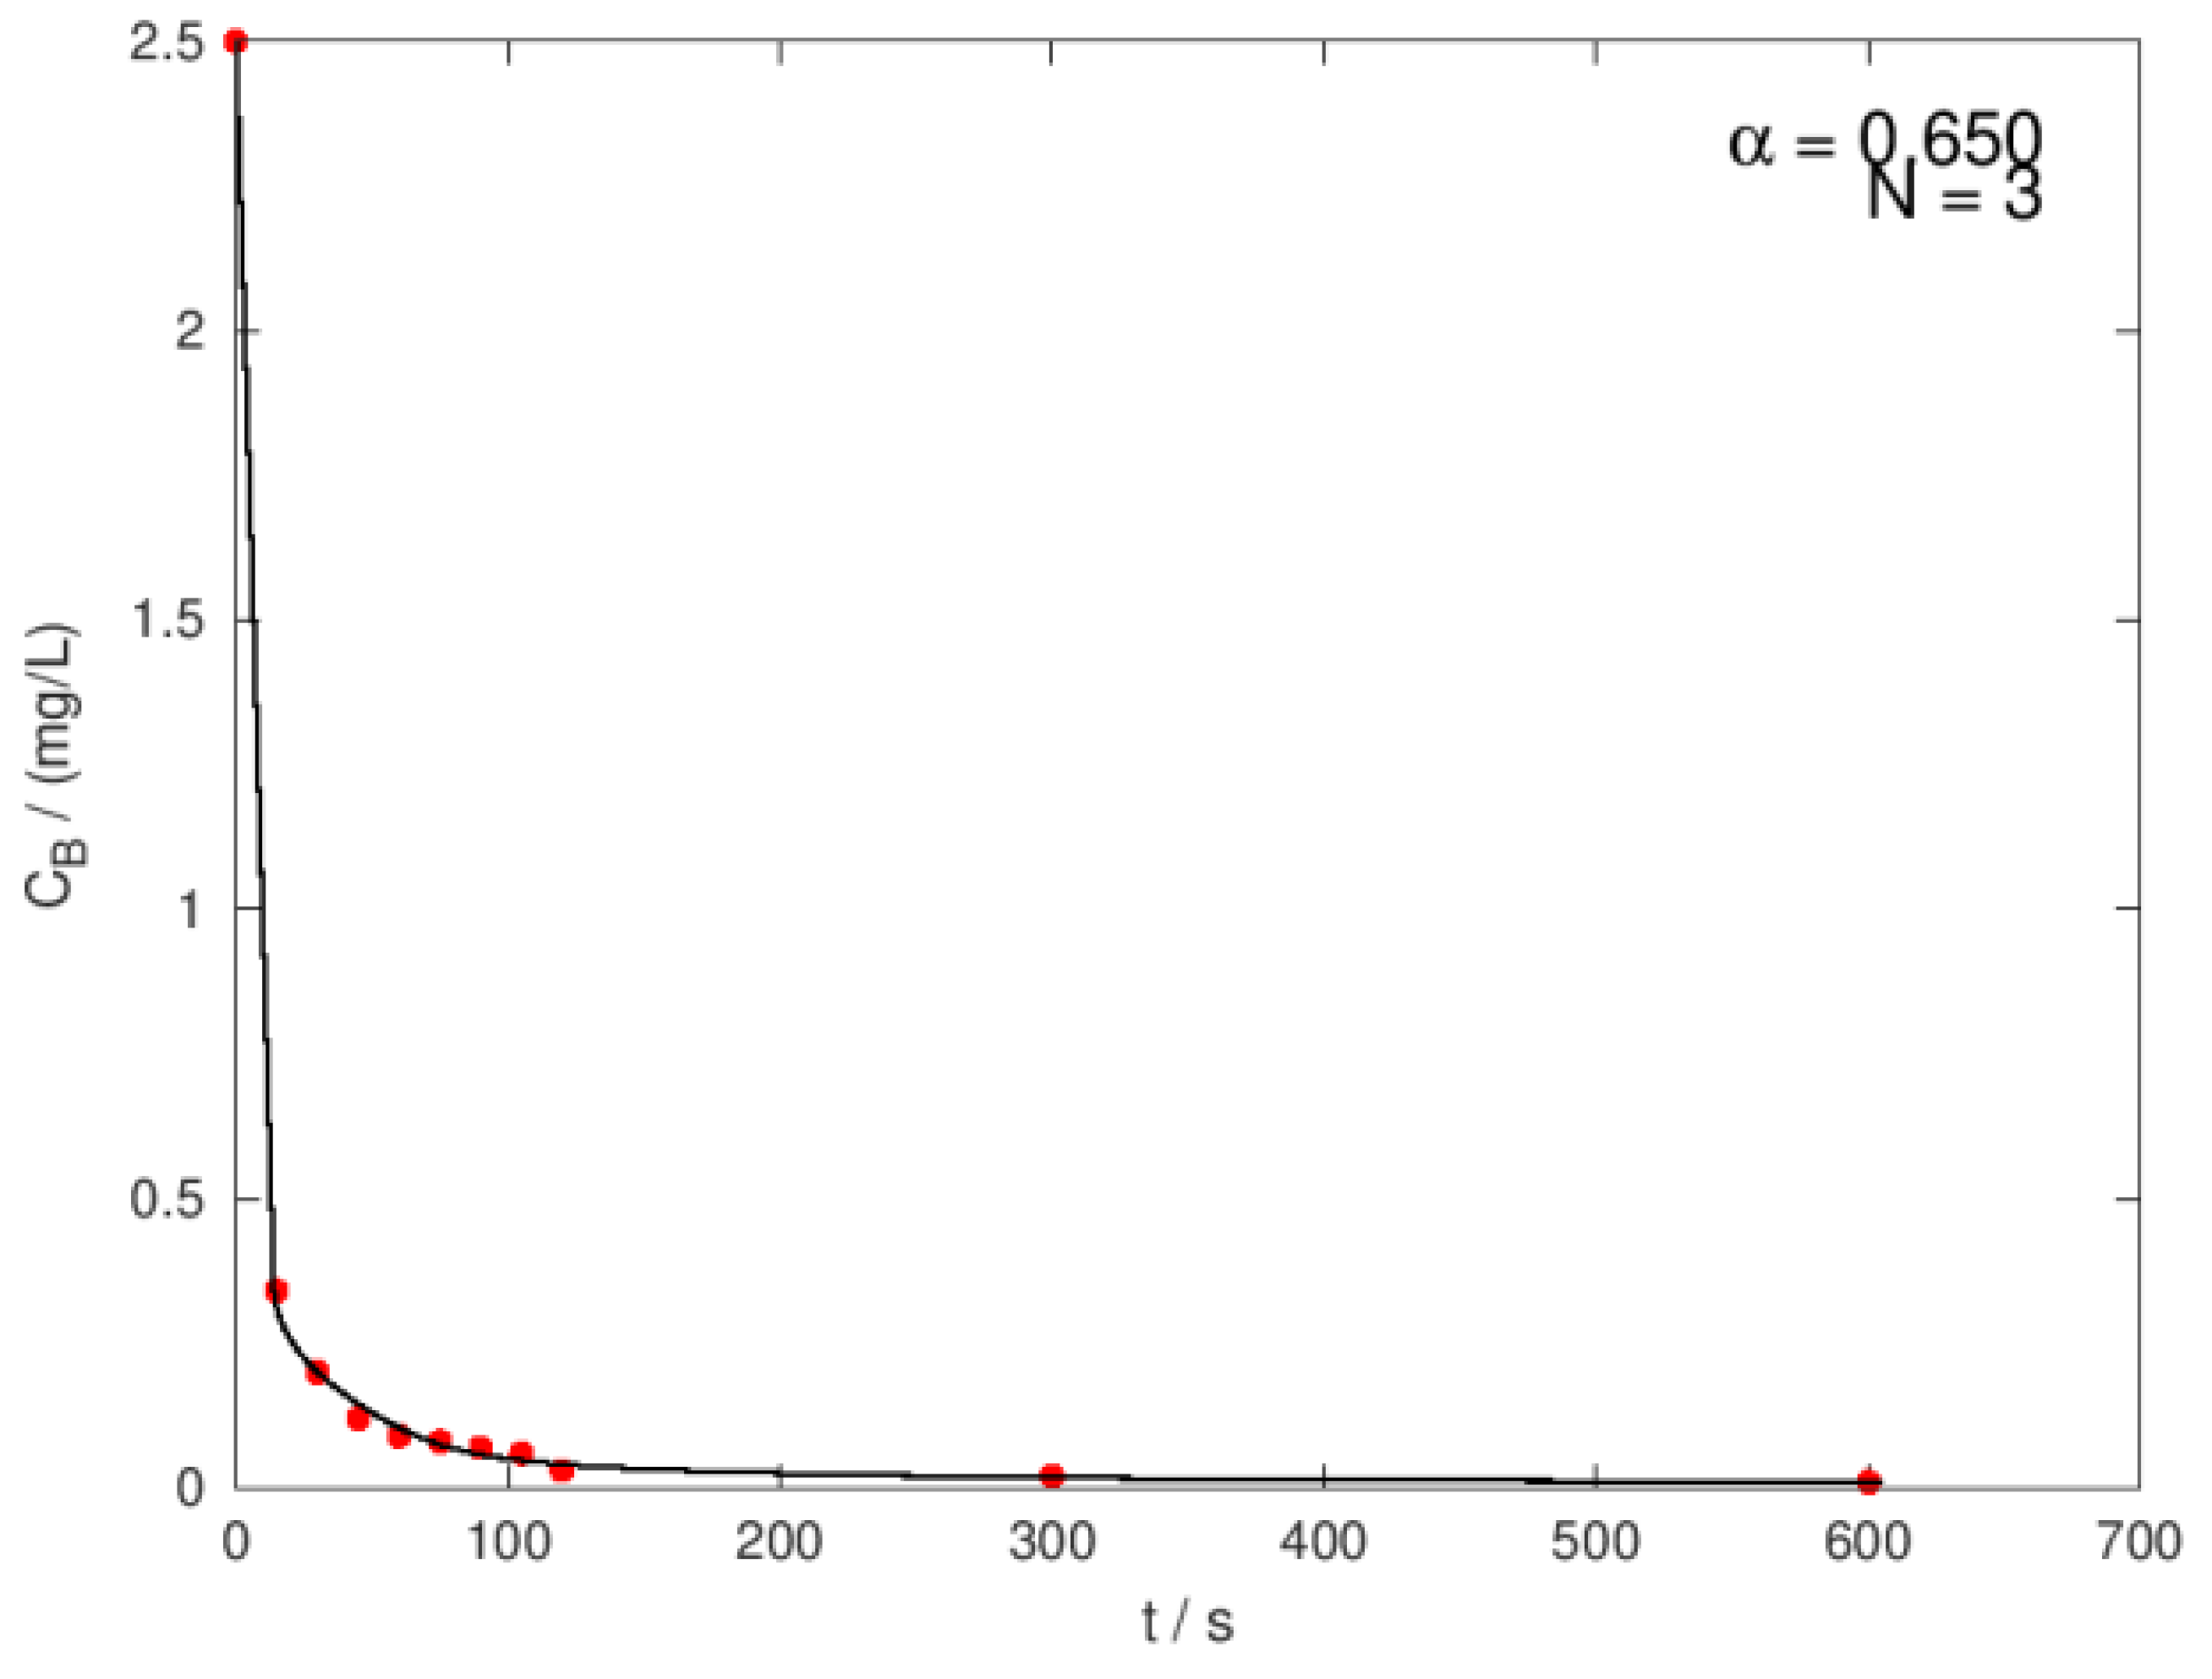
Figure 7.
Experimental and calculated kinetic curve for BB decay at pH = 7, initial chromophore concentration 2.5 mg/L and gas-phase ozone concentration 100 mg/L. Time range [15 s, 600 s].
Figure 7.
Experimental and calculated kinetic curve for BB decay at pH = 7, initial chromophore concentration 2.5 mg/L and gas-phase ozone concentration 100 mg/L. Time range [15 s, 600 s].
Figure 8.
Experimental and calculated kinetic curve for BB decay at pH = 7, initial chromophore concentration 5 mg/L and gas-phase ozone concentration 100 mg/L, full time range.
Figure 8.
Experimental and calculated kinetic curve for BB decay at pH = 7, initial chromophore concentration 5 mg/L and gas-phase ozone concentration 100 mg/L, full time range.
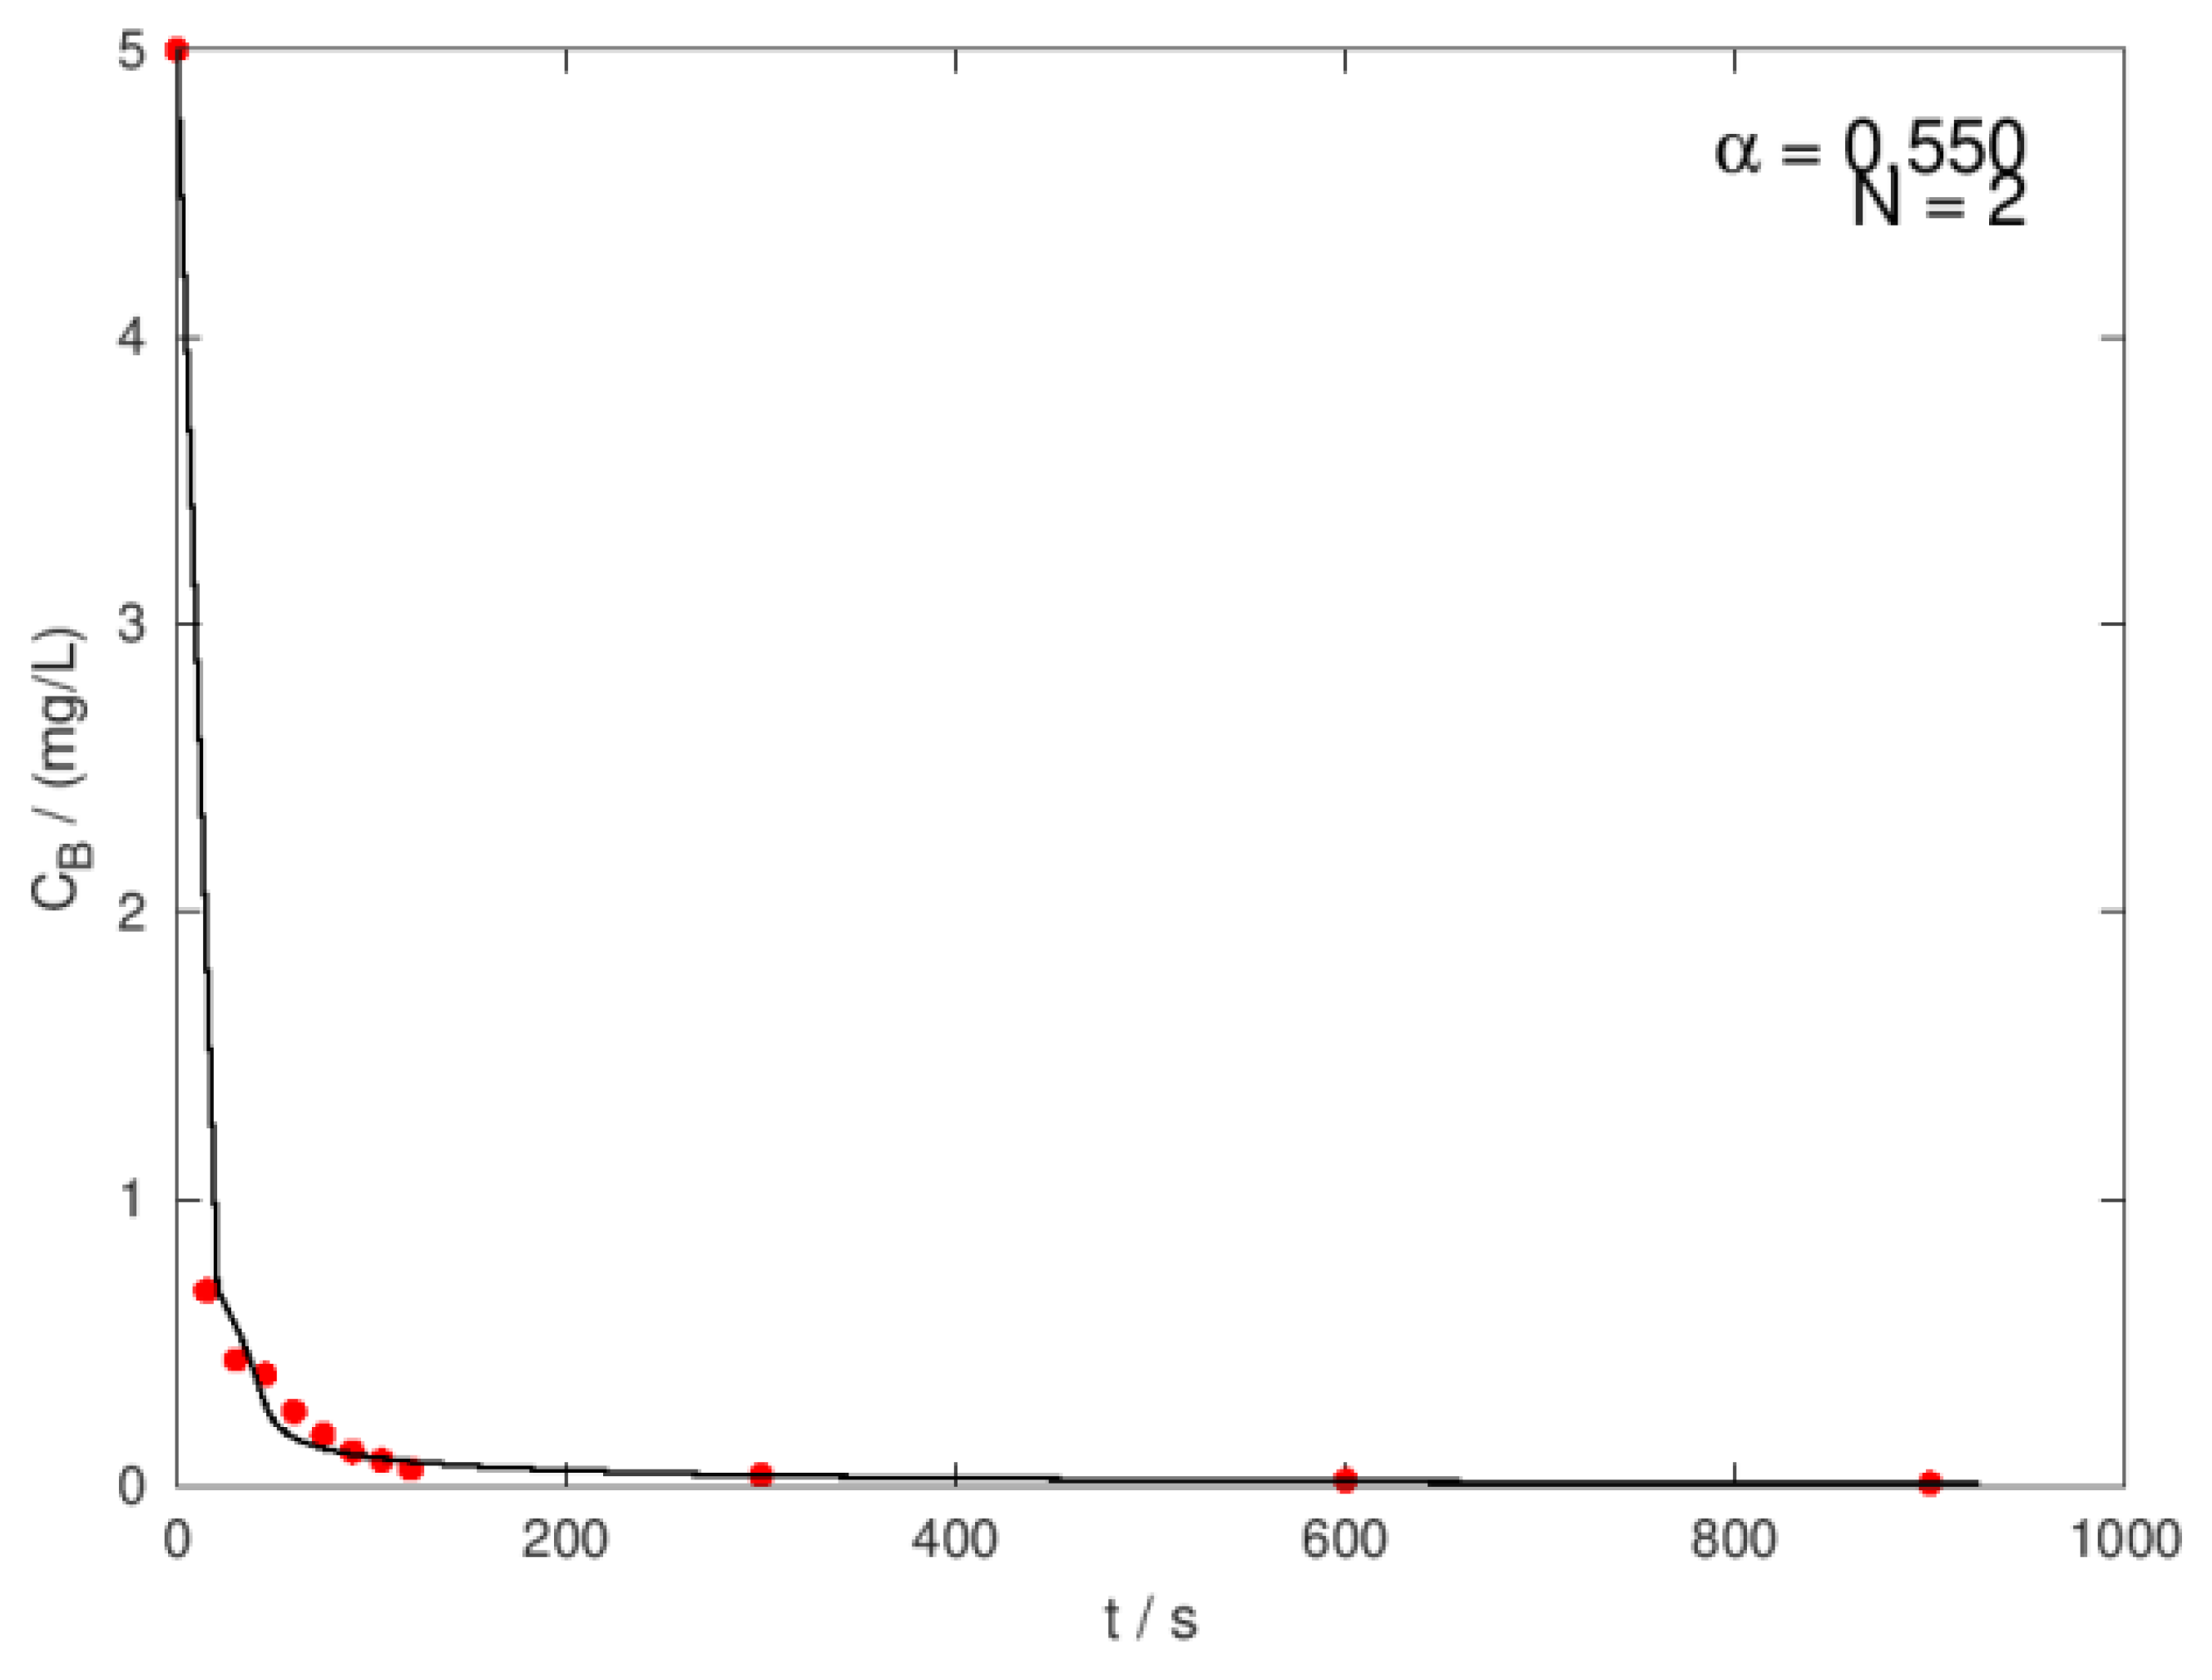
Figure 9.
Experimental and calculated kinetic curve for BB decay at pH = 7, initial chromophore concentration 7.5 mg/L and gas-phase ozone concentration 100 mg/L, full time range.
Figure 9.
Experimental and calculated kinetic curve for BB decay at pH = 7, initial chromophore concentration 7.5 mg/L and gas-phase ozone concentration 100 mg/L, full time range.
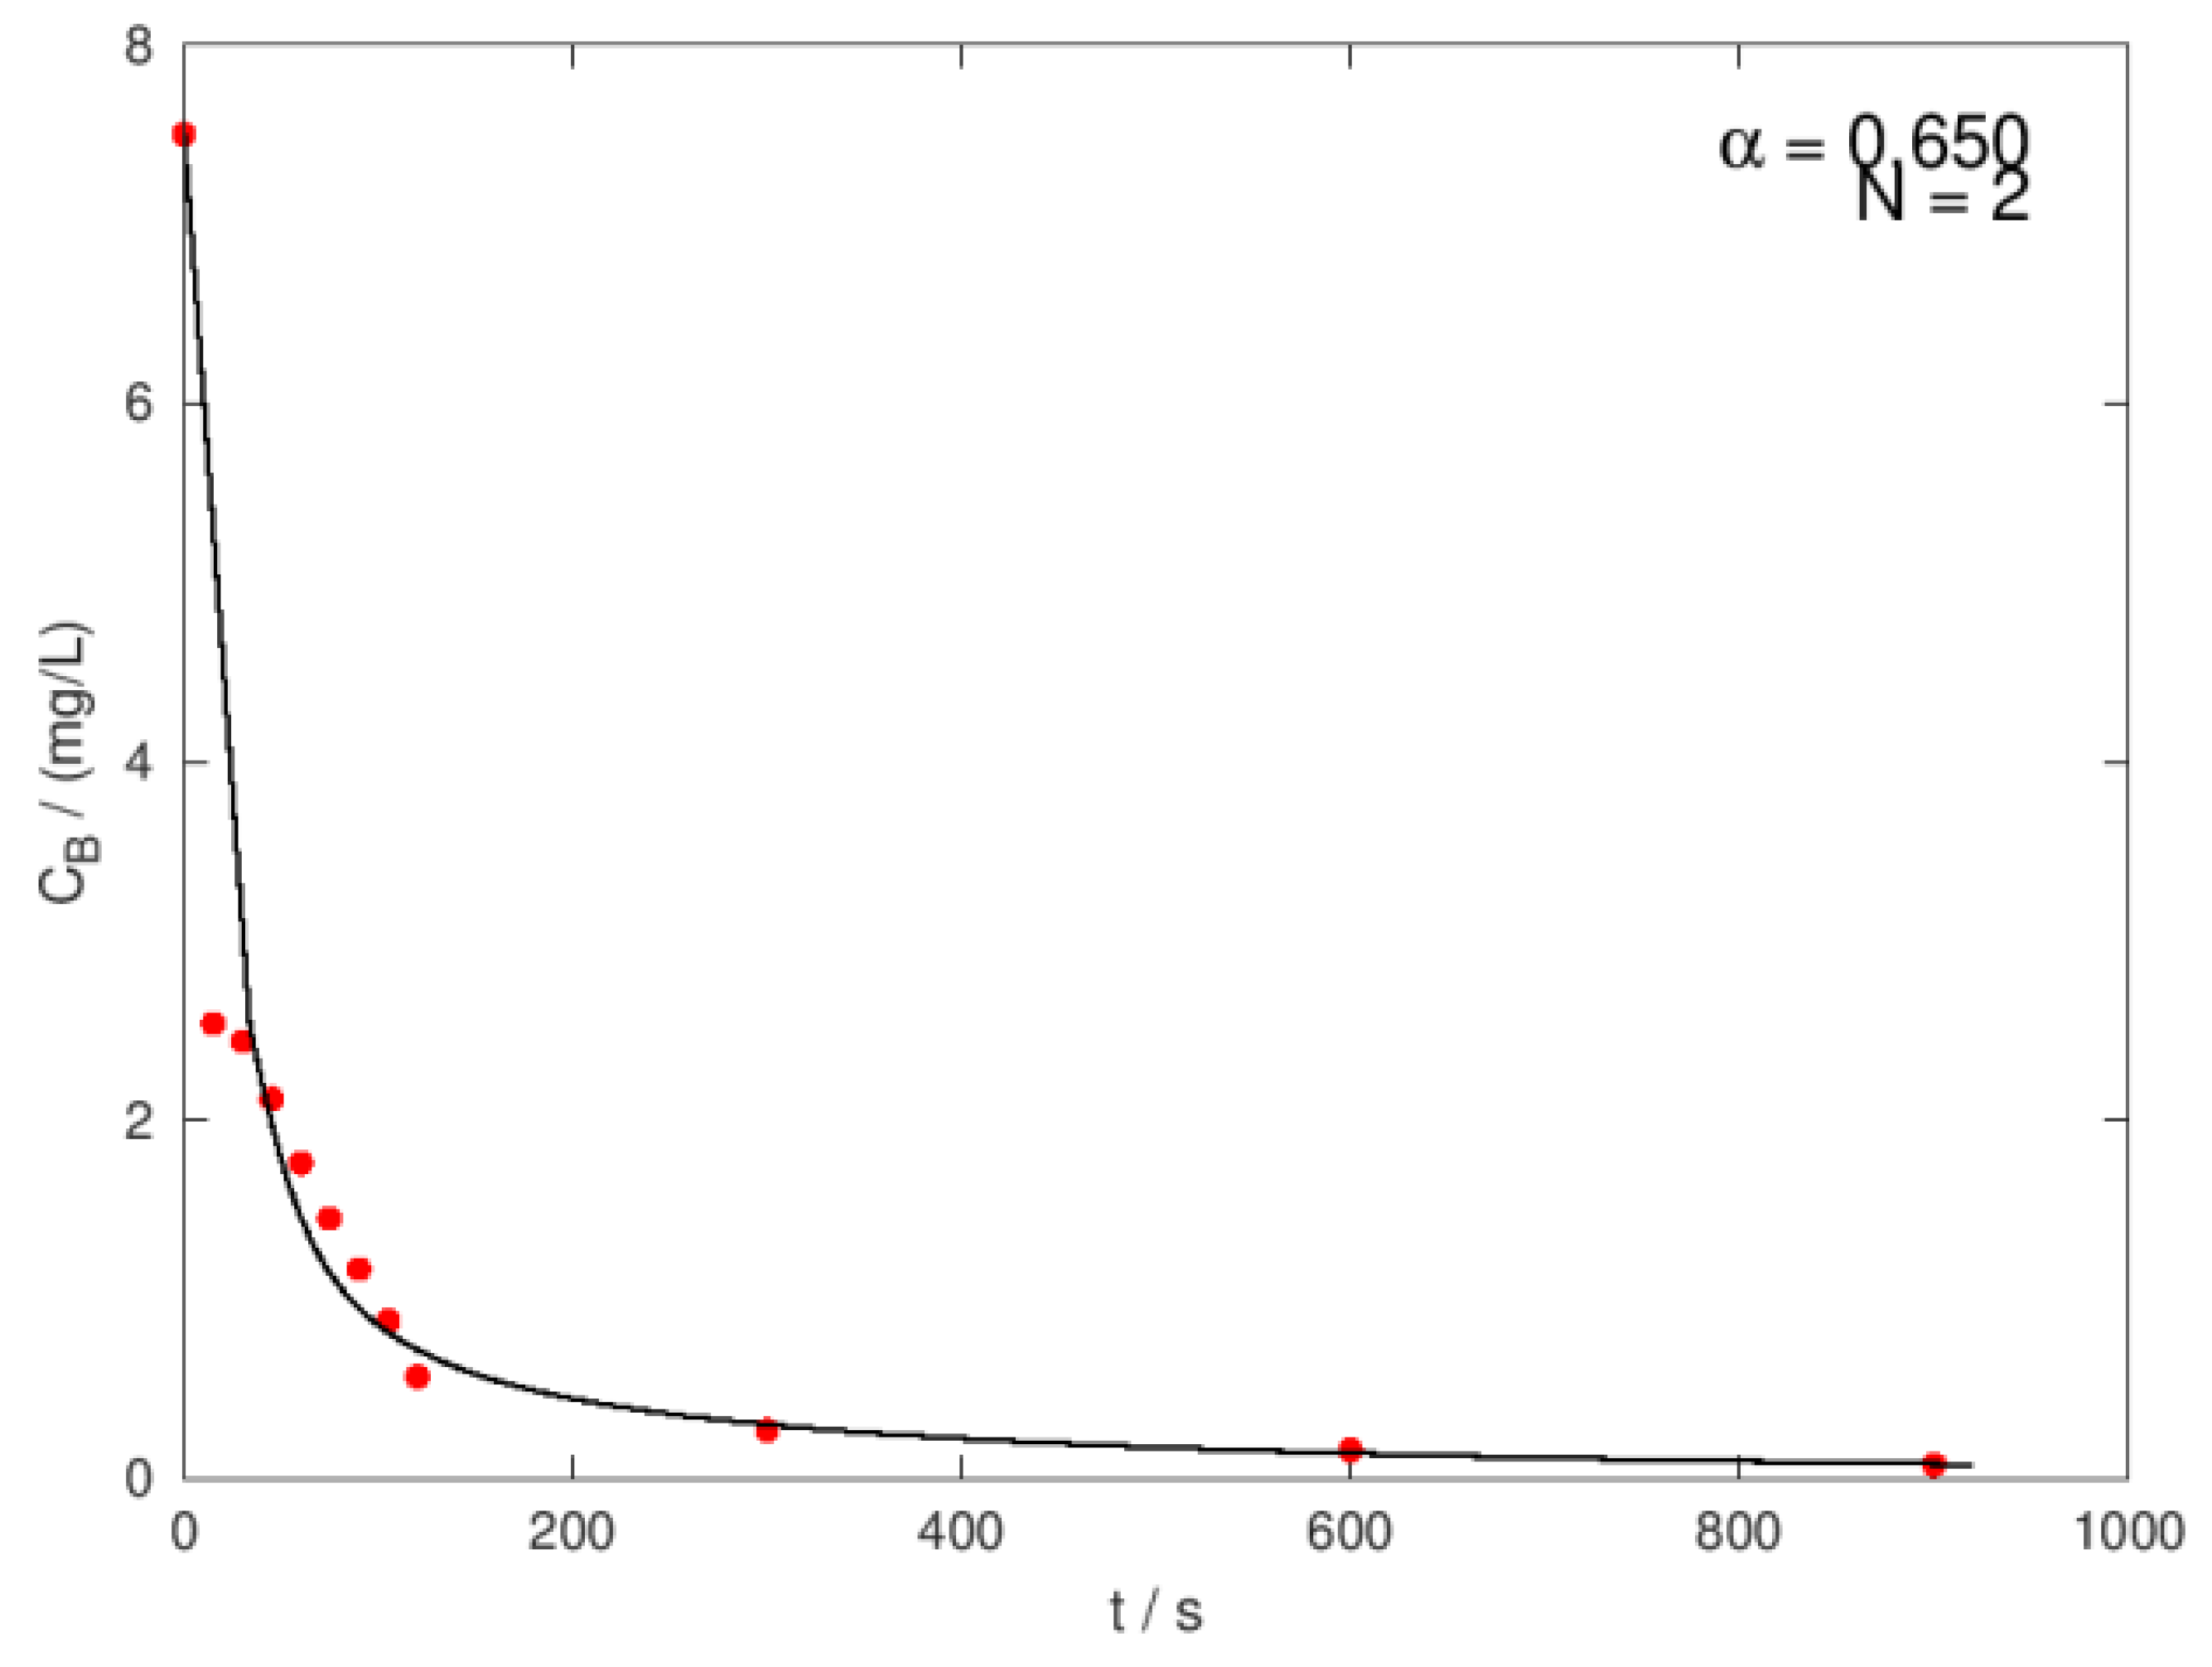
Figure 10.
Experimental and calculated kinetic curve for BB decay at pH = 7, initial chromophore concentration 10 mg/L and gas-phase ozone concentration 100 mg/L, full time range.
Figure 10.
Experimental and calculated kinetic curve for BB decay at pH = 7, initial chromophore concentration 10 mg/L and gas-phase ozone concentration 100 mg/L, full time range.
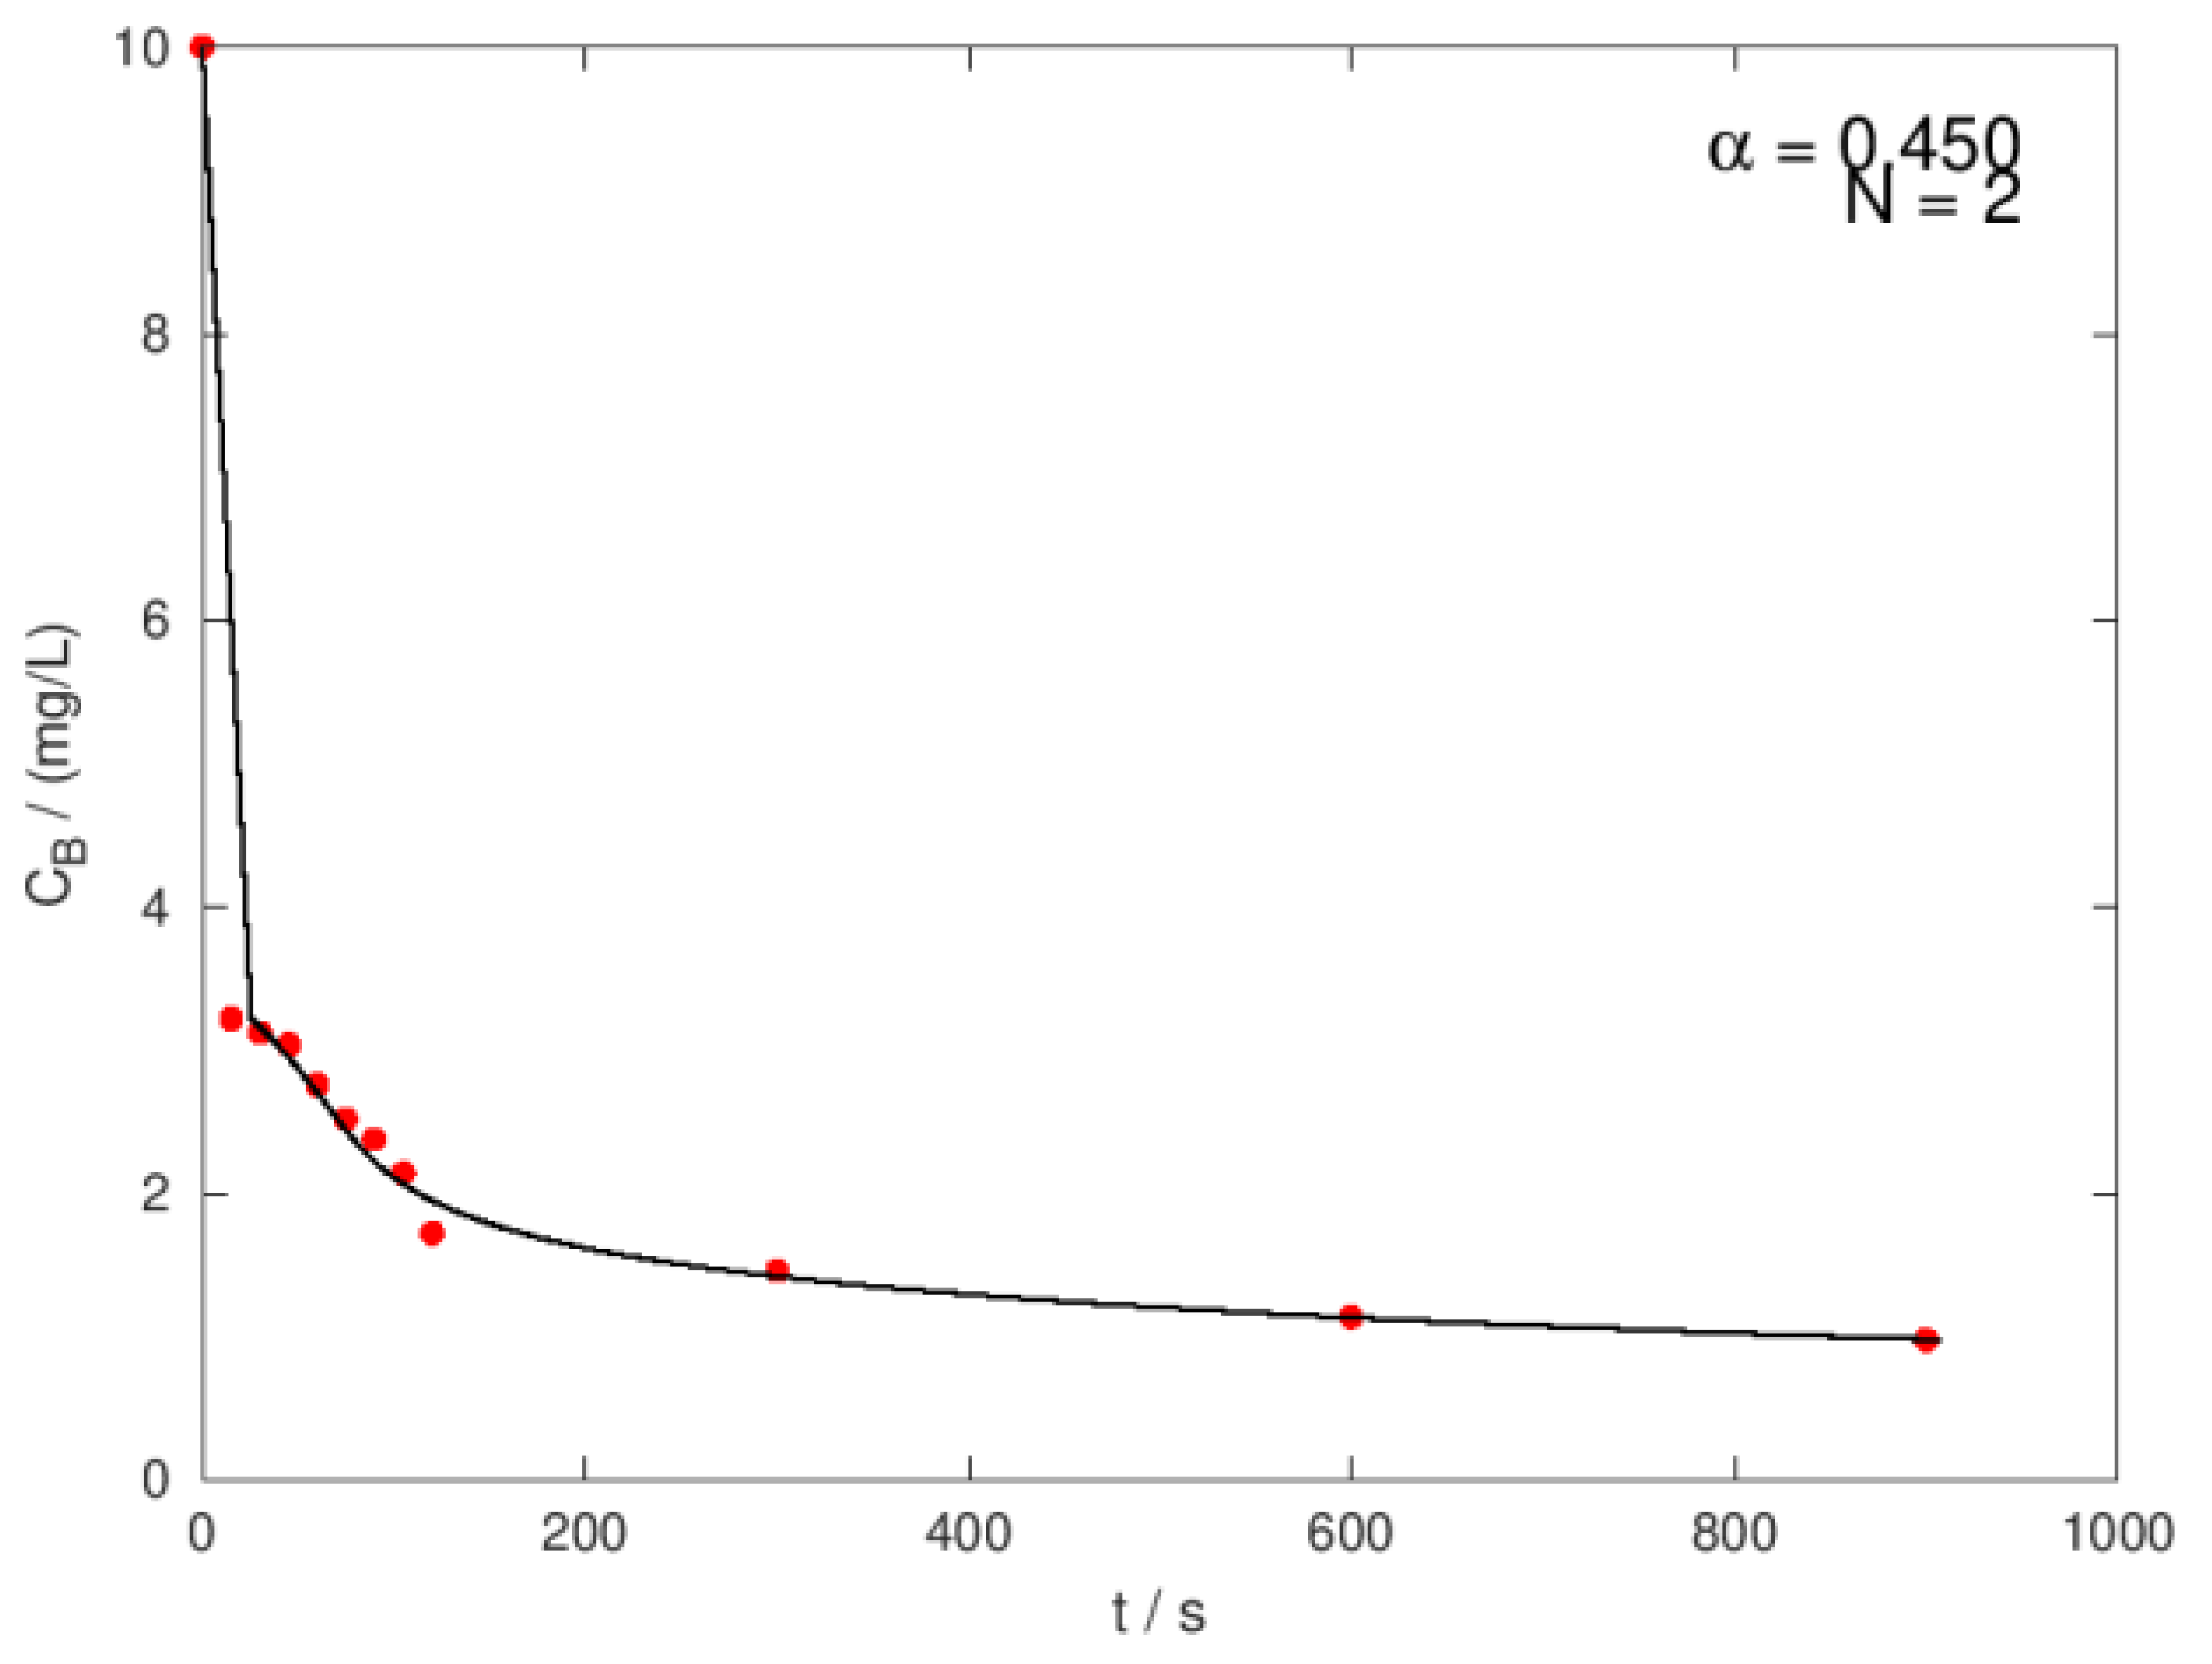
Figure 11.
Experimental and calculated kinetic curve for BB decay at pH = 7, initial chromophore concentration 5 mg/L and gas-phase ozone concentration 150 mg/L, full time range.
Figure 11.
Experimental and calculated kinetic curve for BB decay at pH = 7, initial chromophore concentration 5 mg/L and gas-phase ozone concentration 150 mg/L, full time range.
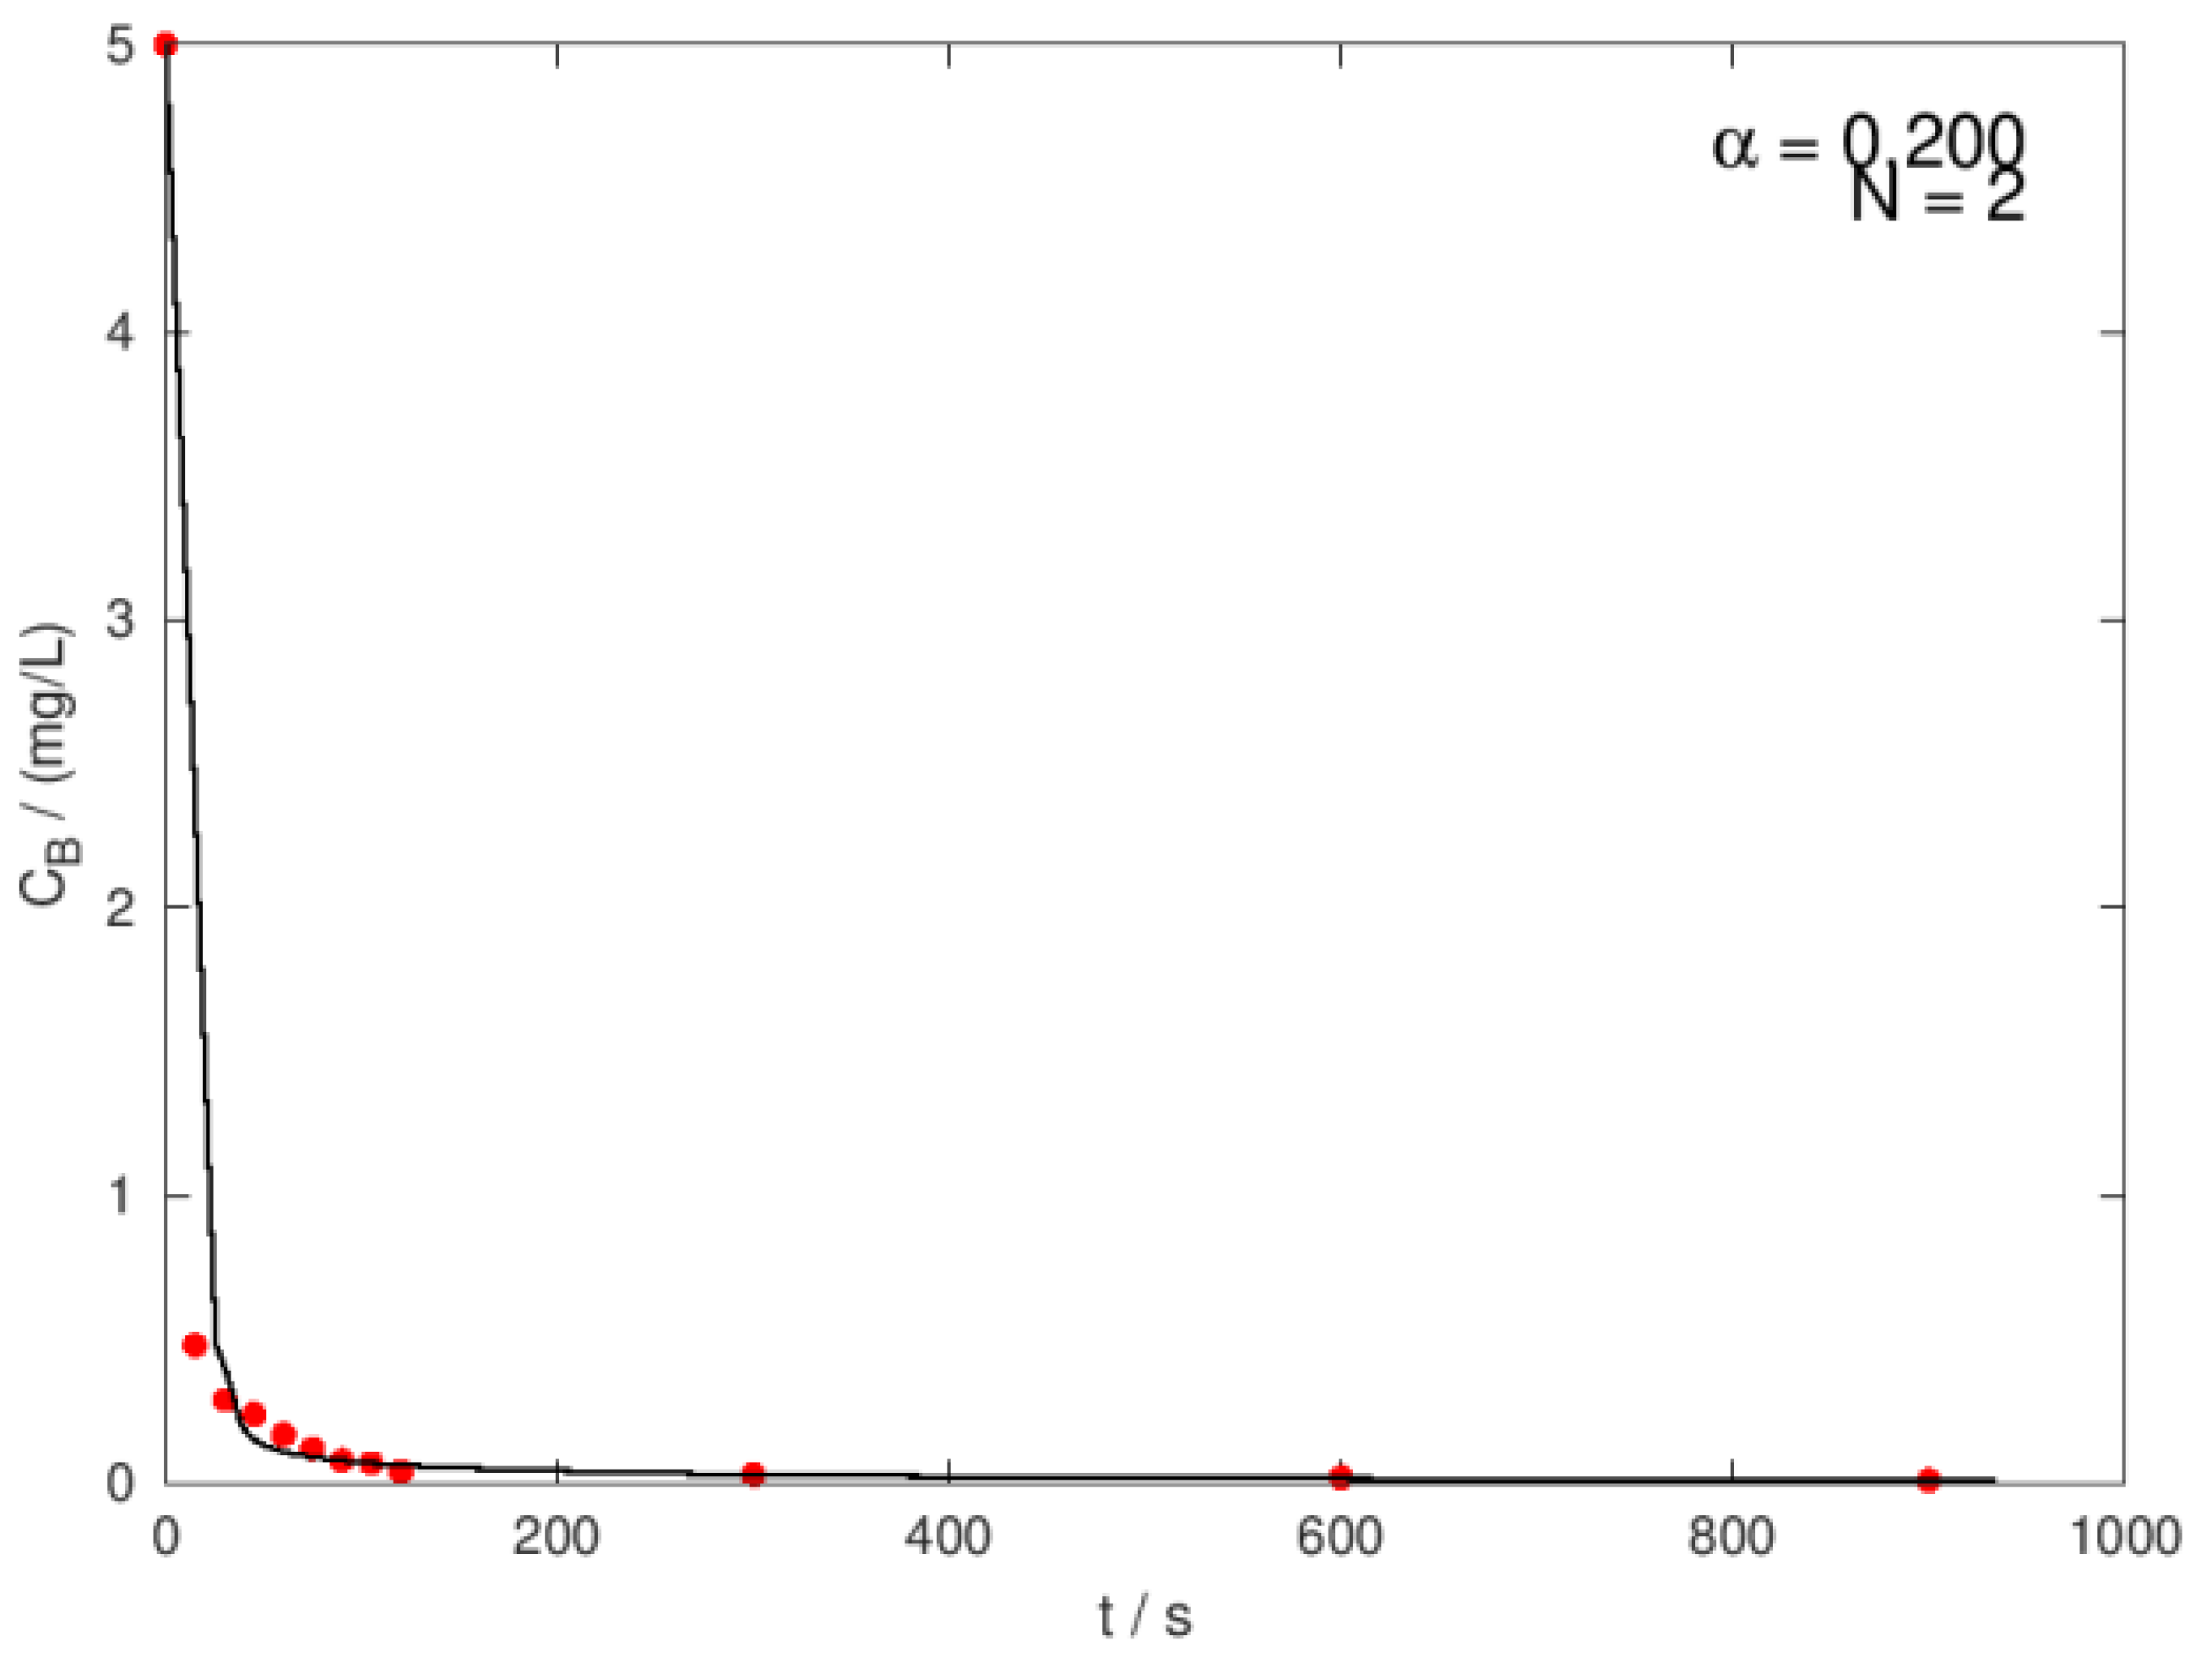

Table 1.
Kinetic parameters calculated for reaction order via integral method, at different O3 concentrations and pH values, CiBB= 5mg/L.
Table 1.
Kinetic parameters calculated for reaction order via integral method, at different O3 concentrations and pH values, CiBB= 5mg/L.
| Ci,O3 mg/L |
N | pH = 4 | pH = 7 | pH = 10 | |||||||||
| k, min-1 | R2 | k, min-1 | R2 | k, min-1 | R2 | ||||||||
| * | ** | * | ** | * | ** | * | ** | * | ** | * | ** | ||
| 100 | 1 | -3,14 | -3,65 | 0,93 | 0,89 | -0,25 | 0,35 | 0,78 | 0,90 | -2,77 | -5,70 | 1 | 0,86 |
| 2 | 89,18 | 63,16 | 0,76 | 0,57 | 6,24 | 3,29 | 0,97 | 0,98 | 115 | 119,98 | 0,92 | 0,64 | |
| 150 | 1 | -2,34 | -3,76 | 0,97 | 0,87 | -0,22 | 0,31 | 0,73 | 0,88 | -1,94 | -4,31 | 0,89 | 0,91 |
| 2 | 86,19 | 90,13 | 0,91 | 0,71 | 6,08 | 3,97 | 0,96 | 0,94 | 110 | 4,32 | 0,90 | 0,91 | |
| 200 | 1 | -0,79 | -2,00 | 0,43 | 0,57 | 0,07 | 0,14 | 0,16 | 0,24 | -6 x 10-15 | -6 x 10-15 | N/A | N/A |
| 2 | 0,79 | 2,00 | 0,43 | 0,57 | 3,20 | 8,21 | 0,17 | 0,27 | 0 | -6 x 10-15 | N/A | N/A | |
| 250 | 1 | -0,40 | -1,19 | 0,43 | 0,43 | -0,03 | 0,09 | 0,17 | 0,16 | -6 x 10-15 | -6 x 10-15 | N/A | N/A |
| 2 | 28,57 | 50,00 | 0,43 | 0,43 | 2,04 | 3,55 | 0,17 | 0,17 | 0 | -6 x 10-15 | N/A | N/A | |
*with stirring, **without stirring.
Disclaimer/Publisher’s Note: The statements, opinions and data contained in all publications are solely those of the individual author(s) and contributor(s) and not of MDPI and/or the editor(s). MDPI and/or the editor(s) disclaim responsibility for any injury to people or property resulting from any ideas, methods, instructions or products referred to in the content. |
© 2024 by the authors. Licensee MDPI, Basel, Switzerland. This article is an open access article distributed under the terms and conditions of the Creative Commons Attribution (CC BY) license (http://creativecommons.org/licenses/by/4.0/).
Copyright: This open access article is published under a Creative Commons CC BY 4.0 license, which permit the free download, distribution, and reuse, provided that the author and preprint are cited in any reuse.


