Submitted:
12 September 2024
Posted:
14 September 2024
You are already at the latest version
Abstract
The objective of this research is to show the family farms as an energy consumers and producers from renewable sources. It is a possibility for them to reduce operating costs. Time scope of the study covers the period 2014-2022. The data source is the Farm Accountancy Data Network. On the basis of the value of energy output and energy costs the rankings were prepared. After the ranks were awarded, the strong position of the Netherlands and Germany was indicated. It has been shown that the production and consumption of energy depend on the economic size of the farm, and do not depend on the type of production. As such, panel models were built for energy output and costs. The determinants that affect them were indicated. Energy output depends on total inputs – the higher they are, the higher the output. The energy costs are related to utilized agricultural area, total output and family farm income. The results obtained are discussed within the framework of recommendations of the European Commission.
Keywords:
energy cost
; energy output
; European Union
; family farm
; renewable sources
1. Introduction
The interconnected nature of energy and food systems makes a joint approach necessary to achieve the Sustainable Development Goals and the Paris Agreement on Climate Change. The transition towards a renewables-based energy system will be incomplete without considering energy use in the agri-food sector and the provision of sustainable bioenergy [1]. Many different forms of renewable energy are produced in rural areas. They come from wind, solar and geothermal sources and different forms of bioenergy. Also they bring employment and economic development to rural regions, replace fossil fuels and contribute to energy security [2,3,4]. It is an important alternative to current mining-based economy and can be seen as the next wave in economic development. It will bring opportunities for innovation, jobs and growth and contribute to the reindustrialization of Europe [5,6]. It worth to underlined that the solar radiation, tides, winds and hydroelectricity are perpetual resources are in no danger of long-term availability. In contrast to some natural renewable resources such as geothermal power, fresh water, timber and biomass, which must be carefully managed to avoid exceeding the environment’s capacity to replenish them [7].
It is well known that we live in a world of limited resources. Global challenges such as: climate change, land and ecosystem degradation, coupled with a growing population, force us to seek new ways of producing and consuming that would respect the ecological boundaries of our planet. These challenges enforce farmers to make improvements and innovations of the food, products and materials production and consumption [8]. This is directly reflected in the approach to energy production and consumption.
The intensive economic development of the last decades and years has been accompanied by considerable energy use worldwide. For most countries, especially developing and emerging countries, greenhouse gas emissions have increased significantly. This has exacerbated the problems of global climate change, environmental pollution, and energy security [9]. An important role was played by high and fluctuating energy costs, which have caused economic challenges for many of the country’s farmers. For this reason, more producers are seeking alternative energy sources to improve their energy independence and revenue. As more innovative farmers seek ways to reduce energy use and increase agricultural efficiency. So they are turning to renewable energy sources and sustainably produced biofuels [10]. The forms of renewable energy include solar energy, wind and water power, oil from plants, wood from sustainable sources, other forms of biomass (plant material) and biogas which is a gas produced from fermentation of manure and crop residues [11]. There are a variety of alternative energy options available to farmers. Framers are encouraged to remain aware of new developments and, from time-to-time, reevaluate their own energy consumption patterns [12].
Each step of the agri-food system requires diverse energy services that vary significantly depending on value chains’ structure, nature, and depth. The decentralized nature of renewable energy solutions makes them apt for meeting the energy needs in an environmentally-sustainable, affordable and secure manner. The socio-economic dividends can be significant particularly for the hundreds of millions of people deriving subsistence and livelihoods from agriculture and facing increased uncertainty from climate impacts [1].
It is worth noting that the topics of renewable energy sources as part of the introduced bioeconomy have been familiar with the EU regulations for many years. They emphasize that Europe needs to change radically its approach to production, consumption, processing, storage, recycling and disposal of biological resources [13,14]. This new model of development approach to come combines scientific research and innovation, including a wide range of disciplines, such as agronomy, ecology, food processing, engineering, biotechnology and chemistry, genetics, economics and the social sciences [15]. Many documents also share some common concepts, such as the chain approach, sustainability, bio refining, research and innovation, and societal transition towards sustainability, f. ex.: the Seventh Environment Action Programme (7th EAP), the Report Transforming Our World: the United Nations 2030 Agenda for Sustainable Development, the New Innovation Agenda of the European Union, the Bioeconomy Strategy of the EU (2013) and the Circular Economy Action Plan (first version in 2015, in 2019 the EC adopted a comprehensive report on the implementation of the action plan) [16,17,18,19,20].
All that processes with use natural resources and energy more efficiently, is a huge challenge [21,22]. It seems that rural areas will be particularly interested in the development of those conceptions, as well as areas valuable due to their natural values and peripheral areas. The implementation of its assumptions will transform the economies of rural regions and their social structure. Even now the agricultural sector plays a special environmental role due its direct impact on ecosystems, food safety and on the condition of rural areas [23,24].
It should be emphasized that today, Europe's transition to an oil-independent economy is not just one possibility, but an urgent necessity. Change should be driven by scientific research, innovation and large and small scale investment. And this is where farms can play an important role, because they are an important link in the agricultural production sector between tradition and modern instruments of the Common Agricultural Policy. These farms are engaged in the production of agricultural products, providing at the same time rural areas with a chance for multidirectional development. It seems that the first step may be to produce energy ourselves and control its consumption costs.
Taking abovementioned discussion into consideration, the main aim of this research is to show the family farms as an energy consumers and producers from renewable sources, because it creates for them a possibility to reduce operating costs, gain greater independence and innovative.
2. Materials and Methods
Research is based on the downloaded data from the database Farm Accountancy Data Network (FADN). The FADN data provides a detailed presentation and analysis of the main determinants of the farms’ production, economic and financial situations from the EU countries in the years 2014-2022. This time range was chosen because it is only since 2014 that data on energy production by farms have been visible. Currently (as of August 30, 2024), the database does not contain complete data for 2024 – there is no information about 5 countries: Croatia, Germany, Greece, Slovenia and Spain. Also in this research, the data for the United Kingdom is excluded.
The study sought to answer the following questions:
- How much did the European family farm earn money on energy output and spend on energy costs between the years 2014 and 2022 and what were at the same time its area, total output, costs and family farm income?
- In which European country do family farms have the highest average energy production and are they also affected by the highest energy costs?
- Does the energy output and costs of farms depending on their economic size or type of production?
- Which categories (f. ex.: area, assets, cash flow, equity, income, investment, labour, liabilities, output, taxes) interact with energy output and energy costs?
To answer questions 1-3, the FADN average data are analyzed. In order to answer to question 4 panel models using the Gretl program are estimated on the basis on 1 094 individual observations from FADN.
The general formulation of a panel data model is expressed by the equation [25]:
yi,t = αi + X’i,t β + ui,t +εi,t
with:
- -
- i (i = 1, ..., N) as individuals,
- -
- t (t = 1, ..., T) as time periods,
- -
- -X’i,t as the observation of K explanatory variables in country i and time t,
- -
- αi as parameter which is time invariant and accounts for any individual-specific effect not included in the regression equation.
Two different basic models may be distinguished on the basis of two different interpretations given to the αi. We can estimated Fixed Effect Panel Data Model (FEM) and Random Effect Panel Data Model (REM) [26].
Deciding which type of panel model to choose is difficult, because several premises must be taken into account. They are statistical and substantive. We should be careful and not be guided only by the results of significance tests.
First in order to choose between Random and Fixed Effect Model, the Hausman test is used. The idea is that one uses the random effects estimates unless the Hausman test rejects. In practice, a failure to reject means either that the RE and FE estimates are sufficiently close so that it does not matter which one is used, or the sampling variation is so large in the FE estimates that one cannot conclude practically significant differences are statistically significant [27]. We can conclude that other characteristics of the test sample should also have the influence on choice between these models. The estimator in FE model may not be compatible for short panel time series, but the FE model appears to be more appropriate if the analysis objects are not selected randomly and it is important to estimate individual effects for each objects [28].
Now the construction of the database itself from which the observations are derived must be taken into account. The FADN data is not the original data. It is the aggregated average information calculated on the basis of 15 farms with the obligation of data secrecy applied. This approach makes it impossible to identify individual information about a specific farm.
Taking into account all the premises it was decided to estimate the FE models, i.e. models with fixed effects. This decision was supported by the Hausman test was used and showed.
3. Results
In the analyzed period in the European Union, the average farm’s output was between EUR 70.0 thousand in 2014 and EUR 129.3 thousand in 2022. And during this time, their area has only increased from 31.2 to 40.4 hectares. Energy output was in the range of EUR 1 442-2 990, not exceeding 2.5% of total output. Meanwhile the farms’ inputs were between EUR 60.1 thousand and EUR 104.3 thousand at the same time. Energy costs were in the range of EUR 4 387-8 869, counting for 6.8% to 8.5% of total inputs. . The ratio of energy output to its costs in the analyzed period ranged from 29.2% to 36.4%, and on average it was 33.7%. It should only be added that family farm income increased from EUR 17.1 to 41.2 in 2014-2022 (Table 1, Figure 1). It can therefore be concluded that the production and financial situation of farms improved during the period considered despite rising costs, including energy. In addition, we should look at the relationship between energy output and its costs – production is growing slowly, and costs are increasing by leaps and bounds (Figure 2).
To highlight the countries with the highest energy output and costs, the rankings of farms is prepared according to the country in 2021, because for 2022 there is no information about 5 countries (Table 2). It was recognized that since the ratio of energy output to its costs is constant, the countries with the highest costs should also have the highest production. Checking this assumption was the guiding principle behind the creation of 4 rankings. The first concerned the total energy costs of the farm. In the second ranking they were also converted per hectare. The third and fourth ranking was made to show the energy output of the farm and its value converted per hectare. The countries are in descending order. Position in the ranking was considered as a rank. The ranks were added up and the average was calculated.
The Netherlands and Germany stand out in the ranking as countries with high energy output and costs in absolute terms (per farm) and relative terms (per hectare). It was decided to devote special attention to them in further research. The next places in the rankings were taken by Belgium and Denmark (ex aequo), followed by the Czech Republic, Hungary, Luxembourg, Slovakia and Sweden. Low results in four rankings were achieved by farms from countries such as: Croatia, Bulgaria, Poland, Spain, Lithuania, Ireland, Portugal and Romania (Table 2).
Economic size (which is one of the criteria used to classify agricultural farms according to the community typology, measured as the total Standard Output of the farm in euro for a reference period of 5 successive years) had an impact on the values studied. The larger the farm, the greater its interest in energy output, because energy costs were also increasing. In addition, the larger the farm, the more energy output covered its costs, i.e. it can be considered more energy-efficient. On the other hand, the smallest farms had a minimum capacity to produce energy, although they had a noticeable burden of its costs (Table 3).
In the case of the Netherlands and Germany, small and very small farms are not calculated, but the largest farms were also the most energy efficient. Medium-low farms were also distinguished as being on a par with the relative achievements of the largest ones, although their output and energy costs were absolutely much lower (Table 3).
It can be clearly stated that the economic size of farm had an impact on the issues studied. It is now necessary to check whether the type of production of the farm also affects output and energy costs.
For the type of production, inference is difficult. It was not possible to find that plant or animal production was more energy efficient or produced more energy or had higher energy costs. Any conclusions were later refuted by the data of the Netherlands and Germany (Table 4). In view of the inconclusive results, it was concluded that this issue would require separate research at a later date.
In order to fulfil the main target of research, forward stepwise variable selection is introduced. As independent variables in the built models, basic information about farms was used. They concerned their production and financial situation. The set of dependent and independent variables included:
- Y01 – Energy Output,
- Y02 – Energy Costs,
- X01 – Labour Input,
- X02 – Utilized Agricultural Area,
- X03 – Total Output,
- X04 – Total Inputs,
- X05 – Taxes,
- X06 – Family Farm Income,
- X07 – Assets,
- X08 – Liabilities,
- X09 – Gross Investment,
- X10 – Net Investment,
- X11 – Cash Flow,
- X12 – Balance Current Subsidies and Taxes.
Therefore, models were built where the dependent variable was energy output and models with the dependent variable were energy costs. Using the Gretl Program, the FE Models are obtained (Table 5). In some cases, the Hausman test suggested the use of REM models. However, because FEM models were close and they are dedicated to purposeful databases, only FEM models were shown here without harming the final results. In the estimated models all variables are characterized by level of significance below 0.05.
When the dependent variable was energy output, it turned out that it was not affected at all: labour input, net investment, cash flow and balance current subsidies and taxes. The most important determinant turned out to be total inputs – the larger they are, the higher the energy output will be, regardless of the economic size of the farm. It is difficult to determine what factors affect individual economic size classes, because they seem to be unstable and are unlikely to recur. One can only be tempted to say that if taxes increase, energy output will fall (on the example of medium-sized farms from classes 3 and 4). If utilized agricultural area, family farm income and assets increase, the farms will be less interested in energy production (some classes 3-6). This may indicate that when they have conditions for agricultural and economic development, which generates an inflow of money, they care less about energy security. It can also be stated that in some classes of farms’ economic size, the increase in total output and gross investment had an positive effect on energy output, but the increase in liabilities had a negative one (Table 5). In addition, a statistically weak model was created in class 1 (Table 5). All these arguments suggest that energy output is also influenced by factors beyond production, economic or financial. These can be, for example, fashion, the desire to be more modern, independent or environmentally friendly, or curiosity about how it works in practice.
In models with a dependent variable, which is energy costs, it turned out that they do not depend at all on: labour input, total inputs, taxes, assets, gross investment and net investment. Instead, they are closely related to utilized agricultural area, total output and family farm income, regardless of the economic size class of farm. The greater the area and total output, the higher the energy costs. The higher the income, the lower the energy costs – which can be explained by the fact that family farm income is not only the result of economic activity, but also includes farm income outside agricultural production. For the smallest farms, the balance current subsidies and taxes was also important, for large ones liabilities, and for the very large cash flow (Table 5).
Summing up this part of the research, it can be concluded that energy output and costs increased from year to year in the Europe, but production covers only one third of the demand. The largest farms with a significant income from agricultural production, are able to invest in energy output, but also they have the highest costs, including energy costs. This phenomenon occurred in farms in the Netherlands, Germany, Belgium, Denmark, the Czech Republic, Hungary, Luxembourg, Slovakia and Sweden. The lowest results in energy output and energy costs were achieved by farms from countries such as: Croatia, Bulgaria, Poland, Spain, Lithuania, Ireland, Portugal and Romania.
When energy costs unexpectedly increase, these dependencies gain a great importance. Nowadays, particular attention should be paid to these results in the context of rising energy prices.
5. Discussion
In the theory farmers can produce their own energy to become even more self-sufficient by reducing external inputs. The research showed here what is the distance between the actual costs of energy and revenues from its production.
We all know that a modern agriculture requires much greater energy input than conventional agriculture, which heavily depends on fossil fuels for drying grain, manufacturing fertilizers, driving machinery, and generating electricity used for heating and lighting purposes. It should be emphasized that the climate change and its impact can be alleviated by promoting renewable energy in agricultural applications. Nevertheless, transforming from a non-renewable energy-based system to a renewable-based agriculture system imposes several challenges. Renewable energy transition should be immediate and orderly, and requires incentive-based policies for both: lower income and higher income countries [29].
The production of clean and affordable energy on European farms is central to the energy transition that is taking place on the European continent. Nevertheless, the wide variety of available technologies, business models and regulations often introduce a high degree of complexity in the decision-making process to introduce and promote on farm renewable energy sources. It also creates difficulties in the design and assessment of policies to promote it. The regulatory and legal framework is not always aligned with the potential and characteristics of on-farm renewable energy sources. It is mainly developed to deal with a centralized utility-based model for producing and distributing energy. We must notice that it is not always easy to identify where the barriers lie [30].
Despite the stark differences in energy use between regions and the level of development of agri-food systems, renewable energy applications find relevance in most contexts requiring tailored policy, technology, financing and delivery model solutions. Through cross-sector partnerships, action and investments can be mobilized at scale to effectively address the renewable energy opportunity in the agri-food sector, while maintaining a key focus on sustainability aspects. Governments and local stakeholder engagement will be crucial to bridge the gaps in understanding the needs, creating market linkages and delivering capacity and financing within a broader food systems transformation strategy that includes renewables as a key pillar [1].
The only realistic solution to the problem go non-renewable is to find sources of renewable energy to replace today’s dwindling supplies of affordable and usable fossil energy. Solar energy is the only source of truly renewable energy – renewable at least for the next few billion years. Windmills, falling water, solar collectors, and photovoltaic cells are all sources of renewable solar energy. The most common solar energy collectors are green plants. After all, plants were the original collectors of today’s fossil energy. So, it’s only logical to look to agriculture as a renewable source of alternative energy for the future. However, we need to be realistic about the extent to which energy from agriculture can replace our current use of fossil energy. While the energy experts may not agree on specific quantities or percentages, the overall limits on energy from agriculture are fairly basic and straightforward [31].
The European Commission recognizes the importance of these attempts. Offers specific financial support within the framework of the Common Agricultural Policy and the Europe 2020 Strategy. When considering the importance of this issue, the Commission's Horizon 2020 research program takes into account the need to increase public funding for research and innovation. The EUR 4.5 billion has been earmarked for actions under the challenge “Food Security, Sustainable Agriculture and Forestry, Marine and Maritime and Inland Water Research and the Bioeconomy”, and complementary funding is foreseen in other areas of Horizon 2020 [32]. Part of these funds will also support the development of farms. It is possible to improve their economic situation, including small ones.
The European Economic Community countries could play a special role in focusing green investments. The processing sectors, including food and feed, still lag behind. The economies are between the low or moderate innovators, and substantial progress depends on their modernization. The global challenges do require new priorities on modernization, which is implemented with the help of new funding mechanisms. The new projects in these countries could provide unique opportunities for progress if the countries focus their investments [33]. It creates a high attractiveness as a potential solution for green growth and competitiveness and a great opportunity to revitalize productivity and growth by improving the competitiveness of domestic industries through new technologies. Also it can help reducing dependence on imported raw materials by rehabilitating marginalized areas [34,35,36].
The recognition of the full potential of these changes in terms of the research and innovation for the economy and society, it has been promoted over the last twenty years by the Netherlands, Germany, and Finland - pioneering countries [37]. The results of this study confirmed the important role of these countries.
Today more than 50 countries have a strategy or related policies dedicated to these changes [38]. The countries are formulating strategies in accordance with their goals to attain a bio economic development, so proper measurement, monitoring, and reporting of the outcomes of these strategies are crucial for long-term success [39]. As the priority fields of these strategies “lose” their ecological focus and acquire a social, and at the same time capitalist, vision, priorities now focus on economic growth, gross value added, entrepreneurship, competitiveness, employment, and technology development [40].
The burden of the introduced changes falls on individual entities. In many cases it requires a strong modification of their current business models, start-ups and new ventures. Firms need to completely rethink their value proposition, modifying how the product or service is produced, delivered to the customers and disposed of [41]. As this study has shown, not all farms are able to satisfactorily introduce solutions to increase energy output. Over the 11 years studied, energy production increased, but it was followed by rising costs of energy consumption. So in absolute numbers, the improvement is noticeable, but relatively little has changed.
These thoughts are confirmed by other researchers. Still, we are not seeing widespread adoption of circular business models based on remanufacturing and reuse promise significant cost savings as well as radical reductions in environmental impact in industry [42]. The entrepreneurs saw their contribution to sustainable development primarily in the generation of new knowledge and employment, not necessary in the ecological or social motives [43]. In a future new business models are needed. After a phase of excitement and inspiration, an operationalization phase needs to start to ensure the best possible implementation and transition towards a circular economy. The significantly lower the negative impact on the environment, reducing waste and resource pressures and creating a positive impact on society and environment are expected [44].
It probably takes many more years and many political and economic solutions to change the facts. The changes observed in farms require further support and popularization. They should be addressed to smaller entities from regions where the introduction of renewable energy sources is progressing slower than in the leaders.
6. Conclusions
Year by year the concept of renewable energy, it becomes the subject of not only more interest, but also the addressee of specific political and economic solutions. This is an important solution for the future of the agricultural sector and improving its competitiveness. If it is assumed that the introduction of possibility of energy production is an opportunity to improve the economic conditions for agricultural farms. This paper assumes that farms from the European Union have the potential to implement these modern solutions.
At the beginning, four questions were asked, with the wording:
- How much did the European family farm earn money on energy output and spend on energy costs between the years 2014 and 2022 and what were at the same time its area, total output, costs and family farm income?
- In which European country do family farms have the highest average energy production and are they also affected by the highest energy costs?
- Does the energy output and costs of farms depending on their economic size or type of production?
- Which categories (f. ex.: area, assets, cash flow, equity, income, investment, labour, liabilities, output, taxes) interact with energy output and energy costs?
To answer the first question, it should be stated that in the analyzed period energy production covered only 1/3 of its costs. Both of these categories increased year by year, but at a similar pace. These increases were accompanied by an increase in utilized agricultural area, family farm income and, of course, total output and total inputs. Thus, the financial situation of farms was improving, but there were no particularly outstanding data on energy output itself.
After the second question, four rankings were made. They were given the rank and showed the selection of countries with the highest energy output and costs in relative and absolute terms. The leaders are the Netherlands and Germany, followed by Belgium and Denmark (ex aequo), the Czech Republic, Hungary, Luxembourg, Slovakia and Sweden.
The answer to the third question is not entirely satisfactory. The economic size of the farm had an impact on the values studied. The larger the farm, the greater its interest in energy output, because energy costs were also increasing. In addition, the larger the farm, the more energy output covered its costs. The smallest farms had a minimum capacity to produce energy, although they had a noticeable burden of its costs. But the impact of the type of production of farm was difficult to grasp and describe. This issue requires further research, because it wasn’t possible to find that plant or animal production had higher energy output or costs.
The answer to the fourth question brought interesting conclusions. The most important determinant of energy output were the total inputs. Depending on the economic size of the farm, was difficult to determine what factors affect, because the results seem to be unstable and are unlikely to recur. The taxes (classes 3 and 4) and the utilized agricultural area, family farm income and assets (some classes 3-6) were important. It can also be stated that in some classes of farms’ economic size, the total output, gross investment and liabilities were important. These results suggest that energy output is also influenced by factors beyond production, economic or financial, such as (f. ex.): fashion, the desire to be more modern, independent or environmentally friendly, or curiosity about how it works in practice. The energy costs are related to utilized agricultural area, total output and family farm income. The balance current subsidies and taxes (class 1), liabilities (class 5) and cash flow (class 6) were important for energy costs. Some variables turned out to be completely irrelevant. For the energy output were: labour input, net investment, cash flow and balance current subsidies and taxes. For the energy costs were: labour input, total inputs, taxes, assets, gross investment and net investment.
The research presented here requires further observation. It would be worth checking whether the observed trends continue in the coming years. For the time being, complete data for 2022 are not available, but it is worth monitoring this situation for countries that have already completed the data.
Author Contributions
Not applicable.
Funding
This research received no external funding.
Data Availability Statement
FADN – Farm Accountancy Data Network (Public Database) at https://agridata.ec.europa.eu/extensions/FADNPublicDatabase/FADNPublicDatabase.html, (accessed on 30 August 2024).
Acknowledgments
Not applicable.
Conflicts of Interest
The author declare no conflict of interest.
References
- IRENA-FAO. Renewable energy for agri-food systems. Towards the Sustainable Development Goals and the Paris Agreement. IREA and FAO: Abu Dhabi and Rome, United Arab Emirates and Italy, 2021. [CrossRef]
- EIP-AGRI. Renewable energy on the farm, 2019. https://ec.europa.eu/eip/agriculture/sites/default/files/eip-agri_factsheet_renewable_energy_on_the_farm_2019_en.pdf (accessed on 29 August 2024).
- EuropaBio – The European Association for Bioindustries. Industrial Biotechnology: Enabling the Development of the Bioeconomy. 2022. Available online: https://www.europabio.org/wp-content/uploads/2021/10/5.-Industrial-Biotechnology-Enabling-the-Development-of-the-Bioeconomy.pdf (accessed on 1 September 2024).
- EuropaBio – The European Association for Bioindustries. Reducing Greenhouse Gas Emissions with the Bioeconomy. 2022. Available online: https://www.europabio.org/wp-content/uploads/2021/10/6.-Reducing-Greenhouse-Gas-Emissions-with-the-Bioeconomy.pdf (accessed on 1 September 2024).
- European Commission, What is the bioeconomy? (last updated: 17.02.2016), 2016, https://ec.europa.eu/research/bioeconomy/index.cfm (accessed on 1 February 2016).
- Vivien, F.-D.; Nieddu, M.; Befort, N.; Debref, R.; Giampietro, M. The hijacking of the bioeconomy. Ecological Economics 2019, 159, pp. 189–197, . [CrossRef]
- Kaushik, Ch. Renewable energy for sustainable agriculture. Agronomy for Sustainable Development 2011, 31 (1), pp. 91-118. [CrossRef]
- European Commission, Directorate-General for Research and Innovation, A Sustainable Bioeconomy for Europe: Strengthening the Connection between Economy, Society and the Environment: Updated Bioeconomy Strategy, Publications Office, 2018. [CrossRef]
- Pestisha, A.; Gabnai, Z.; Chalgynbayeva, A.; Lengyel, P.; Bai, A. On-Farm Renewable Energy Systems: A Systematic Review. Energies 2023, 16, 862. [CrossRef]
- SARE – Sustainable Agriculture Research and Education. Sustainable Production and Use of On-Farm Energy, 2017. https://www.sare.org/resources/sustainable-production-and-use-of-on-farm-energy/ (accessed on 29 August 2024).
- ACP-EU Technical Centre for Agricultural and Rural Co-operation. Renewable Energy in Agriculture, Rural Radio Resource Pack 2008, 3; Wageningen, The Netherlands: CTA. https://cgspace.cgiar.org/server/api/core/bitstreams/9f0cec5e-e3fb-44ad-91c3-c3c5a5108509/content (accessed on 29 August 2024).
- Both, A. J. Correction to: On-Farm Energy Production: Solar, Wind, Geothermal. In Regional Perspectives on Farm Energy; Ciolkosz, D., Eds.; Springer: Cham, Switzerland, 2022; pp. 95-105. [CrossRef]
- OECD. The Bioeconomy to 2030: Designing a Policy Agenda; OECD Publishing: Paris, France, 2009, . [CrossRef]
- European Commission, Directorate-General for Research and Innovation, Innovating for Sustainable Growth: a Bioeconomy for Europe, Publications Office, 2012, Available online: http://ec.europa.eu/research/bioeconomy/pdf/201202_innovating_sustainable_growth_en.pdf (accessed on 1 September 2024).
- European Commission, Directorate-General for Research and Innovation, A Bioeconomy Strategy for Europe: Working with Nature for a More Sustainable Way of Living, Publications Office, 2013, . [CrossRef]
- 7th Environment Action Programme, Decision No 1386/2013/EU of the European Parliament and of the Council of 20 November 2013 on a General Union Environment Action Programme to 2020 “Living well, within the limits of our planet”, Official Journal of the European Union L 354/171, 28.12.2013. Available online: http://eur-lex.europa.eu/legal-content/EN/TXT/?uri=CELEX:32013D1386 (accessed on 1 September 2024).
- EEA Report, The Circular Economy and the Bioeconomy. Partners in Sustainability, 02/2018, Available online: https://www.eea.europa.eu/publications/circular-economy-and-bioeconomy (accessed on 1 September 2024).
- European Commission, Communication from the Commission to the European Parliament, the Council, the European Economic and Social Committee and the Committee of the Regions: a New European Innovation Agenda, COM(2022) 332 final, 5.7.2022. Available online: https://eur-lex.europa.eu/legal-content/EN/TXT/PDF/?uri=CELEX:52022DC0332&from=EN (accessed on 1 September 2024).
- United Nations, Transforming our world: the 2030 Agenda for Sustainable Development. Resolution adopted by the General Assembly on 25 September 2015, General Assembly UN, 2015, Available online: https://documents-dds-ny.un.org/doc/UNDOC/GEN/N15/291/89/PDF/N1529189.pdf?OpenElement (accessed on 2 September 2024).
- European Commission, Report from the Commission to the European Parliament, the Council, the European Economic and Social Committee and the Committee of the Regions on the Implementation of the Circular Economy Action Plan, COM (2019) 190 final, 4.3.2019. Available online: https://eur-lex.europa.eu/legal-content/EN/TXT/PDF/?uri=CELEX:52019DC0190 &from=EN (accessed on 2 September 2024).
- EuropaBio – The European Association for Bioindustries. Buying into Biobased. Benefiting Consumers Now and for the Future. 2022. Available online: https://www.europabio.org/wp-content/uploads/2021/10/4.-Buying-into-Biobased-Benefiting-Consumers-Now-and-for-the-Future.pdf (accessed on 1 September 2024).
- EuropaBio – The European Association for Bioindustries. Bioeconomy: Circular by Nature. 2022. Available online: https://www.europabio.org/wp-content/uploads/2021/10/2.-Bioeconomy-Circular-by-Nature.pdf (accessed on 1 September 2024).
- Komor, A. Specjalizacje regionalne w zakresie biogospodarki w Polsce w układzie wojewódzkim. Roczniki Naukowe SERiA 2014, XVI, 6, pp. 248-253.
- Brzezina, N.; Biely, K.; Helfgott, A.; Kopainsky, B.; Vervoort, J.; Mathijs, E. Development of organic farming in Europe at thecrossroads: Looking for the way forward through system archetypes lenses. Sustainability 2017, 9, 821. [CrossRef]
- Baltagi, B. H. Econometric analysis of panel data. 3rd ed.; John Wiley & Sons Ltd.: Chichester, United Kingdom, 2005; pp. 11-12.
- Arbia, G.; Piras. G. Convergence in per-capita GDP across European regions using panel data models extended to spatial autocorrelation effects. Istituto di Studi e Analisi Economica, Working Paper 51, 2005. [CrossRef]
- Wooldridge, J. M. Introductory econometrics. A modern approach. 5th ed. South-Western Cengage Learning: Mason, United States; 2013, pp. 495-496.
- Dańska-Borsiak, B. Dynamiczne modele panelowe w badaniach ekonomicznych. Wydawnictwo Uniwersytetu Łódzkiego: Łódź, Poland, 2011; pp. 29-32.
- Rahman, Md M., Khan, I., Field, D. L., Techato, K., Alameh, K. Powering agriculture: Present status, future potential, and challenges of renewable energy applications. Renewable Energy 2022, 188, pp. 731-749, . [CrossRef]
- EIP-AGRI, Minipaper: Business Models and Financial Alternatives for On-Farm Renewable Energy Projects, 2018. https://ec.europa.eu/eip/agriculture/sites/default/files/fg28_mp_businessmodels_2018_en.pdf (accessed on 29 August 2024).
- Ali, S. M., Dash, N., Pradhan, A. Role of Renewable Energy on Agriculture. International Journal of Engineering Sciences Emerging Technologies 2012, 4, 1, pp. 51-57.
- European Parliament Resolution of 2 July 2013 on the contribution of cooperatives to overcoming the crisis (2012/2321(INI)) (2016/C 075/05), Official Journal of the European Union C75/34. 26.02.2016. Available online: https://eur-lex.europa.eu/legal-content/EN/TXT/PDF/?uri=CELEX:52013IP0301&rid=7.
- Rozakis, S.; Juvančič, L.; Kovacs, B. Bioeconomy for Resilient Post-COVID Economies. Energies 2022, 15, . [CrossRef]
- Hurmekoski, E.; Lovrić, M.; Lovrić, N.; Hetemäki, L.; Winkel, G. Frontiers of the forest-based bioeconomy – A European Delphi study. Forest Policy and Economics 2019, 102, pp. 86-99, . [CrossRef]
- DeBoer, J.; Panwar, R.; Kozak, R.; Cashore, B. Squaring the circle: Refining the competitiveness logic for the circular bioeconomy. Forest Policy and Economics 2020, 110 (C), 101858. [CrossRef]
- Purkus, A.; Hagemann, N.; Bedtke, N.; Gawel, E. Towards a sustainable innovation system for the German wood-based bioeconomy: Implications for policy design. Journal of Cleaner Production 2018, 172, pp. 3955–3968, . [CrossRef]
- Kircher, M.; Maurer, K.H.; Herzberg, D. KBBE: The Knowledge-based Bioeconomy: Concept, Status and Future Prospects. EFB Bioeconomy Journal 2022, 2, . [CrossRef]
- OECD. Meeting Policy Challenges for a Sustainable Bioeconomy, OECD Publishing: Paris, France, 2018, . [CrossRef]
- Bracco, S.; Calicioglu, O.; Gomez San Juan, M.; Flammini, A. Assessing the contribution of bioeconomy to the total economy: A review of national frameworks. Sustainability 2018, 10, 1698, . [CrossRef]
- Papadopoulou, C.-I.; Loizou, E.; Chatzitheodoridis, F. Priorities in Bioeconomy Strategies: A Systematic Literature Review. Energies 2022, 15, . [CrossRef]
- Bigliardi, B.; Filippelli, S. Investigating circular business model innovation through keywords analysis. Sustainability 2021, 13(9), 5036, . [CrossRef]
- Linder, M.; Williander, M. Circular Business Model Innovation: Inherent Uncertainties. Business Strategy and the Environment 2017, 26, pp. 182-196, . [CrossRef]
- Sili, M.; Dürr, J. Bioeconomic Entrepreneurship and Key Factors of Development: Lessons from Argentina. Sustainability 2022, 14(4), 2447, . [CrossRef]
- Bocken, N.; Strupeit, L.; Whalen, K.; Nußholz, J. A Review and Evaluation of Circular Business Model Innovation Tools. Sustainability 2019, 11, 2210. [CrossRef]
Figure 1.
Total output, inputs, family farm income towards energy output and costs by farm in the European Union* in 2014-2022**. Source: own preparation based on Table 1. * Excluding the United Kingdom. ** without 5 countries: Croatia, Germany, Greece, Slovenia and Spain.
Figure 1.
Total output, inputs, family farm income towards energy output and costs by farm in the European Union* in 2014-2022**. Source: own preparation based on Table 1. * Excluding the United Kingdom. ** without 5 countries: Croatia, Germany, Greece, Slovenia and Spain.
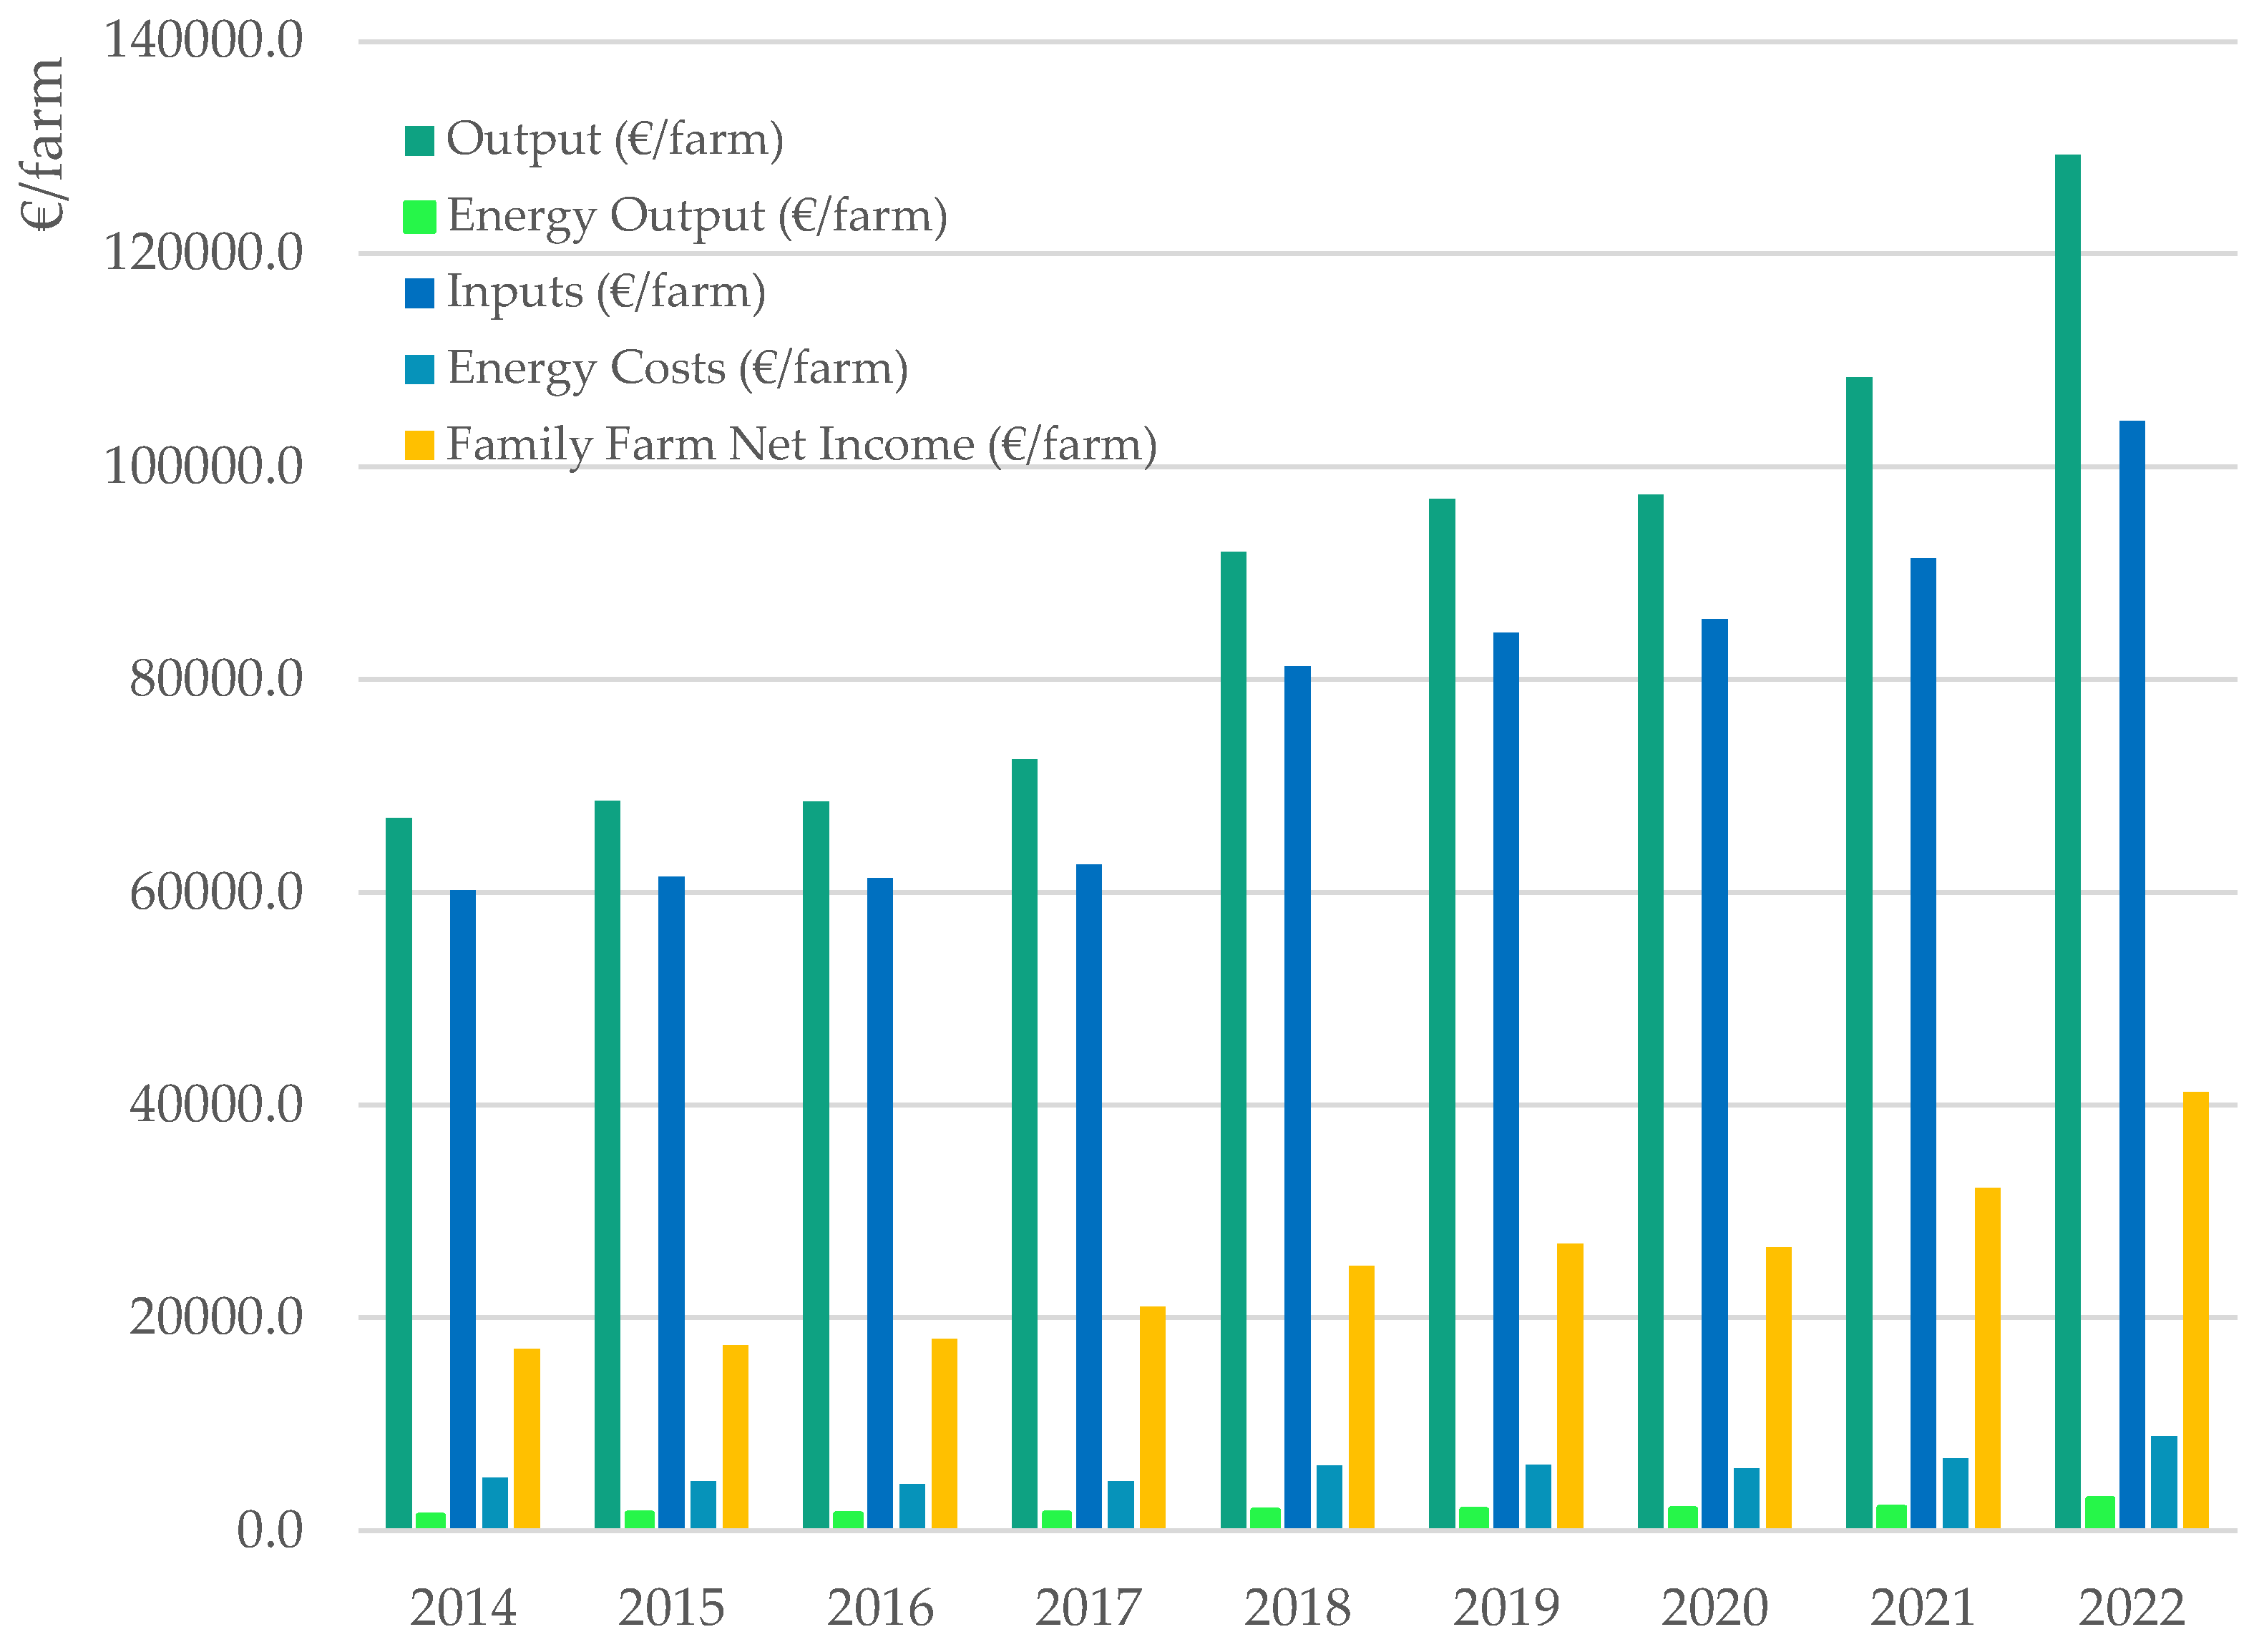
Figure 2.
Energy output and energy costs by farm in the European Union* in 2014-2022**. Source: own preparation based on Table 1. * Excluding the United Kingdom. ** without 5 countries: Croatia, Germany, Greece, Slovenia and Spain.
Figure 2.
Energy output and energy costs by farm in the European Union* in 2014-2022**. Source: own preparation based on Table 1. * Excluding the United Kingdom. ** without 5 countries: Croatia, Germany, Greece, Slovenia and Spain.
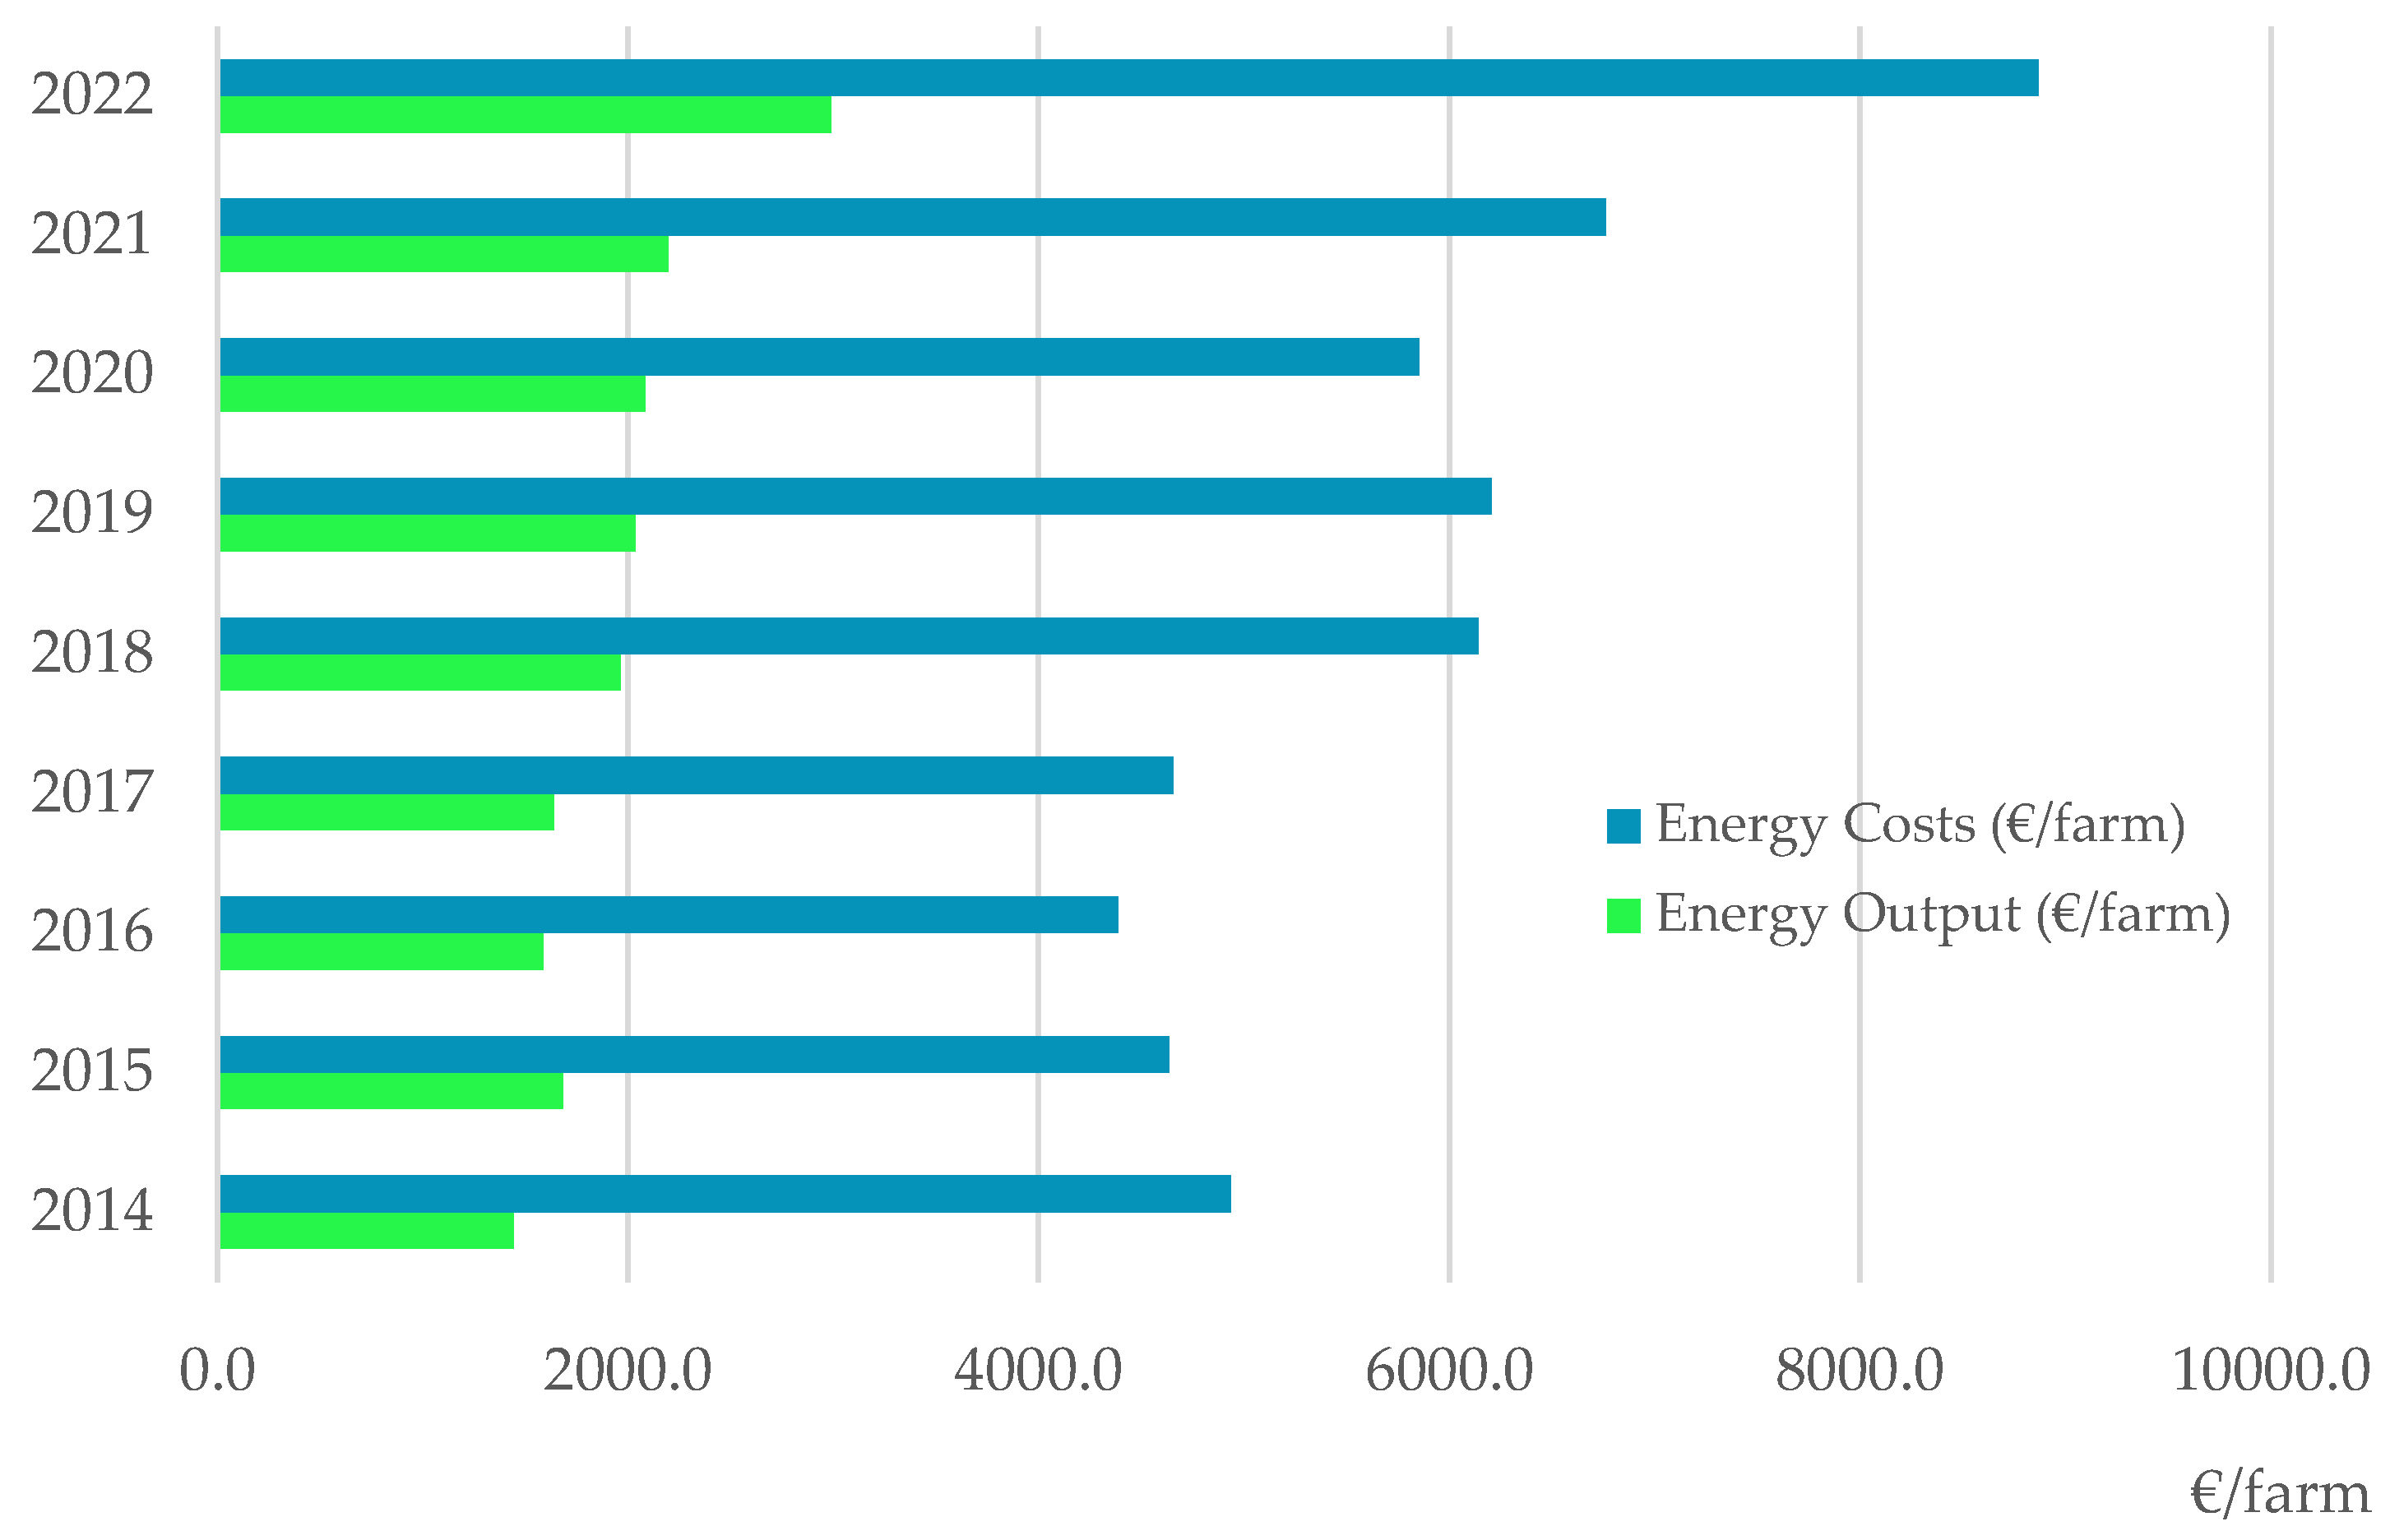

Table 1.
Main information about the financial situation of farms in the European Union* in 2014-2022**
Table 1.
Main information about the financial situation of farms in the European Union* in 2014-2022**
| Year | 2014 | 2015 | 2016 | 2017 | 2018 | 2019 | 2020 | 2021 | 2022 |
| Utilised Agricultural Area (ha/farm) | 31.2 | 31.7 | 31.9 | 32.4 | 40.1 | 40.1 | 40.3 | 40.3 | 40.4 |
| Output (€/farm), including: | 66 953.0 | 68 553.0 | 68 499.0 | 72 504.0 | 92 005.0 | 96 952.0 | 97 364.0 | 108 370.0 | 129 341.0 |
| - Energy output (€/farm) | 1 442.0 | 1 685.0 | 1 590.0 | 1 640.0 | 1 965.0 | 2 035.0 | 2 084.0 | 2 196.0 | 2 990.0 |
| - Share of energy output in total output (%) | 2.2 | 2.5 | 2.3 | 2.3 | 2.1 | 2.1 | 2.1 | 2.0 | 2.3 |
| Inputs (€/farm), including: | 60 147.0 | 61 479.0 | 61 304.0 | 62 607.0 | 81 218.0 | 84 392.0 | 85 662.0 | 91 408.0 | 104 325.0 |
| - Energy costs (€/farm) | 4 936.0 | 4 634.0 | 4 387.0 | 4 655.0 | 6 141.0 | 6 206.0 | 5 853.0 | 6 763.0 | 8 869.0 |
| - Share of energy costs in total intput (%) | 8.2 | 7.5 | 7.2 | 7.4 | 7.6 | 7.4 | 6.8 | 7.4 | 8.5 |
| Farm Net Income (€/farm) | 17 053.0 | 17 427.0 | 18 006.0 | 21 026.0 | 24 900.0 | 26 954.0 | 26 597.0 | 32 176.0 | 41 214.0 |
| Relation of energy output to energy costs (%) | 29.2 | 36.4 | 36.2 | 35.2 | 32.0 | 32.8 | 35.6 | 32.5 | 33.7 |
* Excluding the United Kingdom. ** without 5 countries: Croatia, Germany, Greece, Slovenia and Spain. Source: own calculation based on FADN 2024.
Table 2.
Ranking of the European* farms according to the energy costs and energy output in 2021**.
| Place in the ranking | Member State | Energy Costs (€/farm) | Member State | Energy Costs per 1ha (€/ha) | Member State | Energy Output (€/farm) | Member State | Energy Output per 1ha (€/ha) | Member State | AVERAGE RANGS |
| 1 | Slovakia | 54 871.0 | Malta | 1 465.8 | Denmark | 27 889.0 | Netherlands | 448.4 | Netherlands | 2.0 |
| 2 | Czechia | 41 652.0 | Netherlands | 870.0 | Netherlands | 18 212.0 | Hungary | 236.6 | Germany | 5.0 |
| 3 | Netherlands | 35 338.0 | Cyprus | 387.5 | Czechia | 16 882.0 | Denmark | 186.5 | Belgium | 6.0 |
| 4 | Germany | 26 188.0 | Belgium | 295.4 | Germany | 15 835.0 | Belgium | 178.1 | Denmark | 6.0 |
| 5 | Denmark | 22 572.0 | Slovenia | 270.6 | Slovakia | 14 967.0 | Luxembourg | 157.7 | Czechia | 6.8 |
| 6 | Sweden | 22 479.0 | Germany | 253.3 | Luxembourg | 14 708.0 | Germany | 153.2 | Hungary | 8.3 |
| 7 | Finland | 16 997.0 | Greece | 253.0 | Hungary | 12 253.0 | Italy | 82.6 | Luxembourg | 8.8 |
| 8 | Belgium | 16 138.0 | Italy | 223.9 | Belgium | 9 733.0 | Austria | 82.5 | Slovakia | 9.0 |
| 9 | Estonia | 15 250.0 | Finland | 217.5 | Estonia | 8 269.0 | Czechia | 66.0 | Sweden | 9.3 |
| 10 | Luxembourg | 14 956.0 | Sweden | 215.6 | Sweden | 4 131.0 | Estonia | 54.2 | Austria | 11.3 |
| 11 | France | 12 840.0 | Austria | 199.0 | Austria | 2 780.0 | Sweden | 39.6 | Italy | 11.3 |
| 12 | Hungary | 9 255.0 | Hungary | 178.7 | Latvia | 2 236.0 | Slovakia | 36.4 | Finland | 12.0 |
| 13 | Latvia | 8 505.0 | Czechia | 162.9 | France | 2 137.0 | Slovenia | 32.9 | Estonia | 13.0 |
| 14 | Bulgaria | 7 723.0 | Luxembourg | 160.3 | Italy | 1 914.0 | Latvia | 30.5 | France | 14.0 |
| 15 | Austria | 6 702.0 | Denmark | 151.0 | Finland | 1 320.0 | France | 22.7 | Slovenia | 14.3 |
| 16 | Italy | 5 185.0 | Poland | 151.0 | Slovenia | 378.0 | Croatia | 17.7 | Latvia | 14.8 |
| 17 | Spain | 4 977.0 | France | 136.5 | Croatia | 283.0 | Finland | 16.9 | Greece | 16.8 |
| 18 | Lithuania | 4 609.0 | Slovakia | 133.6 | Greece | 171.0 | Greece | 16.5 | Cyprus | 18.0 |
| 19 | Cyprus | 4 553.0 | Croatia | 129.0 | Ireland | 123.0 | Portugal | 3.3 | Malta | 18.3 |
| 20 | Malta | 4 412.0 | Latvia | 115.9 | Bulgaria | 122.0 | Ireland | 2.7 | Croatia | 19.8 |
| 21 | Ireland | 4 046.0 | Spain | 112.9 | Lithuania | 113.0 | Lithuania | 2.2 | Bulgaria | 20.0 |
| 22 | Poland | 3 226.0 | Portugal | 103.3 | Portugal | 81.0 | Poland | 2.1 | Poland | 20.8 |
| 23 | Slovenia | 3 107.0 | Bulgaria | 100.6 | Poland | 44.0 | Bulgaria | 1.6 | Spain | 21.5 |
| 24 | Greece | 2 629.0 | Estonia | 99.9 | Spain | 3.0 | Spain | 0.1 | Lithuania | 21.5 |
| 25 | Portugal | 2 507.0 | Romania | 95.7 | Cyprus | 0.0 | Cyprus | 0.0 | Ireland | 21.8 |
| 26 | Romania | 2 389.0 | Lithuania | 88.4 | Malta | 0.0 | Malta | 0.0 | Portugal | 22.0 |
| 27 | Croatia | 2 067.0 | Ireland | 87.6 | Romania | 0.0 | Romania | 0.0 | Romania | 26.3 |
| - | EU27 | 6 763.0 | EU27 | 167.6 | EU27 | 2 196.0 | EU27 | 54.4 | - | - |
* Excluding the United Kingdom. ** A green field indicates the first score, a blue the second, an yellow third, fourth and fifth positions and a grey field indicates the five the lowest scores after the calculation the average score in four rankings. Source: own calculation based on FADN 2024.
Table 3.
Energy output and costs and other information of farms according to the farm economic size in the European Union* in 2021.
Table 3.
Energy output and costs and other information of farms according to the farm economic size in the European Union* in 2021.
| Details: | Classes of Economic Size | |||||
|---|---|---|---|---|---|---|
| 1 2 000 ≤ 8 000 € Very Small |
2 8 000 ≤ 25 000 € Small |
3 25 000 ≤ 50 000 € Medium-Low |
4 50 000 ≤ 100 000 € Medium-Large |
5 100 000 ≤ 500 000 € Large |
6 ≥ 500 000 € Very Large |
|
| EU-27 | ||||||
| Utilised Agricultural Area (ha/farm) | 6.0 | 13.9 | 27.2 | 48.1 | 97.9 | 252.8 |
| Output (€/farm), including: | 8 474.0 | 20 730.0 | 44 781.0 | 85 175.0 | 251 093.0 | 126 5074.0 |
| - Energy output (€/farm) | 22.0 | 107.0 | 894.0 | 1 067.0 | 3 452.0 | 40 521.0 |
| - Share of energy output in total output (%) | 0.3 | 0.5 | 2.0 | 1.3 | 1.4 | 3.2 |
| Inputs (€/farm), including: | 7 268.0 | 15 231.0 | 35 878.0 | 67 698.0 | 209 852.0 | 1 125 294.0 |
| - Energy costs (€/farm) | 814.0 | 1 704.0 | 3 439.0 | 5 883.0 | 14 896.0 | 71 585.0 |
| - Share of energy costs in total intput (%) | 11.2 | 11.2 | 9.6 | 8.7 | 7.1 | 6.4 |
| Relation of energy output to energy costs (%) | 2.7 | 6.3 | 26.0 | 18.1 | 23.2 | 56.6 |
| Netherlands | ||||||
| Utilised Agricultural Area (ha/farm) | - | - | 15.8 | 22.8 | 38.5 | 57.7 |
| Output (€/farm), including: | - | - | 90 572.0 | 138 822.0 | 364 407.0 | 1 486 655.0 |
| - Energy output (€/farm) | - | - | 6 423.0 | 6 010.0 | 3 807.0 | 47 341.0 |
| - Share of energy output in total output (%) | - | - | 7.1 | 4.3 | 1.0 | 3.2 |
| Inputs (€/farm), including: | - | - | 88 307.0 | 121 442.0 | 319 371.0 | 1 294 096.0 |
| - Energy costs (€/farm) | - | - | 4 788.0 | 6 381.0 | 16 689.0 | 82 448.0 |
| - Share of energy costs in total intput (%) | - | - | 5.4 | 5.3 | 5.2 | 6.4 |
| Relation of energy output to energy costs (%) | - | - | 134.1 | 94.2 | 22.8 | 57.4 |
| Germany | ||||||
| Utilised Agricultural Area (ha/farm) | - | - | 33.9 | 49.3 | 91.0 | 340.2 |
| Output (€/farm), including: | - | - | 60 703.0 | 102 793.0 | 308 850.0 | 1 308 528.0 |
| - Energy output (€/farm) | - | - | 5 189.0 | 4 157.0 | 7 517.0 | 81 155.0 |
| - Share of energy output in total output (%) | - | - | 8.5 | 4.0 | 2.4 | 6.2 |
| Inputs (€/farm), including: | - | - | 62 156.0 | 98 603.0 | 282 820.0 | 1 311 022.0 |
| - Energy costs (€/farm) | - | - | 6 296.0 | 9 664.0 | 23 117.0 | 93 794.0 |
| - Share of energy costs in total intput (%) | - | - | 10.1 | 9.8 | 8.2 | 7.2 |
| Relation of energy output to energy costs (%) | - | - | 82.4 | 43.0 | 32.5 | 86.5 |
* Excluding the United Kingdom. Source: own calculation based on FADN 2024.
Table 4.
Energy output and costs and other information of farms according the type of production of farms in the European Union* in 2021.
Table 4.
Energy output and costs and other information of farms according the type of production of farms in the European Union* in 2021.
| Details: | Type of production | |||||||
| Field-crops | Horticul-ture | Wine | Other permanent crops | Milk | Other grazing livestock | Granivo-res | Mixed | |
| EU-27 | ||||||||
| Utilised Agricultural Area (ha/farm) | 52.7 | 7.3 | 16.4 | 13.8 | 49.7 | 53.3 | 43.0 | 40.7 |
| Output (€/farm), including: | 84 278.0 | 242 889.0 | 104 567.0 | 47 848.0 | 192 509.0 | 66 967.0 | 490 316.0 | 88 654.0 |
| - Energy output (€/farm) | 2 204.0 | 9 521.0 | 554.0 | 464.0 | 3 094.0 | 738.0 | 7 107.0 | 2 381.0 |
| - Share of energy output in total output (%) | 2.6 | 3.9 | 0.5 | 1.0 | 1.6 | 1.1 | 1.4 | 2.7 |
| Inputs (€/farm), including: | 68 617.0 | 188 288.0 | 72 553.0 | 31 899.0 | 166 710.0 | 64 460.0 | 448 381.0 | 84 079.0 |
| - Energy costs (€/farm) | 6 417.0 | 16 623.0 | 3 762.0 | 2 711.0 | 10 988.0 | 4 626.0 | 21 726.0 | 6 157.0 |
| - Share of energy costs in total intput (%) | 9.4 | 8.8 | 5.2 | 8.5 | 6.6 | 7.2 | 4.8 | 7.3 |
| Relation of energy output to energy costs (%) | 34.3 | 57.3 | 14.7 | 17.1 | 28.2 | 16.0 | 32.7 | 38.7 |
| Netherlands | ||||||||
| Utilised Agricultural Area (ha/farm) | 51.5 | 16.5 | - | 16.1 | 61.5 | 28.0 | 11.6 | 46.6 |
| Output (€/farm), including: | 308 020.0 | 1 560 037.0 | - | 461 989.0 | 470 080.0 | 230 074.0 | 1 124 691.0 | 786 972.0 |
| - Energy output (€/farm) | 5 250.0 | 69 942.0 | - | 21 228.0 | 5 105.0 | 8 431.0 | 14 054.0 | 5 722.0 |
| - Share of energy output in total output (%) | 1.7 | 4.5 | - | 4.6 | 1.1 | 3.7 | 1.2 | 0.7 |
| Inputs (€/farm), including: | 277 047.0 | 1 245 078.0 | - | 402 632.0 | 417 969.0 | 215 720.0 | 1 127 413.0 | 719 400.0 |
| - Energy costs (€/farm) | 18 588.0 | 10 6993.0 | - | 15 767.0 | 19 290.0 | 12 150.0 | 37 102.0 | 27 468.0 |
| - Share of energy costs in total intput (%) | 6.7 | 8.6 | - | 3.9 | 4.6 | 5.6 | 3.3 | 3.8 |
| Relation of energy output to energy costs (%) | 28.2 | 65.4 | - | 134.6 | 26.5 | 69.4 | 37.9 | 20.8 |
| Germany | ||||||||
| Utilised Agricultural Area (ha/farm) | 138.1 | 12.5 | 15.5 | 42.2 | 92.2 | 73.2 | 82.8 | 162.0 |
| Output (€/farm), including: | 276 095.0 | 790 269.0 | 186 812.0 | 300 755.0 | 398 198.0 | 140 205.0 | 522 686.0 | 471 212.0 |
| - Energy output (€/farm) | 12 488.0 | 113 497.0 | 6 419.0 | 29 013.0 | 10 596.0 | 4 746.0 | 13 455.0 | 31 316.0 |
| - Share of energy output in total output (%) | 4.5 | 14.4 | 3.4 | 9.6 | 2.7 | 3.4 | 2.6 | 6.6 |
| Inputs (€/farm), including: | 274 000.0 | 688 116.0 | 135 927.0 | 283 739.0 | 353 913.0 | 145 515.0 | 544 979.0 | 496 272.0 |
| - Energy costs (€/farm) | 24 555.0 | 48 169.0 | 7 648.0 | 18 383.0 | 29141.0 | 12 836.0 | 32 046.0 | 37 855.0 |
| - Share of energy costs in total intput (%) | 9.0 | 7.0 | 5.6 | 6.5 | 8.2 | 8.8 | 5.9 | 7.6 |
| Relation of energy output to energy costs (%) | 50.9 | 235.6 | 83.9 | 157.8 | 36.4 | 37.0 | 42.0 | 82.7 |
* Excluding the United Kingdom. Source: own calculation based on FADN 2024.
Table 5.
Panel Fixed Effect Models for energy output and costs of the European* farms according to the economic size in 2014-2021.
Table 5.
Panel Fixed Effect Models for energy output and costs of the European* farms according to the economic size in 2014-2021.
|
Details |
Classes of Economic Size | |||||
|
1 2 000 ≤ 8 000 € Very Small |
2 8 000 ≤ 25 000 € Small |
3 25 000 ≤ 50 000 € Medium-Low |
4 50 000 ≤ 100 000 € Medium-Large |
5 100 000 ≤ 500 000€ Large |
6 ≥ 500 000 € Very Large |
|
| Number of Observations | 105 | 173 | 209 | 216 | 216 | 175 |
| Models for Energy Output (Y01) | ||||||
| LSDV R2 | 0.6108 | 0.8872 | 0.9207 | 0.9182 | 0.8700 | 0.9145 |
| Within R2 | 0.0398 | 0.2050 | 0.4021 | 0.3538 | 0.0575 | 0.2681 |
| const | -126.5520 (0.3314) |
-199.2900 (0.7498) |
-2 245.7800 (0.3375) |
-1 303.0800 (0.6802) |
3 406.9000 (0.4211) |
94 860.7000 (0.0000) |
| X02 – Utilized Agricultural Area | - | - | -233.3140 (0.0000) |
- | -55.9753 (0.0266) |
-147.4130 (0.0003) |
| X03 – Total Output | - | - | - | 0.3372 (0.0000) |
- | 0.2444 (0.0025) |
| X04 – Total Inputs | 0.0338 (0.0567) |
0.1347 (0.0000) |
0.4091 (0.0000) |
- | 0.0443 (0.0031) |
-0.1882 (0.0141) |
| X05 – Taxes | - | - | -3.5478 (0.0229) |
-2.8264 (0.0418) |
- | - |
| X06 – Family Farm Income | - | - | - | -0.3152 (0.0000) |
- | -0.2762 (0.0008) |
| X07 – Assets | - | - | -0.0097 (0.0125) |
-0.0278 (0.0000) |
- | - |
| X08 - Liabilities | - | -0.0644 (0.0000) |
- | - | - | - |
| X09 – Gross Investment | - | - | - | 0.0718 (0.0500) |
- | - |
| Hausman Test | χ2 (1) = 0.2188 (0.6400) REM Rejected |
χ2 (2) = 18.3722 (0.0010) REM Not Rejected, FEM Sufficiently Close |
χ2 (4) = 6.0772 (0.1935) REM Rejected |
χ2 (5) = 14.3278 (0.0137) REM Not Rejected, FEM Sufficiently Close |
χ2 (2) = 3.3770 (0.1848) REM Rejected |
χ2 (4) = 12.8339 (0.0121) REM Not Rejected, FEM Sufficiently Close |
| Models of Energy Costs (Y02) | ||||||
| LSDV R2 | 0.9280 | 0.9462 | 0.9348 | 0.9312 | 0.9494 | 0.9755 |
| Within R2 | 0.7072 | 0.4271 | 0.4715 | 0.4234 | 0.5267 | 0.5169 |
| const | 121.2400 (0.0726) |
-13.3703 (0.9455) |
-61.6414 (0.8593) |
-807.2930 (0.2529) |
-10 798.5000 (0.0000) |
-28 514.4000 (0.0054) |
| X02 – Utilized Agricultural Area | - | 95.8487 (0.0000) |
90.5202 (0.0000) |
67.4532 (0.0000) |
124.2020 (0.0000) |
142.2290 (0.0000) |
| X03 – Total Output | 0.1104 (0.0000) |
0.0172 (0.0000) |
0.0276 (0.0000) |
0.0490 (0.0000) |
0.0880 (0.0000) |
0.0499 (0.0000) |
| X06 – Family Farm Income | -0.1187 (0.0000) |
- | -0.0318 (0.0002) |
-0.0199 (0.0332) |
-0.0982 (0.0000) |
- |
| X08 - Liabilities | - | - | - | - | -0.0168 (0.0003) |
- |
| X11 – Cash Flow | - | - | - | - | - | -0.0614 (0.0006) |
| X12 – Balance Current Subsidies and Taxes | 0.1248 (0.0000) |
- | - | - | - | - |
| Hausman Test | χ2 (3) = 0.5861 (0.8996) REM Rejected |
χ2 (2) = 4.6274 (0.0989) REM Rejected |
χ2 (3) = 8.7148 (0.0333) REM Not Rejected, FEM Sufficiently Close |
χ2 (3) = 4.8540 (0.1828) REM Rejected |
χ2 (4) = 14.1556 (0.0068) REM Not Rejected, FEM Sufficiently Close |
χ2 (3) = 10.5646 (0.0143) REM Not Rejected, FEM Sufficiently Close |
* Including the United Kingdom. The level of significance is in parentheses. Source: own calculation based on FADN 2024.
Disclaimer/Publisher’s Note: The statements, opinions and data contained in all publications are solely those of the individual author(s) and contributor(s) and not of MDPI and/or the editor(s). MDPI and/or the editor(s) disclaim responsibility for any injury to people or property resulting from any ideas, methods, instructions or products referred to in the content. |
© 2024 by the authors. Licensee MDPI, Basel, Switzerland. This article is an open access article distributed under the terms and conditions of the Creative Commons Attribution (CC BY) license (http://creativecommons.org/licenses/by/4.0/).
Copyright: This open access article is published under a Creative Commons CC BY 4.0 license, which permit the free download, distribution, and reuse, provided that the author and preprint are cited in any reuse.


