Submitted:
11 September 2024
Posted:
12 September 2024
You are already at the latest version
Abstract
This paper examines the impact of renewable energy heating on air quality in northern China, using the Qinling Mountains-Huaihe River line as a quasi-natural experiment to distinguish between regions with central heating and those without. Employing a difference-in-differences approach and analyzing panel data from 299 cities between 2014 and 2022, our findings indicate that the renewable energy heating policy has significantly improved air quality. Specifically, the policy led to substantial reductions in the Air Quality Index (AQI) and concentrations of key pollutants: SO2 by 28.31%, CO by 7.57%, NO2 by 5.72%, and PM2.5 by 7.15%. The policy's effects are most pronounced in regions with lower temperatures and in the eastern parts of the country. Further analysis emphasizes the critical role of energy transition, environmental regulations, and government investment in technology as key drivers of these air quality improvements.
Keywords:
Air Quality
; Central Winter Heating
; Renewable Energy
1. Introduction
The escalating air pollution problem severely threatens public health and environmental quality worldwide, particularly in rapidly industrializing countries like China. The relationship between energy consumption and air quality is a central concern, as traditional fossil fuels, especially coal, significantly exacerbate urban pollution [1,2,3,4]. In northern China, where winter heating is predominantly coal-based (accounting for 85.8% of the total), air pollution levels are notably high. According to the 2023 China Ecological and Environmental Quality Bulletin issued by the Ministry of Ecology and Environment, 126 of the 339 cities still exceed air quality standards, representing 40.1% of all such cities. Renewable energy is increasingly viewed as a viable substitute for fossil fuels, with the potential to mitigate environmental damage and promote a sustainable environment [5,6]. Given this context, transitioning to renewable energy sources and reducing pollution from winter heating are critical for China’s sustainable development. This paper seeks to address a critical question: Can promoting renewable energy heating lead to improved air quality?
To explore this issue, we leverage the Qinling Mountains-Huaihe River line as a quasi-natural experiment to differentiate between regions with municipal central heating and those without. This geographical boundary provides a unique setting to analyze the effects of renewable energy heating policies. Our research utilizes a difference-in-differences (DID) methodology to evaluate the impact of these policies on air quality across 299 cities from 2014 to 2022. This approach enables us to isolate the effects of renewable energy heating policy (REHP) from other factors influencing air quality. To reduce selection bias, we also employ a propensity score matching (PSM) method with a DID design to ensure that the treatment and control groups are comparable on observed characteristics, thereby creating a more balanced comparison.
Our analysis reveals significant improvements in air quality associated with the renewable energy heating policy. Specifically, the introduction of renewable energy heating has led to a substantial reduction in the Air Quality Index () and a decrease in the concentrations of major pollutants: sulfur dioxide () by 28.31%, carbon monoxide () by 7.57%, nitrogen dioxide () by 5.72%, and particulate matter () by 7.15%. These effects are particularly pronounced in low-temperature and eastern regions, where the impact of transitioning to cleaner energy sources is most significant. Beyond the primary analysis, we investigate the roles of energy transition, stricter environmental regulations, and increased government expenditure on technology as key drivers of these improvements. Our results underscore the effectiveness of renewable energy policies in enhancing air quality and highlight the broader implications for urban planning and policy-making in pollution-intensive regions.
This paper is related to three strands of literature. First, existing literature on coal combustion, winter heating, and resulting pollution has received considerable attention. Prior research has demonstrated a negative correlation between coal combustion and deteriorated air quality [7,8,9,10]. Some studies examine the impact of air pollution from coal combustion during the winter season on human health. Chen et al. [11] use a regression discontinuity design based on China’s Huai River policy, revealing a significant increase in particulate matter and a 5.52-year reduction in life expectancy in northern regions due to elevated cardiorespiratory mortality. Fan et al. [12] further refined this analysis by incorporating precise start dates for winter heating, corroborating similar findings. In order to reduce air pollution, the “Air Pollution Prevention and Control Action Plan” was introduced in 2013. With the implementation of the “coal-to-gas” and “coal-to-electricity” initiatives, the literature initially evaluated these clean energy policies [14,15]. This was followed by the “Winter Clean Heating Plan for Northern China (2017-2021)”. A large body of literature has emerged to evaluate the effects of clean energy policies and calculate the cost of clean energy heating [15,16,17,18]. However, these studies often focus on a limited number of pilot cities and do not address the broader applicability of the policies or provide a detailed analysis of their mechanisms. Our paper complements existing research by using a broader sample of 299 Chinese cities. It evaluates the universality of renewable energy heating policies, offering a more comprehensive analysis of the effectiveness, heterogeneity, and underlying mechanisms.
Second, this paper is supported by research on environmental regulation and clean energy consumption. Environmental regulation’s impact on fossil energy consumption has been studied extensively. Most findings indicate that such regulations often reduce fossil fuel use by improving energy efficiency. This effect is achieved through the promotion of more efficient technologies and practices [19,20]. However, research specifically addressing the relationship between environmental regulation and clean energy consumption, particularly within the context of China, remains limited. Zhao et al. [20] utilized province-level panel data and demonstrated that environmental regulation positively influences natural gas consumption. Wang and Lee [21] reveal that environmental regulations enhance the positive impact of clean energy consumption on economic growth, thereby encouraging provinces to pursue a clean growth trajectory, using balanced panel data from 27 provinces from 2000 to 2015. Building on these studies, this research further explores the mechanism through which environmental regulation affects renewable energy policies. Our study verifies that the efficacy of renewable energy policies is significantly bolstered by government regulations and a strong commitment to environmental protection.
Third, numerous studies underscore the positive relationship between technological innovation and sustainable energy development [22,23]. Technological progress is widely recognized for enhancing energy efficiency [24], facilitating energy transitions [25], and enabling the substitution of labor and capital in production processes [26]. These advancements collectively contribute to the promotion of sustainable energy practices. Lee and Wang [27] integrate natural resources, technological innovation, technological introduction, and energy sustainability into a unified research framework, affirming that technological innovation positively impacts sustainable energy development. It is worth noting that the effectiveness of technological introduction is contingent upon its alignment with local natural resource endowments. The impact of technological innovation on sustainable energy development depends on the foundational capabilities and capacity of absorbing new technologies [27]. This paper further substantiates the positive impact of technological innovation on energy transitions by incorporating interaction terms to explore how innovation influences sustainable energy practices.
The subsequent sections of this paper are organized as follows: Section 2 provides background on China’s heating policies and their evolution. Section 3 details the data sources and descriptive statistics. Section 4 presents the empirical strategy and the results of the baseline regressions. Section 5 discusses heterogeneity tests, robustness checks, and explores potential mechanisms. Finally, Section 6 concludes with a summary of findings and policy recommendations.
2. China’s Winter Heating System: Background and Evolution
This section provides an overview of China’s winter heating system, including its scope, modes of heating, and the development and reform of municipal central heating projects alongside the country’s energy transition.
China’s winter heating system was initiated in the 1950s, modeled after the former Soviet Union. Centralized heating, which relies on large boiler plants or thermal power stations distributing heat through extensive networks of thermal pipes, became the dominant method in China. However, due to energy and financial constraints, the government restricted centralized heating to northern regions [11,28]. The boundary between northern and southern China roughly follows the Huai River and Qinling Mountains, where the average January temperature hovers around zero degrees Celsius, forming the basis of the well-known "Huai River Policy".
In recent years, with rapid economic development and changing climate patterns, China’s winter heating system has expanded geographically and transitioned toward cleaner energy sources. On one hand, some southern cities have experienced colder winters due to climate variability, driving increased demand for heating solutions. In response, local governments in cities like Lianyungang, Changzhou, Nanjing, Yangzhou, and Suzhou have expanded central heating in densely populated urban communities. Additionally, pilot central heating projects have been implemented in cities such as Lhasa in 2012, Aba County in 2013, and Liupanshui in 2014, among others. In communities where municipal heating pipelines are inaccessible, decentralized systems, such as distributed energy central heating, have been adopted, alongside traditional electric heaters and air conditioners. Figure A1 illustrates the distribution of municipal central heating in China, categorizing 296 sampled cities into three groups: (1) 125 cities with municipal central heating; (2) 13 cities with partial central heating in some communities (less than 60% coverage); and (3) other southern cities without central heating infrastructure.
On the other hand, significant efforts have focused on transitioning from coal-based heating to cleaner alternatives. Historically, coal dominated centralized heating in China, but its incomplete combustion has resulted in severe winter air pollution [10,28]. 87% of sulfur dioxide () and 76% of oxides of nitrogen () emissions are attributed to coal combustion [29]. Over the past decade, the government has implemented policies promoting the use of natural gas, renewable energy (e.g., geothermal and solar), and energy-efficient technologies. In 2013, the “Air Pollution Prevention and Control Action Plan" was introduced, mandating the replacement of coal-fired boilers with gas or electric systems in urban areas and providing subsidies for rural households to transition from coal stoves to cleaner alternatives. In 2017, the central government launched the "Winter Clean Heating Plan for Northern China (2017-2021)", focusing on "2+26" cities in the Beijing-Tianjin-Hebei air pollution corridor. The plan aimed to replace bulk coal with natural gas and electric heating, increasing the share of clean heating in northern China to 50% by 2019 and 70% by 2021. In 2021, the National Energy Administration issued a circular on "Promoting Renewable Energy Heating According to Local Conditions", encouraging the use of geothermal, biomass, solar, and wind energy for heating.
Our analysis focuses on the implementation of REHP in 2021. While the air quality benefits of the "Winter Clean Heating Plan" have been demonstrated [16,17,18], it is essential to evaluate the effectiveness of policy and explore its mechanism. The shift toward renewable energy heating is critical for China’s energy transition, contributing to energy conservation, emission reduction, and better management of overall energy consumption. It also plays a key role in achieving non-fossil energy targets, building a low-carbon society, and advancing sustainable energy development. This study employs the REHP as a quasi-natural experiment and applies the DID model to evaluate the impacts on air quality during the period from 2014 to 2022, taking into consideration recent reforms in China’s winter heating system and exploring the underlying mechanisms.
3. Data and Descriptive Statistics
3.1. Data
3.1.1. Air Quality Data
The city-level atmospheric pollutant data are obtained from the national urban air quality real-time release platform of the China Environmental Monitoring Center. This platform has provided hourly concentrations of six key air pollutants, including PM2.5, PM10, sulfur dioxide (), nitrogen dioxide (), carbon monoxide (), and ozone () across 337 cities at prefecture-level and above since 2013. The Air Quality Index () is also reported as a comprehensive measure of these pollutions, with higher AQI values indicating more severe pollution. The calculation process proceeds as follows: First, the monthly average concentrations for , , , and are calculated, along with the 95th percentile of daily average CO values and the 90th percentile of daily maximum 8-hour levels. Next, the individual air quality index (IAQI) is calculated by each pollutant’s concentration relative to its respective secondary annual standard. Finally, the AQI is determined by the highest IAQI among the six pollutants1.
3.1.2. Municipal Central Heating
Traditionally, the Qinling Mountains-Huai River boundary has been used to demarcate northern and southern China, with temperature as the primary determinant. However, this classification overlooks other crucial factors, such as humidity, which substantially affect perceived warmth. As economic development has progressed, the demand for winter heating has risen in the relatively humid southern regions, prompting some cities near this boundary to introduce central heating systems.
In our sample of 299 cities, 135 cities provide citywide central heating, 19 provide partial district heating with less than 60% coverage, and 145 do not have central heating. China’s central heating landscape can be categorized into three groups: (1) Municipal Central Heating: This group comprises 135 cities across 17 provinces, autonomous regions, and municipalities, where all cities offer central heating. These regions include Beijing, Tianjin, Hebei, Inner Mongolia, Shanxi, Shandong, Heilongjiang, Jilin, Liaoning, Shaanxi, Ningxia, Gansu, Qinghai, and Xinjiang. (2) Partial or District-Based Heating: Certain cities near the Qinling-Huai River boundary, particularly in Henan, Anhui, and Jiangsu provinces, have implemented partial or district-based heating systems. Most cities in Henan Province have central heating, except for Xinyang and Zhoukou. In Anhui Province, Hefei provides citywide central heating, while cities like Wuhu, Bengbu, and Huainan have limited district heating. Similarly, in Jiangsu Province, Xuzhou has citywide central heating, while cities such as Lianyungang, Changzhou, and Nanjing offer limited heating in specific residential areas. Additionally, high-altitude regions south of the dividing line, particularly near the Tibetan Plateau, have gradually adopted central heating due to prolonged cold winters. Notable examples include Lhasa (since 2012) and Nagqu (since 2016) in the Tibet Autonomous Region, and Liupanshui in Guizhou Province (since 2014). Some cities, like Shiyan in Hubei Province, leverage waste heat from local industries to facilitate large-scale heating projects. Jingmen and Xiangyang have also initiated central heating projects, although their scope remains limited. (3) No Municipal Central Heating: Provinces such as Shanghai, Chongqing, Zhejiang, Fujian, Jiangxi, Hunan, Guangdong, Guangxi, and Hainan do not have central heating infrastructure. Detailed information on the heating situation across Chinese cities is presented in Table A1. The data are sourced from the 2022 China Urban Construction Statistical Yearbook, supplemented with publicly available materials.
3.1.3. City-level Socioeconomic Data
City-level socioeconomic data are mainly collected from the China City Statistical Yearbook, covering the years 2014 to 2022. This yearbook contains major statistical data on the socioeconomic development of cities, encompassing various dimensions such as the economy, population, environment, education, culture, and transportation. Key variables in our paper include GDP per capita as a measure of economic development, population density as a proxy for city size, the number of industrial enterprises as an indicator of industrial development, the proportion of the tertiary industry’s added value as a measure of industrial structure, and the proportion of general public budget expenditure as a gauge of government intervention. Additionally, the proportion of government expenditure on science and technology serves as an indicator of the level of scientific and technological development. We also employ the frequency of environment-related words in government work reports as a measure of government environmental governance, following the methodology of Chen et al. [30]. A higher frequency of these terms suggests a greater governmental focus on environmental issues. The work reports were sourced from local government websites, and the frequency of specific environment-related terms was systematically counted2.
Given the absence of city-level energy consumption statistics in China, urban energy consumption is estimated using efficient inverse models based on global night-time light imagery and provincial energy consumption data, following Su et al. [31] and Shi et al. [32]. The linear correlation between nightlight data and energy consumption has been well-documented in prior research [33,34,35]. We employ a linear model without an intercept to disaggregate provincial energy consumption data into prefecture-level estimates according to nightlight data, unified into 100 tons of standard coal for simplification. The nightlight data are from the National Geophysical Data Center (NGDC) of the National Oceanic and Atmospheric Administration (NOAA), and the provincial energy consumption data were obtained from the China Energy Statistical Yearbook published by the National Bureau of Statistics (NBS).
3.2. Summary Statistics
Detailed definitions of the main variables are presented in Table 1 and Table 2 reports summary statistics. Panel A compares air quality between regions with and without municipal central heating, indicating significantly higher mean AQI values in areas with central heating compared to unheated areas, with statistical significance at the 1% level. This suggests that central heating contributes to poorer air quality. Similarly, concentrations of pollutants such as , , , and are significantly elevated in cities with central heating. Furthermore, coal consumption is notably higher in regions with centralized heating compared to those without, with the difference also statistically significant at the 1% level. Panel B presents descriptive statistics for all variables across 296 cities from 2014 to 2022. The average AQI during the sample period is 76.44. The mean concentrations of , , , and are 16.68 , 0.89 , 28.58 , and 41.36 , respectively. Statistics for other control variables at the city level are provided.
4. Empirical Strategy and Results
4.1. Econometric Model
In this study, we employ a difference-in-differences (DID) approach to evaluate the impact of the REHP on air quality across 299 Chinese cities from 2014 to 2022. The benchmark model is specified as follows:
where represents the Air Quality Index of city i in year t; higher AQI values indicate more severe air pollution. The variable is a dummy variable that equals 1 if the city has municipal central heating (including both citywide and partial heating), and 0 otherwise. The variable is a time dummy set to 1 for years after the implementation of the renewable energy policy in 2021, and 0 for prior years. The coefficient captures the policy’s effect on air quality. According to the hypothesis, this coefficient is expected to be significantly negative. This would demonstrate that the implementation of the REHP leads to improved air quality. The vector includes key city characteristics that may influence air quality, such as GDP per capita (), population density (), industrial development (), degree of government intervention (), and industrial structure (). The city fixed effects account for time-invariant characteristics at the city level, such as natural endowments and geographic location, and the year fixed effects control for shocks common to all cities in a given year. is the error term clustered at the city level to address potential correlations in random perturbations within the same city over time. To mitigate the influence of outliers, all continuous variables are winsorized at the 5% level.
To reduce selection bias, we adopt a Propensity Score Matching-Difference-in-Differences (PSM-DID) design. Propensity score matching is used to ensure that the treatment and control groups are comparable on observed characteristics, thereby creating a more balanced comparison group [36,37]. We employ logit regression to estimate propensity scores and match treated and untreated subjects with similar propensity scores to create an individually matched sample. In the benchmark analysis, nearest neighbor matching is applied to identify control group samples most similar to the treatment group. To ensure robustness, we also employ alternative matching methods, including radius and kernel matching.
4.2. Baseline Results
Table 3 presents the baseline results of the analysis. Columns (1) and (2) display the estimates from the benchmark DID model, revealing that the coefficients for the interaction terms are negative and statistically significant. This indicates that after the implementation of the REHP, air pollution (measured by AQI) decreases by 1.95% to 2.15% more in central heating cities compared to control cities. Columns (3) and (4) present the results after applying 1:1 nearest neighbor matching, in which each treated city is matched to a control city with the closest propensity score. Table A3 and Figure A2 in appendix provide the results of the balance test for matching variables. After matching, the estimated bias for most variables decreases significantly, with nearly all falling within the 10% threshold3. Figure A3 shows the distribution of propensity scores for the treatment and control groups before and after matching. The notable convergence of the two density curves post-matching suggests that the matched samples are well-suited for subsequent DID analysis. After accounting for sample heterogeneity through propensity score matching, the findings indicate a larger improvement in air quality, with a 3.59% to 4.04% reduction in AQI during the post-REHP period. These results align with anecdotal evidence and the findings of previous studies, including Fan et al. [12], Tan et al. [18], Almond et al.
[28], Gao and Sampattavanija [38].
Based on matched samples, this study evaluates the impact of the REHP on air pollutant concentrations using a PSM-DID approach. The regression results, as detailed in Table 4, reveal significant reductions in emissions for key pollutants: sulfur dioxide () decreases by 28.31%, carbon monoxide () by 7.57%, nitrogen dioxide () by 5.72%, and particulate matter () by 7.15%. The pronounced reduction in SO2 concentrations highlights the policy’s effectiveness in targeting one of the most harmful pollutants associated with coal combustion [17,38]. The estimates of REHP on air pollutant concentrations, derived from the benchmark DID model, are presented in Table A3. These results contribute to the growing body of evidence supporting the effectiveness of renewable energy policies in reducing air pollution.
5. Discussion and Robustness Checks
5.1. Parallel Pre-Trends and Dynamic Effects of the REHP
In this subsection, we verify the parallel pre-trend assumption necessary for the validity of the DID approach. We apply the event study method to analyze the dynamics of air quality improvement in response to the REHP by estimating the following equation:
where is a time dummy variable, with capturing the different trends in air quality between the treatment and control cities in the year after the policy implementation ( refers to the kth year before the policy). We take the period -1 as the base period. Figure 1 shows that the estimated coefficients of for the periods before the policy implementation are not significant, confirming that there were no significant differences in air quality trends between the treated and control cities before the REHP. However, after the policy implementation, air quality begins to improve in the treated cities, and these effects are persistent.
5.2. Heterogeneity Effects
In this section, we explore the heterogeneity in the effects of REHP on air quality in cities with different temperatures and geographical locations.
Air pollutant concentrations in ambient air are influenced by meteorological factors such as temperature, wind speed, and humidity [39,40,41,42]. To capture the effect of temperature on our baseline results, we divide the sample into groups based on whether city temperatures are above or below the average. Columns (1) and (2) of Table 5 report the estimated heterogeneity effects related to temperature. The results show that the REHP leads to more substantial improvements in air quality in low-temperature regions than in high-temperature regions. This pattern can be explained by several reasons: On one hand, higher temperatures tend to exacerbate pollution levels. Awand Kleeman [39] find that non-volatile secondary particulate matter and ozone concentrations generally increase at higher temperatures due to accelerated gas-phase reaction rates. Additionally, Jayamurugan et al. [41] confirm that the influence of temperature on gaseous pollutants ( and ) is much more effective in summer than other seasons, due to the higher temperature range. On the other hand, there is a strong demand for heating in low-temperature areas, and the use of renewable energy can bring more significant improvements in air quality, as opposed to traditional coal-based methods. The mechanism related to coal consumption is discussed in Section 6.3.
Heterogeneity results based on geographical locations are presented in Columns (3) and (4). The analysis reveals a significant negative effect of REHP on air quality in the eastern region. However, the estimated coefficients for the interaction terms in the middle and western regions are not statistically significant. This regional variation in policy effectiveness can likely be attributed to several factors. The eastern region, characterized by a higher level of economic development, places greater emphasis on environmental protection [43,44]. Additionally, the region’s advanced green infrastructure [45] and high penetration rate of green technology [46] amplify the policy’s impact, making its effects more pronounced compared to the less developed middle and western regions.
5.3. Mechanism Analysis
The REHP mitigates air pollution through three key mechanisms. First, it promotes the transition from coal-based heating to cleaner alternatives, thereby reducing the harmful emissions associated with traditional heating methods. Second, the efficacy of the policy is enhanced by the government’s robust commitment to environmental stewardship. On the one hand, the government is actively promoting the replacement of coal-fired boilers with gas or electric systems in urban areas and providing subsidies for rural households to transition from coal stoves to cleaner alternatives. On the other hand, government regulations have been shown to heighten public awareness of environmental protection, particularly regarding the potential link between air quality and health [47,48]. Third, the success of the energy transition policy is closely tied to advancements in green technology. The Porter Hypothesis [49] posits that stricter environmental regulations can stimulate innovation in cleaner technologies, leading to significant environmental improvements [46].
Table 6 reports the results of the mechanism analysis. First, as illustrated in Panel A, the reduction in coal consumption provides direct evidence of the REHP’s effectiveness in promoting the transition from coal-based heating to cleaner alternatives. Second, the role of government environmental governance () is evaluated using a word frequency analysis of Chinese local government work reports. By incorporating an interaction term between and the , the analysis in Columns (1) and (2) of Panel B reveals a negative and statistically significant coefficient at the 1% level, confirming that the government’s strong commitment to environmental stewardship enhances the policy’s effectiveness. Additionally, the estimates in Columns (3) and (4) of Panel B underscore the critical role of technology expenditure in improving the air quality of the REHP.
6. Robustness Tests
In this section, we test the robustness of our results using a series of rigorous methods, including placebo tests, alternative treatment variables, different propensity score matching methods, and the control for other concurrent policies.
6.1. Placebo Test
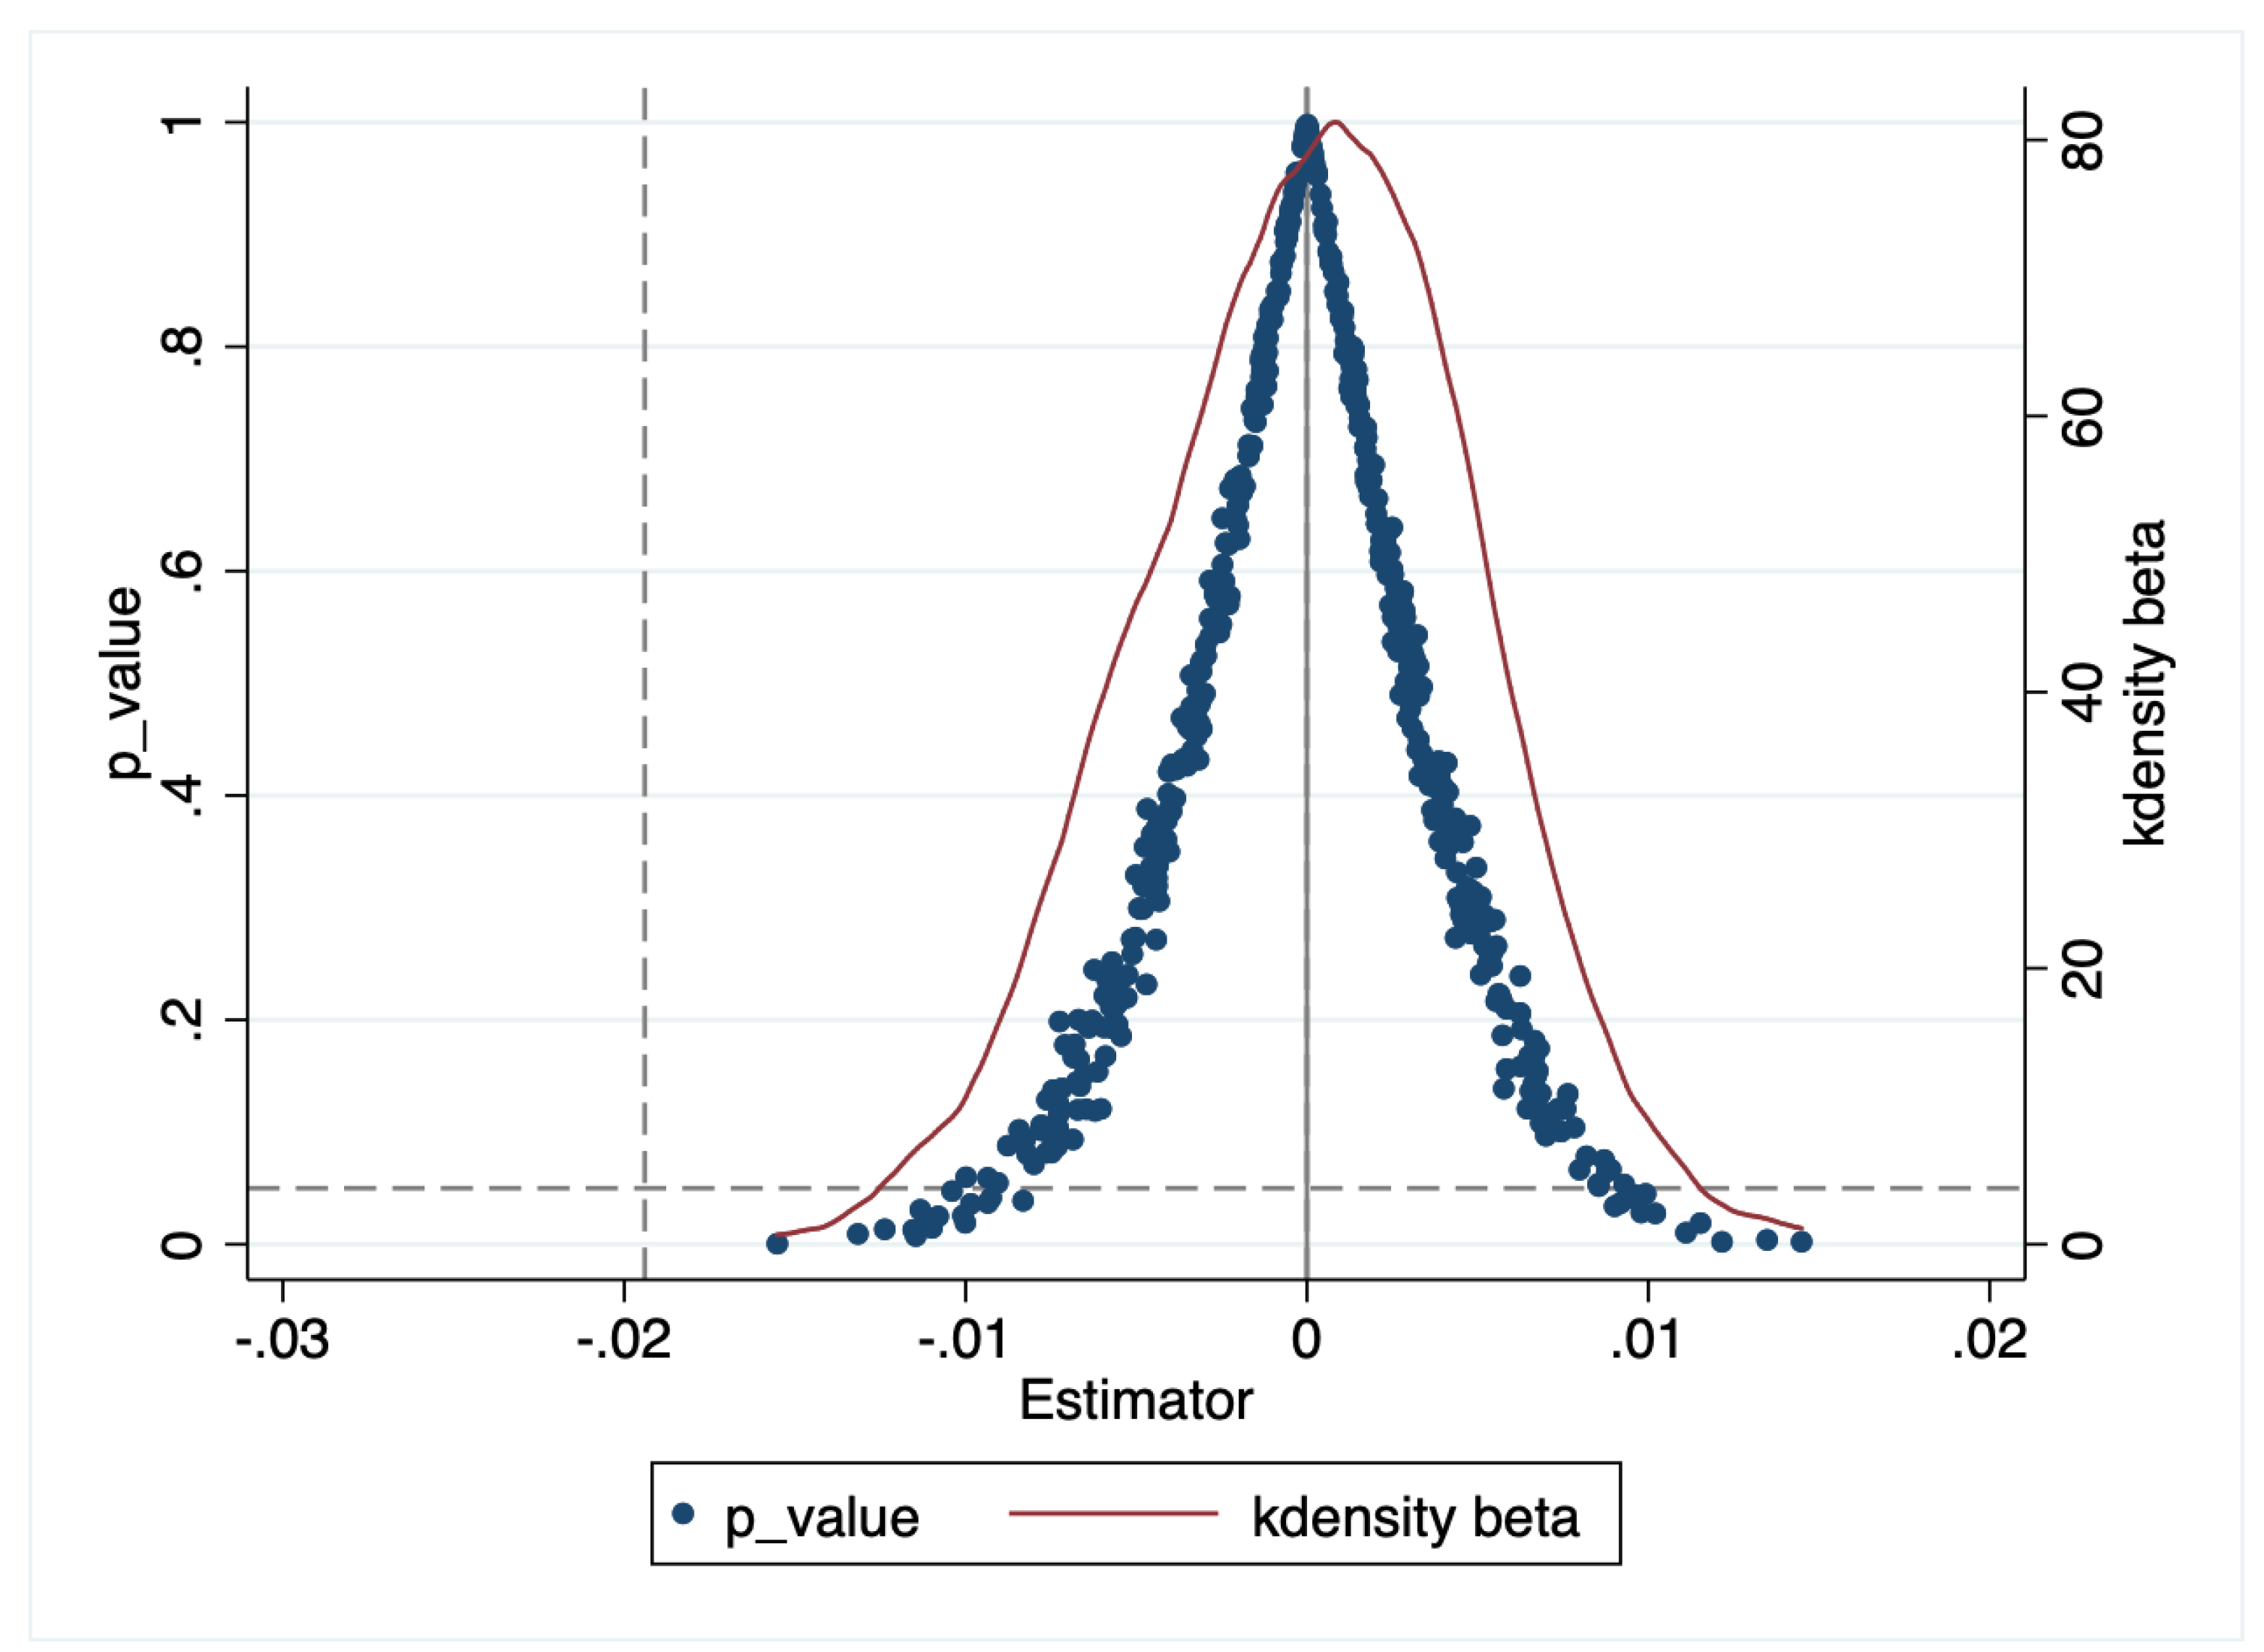
To address the potential influence of unobservable omitted variables on the baseline regression results, we conduct two falsification tests. First, we perform a placebo test using a fictitious treatment group. Specifically, 295 cities from the sample are randomly assigned to a pseudo-treatment group, while the remaining cities serve as the pseudo-control group. This process is repeated 500 times. As illustrated in Figure A4, the p-values and kernel density distributions of the coefficient estimates demonstrate that the regression coefficients exhibit a clustering around zero and adhere to a normal distribution. This suggests that the majority of the regression results are not statistically significant. Furthermore, the coefficient estimates from the baseline regression fall within the lower end of the distribution of spurious regression coefficients, indicating that the baseline results are not influenced by unobservable factors. Second, we perform another placebo test by assigning a fictitious treatment date. Specifically, we simulate the implementation of the REHP occurring one, two, and three years earlier than its actual introduction. Table 7 reports the regression results for these placebo treatment dates. The estimated coefficients of the interaction terms are not statistically significant, reinforcing the conclusion that the observed improvements in air quality are attributable to the actual implementation of the REHP, rather than being due to spurious factors.
6.2. Alternative Treatment Variable
To accurately reflect the heating situation, we explore various alternative specifications of the treatment variable. In Columns (1) and (2) of Table 8, the treatment variable is refined to encompass only those cities with citywide municipal central heating, excluding cases where heating is limited to certain residential areas. Unlike the time-invariant treatment variable employed in the baseline regression, Columns (3) and (4) take into account the possibility of time-varying heating cases. To illustrate, the pilot urban heating project in Lhasa was implemented in 2012, that in Liupanshui in 2014, and that in Nagqu in 2016. The results confirm that REHP significantly reduces air pollution within the treatment group, consistent with previous findings.
6.3. Alternative Propensity Matching Methods
To ensure robustness in our analysis, we employed multiple matching techniques: 1:2 Nearest Neighbor Matching, Radius Matching, and Kernel Matching. The 1:2 Nearest Neighbor Matching method pairs each treated unit with two control units that have the closest propensity scores, thereby minimizing differences between matched pairs. Radius Matching extends this approach by pairing treated units with all control units within a specified radius of the propensity score, providing greater flexibility and reducing the risk of poor matches. Kernel Matching, in contrast, employs a weighted average of all control units to form a comparison group, giving higher weights to control units with propensity scores closer to those of the treated units [50,51,52]. The results, as presented in Table 9, are consistent with the baseline findings reported in Table 3, both qualitatively and quantitatively.
6.4. Eliminating the Interference of Other Policies
During the sample period from 2014 to 2022, some policies related to energy and environment were promulgated. In 2014, the National Energy Administration released a notice announcing the initial list of 81 new energy demonstration cities. Subsequently, in 2017, the central government introduced the "Winter Clean Heating Plan for Northern China (2017-2021)," targeting the "2+26" cities within the Beijing-Tianjin-Hebei air pollution corridor. To account for potential interference from other policies, we conduct a robustness check by excluding two groups of cities from our sample. Columns (1) and (2) present estimates excluding the initial batch of new energy demonstration cities, while Columns (3) and (4) provide results after removing the "2+26" cities included in the Winter Clean Heating Plan. Our regression analysis, detailed in Table 10, demonstrates that these adjustments do not alter the main conclusions of our study. This consistency underscores the robustness of our findings, suggesting that the observed effects are attributable to the policies under investigation rather than the influence of other concurrent policies.
7. Conclusions
This paper investigates the impact of promoting renewable energy heating on air quality in northern China. Using a difference-in-differences approach and panel data from 299 cities spanning 2014 to 2022, the study finds that the renewable energy heating policy significantly enhances air quality. The policy not only reduces the overall air quality index (AQI) but also leads to notable decreases in key pollutants, with concentrations of , , , and dropping by 28.31%, 7.57%, 5.72%, and 7.15%, respectively. The effects of REHP on air quality are heterogeneous, with stronger impacts observed in low-temperature and eastern regions. Further analysis indicates that the policy’s success is driven by a shift from coal-based heating to cleaner alternatives, supported by the government’s strong commitment to environmental governance and augmented technological investment. The conclusions remain robust when subjected to various tests, including checks for parallel pre-trends, placebo tests, alternative treatment variables, propensity score matching methods, and controlling for the interference of other concurrent policies. Based on our findings, we recommend a strategic focus on advancing energy transition, strengthening government regulations, and fostering technological innovation to promote energy conservation and emission reduction. First, optimizing the thermal energy structure is crucial. In northern cities, fossil fuels still account for 85.8% of heating methods4. Therefore, expanding the use of clean energy sources such as solar, wind, and geothermal is imperative for diversifying the energy supply and enhancing efficiency. The Yangtze River Basin is projected to experience a substantial increase in heating demand, reaching 35 billion by 2050, yet over 99% of the region’s heating remains decentralized. Thus, integrating residents who currently lack central heating into existing central heating networks will reduce their reliance on inefficient and polluting scattered coal. Second, government regulations should incentivize the adoption of renewable energy heating systems. Policies such as subsidies, tax credits, and low-interest loans for households and businesses investing in cleaner technologies will lower barriers to entry and accelerate the widespread adoption of these technologies. Finally, sustained investment in R&D is vital for maintaining technological innovation in renewable energy heating. Government fundings should focus not only on advancing heating technologies but also on improving energy efficiency across the entire heating value chain. This includes developing energy-efficient building designs, retrofitting existing structures with superior insulation, and implementing smart heating controls to optimize energy use. By addressing these areas, we can foster a more sustainable energy landscape, significantly reduce emissions, and improve the effectiveness of renewable energy solutions.
Funding
This research received no external funding. The APC was funded by School of International Trade and Economics, Central University of Finance and Economics.
Institutional Review Board Statement
Not applicable.
Informed Consent Statement
Not applicable.
Data Availability Statement
In this study, the data are mainly obtained from the China Environmental Monitoring Center and China City Statistical Yearbook.
Conflicts of Interest
The authors declare no conflict of interest.
Appendix A

Table A1.
Classification of Central Heating in Chinese Cities.
| Province | Num. | Cities |
|---|---|---|
| (1) Municipal Central Heating (Treatment Group) | ||
| Beijing | 1 | Beijing |
| Tianjin | 1 | Tianjin |
| Hebei | 10 | Baoding, Langfang, Zhangjiakou, Chengde, Cangzhou, Shijiazhuang, Qinhuangdao, Hengshui, Xingtai, Handan |
| Inner Mongolia | 9 | Ulanqab, Wuhai, Baotou, Hulunbuir, Hohhot, Bayannur, Chifeng, Tongliao, Ordos |
| Shanxi | 11 | Linfen, Luliang, Datong, Taiyuan, Xinzhou, Jinzhong, Jincheng, Shuozhou, Yuncheng, Changzhi, Yangquan |
| Shandong | 16 | Dongying, Linyi, Weihai, Dezhou, Rizhao, Zaozhuang, Tai ’an, Jinan, Jining, Zibo, Binzhou, Weifang, Yantai, Liaocheng, Heze, Qingdao |
| Heilongjiang | 12 | Qitaihe, Yichun, Jiamusi, Shuangyashan, Harbin, Daqing, Mudanjiang, Suihua, Jixi, Hegang, Heihe,Tsitsihar |
| Jilin | 8 | Jilin, Siping, Songyuan, Baicheng, Baishan, Liaoyuan, Tonghua, Changchun |
| Liaoning | 14 | Dandong, Dalian, Fushun, Chaoyang, Benxi, Shenyang, Panjin, Yingkou,Huludao, Liaoyang, Tieling, Jinzhou, Fuxin, Anshan |
| Shaanxi | 10 | Xianyang, Shangluo, Ankang, Baoji, Yan’an, Yulin, Hanzhong, Weinan, Xi’an, Tongchuan |
| Ningxia | 5 | Zhongwei, Wuzhong, Guyuan, Shizuishan, Yinchuan |
| Gansu | 12 | Lanzhou, Jiayuguan, Tianshui, Dingxi, Pingliang, Qingyang, Zhangye, Wuwei, Baiyin, Jiuquan, Jinchang, Longnan |
| Qinghai | 3 | Haidong, Hainan Tibetan Autonomous Prefecture, Xining |
| Xinjiang | 4 | Urumqi, Karamay, Turpan, Hami |
| Henan | 15 | Sanmenxia, Nanyang, Shangqiu, Anyang, Pingdingshan, Kaifeng, Xinxiang, Luoyang, Luohe, Puyang, Jiaozuo, Xuchang, Zhengzhou, Zhumadian, Hebi |
| Anhui | 1 | Hefei |
| Jiangsu | 1 | Xuzhou |
| Total | 135 | |
| (2) Partial or District-based Heating (Treatment Group) | ||
| Anhui | 7 | Wuhu, Bengbu, Huainan, Suzhou, Huaibei, Fuyang, Bozhou |
| Jiangsu | 6 | Lianyungang, Changzhou, Nanjing, Yangzhou, Suzhou, Huai ’an |
| Hubei | 3 | Shiyan, Xiangyang, Jingmen |
| Guizhou | 1 | Liupanshui |
| Tibet | 2 | Lhasa, Naqu |
| Total | 19 | |
| (3) No municipal Central Heating (Control Group) | ||
| Henan | 2 | Xinyang, Zhoukou |
| Anhui | 8 | Lu’an, Anqing, Xuancheng, Chizhou, Chuzhou, Tongling, Maanshan, Huangshan |
| Jiangsu | 7 | Nantong, Suqian, Xuzhou, Wuxi, Taizhou, Yancheng, Zhenjiang |
| Hubei | 9 | Xianning, Xiaogan, Yichang, Wuhan, Jingzhou, Ezhou, Suizhou, Huanggang, Huangshi |
| Guizhou | 5 | Anshun, Bijie, Guiyang, Zunyi, Tongren |
| Sichuan | 17 | Leshan, Neijiang, Nanchong, Yibin, Bazhong, Guangyuan, Guang’an, Deyang, Chengdu, Panzhihua, Luzhou, Meishan, Mianyang, Zigong, Dazhou, Suining, Ya’an |
| Yunnan | 8 | Lincang, Lijiang, Baoshan, Kunming, Zhaotong, Pu’er, Qujing, Yuxi |
| Tibet | 4 | Shannan, Xigaze, Qamdo, Nyingchi |
| Shanghai | 1 | Shanghai |
| Chongqing | 1 | Chongqing |
| Zhejiang | 11 | Lishui, Taizhou, Jiaxing, Ningbo, Hangzhou, Wenzhou, Huzhou, Shaoxing, Zhoushan, Quzhou, Jinhua |
| Fujian | 9 | Sanming, Nanping, Xiamen, Ningde, Quanzhou, Zhangzhou, Fuzhou, Putian, Longyan |
| Jiangxi | 11 | Shangrao, Jiujiang, Nanchang, Ji’an, Yichun, Fuzhou, Xinyu, Jingdezhen, Pingxiang, Ganzhou, Yingtan |
| Hunan | 13 | Loudi, Yueyang, Changde, Zhangjiajie, Huaihua, Zhuzhou, Yongzhou, Xiangtan, Yiyang , Hengyang, Shaoyang, Chenzhou, Changsha |
| Guangdong | 21 | Dongguan, Zhongshan, Yunfu, Foshan, Guangzhou, Huizhou, Jieyang, Meizhou, Shantou, Shanwei, Jiangmen, Heyuan, Shenzhen, Qingyuan, Zhanjiang, Chaozhou, Zhuhai, Zhaoqing, Maoming, Yangjiang, Shaoguan |
| Guangxi | 14 | Beihai, Nanning, Chongzuo, Laibin, Liuzhou, Guilin, Wuzhou, Hechi, Yulin, Baise, Guigang, Hezhou, Qinzhou, Fangchenggang |
| Hainan | 4 | Sanya, Sansha, Danzhou, Haikou |
| Total | 145 | |
* Data Source: 2022 China Urban Construction Statistical Yearbook, supplemented with publicly available materials.
Table A2.
Balance Test Results of Nearest Neighbor Matching.
| Variable | Unmatched Matched |
Mean | %bias | %reduct |bias| |
t-test | ||
|---|---|---|---|---|---|---|---|
| Treated | Control | t | p>|t| | ||||
| LnGDP | U | 10.849 | 10.893 | -9.4 | 98.8 | -2.34 | 0.019 |
| M | 10.852 | 10.851 | 0.1 | 0.03 | 0.978 | ||
| LnPop | U | 5.466 | 5.995 | -65.3 | 94.7 | -16.49 | 0.000 |
| M | 5.484 | 5.513 | -3.5 | -0.77 | 0.444 | ||
| LnInd | U | 6.325 | 6.866 | -52.8 | 85.1 | -13.26 | 0.000 |
| M | 6.341 | 6.421 | -7.8 | -1.74 | 0.081 | ||
| Exp | U | 0.218 | 0.192 | 32.1 | 100.0 | 8.08 | 0.000 |
| M | 0.218 | 0.218 | 0.0 | 0.00 | 0.999 | ||
| IndStr | U | 0.458 | 0.447 | 14.7 | 13.9 | 3.68 | 0.000 |
| M | 0.457 | 0.466 | -12.6 | -3.04 | 0.002 | ||
Table A3.
Effect of REHP on Air Pollutant Concentration.
| (1) | (2) | (3) | (4) | |
|---|---|---|---|---|
| Dep.Variable | ||||
| Treat*Post | -0.1673*** | -0.0488*** | -0.0023 | -0.0066 |
| (0.0292) | (0.0168) | (0.0137) | (0.0125) | |
| LnGDP | -0.1394* | -0.0600 | 0.1063*** | 0.1124*** |
| (0.0833) | (0.0441) | (0.0382) | (0.0368) | |
| LnPop | 0.2232 | -0.0606 | -0.1329 | 0.0123 |
| (0.3092) | (0.1267) | (0.1144) | (0.1434) | |
| LnInd | 0.0411 | 0.0418 | 0.0656*** | -0.0009 |
| (0.0545) | (0.0273) | (0.0225) | (0.0195) | |
| Exp | -0.1253 | -0.2386 | 0.0522 | -0.0245 |
| (0.3556) | (0.2061) | (0.1726) | (0.1870) | |
| IndStr | -0.2473 | -0.0665 | -0.1422 | -0.2006* |
| (0.2457) | (0.1420) | (0.1171) | (0.1157) | |
| City FEs | Yes | Yes | Yes | Yes |
| Year FEs | Yes | Yes | Yes | Yes |
| Observation | 2504 | 2504 | 2504 | 2504 |
| adj. | 0.867 | 0.842 | 0.913 | 0.916 |
Notes: This table presents the results of the effect of the REHP on air pollutant concentrations, including sulfur dioxide (), carbon monoxide (), nitrogen dioxide (), and particulate matter (), as estimated using the benchmark DID model. Robust standard errors are reported in parentheses. Significance levels are denoted by *, **, and *** for the 10%, 5%, and 1% levels, respectively.
Figure A1.
Municipal Central Heating in China.
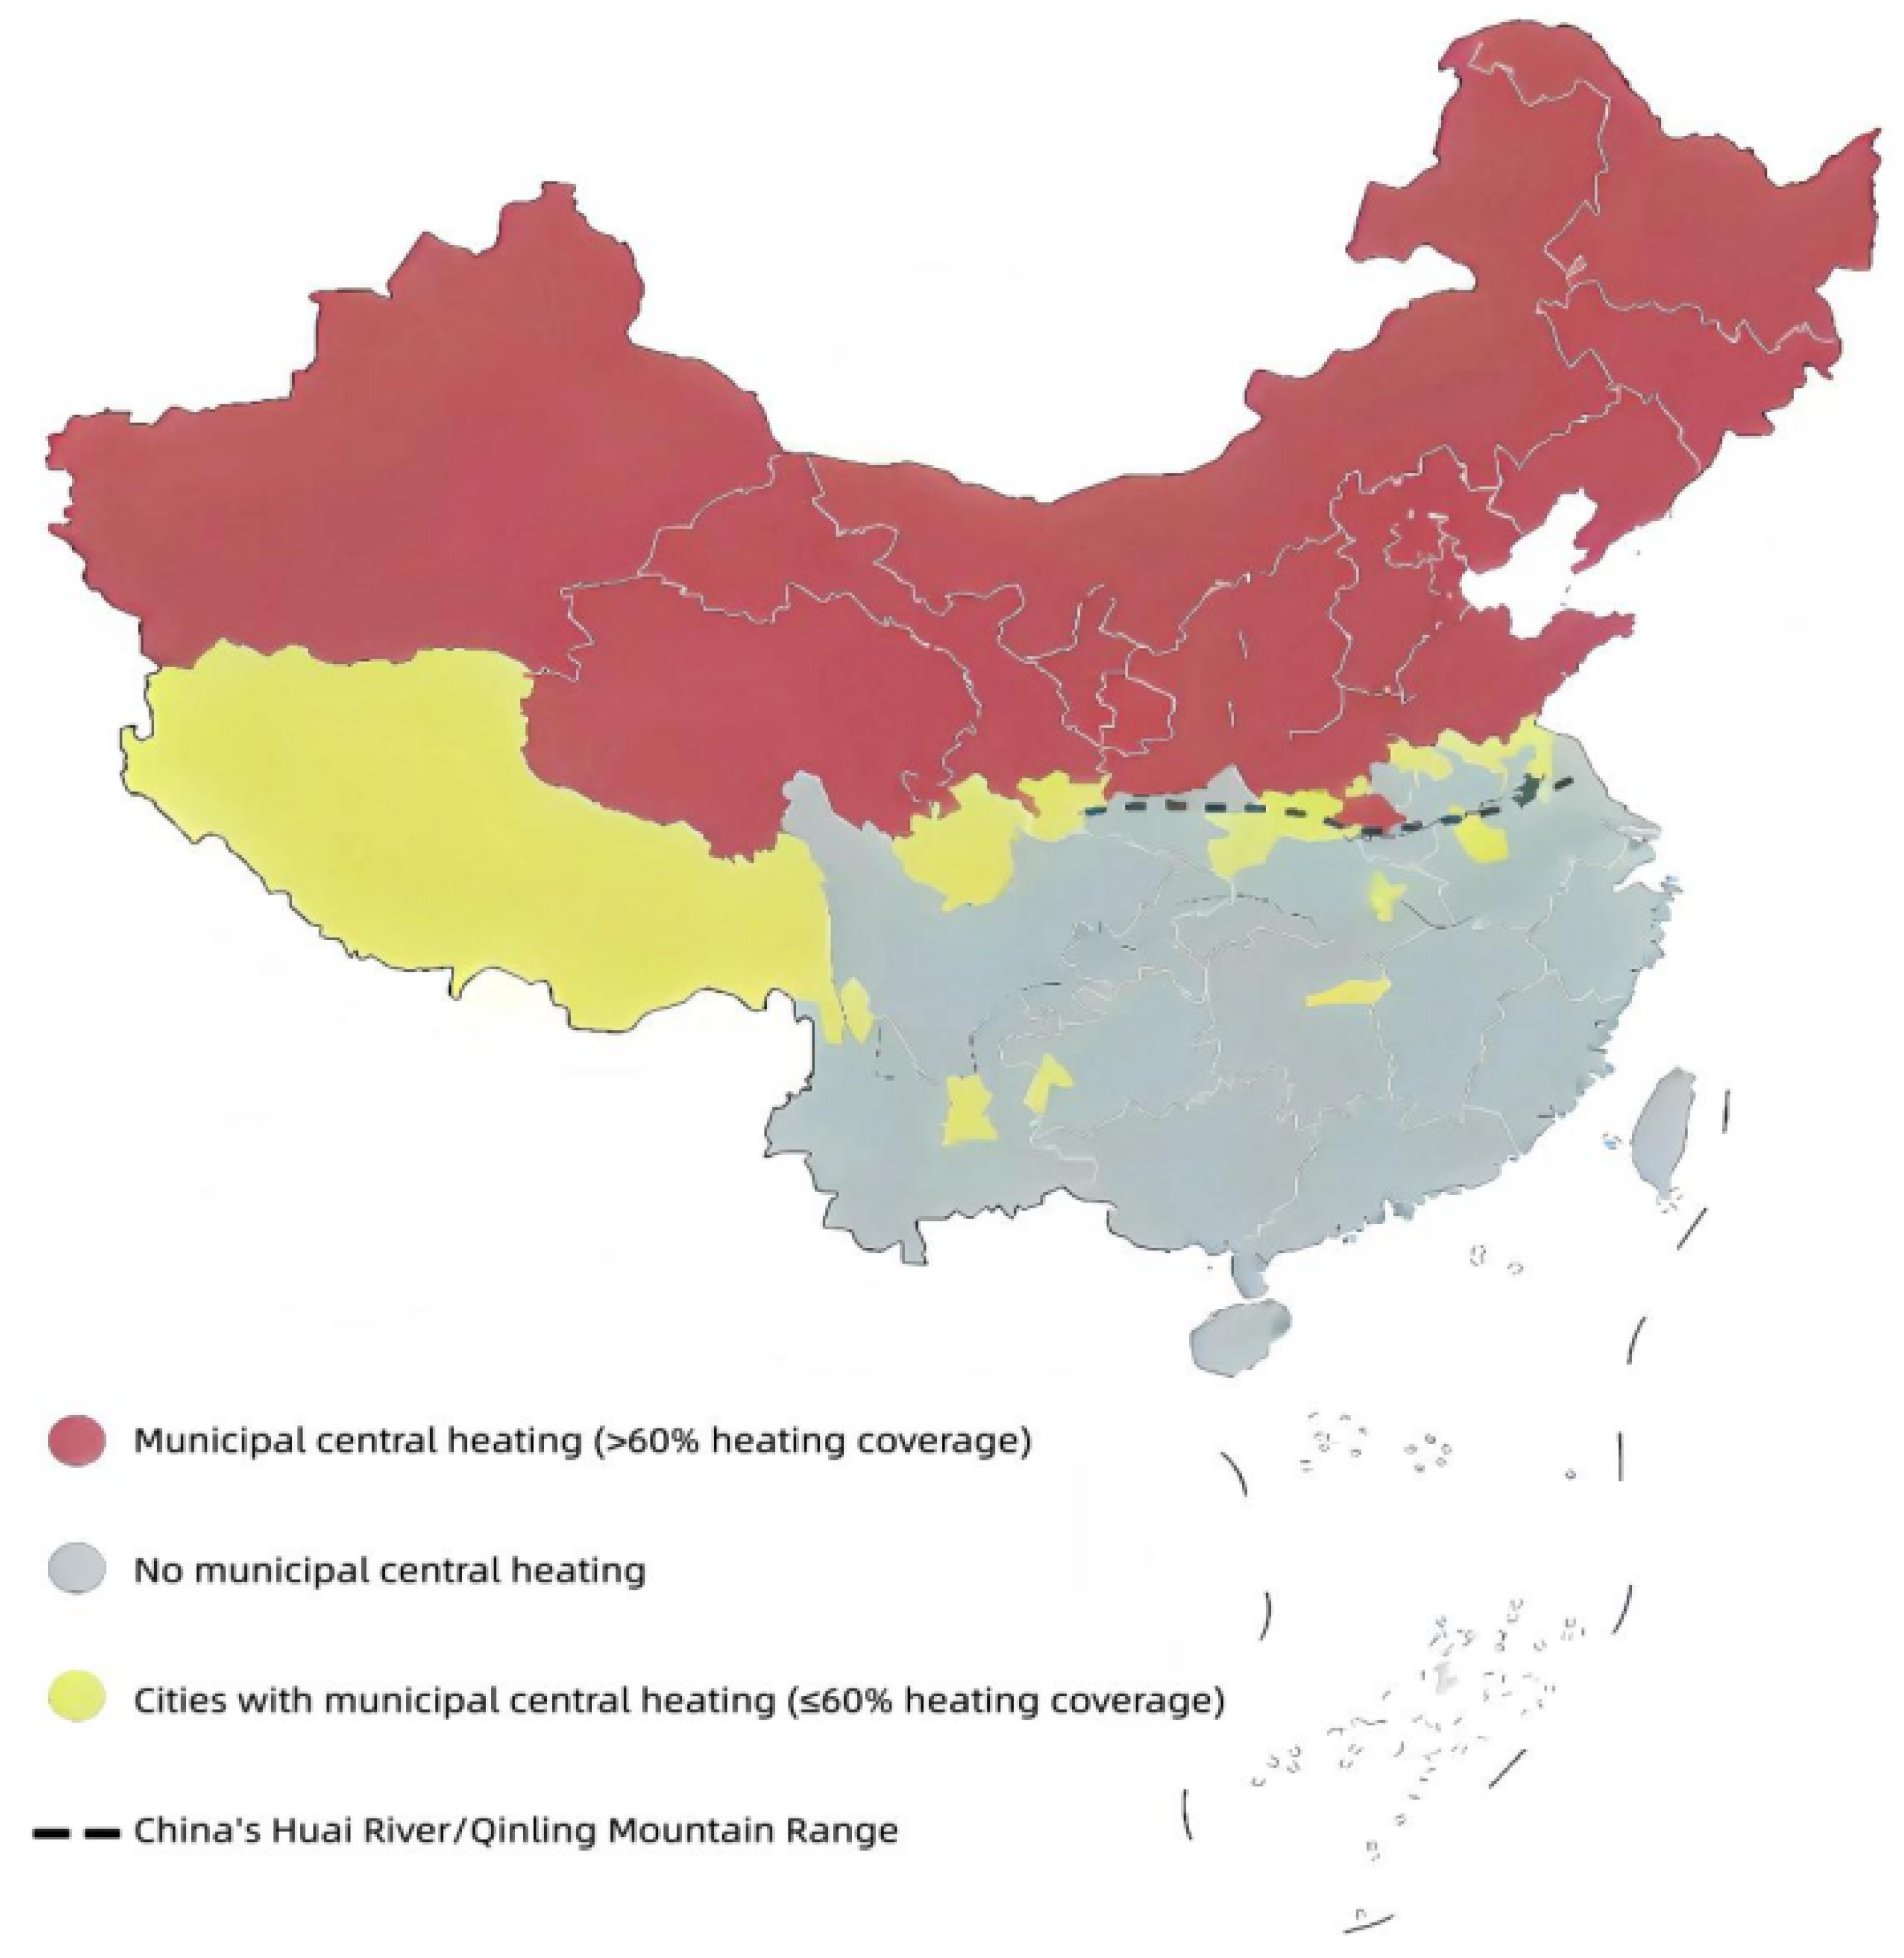
Figure A2.
PSM Balance Test Results.
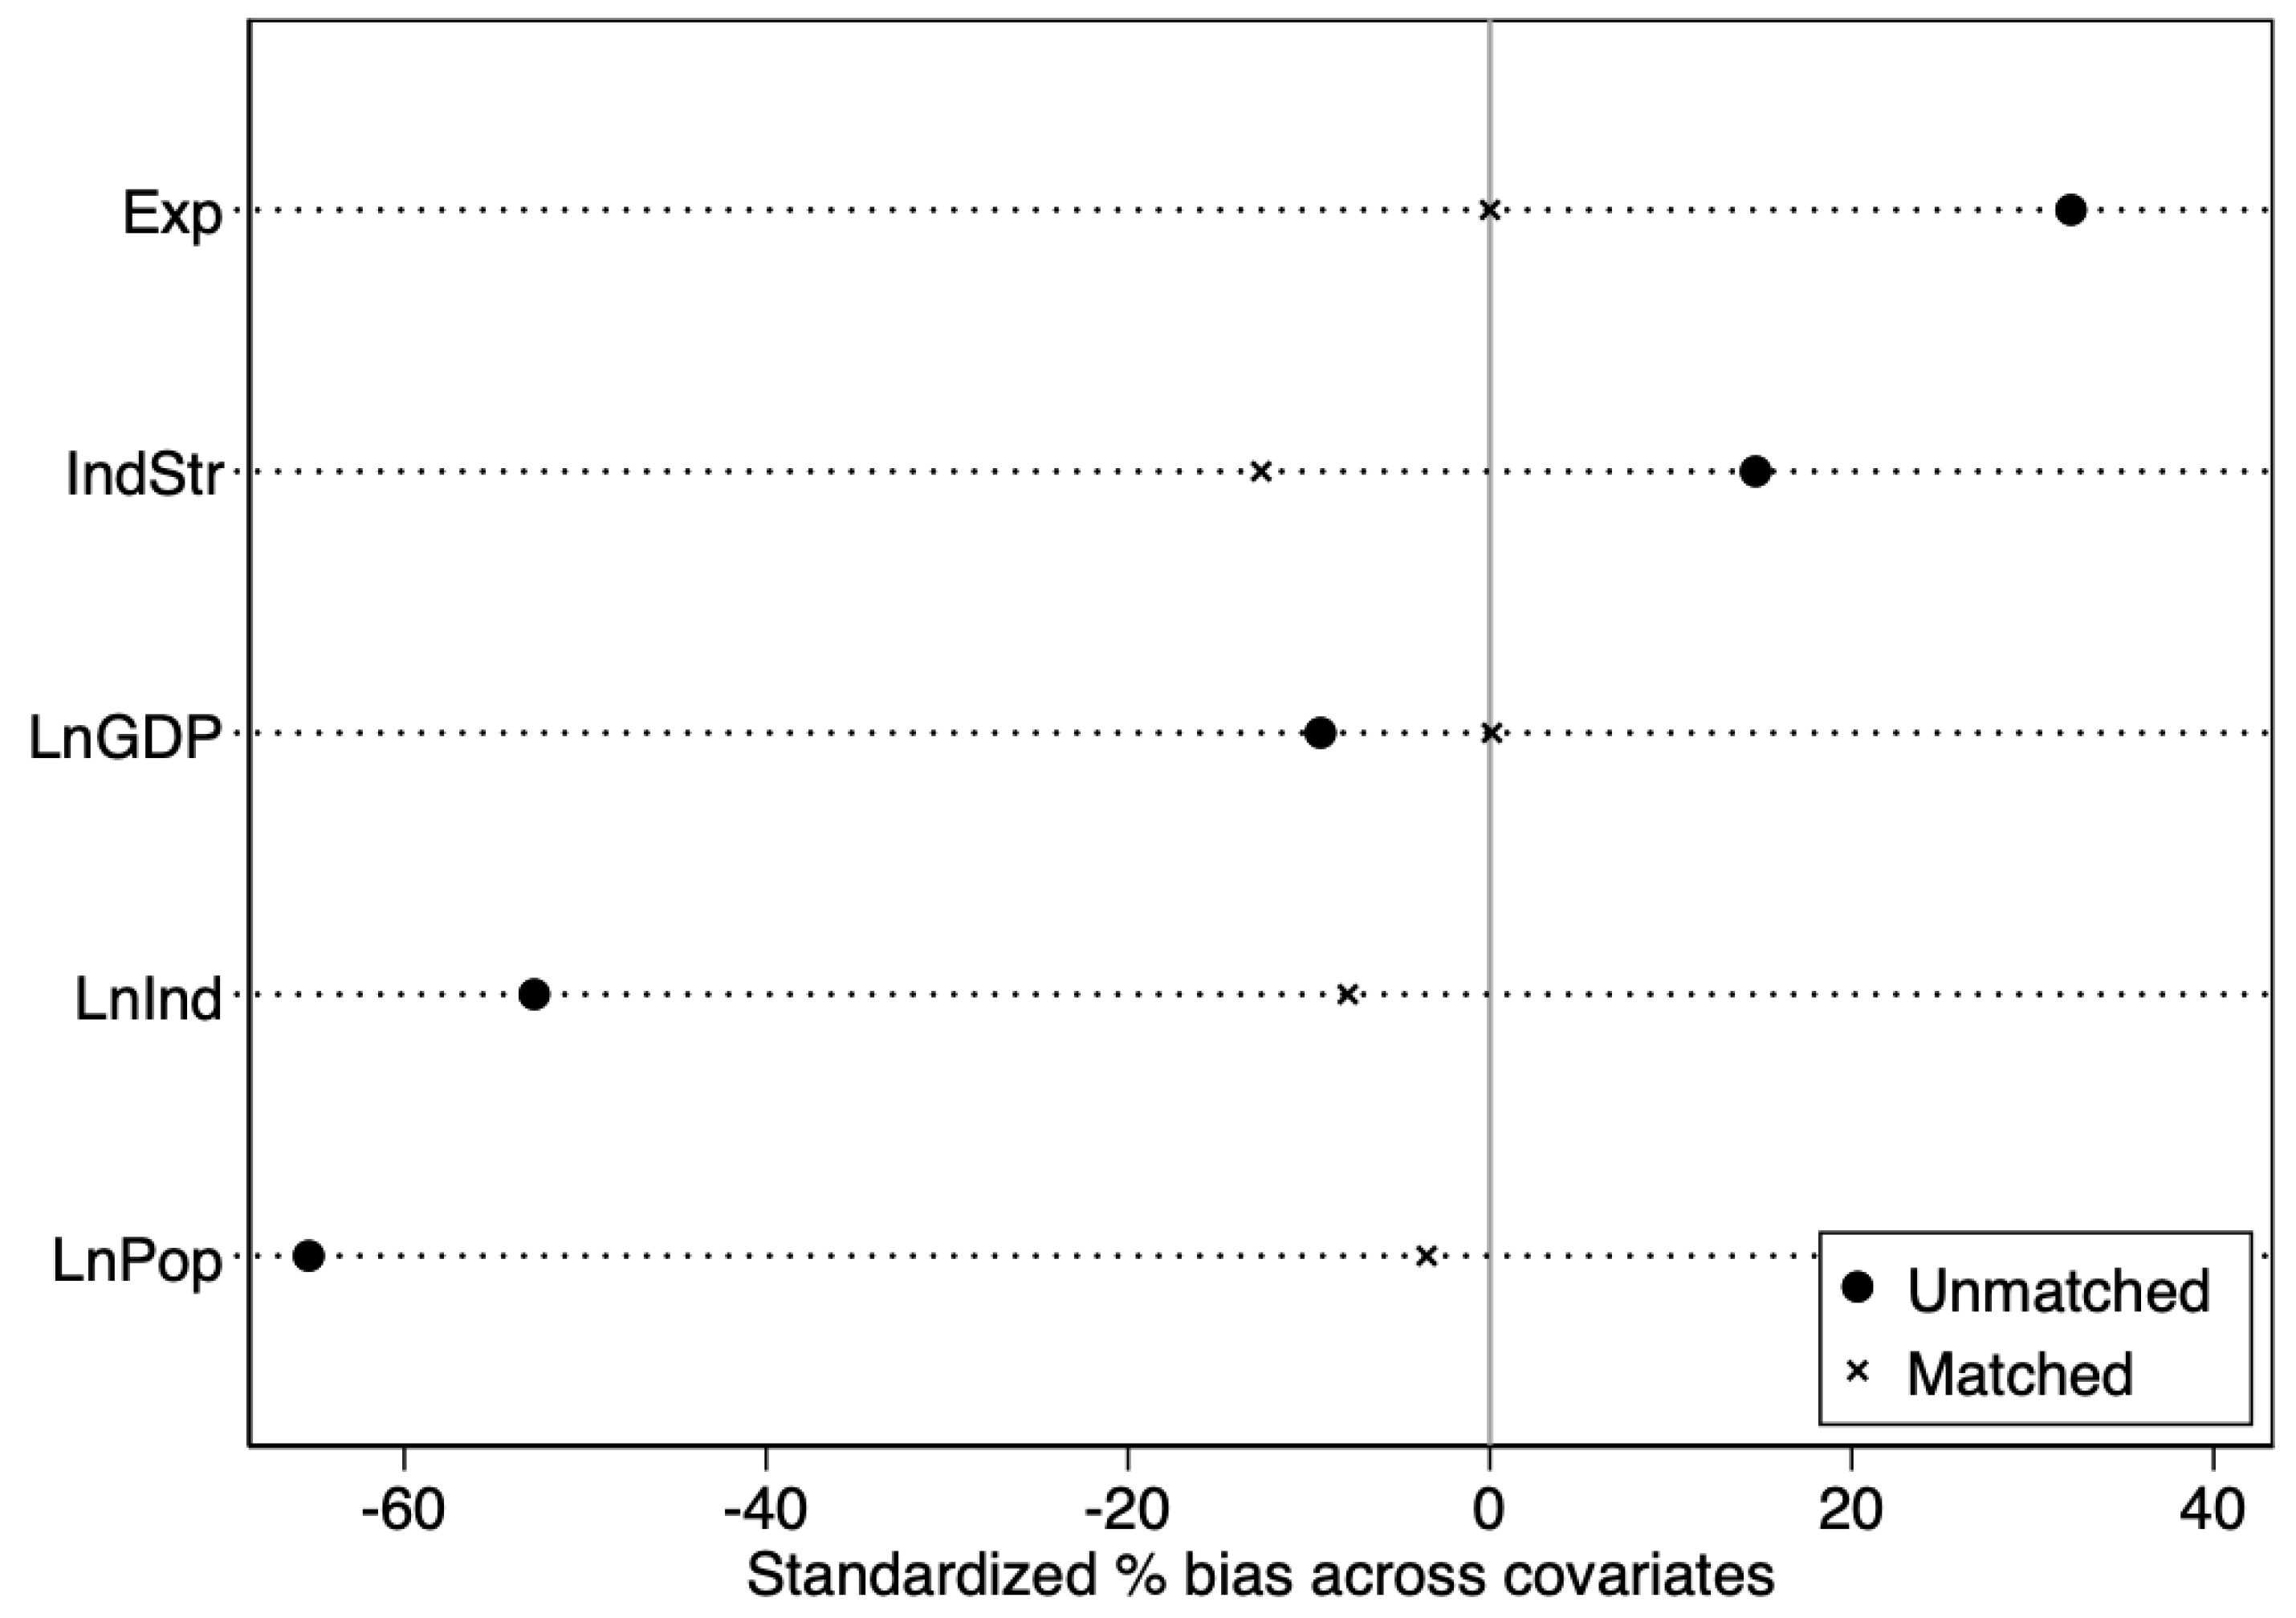
Figure A3.
Kernel Density Curve of Propensity Score before and after Matching.
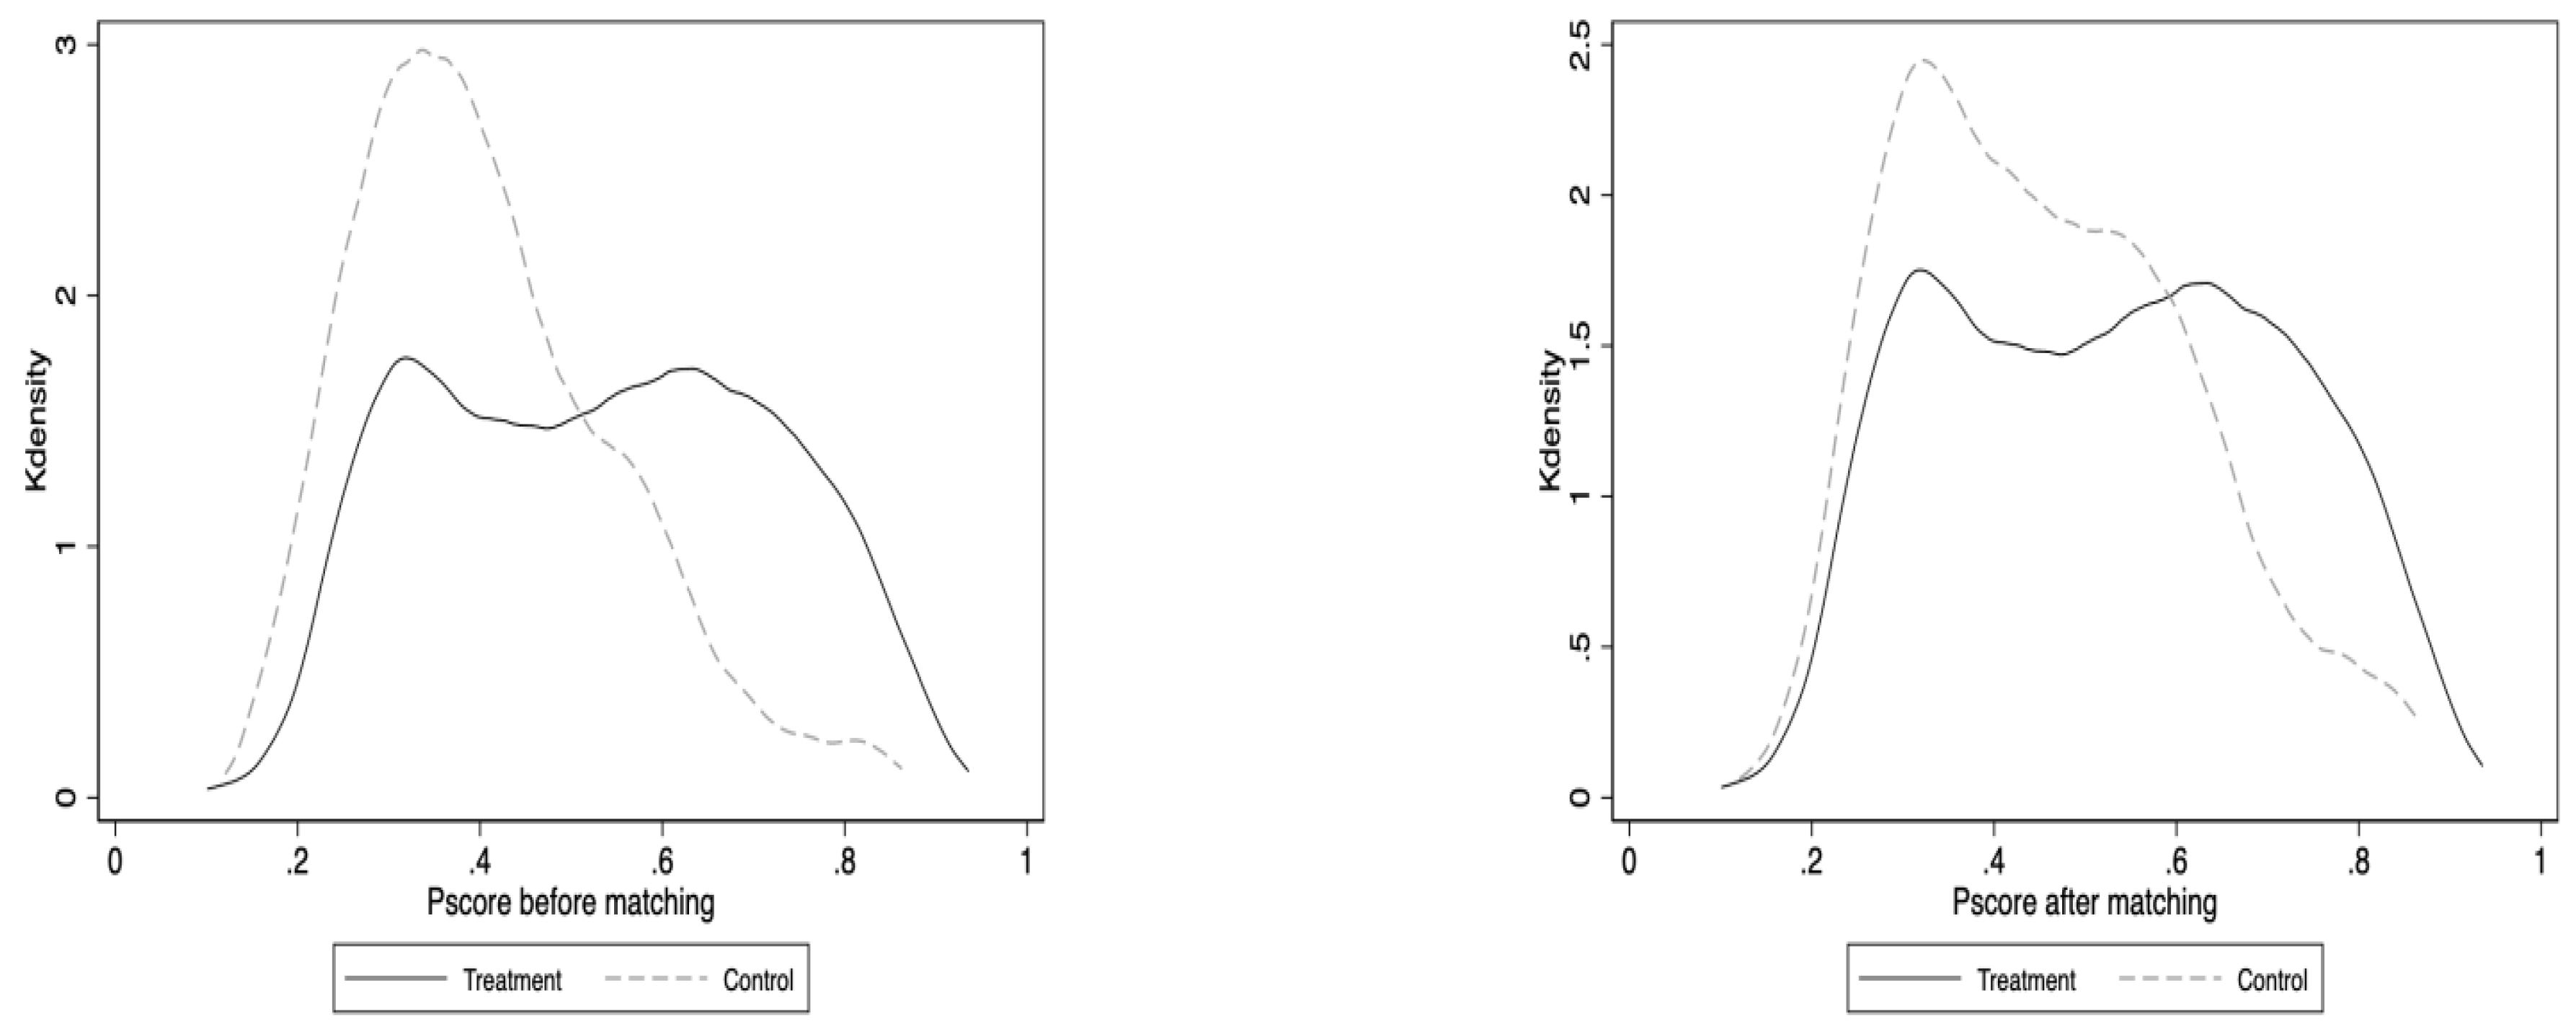
Figure A4.
Placebo Tests - Fictitious Treatment Group.
References
- Cesur, R., Tekin, E., and Ulker, A. (2017). Air pollution and infant mortality: evidence from the expansion of natural gas infrastructure. The Economic Journal, 127(600):330–362. [CrossRef]
- Beach, B. and Hanlon, W. W. (2018). Coal smoke and mortality in an early industrial economy. The Economic Journal, 128(615): 2652–2675. [CrossRef]
- Johnsen, R., LaRiviere, J., and Wolff, H. (2019). Fracking, coal, and air quality. Journal of the Association of Environmental and Resource Economists, 6(5):1001–1037.
- Chu, Y., Holladay, J. S., Qiu, Y., Tian, X.-L., and Zhou, M. (2023). Air pollution and mortality impacts of coal mining: Evidence from coalmine accidents in china. Journal of Environmental Economics and Management, 121, 102846. [CrossRef]
- Sweidan, O. D. (2021). The geopolitical risk effect on the us renewable energy deployment. Journal of Cleaner Production, 293, 126189. [CrossRef]
- Lee, C.-C., Hussain, J., and Chen, Y. (2022). The optimal behavior of renewable energy resources and government’s energy consumption subsidy design from the perspective of green technology implementation. Renewable Energy, 195:670–680. [CrossRef]
- Onder, M. and Yigit, E. (2009). Assessment of respirable dust exposures in an opencast coal mine. Environmental Monitoring and Assessment, 152:393–401. [CrossRef]
- Aneja, V. P., Isherwood, A., and Morgan, P. (2012). Characterization of particulate matter (pm10) related to surface coal mining operations in appalachia. Atmospheric Environment, 54:496–501. [CrossRef]
- Knuckles, T. L., Stapleton, P. A., Minarchick, V. C., Esch, L., McCawley, M., Hendryx, M., and Nurkiewicz, T. R. (2013). Air pollution particulate matter collected from an appalachian mountaintop mining site induces microvascular dysfunction. Microcirculation, 20(2):158–169. [CrossRef]
- Ito, K. and Zhang, S. (2020). Willingness to pay for clean air: Evidence from air purifier markets in china. Journal of Political Economy, 128(5):1627–1672. [CrossRef]
- Chen, Y., Ebenstein, A., Greenstone, M., and Li, H. (2013). Evidence on the impact of sustained exposure to air pollution on life expectancy from china’s huai river policy. Proceedings of the National Academy of Sciences, 110(32):12936–12941. [CrossRef]
- Fan, M., He, G., and Zhou, M. (2020). The winter choke: coal-fired heating, air pollution, and mortality in china. Journal of Health Economics, 71:102316. [CrossRef]
- Lin, J. and Mou, D. (2021). Analysis of the optimal spatial distribution of natural gas under ‘transition from coal to gas’ in china. Resource and Energy Economics, 66:101259. [CrossRef]
- Arora, V., Cai, Y., and Jones, A. (2016). The national and international impacts of coal-to-gas switching in the chinese power sector. Energy Economics, 60:416–426. [CrossRef]
- Liu, H. and Mauzerall, D. L. (2020). Costs of clean heating in china: Evidence from rural households in the beijing-tianjin-hebei region. Energy Economics, 90:104844. [CrossRef]
- Zhang, Y., Li, W., and Wu, F. (2020). Does energy transition improve air quality? Evidence derived from china’s Winter Clean Heating Pilot (WCHP) project. Energy, 206:118130. [CrossRef]
- Song, C., Liu, B., Cheng, K., Cole, M. A., Dai, Q., Elliott, R. J., and Shi, Z. (2023). Attribution of air quality benefits to clean winter heating policies in china: combining machine learning with causal inference. Environmental Science & Technology, 57(46):17707–17717. [CrossRef]
- Tan, X., Chen, G., and Chen, K. (2023). Clean heating and air pollution: Evidence from northern china. Energy Reports, 9:303–313. [CrossRef]
- Zhou, X. and Feng, C. (2017). The impact of environmental regulation on fossil energy consumption in china: Direct and indirect effects. Journal of Cleaner Production, 142:3174–3183. [CrossRef]
- Zhao, J., Jiang, Q., Dong, X., and Dong, K. (2020). Would environmental regulation improve the greenhouse gas benefits of natural gas use? A chinese case study. Energy Economics, 87:104712. [CrossRef]
- Wang, E. Z. and Lee, C. C. (2022). The impact of clean energy consumption on economic growth in china: is environmental regulation a curse or a blessing? International Review of Economics & Finance, 77:39–58.
- Lee, C. C., Yuan, Z., Lee, C. C., and Chang, Y. F. (2022b). The impact of renewable energy technology innovation on energy poverty: does climate risk matter? Energy Economics, 116:106427.
- Lee, C. C., Chen, M. P., and Yuan, Z. (2023). Is information and communication technology a driver for renewable energy? Energy Economics, 124:106786.
- Madaleno, M., Dogan, E., and Taskin, D. (2022). A step forward on sustainability: The nexus of environmental responsibility, green technology, clean energy and green finance. Energy Economics, 109:105945. [CrossRef]
- Khan, K., Su, C. W., Rehman, A. U., and Ullah, R. (2022). Is technological innovation a driver of renewable energy? Technology in Society, 70:102044.
- Lee, C. C., Yuan, Z., Lee, C. C., and Chang, Y.-F. (2022c). The impact of renewable energy technology innovation on energy poverty: does climate risk matter? Energy Economics, 116:106427.
- Lee, C. C. and Wang, C. S. (2022). Does natural resources matter for sustainable energy development in china: The role of technological progress. Resources Policy, 79:103077. [CrossRef]
- Almond, D., Chen, Y., Greenstone, M., and Li, H. (2009). Winter heating or clean air? unintended impacts of china’s huai river policy. American Economic Review, 99(2):184–190. [CrossRef]
- National Research Council (2005). Urbanization, Energy, and Air Pollution in China: The Challenges Ahead: Proceedings of a Symposium. Washington, DC: National Academies Press..
- Chen, Z., Kahn, M. E., Liu, Y., and Wang, Z. (2018). The consequences of spatially differentiated water pollution regulation in china. Journal of Environmental Economics and Management, 88:468–485. [CrossRef]
- Su, Y., Chen, X., Li, Y., Liao, J., Ye, Y., Zhang, H., Huang, N., and Kuang, Y. (2014). China’s 19-year city-level carbon emissions of energy consumptions, driving forces and regionalized mitigation guidelines. Renewable and Sustainable Energy Reviews, 35:231–243.
- Shi, K., Chen, Y., Yu, B., Xu, T., Yang, C., Li, L., Huang, C., Chen, Z., Liu, R., and Wu, J. (2016). Detecting spatiotemporal dynamics of global electric power consumption using DMSP-OLS nighttime stable light data. Applied energy, 184:450–463. [CrossRef]
- Elvidge, C. D., Baugh, K. E., Kihn, E. A., Kroehl, H. W., Davis, E. R., and Davis, C. W. (1997). Relation between satellite observed visible-near infrared emissions, population, economic activity and electric power consumption. International Journal of Remote Sensing, 18(6):1373–1379. [CrossRef]
- Chand, T. K., Badarinath, K., Elvidge, C., and Tuttle, B. (2009). Spatial characterization of electrical power consumption patterns over india using temporal DMSP-OLS night-time satellite data. International Journal of Remote Sensing, 30(3):647–661. [CrossRef]
- Townsend, A. C. and Bruce, D. A. (2010). The use of night-time lights satellite imagery as a measure of australia’s regional electricity consumption and population distribution. International Journal of Remote Sensing, 31(16):4459–4480. [CrossRef]
- Rosenbaum, P. R. and Rubin, D. B. (1984). Reducing bias in observational studies using subclassification on the propensity score. Journal of the American statistical Association, 79(387):516–524.
- D’Agostino Jr, R. B. (1998). Propensity score methods for bias reduction in the comparison of a treatment to a non-randomized control group. Statistics in Medicine, 17(19):2265–2281.
- Gao, Y. and Sampattavanija, S. (2022). Air quality and winter heating: some evidence from china. International Journal of Energy Economics and Policy, 12(4):455–469. [CrossRef]
- Aw, J. and Kleeman, M. J. (2003). Evaluating the first-order effect of intraannual temperature variability on urban air pollution. Journal of Geophysical Research: Atmospheres, 108(D12). [CrossRef]
- Dominick, D., Latif, M. T., Juahir, H., Aris, A. Z., and Zain, S. M. (2012). An assessment of influence of meteorological factors on pm sub (10) and no sub (2) at selected stations in malaysia. Sustainable Environment Research, 22(5):305–315.
- Jayamurugan, R., Kumaravel, B., Palanivelraja, S., and Chockalingam, M. (2013). Influence of temperature, relative humidity and seasonal variability on ambient air quality in a coastal urban area. International Journal of Atmospheric Sciences, 2013(1):264046. [CrossRef]
- Yang, D., Wang, X., Xu, J., Xu, C., Lu, D., Ye, C., Wang, Z., and Bai, L. (2018). Quantifying the influence of natural and socioeconomic factors and their interactive impact on pm2. 5 pollution in china. Environmental Pollution, 241:475–483. [CrossRef]
- Bickerstaff, K. and Walker, G. (2001). Public understandings of air pollution: the ‘localisation’of environmental risk. Global Environmental Change, 11(2):133–145.
- Wang, S., Zhang, R., Wan, L., and Chen, J. (2023). Has central government environmental protection interview improved air quality in china? Ecological Economics, 206:107750.
- Jayasooriya, V., Ng, A., Muthukumaran, S., and Perera, B. (2017). Green infrastructure practices for improvement of urban air quality. Urban Forestry & Urban Greening, 21:34–47. [CrossRef]
- Chen, Y., Yao, Z., and Zhong, K. (2022). Do environmental regulations of carbon emissions and air pollution foster green technology innovation: evidence from china’s prefecture-level cities. Journal of Cleaner Production, 350:131537. [CrossRef]
- Semenza, J. C., Wilson, D. J., Parra, J., Bontempo, B. D., Hart, M., Sailor, D. J., and George, L. A. (2008). Public perception and behavior change in relationship to hot weather and air pollution. Environmental Research, 107(3):401–411. [CrossRef]
- Maione, M., Mocca, E., Eisfeld, K., Kazepov, Y., and Fuzzi, S. (2021). Public perception of air pollution sources across europe. Ambio, 50(6):1150–1158. [CrossRef]
- Porter, M. E. and Linde, C. v. d. (1995). Toward a new conception of the environment-competitiveness relationship. Journal of Economic Perspectives, 9(4):97–118.
- Abadie, A. and Imbens, G. W. (2006). Large sample properties of matching estimators for average treatment effects. Econometrica, 74(1):235–267. [CrossRef]
- Baser, O. (2006). Too much ado about propensity score models? comparing methods of propensity score matching. Value in Health, 9(6):377–385. [CrossRef]
- Benedetto, U., Head, S. J., Angelini, G. D., and Blackstone, E. H. (2018). Statistical primer: propensity score matching and its alternatives. European Journal of Cardio-Thoracic Surgery, 53(6):1112–1117. [CrossRef]
| 1 | The data are openly accessible at https://air.cnemc.cn:18007/. |
| 2 | These terms include "environmental protection", "pollution", "energy", "emission", "sewage", "ecology", "green", "low carbon", "air", "sulfur dioxide", "carbon dioxide", "PM10", and "PM2.5", etc. |
| 3 | The only exception is the industrial structure variable (IndStr), which, although slightly above 10%, remains within the acceptable range of below 20%. |
| 4 | Data source: Decarbonize Urban Heating System: China Building Energy and Emission Yearbook 2023. Springer Nature, 2023. |
Figure 1.
Parallel Trend Test and Dynamic Implications.
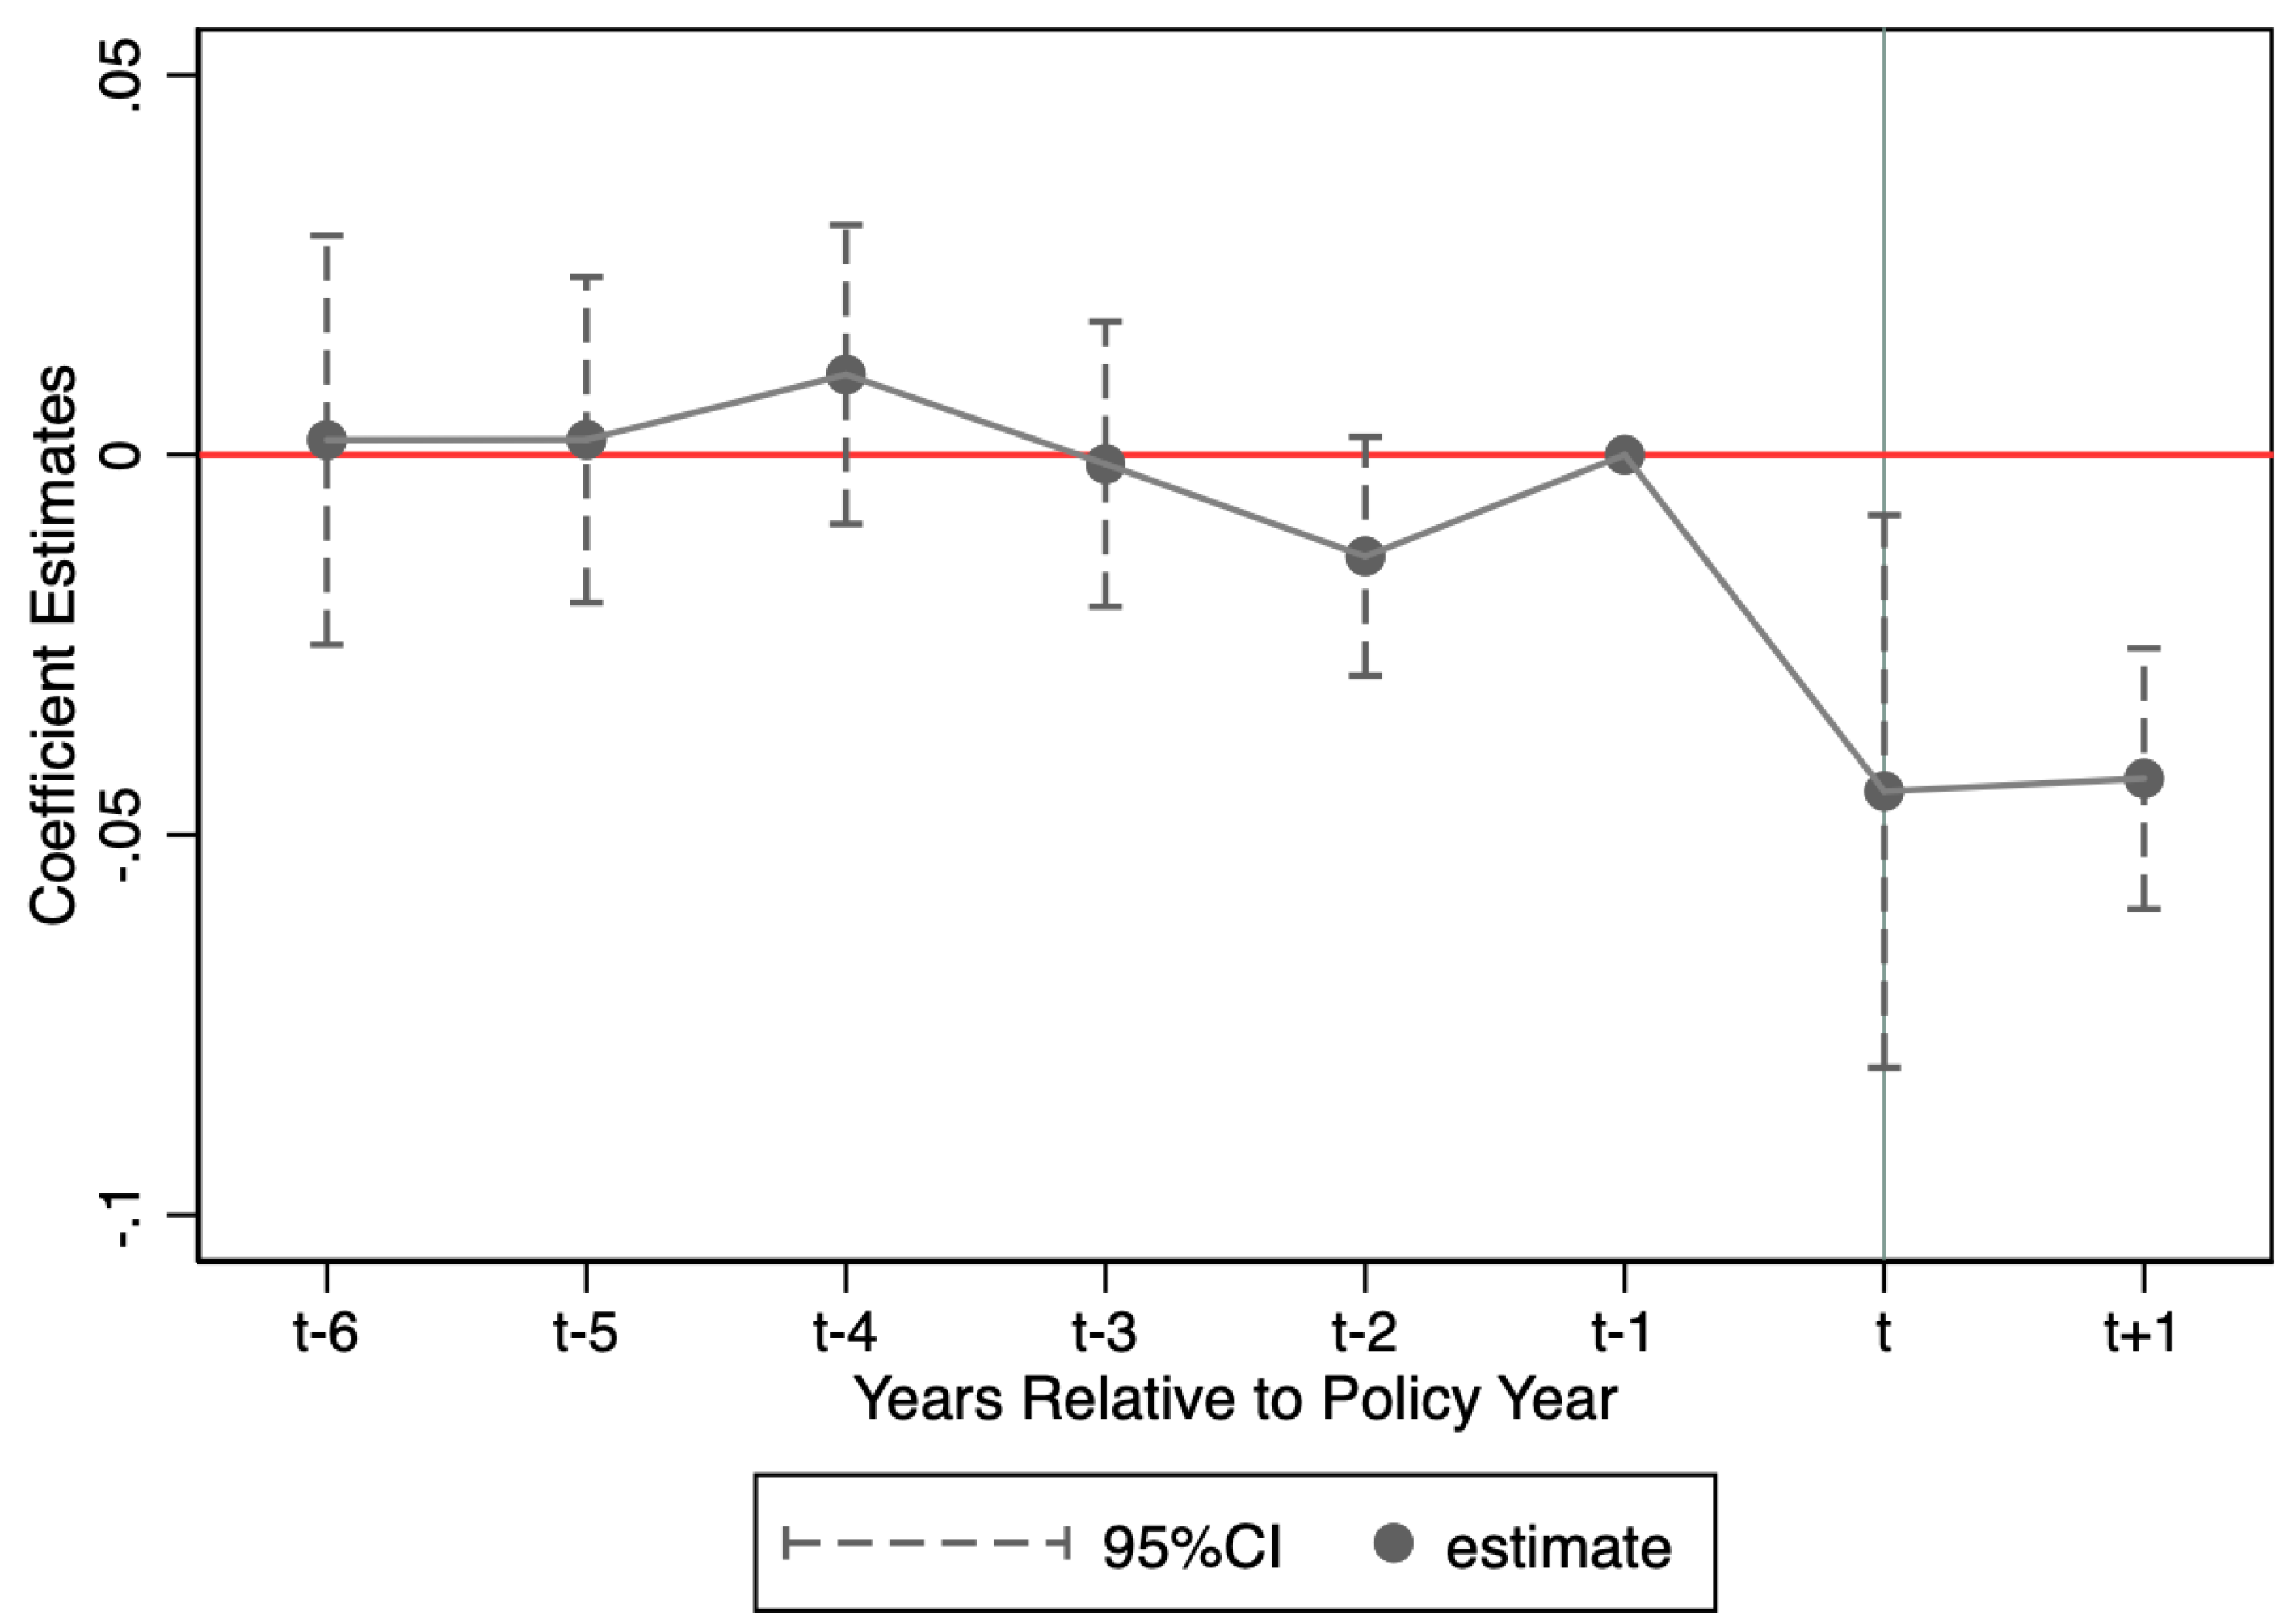
Table 1.
Definition of Main Variables.
| Variable | Definition | |
|---|---|---|
| LnAQI | Log of Air Quality Index | |
| LnSO2 | Log of the average annual SO2 concentration | |
| LnCO | Log of the average annual CO concentration | |
| LnNO2 | Log of the average annual NO2 concentration | |
| LnPM25 | Log of the average annual PM2.5 concentration | |
| LnGDP | Log of GDP per capita | |
| LnPop | Log of population density | |
| LnInd | Log of number of industrial enterprises above designated size | |
| Exp | Ratio of government general public budget expenditure of GDP | |
| IndStr | Proportion of added value of tertiary industry | |
| LnCoal | Total consumption of standard coal | |
| EnvReg | Log of (1+Word frequency of environment in the government work report) | |
| TechExp | Ratio of government expenditure on science and technology to GDP |
Table 2.
Summary Statistics.
| Panel A: Comparison of air quality and energy consumption | |||||||||||||||
|---|---|---|---|---|---|---|---|---|---|---|---|---|---|---|---|
| Variable | Central heating Regions | Non-Central Heating Regions | Diff. in Mean |
T-stat | |||||||||||
| Obs. | Mean | Std. Dev. | Obs. | Mean | Std. Dev. | ||||||||||
| LnAQI | 1180 | 4.401 | 0.238 | 1349 | 4.214 | 0.259 | 0.188*** | 18.908 | |||||||
| LnSO2 | 1180 | 2.808 | 0.645 | 1349 | 2.417 | 0.552 | 0.391*** | 16.415 | |||||||
| LnCO | 1180 | -0.136 | 0.361 | 1349 | -0.197 | 0.288 | 0.061*** | 4.698 | |||||||
| LnNO2 | 1180 | 3.381 | 0.338 | 1349 | 3.208 | 0.377 | 0.174*** | 12.107 | |||||||
| LnPM25 | 1180 | 3.732 | 0.370 | 1349 | 3.566 | 0.421 | 0.166*** | 10.441 | |||||||
| LnCoal | 1242 | 11.58 | 0.866 | 1431 | 11.46 | 0.830 | 0.119*** | 3.628 | |||||||
| Panel B: Descriptive statistics of variables in whole sample | |||||||||||||||
| Variable | Obs. | Mean | Min | Max | Median | Std. Dev | |||||||||
| LnAQI | 2529 | 4.301 | 3.521 | 5.129 | 4.313 | 0.266 | |||||||||
| LnSO2 | 2529 | 2.600 | 0.734 | 4.770 | 2.519 | 0.628 | |||||||||
| LnCO | 2529 | -0.169 | -1.147 | 1.017 | -0.193 | 0.325 | |||||||||
| LnNO2 | 2529 | 3.289 | 1.540 | 4.190 | 3.320 | 0.370 | |||||||||
| LnPM25 | 2529 | 3.643 | 1.720 | 4.817 | 3.648 | 0.407 | |||||||||
| LnCoal | 2673 | 11.52 | 7.406 | 13.60 | 11.53 | 0.849 | |||||||||
| LnGDP | 2642 | 10.88 | 9.227 | 12.46 | 10.85 | 0.527 | |||||||||
| LnPop | 2654 | 5.663 | 0.244 | 8.100 | 5.848 | 1.092 | |||||||||
| LnInd | 2647 | 6.556 | 1.099 | 9.536 | 6.600 | 1.203 | |||||||||
| Exp | 2642 | 0.221 | 0.0440 | 2.060 | 0.184 | 0.141 | |||||||||
| IndStr | 2642 | 0.454 | 0.198 | 0.839 | 0.450 | 0.0920 | |||||||||
| EnvReg | 2549 | 3.831 | 1.386 | 4.942 | 3.871 | 0.409 | |||||||||
| TechExp | 2649 | 10.57 | 6.252 | 15.53 | 10.47 | 1.511 | |||||||||
Notes: Panel A compares air quality and energy consumption between regions with central heating and those without. The differences in means are reported, with statistical significance indicated by *, **, and *** at the 10%, 5%, and 1% levels, respectively. Panel B provides descriptive statistics for all variables in the whole sample.
Table 3.
Effect of REHP on Air Quality Index.
| (1) | (2) | (3) | (4) | |
|---|---|---|---|---|
| Model | Benchmark DID | PSM-DID | ||
| Dep.Variable | AQI | AQI | AQI | AQI |
| Treat*Post | -0.0215*** | -0.0195*** | -0.0404*** | -0.0359*** |
| (0.0074) | (0.0068) | (0.0096) | (0.0088) | |
| LnGdp | 0.0695*** | 0.1213*** | ||
| (0.0213) | (0.0273) | |||
| LnPop | 0.1960** | 0.0414 | ||
| (0.0831) | (0.1596) | |||
| LnInd | 0.0052 | -0.0220 | ||
| (0.0118) | (0.0192) | |||
| Exp | -0.0864 | -0.1710 | ||
| (0.1035) | (0.1559) | |||
| IndStr | -0.2040*** | -0.1583 | ||
| (0.0623) | (0.1040) | |||
| City FEs | Yes | Yes | Yes | Yes |
| Year FEs | Yes | Yes | Yes | Yes |
| Observation | 2529 | 2504 | 1146 | 1146 |
| adj. | 0.923 | 0.929 | 0.935 | 0.938 |
Notes: This table presents the baseline results on the effect of REHP on the Air Quality Index (AQI). Columns (1) and (2) provide estimates from the benchmark DID model, while Columns (3) and (4) show the results after applying 1:1 nearest neighbor matching. Robust standard errors are reported in parentheses. Significance levels are indicated by *, **, and *** for the 10%, 5%, and 1% levels, respectively.
Table 4.
Effect of REHP on Air Pollutant Concentration.
| (1) | (2) | (3) | (4) | |
|---|---|---|---|---|
| Dep.Variable | ||||
| Treat*Post | -0.2831*** | -0.0757* | -0.0572*** | -0.0715*** |
| (0.0372) | (0.0411) | (0.0204) | (0.0202) | |
| LnGDP | -0.0906 | -0.0898 | 0.1940*** | 0.0478 |
| (0.1326) | (0.0710) | (0.0476) | (0.0615) | |
| LnPop | -0.1016 | 0.0019 | -0.0816 | -0.3206 |
| (0.5075) | (0.2764) | (0.2632) | (0.2138) | |
| LnInd | 0.0819 | 0.0490 | -0.1028*** | 0.0886** |
| (0.0674) | (0.0540) | (0.0367) | (0.0370) | |
| Exp | -0.2803 | -0.8172** | -0.2974 | -0.2161 |
| (0.5118) | (0.4121) | (0.2926) | (0.2932) | |
| IndStr | 0.1656 | 0.4083 | -0.0219 | -0.3149 |
| (0.3666) | (0.3381) | (0.2262) | (0.1922) | |
| City FEs | Yes | Yes | Yes | Yes |
| Year FEs | Yes | Yes | Yes | Yes |
| Observation | 1146 | 1146 | 1146 | 1146 |
| adj. | 0.887 | 0.862 | 0.939 | 0.933 |
Notes: This table presents the results of the effect of the REHP on air pollutant concentrations, including sulfur dioxide (), carbon monoxide (), nitrogen dioxide (), and particulate matter (), as estimated using a PSM-DID model. Robust standard errors are reported in parentheses. Significance levels are denoted by *, **, and *** for the 10%, 5%, and 1% levels, respectively.
Table 5.
Effect of REHP on Air Pollutant Concentration.
| (1) | (2) | (3) | (4) | (5) | ||
|---|---|---|---|---|---|---|
| Temperature Heterogeneity | Region Heterogeneity | |||||
| Low | High | East | Middle | West | ||
| Dep.Variable | AQI | AQI | AQI | AQI | AQI | |
| Treat*Post | -0.0542*** | -0.0281*** | -0.0648*** | -0.0014 | 0.0188 | |
| (0.0122) | (0.0088) | (0.0081) | (0.0113) | (0.0152) | ||
| LnGDP | 0.1051*** | 0.0179 | 0.0616* | 0.0856** | 0.0679 | |
| (0.0311) | (0.0309) | (0.0315) | (0.0355) | (0.0511) | ||
| LnPop | 0.0985 | 0.3146* | 0.3028*** | 0.1291 | 0.0672 | |
| (0.0822) | (0.1628) | (0.1151) | (0.1578) | (0.1236) | ||
| LnInd | 0.0393** | -0.0409** | -0.0148 | 0.0253 | -0.0400 | |
| (0.0170) | (0.0160) | (0.0168) | (0.0204) | (0.0315) | ||
| Exp | 0.0818 | -0.3085* | -0.2515 | -0.0913 | -0.1262 | |
| (0.1325) | (0.1568) | (0.1582) | (0.1825) | (0.2248) | ||
| IndStr | -0.1786* | -0.1529 | -0.0164 | -0.2588** | -0.1116 | |
| (0.0916) | (0.0998) | (0.1113) | (0.1149) | (0.1073) | ||
| City FEs | Yes | Yes | Yes | Yes | Yes | |
| Year FEs | Yes | Yes | Yes | Yes | Yes | |
| Observation | 1000 | 1469 | 1009 | 918 | 489 | |
| adj. | 0.919 | 0.935 | 0.956 | 0.896 | 0.939 | |
Notes: This table presents the results on the heterogeneous effect of REHP on the Air Quality Index (AQI). Columns (1) and (2) report the heterogeneity effects related to temperature, and Columns (3) and (4) based on geographical locations. Robust standard errors are reported in parentheses. Significance levels are indicated by *, **, and *** for the 10%, 5%, and 1% levels, respectively.
Table 6.
Mechanism Analysis.
| Panel A: Consumption of Coal | ||||||
|---|---|---|---|---|---|---|
| (1) | (2) | |||||
| Dep.Variable | LnCoal | LnCoal | ||||
| Treat*Post | -0.1378*** | -0.0700** | ||||
| (0.0372) | (0.0308) | |||||
| Controls | No | Yes | ||||
| City FEs | Yes | Yes | ||||
| Year FEs | Yes | Yes | ||||
| Observation | 6831 | 6584 | ||||
| adj. | 0.942 | 0.951 | ||||
| Panel B: Government Environmental Regulation and Technology Expenditure | ||||||
| (1) | (2) | (3) | (4) | |||
| Dep.Variable | AQI | AQI | AQI | AQI | ||
| Treat*Post*EnvReg | -0.0050*** | -0.0044** | ||||
| (0.0019) | (0.0017) | |||||
| EnvReg | 0.0005 | 0.0005 | ||||
| (0.0058) | (0.0055) | |||||
| Treat*Post*TechExp | -0.0434* | -0.0396* | ||||
| (0.0230) | (0.0214) | |||||
| TechExp | 0.0049 | 0.0040 | ||||
| (0.0201) | (0.0195) | |||||
| Controls | No | Yes | No | Yes | ||
| City FEs | Yes | Yes | Yes | Yes | ||
| Year FEs | Yes | Yes | Yes | Yes | ||
| Observation | 2438 | 2432 | 2508 | 2504 | ||
| adj. | 0.923 | 0.927 | 0.925 | 0.929 | ||
Notes: This table presents the results of the mechanism analysis. In Panel A, the dependent variable is coal consumption. Control variables are excluded in Column (1) and included in Column (2), though they are not reported for brevity. In Panel B, interaction terms between the policy and both government environmental regulation (EnvReg) and technology expenditure (TechExp) are added. Columns (1) and (3) exclude control variables, while Columns (2) and (4) include them. The control variables consist of LnGDP, LnPop, LnInd, Exp, and IndStr. Robust standard errors are reported in parentheses. Significance levels are denoted by *, **, and *** for the 10%, 5%, and 1% levels, respectively.
Table 7.
Placebo Test: Fictitious Treatment Time.
| (1) | (2) | (3) | |
|---|---|---|---|
| Dep.Variable | AQI | AQI | AQI |
| Treat*Post-1 | 0.0026 | ||
| (0.0068) | |||
| Treat*Post-2 | -0.0038 | ||
| (0.0077) | |||
| Treat*Post-3 | -0.0032 | ||
| (0.0088) | |||
| LnGDP | 0.0695*** | 0.0685*** | 0.0686*** |
| (0.0214) | (0.0213) | (0.0213) | |
| LnPop | 0.2120** | 0.2062** | 0.2064** |
| (0.0850) | (0.0841) | (0.0839) | |
| LnInd | 0.0079 | 0.0068 | 0.0069 |
| (0.0119) | (0.0119) | (0.0119) | |
| Exp | -0.1104 | -0.0989 | -0.1013 |
| (0.1038) | (0.1041) | (0.1037) | |
| IndStr | -0.1691*** | -0.1817*** | -0.1800*** |
| (0.0624) | (0.0627) | (0.0627) | |
| City FEs | Yes | Yes | Yes |
| Year FEs | Yes | Yes | Yes |
| Observation | 2504 | 2504 | 2504 |
| adj. | 0.929 | 0.929 | 0.929 |
Notes: This table presents the results of the placebo test conducted by creating a fictitious treatment date. The implementation of the REHP is set one, two, and three years before it actually occurred. Robust standard errors are reported in parentheses. Significance levels are denoted by *, **, and *** for the 10%, 5%, and 1% levels, respectively.
Table 8.
Alternative Treatment Variable.
| (1) | (2) | (3) | (4) | |
|---|---|---|---|---|
|
Excluding Heating Cases in Certain Residential Areas |
Considering Time-Varying Heating Cases |
|||
| Dep.Variable | AQI | AQI | AQI | AQI |
| Treat*Post | -0.0198** | -0.0179** | -0.0215*** | -0.0195*** |
| (0.0078) | (0.0072) | (0.0074) | (0.0068) | |
| LnGDP | 0.0692*** | 0.0695*** | ||
| (0.0213) | (0.0213) | |||
| LnPop | 0.1966** | 0.1960** | ||
| (0.0830) | (0.0831) | |||
| LnInd | 0.0061 | 0.0052 | ||
| (0.0118) | (0.0118) | |||
| Exp | -0.0854 | -0.0864 | ||
| (0.1033) | (0.1035) | |||
| IndStr | -0.2029*** | -0.2040*** | ||
| (0.0627) | (0.0623) | |||
| City FEs | Yes | Yes | Yes | Yes |
| Year FEs | Yes | Yes | Yes | Yes |
| Observation | 2529 | 2504 | 2529 | 2504 |
| adj. | 0.923 | 0.929 | 0.923 | 0.929 |
Notes: This table presents the results of replacing the alternative treatment variable. Columns (1) and (2) provide estimates excluding heating cases in certain residential areas, while Columns (3) and (4) show the results after considering time-varying heating cases. Robust standard errors are reported in parentheses. Significance levels are denoted by *, **, and *** for the 10%, 5%, and 1% levels, respectively.
Table 9.
Alternative Propensity Matching Methods.
| (1) | (2) | (3) | |
|---|---|---|---|
| Nearest Neighbor Matching (1:2) | Radius Matching | Kernel Matching | |
| Dep.Variable | AQI | AQI | AQI |
| Treat*Post | -0.0310** | -0.0246*** | -0.0359*** |
| (0.0124) | (0.0090) | (0.0086) | |
| LnGDP | 0.1467*** | 0.1152*** | 0.1280*** |
| (0.0244) | (0.0236) | (0.0251) | |
| LnPop | 0.2206 | 0.2134** | 0.1156 |
| (0.1397) | (0.1013) | (0.1262) | |
| LnInd | -0.0428** | -0.0123 | -0.0259 |
| (0.0198) | (0.0148) | (0.0161) | |
| Exp | -0.1602 | -0.1192 | -0.0393 |
| (0.1730) | (0.1176) | (0.1445) | |
| IndStr | -0.1098 | -0.1361 | -0.1235 |
| (0.1486) | (0.0920) | (0.1008) | |
| City FEs | Yes | Yes | Yes |
| Year FEs | Yes | Yes | Yes |
| Observation | 1699 | 2503 | 2482 |
| adj. | 0.951 | 0.940 | 0.948 |
Notes: This table presents the results of using alternative propensity matching methods. 1:2 Nearest Neighbor Matching, Radius Matching, and Kernel Matching are employed in Columns (1), (2), and (3), respectively. Robust standard errors are reported in parentheses. Significance levels are denoted by *, **, and *** for the 10%, 5%, and 1% levels, respectively.
Table 10.
Eliminating the Interference of Other Policies.
| (1) | (2) | (3) | (4) | |
|---|---|---|---|---|
|
New Energy Demonstration Cities Policy |
Clean Heating Plan for Winter in the Northern Region |
|||
| Dep.Variable | AQI | AQI | AQI | AQI |
| Treat*Post | -0.0241*** | -0.0206*** | -0.0190** | -0.0156** |
| (0.0085) | (0.0076) | (0.0078) | (0.0071) | |
| LnGDP | 0.0677*** | 0.0689*** | ||
| (0.0216) | (0.0212) | |||
| LnPop | 0.1982** | 0.2048** | ||
| (0.0885) | (0.0841) | |||
| LnInd | -0.0034 | 0.0111 | ||
| (0.0130) | (0.0123) | |||
| Exp | -0.1816 | -0.1146 | ||
| (0.1111) | (0.1047) | |||
| IndStr | -0.2361*** | -0.2207*** | ||
| (0.0657) | (0.0627) | |||
| City FEs | Yes | Yes | Yes | Yes |
| Year FEs | Yes | Yes | Yes | Yes |
| Observation | 1993 | 1972 | 2394 | 2364 |
| adj. | 0.923 | 0.930 | 0.916 | 0.924 |
Notes: This table presents the results after controlling for the interference of other policies. Columns (1) and (2) display estimates excluding the initial batch of new energy demonstration cities. Columns (3) and (4) show results after removing the "2+26" cities from the Winter Clean Heating Plan in the Northern Region. Robust standard errors are reported in parentheses. Significance levels are indicated by *, **, and *** for the 10%, 5%, and 1% levels, respectively.
Disclaimer/Publisher’s Note: The statements, opinions and data contained in all publications are solely those of the individual author(s) and contributor(s) and not of MDPI and/or the editor(s). MDPI and/or the editor(s) disclaim responsibility for any injury to people or property resulting from any ideas, methods, instructions or products referred to in the content. |
© 2024 by the authors. Licensee MDPI, Basel, Switzerland. This article is an open access article distributed under the terms and conditions of the Creative Commons Attribution (CC BY) license (http://creativecommons.org/licenses/by/4.0/).
Copyright: This open access article is published under a Creative Commons CC BY 4.0 license, which permit the free download, distribution, and reuse, provided that the author and preprint are cited in any reuse.


