
Submitted:
10 September 2024
Posted:
12 September 2024
You are already at the latest version
Abstract
Background: The advantage of a robotic assisted (RARP) over a laparoscopic (LRP) approach in radical prostatectomy (RP) remains to be demonstrated. Aim of the study is to use a homogeneous population in real life and single surgeon surgery, to analyze the oncological and functional results based on the type of the surgical approach. Methods: This is a prospective trial on non-metastatic prostate cancers (PC) patients considered after multidisciplinary decision to RP, using RARP or LRP. A real-life setting was analyzed at our Urological Departments, using homogeneous criteria for the management of PC cases and a one surgeon experience on 444 cases (284 LRP and 160 RARP) .Results: Mean operative time was significantly lower in RARP (173.33±44.3 min) than in LRP (153.21±25.1 min) (p<0.001). In cases submitted to an extended lymph node dissection (eLND), the mean number of lymph nodes removed was 15.16±7.83 and 19.83±4.78 respectively in LRP and RARP procedures (p<0.001), but positive lymph nodes (pN1) were similarly found in 15.8% of LRP patients and 13.6% of RARP patients (p=0.430). Surgical margins (SM) positivity was not significantly higher in RARP group (20.0%) when compared to LRP group (15.9%) (p=0.145). During the postoperative follow-up, a biochemical recurrence (BCR) was detected in 14.4% and 7.5% of cases in the LRP and RARP group respectively (p=0.014). Better results of PAD test at 3-month interval using RARP approach (mean pad weight 75.57±122 grams and 14±42 grams respectively in LRP and RARP (p<0.01)) were described. Conclusions: In the comparison between RARP and LRP approach, a clear advantage of the robotic approach is a significant reduction in operating times, days of hospitalization and postoperative catheterization compared to laparoscopic surgery. It is not possible to describe any certain oncological advantage both in terms of surgical margins and pathological lymph nodes removed. In RARP cases a reduction to the limit of significance is described in terms of biochemical recurrence. RARP produces a more rapid recovery of urinary continence at 3 months postoperatively without significant advantages in terms of erective potency recovery.
Keywords:
prostatic neoplasm
; radical prostatectomy
; robotic surgery
; laparoscopic surgery
1. Introduction
Robotic-assisted radical prostatectomy (RARP) has become the most widely used robotic intervention and the most frequently performed technique for the treatment of non-metastatic prostate cancer [1,2,3,4,5,6].
However, its advantage over the laparoscopic (LRP) approach remains to be demonstrated but the greater simplicity of execution and the shorter learning curve make it favored [1,2,3,4]. The European Urological Association (EAU) recommends informing patients’ candidates for prostatectomy that no surgical approach (laparoscopic versus robotic) has clearly demonstrated superiority in terms of both oncological and functional results [7]. However, several clinical trials have shown an advantage of RARP over LRP in terms of recovery of sexual potency and surgical margins (SM) status in organ-confined PC [1,2,3,4,5,6,8,9,10,11,12,13,14,15,16]. The presence of SM+ represents the most immediate indication of failure for RP to achieve patient cure. However, more and more frequently its treatment is not immediate and is replaced by vigilant monitoring, delaying treatment in case of early biochemical recurrence [8,9,10,11,12,13,14,15,16].
Even in this setting, a randomized study can allow us to compare two homogeneous populations to verify significant differences between the different approaches. However, the limit of the randomized study is the distance that can be produced from a real-life situation as well as the difficulty of execution. Moreover, a study that reaches a significant number of RP sample through the coexistence of different surgeons with different approaches and experiences, introduces a relevant factor of variability that can reduce the validity of the results [1,2,3,4,5,6,17,18,19,20,21,22,23,24,25].
In the present study we report the long-term case history of a population of patients with non-metastatic PC considered suitable, according to EAU guidelines and after multidisciplinary discussion, for radical prostatectomy, performed by a single surgeon with experience of over 10 years. This population represents a homogeneously treated sample in a perfect real-life situation at a high-volume institution for the treatment of PC and with a multidisciplinary (MDT) group regulating decisions relating to the management of each individual patient.
Aim of the study is to use this homogeneous population in real life to analyze the oncological and functional results based on the type of surgical approach but also based on the clinical and pathological characteristics of the neoplasms.
2. Materials and Methods
This is a prospective trial on non-metastatic PC patients considered after MDT decision to RP, using RARP or LRP. A real-life setting was analyzed at our Urological Departments, using homogeneous criteria for the management of PC cases and a one surgeon experience is reported.
2.1. Population
Patients with a histological diagnosis of non-metastatic PC considered for RP as primary therapeutic option and submitted to surgery by a single surgeon (AS), were consecutively enclosed in the analysis. The analysis was approved by our internal ethical committee and all patients gave their informed consensus for each procedure. All diagnostic and therapeutic procedures reflected our routine clinical practice in a department at high-volume for the management of PC disease. All diagnostic and therapeutic decisions for the management of patients and selection for surgery were discussed in a MDT group. In particular for low-risk PC patients, possible options between active surveillance, surgery and radiotherapy were offered and presented with the possible advantages, limitations and side effects. In patients at intermediate or high risk, the two options surgery and radiotherapy were equally presented to the patient. Inclusion criteria were histological diagnosis of adenocarcinoma, no distant metastases at clinical staging, RP as chosen primary treatment option, estimated life-expectancy of ≥10 years. Exclusion criteria were androgen deprivation therapies, chemotherapies, pelvic radiation therapies or treatments with other agents that could influence prostate tumor growth. From January 2013 to December 2023, 444 consecutive patients with PC submitted to RP in our Department of Urology by a single surgeon (AS), corresponding to defined inclusion and exclusion criteria were included in our analysis (Table 1).
2.2. Clinical Parameters
The whole population of 444 cases is described in Table 1. Patients, after prostatic specific antigen (PSA) increase, were submitted to multiparametric magnetic resonance imaging of the prostate (mMRI) with PI-RADS score determination. Targeted samples on sites indicated by mMRI were associated to random samples in each prostate lobe. Before surgery, clinical staging and risk category (D’Amico and EAU classification) assessment was homogeneously performed, using PSA determination and imaging (mMRI, CT and bone scan, PET-CT scan). Validated predictive nomograms in terms of risk for positive lymph node involvement were used [13,17]. In cases with familiarity and high risk PC, a genetic evaluation for pathogenic variants (PV) of Damage DNA Repair (DDR) genes was performed on surgical samples as part of a prospective trial.
2.3. Pathologic Evaluation
All histological specimens from prostatic biopsy and RP were analyzed by our uro-pathologist with a long experience in PC field. Gleason score and grade groups according to the World Health organization (WHO)/ISUP 2014 guidelines at biopsy and at surgery, pathologic staging using TNM classification, SM status were routinely defined in all cases. In particular, SM were considered positive when carcinoma was transected by an inked SM; this could be in a setting of organ-confined or extracapsular disease.
2.4. Surgical Procedure
Surgical technique was not assigned randomly, and no specific selection was performed regarding the two approaches. As routine clinical practice in our department, each procedure (RARP and LRP) was discussed with the patient and performed by the same single surgeon (AS) who had a high expertise (> 10 years for LRP and > 5 years for RARP) in each approach, consistent with best practice. All surgical procedures (LRP and RARP) were performed using the same intraperitoneal standard technique for RP, starting from the bladder neck and proceeding to the prostate apex. A nerve-sparing (NS) (intrafascial, monolateral or bilateral) procedure was performed based on mMRI results, risk classes, the risk of extracapsular disease and after discussion with the patient on the probability to maintain potency balanced with possible harm. In particular, for either RARP or LRP:- intrafascial NS was performed in cases with low or intermediate risk classes PC , low risk of ipsilateral extracapsular PC extension, good preoperative sexual potency - patients with clinical high-risk of ipsilateral extracapsular disease were excluded from a NS surgery; - extended lymph node dissection (eLND) was performed in all high-risk cases and in the intermediate-risk class in cases with ≥5% probability for positive nodes based on predictive nomograms; intra-operative evaluation of SM was not performed; - surgical intraperitoneal technique was equal using RARP or LRP. Intra and perioperative complications were reported, in particular anastomotic leakage, lymphocele, rectal injury, such as operative time, blood transfusion, catheterization time and postoperative hospitalization.
2.5. Functional Analysis
Post-operative functional complications, such as urethral stricture, urinary incontinence (UI) and erectile dysfunction (ED) were analyzed during a follow-up of 12 months. A UI was defined as a persistent urinary leakage ≥5 g at a 24-hour pad test. The use of a postoperative pelvic floor rehabilitation and pad test modifications during treatment was described such as the need for an artificial sphincter procedure. A significant ED was defined as an International Index of Erectile Function-5 (IIEF-5) score between 1-10. Postoperative tadalafil rehabilitation was performed in all cases submitted to NS procedure.
2.6. Oncological Outcomes
All patients were followed at regular intervals (each 3 months for the first two years and then every 6 months) to determine time to biochemical (confirmed total PSA progression ≥0.2 ng/ml), radiological (radiologically confirmed at PET CT scan and/or mpMRI), local or distant recurrence, as recommended by the EAU guidelines. The decision for adjuvant therapy to surgery or early biochemical progression was taken homogeneously in all cases after discussion in the MDT and based on the EAU guidelines.
2.7. Statistical Analysis
For statistical evaluation SPSS Statistics program was used. Descriptive statistical methods, such as number of cases, mean ± SD, median and range were used. For the comparison of quantitative data and pairwise intergroup comparisons of variables a Mann Whitney test or ANOVA one-way test were performed. For comparison of qualitative data Fisher’s Exact test and chi-square test were used. Univariate and multivariate Cox proportional analysis considering clinical and pathological parameters were used. Statistical significance was evaluated at p<0.05. Kaplan Maier analysis to define the cumulative rate of risk for biochemical progression was performed in the population stratified on the basis of different variables.
3. Results
Baseline characteristics of the whole population of 444 cases considered for RP are described in Table 1. 284 patients (64.0%) were submitted to a laparoscopic approach (LRP) whereas 160 patients (36.0%) to a robotic assisted surgery (RARP). Mean age of the population was 67.49±6.53 with a range of 47-73 years and mean preoperative total PSA was 8.61±5.74, ranged between 3.0-64.0ng/ml.
An intermediate- and high-risk PC was present in 45.0% and 23.0% of cases, respectively. An eLND was performed in 135 (30.4%) cases (mean number of removed lymph nodes: 17.22±6.81), whereas a NS technique in 127 (28.6%) cases. At the final pathologic evaluation an extracapsular disease (pT3) was found in 44.6% of cases (pT3a 33.8% and pT3b 10.8%). SM+ were found in 77 (17.3%) cases and positive lymph nodes (pN1) in 20 cases (14.8%). Mean surgical operative time was 160.05min (range 90-300), mean time for hospitalization was 3.41±0.56 days (range 3-7 days) and mean time of catheterization was10.27 days (range 6-16 days). During the first post-operative 12-month follow-up, rates of urethral stricture, blood transfusion and lymphocele were 2.7%,0.5% and 1.8%, respectively. Mean IIEF-5 changed from a preoperative 20.75±5.83 to a postoperative 10.41±24.10. A no PADS status was obtained in 91.6% of cases after surgery.
Mean postoperative follow-up was 56.4 ±37.8 months (range 12-120) with a 11.9% rate of biochemical recurrence (BCR) at a mean time of 18.67±24.57 months. Adjuvant therapies were prescribed in 11.9 % of cases, radiotherapy (RT) in 8.3% and RT + androgen deprivation therapy (ADT) in 3.6%.
3.1. Differences in Pathological, Oncological and Functional Outcomes according to Surgical Approach
Clinical parameters such as preoperative PSA, prostate tumor size and ISUP grading were not significantly (p>0.50) different between cases submitted to RARP and LRP. A higher percentage (13.8%) of cases submitted to RARP were clinically staged T3 when compared to cases submitted to LRP (5.3%) (p<0.001). Patients undergoing RARP were significantly younger (median 66vs69 years; p<0.001) and had a slightly but significantly higher Charlson Comorbidity Index (CCI) when compared to LRP patients (Table 2).
The distribution of PC risk classes did not significantly (p=0.849) differ between the two groups. In cases submitted to mMR, PIRADS 4 and 5 lesions were more frequent in the RARP group than in the LRP group (56.5% and 24.6% vs 47.1% and 18.6%, respectively; p=0.042) (Table 2). At biopsy, the percentage of positive cores did not significantly differ between the two groups (p=0.772). The percentage of bilateral positive biopsies was higher in the LRP group (p<0.01) (Table 2).
The percentage of cases submitted to a NS procedure was 21.5% and 41.3% respectively (p<0.01), whereas the percentage of cases submitted to eLND was 26.8% and 36.9% respectively in the LRP and RARP group (p=0.56) . In cases submitted to eLND , the mean number of lymph nodes removed was 15.16±7.83 and 19.83±4.78 respectively in LRP and RARP procedures (p<0.001). Mean operative time was 173.33±44.3 min and 153.21±25.1 min respectively in LRP and RARP (p<0.001) (Table 2).
3.1.1. Pathological Outcomes
The distribution of pathological T stage was not significantly different (p=0.910) in the two groups. When an eLND was performed, positive lymph nodes (pN1) were found in 15.8% of LRP patients and 13.6% of RARP patients (p=0.430). Pathological ISUP 2 and 3 were more frequent in the RARP group, while the LRP group had a higher percentage of ISUP 1, 4 and 5 cases (p<0.001), (Table 2). SM positivity was not significantly higher in RARP group (20.0%) when compared to LRP group (15.9%) (p=0.145). In cases submitted to LRP, the highest rate of SM+ was at the apex (48.9%) followed by the lateral site (24.4%), whereas in cases submitted to RARP was at the lateral site (37.5%) followed by the apex (28.1%) (p=0.037). Extra-prostatic extension of positive SM was 3.45±0.84 and 2.63±1.14 in the LRP and RARP group respectively (p=0.008). SM+ grading was 4 in 24.4% and 31.3% of cases respectively in LRP and RARP procedures (p=0.225) (Table 2). During the postoperative follow-up, a BCR was detected in 14.4% and 7.5% of cases in the LRP and RARP group respectively (p=0.014) with a similar mean time to progression (21.77±26 months and 18.58±13 months respectively in LRP and RARP) (p=0.1059. Kaplan Maier curve describing cumulative biochemical recurrence (BCR) free survival rates according to the surgical approach are showed in Figure 1.
Adjuvant therapies were prescribed in 13.0% (73.0% RT and 27.0% RT + ADT) and 10.0% (62.5% RT and 37.5%RT+ADT) in LRP and RARP cases respectively (p=0.358) (Table 2).
3.1.2. Functional Outcomes
Postoperative catheterization time was shorter in RARP cases (mean 9.60±2.0) than in LRP cases (mean 11.53±1.45)(p<0.001) (Table 2). The percentage of postoperative side effects after surgery was similar between the two approaches and it is described in Table 2 and 3.

Table 3.
a. Postoperative side effects according to the surgical approach (LRP= Laparoscopic versus RARP= Robotic assisted). Number of cases and % of cases. Mean±SD, median, (range).
Table 3.
a. Postoperative side effects according to the surgical approach (LRP= Laparoscopic versus RARP= Robotic assisted). Number of cases and % of cases. Mean±SD, median, (range).
| Parameter | LRP | RARP | P value |
|---|---|---|---|
|
Postoperative anastomotic leakage No yes |
284(100%) 0 |
157 (98.1%) 3 (1.9%) |
0.245 |
|
Postoperative blood transfusion no yes |
284 (100%) 0 |
158 (98.7%) 2 (1.3%) |
0.294 |
|
Postoperative lymphocele no yes |
278 (97.9%) 6 (2.1%) |
158 (98.7%) 2 (1.3%) |
0.16 |
|
Postoperative anastomotic stricture no yes |
272 (95.8%) 12 (4.2%) |
160 (100%) 0 |
0.51 |
|
Postoperative rectal injury no yes |
824 (100%) 0 |
160 (100%) 0 |
x |
| Postoperative hospitalization (days) | 3.75±0.74;3 (3-7) | 3.11±0.36;3 (3-5) | 0.037 |
| Catheterization time (days) | 11.53±1.45; 12 (8-14) | 9.60±2.06; 10 (6-16) | <0.001 |
Table 3.
b. Postoperative urinary continence results according to the surgical approach ( LRP= Laparoscopic versus RARP= Robotic assisted). Number of cases and % of cases and mean +/- SD, median and range.
Table 3.
b. Postoperative urinary continence results according to the surgical approach ( LRP= Laparoscopic versus RARP= Robotic assisted). Number of cases and % of cases and mean +/- SD, median and range.
| Parameter | LRP | RARP | P value |
|---|---|---|---|
| Postoperative Pelvic floor rehabilitation no yes |
230 (81.0%) 54 (19.0%) |
125 (78.2%) 33 (21.8%) |
0.106 |
| Postoperative PAD test (1 month) (grams) | 163.84±222.0; 50 (0-400) | 68.17± 374.17; 11 (0-404) | 0.68 |
| Postoperative PAD test (3 months (grams) | 75.57±122.20; 20 (0-480) | 14.02±42.09; 0 (0-250) | <0.001 |
| Postoperative PAD test ( 6 months) (grams) | 39.47±76.08; 5 (0-420) | 13.62±28.60; 0 (0-80) | 0.023 |
| Postoperative PAD test ( 12 months) (grams) | 14.76±29.41; 0 (0-100) | 15.33±23.2; 1 (0-50) | 0.964 |
Table 3.
c. Postoperative Sexual recovery results according to the surgical approach (LRP=Laparoscopic versus RARP=Robotic assisted). Number of cases and % of cases and mean +/- SD, median and range.
Table 3.
c. Postoperative Sexual recovery results according to the surgical approach (LRP=Laparoscopic versus RARP=Robotic assisted). Number of cases and % of cases and mean +/- SD, median and range.
| Parameter | LRP | RARP | P value |
|---|---|---|---|
|
Nerve sparing technique at surgery No Yes Monolateral Bilateral |
223 (78.5%) 61 (21.5%) 27 (43.3%) 34 (56.7%) |
94 (58%) 66 (42%) 25 (31.7%) 41 (68.3%) |
<0.001 0.187 |
| IIEF-5 postoperative ( 6 months) | 9.60±3.78; 9 (6-19) | 10.25±3.94; 9.5 (7-15) | 0.750 |
| IIEF-5 postoperative (12 months) | 10.14±4.77; 10 (5-21) | 18.0±3.75; 18 (18-18) | 0.117 |
Postoperative pelvic floor rehabilitation was used in 19.0% and 21.8% of cases respectively in LRP and RARP groups (p=0.106) (Table 2 and 3). Postoperative PAD test was similar at 1- and 12-month intervals (p>0.05) between LRP and RARP procedures, whereas better results at 3-month interval using RARP approach (mean pad weight 75.57±122 grams and 14±42 grams respectively in LRP and RARP (p<0.01)) were described (Table 3). In cases submitted to NS procedures, IIEF5 mean score was 9.60±3.78 at 6-month and 10.14±4.77 at 12-month interval for LRP group and 10.25±3.94 and 18.0±3.75 for RARP group (p>0.05) (Table 2, 3).
3.1.3. Main Significant Differences in Results
In the RARP group: - higher percentage of NS procedure; - higher mean number of lymph nodes removed; - lower mean operative time; - higher (but not statistically significant) rate of SM+; lower rate of BCR; lower catheterization time; lower mean pad weight at 3- and 6-month interval; higher ( but not statistically significant) IIEF-5 score at 12-month.
3.2. Differences in Pathological, Oncological and Functional Outcomes according to Risk Classes
The distribution of the population according to the risk classes showed 142 cases (32.0%) in the low, 200 cases (45.0%) in the intermediate and 102 cases (23.0%) in the high risk class. Clinical parameters such as age, BMI and Charlson Index were not significantly (p>0.50) different between the 3 classes (Table 4).
Mean preoperative PSA significantly increased with increasing risk classes (p<0.001). In cases submitted to mMR, the highest percentages of PIRADS 4 and 5 lesions were found respectively in the intermediate and high risk groups (p<0.01) (Table 4).
A similar proportion of cases was submitted to LRP versus RARP in the three classes (p=0.850). The percentage of cases submitted to a NS procedure was 48.6%, 27.5% and 3.0% respectively in the low, intermediate and high risk class, whereas the percentage of cases submitted to eLND in the intermediate class (based on a risk > 5% at predictive nomogram) was 16.5% and 100% in the high risk class; p<0.001). Operative time was shorter in low risk cases (mean 150.50±27.35 min) when compared to intermediate (mean 155.0±20.06min) and high risk cases (mean 183.51±50.71min) (p<0.001). (Table 4).
3.2.1. Pathological Outcomes
The distribution of pathological ISUP varied greatly between the three groups, with only one patient in the low risk class with a pathological ISUP of 4-5 and only 3 patients in the high risk group with a pathological ISUP of 1 (p<0.01). When an eLND was performed, positive lymph nodes (pN1) were found in a higher percentage of cases in the intermediate risk group when compared with the high risk class (26.9%vs12.8%; p<0.01) (Table 4). SM positivity was higher in the high risk group (25.5%) when compared to the intermediate (19.2%) and low risk (9.2%) (p=0.003). SM+ grading was 4 in 0%, 13.2% and 61.5% of cases respectively in low, intermediate and high risk cases (p<0.00)(Table 4).
A BCR was detected in 4.2%, 8.5% and 29.4% of cases in the low, intermediate and high risk group respectively with a similar mean time to progression ( 19.0±15.83 months, 23.88±28.22 months and 15.72± 24.12 months respectively).Adjuvant therapies were prescribed in 2.1% (100% RT), 7.0% (92.9% RT and 7.1% RT + ADT) and 35.3% (58.3% RT and 41.7%RT+ADT) in low, intermediate and high risk cases respectively (p<0.001) (Table 4).
3.2.2. Main Significant Differences in Results
Increasing risk class: -increase in operative time; - increase in SM+ rate, SM+ grading; -increase in BRC rate, use of adjuvant therapies.
3.3. Differences in Pathological, Oncological and Functional Outcomes according to pT Stage
A pathologic extraprostatic tumor was found in 198 cases (44.9%) with pT3a in 34.0% and pT3b in 10.8% of cases. Preoperative PSA significantly (p<0.001) increased from pT2 to pT3b cases (Table 5).
In cases submitted to mMR, the percentage of PIRADS 5 lesion significantly increased with increasing pT stage (p=0.01) (Table 5). At biopsy, the percentage of positive cores, bilateral incidence, and ISUP 4-5 were significantly higher (p<0.001) in the pT3 groups (Table 5). A similar proportion of cases was submitted to LRP or RARP approach with similar mean operative times in pT2 and pT3 cases (p>0.05) (Table 5).
3.3.1. Pathological Outcomes
The percentage of ISUP 4-5 PC at surgery increased with pathological stage (p<0.001), as the percentage of positive lymph node (pN1) (0% in pT2, 11.1% in pT3a and 25.0% in pT3b; p<0.01) (Table 5). SM positivity was higher in the pT3b (37.5%) than in pT3a (20.8%) and pT2 (11.4%) cases (p<0.001) . pT3b patients demonstrated a significantly longer mean extra-prostatic extension of SM+ (3.71±1.28) than the other groups (p=0.01), and SM+ grading was 4 in 14.3%, 16.2% and 66.7% of cases respectively in pT2, pT3a and pT3b cases (p=0.001) (Table 5). A BCR was detected in 4.9%, 13.3% and 37.5% of cases in the pT2, pT3a and pT3b group respectively with a shorter mean time to progression in the pT3b group (34.25±42.2, 16.1±11.3 and 11.28±15.1 in the pT2, pT3a and pT3b groups, respectively; p=0.032).Adjuvant therapies were prescribed in 1.6% (100% RT), 11.3% (82.4% RT and 17.6% RT+ADT) and 62.7% (59.5% RT and 40.6%RT+ADT) in pT2, pT3a and pT3b cases respectively (p<0.001)(Table 5). Kaplan Maier curve describing cumulative biochemical recurrence (BCR) free survival rates according to pT stage are showed in Figure 2
3.3.2. Main Significant Differences in Results
Increasing pT stage: - increase in preoperative PSA; - increase in PIRADS 5 lesions and percentage of positive biopsy cores; - increased rate of positive lymph nodes (pN+), SM+; increase in SM+ grading, BCR rate, use of adjuvant therapies.
3.4. Differences in Pathological, Oncological and Functional Outcomes according to pN Stage
A low percentage (14.8%) of cases submitted to eLND showed pathological lymph node involvement, with a similar distribution between LRP (15.8%) and RARP (13.6%) approach. Clinical parameters such as age, BMI and Charlson index were not significantly (p>0.50) different between pN0 and pN1 cases (Table 6).
Mean total PSA was significantly higher in pN1 patients (16.54±8.83 vs 8.72±5.29 in the pN1 and pN0 groups, respectively; p<0.001) (Table 6). A clinical suspicious for lymph node involvement at preoperative imaging was found in 0.9% of cases in pN0 and 15.5% of cases in pN1 cases (p<0.001). At biopsy, the percentage of positive cores and bilateral incidence were significantly higher (p=0.001) in the pN1 group. The distribution of ISUP grading (p=0.304) and mean and median nomograms results were similar between pN0 and pN1 groups (p>0.05) (Table 6).
3.4.1. Pathological Outcomes
The mean number of lymph nodes removed was similar in the two groups (p=0.60). In pN1 cases the site of positive lymph nodes (pN+) was obturatory (100%), internal iliac (45.0%) and esternal iliac (40.0%). (Table 6). The percentage of pathological ISUP 5, pT3b stage and PNI were significantly higher in pN1 patients (p=0.001, 0.001 and 0.02 respectively) (Table 6). Also SM positivity was higher in the pN1group (45.0%) than in pN0 (27.9%) cases (p=0.001) and SM+ grading was 4 in 37.5% and 55.6% of cases respectively in pN0 and pN1 cases (p=0.384)(Table 6). A BCR was detected in 18.3% and 55.0% of cases in the pN0 and pN1 group respectively (p<0.001) with a shorter mean time to progression in the pN1 group (4.18±7.37 months and 28.3±34.6 months respectively in pN1 and pN0). Adjuvant therapies were prescribed in 26.1% (80% RT and 20% RT + ADT) and 70.0% (28.6% RT and 71.4%RT+ADT) in pN0 and pN1 cases respectively (p<0.001) (Table 6). Kaplan Maier curve describing cumulative biochemical recurrence (BCR) free survival rates according to the pN stage are showed in Figure 3
3.4.2. Main Significant Differences in Results
In pN1 cases: - higher clinical suspicious cN1; higher preoperative PSA and percentage of positive core at biopsy; - higher pT3b rate, ISUP 5 rate, SM+ rate and SM+ grading; - higher BCR rate and use of adjuvant therapies.
3.5. Differences in Pathological, Oncological and Functional Outcomes according to Surgical Margins
Positive surgical margins were found in 17.3% of cases with a no significant difference between the LRP (15.9%) and the RARP (20.0%) group (p=0.145). Clinical parameters such as age, Charlson Index and BMI were not significantly (p>0.50) different between SM- and SM+ cases (Table 7).
The SM+ group had a significantly higher mean preoperative PSA (11.54±8.8 vs 8±1.07; p<0.001). A higher percentage of clinical stage cT1, cT2a and cT2b in the SM- group and a higher percentage of cT2c, cT3a and cT3b cases in the SM+ group was present (p<0.001) (Table 7). At biopsy the percentage of positive cores was significantly higher (p<0.001) in the SM+ group. The distribution of ISUP grading was similar between SM- and SM+ groups (p=0.14) (Table 7).
The percentage of cases submitted to a NS procedure was 29.6% and 25.3% respectively (p=0.450) and mean operative time was 160.03±36.02 min and 160.63±22.39 min respectively in SM- and SM+ (p=0.92) (Table 7).
3.5.1. Pathological Outcomes
The distribution of pathological ISUP grading and T stage were significantly different (p=0.006 and <0.001 respectively) in the two groups. In particular, pT3 cases were more frequent in SM+ patients than in SM- patients (63.6% and 40.6%) (Table 7). The site for positive SM was posterior-lateral in 45.5% of cases, basal in 7.8% and apex in 40.2% of cases. Median extra-prostatic radial extension of positive SM was 3mm (range 1-7) and SM+ grading was 4 in 27.3% and 3 in 71.4% of cases (Table 7). A BCR was detected in 7.9 % and 31.2% of SM- and SM+ cases respectively with a shorter mean time to progression in SM+ cases (25.45±29.4 months and 9.73±11.57 months respectively in SM- and SM+). Adjuvant therapies were prescribed in 8.4% (40% RT and 60% RT + ADT) and 55.9% (76.7% RT and 23.3%RT+ADT) in SM- and SM+ cases respectively (p<0.001)(Table 7). Kaplan Maier curve describing cumulative biochemical recurrence (BCR) free survival rates according to the SM status are showed in Figure 4
3.5.2. Main Significant Differences in Results
In SM+: - higher preoperative PSA; - higher percentage of positive core at biopsy; increase in BCR rate; increase in adjuvant therapy use
3.6. Differences in Pathological, Oncological and Functional Outcomes according to Biochemical Recurrence
Biochemical recurrence (BCR) was evaluated at a mean postoperative follow up of 56.4±37.8 years. A BCR was detected in 11.9% of cases with a mean time of 18.67±24.57 months, with a lower percentage in cases submitted to RARP (7.5%) than in cases submitted to LRP (14.4%) (p=0.014).
Clinical parameters such as age and Charson Index were not significantly (p>0.50) different between BCR- and BCR+ cases (Table 8).
On the contrary, BCR+ patients had a significantly higher preoperative mean BMI (27.21±3.61 vs 25.74±3.43; p=0.017) (Table 8). At biopsy the percentage of positive cores and bilateral incidence were significantly higher (p<0.001) in the BCR+ group . The distribution of ISUP grading also varied significantly between the two groups. In fact, only 2% of patients that did not develop a BCR were found to have an ISUP of 5 at biopsy, while 15.1% of those who experienced a BCR had an ISUP grade of 5 at diagnostic biopsy (p<0.001) (Table 8).
The percentage of cases submitted to a NS procedure was 30.9% and 11.3% respectively, in the BCR- and BCR+ group (p=0.02) (Table 8).
3.6.1. Pathological Outcomes
As expected, BCR+ patients were more likely to have a higher pathological stage and ISUP grading at final pathology (p<0.001). Similarly, positive lymph nodes (pN1) in the case of an eLND were found in a higher percentage of cases in the BCR+ group (8.7% in BCR- and 34.4% in BCR+; p=0.014) (Table 8). SM positivity was higher in the BCR+ (45.3%) than in BCR- (13.6%) cases (p<0.001) . Mean extra-prostatic extension of positive SM was higher in BCR+ patients (3.75±1.35 vs 2.67±0.8; p=0.001) and SM+ grading was 4 in 13.2% and 58.3% of cases respectively in BCR- and BCR+ cases (p<0.001)(Table 8) . Kaplan Maier curve describing cumulative biochemical recurrence free survival rates according to the different variables are showed in Figure 1, Figure 2, Figure 3, Figure 4 and Figure 5.
3.6.2. Main Significant Differences in Results
In BCR+: - higher preoperative PSA; - higher percentage of positive prostatic core at biopsy; - higher pT stage and ISUP grading; - higher percentage of SM+ and SM+ grading.
3.7. Logistic Regression Analysis
Table 9 shows a logistic regression analysis assessed to identify variables able to condition adverse pathological, oncological and functional conditions in our population of non-metastatic PC submitted to surgery.
Table 9.
a Risk for extracapsular extention (pT3a and pT3b) at surgery on the basis of different preoperative parameters at univariate and multivariate analysis.
Table 9.
a Risk for extracapsular extention (pT3a and pT3b) at surgery on the basis of different preoperative parameters at univariate and multivariate analysis.
| Univariate | Multivariate | |||||
| Parameter | OR | 95%CI | P value | OR | 95%CI | P value |
| Preoperative PSA | ||||||
| <10 ng/ml | 1.0 | 1.0 | ||||
| ≥ 10 ng/ml | 3.46 | 2.19-5.44 | <0.001 | 1.79 | 0.78-4.0 | 0.16 |
| PIRADS score | ||||||
| 3 | 1.0 | 1.0 | ||||
| 4 | 1.98 | 0.92-4.37 | 0.079 | 1.30 | 0.53-3.15 | 0.50 |
| 5 | 4.84 | 1.97-11.93 | <0.001 | 1.70 | 0.55-5.16 | 0.30 |
| Prostate biopsy + | ||||||
| monolateral | 1.0 | 1.0 | ||||
| bilateral | 1.40 | 0.95-2.07 | 0.087 | 2.0 | 1.48-6.22 | 0.064 |
| Max percentage PC tissue per core | Not included | |||||
| < 25% | 1.0 | |||||
| 25-50% 51-75% >75% |
1.33 1.33 2.0 |
0.76-2.35 0.76-2.35 0.75-5.33 |
0.285 0.285 0.102 |
|||
| ISUP grading | ||||||
| 1 e 2 | 1.0 | 1.0 | ||||
|
3 4-5 |
5.41 10.63 |
3.23-0.97 5.79-19.52 |
<0.001 <0.001 |
2.106.40 | 0.95-5.021.72-24.44 | 0.060.006 |
| Risk Classes | ||||||
| Low | 1.0 | |||||
| Intermediate | 1.20 | 0.87-2.45 | 0.276 | 1.0 | ||
| High | 2.90 | 1.74-4.89 | <0.001 | 2.80 | 1.1-6.2 | 0.04 |
Table 9.
b Risk for upgrading (ISUP 1-2 in ISUP 3-5) at surgery on the basis of different preoperative parameters at univariate and multivariate analysis.
Table 9.
b Risk for upgrading (ISUP 1-2 in ISUP 3-5) at surgery on the basis of different preoperative parameters at univariate and multivariate analysis.
| Univariate | Multivariate | |||||
| Parameter | OR | 95%CI | P value | OR | 95%CI | P value |
| Preoperative PSA | ||||||
| <10 ng/ml | 1.0 | 1.0 | ||||
| ≥ 10 ng/ml | 3.42 | 1.65-7.10 | <0.001 | 2.20 | 0.7-8.69 | 0.15 |
| PIRADS score | Not included | |||||
| 3 | 1.0 | |||||
| 4 | 1.57 | 0.4-6.09 | 0.51 | |||
| 5 | 0.58 | 0.56-5.96 | 0.64 | |||
| Prostate biopsy + | ||||||
| monolateral | 1.0 | 1.0 | ||||
| bilateral | 2.06 | 1.01-4.18 | 0.042 | 1.71 | 0.8-3.54 | 0.1 |
| Max percentage PC tissue per core | Not included | |||||
| < 25% | 1.0 | |||||
| 25-50% 51-75% >75% |
1.0 1.20 1.33 |
0.66-2.15 0.75-2.53 |
0.385 0.102 |
|||
| Risk Classes | ||||||
| Low | 1.0 | |||||
| Intermediate | 1.0 | 1.0 | ||||
| High | 2.90 | 1.74-4.89 | <0.001 | 3.28 | 1.45-7.4 | 0.04 |
Table 9.
c Risk for lymp hnode involvement (pN1) at surgery on the basis of different preoperative parameters at univariate and multivariate analysis.
Table 9.
c Risk for lymp hnode involvement (pN1) at surgery on the basis of different preoperative parameters at univariate and multivariate analysis.
| Univariate | Multivariate | |||||
| Parameter | OR | 95%CI | P value | OR | 95%CI | P value |
| Preoperative PSA | ||||||
| <10 ng/ml | 1.0 | 1.0 | ||||
| ≥ 10 ng/ml | 4.27 | 1.65-11.02 | 0.001 | 1.31 | 0.63-2.71 | 0.47 |
| PIRADS score | ||||||
| 3 | 1.0 | 1.0 | ||||
| 4 | 1.07 | 1-1.15 | 0.10 | 2.55 | 1.08-6 | 0.03 |
| 5 | 1.28 | 1.08-1.53 | 0.003 | 3.97 | 1.36-11.54 | 0.01 |
| Prostate biopsy + | ||||||
| monolateral | 1.0 | 1.0 | ||||
| bilateral | 5.20 | 1.48-18.36 | 0.005 | 1.35 | 0.96-1.89 | 0.78 |
| Max percentage PC tissue per core | Not included | |||||
| < 25% | 1.0 | |||||
| 25-50% 51-75% >75% |
1.0 1.0 1.50 |
0.67-3.39 |
0.27 | |||
| Risk classes | ||||||
| Low | 1.0 | |||||
| Intermediate | 1.0 | 1.0 | ||||
| High | 7.32 | 2.06-25.94 | <0,001 | 4.50 | 1.7.11.9 | 0.002 |
| Number of lymph nodes removed at surgery | ||||||
| <10 | 1.0 | 1.0 | ||||
| 10-15 | 3.36 | 0.7-12 | 0.10 | 1.70 | 0.62-11 | 0.5 |
| >15 | 5.69 | 1.78-18.17 | 0.001 | 4.10 | 1.009-26.5 | 0.049 |
| Nomogram risk | ||||||
| ≤7% | 1.0 | 1.0 | ||||
| >7% | 1.30 | 1.07-1.49 | 0.10 | 1.61 | 0.17-15.1 | 0.60 |
| Surgical technique | ||||||
| Laparoscopy | 1.0 | 1.0 | ||||
| Robotic assisted | 1.20 | 0.5-3.15 | 0.60 | 2.0 | 0.34-12.66 | 0.60 |
| ISUP grading | ||||||
| 1 e 2 | 1.0 | 1.0 | ||||
| 3 4-5 |
9.45 9.28 |
1.93-46.32 1.96-43.86 |
0.003<0.001 | 2.215.89 | 3.0-11.523.0-11.52 | 0.005<0.003 |
| pTstage | ||||||
| pT2 | 1.0 | 1.0 | ||||
| pT3a pT3b |
1.08 1.70 |
1.01-1.15 1.28-2.25 |
0.012<0.001 | 1.203.34 | 0.76-1.961.5-7.4 | 0.400.003 |
Table 9.
d Risk for positive surgical margin at surgery on the basis of different preoperative parameters at univariate and multivariate analysis.
Table 9.
d Risk for positive surgical margin at surgery on the basis of different preoperative parameters at univariate and multivariate analysis.
| Univariate | Multivariate | |||||
| Parameter | OR | 95%CI | P value | OR | 95%CI | P value |
| Preoperative PSA | ||||||
| <10 ng/ml | 1.0 | 1.0 | ||||
| ≥ 10 ng/ml | 3.57 | 2-5.63 | <0.001 | 2.98 | 1-8.8 | 0.04 |
| Prostate volume | Not included | |||||
| <50 cc | 1.0 | |||||
| ≥ 50 cc | 1.04 | 0.47-2.33 | 0.90 | |||
| PIRADS score | ||||||
| 3 | 1.0 | 1.0 | ||||
| 4 | 1.57 | 0.54-4.54 | 0.40 | 0.89 | 0.2-3.2 | 0.80 |
| 5 | 3.32 | 1.08-10.23 | 0.03 | 1.90 | 0.7-9.5 | 0.20 |
| Prostate biopsy + | Not included | |||||
| monolateral | 1.0 | |||||
| bilateral | 1.14 | 0.68-1.09 | 0.60 | |||
| Risk classes | ||||||
| Low | 1.0 | |||||
| Intermediate | 1.0 | 1.0 | ||||
| High | 1.44 | 0.81-2.54 | 0.20 | 4.98 | 1.0-22.8 | 0.40 |
| Surgical technique | ||||||
| Laparoscopic | 1.0 | 1.0 | ||||
| Robotic assisted | 1.27 | 0.7-2.1 | 0.35 | 1.20 | 0.5-1.8 | 0.40 |
| Nerve sparing tecnique at surgery | ||||||
| no | 1.0 | 1.0 | ||||
| yes | 0.80 | 0.46-1.44 | 0.48 | 2.10 | 0.5-7.9 | 0.30 |
| Operative time | Not included | |||||
| ≤ 120 min | 1.0 | |||||
| >120 min | 1.57 | 0.34-7.27 | 0.56 | |||
| pTstage | ||||||
| pT2 | 1.0 | 1.0 | ||||
| pT3a | 2.0 | 1.15-3.52 | 0.01 | 2.0 | 1.1-3.65 | 0.20 |
| pT3b | 4.60 | 2.27-9.32 | <0.001 | 4.60 | 2-10.67 | <0.001 |
| ISUP grading at surgery | ||||||
| 1-2 | 1.0 | 1.0 | ||||
| 3 | 1.65 | 0.90-3.0 | 0.10 | 1.37 | 0.73-2.66 | 0.30 |
| 4-5 | 1.84 | 1.0-3.41 | 0.05 | 1.40 | 0.74-2.70 | 0.30 |
Table 9.
e Risk for biochemical progression after surgery on the basis of different preoperative parameters at univariate and multivariate analysis.
Table 9.
e Risk for biochemical progression after surgery on the basis of different preoperative parameters at univariate and multivariate analysis.
| Univariate | Multivariate | |||||
| Parameter | OR | 95%CI | P value | OR | 95%CI | P value |
| Preoperative PSA | ||||||
| <10 ng/ml | 1.0 | 1.0 | ||||
| ≥ 10 ng/ml | 3.0 | 1.68-5.57 | <0.001 | 4.12 | 1.2-19.21 | 0.007 |
| PIRADS score | ||||||
| 3 | 1.0 | 1.0 | ||||
| 4 | 1.05 | 1-1.09 | 0.06 | 1.02 | 0.9-1.20 | 0.90 |
| 5 | 1.42 | 1.17-1.71 | <0.001 | 1.90 | 0.7-9.50 | 0.20 |
| Prostate biopsy + | ||||||
| monolateral | 1.0 | 1.0 | ||||
| bilateral | 2.64 | 1.37-5.10 | 0.003 | 4.52 | 0.81-25.10 | 0.08 |
| Risk classes | ||||||
| Low | 1.0 | |||||
| Intermediate | 1.0 | 1.0 | ||||
| High | 4.35 | 2.47-8.44 | <0.001 | 9.66 | 1.85-50.32 | 0.007 |
| Surgical technique | ||||||
| Laparoscopic | 1.0 | 1.0 | ||||
| Robotic assisted | 0.38 | 0.19-0.75 | 0.007 | 0.66 | 0.17-2.55 | 0.66 |
| Nerve sparing tecnique at surgery | ||||||
| no | 1.0 | 1.0 | ||||
| yes | 0.24 | 0.09-0.62 | 0.002 | 0.30 | 0.10-2.20 | 0.30 |
| Operative time | ||||||
| ≤ 120 min | 1.0 | 1.0 | ||||
| >120 min | 1.10 | 0.99-1.14 | 0.23 | 0.98 | 0.65-1.62 | 0.90 |
| pTstage | ||||||
| pT2 | 1.0 | 1.0 | ||||
| pT3a | 3.42 | 1.64-7.14 | <0.001 | 1.20 | 0.70-3.0 | 0.40 |
| pT3b | 11.10 | 4.80-25.75 | <0.001 | 2.82 | 0.99-8.21 | 0.06 |
| ISUP grading at surgery | ||||||
| 1-2 | 1.0 | 1.0 | ||||
| 3 | 3.21 | 1.47-7.0 | 0.005 | 1.87 | 0.83-5.72 | 0.190 |
| 4-5 | 6.76 | 3.32-13.70 | <0.001 | 3.73 | 1.50-9.50 | 0.006 |
| Lymphnode involvement | ||||||
| pN0 | 1.0 | 1.0 | ||||
| pN1 | 2.46 | 1.82-5.13 | 0.010 | 8.32 | 1.53-45.0 | 0.014 |
| Number of Lymph nodes removed | ||||||
| <10 | 1.0 | 1.0 | ||||
| 10-15 | 3.18 | 0.99-10.21 | 0.60 | 1.7 | 0.40-3.20 | 0.40 |
| >15 | 2.86 | 1.24-6.60 | 0.010 | 2.2 | 0.80-4.50 | 0.20 |
| Surgical margins | ||||||
| Negative | 1.0 | 1.0 | ||||
| positive | 4.97 | 2.39-10.34 | <0.001 | 7.20 | 1.80-28.30 | 0.004 |
| Surgical margins grade | ||||||
| 3 | 1.0 | 1.0 | ||||
| 4 | 5.0 | 5.57-45.0 | <0.001 | 4.96 | 2.37-10.37 | <0.001 |
| PNI at surgery | ||||||
| negative | 1.0 | 1.0 | ||||
| positive | 4.50 | 1.92-10.55 | <0.001 | 1.50 | 0.63-4.50 | 0.32 |
3.7.1. Predictors for the Risk of Extracapsular Extension
On univariate analysis, the risk of extracapsular extension at pathological staging after surgery did not significantly vary according to percentage of positive tissue per core at biopsy and biopsy laterality whereas it significantly increased according to preoperative PSA (OR= 3.46; 95% CI= 2.19-5.44; p<0.002), PIRADS score (highest OR=4.84; 95% CI=1.97-11.93; p<0.001), ISUP grading (highest OR=10.63; 95% CI 5.79-19.52;p<0.001) and risk class (high risk: OR=2.9; 95% CI=1.74-4.89; p<0.001). On multivariate analysis, ISUP grading 4-5 and high risk class were the only variables able to independently and significantly influence the risk for extracapsular extension ( p=0.006 and p=0.04 respectively) (Table 9a) .
3.7.2. Predictors for the Risk of Upgrading at Surgery
On univariate analysis, the risk of upgrading after surgery (ISUP 1-2 in ISUP 3-5) did not significantly vary according to PIRADS score at mMR and percentage of positive tissue per core. Considering the intermediate risk class as standard reference, the risk of upgrading significantly increased 2.9 times (95%CI 1.74-4.89; p<0.001) in cases with a high risk tumor. On multivariate analysis, only high risk class remains a variable able to independently and significantly influence the risk for upgrading (p=0.04) (Table 9b).
3.7.3. Predictors for the Risk of Lymph Node Involvement
On univariate analysis, the risk of lymph node involvement at pathological evaluation (pN1) did not significantly vary according to the percentage of positive tissue per core biopsy, Briganti 2019 nomogram risk using a 7% cut-off (OR=1.3; 95% CI=1.07-1.49, p=1.61) and surgical approach (OR=1.2; 95%CI= 0.5-3.12; p=0.60) . On univariate analysis, variables able to significantly increase the risk of lymph node involvement were preoperative PSA with a > 15ng/ml value (OR=5.69; 95%CI 1.78-18.17; p=0.001),, high risk class ( OR 7.32; 95%CI 2.06-25.94, p<0.001), number of lymph nodes removed at surgery >15 vs <10 (OR 5.69; 95%CI=1.78-18.17; p=0.001), ISUP grading 3 vs 1-2 and 4-5 vs 1-2 (OR=9.45; 95%CI=1.93-46.32; p=0.003 and OR=9.28; 95%CI=1.96-43.86; p<0.001 respectively) and pT stage, pT3a vs pT2 and pT3b vs pT2 (OR= 1.08; 95%CI=1.01-1.15; p=0.012 and OR=1.7; 95%CI=1.28-2.25; p<0.001).
On multivariate analysis, PIRADS score 4 vs 3 and 5 vs 3 (p=0.01 and p=0.03), high risk class (0.002), ISUP grading 3 vs 1-2 and 4-5 vs 1-2 (p=0.005 and p<0.003) , pT3b vs pT2 (p=0.003) and number of removed lymph node >15 versus < 10 (p=0.049) were the variables able to independently and significantly influence the risk for lymph node involvement (Table 9c).
3.7.4. Predictors for the Risk of Positive Surgical Margins
On univariate analysis, the risk of positive surgical margins at pathological evaluation did not significantly vary according to prostate volume, positive biopsy laterality, risk class, NS technique (OR=0.8; 95%CI=0.46-1.44; p=0.48), surgical approach (OR=1.27; 95%CI=0.7-2.1; p=0.35), operative time >120min vs <120min (OR= 1.57; 95%CI 0.34-7.27.; p=0.56). On the contrary, the risk of SM+ increased with preoperative PSA >10ng/dl vs <10ng/dl (OR=3.57; 95%CI=1-5.63;p<0.001), PIRADS score 5 vs 3 (OR3.32; 95%CI 1.08-10.23; p=0.003), pT3a vs pT2 and pT3b vs pT2 (OR=2; 95%CI 1.15-3.52; p=0.01 and OR=4.6; 95%CI 2.27-9.32; p<0.001) and ISUP grading 4-5 vs 1-2 (OR=1.84; 95%CI 1-3.41; p=0.05).
On multivariate analysis, only preoperative PSA and pT3b vs pT2 remained variables able to independently and significantly influence the risk for SM+ (p=0.04 and p<0.001, respectively) (Table 9d).
3.7.5. Predictors for the Risk of Biochemical Recurrence
On univariate analysis, the risk of biochemical recurrence (BCR) during the postoperative follow-up was significantly related to several variables. In particular, the risk for BCR increased with preoperative PSA >10ng/ml vs <10ng/ml (OR=3; 95%CI 1.68-5.57; p<0.001), PIRADS score 5 vs 3 (OR= 1.42; 95%CI 1.17-1.71; p<0.001), positive biopsy laterality (OR= 2.64; 95%CI= 1.37-5.1; p=0.003), risk class (OR=4.35; 95%CI 2.47-8.44; p<0.001), pT3a vs pT2 and pT3b vs pT2 (OR=3.42; 95%CI 1.64-7.14; p<0.001 and OR=11.1; 95%CI 4.8-25.75; p<0.001 respectively), ISUP grading 3 vs 1-2 and 4-5 vs 1-2 (OR=3.21; 95%CI 1.47-7; p=0.005 and OR=6.76; 95%CI 3.32-13.7; p<0.001), lymph nodes removed >15 vs <10 (OR=2.86; 95%CI 1.24-6.6; p=0.01), SM positivity (OR=4.97; 95%CI 2.39-10.34; p<0.001), grading at SM+ 4 vs 3 (OR=50; 95%CI 5.57-451; p<0.001) and PNI positivity at final pathology (OR 4.5; 95%CI 1.92-10.55; p<0.001). Finally, the risk for BCR was lower in patients who underwent a RARP when compared to a LRP and in those submitted to a NS technique (OR=0.38; 95%CI=0.19-0.75; p=0.007 and OR=0.24; 95%CI 0.09-0.62; p=0.002).
On multivariate analysis, PSA>10 ng/ml (p=0.007), high risk class (p=0.007), ISUP 4-5 (p=0.006), lymph node involvement (p=0.014), SM positivity (p=0.004) and SM+ grading 4 (p<0.001) remained significant and independent predictors for the development of a BCR. (Table 9e)
4. Discussion
Radical prostatectomy remains a primary treatment for non-metastatic prostate cancer, with minimally invasive techniques like laparoscopic radical prostatectomy and robotic-assisted radical prostatectomy being widely adopted. As these techniques continue to evolve, updated evidence is critical for understanding their comparative effectiveness, safety, and patient outcomes [26,27,28,29,30].
LRP, although effective, requires significant technical expertise. Surgeons must develop advanced laparoscopic skills, particularly in high-volume centers, to achieve outcomes that match those of RARP [31,32,33,34,35,36]. A study by Bhayani and Pavlovich [1] reaffirms the steep learning curve associated with LRP, emphasizing the need for extensive training and experience to achieve optimal patient outcomes. Stolzenburg JU [2] reported that while LRP remains effective in experienced hands, the advantages of RARP in preserving functional outcomes, particularly continence, are becoming more pronounced with robotic technology.
RARP, in some experiences, has been associated with lower positive surgical margin rates, particularly in high-risk prostate cancer cases, and better preservation of urinary continence and sexual function due to enhanced nerve-sparing capabilities [12,14,15,16,20,21,22]. A recent systematic review by Ma J et al [3] highlighted the technological superiority of RARP in terms of precision and ergonomics, contributing to better surgical outcomes and shorter learning curves for surgeons compared to LRP. A meta-analysis by Huang X et al [4] found that RARP had significantly better functional outcomes than LRP, especially in terms of early continence recovery and sexual function preservation, making it the preferred choice in several centers. A multi-institutional study by Dell’Oglio et al [5] confirmed that RARP continues to demonstrate superior functional outcomes compared to LRP, with lower rates of postoperative complications.
The latest guidelines of the European Association of Urology reflect the growing preference for RARP in centers where it is available, citing its advantages in functional outcomes. However, LRP remains a recommended alternative and he EAU Guidelines on Prostate Cancer (2024) emphasize that both LRP and RARP are viable options, with the choice depending on the availability of technology and surgeon expertise [7]. RARP may be favored for its superior functional outcomes, particularly in terms of continence and potency preservation [12,14,15,16,20,21,22]. The decision between these techniques should be individualized based on patient characteristics, surgeon experience, and available resources, in line with the latest European guidelines [7].
In the present study we report the long-term case history of a population of patients with non-metastatic PC considered suitable, according to EAU guidelines and after multidisciplinary discussion, for radical prostatectomy, performed by a single surgeon with experience of over 10 years with LRP and over 5 years with RARP. This population represents a homogeneously treated sample in a perfect real-life situation at a high-volume institution for the treatment of PC and with a multidisciplinary (MDT) group regulating decisions relating to the management of each individual patient. Limitations and strengts: Strengths of the study are the analysis of a real-world situation in a high-volume center and with an MDT group that determines homogeneous evaluation and treatment criteria. Furthermore, as a university training center, all LRP and RARP procedures were performed by a single surgeon with an operating team of urology residents. The limitations are mainly the lack of randomization in the selection of patients for the two procedures (LRP versus RARP). No selection parameters were considered to determine the surgical procedure; however, the non-randomization produced some differences between the population undergoing LRP and that undergoing RARP. In particular, age was significantly higher in the LRP group, whereas the percentage of PIRADS 4-5 at mMR and the percentage of clinical locally advanced stage (cT3) was significantly higher in the RARP group. Except for these parameters, the two populations are sufficiently homogeneous at baseline.
In the comparison between the robotic and laparoscopic approach, a first advantage of the robotic approach is a significant reduction in operating times, days of hospitalization and postoperative catheterization compared to laparoscopic surgery (despite the greater experience of the operator > 10 years in LRP compared to robotics > 5 years).Perioperative and postoperative complications such as anastomotic leakage, need of blood transfusion, urethral stricture have practically disappeared with both approaches. Both approaches have similarly resulted in a drastic reduction in postoperative complications in clinical practice; the greater simplicity of the robotic approach produces an advantage also in terms of operating, catheterization and hospitalization times.
With a homogeneous indication for extended lymph node dissection (all high risk cases and >5% risk at Briganti nomogram in intermediate risk), a similar percentage of cases was submitted to eLND using RARP or LRP. RARP was able to remove a significantly higher number of lymph nodes, however the percentage of pN1 was similar and limited in both approaches (LRP 15.8%, RARP 13.6%). The role of extended lymphadenectomy in RP remains debated due to the low percentages of pN1 reported in most experiences, regardless of the number of lymph nodes removed at surgery and despite indications obtained by nomograms []. In our experience, at multivariate analysis, together with PIRADS score , high risk class, ISUP grading and pT stage, also the number of removed lymph node >15 versus < 10 was a variables able to independently and significantly influence the risk for pathologic lymph node involvement (OR 4.10; 95%CI 1.0-26.5;p=0.049), whereas surgical approach was not a significant variable.
Our experience did not confirm significant differences in terms of risk for SM+ related to the surgical approach although the percentage was slightly higher after RARP. A higher but not statistically significant percentage of positive surgical margins was found after RARP when compared to LRP, but with lower extraprostatic radial distance in RARP group. At the multivariate analysis only a pathologic involvement of seminal vesicles (pT3b stage) was able to significantly and independently increase the risk of SM+.
The only parameter significantly influenced by the surgical approach in our population was biochemical recurrence at postoperative follow-up. The RARP approach was associated with a significantly lower percentage of BCR (7.5%) when compared to LRP (14.4%)(p=0.014). Time to biochemical progression was similar between LRP and RARP cases but in the RARP group the risk for BCR was significantly reduced at univariate analysis. However, at multivariate analysis the surgical approach did not remain a significant and independent variable able to influence BCR rates, as opposed to surgical margins positivity and grade, lymph node involvement and ISUP grading.
The second crucial point in the comparative analysis between RARP and LRP, is the possibility for a functional long-term advantage []. In our experience, the percentage of nerve sparing techniques was double in the RARP group when compared to the LRP. Robotic vision probably determines greater safety in performing a nerve sparing approach, leading to an extension of the indications in clinical practice. In our clinical practice we extensively use pelvic floor rehabilitation with electrostimulation and biofeedback starting 30 days after removal of the catheter, homogeneously in RARP (21.8%) and LRP (19.0%) cases []. RARP was capable of speeding up the reduction of postoperative urinary losses with a significantly lower PAD weight at 3 and 6 months postoperatively compared to LR (mean pad weight 75.57±122grams and 14±42 grams respectively in LRP and RARP (p<0.01)) while at 12 months the recovery of continence was high in both approaches (no PADS in 91.6% of cases). In cases submitted to a nerve sparing procedure, the two approaches produced no statistically significant differences in terms of IIEF-5 score reduction at 6 and 12 months postoperatively (p>0.05). However, the 12-month IIEF-5 mean and median score showed better results using RARP (18.0±3.75; 18) than LRP (10.14±4.77; 8). Considering ED as postoperative International Index of Erectile Function-5 (IIEF-5) score between 1-10 , the 12-month percentage of ED was 57.3% in LRP and 45.4% in RARP.
5. Conclusions
In the comparison between the robotic and laparoscopic approach, a clear advantage of the robotic approach is a significant reduction in operating times, days of hospitalization and postoperative catheterization compared to laparoscopic surgery. Perioperative and postoperative complications such as anastomotic leakage, need of blood transfusion, urethral stricture have practically disappeared with both approaches. it is not possible to describe any certain oncological advantage both in terms of surgical margins and pathological lymph nodes removed. A reduction to the limit of significance is described in terms of biochemical recurrence to the advantage of the robotic approach. RARP produces a more rapid recovery of urinary continence at 3 months postoperatively without significant advantages in terms of erective potency recovery.
6. Patents
The choice of a robotic assisted approach for radical prostatectomy procedure can provide a clear advantage in terms of reduction of operating time, days of hospitalization and catheterization compared to the laparoscopic surgery. Perioperative complications such as anastomotic leakage, need of transfusion, urethral stricture have practically disappeared with both approaches. It is not possible to report any certain oncological advantages of one technique on the other. Robotic approach produces a more rapid recovery of urinary continence at 3 months postoperatively without significant advantages in terms of erective potency recovery.
Supplementary Materials
none.
Author Contributions
All authors significantly contributed to the research and the manuscript. Stefano Salciccia: contributing to clinical evaluations; collecting data; writing manuscript. Valerio Santarelli: collecting data, statistical analysis, writing manuscript Giovanni Di Pierro, Francesco Del Giudice, Giulio Bevilacqua, Giovanni Di Lascio, Alessandro Gentilucci, Giorgio Franco; Flavio Forte: contributing to clinical and surgical evaluation, data collection. Roberta Corvino, Marco Frisenda, Valentina Brunelli, Greta Basile, Carlo Scornajenghi, Lorenzo Santodirocco, Davide Rosati, Martina Moriconi: data collection ; Valeria Panebianco: contributing to clinical radiological evaluation; data collection; Fabio Magliocca: contributing to pathologic evaluation, data collection. Daniele Santini, Mattia Alberto Di Civita: contributing to pathologic evaluation, data collection. Alessandro Sciarra: organizing the study, surgical procedures, clinical evaluation ; data collection, Writing the manuscript
Funding
This research received no external funding.
Institutional Review Board Statement
The analysis was approved by our internal ethical committee and all patients gave their informed consensus for each procedure. All diagnostic and therapeutic procedures reflected our routine clinical practice in a department at high-volume for the management of PC disease.
Informed Consent Statement
all patients gave their informed consensus for each procedure. All diagnostic and therapeutic procedures reflected our routine clinical practice in a department at high-volume for the management of PC disease.
Acknowledgments
no acknoledgments.
Conflicts of Interest
The authors declare no conflicts of interest. None of the contributing authors have any conflict of interest, including specific financial interests or relationships and affiliations relevant to the subject matter or materials discussed in the manuscript.
References
- Bhayani, S, Pavlovich CP, Strup SE, Su LM. Laparoscopic Radical Prostatectomy: a multi-istitutional study of conversion to open surgery. Urology, 2004; 63(1) 99-102. [CrossRef]
- Stolzenburg JU, Holze S, Arthanareeswaran VK, Neuhaus P, Do HM, Haney CM,Dietel A, Truss MC, Stützel KD, Teber D, Hohenfellner M, Rabenalt R, Albers P,Mende M. Robotic-assisted Versus Laparoscopic Radical Prostatectomy: 12-month Outcomes of the Multicentre Randomised Controlled LAP-01 Trial. Eur Urol Focus. 2022 Nov;8(6):1583-1590. [CrossRef]
- Ma J, Xu W, Chen R, Zhu Y, Wang Y, Cao W, Ju G, Ren J, Ye X, He Q, Chang Y,Ren S. Robotic-assisted versus laparoscopic radical prostatectomy for prostate cancer: the first separate systematic review and meta-analysis of randomised controlled trials and non-randomised studies. Int J Surg. 2023 May 1;109(5):1350-1359. [CrossRef]
- Huang X, Wang L, Zheng X, Wang X. Comparison of perioperative, functional,and oncologic outcomes between standard laparoscopic and robotic-assisted radical prostatectomy: a systemic review and meta-analysis. Surg Endosc. 2017 Mar;31(3):1045-1060. [CrossRef]
- Dell'Oglio P, Mottrie A, Mazzone E. Robot-assisted radical prostatectomy vs.open radical prostatectomy: latest evidences on perioperative, functional and oncological outcomes. Curr Opin Urol. 2020 Jan;30(1):73-78. [CrossRef]
- de Oliveira RAR, Guimarães GC, Mourão TC, de Lima Favaretto R, Santana TBM,Lopes A, de Cassio Zequi S. Cost-effectiveness analysis of robotic-assisted versus retropubic radical prostatectomy: a single cancer center experience. J Robot Surg. 2021 Dec;15(6):859-868. [CrossRef]
- European Association of Urology (EAU). EAU Guidelines on Prostate Cancer. 2024 Available at: [EAU Guidelines](https://uroweb.org/guidelines/prostate-cancer).
- Sciarra A, Gentilucci A, Cattarino S, Innocenzi M, Von Heland M, Gentile V, Salciccia S. Laparoscopic versus open radical prostatectomy in high prostate volume cases: impact on oncological and functional results. Int Braz J Urol 2016; 42: 223-33. [CrossRef]
- Okegawa T, Omura S, Samejima M, Fukuhara H. Laparoscopic radical prostatectomy versus robot-assisted radical prostatectomy: comparison of oncological outcomes at a single center. Prostate International 2020 ;8: 16-21. [CrossRef]
- Gacci M, Artibani W, Bassi P, Bertoni F, Bracarda S, Briganti A, Carmignani G, Carmignani L, Conti G, Corvò R, De Nunzio C, Fusco F, Graziotti P, Greco I, Maggi S, Magrini SM, Mirone V, Montironi R, Morgia G, Muto G, Noale M, Pecoraro S, Porreca A, Ricardi U, Russi E, Russo G, Salonia A, Simonato A, Serni S, Tomasini D, Tubaro A, Zagonel V, Crepaldi G; MIRROR-SIU/LUNA Study Group and the Pros-IT CNR Study Group. How radical prostatectomy procedures have changed over the last 10 years in Italy: a comparative analysis based on more than 1500 patients participating in the MIRROR-SIU/LUNA and the Pros-IT CNR study. World J Urol. 2021 May;39(5):1445-1452. [CrossRef]
- Laschena L, Messina E, Flammia RS, Borrelli A, Novelli S, Messineo D, Leonardo C, Sciarra A, Ciardi A, Catalano C, Panebianco V. What the urologist needs to know before radical prostatectomy: MRI effective support to pre-surgery planning. Radiol Med. 2024 Jul;129(7):1048-1061. [CrossRef]
- Salciccia S, Viscuso P, Bevilacqua G, Tufano A, Casale P, De Berardinis E, Di Pierro GB, Cattarino S, Gentilucci A, Lourdes Lia F, Ivan DG, Rosati D, DelGiudice F, Sciarra A, Mariotti G. Comparison of Different Invasive Devices for the Treatment of Urinary Incontinence after Radical Prostatectomy. Adv Urol. 2022 Jun 21;2022:8736249. [CrossRef]
- Di Pierro GB, Salciccia S, Frisenda M, Tufano A, Sciarra A, Scarrone E, Del Giudice F, Asero V, Bevilacqua G, Moriconi M, Carbone A, Pastore A, Signore S, Bove P, Forte F, Emiliozzi P, Tubaro A, De Nunzio C, Canale V. Comparison of Four Validated Nomograms (Memorial Sloan Kettering Cancer Center, Briganti 2012, 2017, and 2019) Predicting Lymph Node Invasion in Patients with High-Risk Prostate Cancer Candidates for Radical Prostatectomy and Extended Pelvic Lymph Node Dissection: Clinical Experience and Review of the Literature. Cancers (Basel). 2023 Mar 9;15(6):1683. [CrossRef]
- Sciarra A, Frisenda M, Maggi M, Magliocca FM, Ciardi A, Panebianco V, Berardinis E, Salciccia S, Di Pierro GB, Gentilucci A, Del Giudice F, Busetto GM, Tufano A. Prospective comparative trial on nerve-sparing radical prostatectomy using a robot-assisted versus laparoscopic technique: expectation versus satisfaction and impact on surgical margins. Cent European J Urol. 2021;74(2):169-177. [CrossRef]
- Valenzi FM, Fuschi A, Al Salhi Y, Sequi MB, Suraci PP, Pacini M, Scalzo S, Rera OA, Antonioni A, Graziani D, Martino G, Candita G, Gianfrancesco F, Zucchi A, Lombardo R, De Nunzio C, Cicione A, Bozzini G, Rengo M, Capodiferro P,Sciarra A, Petrozza V, Carbone A, Pastore AL. Is early continence recovery related to the length of spared urethra? A prospective multicenter study comparing preoperative MRI and histologic specimen measurements after robotic radical prostatectomy. Eur J Surg Oncol. 2024 Jun;50(6):108319. [CrossRef]
- Salciccia S, Sciarra A, Moriconi M, Maggi M, Viscuso P, Rosati D, Frisenda M,Di Pierro GB, Canale V, Bevilacqua G, Nesi G, Del Giudice F, Gentilucci A,Cattarino S, Mariotti G. How to Predict Outcomes from a Biofeedback and Pelvic Floor Muscle Electric Stimulation Program in Patients with Urinary Incontinence after Radical Prostatectomy. J Clin Med. 2021 Dec 27;11(1):127. [CrossRef]
- Lucciola S, Pisciotti ML, Frisenda M, Magliocca F, Gentilucci A, Del Giudice F, Canale V, Scarrone E, Busetto GM, Carrieri G, Cormio L, Carbone A, Pastore A,De Nunzio C, Tubaro A, Leonardo C, Franco G, Di Pierro GB, Salciccia S, Sciarra A, Panebianco V. Predictive role of node-rads score in patients with prostate cancer candidates for radical prostatectomy with extended lymph node dissection:comparative analysis with validated nomograms. Prostate Cancer Prostatic Dis.2023 Jun;26(2):379-387. [CrossRef]
- Salciccia S, Rosati D, Viscuso P, Canale V, Scarrone E, Frisenda M, Catuzzi R, Moriconi M, Asero V, Signore S, De Dominicis M, Emiliozzi P, Carbone A,Pastore AL, Fuschi A, Di Pierro GB, Gentilucci A, Cattarino S, Mariotti G, Busetto GM, Ferro M, De Berardinis E, Ricciuti GP, Panebianco V, Magliocca FM,Del Giudice F, Maggi M, Sciarra A. Influence of operative time and blood loss on surgical margins and functional outcomes for laparoscopic versus robotic-assisted radical prostatectomy: a prospective analysis. Cent European J Urol.2021;74(4):503-515. [CrossRef]
- Fuschi A, Pastore AL, Al Salhi Y, Martoccia A, De Nunzio C, Tema G, Rera OA,Carbone F, Asimakopoulos AD, Sequi MB, Valenzi FM, Suraci PP, Scalzo S, Del Giudice F, Nardecchia S, Bozzini G, Corsini A, Sciarra A, Carbone A. The impact of radical prostatectomy on global climate: a prospective multicentre study comparing laparoscopic versus robotic surgery. Prostate Cancer Prostatic Dis.2024 Jun;27(2):272-278. [CrossRef]
- Sciarra A, Viscuso P, Arditi A, Mariotti G, De Berardinis E, Di Pierro GB,Canale V, Gentilucci A, Maria Busetto G, Maggi M, Eisenberg ML, Vilson F, Chung BI, Ferro M, Salciccia S, Del Giudice F. A biofeedback-guided programme or pelvic floor muscle electric stimulation can improve early recovery of urinary continence after radical prostatectomy: A meta-analysis and systematic review.Int J Clin Pract. 2021 Oct;75(10):e14208. [CrossRef]
- Mariotti G, Salciccia S, Innocenzi M, Gentilucci A, Fasulo A, Gentile V,Sciarra A. Recovery of Urinary Continence After Radical Prostatectomy Using Early vs Late Pelvic Floor Electrical Stimulation and Biofeedback-associated Treatment. Urology. 2015 Jul;86(1):115-20. [CrossRef]
- Mariotti G, Sciarra A, Gentilucci A, Salciccia S, Alfarone A, Di Pierro G,Gentile V. Early recovery of urinary continence after radical prostatectomy using early pelvic floor electrical stimulation and biofeedback associated treatment. J Urol. 2009 Apr;181(4):1788-93. [CrossRef]
- Sciarra A, Gentilucci A, Salciccia S, Von Heland M, Ricciuti GP, Marzio V,Pierella F, Musio D, Tombolini V, Frantellizzi V, Pasquini M, Maraone A,Guandalini A, Maggi M. Psychological and functional effect of different primary treatments for prostate cancer: A comparative prospective analysis. Urol Oncol. 2018 Jul;36(7):340.e7-340.e21. [CrossRef]
- Panebianco V, Salciccia S, Cattarino S, Minisola F, Gentilucci A, AlfaroneA, Ricciuti GP, Marcantonio A, Lisi D, Gentile V, Passariello R, Sciarra A. Use of multiparametric MR with neurovascular bundle evaluation to optimize the oncological and functional management of patients considered for nerve-sparing radical prostatectomy. J Sex Med. 2012 Aug;9(8):2157-66. [CrossRef]
- Sciarra A, Cristini C, Von Heland M, Salciccia S, Gentile V. Randomized trial comparing an anterograde versus a retrograde approach to open radical prostatectomy: results in terms of positive margin rate. Can Urol Assoc J. 2010 Jun;4(3):192-8. [CrossRef]
- Sciarra A, Voria G, Monti S, Mazzone L, Mariotti G, Pozza M, D'Eramo G,Silverio FD. Clinical understaging in patients with prostate adenocarcinoma submitted to radical prostatectomy: predictive value of serum chromogranin A. Prostate. 2004 Mar 1;58(4):421-8. [CrossRef]
- Sciarra A, Gentile V, Voria G, Mariotti G, Seccareccia F, Pastore A, Di Silverio F. Role of radical retropubic prostatectomy in patients with locally advanced prostate cancer: the influence of Gleason score 8-10. Urol Int. 2003;70(3):186-94. [CrossRef]
- Sciarra A, Gentile V, De Matteis A, Dattilo C, Autran Gomez AM, Salciccia S, Di Silverio F. Long-term experience with an anatomical anterograde approach to radical prostatectomy: results in terms of positive margin rate. Urol Int. 2008;80(2):151-6. [CrossRef]
- Sooriakumaran P,Srivastava A,Shariat SF A multinational, multiinstitutional study comparing positive surgical margin rates among 22393 open, laparosocopic and robot assisted radical prostatectomy patients. Eur Urol 2004;66:450-6. [CrossRef]
- Albadine R, Hyndman ME, Chaux A, Jeong JY, Saab S, Tavora F Characteristics of positive surgical margins in robotic assisted radical prostatectomy, open retropubic radical prostatectomy, and laparoscopic radical prostatectomy: a comparative histopathologic study from a single academic center. Hum Pathol. 2012;43:254-60. [CrossRef]
- Hegarty NJ, Kaouk JH. Radical prostatectomy: a comparison of open, laparoscopic and robot-assisted laparoscopic techniques. Can J Urol. 2006;13:56-61.
- Laurila TA, Huang W, Jarrard DF. Robotic-assisted laparoscopic and radical retropubic prostatectomy generate similar positive margin rates in low and intermediate risk patients. Urol Oncol. 2009;27:529-33. [CrossRef]
- Williams SB, D’Amico AV, Weinberg AC, Gu X, Lipsitz SR, Hu JC. Population-based determinants of radical prostatectomy surgical margin positivity. BJU Int. 2011;107:1734-40. [CrossRef]
- Williams SB, Chen MH, D’Amico AV, Weinberg AC, Kacker R, Hirsch MS, et al. Radical retropubic prostatectomy and robotic-assisted laparoscopic prostatectomy: likelihood of positive surgical margin(s). Urology. 2010;76:1097-101. [CrossRef]
- Smith JA Jr, Chan RC, Chang SS, Herrell SD, Clark PE, Baumgartner R, et al. comparison of the incidence and location of positive surgical margins in robotic assisted laparoscopic radical prostatectomy and open retropubic radical prostatectomy. J Urol. 2007;178:2385-9. [CrossRef]
- Pettus JA, Masterson T, Sokol A, Cronin AM, Savage C, Sandhu JS, et al. Prostate size is associated with surgical difficulty but not functional outcome at 1 year after radical prostatectomy. J Urol. 2009;182:949-55. [CrossRef]
Figure 1.
Kaplan Maeier analysis. Estimated rates of Biochemical free-survival (BFS) according to the surgical approach. LRP( Laparoscopic) versus Robotic assisted (RARP).
Figure 1.
Kaplan Maeier analysis. Estimated rates of Biochemical free-survival (BFS) according to the surgical approach. LRP( Laparoscopic) versus Robotic assisted (RARP).
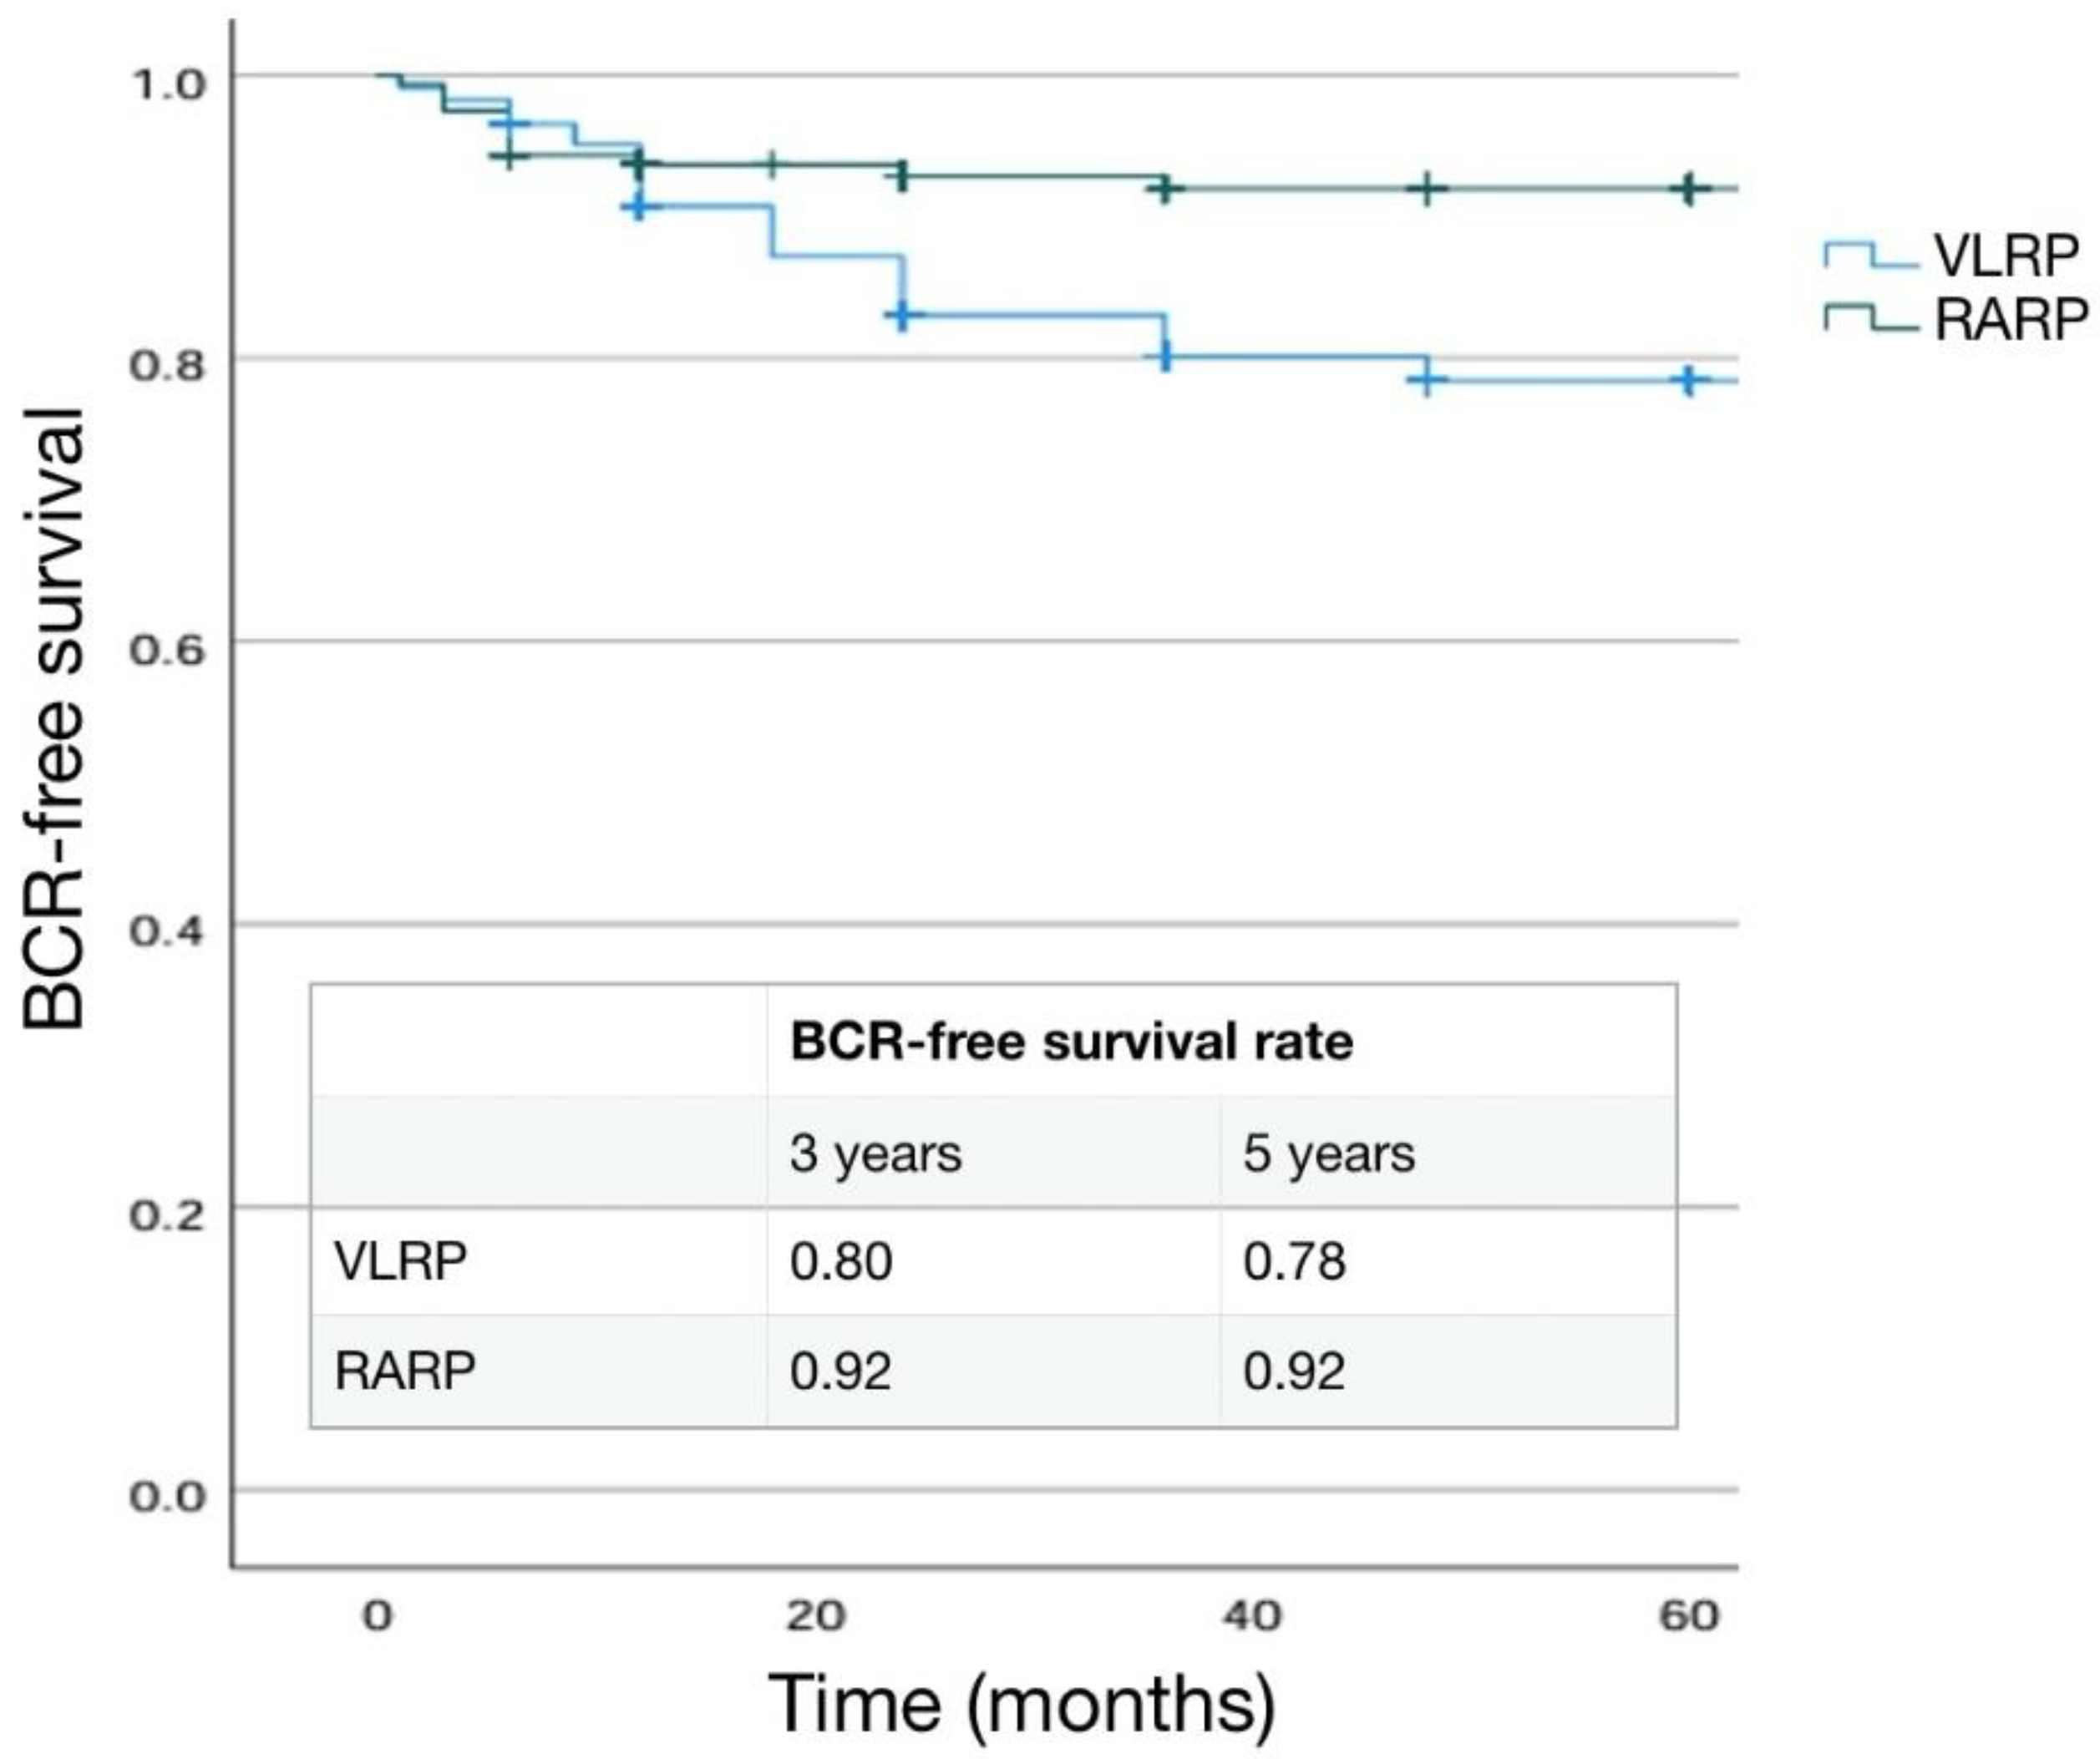
Figure 2.
Kaplan Maeier analysis. Estimated rates of Biochemical free-survival (BFS) according to the pT stage.
Figure 2.
Kaplan Maeier analysis. Estimated rates of Biochemical free-survival (BFS) according to the pT stage.
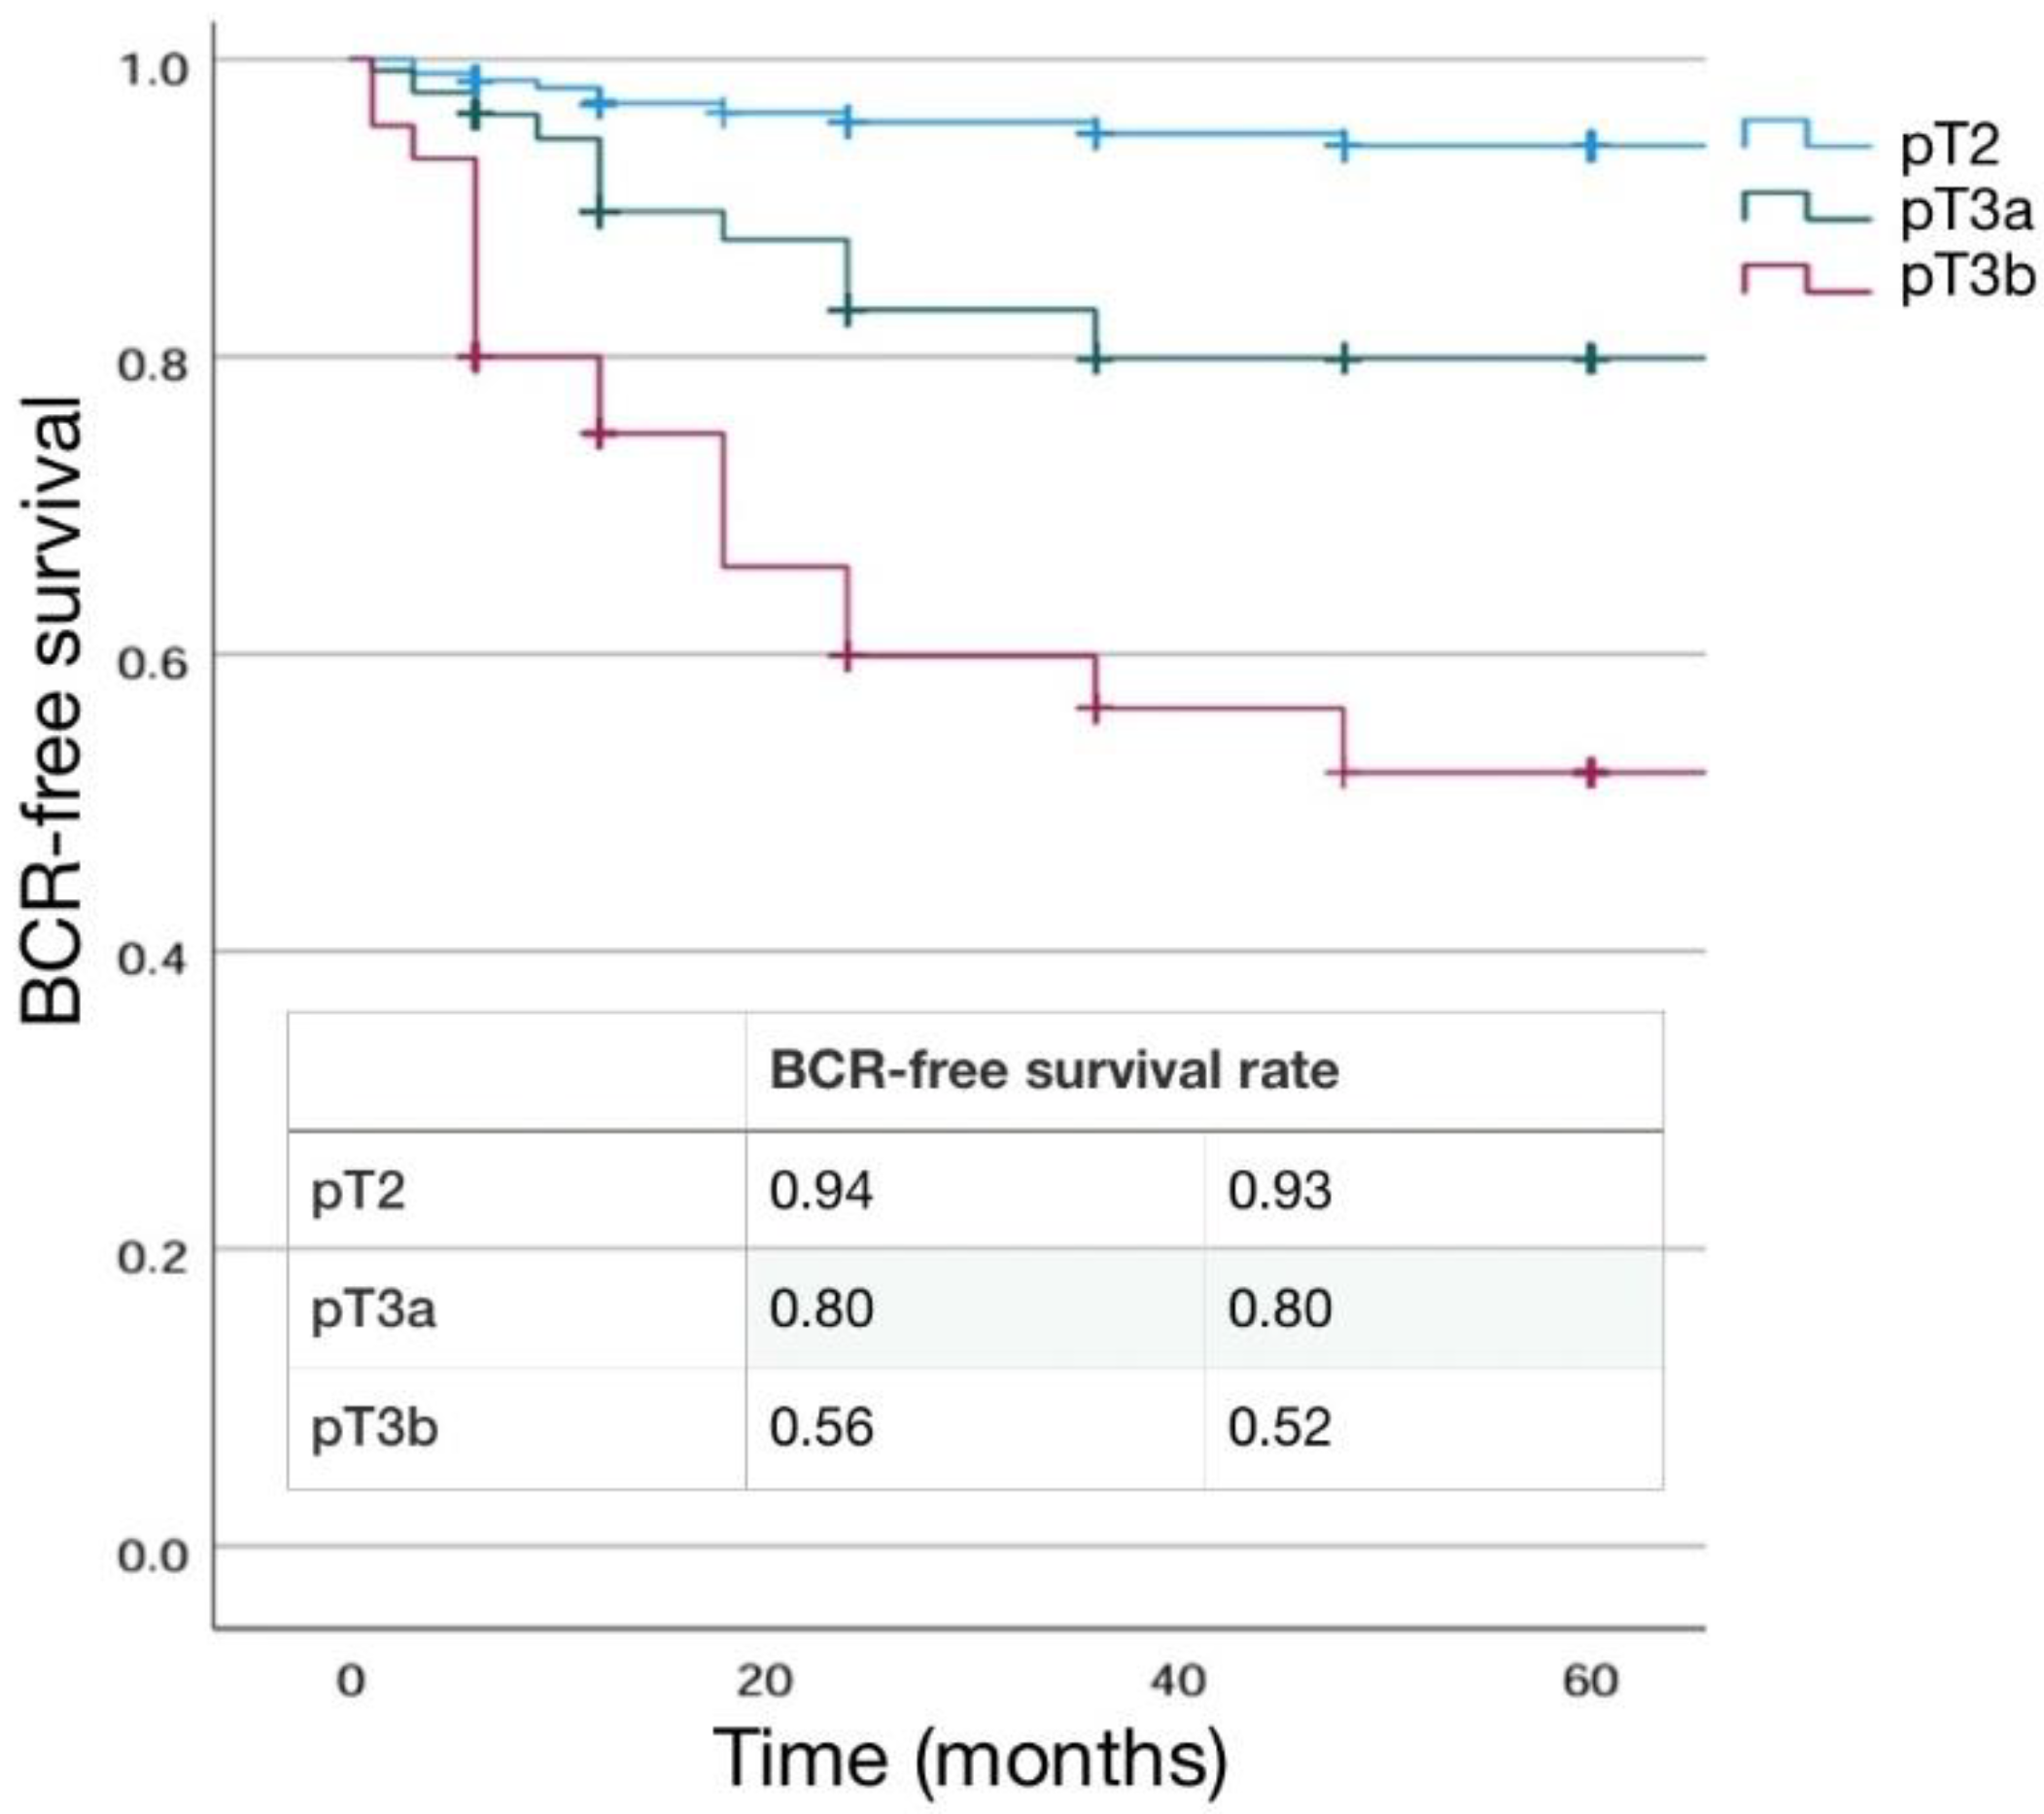
Figure 3.
Kaplan Maeier analysis. Estimated rate of Biochemical free-survival (BFS) according to the pN stage.
Figure 3.
Kaplan Maeier analysis. Estimated rate of Biochemical free-survival (BFS) according to the pN stage.
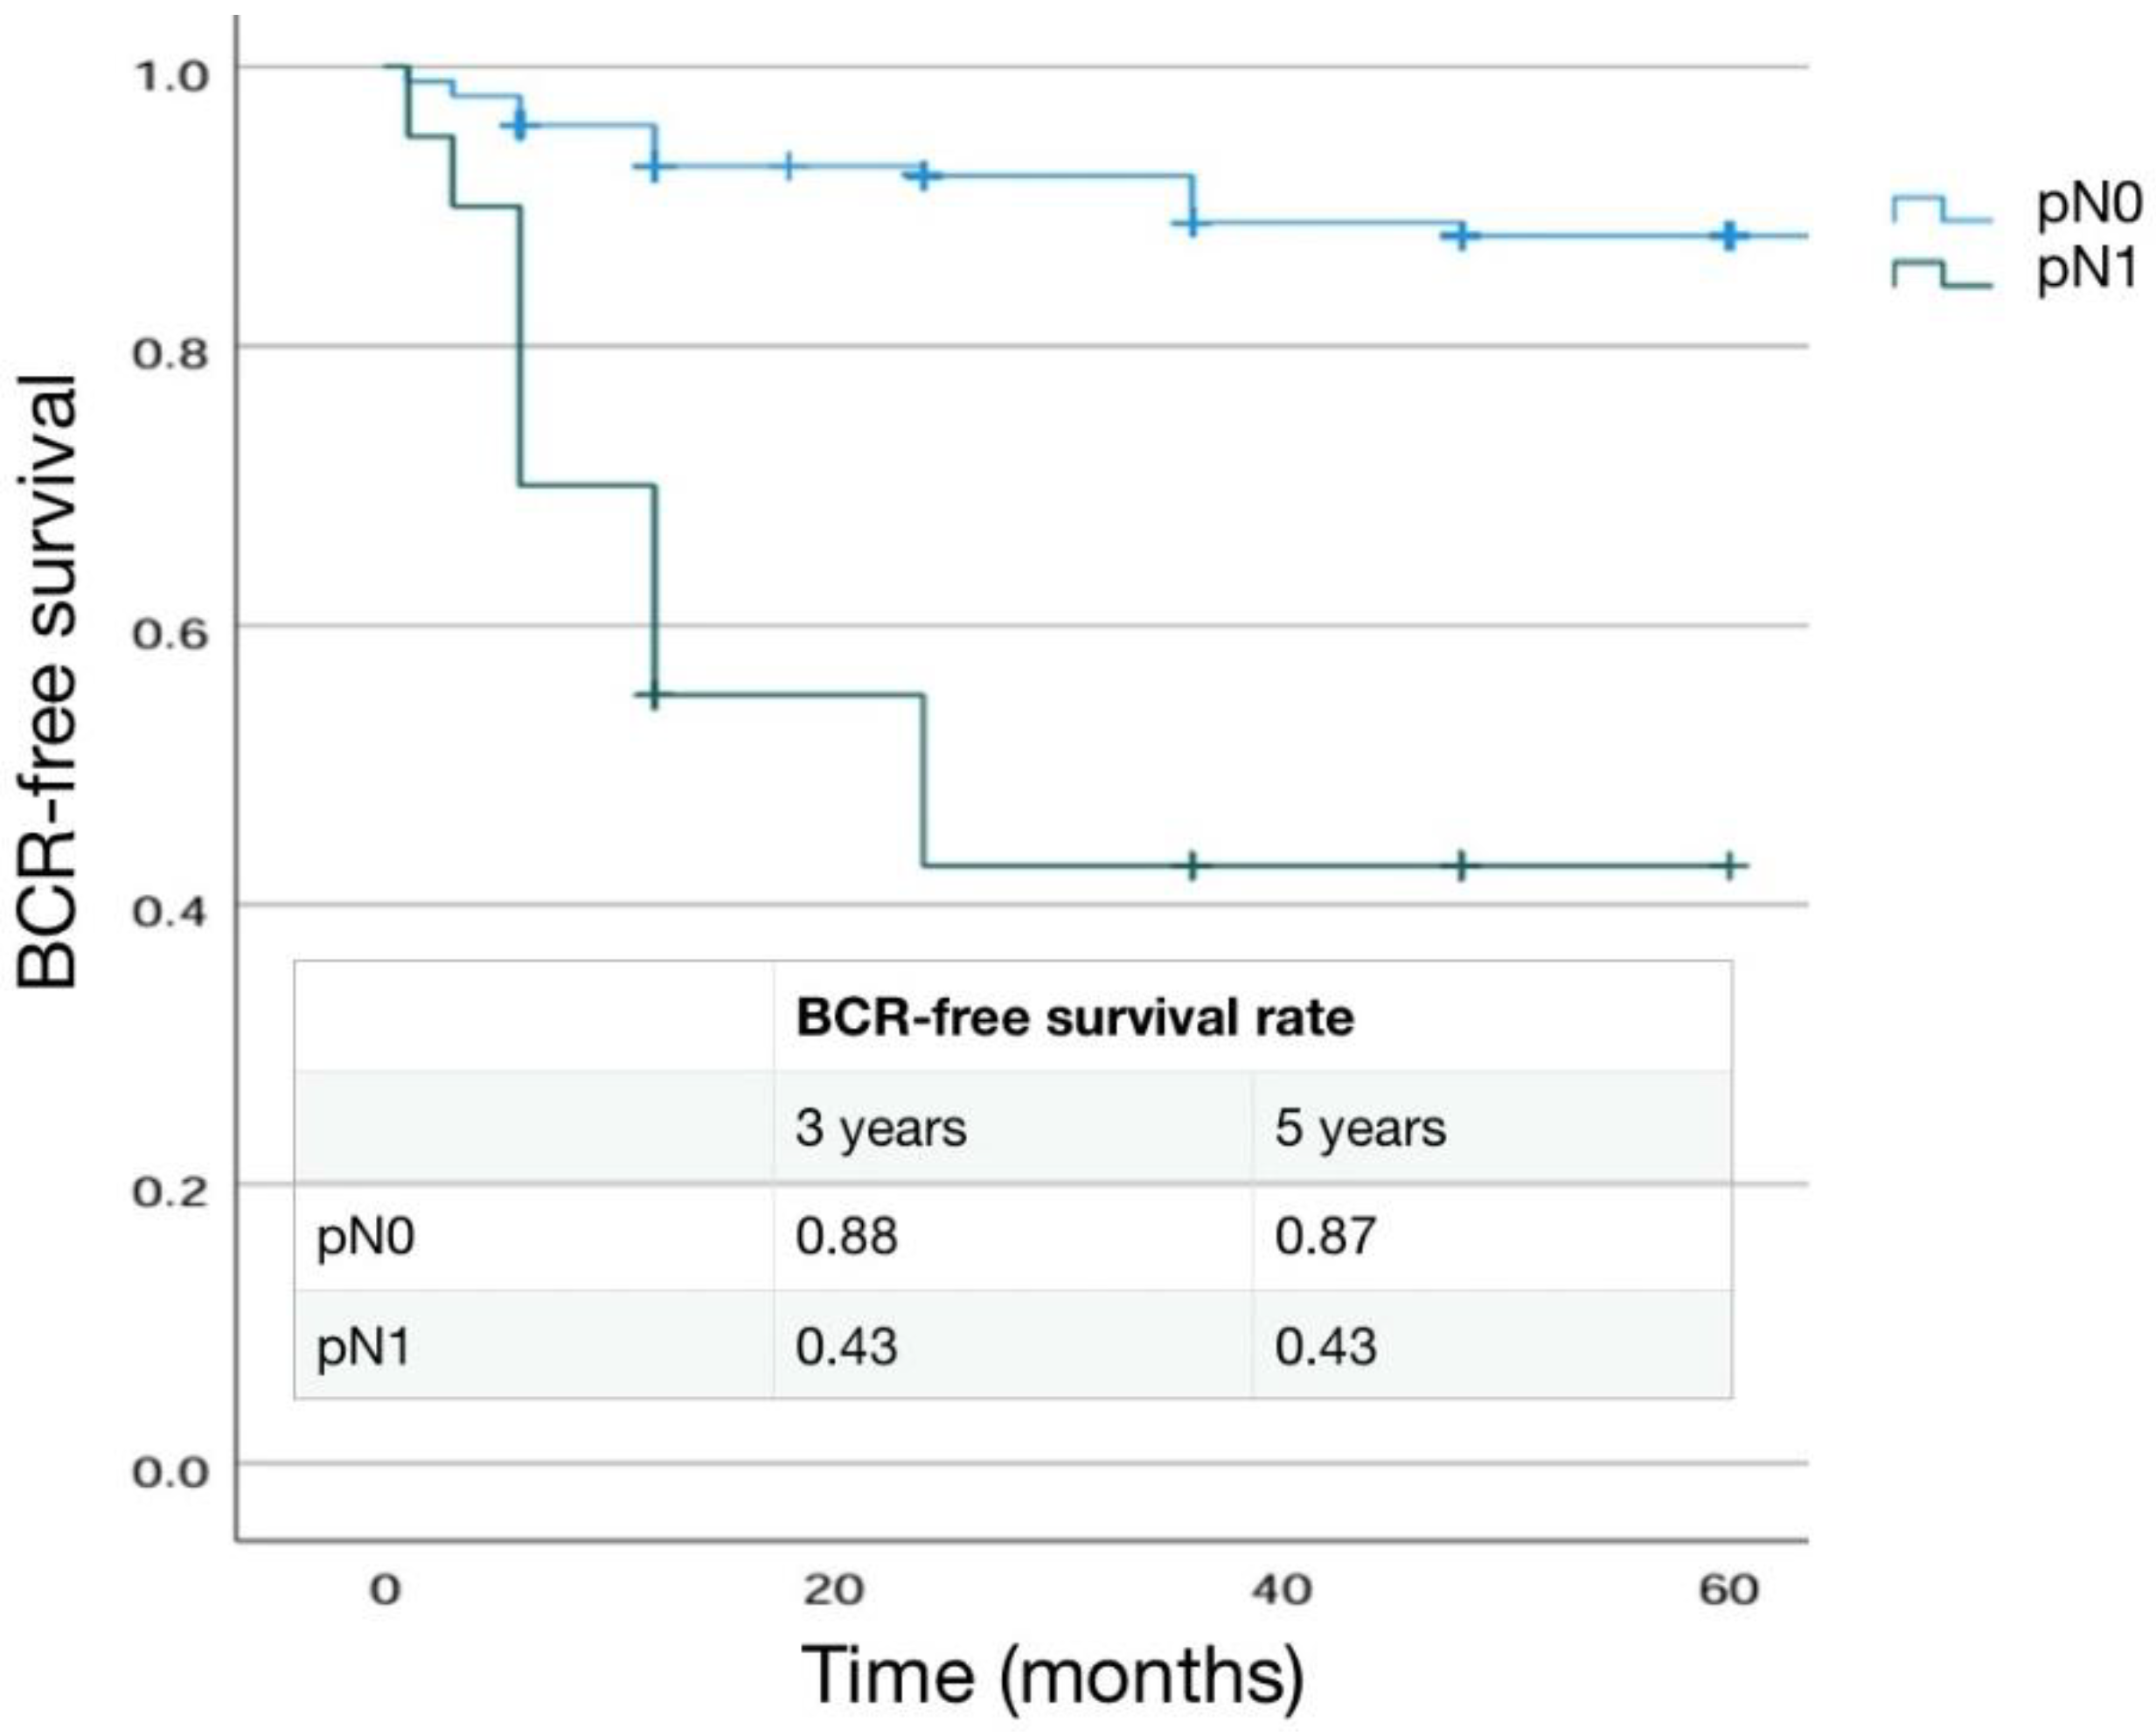
Figure 4.
Kaplan Maeier analysis. Estimated rates of Biochemical free-survival (BFS) according to surgical margin (SM) status.
Figure 4.
Kaplan Maeier analysis. Estimated rates of Biochemical free-survival (BFS) according to surgical margin (SM) status.
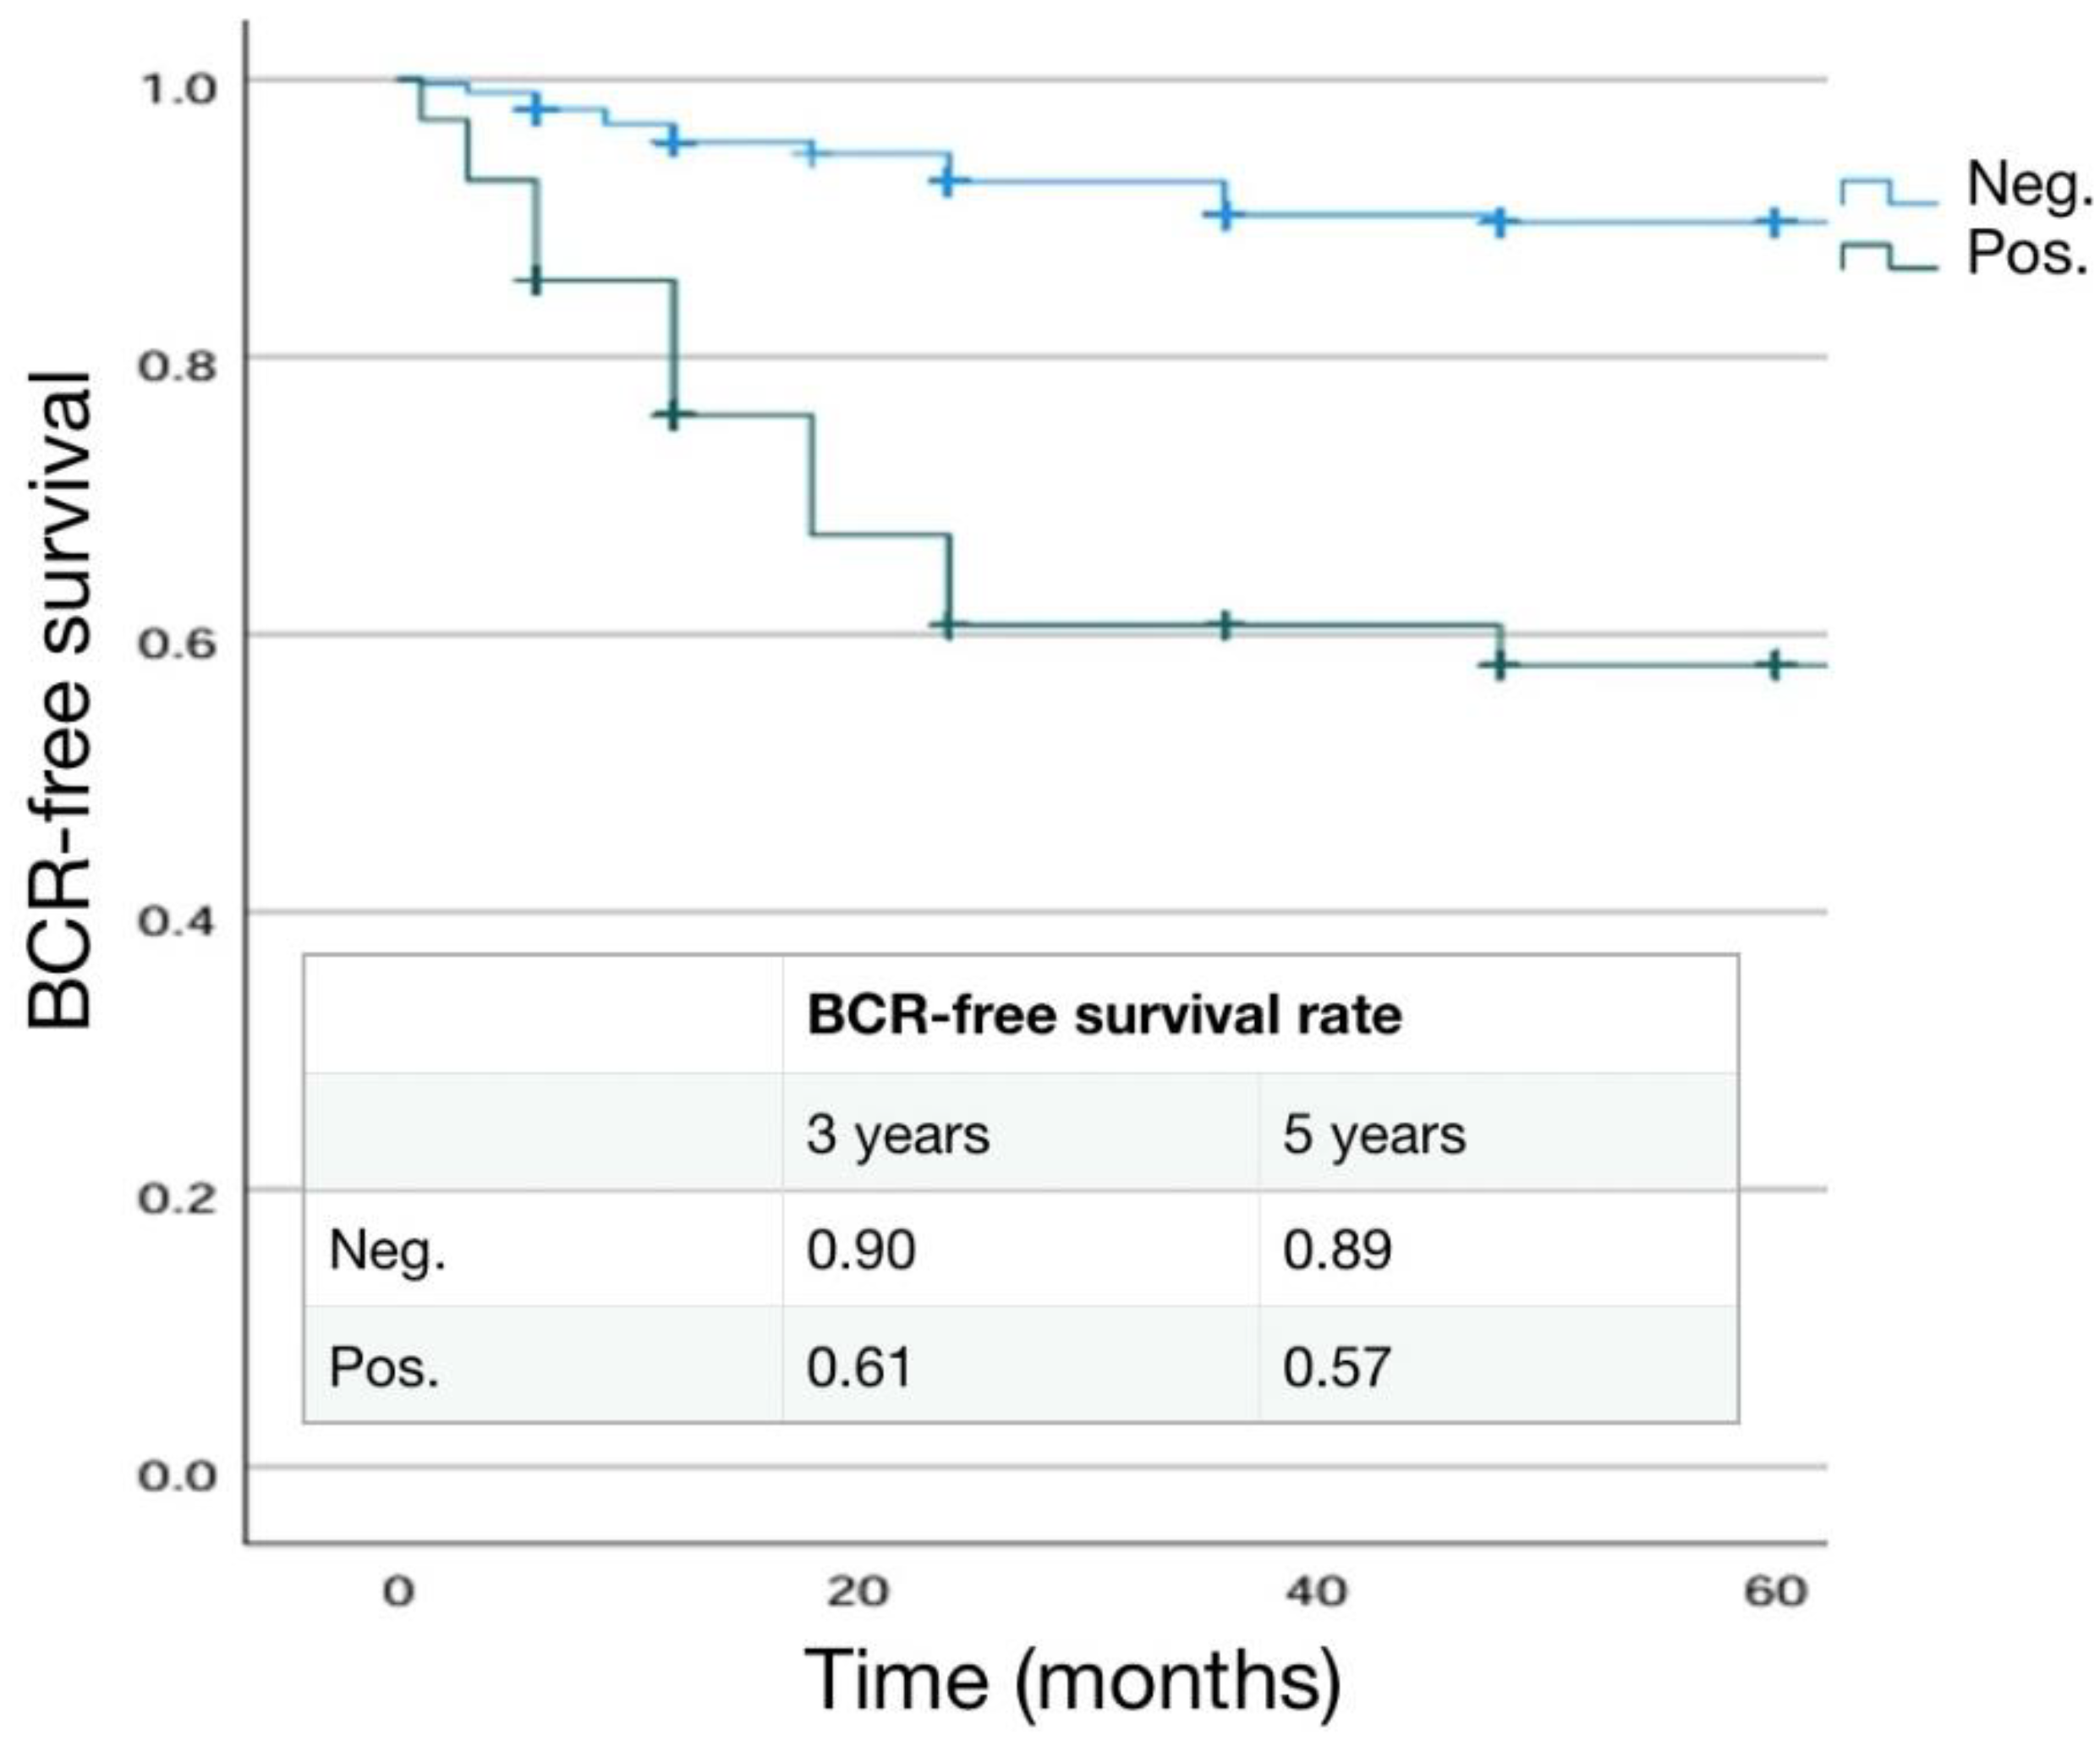
Figure 5.
Kaplan Maeier analysis. Estimated rates of Biochemical free-survival (BFS) according to the ISUP grading at surgery.
Figure 5.
Kaplan Maeier analysis. Estimated rates of Biochemical free-survival (BFS) according to the ISUP grading at surgery.
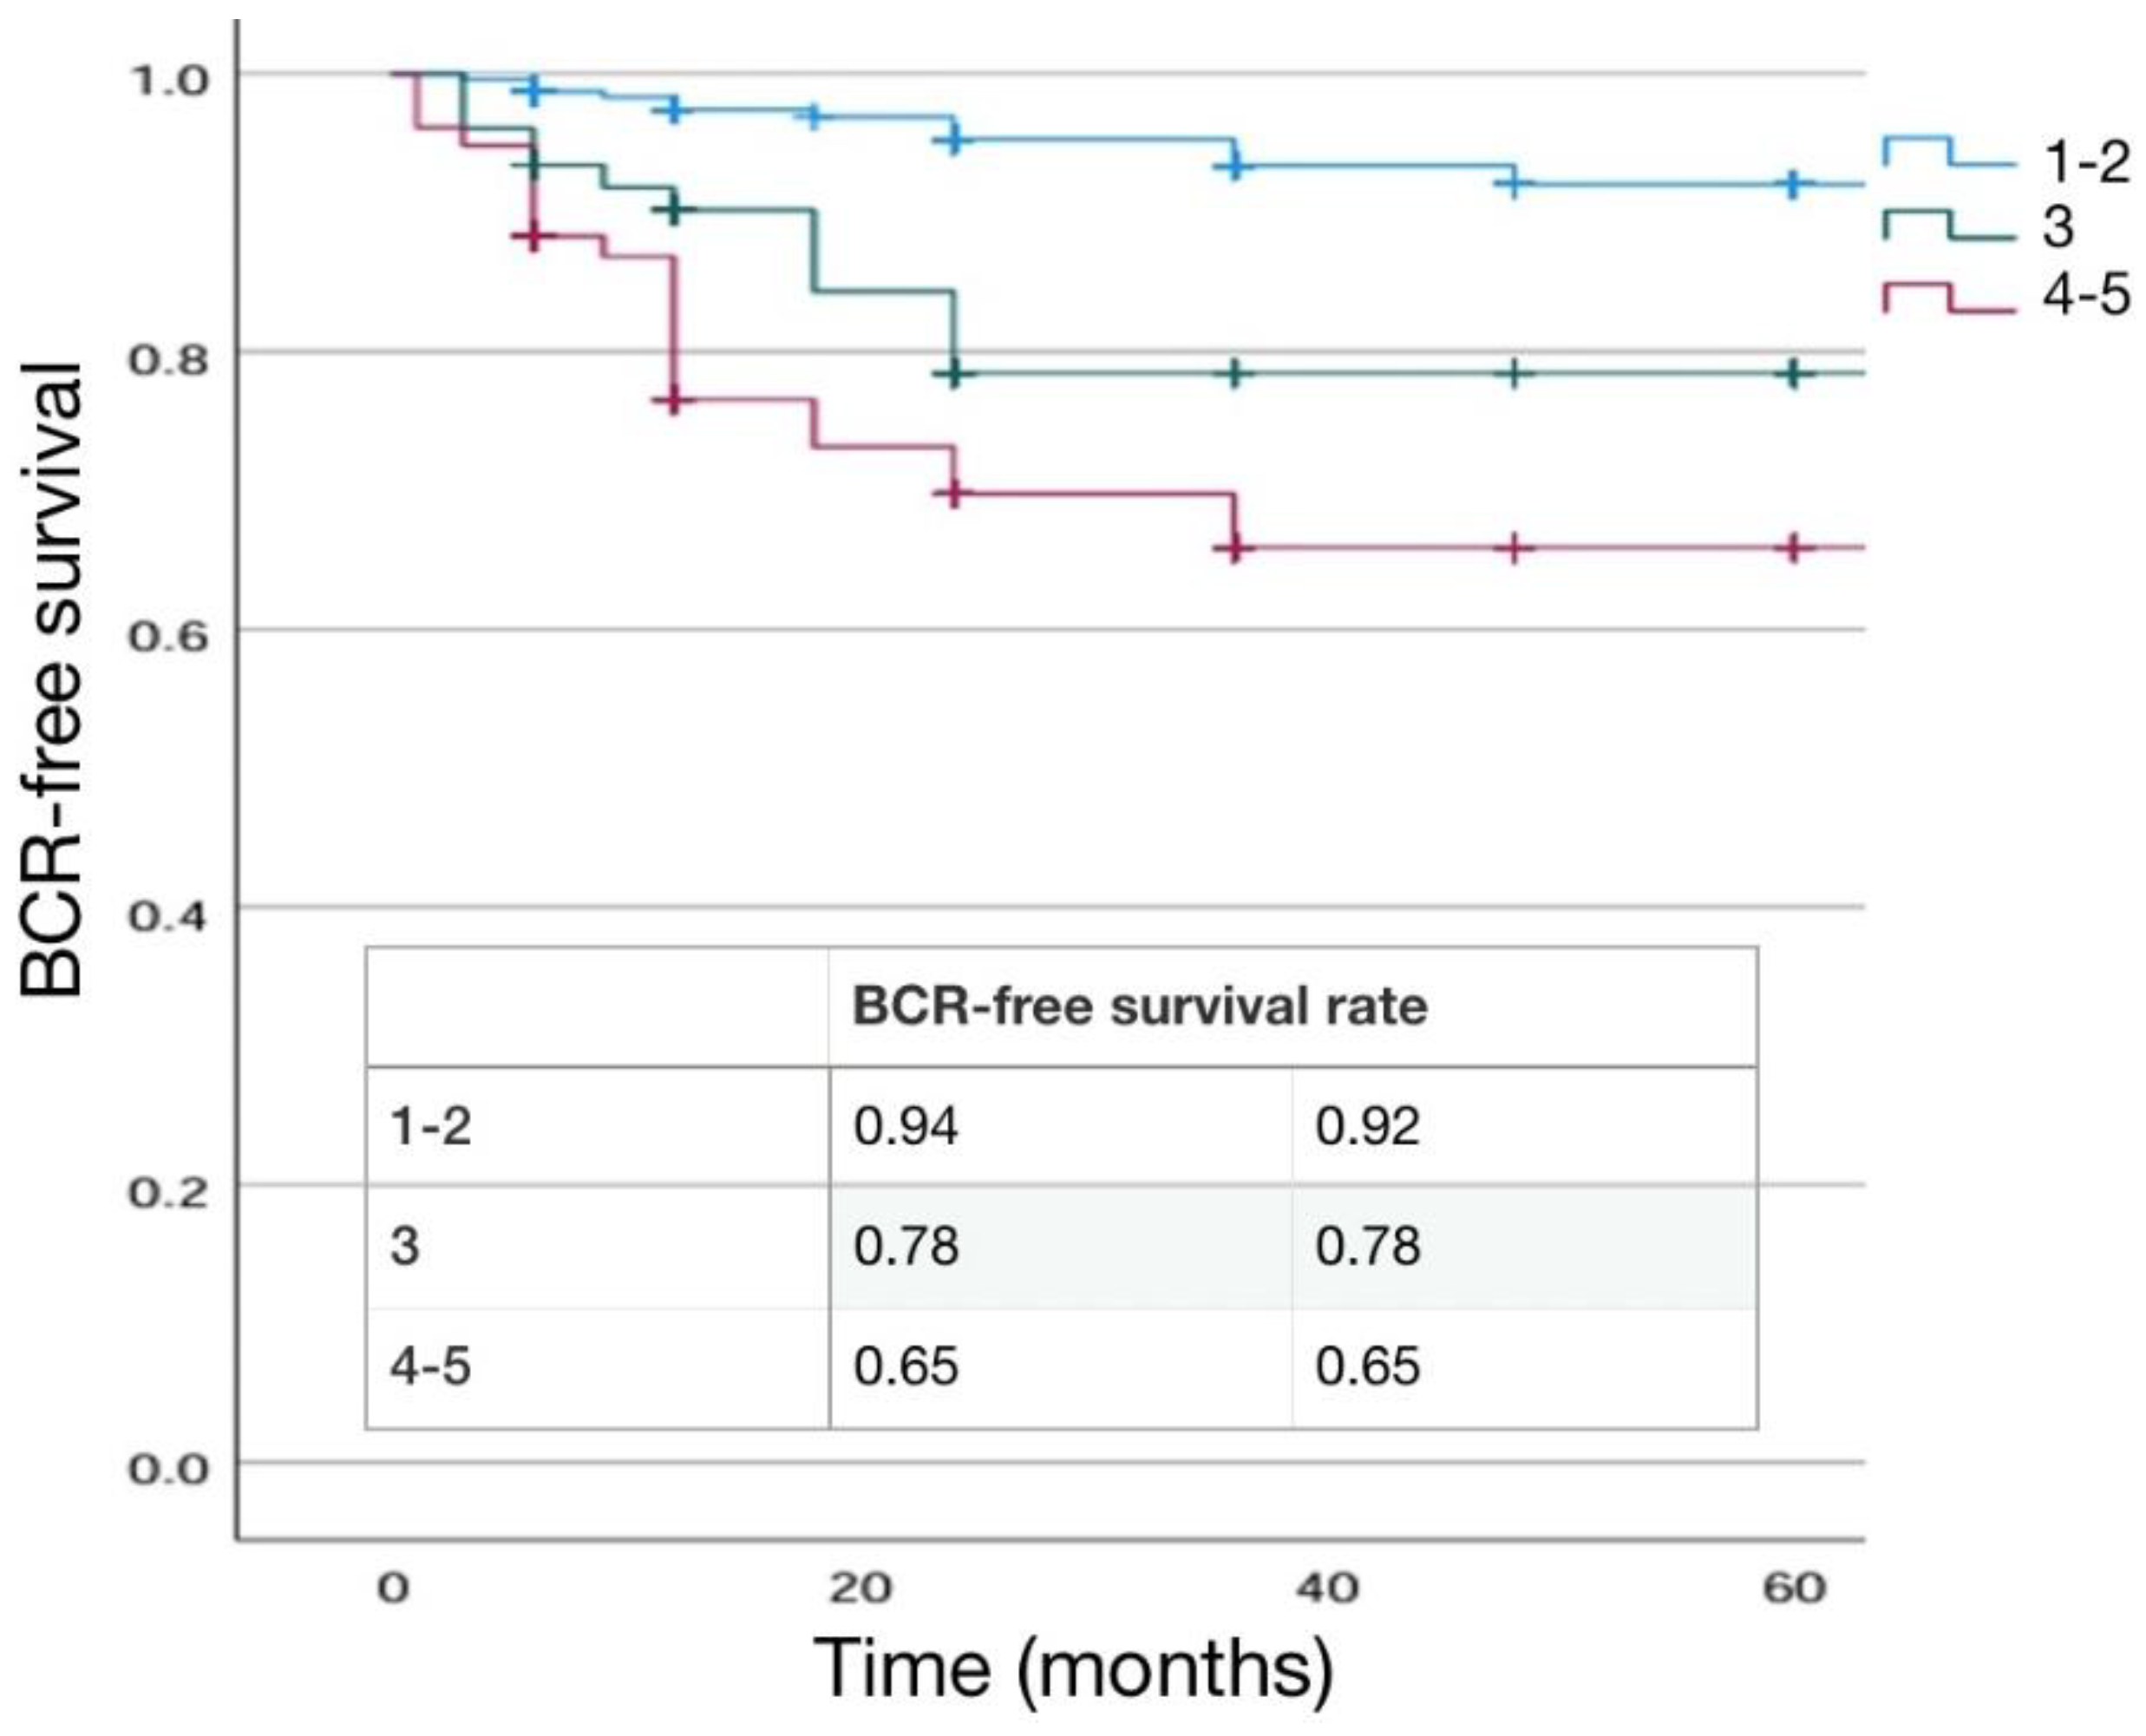
Table 1.
Characteristics of the whole population included in the study. Mean±SD, median, (range). Number of cases (%).
Table 1.
Characteristics of the whole population included in the study. Mean±SD, median, (range). Number of cases (%).
| Number cases | 444 |
| Age (years) | 67.49±6.53; 68: (47-73) |
| BMI | 26.05±3.55; 26.0: (18.0- 39.40) |
| Charlson Index | 3.86±1.06; 4: (0-7) |
| Familiarity Yes no |
35 (7.9%) 409(92.1%) |
| Digital Rectal Examination Normal Suspicious |
376 (84.7%) 68 (15.3%) |
| Preoperative total PSA (ng/ml) | 8.61±5.74; 7.30: (3.0-64.0) |
| PSAD | 0.22±0.186; 0.17: (0.1-0.59) |
| Prostate volume (cc) | 48.17±14.79; 45.0: (20.0-120.0) |
|
mMR PIRADS score PIRADS 2 PIRADS 3 PIRADS 4 PIRADS 5 |
(data available in 208 cases) 6 (2.9%) 44 (21.1%) 111 (53.4%) 47 (22.6%) |
| Prostate Tumor size (mm) at mMR | 12.8±6.53; 11.0: (4.0-39.0) |
| Preoperative CT and bone scan No yes |
374 (84.3%) 70 (15.7%) |
| Preoperative PET CT scan no choline PSMA |
434 (97.7%) 6 (1.3%) 4 (1.0%) |
|
Clinical T staging T1 T2a T2b T2c T3a T3b T4 |
12 (2.7%) 30 (6.7%) 192 (43.2%) 173 (39.0%) 30 (6.8%) 7 (1.6%) 0 |
|
Clinical N staging N0 N1 |
440 (99.1%) 4 (0.9%) |
| Number of suspected lymph node at imaging | 3.0±1,4; 3: (2-4) |
| Prostate biopsy type Random Target Target + random |
163(36.7%) 17 (3.8%) 264 (59.5%) |
| Prostate biopsy number of cores | 12.61±3.65;12 (4-27) |
|
Biopsy outcomes % positive samples PC % positive clinical significant PC Max% PC tissue per core |
41.31±26.13; 34: (2-100) 53.47±28.5; 50.0: (8.0-100.0) 58.35±24.7; 50.0: (6.0-100.0) |
| Prostate biopsy laterality + Monoliteral bilateral |
203 (45.7%) 241 (54.3%) |
|
ISUP grading at biopsy 1 2 3 4 5 |
149 (33.6%) 135 (30.4%) 86 (19.4%) 57 (12.8%) 17 (3.8%) |
|
Risk Class ( D’Amico) Low risk Intermediate risk High risk |
142 (32.0%) 200 (45.0%) 102 (23.0%) |
|
Nomograms results (% estimated risk for N+) in intermediate and high risk cases Briganti 2012 Briganti 2019 |
23.40±19.11; 17.5: (2-85) 17.58±31.4; 12.85: (2-95) |
|
Surgical technique at radical prostatectomy Laparoscopic Robotic assisted |
284 (64%) 160 (36%) |
| Operative time (minutes) | 160.05±33.73; 160: (90-300) |
|
Nerve sparing technique at surgery No Yes Monolateral Bilateral |
317 (71.4%) 127 (28.6%) 52 (40.9%) 75 (59.1%) |
|
Extended lymph node dissection no yes |
309 (69.6%) 135 (30.4%) |
|
Pathological stage (T) pT2 pT3a pT3b pT4 |
246 (55.4%) 150 (33.8%) 48 (10.8%) 0 |
|
Pathological stage (N) N0 N+ |
115 (85.2%) 20 (14.8%) |
|
Number Lymph nodes removed at surgery Total cases N+ cases N0 cases |
17.22±6.81; 18: (4-47) 17.95±9.38; 19: (6-47) 17.07±6.24; 18: (4-35) |
| Percentage positive lymph nodes in pN+ cases | 14.80 ±11.60; 10.4: (4.0-26.6) |
|
Site of positive lymphnodes (number of cases) Obturator right Obturator left External iliac right External iliac left Internal iliac right Internal iliac left |
10 (50.0%) 13 (65.0%) 4 (20.0%) 6 (30.0%) 7 (35.0%) 9 (45.0%) |
|
ISUP grading at surgery 1 2 3 4 5 |
92 (20.7%) 183 (41.2%) 89 (20.1%) 48 (10.8%) 32 (7.2%) |
|
Surgical margin at surgery (R) Negative positive |
367 (82.7%) 77 (17.3%) |
|
Positive surgical margin site apex lateral basal posterior multiple |
31 (40.2%) 23 (29.9%) 6 (7.8%) 12 (15.6%) 5 (6.5%) |
|
Positive surgical margin grading 3 4 5 |
55 (71.4%) 21 (27.3%) 1 (1.3%) |
| Positive surgical margin radial distance (mm) | 2.97±1.1; 3 (1-7) |
|
Positive surgical margin Single multiple |
72 (93.5%) 5 (6.5%) |
|
PNI at surgery positive negative |
269 (60.5%) 175 (39.5%) |
|
Cribriform/IDC at surgery positive negative |
20 (4.5%) 424 (95.5%) |
| Postoperative hospitalization (days) | 3.41±0.56;3 (3-7) |
| Catheterization time (days) | 10.27±2.0; 10: (6-16) |
| Postoperative anastomotic leakage no yes |
441 (99.3%) 3 (0.7%) |
| Postoperative blood transfusion no yes |
442 (99.5%) 2 (0.5%) |
| Postoperative lymphocele no yes |
436 (98.2%) 8 (1.8%) |
| Postoperative anastomotic stricture no yes |
432 (97.3%) 12 (2.7%) |
| Postoperative rectal injury no yes |
444 (100%) 0 (0%) |
| Postoperative total PSA (ng/ml)(at 1 month) | 0.09±0.17; 0.02: (0.01-2.0) |
| Postoperative follow-up (months) | 56.4±37.8; 48 (12-120) |
| Biochemical progression No Yes |
391 (88.1%) 53 (11.9%) |
| Time to biochemical progression (months) | 18.67±24.57;12 (1-48) |
| Adjuvant therapy no RT RT+ADT |
391 (88.1%) 37 (8.3%) 16 (3.6%) |
| IIEF-5 preoperative (patients submitted to nerve sparing) | 20.75±5.83; 23: (12-25) |
| Postoperative use of tadalafil No yes |
317 (71.4%) 127 (28.6%) |
| IIEF-5 postoperative (6 months) (patients submitted to nerve sparing) | 9.68±3.74; 9: (6-19) |
| IIEF-5 postoperative (12 months) (patients submitted to nerve sparing) | 10.41±24.10; 8: (5-21) |
| Penile prothesis no yes |
420 (94.6%) 24 (5.4%) |
| Postoperative Pelvic floor rehabilitation no yes |
355 (79.9%) 89 (20.1%) |
|
Postoperative PAD test 1 months (grams) 3 months (grams) 6 months (grams) 12 months (grams) |
99.37±33.0; 20.0: (0-404) 45.14±95.9; 4.0 (0-480) 34.86±70.5; 2.0 (0-420) 14.82±28.7; 0: (0-100) |
| No PADS postoperative status | 407 (91.6%) |
| Artificial Sphincter no yes |
432 (97.3%) 12 (2.7%) |
Table 2.
Distribution of preoperative and postoperative parameters on the basis of the surgical approach. Mean±SD, median, (range). Number of cases (%). (LRP= laparoscopic; RARP= robotic assisted).
Table 2.
Distribution of preoperative and postoperative parameters on the basis of the surgical approach. Mean±SD, median, (range). Number of cases (%). (LRP= laparoscopic; RARP= robotic assisted).
| LRP | RARP | P value | |
|---|---|---|---|
| Number cases | 284 | 160 | |
| Age (years) | 68.65±6.582; 69: (48-73) | 66.35±5.973; 66 (47-68) | <0.001 |
| BMI | 26.17±11.16; 25.6:(17-39.4) | 25.127±4.317; 25.0 (17-34) | 0.124 |
| Charlson Index | 3.34±1.42; 4 (2-7) | 4.10±0.722; 4 (0-7) | <0.001 |
| Familiarity Yes no |
25 (8.8%) 259 (91.2%) |
10 (6.2%) 150 (93.8%) |
0.217 |
| Digital Rectal Examination Normal Suspicious |
245 (86.3%) 39 (13.7%) |
131 (81.9%) 29 (18.1%) |
0.327 |
| Preoperative total PSA (ng/ml) | 8.79±6.175; 7.5: (3.0-64.0) | 8.23±4.89; 6.9 (3.0-30.0) | 0.328 |
| PSAD | 0.16±0.10; 0.14: (0.04-0.59) | 0.22±0.18; 0.17 (0.07-0.59) | 0.546 |
| Prostate volume (cc) | 49.67±16.07; 49.5: (22-120) | 47.56±14.39; 45 (20-120) | 0.409 |
|
mMR PIRADS score (data available in 208 cases) PIRADS 2 PIRADS 3 PIRADS 4 PIRADS 5 |
3 (4.3%) 21 (30.0%) 33 (47.1%) 13 (18.6%) |
3 (2.2%) 23 (16.7%) 78 (56.5%) 34 (24.6%) |
0.042 |
| Prostate Tumor size (mm) at mMR | 10.76±5.11; 10.0: (6-39) | 13.59±6.94;12.0 (4-38) | 0.10 |
| Preoperative CT and bone scan No yes |
245 (86.3%) 39 (13.7%) |
129(80.6%) 31 (19.4%) |
0.251 |
| Preoperative PET CT scan no choline PSMA |
283 (99.6%) 1 (0.4%) 0 |
151 (94.3%) 5 (3.2%) 4 (2.5%) |
0.117 |
|
Clinical T staging T1 T2a T2b T2c T3a T3b |
9 (3.2) 19 (6.7%) 110 (38.7%) 131 (46.1%) 12 (4.2%) 3 (1.1%) |
3 (1.9%) 11 (6.9%) 82 (51.2%) 42 (26.2%) 18 (11.3%) 4 (2.5%) |
<0.001 |
|
Clinical N staging N0 N1 |
282 (99.3%) 2 (0.7%) |
158 (98.7%) 2 (1.3%) |
0.545 |
| Number of suspected lymph node at imaging | 4±1.4; 4: (3-4) | 2±1.35; 2 (1-3) | 0.64 |
|
Biopsy outcomes % positive samples PC |
40.6±26.26; 29: (8-100) |
41.60±26.09;35 (4-57) |
0.772 |
| Prostate biopsy laterality + Monoliteral bilateral |
102 (35.9%) 182 (64.1%) |
101 (63.1%) 59 (36.9%) |
<0.001 |
|
ISUP grading at biopsy 1 2 3 4 5 |
98 (34.5%) 74 (26.1%) 58 (20.4%) 42 (14.8%) 12 (4.2%) |
51 (31.9%) 61 (38.1%) 28 (17.5%) 15 (9.4%) 5 (3.1%) |
0.610 |
|
Risk Class ( D’Amico) Low risk Intermediate risk High risk |
92 (32.4%) 126 (44.3%) 66 (23.3%) |
50 (31.3%) 74 (46.2%) 36 (22.5%) |
0.849 |
| Operative time (minutes) | 173.33±44.34; 160 (90-300) | 153.21±25.11; 142.5 (90-300) | <0.001 |
|
Nerve sparing technique at surgery No Yes Monolateral Bilateral |
223 (78.5%) 61 (21.5%) 27 (43.3%) 34 (56.7%) |
94 (58.7%) 66 (41.3%) 25 (31.7%) 41 (68.3%) |
<0.001 0.187 |
|
Extended lymph node dissection no yes |
146 (73.2%) 76 (26.8%) |
74 (63.1%) 59 (36.9%) |
0.160 |
|
Pathological stage (T) pT2 pT3a pT3b pT4 |
157 (55.3%) 91 (32.0%) 36 (12.7%) 0 |
89 (55.6%) 59 (36.9%) 12 (7.5%) 0 |
0.910 |
|
Pathological stage (N) N0 N+ |
64(84.2%) 12(15.8%) |
51 (86.4%) 8 (13.6%) |
0.430 |
|
Number Lymph nodes removed at surgery Total cases N+ cases N0 cases |
15.16±7.83; 15: (4-47) 17.45±11.8; 15 (6-47) 14.7±6.8; 14 (4-35) |
19.83±4.78; 20 (6-34) 19.6±7.1; 20 (6-34) 19.8±4.1; 20 (11-31) |
<0.001 |
|
ISUP grading at surgery 1 2 3 4 5 |
73 (25.7%) 98 (34.5%) 54 (19.0%) 37 (13.0%) 22 (7.8%) |
19 (11.9%) 85 (53.1%) 35 (21.9%) 11 (6.9%) 10 (6.2%) |
<0.001 |
|
Surgical margin at surgery (R) Negative positive |
239 (84.1%) 45 (15.9%) |
128 (80.0%) 32 (20.0%) |
0.145 |
|
Positive surgical margin site apex lateral basal posterior multiple |
22 (48.9%) 11 (24.4%) 2 (4.4%) 7 (15.6%) 3 (6.7%) |
9 (28.1%) 12 (37.5%) 4 (12.5%) 5 (15.6%) 2 (6.3%) |
0.037 |
|
Positive surgical margin grading 3 4 5 |
34 (75.6%) 11 (24.4%) 0 (0%) |
21 (65.6%) 10 (31.3%) 1 (3.1%) |
0.225 |
| Positive surgical margin radial distance (mm) | 3.45±0.84; 3 (2-6) | 2.63±1.14; 2.5 (1-7) | 0.008 |
|
Positive surgical margin Single multiple |
42 (93.3%) 3 (6.7%) |
30 (93.7%) 2 (6.3%) |
0.762 |
|
PNI at surgery positive negative |
179 (62.6%) 105 (37.4%) |
90 (56.2%) 70 (43.8%) |
0.10 |
|
Cribriform/IDC at surgery positive negative |
7 (2.5%) 277 (97.5%) |
13 (8.1%) 147 (91.9%) |
0.01 |
| Postoperative hospitalization (days) | 3.75±0.74;3 (3-7) | 3.11±0.36;3 (3-5) | 0.057 |
| Catheterization time (days) | 11.53±1.45; 12 (8-14) | 9.60±2.06; 10 (6-16) | <0.001 |
|
Postoperative anastomotic leakage no yes |
284 (100%) 0 (0%) |
157 (98.1%) 3 (1.9%) |
0.245 |
|
Postoperative blood transfusion no yes |
284 (100%) 0(0%) |
158 (98.7%) 2 (1.3%) |
0.294 |
|
Postoperative lymphocele no yes |
278 (97.9%) 6 (2.1%) |
158 (98.7%) 2 (1.3%) |
0.16 |
|
Postoperative anastomotic stricture no yes |
272 (95.8%) 12 (4.2%) |
160 (100%) 0 (0%) |
0.51 |
|
Postoperative rectal injury no yes |
284 (100%) 0 |
160 (100%) 0 |
-- |
| Postoperative total PSA (ng/ml)(at 1 month) | 0.06±0.2; 0.02: (0.01-2.0) | 0.04±0.92; 0.02 (0.01-1.0) | 0.047 |
| Postoperative follow-up ( years) | 64.4±28.8; 62 (24-120) | 49.2±36.0; 48 (12-120) | 0.385 |
| Biochemical progression No Yes |
243 (85.6%) 41 (14.4%) |
148 (92.5%) 12 (7.5%) |
0.014 |
| Time to biochemical progression (months) | 21.77±26.49; 12 (1-120) | 18.58±13.2; 13 (1-36) | 0.105 |
| Adjuvant therapy no yes |
247 (87.0%) 37 (13.0%) |
143 (90.0%) 16 (10.0%) |
0.55 |
| Adjuvant therapy type -RT -RT + ADT |
27 (73.0%) 10 (27.0%) |
10 (62.5%) 6 (37.5%) |
0.358 |
| IIEF-5 postoperative (6 months) (patients submitted to nerve sparing) | 9.60±3.78; 9 (6-19) | 10.25±3.94; 9.5 (7-15) | 0.750 |
| IIEF-5 postoperative (12 months) (patients submitted to nerve sparing) | 10.14±4.77; 10 (5-21) | 18.0±3.75; 18 (8-18) | 0.117 |
| Postoperative Pelvic floor rehabilitation no yes |
230 (81.0%) 54 (19.0%) |
125 (78.2%) 35 (21.8%) |
0.106 |
|
Postoperative PAD test 1 months (grams) 3 months (grams) 6 months (grams) 12 months (grams) |
163.84±222.0; 50 (0-400) 75.57±122.20; 20 (0-480) 39.47±76.08; 5 (0-420) 14.76±29.41; 0 (0-100) |
68.17± 374.17; 11 (0-404) 14.02±42.09;0 (0-250) 13.62±28.60; 0 (0-80) 15.33±23.2; 1 (0-50) |
0.680 <0.001 0.023 0.964 |
Table 4.
Distribution of preoperative and postoperative parameters on the basis of risk classes. Mean±SD, median, (range). Number of cases (%).
Table 4.
Distribution of preoperative and postoperative parameters on the basis of risk classes. Mean±SD, median, (range). Number of cases (%).
| Low risk | Intermediate Risk | High risk | P value | |
|---|---|---|---|---|
| Number cases | 142 | 200 | 102 | |
| Age (years) | 67.73±6.60; 67: (50-73) | 67.42±6.61; 68 (49-22) | 67.46±6.12; 69 (47-71) | 0.906 |
| BMI | 25.73±3.70; 25.3 (18-37) | 25.84±3.35; 25.4 (18.5- 37) | 26.81±3.63; 26 (21-39.4) | 0.121 |
| Charlson Index | 3.82±1.02; 4 (2-7) | 3.89±1.08; 4 (0-7) | 3.88±1.06; 4 (1-6) | 0.903 |
| Familiarity Yes no |
0 142 (100%) |
19 (9.5%) 181 (90.5%) |
17 (16.7%) 85 (83.3%) |
0.138 |
| Digital Rectal Examination Normal Suspicious |
134 (94.4%) 8 (5.6%) |
176 (88.0%) 24 (12.0%) |
66 (64.7%) 36 (35.3%) |
<0.001 |
| Preoperative total PSA (ng/ml) | 6.73±3.12;6.4 (3.0-19.0) | 8.41±3.91;7.5 (3.0-23.0) | 11.74±9.3;9.3 (3.0-64.0) | <0.001 |
| PSAD | 0.14±0.49;0.13 (0.08-0.26) | 0.23±0.17;0.19 (0.06-0.54) | 0.3±0.3;0.24 (0.11-0.59) | 0.048 |
| Prostate volume (cc) | 47.78±15.48;45 (25-120) | 47.4±13.72;45 (20-87) | 51.53±16.77; 52.5 (25-90) | 0.403 |
|
mMR PIRADS score (data available on 208 cases) PIRADS 2 PIRADS 3 PIRADS 4 PIRADS 5 |
6 (10.7%) 14 (25.0%) 32 (57.1%) 4 (7.2%) |
0 (0%) 26 (26.2%) 58 (58.6%) 15 (15.2%) |
0 (0%) 4 (7.7%) 20 (38.5%) 28 (53.8%) |
<0.001 |
| Prostate Tumor size (mm) at mMR | 10.15±4.78; 9.5 (4.0-30.0) | 11.83±4.66; 10 (5.0-27.0) | 18.25±8.72; 16 (7.0-39.0) | <0.001 |
| Preoperative CT and bone scan No yes |
133 (93.7%) 9 (6.3%) |
88 (87.5%) 25 (12.5) |
66 (64.8%) 36 (35.2%) |
<0.001 |
| Preoperative PET CT scan no choline PSMA |
142 (100%) 0 0 |
195 (97.5%) 4 (2.0%) 1 (0.5%) |
97 (95.1%) 2 (2.0%) 3 (2.9%) |
0.027 |
|
Surgical technique at radical prostatectomy Laparoscopic Robotic assisted |
92 (64.8%) 50 (35.2%) |
126 (63.0%) 74 (37.0%) |
66 (64.7%) 36 (35.3%) |
0.850 |
| Operative time (minutes) | 150.50±27.35;140 (120-300) | 155.0±20.06;157.5 (90-210) | 183.51±50.711; 175 (90-300) | <0.001 |
|
Nerve sparing technique at surgery No Yes Monolateral Bilateral |
73 (51.4%) 69 (48.6%) 19 (27.5%) 50 (72.5%) |
145 (72.5%) 55 (27.5%) 31 (56.4%) 24 (43.6%) |
99 (97.0%) 3 (3.0%) 2 (66.7%) 1 (33.3%) |
<0.001 <0.001 |
|
Extended lymph node dissection no yes |
142 (100%) 0 (0%) |
167 (83.5%) 33(16.5%) |
0 (0%) 102(100%) |
<0.001 |
|
Pathological stage (T) pT2 pT3a pT3b |
110 (77.5%) 28 (19.7%) 4 (2.8%) |
108 (53.0%) 80 (39.9%) 12 (7.1%) |
28 (27.4%) 42 (41.2%) 32 (31.4%) |
<0.001 |
|
Pathological stage (N) N0 N+ |
-- |
26 (73.1%) 7 (26.9%) |
89 (87.2%) 13 (12.8%) |
<0.001 |
|
ISUP grading at surgery 1 2 3 4 5 |
75 (52.8%) 57 (40.2%) 9 (6.3%) 1 (0.7%) 0 (0%) |
14 (7.0%) 109 (54.5%) 58 (29.0%) 12 (6.0%) 7 (3.5%) |
3 (2.9%) 17 (16.7%) 22 (21.6%) 35 (34.5%) 25 (24.5%) |
<0.001 |
|
Surgical margin at surgery (R) Negative positive |
129 (90.8%) 13 (9.2%) |
162(80.8%) 38 (19.2%) |
76 (74.5%) 26 (25.5%) |
0.003 |
|
Positive surgical margin grading 3 4 5 |
13 (100%) 0 (0%) 0 (0%) |
33 (86.8%) 5 (13.2%) 0 (0%) |
9 (34.6%) 16 (61.5%) 1 (3.9%) |
<0.001 |
| Positive surgical margin radial distance (mm) | 2.86±0.945; 3 (2-4) | 2.65±0.89; 2.5 (2-6) | 3.34±1.25; 3 (1-7) | 0.104 |
| Postoperative total PSA (ng/ml)(at 1 month) | 0.03±0.08; 0.02 (0.01-1.0) | 0.04±0.093; 0.02 (0.01-1.0) | 0.12±0.3; 0.03 (0.01-2.0) | <0.001 |
| Biochemical progression -No -Yes |
136 (95.8%) 6 (4.2%) |
183 (91.5%) 17 (8.5%) |
72 (70.6%) 30 (29.4%) |
<0.001 |
| Time to biochemical progression (months) | 19.0±15.83; 15 (6-48) | 23.88±28.22; 18 (1-120) | 15.72±24.12; 6 (1-4120 | 0.576 |
| Adjuvant therapy no yes |
139 (97.9%) 3 (2.1%) |
186 (93.0%) 14 (7.0%) |
66 (64.7%) 36 (35.3%) |
<0.001 |
| Adjuvant therapy type -RT -RT + ADT |
3 (100%) 0 |
13 (92.9%) 1 (7.1%) |
21 (58.3%) 15 (41.7%) |
0.290 |
Table 5.
Distribution of preoperative and postoperative parameters on the basis of pT. Mean±SD, median, (range). Number of cases (%).
Table 5.
Distribution of preoperative and postoperative parameters on the basis of pT. Mean±SD, median, (range). Number of cases (%).
| pT2 | pT3a | pT3b | P value | |
|---|---|---|---|---|
| Number cases | 246 | 150 | 48 | |
| Age (years) | 66.76±6.45; 67 (48-71) | 68.25±6.587; 68 (47-72) | 68.79±6.75; 68 (54-73) | 0.032 |
| BMI | 25.71±3.56; 25.3 7-37.2) | 26.25±3.41; 25.7 (19-39.4) | 27.21±3.8; 26.1 (19-37) | 0.077 |
| Charlson Index | 3.77±1.08; 4 (0-7) | 4.05±1.01; 4 (0-7) | 3.8±1.05; 4 (1-6) | 0.179 |
| Familiarity Yes no |
14 (5.7%) 232 (94.3%) |
15 (10%) 135 (90%) |
6 (12.5%) 42 (87.5%) |
0.211 |
| Digital Rectal Examination Normal Suspicious |
226 (91.9%) 20 (8.1%) |
118 (78.7%) 32 (21.3%) |
52 (66.7%) 16 (33.3%) |
<0.001 |
| Preoperative total PSA (ng/ml) | 7.64±4.52;6.85 (3.0-48.0) | 8.59±4.77;7.5 (3.0-33.0) | 13.55±10.14: 11.2 (4.0-64.0) | <0.001 |
| PSAD | 0.19±0.15;0.15 (0.1-0.50) | 0.22±0.15;0.18 (0.1-0.59) | 0.35±0.36; 0.23 (0.1-0.50) | 0.112 |
| Prostate volume (cc) | 48.0±4.53; 45 (20-120) | 49.08±14.4;47 (24-90) | 43.91±15.87;40 (25-75) | 0.56 |
|
mMR PIRADS score PIRADS 2 PIRADS 3 PIRADS 4 PIRADS 5 |
6 (5.2%) 31 (26.9%) 61 (53.1%) 17 (14.8%) |
11 (15.1%) 41 (56.2%) 21 (28.7%) |
2 (10.0%) 9 (45.0%) 9 (45.0%) |
0.01 |
| Prostate Tumor size (mm) at mMR | 10.9±4.78; 10 (4-30) | 14.10±5.98; 12 (5-35) | 20.53±11.33; 18 (8-39) | <0.001 |
|
Clinical T staging T1 T2a T2b T2c T3a T3b |
8 (3.2%) 29 (11.8%) 106 (43.1%) 96 (39.0%) 7 (2.9%) 0 |
4 (2.7%) 1 (0.6%) 76 (50.7%) 51 (34.0%) 18 (12.0%) 0 |
0 0 10 (20.8%) 26 (54.2%) 5 (10.4%) 7 (14.6%) |
<0.001 |
|
Biopsy outcomes % positive samples PC |
33.15±21.7.25 (5-100) |
48.11±26.58; 44 (2-100) |
59.66±29.42; 52.5 (10-100) |
<0.01 |
|
ISUP grading at biopsy 1 2 3 4 5 |
113 (45.9%) 77 (31.4%) 34 (13.8%) 20 (8.1%) 2 (0.8%) |
31 (20.7%) 50 (33.3%) 37 (24.7%) 24 (16%) 8 (5.3%) |
5 (10.4%) 8 (16.7%) 15 (31.3%) 13 (27.0%) 7 (14.6%) |
<0.001 |
|
Surgical technique at radical prostatectomy Laparoscopic Robotic assisted |
157 (63.8%) 89 (36.2%) |
91 (60.7%) 59 (39.3%) |
36 (75.0%) 12 (25.0%) |
0.193 |
| Operative time (minutes) | 159.02±35.57;160 (90-300) | 160.42±33.21; 160 (90-300) | 165.28±26.53; 177.5 (100-200) | 0.764 |
|
Pathological stage (N) N0 N+ |
11 (100%) 0 (0%) |
68 (88.9%) 8 (11.1%) |
36 (75.0%) 12 (25.0%) |
<0.01 |
|
ISUP grading at surgery 1 2 3 4 5 |
85 (34.6%) 114 (46.3%) 32 (13.0%) 13 (5.3%) 2 (0.8%) |
7 (4.7%) 65 (43.3%) 39 (26.0%) 27 (18.0%) 12 (8.0%) |
0 4 (8.3%) 18 (37.5%) 8 (16.7%) 18 (37.5%) |
<0.001 |
|
Surgical margin at surgery (R) Negative positive |
218 (88.6%) 28 (11.4%) |
119 (79.2%) 31 (20.8%) |
30 (62.5%) 18 (37.5%) |
<0.001 |
|
Positive surgical margin grading 3 4 5 |
24 (85.7%) 4 (14.3%) 0 (0%) |
25 (80.6%) 5 (16.2%) 1 (3.2%) |
6 (33.3%) 12 (66.7%) 0 (0%) |
0.001 |
| Positive surgical margin radial distance (mm) | 2.72±0.966; 3 (1-4) | 2.67±0.84; 3 (2-5) | 3.71±1.28; 3.5 (2-7) | 0.01 |
|
PNI at surgery positive negative |
103 (41.9%) 143 (58.1%) |
123 (82.0%) 27 (18.0%) |
43 (89.6%) 5 (10.4%) |
<0.001 |
|
Cribriform/IDC at surgery positive negative |
2 (0.8%) 244 (99.2%) |
10 (6.7%) 140 (93.3%) |
8 (16.7%) 40 (83.3%) |
0.001 |
| Postoperative total PSA (ng/ml)(at 1 month) | 0.03±0.31;0.02 (0.01-0.1) | 0.05±0.143; 0.02 (0.01-1.0) | 0.21±0.419; 0.04 (0.01-2.0) | <0.001 |
| Biochemical progression (number of cases and %) -No -Yes |
234 (95.1%) 12 (4.9%) |
127 (84.7%) 23 (13.3%) |
30 (62.5%) 18 (37.5%) |
<0.001 |
| Time to biochemical progression (months) | 34.25±42.26; 15 (3-120) | 16.1±11.38; 12 (1-36) | 11.28±15.18; 2 (1-48) | 0.032 |
| Adjuvant therapy no yes |
242(98.4%) 4 (1.6%) |
133 (88.7%) 17 (11.3%) |
16 (33.3%) 32 (62.7%) |
<0.001 |
| Adjuvant therapy type -RT -RT + ADT |
4 (100%) 0 |
14 (82.4%) 3 (17.6%) |
19 (59.5%) 13 (40.6%) |
0.033 |
Table 6.
Distribution of preoperative and postoperative parameters on the basis of pN status. Mean±SD, median, (range). Number of cases (%).
Table 6.
Distribution of preoperative and postoperative parameters on the basis of pN status. Mean±SD, median, (range). Number of cases (%).
| pN0 | pN1 | P value | |
| Number cases | 115 | 20 | |
| Age (years) | 66.16±6; 67 (47-72) | 67.37±6.66;68 (56-71) | 0.40 |
| BMI | 26.1±3.3; 25.1 (19-39.4) | 27.01±3.86;26.65 (19.32.8) | 0.41 |
| Charlson Index | 3.75±1.14; 4 (0-7) | 4±0.6; 4 (3-5) | 0.454 |
| Familiarity Yes no |
3 (1.5%) 201 (98.5%) |
10 (50.0%) 10 (50.0%) |
0.145 |
| Digital Rectal Examination Normal Suspicious |
156 (76.5%) 48 (23.5%) |
9 (45.0%) 11 (55.0%) |
<0.001 |
| Preoperative total PSA (ng/ml) | 8.72±5.29; 7.5 (3.0-48.0) | 16.54±8.83;16 (5.0-30.0) | <0.001 |
| PSAD | 0.22±0.175; 16 (0.1-0.6) | 0.51±0.441;0.33 (0.1-0.7) | 0.012 |
| Prostate volume (cc) | 48.38±15.21; 47 (20-120) | 53.11±21.86;50 (25-90) | 0.386 |
| Prostate Tumor size (mm) at mMR | 11.94±4.77; 10 (5-28) | 27.7±10.47;30 (11-39) | <0.001 |
|
Clinical T staging T1 T2a T2b T2c T3a T3b |
4 (3.5%) 12 (10.4%) 45 (39.1%) 29 (25.2%) 21 (18.3%) 4 (3.5%) |
0 0 3 (15.0%) 8 (40.0%) 6 (30.0%) 3 (15.0%) |
<0.001 |
|
Clinical N staging N0 N1 |
114 (99.1%) 1 (0.9%) |
17 (85.0%) 3 (15.5%) |
<0.001 |
| Number of suspected lymph node at imaging | 2±1; 2 (1-3) | 4±1; 4 (3-4) | 0.21 |
| Nomograms results ( % risk for N+) Briganti 2012 Briganti 2019 |
24.5±17.12; 17: (2-82) 23.4±16.45; 16: (2-82) |
26.4±15.46; 20: (7-85) 26.9±21.36; 21: (4-78) |
0.175 0.143 |
|
Biopsy outcomes % positive samples PC |
38.78±24.76; 30 (2-100) |
72.54±24.7;75 (35-100) |
0.001 |
|
ISUP grading at biopsy 1 2 3 4 5 |
7 (6.1%) 10 (8.7%) 42 (36.5%) 43 (37.4%) 13 (11.3%) |
1 (5.0%) 5 (25.0%) 6 (30.0%) 6 (30.0%) 2 (10.0%) |
0.304 |
|
Surgical technique at radical prostatectomy Laparoscopic Robotic assisted |
64 (55.6%) 51 (44.4%) |
12 (60.0%) 8 (40.0%) |
0.62 |
| Operative time (minutes) | 166.01±34.74; 160 (90-300) | 170±26.06;175 (135-220) | 0.68 |
|
Pathological stage (T) pT2 pT3a pT3b |
11 (9.6%) 68 (59.1%) 36 (31.3%) |
0 8 (40.0%) 12 (60.0%) |
<0.001 |
|
Number Lymph nodes removed at surgery Total cases |
17.07±6.24; 18 (2-35) |
17.95±9.38; 18.5 (6-47) |
0.60 |
|
Site of positive lymphnodes Obturator External iliac Internal iliac |
--- |
20 (100%) 8 (40.0%) 9 (45.0%) |
-- |
|
ISUP grading at surgery 1 2 3 4 5 |
1 (0.9%) 14 (12.2%) 44 (38.2%) 36 (38.3%) 20 (17.4%) |
0 2 (10.0%) 8 (40.0%) 2 (10.0%) 8 (40.0%) |
0.001 |
|
Surgical margin at surgery (R) Negative positive |
83 (72.1%) 32 (27.9%) |
11 (55.0%) 9 (45.0%) |
0.001 |
|
Positive surgical margin grading 3 4 5 |
19 (59.4%) 12 (37.5%) 1 (3.1%) |
4 (44.4%) 5 (55.6%) 0 (0%) |
0.384 |
| Positive surgical margin radial distance (mm) | 3.03±1; 3 (1-7) | 3.79±1.72; 3 (1-7) | 0.136 |
|
PNI at surgery positive negative |
70 (60.9%) 45 (39.1%) |
4 (15.8%) 16 (84.2%) |
0.02 |
|
Cribriform negative positive |
105 (91.3%) 10 (8.7%) |
14 (73.7%) 6 (26.3%) |
<0.001 |
| Postoperative total PSA (ng/ml)(at 1 month) | 0.05±0.19; 0.02 (0.01-2.0) | 0.28±0.376;0.09 (0.01-1.0) | <0.001 |
| Biochemical progression -No -Yes |
94 (81.7%) 21 (18.3%) |
9 (45.0%) 11 (55.0%) |
<0.001 |
| Time to biochemical progression (months) | 28.3±34.6; 12 (1-120) | 4.18±7.37; 3 (1-24) | 0.030 |
| Adjuvant therapy no yes |
85 (73.9%) 30 (26.1%) |
6 (30.0%) 14 (70.0%) |
<0.001 |
| Adjuvant therapy type -RT -RT + ADT |
24 (80.0%) 6 (20.0%) |
4 (28.6%) 10 (71.4%) |
<0.001 |
Table 7.
Distribution of preoperative and postoperative parameters on the basis of Surgical margins (SM). Mean±SD, median, (range). Number of cases (%).
Table 7.
Distribution of preoperative and postoperative parameters on the basis of Surgical margins (SM). Mean±SD, median, (range). Number of cases (%).
| Negative SM | Positive SM | P value | |
|---|---|---|---|
| Number cases | 367 | 77 | |
| Age (years) | 67.44±6.62; 68 (47-73) | 67.78±6.14; 69 (52-72) | 0.68 |
| BMI | 25.88±3.44; 25,4 (18.0-39.4) | 26.89±4.04; 26.2 (19-37) | 0.83 |
| Charlson Index | 3.81±1; 4 (0-7) | 4.14±0.93; 4 (1-6) | 0.7 |
| Familiarity Yes no |
23 (6.3%) 344 (93.7%) |
12 (15.6%) 65 (84.4%) |
0.96 |
| Digital Rectal Examination Normal Suspicious |
315 (85.8%) 52 (14.2%) |
61 (79.2%) 16 (20.8%) |
0.01 |
| Preoperative total PSA (ng/ml) | 8.0±1.07; 4 (3.0-7.0) | 11.54±8.8;9.6 (3.0-64.0) | <0.001 |
| PSAD | 0.21±0.14; 0.17 (0.1-0.50) | 0.28±0.318;0.18 (0.2-0.59) | 0.253 |
| Prostate volume (cc) | 47.78±14.65; 445 (20-120) | 49.97±15.77;46.5 (25-90) | 0.452 |
| Prostate Tumor size (mm) at mMR | 11.98±5.66; 10 (4-39) | 16.52±8.67; 14 (5-38) | <0.001 |
|
Clinical T staging T1 T2a T2b T2c T3a T3b |
12 (3.2%) 30 (8.2%) 160 (43.6%) 142 (38.7%) 22 (6.0%) 1 (0.3%) |
0 0 32 (42.1%) 31 (39.5%) 8 (10.5%) 6 (7.9%) |
<0.001 |
|
Clinical N staging N0 N1 |
366 (99.7%) 1 (0.3%) |
74 (96.1%) 3 (3.9%) |
0.002 |
|
Biopsy outcomes % positive samples PC |
38.31±25.167; 30 (5-100) |
54.664±26.78;50 (2-100) |
<0.001 |
|
ISUP grading at biopsy 1 2 3 4 5 |
131 (35.7%) 107 (29.1%) 69 (18.7%) 50 (13.6%) 10 (2.7%) |
18 (23.4%) 28 (36.4%) 17 (22.0%) 7 (9.1%) 7 (9.1%) |
0.14 |
|
Surgical technique at radical prostatectomy Laparoscopic Robotic assisted |
239 (65.1%) 128 (34.9%) |
45 (59.2%) 32 (40.8%) |
0.345 |
| Operative time (minutes) | 160.03±36.02; 160 (90-300) | 160.63±22.39;160 (120-220) | 0.92 |
|
Nerve sparing technique at surgery No Yes Monolateral Bilateral |
259 (70.4%) 108 (29.6%) 42 (38.9%) 66 (61.1%) |
5 8 (74.7%) 19 (25.3%) 10 (52.6%) 9 (47.4%) |
0.450 0.230 |
|
Pathological stage (T) pT2 pT3a pT3b |
218 (59.4%) 119 (32.4%) 30 (8.2%) |
28 (36.4%) 31 (40.2%) 18 (23.4%) |
<0.001 |
|
ISUP grading at surgery 1 2 3 4 5 |
84 (23%) 152 (41.3%) 70 (18.9%) 41 (11.2%) 20 (5.7%) |
8 (10.4%) 31 (40.3%) 19 (24.7%) 7 (9.1%) 12 (15.6%) |
0.006 |
|
Positive surgical margin site apex lateral basal posterior multiple |
31(40.2%) 23 (29.9%) 6 (7.8%) 12 (15.6%) 5 (6.5%) |
-- | |
|
Positive surgical margin grading 3 4 5 |
|
55 (71.4%) 21 (27.3) 1 (1.3%) |
-- |
| Positive surgical margin radial distance (mm) | x | 2.97±1.1; 3 (1-7) | -- |
|
PNI at surgery positive negative |
215 (58.5%) 152 (41.5%) |
54 (70.1%) 23 (29.9%) |
0.05 |
|
Cribriform/IDC at surgery positive negative |
12 (3.3%) 355 (96.7%) |
8 (10.4%) 69 (89.6%) |
0.20 |
| Postoperative total PSA (ng/ml)(at 1 month) | 0.04±0.97; 0.02 (0.01-1.0) | 0.13±3.4;0.03 (0.01-2.0) | <0.001 |
| Biochemical progression -No -Yes |
338 (92.1%) 29 (7.9%) |
53 (68.8%) 24 (31.2%) |
<0.001 |
| Time to biochemical progression (months) | 25.45±29.4; 18 (1-120) | 9.73±11.57; 4.5 (1-48) | 0.022 |
| Adjuvant therapy no yes |
359 (91.6%) 10 (8.4%) |
34 (44.1%) 43 (55.9%) |
<0.001 |
| Adjuvant therapy type -RT -RT + ADT |
4 (40.0%) 6 (60.0%) |
33 (76.7%) 10 (23.3%) |
0.037 |
Table 8.
Distribution of preoperative and postoperative parameters on the basis of Biochemical recurrence (BCR). Mean±SD, median, (range). Number of cases (%).
Table 8.
Distribution of preoperative and postoperative parameters on the basis of Biochemical recurrence (BCR). Mean±SD, median, (range). Number of cases (%).
| No BCR | Yes BCR | P value | |
|---|---|---|---|
| Number cases | 391 | 53 | |
| Age (years) | 67.13±6.588; 68 (47-72) | 68.62±6.7; 70 (49-73) | 0.131 |
| BMI | 25.74±3.43; 25 (18-37) | 27.21±3.61;26.7 (21.4-39.4) | 0.017 |
| Charlson Index | 3.85±1.02; 4 (0-7) | 3.86±1.39; 4 (0-7) | 0,96 |
| Familiarity Yes no |
28 (7.2%) 363 (92.8%) |
7 (13.2%) 46 (86.8%) |
0.12 |
| Digital Rectal Examination Normal Suspicious |
340 (86.9%) 51 (13.1%) |
36 (67.9%) 17 (32.1%) |
<0.001 |
| Preoperative total PSA (ng/ml) | 8.14±5.04; 7.1 (3.0-64.0) | 11.37±7.03;9.65 (4.0-30.0) | <0.001 |
| PSAD | 0.2±0.145; 0.17 (0.1-0.59) | 0.26±0.48;0.28 (0.1-0.47) | 0.007 |
| Prostate volume (cc) | 48.15±14.6; 45 (20-120) | 48.55±18.37;50 (25-90) | 0.933 |
| Prostate Tumor size (mm) at mMR | 11.95±5.14; 10 (4-30) | 23.21±11.18;20 (10-39) | <0.001 |
|
Clinical T staging T1 T2a T2b T2c T3a T3b |
12 (3.1%) 30 (7.7%) 173 (44.2%) 148 (37.8%) 26 (6.7%) 2 (0.5%) |
0 0 19 (35.8%) 25 (47.2%) 4 (7.5%) 5 (9.4%) |
<0.001 |
|
Clinical N staging N0 N1 |
390 (99.7%) 1 (0.3%) |
50 (94.3%) 3 (5.7%) |
<0.001 |
|
Biopsy outcomes % positive samples PC |
38.68±25.2; 30 (2-100) |
59.21±27.57;50 (14-100) |
<0.001 |
|
ISUP grading at biopsy 1 2 3 4 5 |
143 (36.6%) 123 (31.4%) 70 (17.9%) 46 (11.8%) 9 (2.3%) |
6 (11.3%) 12 (22.6%) 16 (30.2%) 11 (20.8%) 8 (15.1%) |
<0.001 |
|
Surgical technique at radical prostatectomy Laparoscopic Robotic assisted |
243 (62.1%) 148 (37.9%) |
41 (77.4%) 12 (22.6%) |
0.034 |
|
Nerve sparing technique at surgery No Yes Monolateral Bilateral |
270 (69.1%) 121 (30.9%) 48 (28.9%) 73 (71.1%) |
47 (88.7%) 6 (11.3%) 4 (80.0%) 2 (20.0%) |
0.002 0.016 |
|
Pathological stage (T) pT2 pT3a pT3b pT4 |
234 (59.8%) 127 (32.5%) 30 (7.7%) 0 |
12 (22.6%) 23 (43.4%) 18 (34.0%) 0 |
<0.001 |
|
Pathological stage (N) N0 N+ |
94 (91.3%) 9 (8.7%) |
21 (65.6%) 11 (34.4%) |
0.014 |
|
ISUP grading at surgery 1 2 3 4 5 |
88 (22.5%) 172 (43.0%) 75 (19.0%) 40(11.4%) 16 (4.1%) |
4 (7.5%) 11 (20.8%) 14 (24.4%) 8 (15.1%) 16 (20.2%) |
P<0.001 |
|
Surgical margin at surgery (R) Negative positive |
338 (86.4%) 53 (13.6%) |
29 (54.7%) 24 (45.3%) |
<0.001 |
|
Positive surgical margin grading 3 4 5 |
45 (84.9%) 7 (13.2%) 1 (1.9%) |
10 (41.7%) 14 (58.3%) 0 |
<0.001 |
| Positive surgical margin radial distance (mm) | 2.67±0.82; 3 (1-4) | 3.75±1.35; 3.5 (2-7) | 0.001 |
|
PNI at surgery positive negative |
225 (57.5%) 166 (42.5%) |
44 (83.0%) 9 (17.0%) |
<0.001 |
|
Cribriform/IDC at surgery positive negative |
15 (3.8%) 376 (91.2%) |
5 (9.4%) 48 (90.6%) |
0.217 |
| Postoperative total PSA (ng/ml)(at 1 month) | 0.03±0.03; 0.02 (0.01-0.1) | 0.24±0.433;0.07 (0.01-2.0) | <0.001 |
| Time to biochemical progression (months) | 18.67±24.57;12 (1-120) | -- | |
| Adjuvant therapy no yes |
359 (91.8%) 32 (8.2%) |
32 (60.4%) 21 (39.6%) |
<0.001 |
| Adjuvant therapy type -RT -RT + ADT |
26 (81.2%) 6 (18.8%) |
11 (55.0%) 10 (45.0%) |
0.042 |
Disclaimer/Publisher’s Note: The statements, opinions and data contained in all publications are solely those of the individual author(s) and contributor(s) and not of MDPI and/or the editor(s). MDPI and/or the editor(s) disclaim responsibility for any injury to people or property resulting from any ideas, methods, instructions or products referred to in the content. |
© 2024 by the authors. Licensee MDPI, Basel, Switzerland. This article is an open access article distributed under the terms and conditions of the Creative Commons Attribution (CC BY) license (http://creativecommons.org/licenses/by/4.0/).
Copyright: This open access article is published under a Creative Commons CC BY 4.0 license, which permit the free download, distribution, and reuse, provided that the author and preprint are cited in any reuse.


