Submitted:
09 September 2024
Posted:
10 September 2024
You are already at the latest version
Abstract
Understanding the relationship between sugar yield and related traits is crucial for successfully breeding this important industrial crop. Thirteen sugar beet monogram cultivars were evaluated during 2018-2019. The study used a split-factorial design with two planting dates as the main plot, while cultivars and harvesting dates were laid out as CRBD as subplots. Significant differences were observed among the cultivars for all measured traits. The genetic correlation coefficients showed the highest positive and significant correlations between sugar yield and white sugar yield (WSY) (0.88**), sugar content (SC) (0.71**), and white sugar content (0.65**). Conversely, the highest negative and significant correlations were found between sugar yield and molasses sugar content (-0.62**), alkalinity coefficient (-0.58**), and root potassium content (-0.52**). In the stepwise multiple regression analysis, white sugar content (WSC), sugar content (SC), root α-amino nitrogen content, and root yield were included in the regression model, explaining 84% of the total variance in the sugar yield. Path analysis revealed that sugar content (1.12) and root yield (1.03) had the highest direct effects on sugar yield. These traits can be used as key criteria for developing superior hybrids with high economic productivity, thereby accelerating the selection process in various breeding programs.
Keywords:
Cause and effect relationships
; Genetic correlation
; Sugar Beet Final yield
1. Introduction
The sugar industry, an integral part of the food and agriculture sector, faces critical global challenges, including increasing world population, hunger, and extreme climate change. These challenges can only be mitigated by increasing agricultural production. This goal can be achieved by expanding both the cultivation area and yield per unit area. Given the limited arable land, increasing yield per unit area is the most viable option [1]. The sugar beet (Beta vulgaris L.) is the second most vital and strategic crop for sugar production worldwide. Globally, sugar beets are cultivated on 4.3 million hectares of land, producing approximately 261 million tons with an average yield of 60.8 MG ha-1. In Iran, the production stands at 5.0 million tons with an average yield of 55.6 MG ha-1 [2]. Due to its climatic diversity and latitude, Iran is among the six countries with sugar production infrastructure from sugarcane and sugar beets. Sugar beet cultivation in Iran has a history of more than 100 years. Over the past five years, the average cultivation area has been 109,000 ha, with an average yield of 56 MG ha-1. Owing to the growing population, the need to supply sugar through sugar beet cultivation is increasing, leading to a cultivation area of 113,000 ha (92,000 and 21,000 ha of spring and autumn cultivation, respectively) in 2022. Notably, 50% of the sugar produced in Iran is obtained from sugar beet [3].
In Iran, sugar beets account for approximately 7% of the total agricultural crop production and 49% of the total industrial production. West Azerbaijan Province ranks first (approximately 33% of production) [3]. The high importance of sugar in Iranian households, the need to fulfill domestic demand through imports, and yield reduction due to abiotic stresses, such as drought, underscores the need to increase sugar beets' quantitative and qualitative yield.
The sugar beet germplasm in Iran exhibits favorable diversity in terms of quantitative and qualitative traits. Evaluating agronomic traits, specifically those with the highest impact on the final sugar beet yield, can enhance breeding programs. Understanding the relationships between traits, particularly those that are not easily measurable or have low heritability, is crucial for indirect selection. Identifying and understanding the relationships between traits with complex inheritance and low heritability and those with simple and higher heritability increases the genetic efficiency of breeding complex traits, such as sugar yield [4]. Selecting correlated traits also impacts the primary trait, but the degree of dependence among traits is limited when the number of independent variables affecting the dependent trait increases. In such cases, correlations alone cannot explain the relationships between variables [5]. The fundamental relationships between traits need to be expressed through path analysis, which provides additional information that is not generally observed in simple correlations [6].
Path coefficient analysis is widely used in crop breeding to determine the relationship between yield (response or dependent variable) and its contributing components (predictor or independent variables). This analysis identified components with significant effects on yield for potential use as selection criteria, offering an acceptable explanation of the correlation between traits based on a cause-and-effect model. Many researchers have examined the cause-and-effect relationships between yield and other traits in various crops, including rice [7], wheat [8], barley [9], rapeseed [10], and sugar beet [11,12,13,14,15]. The direct effects of leaf area [14], root dry weight, total fresh weight, leaf fresh weight, crown fresh weight [15], root diameter, and molasses sugar content [12] on root yield, sugar content, white sugar content, alkalinity coefficient, and root potassium content have been previously reported [15,16].
Plant breeders generally select only a few traits, which makes it essential to understand their effects on other important characteristics. The current study was conducted to investigate the relationship between sugar yield and its components and to determine the most critical traits affecting sugar beet yield.
2. Materials and Methods
2.1. Experiment Layout
Thirteen different sugar beet monogerm cultivars, including 11 Iranian (SBSI035, SBSI037, SBSI048, Sina, Shokoofa, Paya, Motahar, Ekbatan, Aria, Sharif, and Arta), and two foreign cultivars (Perfecta and Palma) were evaluated during the 2018-2019 crop season. The study was conducted as a split-factorial experiment based on a randomized complete block design (RCBD) with four replications. The main plot consisted of two planting dates (April 21 and June 22, as early and late planting, respectively). The subplots included a factorial combination of three harvest dates (7 and 22 October, and 6 November) and 13 cultivars. The experiment was conducted at the Agricultural and Natural Resources Research and Education Center of West Azerbaijan Province, Miandoab Agricultural Research Station (Longitude, 46º 90' E; latitude, 36º 58' N; altitude 1314 m). This region features a mesic temperature regime (average annual soil temperature from 8 to 15 °C) and a xeric moisture regime (semi-arid). The soil was silty loam with a pH of 7.5-8.0 and an electrical conductivity of approximately 2.3 ds/m. The land was conventionally prepared, including plowing, disking, leveling, and planting. Each plot consisted of three rows, each 8 m long, with a line spacing of 0.5m and a plant distance of 18 cm. Agronomic management followed conventional practices, including irrigation, fertilization, cultivation operations, weeding, and pest control, which were conducted following local customs.
2.2. Measurements
The measured traits included root yield (RY) (MG ha-1), sugar yield (SY), white sugar yield (WSY) (MG ha-1), sugar content (SC), white sugar content (WSC) (%), amount of root impurities (including root sodium, potassium, and α-amino nitrogen content) (meq.100g beet-1), molasses sugar content (MS) (%), extraction coefficient of sugar (ECS) (%), and alkalinity coefficient (Alc), which were determined as follows:
2.3. Root Yield (RY)
After harvesting, weighing, and determining root yield, 30-35 roots were randomly selected. The roots were washed and prepared into pulp in the laboratory. The prepared pulp was then frozen and sent to the Sugar Technology Laboratory of the Sugar Beet Seed Breeding Research Institute in Karaj for further laboratory analysis to determine the desired traits. The methods used for measuring and determining the technological quality and quantity of sugar beets, as assessed in this study, are summarized below.
2.4. Sugar Content (SC)
To determine the sugar content, 177.8 cc of alkaline lead acetate solution was added to 26g of the prepared pulp. The mixture was thoroughly blended and filtered using a magnetic stirrer. A portion of the filtered solution was poured into a polarimeter using a funnel, and the sugar content was measured by observing the degree of deflection of polarized light [17].
2.5. White Sugar Content (WSC)
This trait, which represents the amount of white sugar extracted in the factory, was calculated by subtracting the sum of molasses sugar and sugar waste in the factory (usually 0.6) from sugar content (SC). The closer the value of this trait to the sugar content, the less waste there is, resulting in a higher extraction coefficient.
2.6. Sugar Yield (SY)
This trait, equivalent to the amount of sugar produced per unit area of the field or the amount of sucrose stored in the roots of sugar beets, is considered the final yield in sugar beet cultivation. It was calculated by multiplying the root yield (RY) by the sugar content (SC) in MG ha-1 [18].
2.7. White Sugar Yield (WSY)
The white sugar yield, which is the same amount of sugar that can be extracted from sugar beets per unit area of the field, was obtained by multiplying the root yield (RY) by the white sugar yield (WSC) in MG ha-1 [18].
Pure sugar yield (t ha-1) = root yield (t ha-1) × [Sugar Content (%) − sugar efficiency loss (%)]
Sugar efficiency loss (%) = standard loss of molasses (%) + 0.6 (%)
Standard loss of molasses (%) = 0.012 × (K + Na) + 0.024(α-amino N) + 0.48
2.8. Root Impurities (Na, K, and α-Amino N)
Root impurities, including sodium, potassium, and α-amino nitrogen, were measured in milliequivalents per 100 g of root pulp. Another part of the filtered solution was analyzed using a Beet Analyzer to measure impurities. Sodium and potassium levels were determined using flame photometry, which compares the emission spectrum of lithium with previously calibrated standards [19]. A small portion of the filtered solution was used to measure the α-amino nitrogen content, which included all organic nitrogen compounds such as amino acids. The Abbe number method measures these nitrogen compounds [20].
2.9. Extraction Coefficient of Sugar (ECS)
The extraction coefficient of sugar (ECS) quantifies the efficiency with which white sugar can be extracted from the sucrose in sugar beet roots. It was calculated by dividing the white sugar content (WSC) by the sugar content (SC) × 100. A value closer to 100 indicates higher sugar production efficiency, implying that a more significant proportion of the sugar in the root is extractable and the root contains a lower percentage of impurities [21].
2.10. Molasses Sugar Content (MS)
The content or percentage of non-extractable sugar from sugar beet root, known as molasses sugar (MS), was calculated based on the amount and content of root impurities such as sodium (Na), potassium (K), and nitrogen (N), according to the following equation [22]:MS = 0.343 (Na + K) + 0.094 N − 0.29
2.11. Alkalinity Coefficient (Alc)
This trait was calculated as the total sodium and root potassium content ratio to root α-amino nitrogen content [23].
2.12. Statistical Analysis
The collected data were subjected to statistical analyses, including variance analysis, genetic correlation analysis, multiple regression analysis, and path analysis. Stepwise multiple regression analysis was employed to investigate the effect of each trait on sugar yield (dependent variable), reduce the number of independent variables, and fit the best regression model. Path analysis based on genetic correlation coefficients was used to understand the relationships between traits and identify those that play the most important roles in sugar yield. Data were analyzed using Excel, SAS 9, and Path2 for statistical calculations.
3. Results
Before data analysis, normality tests were performed using the Kolmogorov-Smirnov and Shapiro-Wilk methods, which confirmed that the error distribution of the data for the traits was normal. Additionally, an F test indicated that the error variance between the two years was insignificant, demonstrating the uniformity of the error variance across the years. Consequently, the effect of the year was merged with the error, and a combined ANOVA was conducted as a factorial split test based on a randomized complete block design (RCBD). Table 1 presents the results.
The year factor was highly significant for root yield, sugar yield, white sugar yield, sugar content, and white sugar content (p≤0.01) and significant for root α-amino nitrogen and root sodium content (p≤0.05). The planting date, as the main factor (A), significantly affected most of the measured traits. Specifically, it significantly affected the root yield, white sugar content, root α-amino nitrogen, and root potassium content (p≤0.01), as well as the sugar yield, white sugar yield, and sugar content (p≤0.05). The differences between the evaluated cultivars for all measured traits, including root yield, sugar yield, sugar content, root α-amino nitrogen, root sodium content (p≤0.01), white sugar yield, white sugar content, sugar extraction coefficient, root potassium content, alkalinity coefficient, and root molasses sugar content (p≤0.05).
The harvest date factor significantly affected all measured traits except the sugar extraction coefficient, root α-amino nitrogen, root potassium content, alkalinity coefficient, and root molasses sugar content. The interaction between planting date and harvest date for all measured traits was not statistically different, indicating that the influence of these factors was independent. Thus, the main effects on the measured traits were evaluated separately.
The interaction between planting date and cultivar was significant (p≤0.01) for root yield, sugar yield, white sugar yield, sugar content, white sugar content, and potassium content (p≤0.05). Some measured traits, including root yield, sugar yield, white sugar yield, sugar content, white sugar content, root α-amino nitrogen, and root potassium content, were significantly influenced by the interaction between the harvest date and cultivar (p≤0.05). The results suggest that the differences between cultivars vary depending on planting and harvest dates, demonstrating the interaction effect between these factors.
The 3-way interaction effect of cultivar × planting date × harvesting date was significant for root yield, sugar yield, white sugar yield, sugar content, and white sugar content (p≤0.05) but not for other traits. Because of the complexity of interpreting triple interactions, they are less frequently investigated, as they add complexity to the results.
The coefficients of variation ranged from a maximum of 38.85 for root sodium content to a minimum of 5.15 for sugar content. The average coefficients were related to sugar yield (SY), root α-amino nitrogen content (N), and molasses sugar content (MS) (Table 1).
Table 2 presents the genetic correlation coefficients between different traits that showed significant negative correlations between root yield and sugar content (-0.60**), white sugar content (-0.54**), alkalinity coefficient (-0.52**), root potassium content (-0.47**), molasses sugar content (-0.45**), and root sodium content (-0.33). The results indicated significant positive correlations between root yield and sugar yield (0.86**), white sugar yield (0.79**), and sugar extraction coefficient (0.58**).
The white sugar yield was significantly positively correlated with sugar content (0.71**), white sugar content (0.65**), sugar extraction coefficient (0.59**), and root sodium content (0.50**). Furthermore, white sugar yield was significantly positively correlated with sugar content (0.77**), sugar extraction coefficient (0.76**), and white sugar content (0.71**), but negatively correlated with the alkalinity coefficient (-0.68**), root sodium content (-0.64**), root potassium content (-0.60**), and molasses sugar content (-0.59**). Root α-amino nitrogen content was also positively correlated with root sodium and potassium content (0.24* and 0.29*, respectively).
White sugar, sugar content, root α-amino nitrogen content, and root yield were included in the model (Table 3). Other traits did not significantly affect the model, indicating that the difference in sugar yield between genotypes could be attributed to variations in these traits. The results showed that the independent variables—white sugar content, sugar content, root α-amino nitrogen content, and alkalinity coefficient—explained 24%, 28%, 11%, and 21% of the variance in sugar yield, respectively. The fitted model's cumulative coefficient of determination (R²) indicated that these independent variables explained 84% of the variance in the sugar yield.
Owing to the relatively high correlation between some variables in the model, the variance inflation factor (VIF) was used to check for the possible existence of collinearity. Only traits with a VIF value less than ten were included in the model. Measurement of the partial coefficients of standardized regression revealed that all independent variables in the model, except for root α-amino nitrogen content, increased sugar yield.
Path analysis was employed to interpret the results of genetic correlation coefficients and stepwise regression more comprehensively and to determine cause-and-effect relationships by specifying the components' direct and indirect effects. Path analysis showed that the correlation between traits and sugar yield could be attributed either to their direct effects on yield or to their indirect effects through other traits.
When the correlation between sugar yield and a trait is due to its direct effect, this indicates that the trait can be selected for improved yield. Conversely, if the correlation is due to an indirect effect through other traits, selection should focus on the trait that has caused the indirect effect.
Considering the important relationships between different traits in developing breeding programs and identifying suitable traits for selection, it is crucial to account for both direct and indirect effects. This approach prevents undesirable results of one-sided selection for crop traits without considering other traits. Thus, correlations between traits and their direct and indirect effects should be considered in breeding programs and the identification of superior genotypes, making path analysis necessary.
Path analysis was performed in this study with sugar yield as the dependent variable (effect) and traits in the stepwise regression model as the independent variables (cause). The results of the path analysis (Table 4) indicated that the maximum and minimum direct effects were related to the sugar content (1.12) and root α-amino nitrogen content (-0.57), respectively.
Sugar content, with the highest direct and positive effect (1.12), had negative indirect effects through root α-amino nitrogen content (-0.35) and root yield (-0.43) and a positive indirect effect through white sugar content (0.37) on root yield (Table 4, Figure 1). Following sugar content, root yield had a direct and highly positive impact (1.03) on sugar yield. The indirect effect of root yield was decreased through white sugar content (-0.14) and sugar content (-0.21) but increased through root α-amino nitrogen content (0.18) (Table 4, Figure 1).
The residual effect in this study was 0.26 (Table 4, Figure 1), indicating how causal factors justified the variation of the dependent factor (sugar yield). The variables (white and sugar content, root α-amino nitrogen content, and root yield) explained approximately 74% of the variance in sugar yield. This is likely due to the relatively low correlations between traits, especially root α-amino nitrogen content and sugar yield. Additionally, other factors not considered in this study must be included in the path analysis to fully explain the variance in sugar yield.
4. Discussion
The results of the present study revealed substantial diversity among the cultivars. This diversity can be used in breeding programs to select superior cultivars.
Understanding the relationships between traits is crucial for crop breeding programs, as they indirectly influence selection success. Correlation analysis was conducted to evaluate the underlying relationships between different traits to identify the component characters that can be used for yield improvement.
In this study, the significant relationship between sugar yield and sugar content (0.71**) was likely due to the mathematical relationship between these two traits, where sugar content is a component of the formula used to derive the sugar yield. Because sodium is present in the root in an impure form, increasing sodium levels can increase sugar content but decrease sugar purity [13]. Additionally, the significant positive correlation between root α-amino nitrogen content and roots' sodium and potassium content (0.24* and 0.29*, respectively) indicated that potassium does not inhibit nitrogen uptake. Potassium consumption in saline soils may reduce sodium damage to some extent [24].
Furthermore, because of the significant negative correlation between root sodium content and white sugar content (-0.86**) and sugar content (-0.74**), it can be inferred that in high-sodium soils (e.g., saline soils), sugar content significantly decreases in the presence of potassium deficiency. The positive correlation between the extraction coefficient of sugar and white sugar yield (0.76**) can be attributed to the common components of these two traits, namely white sugar content. An increase in the white sugar content improved both traits.
The positive and significant correlation between the white sugar content and the extraction coefficient of sugar and white sugar yield supports this claim. Additionally, sugar content shares a common component with white sugar content and white sugar yield, so increasing white sugar content enhances both traits [15]. The results of this study are consistent with those of previous studies [13,23,25]. However, differences in the study conditions and genotypes affect the results of the correlations in different studies. Therefore, more studies are required to fill this information gap [7,23].
From stepwise regression analysis (Table 3), it can be concluded that white sugar content, sugar content, root α-amino nitrogen content, and root yield are the most important traits affecting sugar yield (Y). Thus, selecting these traits in breeding programs will likely increase sugar yield. However, because the sugar content is part of the final yield, cultivars with higher root yield should be selected, considering the balance between this component and root yield to achieve a higher yield (sugar yield). In contrast with the results of the current study, Bashiri et al. (2015) concluded that sugar and root α-amino nitrogen content explained 61% of the total variance [5]. The disagreement in the results could be due, at least in part, to differences in the genotypes and cultivars studied.
Path coefficient analysis provides insights into interrelationships by separating the correlation coefficients into the direct and indirect effects of the assessed traits. Plant breeders have used this method to identify useful traits as selection criteria for crop yield improvements. Sugar beet breeders use this method to estimate desirable features to enhance quantitative and qualitative yields. The relatively high and negative direct effect of root α-amino nitrogen content (-0.57) and its significant negative correlation with sugar yield (-0.33) at the 0.05 probability level (p≤0.05) indicate that this trait can be used as a selection criterion to improve sugar yield. However, the reverse relationship should also be considered. The negative direct effect of root α-amino nitrogen content (-0.57) (Table 4, Fig. 1) suggests that the indirect effects of this trait through other traits are the main factors of its correlation with sugar yield. Therefore, indirect causal factors must be considered in the selection process. The results also indicate that the direct selection of traits with a positive direct effect (sugar content, white sugar content, and root yield) would enhance the breeding efficiency of sugar beet sugar yield.
5. Conclusion
Using traits such as white sugar content, sugar content, and root yield in a direct selection approach, the root α-amino nitrogen content in an indirect selection approach seems more promising for achieving higher sugar yields. These traits can play important roles in indirectly selecting superior genotypes to increase sugar yield. Consequently, breeding or agronomic activities to improve these traits can increase sugar yields.
The current study indicates that selecting appropriate criteria for yield improvement requires more than relying solely on the correlation between traits and sugar yield. Other statistical methods, such as stepwise regression analysis, must be used to identify traits affecting sugar yield and then perform path coefficient analysis to understand the direct and indirect effects of independent variables on sugar yield.
Author Contributions
Farhang Mouloodi, Saman Yezdanseta, and Heydar Azizi (plant breeding) wrote the manuscript with Esmaiel Nabizadeh (Crop Physiology) support.
Ethical Compliance: All procedures performed in studies involving human participants were by the ethical standards of the institutional and/or national research committee and with the 1964 Helsinki Declaration and its later amendments or comparable ethical standards.
Data Availability Statement
Research data supporting this publication are available upon request.
Acknowledgments
The authors thank Islamic Azad University and West Azarbaijan Agricultural and Natural Resources Research Center, Agricultural Research, Education, and Extension Organization (AREEO), Urmia, Iran, for their support.
Conflicts of Interest
Authors do not have any conflict of interest to declare.
References
- Kumar, L.; Chhogyel, N.; Gopalakrishnan, T.; Hasan, K.; Jayasinghe, L.; Kariyawasam, C.S.; Kipkemboi Kogo, B.; Ratnayake, S. Climate change and future of agri-food production. Future Foods 2022, 49, 49–79.
- FAO (Food and Agriculture Organization). FAOSTAT Database. Rome, 2022. Available online: http://faostat.fao.org.
- Anonymous. Ministry of Agriculture-Jahad Press. Min. Agri.-Jahad Press 2020, 95 pp.
- Tolera, B.; Gedebo, A.; Tena, E. Genetic variability, character association, and path analysis in sugarcane genotypes. Arch. Agron. Soil Sci. 2024, 70, 1–15. [CrossRef]
- Hamel Niyat, M.; Babaeian Jelodar, N.A.; Bagheri, A.; Kiani, Gh. Determination of correlation coefficients and path analysis of traits affecting yield in local Tarom mutant lines. J. Crop Breed. 2016, 8, 198–206.
- Soghani, M.; Vaezi, Sh.; Sabaghpour, S.H. Study on correlation and path analysis for seed yield and its dependent traits in white bean genotypes (Phaseolus vulgaris L.). J. Agron. Plant Breed. 2010, 6, 27–36.
- Azizi, H.; Aalami, A.; Esfahani, M.; Ebadi, A.A. The study of correlation and path analysis of grain yield and its related traits in rice (Oryza sativa L.) varieties and lines. J. Crop Breed. 2017, 9, 36–43. [CrossRef]
- Mohammadi, S. Evolution of grain yield and its components relationships in bread wheat genotypes under full irrigation and terminal water stress conditions using multivariate statistical analysis. Iran. J. Field Crop Res. 2014, 12, 99–109.
- Zare, M. Analysis of phenotypic correlation and causality of different agronomic traits in barley under optimal irrigation conditions and drought stress. J. Crop Ecophysiol. 2017, 9, 60–67.
- Rahimi, M.; Ramazani, M.; Ozoni Duji, A.A. Correlation analysis and causality of pattern effect and planting density on two rapeseed cultivars. J. Crop Breed. 2016, 8, 218–227.
- Ahmadkhansari, V.; Sabouri, H.; Biyabani, A.L.; Falahi, H.A.; Zarei, M. Study of correlation and path analysis of agronomic traits in wheat-wheat and sugar beet-wheat rotations. Appl. Res. Plant Ecophysiol. 2006, 2, 145–156.
- Baradaran Firouzabadi, M.; Farrokhi, N.; Parsaeyan, M. Sequential path analysis of some yield and quality components in sugar beet grown in normal and drought conditions. Ital. J. Agron. 2011, 6, 45–51. [CrossRef]
- Bashiri, B.; Mir Mahoudi, T.; Fotouhi, K. Evaluation of sugar beet (Beta vulgaris L.) genotypes for their trait associations under saline conditions. J. Crop Ecophysiol. 2015, 9, 243–258.
- Mohammad Yousefi, S.; Ahmadi, M.; Najafi Zarrini, H. Evaluation of the relationship between traits affecting stem shrub and root yield in sugar beet lines in autumn agriculture. J. Plant Prod. 2017, 10, 11–28.
- Mirmahmoudi, T., Fotouhi, K., Hamzeh, H. and Azizi, H. Evaluation of Quantitative and qualitative characteristics and relationship between traits in sugar beet genotypes under normal and salt stress conditions. Envir Str Cr Sci.2021; 14 (1), 221-233.
- Ouda Sohier, M.M. Yield and quality of sugar beet as affected by planting density and nitrogen fertilizer levels in the newly reclaimed soil. Zagazig J. Agric. Res. 2005, 32, 701–715.
- Babaei, B.; Abdollahian-Noghabi, M.; Jahad Akbar, M.R.; Yousefabadi, V. Introduction of appropriate method for determination of sugar content in sugar beet produced under drought, salinity, and normal conditions. J. Sugar Beet 2013, 29, 99–111.
- Khayamim, S.; Mazaher, D.; Banaian Aval, M.; Govhari, J.; Jahansooz, M.R. Assessment of sugar beet physiologic and technologic characteristics at different plant density and nitrogen use levels. J. Pajoohesh Sazandegi 2003, 60, 21–29.
- Artyszak, A.; Kondracka, M.; Gozdowski, D.; Siuda, A.; Czuk-Bis, M.L. Impact of foliar application of various forms of silicon on the chemical composition of sugar beet plants. Sugar Tech 2021, 23, 546–559. [CrossRef]
- Hoffmann, C.M.; Märländer, B. Composition of harmful nitrogen in sugar beet (Beta vulgaris L.) - Amino acids, betaine, nitrate - As affected by genotype and environment. Eur. J. Agron. 2005, 22, 255–265.
- Hosseini, S.Z.; Abbasi Souraki, B. Simulation of mass transfer during sucrose extraction from sugar beet using a combined analytical and semi-empirical model. Chem. Eng. Commun. 2022, 210, 1873–1884. [CrossRef]
- Reinfeld, E.; Emmerich, A.; Baumgarten, G.; Winner, C.; Beiss, U. Zur voraussage des melassezuckers aus rubenanalysen. Zucker 1974, 27, 2–15.
- Taia, A.; El-Mageed, A.; Mekdad, A.A.A.; Rady, M.O.A.; Abdelbaky, A.S.; Saudy, H.S.; Shaaban, A. Physio-biochemical and agronomic changes of two sugar beet cultivars grown in saline soil as influenced by potassium fertilizer. J. Soil Sci. Plant Nutr. 2022, 22, 3636–3654. [CrossRef]
- Nasri, R.; Paknezhad, F.; Sadeghishoa, M.; Gorbani, S.; Fatemi, Z. Correlation and path analysis of drought stress on yield and yield components of barley (Hordeum vulgare) in Karaj region. J. Agron. Plant Breed. 2013, 8, 155–165.
- Fotouhi, K.; Mesbah, M.; Sadeghian, S.Y.; Ranji, Z. Path analysis under normal and salt stress conditions in sugar beet germplasm. J. Sugar Beet 2010, 26, 1–13.
Figure 1.
Diagram of path analysis for sugar yield and its determinant traits.
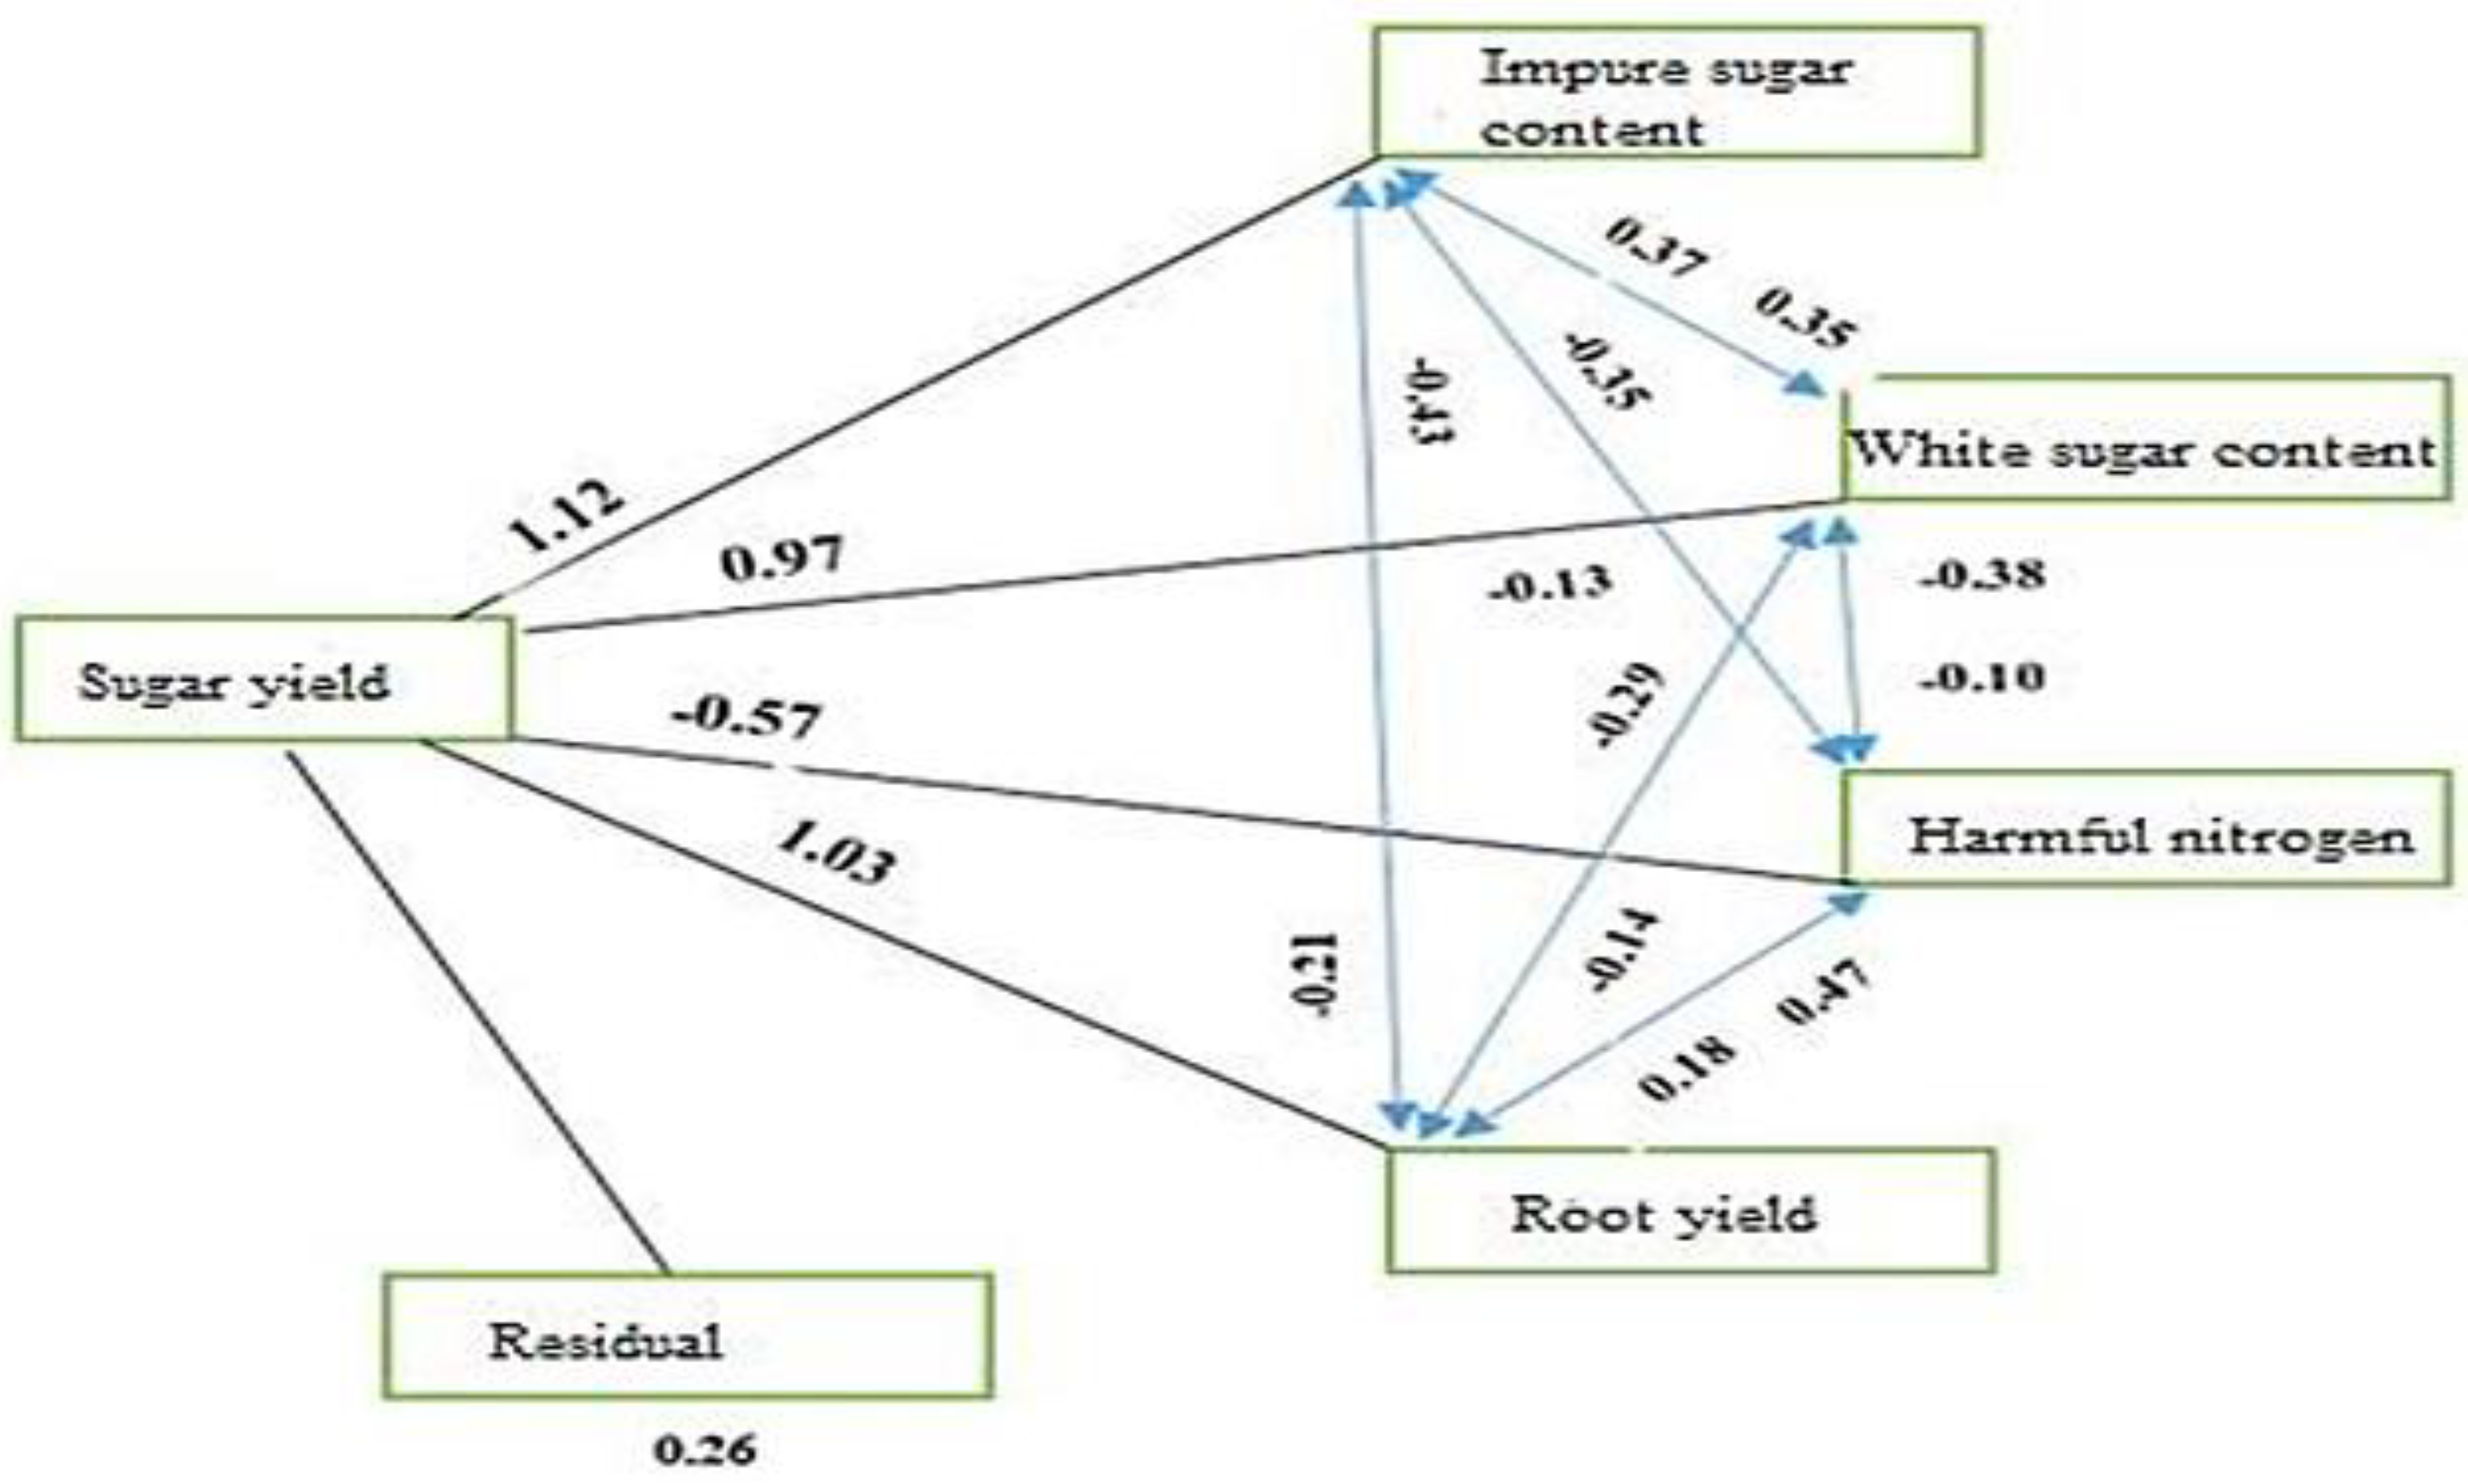

Table 1.
The combined ANOVA results for assessed quantitative and qualitative yield-related traits.
| S.O.V | D.F | MS | ||||||||||
|---|---|---|---|---|---|---|---|---|---|---|---|---|
| RY | SY | WSY | SC | WSC | ECS | N | Na | K | Alk | MS | ||
| Rep. | 3 | 500.45** | 8.65* | 8.21* | 2.55* | 2.74* | 158.3ns | 0.28** | 5.51** | 1.12ns | 3.35ns | 0.62ns |
| Y | 1 | 845.84** | 30.53** | 27.92** | 6.53** | 5.59** | 302.5ns | 0.29* | 4.14* | 1.51ns | 4.21ns | 0.44ns |
| PD (A) | 1 | 824.26** | 33.52* | 16.96* | 8.11* | 8.40** | 238.3ns | 0.59** | 3.34ns | 5.79** | 4.10ns | 0.34ns |
| Y×PD | 1 | 1016.75** | 28.49** | 21.18** | 8.53** | 6.84** | 279.9ns | 0.57** | 4.59* | 2.04* | 3.87ns | 0.39ns |
| Error (A) | 9 | 70.51 | 2.15 | 1.89 | 0.49 | 0.45 | 61.5 | 0.039 | 0.67 | 0.31 | 0.92 | 0.09 |
| C (B) | 12 | 392.02** | 12.96** | 5.57* | 3.32** | 1.46* | 164.5* | 0.38** | 3.75** | 0.87* | 2.53* | 0.30* |
| HD (C) | 2 | 427.20* | 18.81** | 15.76** | 4.84** | 4.79** | 266.9ns | 0.25ns | 7.57** | 1.19ns | 3.93ns | 0.39ns |
| AB | 12 | 418.59** | 14.18** | 11.73** | 3.88** | 3.29** | 147.7ns | 0.14ns | 1.59ns | 0.83* | 2.09ns | 0.24ns |
| AC | 2 | 341.76ns | 7.88ns | 7.45ns | 2.02ns | 2.06ns | 254.6ns | 0.25ns | 2.73ns | 1.32ns | 3.41ns | 0.43ns |
| BC | 24 | 196.02* | 5.74* | 4.74* | 1.32* | 1.33* | 133.1ns | 0.15* | 1.51ns | 0.76* | 2.04ns | 0.23ns |
| YB | 12 | 378.74** | 12.45** | 10.19** | 3.28** | 2.95** | 137.7ns | 0.16* | 2.01* | 0.74ns | 2.11ns | 0.19ns |
| YC | 2 | 589.83** | 20.36** | 16.95** | 4.88** | 4.43** | 230.1ns | 0.31* | 5.45** | 1.11ns | 3.53ns | 0.43ns |
| ABC | 24 | 236.42** | 8.97** | 10.11** | 2.92** | 2.41** | 119.6ns | 0.14* | 1.89* | 0.79* | 1.91ns | 0.21ns |
| YAB | 12 | 476.45** | 11.31** | 5.15* | 2.84** | 2.55** | 149.5ns | 0.33** | 1.95* | 0.81* | 2.81ns | 0.24ns |
| YAC | 2 | 681.50** | 21.22** | 14.32** | 4.12** | 4.34** | 218.3ns | 0.30* | 4.22* | 1.23ns | 3.50ns | 0.37ns |
| YBC | 24 | 235.21** | 8.83** | 8.28** | 2.42** | 1.59** | 122.3ns | 0.14* | 2.73** | 0.63ns | 1.81ns | 0.17ns |
| YABC | 48 | 204.40** | 5.95* | 4.46* | 1.47** | 1.55** | 108.6ns | 0.12* | 1.52* | 0.51ns | 1.66ns | 0.20ns |
| Error (BC) | 456 | 120.62 | 3.48 | 2.77 | 0.78 | 0.74 | 90.6 | 0.085 | 1.06 | 0.45 | 1.37 | 0.15 |
| Total mean | - | 60.18 | 10.49 | 8.61 | 17.14 | 13.89 | 80.2 | 1.76 | 2.65 | 5.49 | 5.24 | 2.65 |
| C.V (%) | - | 18.25 | 17.78 | 19.33 | 5.15 | 6.19 | 11.9 | 16.56 | 38.85 | 12.22 | 22.34 | 14.62 |
Rep: Replication; Y: Year; PD: Planting date; C: Cultivar; HD: Harvesting date. RY: Root yield; SY: Sugar yield; WSY: White sugar yield; SC: Sugar content; WSC: White sugar content; ECS: Extraction coefficient of sugar; N: Root α-amino nitrogen; Na: Root sodium content; K: Root potassium content; Alc: alkaline coefficient; MS: Molasses sugar content.
Table 2.
Genetic correlation coefficients between the traits.
| Traits | 1 | 2 | 3 | 4 | 5 | 6 | 7 | 8 | 9 | 10 | 11 |
|---|---|---|---|---|---|---|---|---|---|---|---|
| -1RY | 1.00 | ||||||||||
| SY-2 | **0.86 | 1.00 | |||||||||
| -3WSY | **0.79 | **0.88 | 1.00 | ||||||||
| -4SC | **-0.60 | **0.71 | **0.77 | 1.00 | |||||||
| -5WSC | **-0.54 | **0.65 | **0.71 | **0.90 | 1.00 | ||||||
| -6ECS | **0.58 | **0.59 | **0.76 | **0.79 | **0.84 | 1.00 | |||||
| -7Na | **-0.33 | **0.50 | **-0.64 | **-0.74 | **-0.86 | **-0.76 | 1.00 | ||||
| -8K | **-0.47 | **-0.52 | **-0.60 | **-0.56 | **-0.67 | **-0.84 | **0.64 | 1.00 | |||
| -9N | *0.16 | *-0.33 | 0.06 | -0.10 | -0.03 | -0.02 | *0.24 | *0.29 | 1.00 | ||
| -10ALC | **-0.52 | **-0.58 | **-0.68 | **-0.72 | **-0.71 | **-0.67 | **0.61 | **0.57 | **-0.52 | 1.00 | |
| -11MS | **-0.45 | **-0.62 | **-0.59 | **-0.80 | **-0.77 | **-0.90 | **0.83 | **0.86 | *0.21 | **0.61 | 1.00 |
RY: Root yield; SY: sugar yield; WSY: white sugar yield; SC: sugar content; WSC: white sugar content; ECS: extraction coefficient of sugar; N: Root α-amino nitrogen content; Na: Root sodium content; K: Root potassium content; ALC: Alkalinity coefficient; MS: Molasses sugar.
Table 3.
Stepwise regression analysis of sugar yield as a dependent variable, and other traits as independent variables.
Table 3.
Stepwise regression analysis of sugar yield as a dependent variable, and other traits as independent variables.
| Step | variable | the partial coefficients of standardized regression | R2 Relative | R2 cumulative |
|---|---|---|---|---|
| 1 | SC(X1) | 4.51 | 0.24 | 0.24 |
| 2 | WSC(X2) | 5.13 | 0.28 | 0.52 |
| 3 | N(X3) | -3.26 | 0.11 | 0.53 |
| 4 | RY(X4) | 4.75 | 0.21 | 0.84 |
| Y=10.3+4.51X1+5.13X2-3.26X3+4.75X4 | ||||
Table 4.
Direct and indirect effects (path coefficients) of the traits on sugar yield of sugar beet cultivars.
Table 4.
Direct and indirect effects (path coefficients) of the traits on sugar yield of sugar beet cultivars.
| Traits | Direct effect | Indirect effect via | ||||
|---|---|---|---|---|---|---|
| WSC | SC | N | RY | Correlation with sugar yield | ||
| SC | 1.12 | 0.37 | - | -0.35 | -0.43 | 0.71 |
| WSC | 0.97 | - | 0.35 | -0.38 | -0.29 | 0.65 |
| N | -0.57 | -0.10 | -0.13 | - | 0.47 | -0.33 |
| RY | 1.03 | -0.14 | -0.21 | 0.18 | - | 0.86 |
| Residual == 0.26 | 0.93 = R2 | |||||
Disclaimer/Publisher’s Note: The statements, opinions and data contained in all publications are solely those of the individual author(s) and contributor(s) and not of MDPI and/or the editor(s). MDPI and/or the editor(s) disclaim responsibility for any injury to people or property resulting from any ideas, methods, instructions or products referred to in the content. |
© 2024 by the authors. Licensee MDPI, Basel, Switzerland. This article is an open access article distributed under the terms and conditions of the Creative Commons Attribution (CC BY) license (http://creativecommons.org/licenses/by/4.0/).
Copyright: This open access article is published under a Creative Commons CC BY 4.0 license, which permit the free download, distribution, and reuse, provided that the author and preprint are cited in any reuse.


