Submitted:
06 September 2024
Posted:
09 September 2024
Read the latest preprint version here
Abstract
Background: Pediatric patients with polyuria polydipsia syndrome (PPS) represent a diagnostic challenge for clinicians because of the technical difficulties in performing the gold standard water deprivation test (WDT). Copeptin, a stable biomarker representing the C-terminal portion of the polypeptide chain of antidiuretic hormone, proves to be a more reliable diagnostic tool. Objective: To assess the diagnostic accuracy of copeptin baseline dosing, arginine/saline copeptin stimulation tests, and WDT. Establishing the diagnostic utility of copeptin in pediatrics, for differentiating central and nephrogenic diabetes insipidus, and primary polydipsia. Methods: comparative and non-comparative primary studies, relating to children, were included and searched for in PubMed, Cochrane Library, WOS, ScienceDirect, Scopus, Google Scholar, up to August 2024. QUADAS-2 tool was used to assess risk of bias and applicability. Meta-analyses used fixed effect models due to low heterogeneity and the HSROC model. Results: 11 studies included, with an overall Low bias, no significant applicability concerns. The mean pooled sensitivity = 0.98 (95% CI: 0.936–1.025), pooled specificity=0.947 (95% CI: 0.920–0.973), and AUC=0.972 (95% CI: 0.952–0.992), indicating excellent diagnostic accuracy. Conclusion: Stimulation methods for copeptin dosing represent effective and less invasive diagnostic test for children with PPS, and future development of standard copeptin testing protocols are needed.
Keywords:
copeptin
; polyuria-polydipsia syndrome
; pediatrics
; diagnostic accuracy
1. Introduction
1.1. Background
Polyuria-polydipsia syndrome presents a diagnostic challenge, especially in the pediatric population. Currently, the gold standard for diagnosis is the water deprivation test, which is followed by the administration of a synthetic antidiuretic hormone (ADH) molecule to evaluate the renal response to arginine-vasopressin (AVP) secretion. This is typically assessed by monitoring the urinary concentration and serum osmolality elevation as indicators of a normal physiological response to dehydration [1]. As it is well known, the results of this clinical test are subdued to important technical limitations, due to the potential discomfort it causes in young children, their noncompliance with all the steps comprise within this test and the potential overlapping results. Therefore, it is sometimes difficult to establish the exact type and etiology of polyuria-polydipsia syndrome, especially when a more defined differentiation between partial central diabetes insipidus (CDI), nephrogenic diabetes insipidus (NDI), or primary polydipsia (PP) is needed.
In recent years the potential of copeptin dosing, as an alternative diagnostic method, has been demonstrated in clinical practice. Copeptin, synthesized in equimolecular proportion with ADH, represents a more reliable and stable biomarker for hypothalamic and renal function. Copeptin is the C-terminal part of the AVP precursor, pre-provasopressin, consisting of 164 amino acids. This precursor is synthesized by the magnocellular and parvocellular neurons, in the supraoptic and paraventricular nuclei of the hypothalamus, transported to posterior pituitary grand, and released into the bloodstream under the influence of serum osmolality that stimulate hypothalamic osmoreceptors [1,2]. The biochemical mechanism of production imply cleavage into three parts: AVP, neurophysin II, and copeptin. AVP, also known as antidiuretic hormone (ADH), is a critical regulator of water homeostasis and blood pressure, producing these effects through three types of AVP receptors: V1a, V1b (or V3) and V2, which are heptahelical G protein-coupled receptors, with different expressions on cell membrane in different tissues [2]. While AVP is unstable and difficult to measure directly due to its short half-life and rapid degradation, having an estimated half time of 15 minutes in serum samples. Copeptin, on the other hand, is more stable in the circulation, making it a reliable surrogate marker for AVP secretion. [3,4]. Clinical studies have shown that copeptin measurements can significantly improve the diagnostic rate in pediatric patients presenting with polyuria-polydipsia syndrome. Differential diagnosis between CDI, NDI and PP is essential for appropriate management in pediatric cases of polyuria-polydipsia syndrome. However, copeptin is still not definitively established as a single standard diagnostic test [4,5]. The diagnostic accuracy of copeptin in differentiating between CDI, NDI, and PP has been validated through various studies, demonstrating high sensitivity and specificity. For instance, Fenske et al. reported that stimulated copeptin levels had a sensitivity of 0.93 and specificity of 0.96 in differentiating between PP and CDI. Additionally, copeptin levels were particularly useful in diagnosing NDI without needing additional tests like the water deprivation test or hypertonic saline infusion [5,6]. This is significant for clinical practice as it simplifies the diagnostic process and reduces patient burden.
Any treatment and management recommendations should be based on the best diagnostic methods, adapted for pediatric patients. Therefore, we systematically reviewed the most accurate, sensitive, and specific methods used for diagnostic tests in polyuria-polydipsia syndrome, in pediatric population. This review aims to synthesize the existing literature on copeptin dosing after iv infusion of saline solution or arginine stimulation test to provide a comprehensive evaluation of their diagnostic accuracy, thereby enhancing clinical practice and reducing the diagnostic burden on young patients.
1.2. Objectives
The primary objective of this systematic review and meta-analysis is to assess the diagnostic accuracy and utility of the baseline dosing of copeptin, diagnostic test of copeptin after infusion of saline intravenous solution, and arginine stimulation tests in pediatric populations presenting symptoms of the polyuria-polydipsia syndrome and other related symptoms. This systematic review and meta-analysis are designed using the framework of PIT to achieve the aimed objectives.
Population: pediatric patients and adolescents (age <18 years) presenting with polyuria-polydipsia syndrome, nocturia, and other symptoms of diabetes insipidus.
Index Test: baseline dosing of copeptin, diagnostic test after hypertonic saline infusion or arginine stimulation of copeptin, and water deprivation test followed by administration of desmopressin.
Target Condition: differential diagnosis of CDI (central diabetes insipidus), NDI (nephrogenic diabetes insipidus), PP (primary polydipsia), and other causes of polyuria-polydipsia.
We also structured a series of secondary objectives in a way that should give a complete evidence base on the diagnostic accuracy of copeptin and the water deprivation test and its contribution towards clinical decision-making and outcomes in pediatric endocrinology.
To compare the diagnostic performance of copeptin dosing with that of the water-deprivation test, or other diagnostic methods for PPS patients. This will be assessed by calculating sensitivity and specificity of copeptin levels measured after hypertonic saline infusion, arginine stimulation, or other stimulation methods for copeptin dosing in differential diagnosis of CDI, NDI, and PP. We will compare with the water deprivation test followed by desmopressin administration, or other traditional diagnostic methods.
To assess the clinical utility of copeptin as a diagnostic biomarker by testing the feasibility and reliability of copeptin measurement, less invasive and more child-friendly than the water deprivation test, in children, and to test the potential of copeptin levels for rapid and accurate differentiation between CDI, NDI, and PP, or other causes of polyuria, at a clinical setting.
To identify gaps and inconsistencies in the existing literature: by reviewing and summarizing current studies to identify areas of further research, in order to recommend future studies to fill these gaps and improve diagnostic protocols for pediatric patients with the polyuria-polydipsia syndrome.
2. Methods
This review is being registered to PROSPERO International prospective register of systematic reviews (ID CRD42024576715) And the protocol was designed following the Cochrane Handbook for systematic reviews of diagnostic test accuracy [7]. Reporting was guided by the improved preferred reporting items for systematic review and meta-analysis adapted to systematic reviews of diagnostic test accuracy - PRISMA-DTA statement [8,9]. (Protocol available through PROSPERO registration https://www.crd.york.ac.uk/PROSPEROFILES/576715_PROTOCOL_20240822.pdf)
2.1. Eligibility Criteria
2.1.1. Study characteristics:
Population:
We included studies performed with children and adolescents, that present the following clinical symptoms: polyuria, polydipsia, nocturia, electrolytic imbalances, and other related symptoms of central diabetes insipidus, nephrogenic diabetes insipidus, or primary polydipsia.
The exclusion criteria were mainly for studies that refer exclusively to disorders not directly related to diabetes insipidus, as well as other definite causes of PPS, or studies assessing only adult patients. And also, patients with hyperosmolar polyuria, such as those with diabetes mellitus, will again be excluded to preserve the specificity of this review.
Index tests
We considered the following index tests:
Copeptin dosing: we selected the studies that involve measuring baseline copeptin levels, and studies that asses copeptin levels after hypertonic saline infusion or arginine stimulation. The protocol should aim to achieve a target serum sodium level of approximately 150 mmol/L, corresponding to a serum osmolality of around 300 mOsm/kg [6,10].
Water Deprivation Test: we considered all studies that utilize a standardized water deprivation protocol, which involves depriving the patient of fluid for up to eight hours or until a 3% loss in body weight is achieved. During the test, plasma osmolality is measured at regular intervals to ensure an adequate rise that stimulates endogenous vasopressin release. Urine volume and osmolality are also monitored throughout the test. Following the fluid deprivation test, the patient is given desmopressin, a synthetic form of vasopressin, then the urine volume and osmolality are measured to assess the response to exogenous vasopressin [1,5,6].
Other relevant alternative diagnostic tests for patients presenting with diabetes insipidus related symptoms.
Target condition:
All patients were eligible if presenting with hippo-osmolar polyuria, associated with secondary polydipsia, due to inadequate secretion of ADH or an abnormal renal response, or other related symptoms, excluding patients with hyperosmolar polyuria, such as in diabetes mellitus.
Reference standards:
- For copeptin dosing, studies must have included specific determination of baseline copeptin levels. Another test that will be assessed is represented by the copeptin levels after intravenous infusion of 3% NaCl solution, as well as arginine stimulation test, or other copetin stimulation methods. These mechanisms are meant to achieve a target serum sodium level of approximately 150 mmol/L, corresponding to a serum osmolality of around 300 mOsm/kg.
- Additionally, studies comparing copeptin with other traditional diagnostic methods such as the water deprivation test. This test is usually extended for 8 hours, and followed by desmopressin administration, to assess the urinary response, od ADH. The study should have recorded serum sodium levels ranging from 145 mmol/L to 150 mmol/L and urinary osmolality ranging from 300 mOsm/kg to 1200 mOsm/kg.
These reference standards are essential to be included in the testing protocols, because they are considered optimal for stimulating hypothalamic osmoreceptors, leading to ADH release and subsequent renal urinary concentration as a physiological response.
Study design:
Comparative Primary Study Designs: Mainly we consider including comparative primary study designs where all patients undergo all tests, or patients are randomized to different tests.
Non-comparative Primary Studies: Due to the limited number of eligible studies, the decision was made to extend the eligibility criteria to include other types of studies. Non-comparative primary studies where only one of the index tests has been investigated were also included. These studies were selected based on similar populations, diagnostic pathways, and described reference standards to minimize bias in our comparative DTA review.
Other studies included: Due to the reduced number of such studies especially in pediatric population we also considered - Randomized controlled trials (RCTs), cohort studies, case-control studies, cross-sectional studies, observational studies, and case series.
2.1.2. Report Characteristics
The review was restricted to studies published in the last 6 years onward because copeptin became widely used for the systematic diagnosis of various types of polyuria-polydipsia syndrome in children starting with 2018. We applied no language restrictions. Reports such as unpublished manuscripts were not included. However, conferences abstracts reporting relevant statistical data were eligible for inclusion in order to cover all the relevant studies conducted on this subject.
Outcome Measures: Our primary outcome measure was the diagnostic accuracy measures (sensitivity, specificity, PPV, NPV, likelihood ratios, AUC) Especially the specificity and sensitivity of the main methods (the water deprivation test and copeptin baseline dosing, as well as iv saline infusion or arginine stimulation tests) used for diagnostic of polyuria-polydipsia syndrome in pediatric population, adolescents and young adults.
2.2. Information Sources
This systematic review is based on a comprehensive and in-depth study of the literature available. The review was conducted from March till August 2024, adhering to the recommendations of the Preferred Reporting Items for Systematic Reviews and Meta-analyses (PRISMA 2020) statement, modified to reflect the requirements for the reporting of diagnostic test accuracy studies in systematic reviews [9,11,12].
All the information was searched in databases accessed through the e-nformation platform,
The following electronic databases were searched for relevant studies: PubMed: Covering biomedical literature from MEDLINE, life science journals, and online books; Cochrane Library; Web of Science: Providing access to multiple databases that reference cross-disciplinary research; ScienceDirect Freedom Collection; Scopus; Google Scholar.
2.3. Search Strategy
The search strategy utilized Medical Subject Headings (MeSH) terms and keywords related to polyuria-polydipsia syndrome and its diagnostic tests. The following terms were used, combined with Boolean operators (AND, OR) to ensure a comprehensive search: "Polyuria", "Polydipsia", ‘’Nocturia’’, "Diabetes insipidus", "Diabetes insipidus nephrogenic", "Arginine vasopressin", "C-terminal provasopressin", "Water deprivation test", "Diamino arginine vasopressin", "Copeptin", "Diagnostic accuracy"
This review follows the guidance for describing search strings for systematic reviews in the form of PRISMA-S (Preferred Reporting Items for Systematic Review and Meta-Analysis Search) [13], ensuring that the search strategies are transparent and reproducible. Each search strategy was documented meticulously, including the database, search terms, date of the last search, and the number of results retrieved. Searches were tailored to each database’s specific indexing system and capabilities. The final search was conducted on 3rd August 2024. Articles not directly related to the main diagnostic tests for polyuria-polydipsia syndrome in children were excluded based on relevance to the review. No unpublished or ongoing studied were included, as well as no other grey literature were considered for this review. All MeSH keywords and search strategy were adapted according to the specifics of each database, as represented in Appendix A – Table A1. (Systematic review and meta-analysis search strategy available through PROSPERO https://www.crd.york.ac.uk/PROSPEROFILES/576715_STRATEGY_20240822.pdf )
2.4. Study Selection
Initial screening of search results based on title and abstract was performed by two reviewers (D.-A.C., L.C.P.) independently. All the eligible studies were assessed by the full-text articles and decision about inclusion was made also independently. We also checked manually the reference lists from all included studies for additional citations. Extracted data were compared, and any discrepancies were resolved through discussion. If consensus cannot be reached, a third reviewer (G.G.) was consulted. In the first step we selected 126 studies, that have been filtered down to 26 studies, that have been full text assessed and finally a total of 11 studies have been included in the meta-analysis, beeing the most relevat for our main objective, and due to completeness of reported data.
2.5. Data Collection Process
Before full data extraction, the extraction form was piloted on two studies, not included in this review to ensure clarity and consistency in data collection.
The data extraction form was extracted in duplicate and included the following key elements:
Study Identification: Author(s), year of publication, journal.
Participant Characteristics: Age, clinical presentation, and inclusion/exclusion criteria.
Index Test Details: Details on the copeptin determination that clearly defines the protocols, including hypertonic saline or arginine stimulation, and other reference tests.
Reference Standards: including the applied criteria and methods used to ascertain the diagnosis, should be clearly described; referring to polyuria, polydipsia, serum sodium concentrations or urinary osmolality.
Diagnostic Accuracy Measures: Sensitivity, specificity, positive predictive value (PPV), negative predictive value (NPV), likelihood ratios, and area under the receiver operating characteristic curve (AUC).
Results: Individual data (raw data) may be presented in detail in 2 x 2 tables with true positives, false positives, true negatives and false negatives, summary statistics, and all subgroup analyses.
Quality Assessment: Use of the QUADAS-2 tool for assessing the risk of bias and applicability of each included study.
2.6. Definitions for Data Extraction
All the definitions used for data extraction process were meticulously revised to ensure that we captured comprehensive and relevant information from each study. This approach allows for a robust comparison of the diagnostic accuracy of copeptin versus traditional methods in the diagnosis of pediatric polyuria-polydipsia syndrome.
For the diagnostic of CDI, we considered a baseline copeptin value of <2.6 pmol/L [3,10,14]. Additionally, a low plasma copeptin level of <4.9 pmol/L obtained as a result of hypertonic saline infusion indicates central DI, both partial and complete forms. A higher level of ≥4.9 pmol/L indicates primary polydipsia [3,14]. Some studies report a cut-off value of 6.5 pmol/L for hypertonic saline-induced copeptin levels due to its higher diagnostic accuracy, which we have also taken into account as equivalent [3,6]. Furthermore, a very high baseline copeptin value of >21.4 pmol/L is is indicative of nephrogenic diabetes insipidus (NDI), encompassing both partial and complete forms [1,3,14].
2.7. Risk of Bias and Applicability
The QUADAS-2 (Quality Assessment of Diagnostic Accuracy Studies-2) tool was used to assess the risk of bias and applicability concerns in individual studies. Two reviewers independently evaluated each study, with discrepancies resolved by a third reviewer. Detailed methods regarding patient selection, index test conduct, and reference standards, and main observations are provided in Appendix B.
2.8. Principal Diagnostic Accuracy Measures
In this systematic review, we assessed the following principal diagnostic accuracy measures for evaluating the performance of copeptin as a diagnostic test in pediatric patients with polyuria-polydipsia syndrome: Sensitivity to measures the proportion of actual positives patients with PPS, correctly identified by the test (copeptin), who have the actual condition, such as CDI; Specificity for the proportion of actual negatives patients correctly identified by the test (copeptin) who do not have the condition, such as ruling out the NDI or PP; Positive Predictive Value (PPV): representing the proportion of positive test results for copeptin that are true positives, meaning that the test correctly identifies those out of all positive results given; Negative Predictive Value (NPV) for the proportion of negative test results that are true negatives, meaning the copeptin test correctly identifies patients who do not have the condition out of the negative results given by the test; Likelihood Ratios (LR) with LR+ (positive likelihood ratio) and LR- (negative likelihood ratio) indicating the test's ability to correctly identify the condition from the patients with positive or negative tests; and Area Under the Receiver Operating Characteristic Curve (AUC) for measuring the test's overall ability to discriminate between those with and without the condition.
2.9. Data Handling for Synthesis of Results
We used several methods to handle data, combine results from various studies, and describe variability between studies in this systematic review:
- Standardization of Target Conditions: Definitions for conditions such as CDI, NDI, and PP were standardized using clinical criteria across studies.
- Harmonization of threshold: Different thresholds for test positivity were harmonized, and subgroup analyses done according to different diagnostic methods. The use of HSROC modeling further allowed us to account for and understand these threshold effects, providing a more nuanced analysis of the diagnostic accuracy across studies.
- Indeterminate results: Clear definitions and sensitivity analyses were used for copeptin levels within a borderline range, and statistical adaptations were done for undefined values, when necessary.
- Meta-Analysis techniques: were carried out with the use of fixed-effects models applied for the assessment of measures of diagnostic accuracy because the studies had shown low heterogeneity. Heterogeneity was assessed using the I² statistic, Cochran's Q test and Tau-squared (τ²) test. The statistical analyses were performed following standard meta-analysis protocols, to ensure robust and reliable estimates, using forest plots to visually compare diagnostic accuracy. Furtehrmore, we used HSROC model to assess threshold variability and obtained a deeper insight into the diagnostic accuracy across studies. [7].
We conducted data analysis using Python in IDLE (Python 3.14) environment, which offered a reliable number of statistical capabilities. Key libraries used included NumPy and Pandas for data manipulation, SciPy for statistical analysis, Matplotlib and Seaborn for data visualization. Advanced AI language models helped us in code generation to enhance precision and efficiency, with expert reviewing all the process to guarantee validity. To ensure result reliability, key analyses were cross-checked using RStudio software or IBM SPSS, confirming the consistency of findings derived from Python scripts.
2.10. Additional Analyses
In this systematic review and meta-analysis, we primarily focused on evaluating the overall diagnostic accuracy of copeptin in pediatric PPS. In order to achieve this, we performed a detailed interpretation of sensitivity analysis results for copeptin borderline studies. And also, we conducted subgroup analyses to evaluate the diagnostic accuracy of various methods for diagnosing PPS, as well as for diagnostic trends over the period studied. The diagnostic methods included copeptin baseline dosing, copeptin stimulation after arginine, copeptin stimulation after saline, and the water deprivation test.
3. Results
3.1. Study Selection
After database search we identified a total of 126 records, after the removal of 29 duplicates, a number of 97 records were screened and assessed for eligibility. As mentioned in the PRISMA flow diagram (Diagram 1) [15], 71 articles have been initially excluded based on the title and abstract. Mainly due to the fact that many studies did not specifically focus on pediatric patients or adolescents and diagnostic methods for PPS. Further refinement was done for 26 articles selected for full text assessment. Several studies did not meet the index tests, by not using the specified diagnostic tests or biomarkers (Copeptin, Water Deprivation Test, Arginine Vasopressin, C-Terminal Provasopressin), or being literature reviews or case-reports, there for a final total of 11 studies that have been selected for our meta-analysis.
The main exclusion reasons were categorized according to PIT:
Population:
Studies focusing on general DI management, or treatment and patient perspective, rather than specific diagnostic methods.
Some studies that were not based on pediatric population with polyuria
Index Test:
Studies that do not addressed the diagnostic methods of our interest.
Target condition:
Several studies that excluded CDI and NDI based on copeptin dosing, and the pathology was not of our interest.
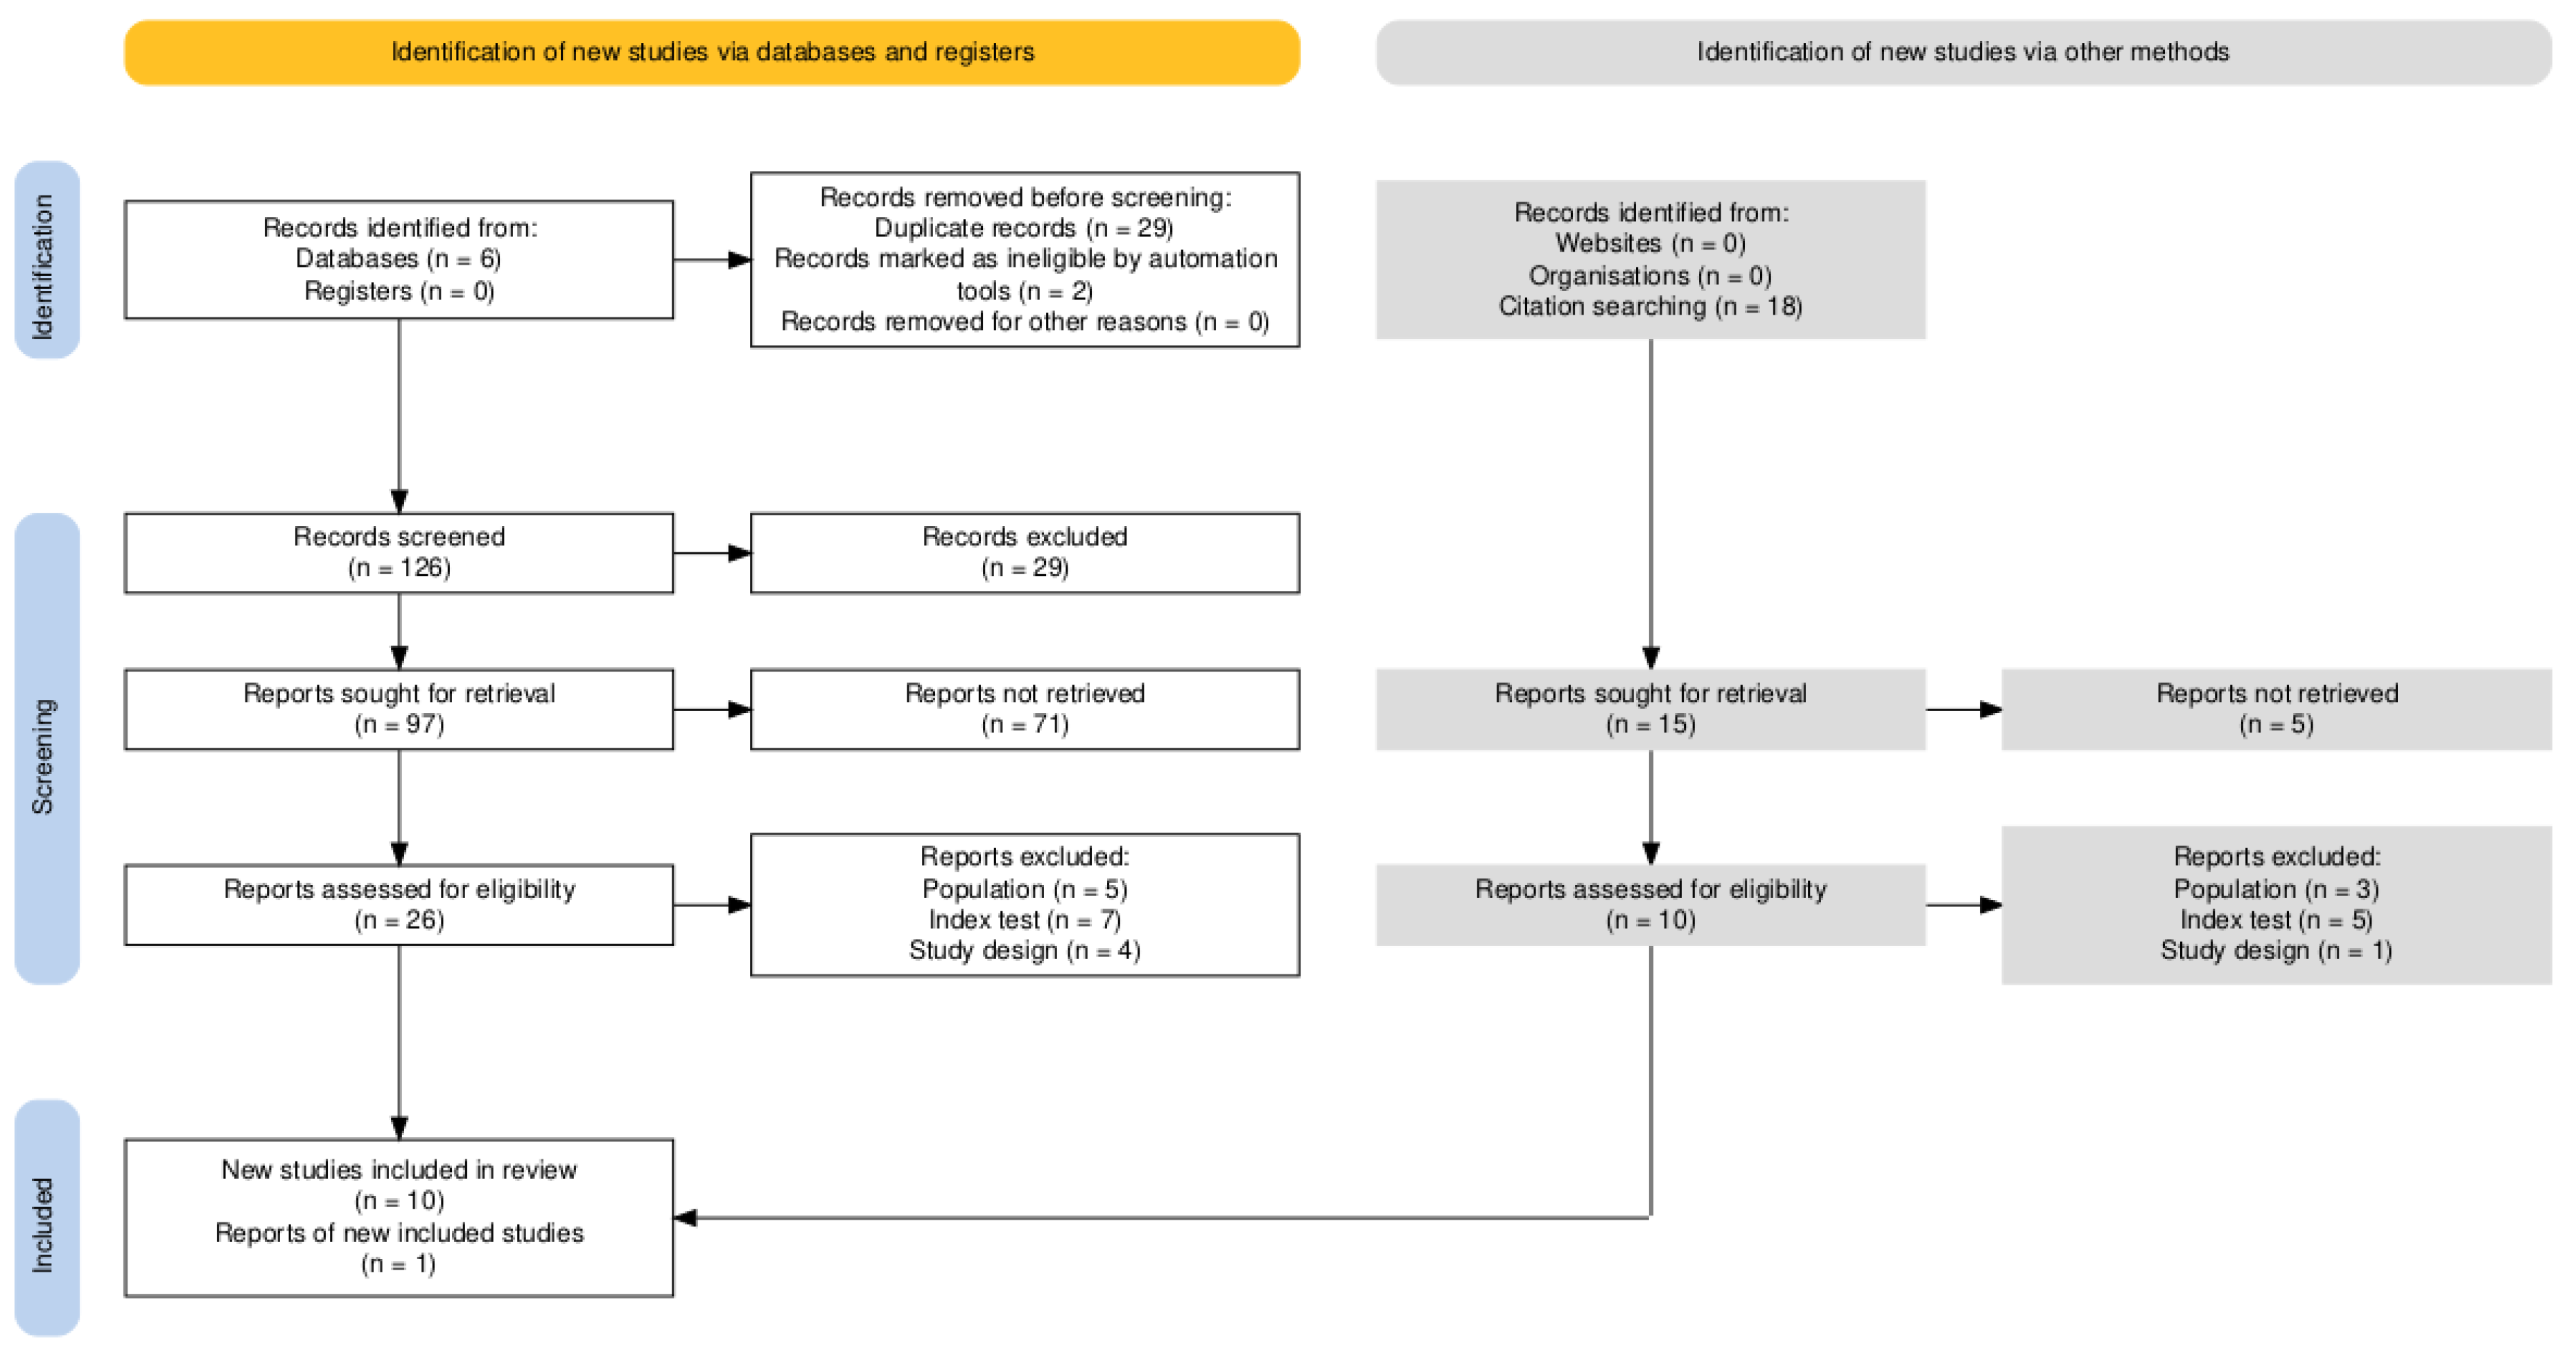
Diagram 1. PRISMA-DTA flow diagram.
3.2. Study Characteristics
We identified 11 key studies based on relevance to the research question, being original research articles, focusing on pediatric population, as well as completeness of data, sample size, clinical settings, and recent high-impact research for the analysis. We described herein in detail to give an insight into the study designs, populations, and diagnostic methods (Table 1).
3.3. Quality Assessment and Publication Bias
3.3.1. QUADAS-2 Was Used to Assess the Quality of Diagnostic Accuracy Studies. It Evaluates the Risk of Bias and Applicability Concerns in Four Key Domains. Detailed Assessment is Available in Appendix C.
For each of the four domains we obtained the following results:
Patient Selection:
We identified a Low Risk of bias in most studies, because the process of patient selection was clearly defined and prospective (Fenske et al., 2018, Tuli et al., 2023, Binder et al., 2023, Tuli et al. 2018, Nofal et al., 2023, Gippert et al., 2023). More than half of the studies were multi-centered, thus reducing selection bias. Moderate Risk of Bias was identified in the studies conducted by Pedrosa et al. 2018, Kitamura M. et al., 2022, March et al. 2018, Bonnet et al. 2024, that were done in a retrospective or single-center manner, which potentially limits the representativity and may introduce some selection bias. Likewise, Bonnet et al. 2021 was single center with a raising moderate risk of bias.
2. Index Test:
Low Risk of Bias was obtained because Index tests (standardization of copeptin measurement after arginine-stimulation, hypertonic saline infusion, and water deprivation tests) were applied uniformly in all studies, with well-documented methodology. None of the studies showed bias in interpretation; hence, the risk remained low in this domain.
3. Reference Standard
Moderate Risk of Bias was obtained in most of the studies, because a reference standard of clinical diagnosis was based on expert consensus. Although this is a relatively robust approach, it could still be open to potential subjectivity that might rest upon expert judgment. Only very few studies, obtained a Low Risk of Bias, such as Fenske et al. 2018, Tuli G. et al. 2023, Binder et al. 2023, because the authors clearly provided diagnostic criteria and appeared to have applied the reference standard with a fair degree of blind conduct.
4. Timing and Flow
Patient flow was clearly recorded in all studies, the appropriate interval between index test and reference standard was maintained, there were losses to follow-ups that were minimal, and procedures were applied consistently. This makes this close to a low-risk bias domain.
Overall, all studies had a low to moderate overall risk of bias in all four domains of QUADAS-2 (Figure 1). The quality of the designs is supported by good standards of execution for index tests with clear documentation of procedures, which strengthens the reliability of the findings. Regarding the main concerns, arise from the domains of Patient Selection and Reference Standard. This is because most studies included single-center settings and retrospective designs, which might further introduce bias into the consensus diagnosis by expert opinion.
3.4. Results of Individual Studies
For each analysis in all 11 studies, we extracted the unique combination of index tests, reference standard, and positivity thresholds, as well as the sensitivity and specificity which were provided, and adequately calculated the results for 2X2 data tables as following (Table 2):
Further for diagnostic accuracy estimates we calculated and assessed Sensitivity, Specificity, Positive Predictive Value (PPV), Negative Predictive Value (NPV), Positive Likelihood Ratio (LR+), Negative Likelihood Ratio (LR-), and Area Under the Receiver Operating Characteristic Curve (AUC), for each study, as described in Table 2. And also, we provided confidence intervals (CI) for all diagnostic accuracy estimates. To obtain a general evaluation of the studies a HSROC model was also applied to account for variations in diagnostic thresholds across studies.
In the 11 studies included in our review and meta-analysis, we generally obtained, high sensitivity and specificity, raging mostly from 95% to 100% in the former and from 85% to 100% in the latter. The diagnostic accuracy, correspondingly, for each index test, was good to excellent in most of the studies, as confirmed by AUC values ranging from 0.93 to 1.00. Most of the studies showed very good diagnostic potential, especially Binder et al. 2023, with the best performance, AUC = 1.00, followed by Tuli et al. 2018 with an AUC of 0.99 and Winzeler B. et al. 2019 with an AUC of 0.98. In generally, the confidence intervals calculated for sensitivity and specificity were narrow, which suggests precise estimates. However, some studies—for instance, Kitamura M et al., 2022—had wide intervals due to smaller sample sizes. Regarding Likelihood Ratios with values for LR+ >7 and LR− ≅0, found in most of the studies suggest, overall, that these tests are good for ruling in and ruling out polyuria polydipsia syndrome, like CDI.
To further illustrate the variability and precision of sensitivity and specificity estimates across the studies, forest plots were generated (Figure 2 and Figure 3). These plots allow for direct comparison between studies regarding the diagnostic performance of copeptin in pediatric polyuria-polydipsia syndrome.
Forest plots of sensitivity and specificity provide a comprehensive overview of diagnostic performance of copeptin within the selected studies, as shown in more detail in Figure 2 and Figure 3. For each study, sensitivities—that is, true positive rates—and specificities, which are the true negative rates, along with their corresponding 95% confidence intervals, were reported. The plots allow for direct comparison between studies regarding the precision and variability of these estimates, focusing on individual measures.
To further evaluate the diagnostic performance of copeptin across the studies, from a different overall perspective, we generated a Receiver Operating Characteristic plot (Figure 4). It graphically shows how sensitivity varies with 1 - specificity. Each curve corresponds to a study and area under the curve is the summary measure of the overall diagnostic accuracy. The higher the AUC, the better the diagnostic performance: an AUC of 1.0 represents a perfect test. The studies with curves closer to the upper-left corner have a higher diagnostic accuracy and better sensitivity with specificity.
3.5. Test Accuracy and Variability
For assessing the diagnostic accuracy of copeptin, in pediatric patients with polyuria-polydipsia syndrome, a total of 11 studies were analyzed based on main diagnostic accuracy metrics.
Sensitivity ranged from 95% in Fenske et al. 2018—to 100% in Kitamura M et al. 2022, Tuli G. et al. 2023, Winzeler B. et al. 2019—a clear indication of an absolutely high ability of the copeptin test to detect true positives.
The specificity ranged from 85.7% with a 95% CI of 66.89%–95.45% in Bonnet et al., 2021, to 100% with a 95% CI of 76.03%–100% in the Binder et al., 2023, which underlines variability of test performance concerning true negatives.
Variability was shown by the Forest plots of sensitivity and specificity across studies with the confidence intervals that express the precision of such estimates. Several had high narrow confidence intervals, for example, Winzeler B. et al., 2019, with a specificity of 95% CI: 84.98%–99.46%, showing more homogeneous test performance. Other studies like Bonnet et al. 2021 have wide-ranging intervals. For example, specificity with 95% CI: 66.89%–95.45% shows a high variability in its accuracy.
Values of AUCs that highlight the overall diagnostic performance ranged from 0.93 in Kitamura M et al. 2022, Bonnet et al. and Tuli G. et al. 2023 to 1.00 in Binder et al. 2023. Most studies presented AUC values above 0.95, hence giving a collectively high overall diagnostic accuracy of copeptin in this patient population. AUCs of the individual studies were given together with their corresponding 95% CI, stating the range of uncertainty about these estimates. For example, in the study by Fenske et al. 2018, an AUC of 0.95 was reported, with a 95% CI of 0.88–0.98, indicating very good diagnostic performance.
To consider the variability between studies especialy their thresholds for test positivity, which sometimes the traditional meta-analysis may not fully capture, we also used the HSROC analysis, that provided a more comprehensive understanding of the diagnostic accuracy by modeling the relationship between sensitivity and specificity across studies.
3.6. Meta-Analysis
Results:
A meta-analysis of the diagnostic performance across all studies was conducted, pooling the sensitivity, specificity, and AUC values across the studies. The variances of each assessed measures, as well as the wight for each study were precisely calculated under a fixed-effect-model (Table 3).
The pooled sensitivity was 0.98, with a 95% CI of 0.936–1.025, proving that copeptin is very effective in correctly identifying cases of polyuria-polydipsia syndrome (Figure 5). The corresponding forest plot in Figure 5 illustrates the sensitivity estimates of each study along with their 95% confidence intervals. The red dashed vertical line represents a pooled sensitivity of 0.96 as estimated in a fixed-effects model. From the plot, high sensitivity is observed in most of the studies, as indicated by the overlapping of their confidence intervals, hence consistency among them. Though, some of the studies like that of Kitamura M et al. 2022 have rather wide intervals. This can be attributed to small sample size, which may result to less precision by those estimates. Putting it all together, the evidence suggests a pooled sensitivity that provides very high probability that this diagnostic test for copeptin will correctly identify true positive cases of PPS.
In parallel, the pooled specificity was 0.947 with a 95% CI of 0.920–0.973, thus showing the strong capability of copeptin in correctly identifying true negative cases and hence minimizing the risk of a false positive diagnosis (Figure 6). The forest plot in Figure 6 shows the specificity estimates for each study. The red dashed line represents the pooled specificity across studies. This plot reveals some variability in specificity across the studies, with several studies achieving near-perfect specificity. The overall consistency observed in the pooled estimate indicates that copeptin is highly accurate in correctly identifying true negatives, thereby reducing the risk of false positive diagnoses.
These findings were confirmed by the AUC providing a value of 0.972 with a 95% confidence interval of 0.952–0.992, underscoring very high diagnostic accuracy due to excellent discriminative power between cases and non-cases (Figure 7). The AUC values across the studies are closely clustered around the pooled estimate, indicating consistent diagnostic performance of copeptin across different populations and study designs. The high pooled AUC value suggests that copeptin is very close to being a perfect test for differential diagnosis among the causes of the polyuria-polydipsia syndrome in pediatric populations, with minimal overlap between true positive and true negative cases.
3.6.1. HSROC Model Results
We performed another meta-analysis using a Hierarchical Summary Receiver Operating Characteristic (HSROC) model to evaluate the diagnostic accuracy of copeptin across the 11 studies, and to obtain a more accurate image of copeptin efficiency that a traditional meta-analysis may not comprise. This model inherently incorporates random effects, which means that it accounts for between-study variability. This aspect is particularly important in diagnostic accuracy assessment where different studies might use different thresholds for defining the positive diagnostic, based on copeptin level. As consequence, the HSROC model accounts for the variability in thresholds and provides a more nuanced summary of the diagnostic accuracy that reflects the variability between studies, even if we obtained a low overall heterogeneity. Using the HSROC model we estimated a logit-transformed sensitivity of 2.7873 and a logit-transformed false positive rate of -2.4335. On the probability scale, this corresponds to an overall sensitivity of 0.942 and specificity of 0.92. These estimates suggest that while the traditional meta-analysis pooled sensitivity of 0.98 (95% CI: 0.936-1.025) and specificity of 0.947 (95% CI: 0.920-0.973) are slightly higher, the HSROC model helps us in understanding the diagnostic accuracy by modelling the relationship between sensitivity and specificity across studies, by providing a SROC curve.
The Summary Receiver Operating Characteristic (SROC) curve obtained by HSROC model (Figure 8) illustrates the relationship between sensitivity and false positive rate, indicating that copeptin generally demonstrates high diagnostic accuracy. However, the curve also suggests that there is some variability in the specificity across studies, highlighting the importance of considering the context in which the test is applied. The SROC reflect the inherent trade-offs between these measures across different studies and thresholds, suggesting that while the overall diagnostic performance of copeptin is high, there is some variability in how sensitivity and specificity are balanced across different clinical settings.
3.6.2. Assessment of Heterogeneity
For heterogeneity assessment a Cochran's Q test was conducted based on the AUC values and the variabilities calculated for each study. The test returned the result of 10.70 with a p-value of 0.3816, suggests that the variation across the studies is not significantly greater than what would be expected by chance. This indicates that the observed heterogeneity is likely due to random variation rather than real differences between the studies. Furthermore, I² statistic turned a value of 6.52%, suggesting that there is low heterogeneity among the studies, being relatively consistent in their findings. These results have been assessed and confirmed using Tau-squared (τ²) with a very small value of 0.000042, which indicates minimal variability and low heterogeneity. Because of the similarity between the studies and a low heterogeneity, we decided to use fixed-effect-model for the meta-analysis.
However, it is important to note that these traditional heterogeneity assessments may not fully capture all aspects of variability across studies, particularly when threshold effects are present. To overpass the assumption made by using fixed-effect-mode that all studies are estimating the same underlying effect size, and does not account for variability between studies, we used HSROC model. Therefore, all possible variations in the thresholds that may be considered in studies for a positive diagnostic result, have been assessed using this model. This aspect is essential especially when is well known the limitations of traditional heterogeneity measures like Cochrane’s Q or I2, that may not fully capture residual heterogeneity. Based on the results of these methods, such as sensitivity of 0.942 and specificity of 0.920 obtained from HSROC model, as well as SROC plot, we confirmed the high diagnostic accuracy of copeptin in diagnosing polyuria-polydipsia syndrome. Through HSROC model we reinforced the findings of the traditional metrics.
3.6.3. Publication Bias Assessment
We constructed a funnel plot (Figure 9) of the Log Odds Ratios against their standard errors to evaluate for the potential of publication bias and did an Egger's regression test. The funnel plot showed some asymmetry, and this was due to the smaller studies, so there probably was some publication bias. Egger's test, however, did not show statistical evidence of this bias with p = 0.716. In the light of these findings, it is believed that even though there are visual cues for publication bias, the practical influence on the inclusively pooled diagnostic accuracy might be low. However, this possible bias has to be taken into account when interpreting the findings, particularly for studies of a smaller size.
3.6.4. Sensitivity Analysis Based on Risk of Bias
This analysis was performed excluding studies with a moderate risk of bias in at least two of the fourth domains assessed by QUADAS 2 tool. Kitamura et al., 2022; Pedrosa et al., 2018; March et al., 2018; and Bonnet et al., 2021 had a moderate risk about either population selection or the reference standard. Subsequently, sensitivity that was pooled became a bit lower at 0.976. The confidence interval, however, from 0.9277-1.0250 remains very similar. The slight decrease in the overall pooled sensitivity would thus reflect that deleting these studies with bias did not appreciably alter the overall sensitivity of copeptin in identifying true cases. The pooled specificity increased slightly to 0.9530 with similar confidence level interval of 0.9242 to 0.9818 after deleting such studies with moderate bias. That means the accuracy of the diagnostic test in correctly identifying true negatives can be said to have insufficient improved following the elimination of biased studies. And the new pooled AUC was 0.974, with a similar CI: 0.9522; 0.9955. The very slight increase in AUC means that after the exclusion of biased studies, overall diagnostic ability did not substantially change. These results were compared against the overall analysis that included all studies. This sensitivity analysis showed that the results were consistent and, therefore, proved that the inclusion of such studies in the meta-analysis did not influence the conclusion.
3.7. Sensitivity of Sub-Group Analysis for Main Diagnostic Methods
In this sensitivity analysis, we aimed to evaluate the consistency of diagnostic accuracy metrics across different diagnostic methods used in the studies reviewed. In this way we could assessed copeptin performance as a diagnostic test among all main diagnostic methods in pediatric patients with polyuria-polydipsia syndrome. Specifically, we analyzed sensitivity, specificity, positive predictive value (PPV), negative predictive value (NPV), positive likelihood ratio (LR+), negative likelihood ratio (LR-), and area under the curve (AUC) for baseline copeptin levels, copeptin after stimulation (hypertonic saline and arginine), and the water deprivation test.
In Group 1 – we included all studies that assessed baseline copeptin levels such as Fenske et al., 2018 and Pedrosa et al., 2018. For Group 2 – we aimed to analyze copeptin after hypertonic saline infusion test, and the relevant studies were Kitamura M et al., 2022, Tuli et al., 2023, March et al., 2024 and Gippert et al., 2023. In Group 3 we included the studies conducted by Winzeler et al., 2019, Binder et al., 2023, and Tuli et al., 2018, as all these studies assess copeptin measurements after arginine stimulation. And in the final group – Group 4 - we addressed water deprivation test including the studies conducted by Bonnet et al., 2021 and Nofal et al., 2023.
All data were evaluated for a normal distribution and the Shapiro-Wilk test concluded that the data is not normally distributed due to smaller sample sizes in some groups. Therefore, we used a non-parametric test – Kruskal-Wallis - for comparing the subgroup since we cannot assume a normal distribution and traditional tests, such as ANOVA, are not applicable in our case.
The Kruskal-Wallis test results indicated for sensitivity H (3) = 4.5 and the p-value of approximately 0.21, for specificity H (3) = 8.3 with a p-value of 0.40 and the results for AUG were H (3) = 5.9 with a p-value of 0.12. All resulted p-values are greater than the common significance level of 0.05, meaning that there were no statistically significant differences between the diagnostic methods for any of the metrics evaluated. This suggests that the diagnostic methods are generally consistent in their performance across the studies.
For further information, to address practical applications of these methods in clinical settings where prevalence may vary, we also assess PPV and NPV, along with LR+ and LR-, which are valuable tools for clinicians making decisions for different diagnostic methods.
Similarly, we applied Kruskal-Wallis test, which turned the following results: for PPV we obtained H (3) = 4.5 with a p-value of 0.021; for NPV the result was H (3) = 6.26 with a p-value of 0.1; for LR+ was H (3) = 5.9 with a p-value of 0.11 and for LR- the test couldn’t be performed accurately due to presence of perfect test values. Based on these results, there are no statistically significant differences in PPV, NPV, and LR+ across the different diagnostic methods. This suggesting that the diagnostic accuracy metrics are consistent in all evaluated studies.
In this subgroup analysis we also want to draw attention to the subtle differences that may not be captured by statistical tests alone. As consequence, especially due to the fact that we used a small samples size for the Kruskal-Wallis test, we assure further assessment of the potential differences in diverse diagnostic methods using visual representations with boxplots of each diagnostic metrics.
The visual inspection of boxplots (Figure 10) provided additional insights. While the statistical test did not reveal significant differences, the boxplots demonstrated some variability in certain metrics, particularly in PPV and specificity. These variations, though not statistically significant, may have clinical relevance, especially in scenarios where slight differences in diagnostic performance could impact patient outcomes.
Sensitivity shows mean values ranging from 0.95 to 1.00, across all diagnostic methods, indicating that these tests are very good at identifying patients who actually have the disease (true positives). This aspect is critical in a clinical setting to ensure that cases are not missed, and an accurate diagnosis is made.
Specificity shows at times some variability, with certain methods like Baseline Copeptin Levels and Water Deprivation Test displaying slightly lower medians (e.g. 0.87 to 0.96). While these methods still very useful, the variability suggests that they may not be as strong at correctly identifying true negatives compared to the other methods. This could potentially lead to increase of the number of false positives in certain clinical scenarios.
PPV varies more widely across all diagnostic methods, particularly for the Hypertonic Saline Infusion and Water Deprivation Test, with median values ranging from 0.429 to 1.000. Therefore, these diagnostic tests might be more susceptible to the underlying prevalence of the disease in the study populations or could be due to differences in how these tests are conducted to the patients, especially in small age children. When the PPV is lower, there’s a higher chance that a positive test result might be a false positive. For all diagnostic methods, the NPV remains very high, with median values approaching 1.00. This means that all tests are very good at ruling out the disease when the test result is negative. Such consistency across methods underscores further the reliability of the methods in these tests for identifying true negatives, even in a clinical setting.
LR+ shows some variability, particularly with Hypertonic Saline and Water Deprivation Test methods having wider ranges (LR+ from 7.00 to 25.00). This variability might suggest differences in how much these methods increase the odds of disease presence when positive. LR- values are generally low across all methods, (ranging from 0.000 to 0.052), which is desirable because lower values indicate that a negative test result effectively reduces the likelihood of disease. Although these methods are generally effective, the variability suggests that they may be more influenced by factors such as patient selection or test administration.
For all diagnostic methods, the AUC values are very high, with medians close to 1.00. This may indicate excellent overall average diagnostic accuracy across diagnostic methods and that all the tests compared in this study are reliable tools to make a diagnosis of polyuria-polydipsia syndrome and its related conditions in a pediatric population. Very small variability could reflect the differences in the robustness of the tests under different conditions.
The observed variations underscore the importance of considering both statistical significance and practical relevance in clinical settings. Although the diagnostic methods appear consistent overall, the visual analysis highlights areas where specific methods may perform differently and evaluate subtle variances that statistics may not cover. This aspect could guide future research and clinical practice. For instance, in spite of the general statistical analysis where all methods are effective, Baseline Copeptin Levels and Copeptin After Arginine Stimulation show the most consistent results across all metrics, even in the visual analysis. This could make them more reliable choices in clinical settings where consistency is critical.
4. Discussion
4.1. Principal Findings:
Although diagnostic of polyuria-polydipsia syndrome has been widely studied in adult patients, we faced a limited number of studies addressing this pathology in children and adolescents. Even if we thoroughly searched several databases after rigorous assessment of the potential suitable studies, we had to exclude a large number of due to the fact that these articles didn’t focus on pediatric patients or were analyzing tests that did not met our interest and objectives. As a result, in our systematic review and meta-analysis we rigorously evaluated the diagnostic accuracy of copeptin measurements, both baseline and post-stimulation, as an alternative to the traditional water deprivation test (WDT) in pediatric patients with polyuria-polydipsia syndrome (PPS).
By analyzing the results from the 11 studies that met out PIT inclusion criteria, we consistently demonstrate that copeptin is a highly effective diagnostic biomarker, with a pooled sensitivity of 0.98 (95% CI: 0.936–1.025), a pooled specificity of 0.947 (95% CI: 0.920–0.973), and an AUC of 0.972 (95% CI: 0.952–0.992), indicating excellent diagnostic accuracy.
Although the heterogeneity assessment proved to be low (Cochran's Q = 10.70, p = 0.382; I² = 6.52%; τ² = 0.000042) and consequently the meta-analysis was based on fixed-effect model, we further assessed all the potential residual variances, due to different thresholds in diagnostic test, by using the HSROC model, in order to reinforce our findings.
The results obtained through this more complex statistical model (logit-transformed sensitivity of 2.7873 and a logit-transformed false positive rate of -2.4335. corresponding to an overall sensitivity of 0.942 and specificity of 0.92), helped us to obtain a more complex dimension of diagnostic accuracy of copeptin. HSROC model helps to deal with interstudy-variability and the differences in how studies are conducted. This allows for a more accurate reflection of the diagnostic test’s performance across different practical contexts, making these results more reliable for clinical decisions. Both statistical approaches confirmed that copeptin is a valuable diagnostic test for accurately establishing the etiologic diagnostic of polyuria-polydipsia syndrome in pediatric patients.
Due to the fact that we recorded high values for sensitivity and specificity, as well as having a limited sample size of studies included, assessing bias was an essential target in our review and meta-analysis, in order to search for all potential factors that could interfere with the interpretation of these results, in terms of diagnostic accuracy and efficacy. Publication bias was assessed using a funnel plot for visual assessment (LOR of the included studies were plotted against their SE), which demonstrated slightly asymmetry especially due to some studies (Fenske et al., 2018, Binder et al., 2023) that have differences in study design or populations. The Egger’s test (p = 0.716) was performed and both methods confirmed there was no publication bias in the selected studies. To ensure that the selected studies classified as having moderate bias in two of the 4 criteria after QUADAS-2 assessment, we performed a sensitivity analysis to evaluate their impact among the total sample of studies. Studies conducted by: Kitamura et al., 2022; Pedrosa et al., 2018; March et al., 2018; and Bonnet et al., 2021, were excluded and the sensitivity analysis’ results were consistent (Sensitivity = 0.976, 95% CI: 0.928–1.025; specificity = 0.953, 95% CI: 0.924–0.982; AUC = 0.974, 95% CI: 0.952–0.996), proving that the inclusion of such studies in the meta-analysis did not influence the outcome.
4.2. Comparison with Previous Studies:
The diagnostic of PPS in pediatric population represents a real challenge for clinicians especially in young children where standard WDT is difficult to be conducted following all the protocol steps. As a result, the findings in this review and meta-analysis align with previous studies in which copeptin testing is a useful alternative diagnostic tool in pediatric population. It is reported that the copeptin levels were not corelated with age, and some thresholds in children are similar to what is so far established in adult population, but these aspects need to be further proven by prospective studies in pediatric population [25]. In fact, differential diagnostic and establishing the form of the polydipsia-polyuria syndrome is a more complex medical-thinking process. For main diagnostic of CDI in children Bonnet et al, and Winzeler et al. reported the use of a copeptin threshold of 3.53 pmol/L having a sensitivity of 100% and a specificity of 87.4%, and copeptin dosing after arginine stimulation test with a cutoff of 3.8 pmol/L with a sensitivity of 93% and a specificity of 92%. These reports are similar to our findings, obtained through statistical sensitivity analysis and visual assessment of boxplots for each diagnostic method, suggesting higher accuracy for the arginine stimulated copeptin test, that achieved better diagnostic metrics in comparison to standard WDT. The NDI is reported with a less frequency in pediatric population (estimated a prevalence in males 8.8: 1.000.000) [26]. For the differentiation of this pathological entity Tuli et al. concluded that the copeptin values >20ymol/L after WDT, are pathognomonic for NDI [21]. Primary polydipsia remains as reported in the literature an important differential diagnosis for children with PPS. In this case the copeptin level measured after hypertonic saline infusion proved to be more accurately and more reliable to differentiate primary polydipsia from central diabetes insipidus (Fenske et al. - Copeptin cutoff > 4.9 pmol/L: sensitivity = 93.2% [95% CI: 83.5–98.1], specificity = 100% [95% CI: 95.5–100.0], AUC = 0.97 [95% CI: 0.93–1.00]) , than the water-deprivation test with or without copeptin measurement.
When discussing further the differential diagnostic of these cases, we should consider other rare causes of PPS, such as systemic autoimmune inflammatory diseases [27,28], Langerhans histiocytosis [29], cerebral tumors [30,31], head trauma associated to syndrome of inappropriate secretion of antidiuretic hormone (SIADH) [32], or other renal impairments [33]. Additionally severe cases of sepsis or multisystemic inflammatory syndrome in children (MIS-C) are associated with ADH secretion abnormalities [34,35,36]. Due to the complex physio pathological processes that involves ADH secretion from the neurohypophysis, have a direct impact on water balance and hydroelectrolitic impairment. Copeptin dosing has been mentioned to be a reliable biomarker in diagnostic of these cases of pediatric septic shock (sensitivity=94%, ROC= 0.960 – Saleh et al. 2023), due to the well described biphasic ADH secretion in early stages of some septic shocks, especially in relation to hyponatremia, and hemodynamic instability [35,37].
In these cases, copeptin is being reported as having important diagnostic implications, which accounts to our results derived from the SROC curve (Figure 8) generated by the HSROC model. The SROC curve shows the plotted sensitivity versus 1-specificity, representing the copeptin test's ability to discriminate between cases and non-cases across different thresholds and different clinical scenarios, such as these differential diagnosis associated with ADH secretion abnormalities.
This review further corroborates the utility of copeptin across diverse pediatric populations and clinical settings, extending its applicability beyond what has been reported in earlier studies. Furthermore, we assessed all main diagnostic methods to bring a new perspective regarding the clinical approach and selection of these test.
4.3. Clinical Implications:
One of the objectives of this review and meta-analysis was to assess the efficiency and diagnostic accuracy of the main diagnostic methods for PPS in children. Therefore, we conducted a sensitivity subgroup analysis for baseline copeptin levels, copeptin after stimulation with hypertonic saline solution or arginine stimulation and the water deprivation test. These statistical results regarding the diagnostic metrics for each method have direct impact and relevance in clinical practice. A non-parametric test - the Kruskal-Wallis test - was used to assess the main metrics for diagnostic accuracy consistency, because the data were not normally distributed, as showed by Shapiro-Wilk test. The Kruskal-Wallis test showed (Sensitivity: H(3) = 4.5, p = 0.21; Specificity: H(3) = 8.3, p = 0.40; AUC: H(3) = 5.9, p = 0.12) no statistical significant difference for any of the diagnostic methods evaluated, in terms of general performance. For further investigate the practical implications of these methods in clinical settings where prevalence may vary in pediatric patients, we also conducted the Kruskal-Wallis test for PPV and NPV, along with LR+ and LR- (PPV: H(3) = 4.5, p = 0.021; NPV: H(3) = 6.26, p = 0.10; LR+: H(3) = 5.9, p = 0.11; LR- irrelevant), proving again no statistical significant difference.
But taking into consideration that the clinical experience in conducting these diagnostic tests may vary on different aspects and situations, we aimed to address the practical applicability of all these methods as thorough as possible. In consequence, we used combined statistical and visual (boxplots) analysis to investigate all differences between these diagnostic tests. The high sensitivity of all methods points out that they are reliable tools to detect PPS. For that reason, they are particularly useful in clinical situations where accurate diagnosis is critical. However, the slight variability in specificity, especially in the level of baseline copeptin levels and the water deprivation test, suggests that clinicians should be cautious and suspicious of false positives, especially in ruling out the condition. The values of PPV ranged, especially for the hypertonic saline infusion and water deprivation test, suggesting that these methods might be more prone to identify false positives in populations with low prevalence of the PPS. However, all methods are high in NPV, thus making them reliable for ruling out PPS, which is important for clinical decision-making. The variability in LR+ indicates that while these tests generally increase the likelihood of diagnosing PPS when positive, the degree to which they do so may vary depending on the test used and the clinical context. The low values of LR- for all these methods confirm its usefulness for unequivocal exclusion of PPS when the test is negative. High AUC values with good reliability of all these methods used indicate that these are valuable diagnostic tools for PPS. However, the observed variability in some metrics, even though not statistically significant, highlights the importance of considering both statistical outcomes and practical clinical relevance when selecting a diagnostic method.
The clinical implications of these findings are significant. The high diagnostic accuracy of copeptin, particularly post-stimulation with arginine, suggests that it can effectively replace WDT in most young children, reducing patient discomfort and improving diagnostic workflows in pediatrics. This is especially relevant in settings where the WDT is impractical or difficult to realize due to clinical impediments to follow the exact protocol, especially in young patients that are suffering from different types of PPS and need to be accurately diagnosed.
4.4. Limitations
Despite the consistent findings, this study has several limitations. The review and meta-analysis were based on a limited number of studies, that could accomplish all the inclusion criteria, in order to select the most reliable ones, for a solid analysis. Although, the comprehensive statistical evaluation of these studies indicated low risk of bias, some concerns and limitations might be considered regarding the differences in patient populations, study design, and copeptin measurement protocols.
Another aspect that could be considered is the retrospective nature of some included studies which could induce some degree of bias, particularly in patients’ selection and reference standard application.
Finally, although copeptin shows consistency in diagnostic accuracy, the different diagnostic tests thresholds emphasis the utility of introducing a standardized testing protocol
5. Conclusion and Future Perspectives
In conclusion, our review supports the general reported evidence that copeptin dosing, especially after stimulation tests, has a significant clinical value, representing a reliable and less invasive diagnostic tool for PPS in pediatric patients. Based on the results obtained in our sensitivity analysis for each of the diagnostic methods assessed, we can sustain that baseline copeptin levels and copeptin after arginine stimulation appear to offer the most consistent diagnostic performance across all metrics. Therefore, these tests have the potential to be more effective choices in clinical situations where consistency and accuracy are paramount. The observed variability in the hypertonic saline and water deprivation tests suggests that further research should be conducted to explore the sources of variability, taking into consideration the complex technical and practical methods that are needed to obtain accurate results for these diagnostic tests, especially in young children. Furthermore, developing future studies to optimize these methods are essential for a broader clinical use, as well as conducting further research regarding post-stimulation copeptin thresholds. The findings encourage the integration of copeptin measurements into clinical pediatric practice on a regular basis, with future research needed for developing a standardized and optimized diagnostic protocols for children with polyuria-polydipsia syndrome.
Author Contributions
For research articles with several authors, a short paragraph specifying their individual contributions must be provided. The following statements should be used “Conceptualization, D.-A.C.; methodology, D.-A.C.; software, D.A.C.; validation, D.-A.C., C.L.P. and G.G.; formal analysis, D.-A.C.; investigation, D.-A.C. and C.L.P.; resources, D.-A.C.; data curation, D.-A.C., C.L.P.; writing—original draft preparation, D.-A.C..; writing—review and editing, D.-A.C., C.L.P. and C.I.V.; visualization, D.-A.C., C.L.P, G.G., L.B.B., C.I.V., S.I.B., M.N.M.; supervision, A.N.; project administration, D.-A.C. and A.N. All authors have read and agreed to the published version of the manuscript.”.
Funding
This research received no external funding.
Institutional Review Board Statement
Not applicable.
Informed Consent Statement
Not applicable.
Data Availability Statement
Not applicable .
Conflicts of Interest
The authors declare no conflict of interest.
Appendix A
The table below outlines the search strategies used for each database in the systematic review. It includes the search strings and any limitations applied to ensure transparency and reproducibility.

Table A1.
- Search Strategy.
| Database | Search String | Limits |
|---|---|---|
| PubMed | (("Polyuria"[Mesh] OR "Polydipsia"[Mesh] OR "Central Diabetes Insipidus"[Mesh] OR "Primary Polydipsia"[Mesh] OR "Nephrogenic Diabetes Insipidus"[Mesh]) AND ("Arginine Vasopressin"[Mesh] OR "C-Terminal Provasopressin"[Mesh] OR "Water Deprivation Test"[Mesh] OR "Desmopressin"[Mesh] OR "Copeptin"[Mesh] OR "Baseline Copeptin" OR "Copeptin Stimulation" OR "Copeptin Test" OR "Saline Infusion Test" OR "Arginine Stimulation") AND ("Child"[Mesh] OR "Adolescent"[Mesh]) AND ("Diagnostic Accuracy" OR "Sensitivity" OR "Specificity" OR "ROC" OR "AUC" OR "Predictive Value")) | Publication date from 2018 to 2024, Humans, Children and Adolescents |
| Cochrane Library | ((Polyuria OR Polydipsia OR "Central Diabetes Insipidus" OR "Primary Polydipsia" OR "Nephrogenic Diabetes Insipidus") AND ("Arginine Vasopressin" OR "C-Terminal Provasopressin" OR "Water Deprivation Test" OR "Desmopressin" OR "Copeptin" OR "Baseline Copeptin" OR "Copeptin Stimulation" OR "Copeptin Test" OR "Saline Infusion Test" OR "Arginine Stimulation") AND (Child OR Adolescent) AND ("Diagnostic Accuracy" OR "Sensitivity" OR "Specificity" OR "ROC" OR "AUC" OR "Predictive Value")) | Publication date from 2018 to 2024, Trials, Reviews |
| Web of Science | (TS=(Polyuria OR Polydipsia OR "Central Diabetes Insipidus" OR "Primary Polydipsia" OR "Nephrogenic Diabetes Insipidus") AND TS=("Arginine Vasopressin" OR "C-Terminal Provasopressin" OR "Water Deprivation Test" OR "Desmopressin" OR "Copeptin" OR "Baseline Copeptin" OR "Copeptin Stimulation" OR "Copeptin Test" OR "Saline Infusion Test" OR "Arginine Stimulation") AND TS=(Child OR Adolescent) AND TS=("Diagnostic Accuracy" OR "Sensitivity" OR "Specificity" OR "ROC" OR "AUC" OR "Predictive Value")) | Timespan: 2018-2024, Indexes: SCI-EXPANDED, SSCI, A&HCI, ESCI |
| ScienceDirect | Search String 1: (Polyuria OR Polydipsia OR "Central Diabetes Insipidus" OR "Primary Polydipsia") AND (Copeptin OR "Arginine Vasopressin'' OR ''Water deprivation test'') AND (Child OR Adolescent)Search String 2: ("Water Deprivation Test" OR Desmopressin OR "Copeptin Stimulation" OR "Saline Infusion Test") AND ("Central Diabetes Insipidus" OR ''Nephrogenic Diabetes Insipidus'' OR "Primary Polydipsia") AND (Child OR Adolescent) | Date: 2018-2024, Article type: Research Articles |
| Scopus | TITLE-ABS-KEY(Polyuria OR Polydipsia OR "Central Diabetes Insipidus" OR "Primary Polydipsia" OR "Nephrogenic Diabetes Insipidus") AND TITLE-ABS-KEY("Arginine Vasopressin" OR "C-Terminal Provasopressin" OR "Water Deprivation Test" OR "Desmopressin" OR "Copeptin" OR "Baseline Copeptin" OR "Copeptin Stimulation" OR "Copeptin Test" OR "Saline Infusion Test" OR "Arginine Stimulation") AND TITLE-ABS-KEY(Child OR Adolescent) AND TITLE-ABS-KEY("Diagnostic Accuracy" OR "Sensitivity" OR "Specificity" OR "ROC" OR "AUC" OR "Predictive Value") | Limits:Date: 2018-2024, Document type: Article; Humans; Child |
| Google Scholar | (Polyuria OR Polydipsia OR "Central Diabetes Insipidus" OR ‘’ Nephrogenic Diabetes Insipidus’’ OR "Primary Polydipsia") AND (Copeptin OR "Arginine Vasopressin" OR "Water deprivation test") AND (Child OR Adolescent) AND (Diagnosis OR "Diagnostic Accuracy" OR Sensitivity OR Specificity OR "ROC Curve") -treatment -meta-analysis -case-report | Date: 2018-2024 |
Appendix B. Independent Read and Assessment of Quality Using QUADAS-2
Independent Assessment: In each review, two reviewers independently assessed the risk of bias and applicability using the QUADAS-2 tool. Any disagreement was then resolved through discussion or consultation with a third reviewer to reach an agreement.
Data Extraction Forms: The data extraction forms were piloted on a few studies in order to iron out consistency and clarity. Extracted data included items on study design, patient demographics, details of the index test and reference standard, and measures of diagnostic accuracy. This allowed for data extraction in all studies reviewed for the overview to be systematic and comprehensive.
QUADAS-2 tool domains: The QUADAS-2 tool was run against these studies with respect to four key domains, including:.
Patient Selection: The review looked at how participants were selected and the appropriateness of the selection criteria in projecting the possibility of selection bias. Common sources of bias were seen to come from retrospective study designs and small populations.
Index Test: The focus was on the diagnostic test being studied, carried out and interpreted; in particular, whether investigators applied the reference standard blind. There were variable methods of copeptin measurement and stimulation protocols across studies.
Reference Standard: This domain examines the validity and applicability of the reference standard that was used to classify subjects with regard to the target condition. The reliability of standards such as WDT and plasma arginine-vasopressin analysis were generally well supported, although some studies varied in its application. In some cases, the reference standard was based on expert opinion without additional objective measures which could introduce some subjectivity, or was based on clinical judgment without blinding, which also could induce bias.
Flow and Timing. In the methodology assessment it was examined whether investigations had been carried out into appropriate timing between index test and reference standard. Retrospective study designs often yield variability in timing, while prospective designs very rarely are. Timing was usually adequate across studies; however, because of variability in timing between the index test and the reference standard in retrospective studies, the results of some of these studies may not generalize as well to clinical practice.
Quality Assessment Findings: Results relating to the risk of bias and concerns relating to the appraisal of applicability are summarized in one structured table (Appendix C), pointing out areas of potential bias and issues with respect to generalizability, as well as graphic representation using “traffic light” plots (Figure 1) of the domain-level judgements for each individual study, created using ROBVIS tool.
Sensitivity Analysis: A sensitivity analysis was undertaken to assess the contribution of studies with medium risk of bias in the overall results. It showed that exclusion of studies with noticeable bias did not materially alter the overall findings, thus supporting the fact that conclusions of this review are robust despite identified risks of bias.
Applicability Issues: Patient selection: The studies did differ in age range, with most of them targeting the pediatric population. Nevertheless, some of the studies included adults and pediatric patients; therefore, generalization of results to a pediatric population may be diminished.
Index test conduct: Possible differences in the performance characteristics of copeptin measurement may, in particular, bear on modes of stimulation that affect its generalizability. Thus, standardization of test procedures is suggested to perform better comparability in further studies.
Reference Standard: In general, the test protocols were consistent and reliable. The application of expert judgement without blinding is likely to influence study comparability. Future studies should strive toward greater consistency in applying reference standards to enhance the reliability of pooled analyses.
Flow and Timing: While generally appropriate, the retrospective design of some studies probably introduced potential variability in the timing of index tests and reference standards for some studies, which is a factor that may affect the applicability of these findings to routine clinical practice. For this reason, future studies should establish the timing in a way that delineates consistency so that results are more reliable and applicable.
Appendix C
Table A2.
- QUADAS-2 Assessment Summary.
| Study | Patient Selection (Risk of Bias) | Index Test (Risk of Bias) | Reference Standard (Risk of Bias) | Flow and Timing (Risk of Bias) | Overall Summary of Bias | Observations |
|---|---|---|---|---|---|---|
| 1. Fenske et al. 2018 | Low (some concerns on applicability) | Low | Low (minor subjectivity) | Low | Low overall risk | The study involved patients from tertiary centers, which may not represent the general population. |
| 2. Kitamura et al. 2022 | Moderate (retrospective, single-center) | Low to Moderate (potential blinding issues) | Moderate (expert consensus) | Low | Moderate overall risk | Retrospective design and single-center setting increase the selection bias; possible lack of blinding. |
| 3. Tuli et al. 2023 | Low | Low | Low | Low | Low overall risk | Prospective design with a well-defined patient population, reducing bias. |
| 4. Winzeler et al. 2019 | Low (concerns about applicability to pediatric) | Low | Low to Moderate (subjectivity) | Low | Low overall risk | The study is focused on adults, limiting applicability to pediatric populations. |
| 5. Binder et al. 2023 | Low | Low | Low | Low | Low overall risk | Clear protocol and prospective design contribute to low bias across domains. |
| 6. Pedrosa et al. 2018 | Moderate (retrospective, single-center) | Low | Moderate (subjectivity) | Low | Moderate overall risk | Retrospective design and reliance on expert opinion without blinding introduce moderate bias. |
| 7. Tuli et al. 2018 | Low | Low | Moderate (subjectivity) | Low | Low overall risk | Prospective study with rigorous methods, though expert consensus introduces some subjectivity. |
| 8. March et al. 2018 | Low to Moderate (single-center setting) | Low | Moderate (subjectivity) | Low | Low to Moderate overall risk | Single-center design may affect generalizability, and expert consensus introduces subjectivity. |
| 9. Nofal et al. 2023 | Low | Low | Moderate (subjectivity) | Low | Low overall risk | Multicenter design reduces selection bias, but expert consensus may introduce some subjectivity. |
| 10. Gippert et al. 2023 | Low | Low | Moderate (subjectivity) | Low | Low overall risk | Consistent methods across centers, though reliance on expert consensus introduces moderate bias. |
| 11. Bonnet et al. 2024 | Low to Moderate (single-center setting) | Low | Moderate (subjectivity) | Low | Low to Moderate overall risk | Single-center design could limit generalizability; expert consensus introduces moderate bias. |
References
- Gubbi S, H.-S. F. K. C. et al. Diagnostic Testing for Diabetes Insipidus. [Updated 2022 Nov 28]. . Endotext. https://www.ncbi.nlm.nih.gov/books/NBK537591/ (accessed 2024-03-28).
- Yoshimura, M.; Conway-Campbell, B.; Ueta, Y. Arginine Vasopressin: Direct and Indirect Action on Metabolism. Peptides (N.Y.) 2021, 142, 170555. [Google Scholar] [CrossRef] [PubMed]
- Fenske, W.; Quinkler, M.; Lorenz, D.; Zopf, K.; Haagen, U.; Papassotiriou, J.; Pfeiffer, A. F. H.; Fassnacht, M.; Störk, S.; Allolio, B. Copeptin in the Differential Diagnosis of the Polydipsia-Polyuria Syndrome—Revisiting the Direct and Indirect Water Deprivation Tests. J Clin Endocrinol Metab 2011, 96, 1506–1515. [Google Scholar] [CrossRef] [PubMed]
- Fenske, W.; Refardt, J.; Chifu, I.; Schnyder, I.; Winzeler, B.; Drummond, J.; Ribeiro-Oliveira, A.; Drescher, T.; Bilz, S.; Vogt, D. R.; Malzahn, U.; Kroiss, M.; Christ, E.; Henzen, C.; Fischli, S.; Tönjes, A.; Mueller, B.; Schopohl, J.; Flitsch, J.; Brabant, G.; Fassnacht, M.; Christ-Crain, M. A Copeptin-Based Approach in the Diagnosis of Diabetes Insipidus. New England Journal of Medicine 2018, 379, 428–439. [Google Scholar] [CrossRef] [PubMed]
- Driano, J. E.; Lteif, A. N.; Creo, A. L. Vasopressin-Dependent Disorders: What Is New in Children? Pediatrics 2021, 147. [Google Scholar] [CrossRef]
- Mu, D.; Ma, Y.; Cheng, J.; Qiu, L.; Chen, S.; Cheng, X. Diagnostic Accuracy of Copeptin in the Differential Diagnosis of Patients With Diabetes Insipidus: A Systematic Review and Meta-Analysis. Endocrine Practice 2023, 29, 644–652. [Google Scholar] [CrossRef]
- Deeks JJ; Bossuyt PM; Leeflang MM, T.; akwoingi Y. Chapter PDFs of the Cochrane Handbook for Systematic Reviews of Diagnostic Test Accuracy (v2.0) | Cochrane Training. https://training.cochrane.org/handbook-diagnostic-test-accuracy/current (accessed 2024-08-02).
- McInnes, M. D. F.; Moher, D.; Thombs, B. D.; McGrath, T. A.; Bossuyt, P. M.; Clifford, T.; Cohen, J. F.; Deeks, J. J.; Gatsonis, C.; Hooft, L.; Hunt, H. A.; Hyde, C. J.; Korevaar, D. A.; Leeflang, M. M. G.; Macaskill, P.; Reitsma, J. B.; Rodin, R.; Rutjes, A. W. S.; Salameh, J. P.; Stevens, A.; Takwoingi, Y.; Tonelli, M.; Weeks, L.; Whiting, P.; Willis, B. H. Preferred Reporting Items for a Systematic Review and Meta-Analysis of Diagnostic Test Accuracy Studies The PRISMA-DTA Statement. JAMA - Journal of the American Medical Association 2018, 319, 388–396. [Google Scholar] [CrossRef]
- Salameh, J.-P.; Bossuyt, P. M.; McGrath, T. A.; Thombs, B. D.; Hyde, C. J.; Macaskill, P.; Deeks, J. J.; Leeflang, M.; Korevaar, D. A.; Whiting, P.; Takwoingi, Y.; Reitsma, J. B.; Cohen, J. F.; Frank, R. A.; Hunt, H. A.; Hooft, L.; Rutjes, A. W. S.; Willis, B. H.; Gatsonis, C.; Levis, B.; Moher, D.; McInnes, M. D. F. Preferred Reporting Items for Systematic Review and Meta-Analysis of Diagnostic Test Accuracy Studies (PRISMA-DTA): Explanation, Elaboration, and Checklist. BMJ 2020, m2632. [Google Scholar] [CrossRef]
- Fenske, W.; Refardt, J.; Chifu, I.; Schnyder, I.; Winzeler, B.; Drummond, J.; Ribeiro-Oliveira, A.; Drescher, T.; Bilz, S.; Vogt, D. R.; Malzahn, U.; Kroiss, M.; Christ, E.; Henzen, C.; Fischli, S.; Tönjes, A.; Mueller, B.; Schopohl, J.; Flitsch, J.; Brabant, G.; Fassnacht, M.; Christ-Crain, M. A Copeptin-Based Approach in the Diagnosis of Diabetes Insipidus. New England Journal of Medicine 2018, 379, 428–439. [Google Scholar] [CrossRef]
- Page, M. J.; McKenzie, J. E.; Bossuyt, P. M.; Boutron, I.; Hoffmann, T. C.; Mulrow, C. D.; Shamseer, L.; Tetzlaff, J. M.; Akl, E. A.; Brennan, S. E.; Chou, R.; Glanville, J.; Grimshaw, J. M.; Hróbjartsson, A.; Lalu, M. M.; Li, T.; Loder, E. W.; Mayo-Wilson, E.; McDonald, S.; McGuinness, L. A.; Stewart, L. A.; Thomas, J.; Tricco, A. C.; Welch, V. A.; Whiting, P.; Moher, D. The PRISMA 2020 Statement: An Updated Guideline for Reporting Systematic Reviews. BMJ 2021, n71. [Google Scholar] [CrossRef]
- McInnes, M. D. F.; Moher, D.; Thombs, B. D.; McGrath, T. A.; Bossuyt, P. M.; Clifford, T.; Cohen, J. F.; Deeks, J. J.; Gatsonis, C.; Hooft, L.; Hunt, H. A.; Hyde, C. J.; Korevaar, D. A.; Leeflang, M. M. G.; Macaskill, P.; Reitsma, J. B.; Rodin, R.; Rutjes, A. W. S.; Salameh, J.-P.; Stevens, A.; Takwoingi, Y.; Tonelli, M.; Weeks, L.; Whiting, P.; Willis, B. H. Preferred Reporting Items for a Systematic Review and Meta-Analysis of Diagnostic Test Accuracy Studies. JAMA 2018, 319. [Google Scholar] [CrossRef]
- Rethlefsen, M. L.; Kirtley, S.; Waffenschmidt, S.; Ayala, A. P.; Moher, D.; Page, M. J.; Koffel, J. B.; Blunt, H.; Brigham, T.; Chang, S.; Clark, J.; Conway, A.; Couban, R.; de Kock, S.; Farrah, K.; Fehrmann, P.; Foster, M.; Fowler, S. A.; Glanville, J.; Harris, E.; Hoffecker, L.; Isojarvi, J.; Kaunelis, D.; Ket, H.; Levay, P.; Lyon, J.; McGowan, J.; Murad, M. H.; Nicholson, J.; Pannabecker, V.; Paynter, R.; Pinotti, R.; Ross-White, A.; Sampson, M.; Shields, T.; Stevens, A.; Sutton, A.; Weinfurter, E.; Wright, K.; Young, S. PRISMA-S: An Extension to the PRISMA Statement for Reporting Literature Searches in Systematic Reviews. Syst Rev 2021, 10. [Google Scholar] [CrossRef] [PubMed]
- Timper, K.; Fenske, W.; Kühn, F.; Frech, N.; Arici, B.; Rutishauser, J.; Kopp, P.; Allolio, B.; Stettler, C.; Müller, B.; Katan, M.; Christ-Crain, M. Diagnostic Accuracy of Copeptin in the Differential Diagnosis of the Polyuria-Polydipsia Syndrome: A Prospective Multicenter Study. J Clin Endocrinol Metab 2015, 100, 2268–2274. [Google Scholar] [CrossRef] [PubMed]
- Haddaway, N. R.; Page, M. J.; Pritchard, C. C.; McGuinness, L. A. PRISMA2020: An R Package and Shiny App for Producing PRISMA 2020-compliant Flow Diagrams, with Interactivity for Optimised Digital Transparency and Open Synthesis. Campbell Systematic Reviews 2022, 18. [Google Scholar] [CrossRef] [PubMed]
- Kitamura, M.; Nishioka, J.; Matsumoto, T.; Umino, S.; Kawano, A.; Saiki, R.; Tanaka, Y.; Yatsuga, S. Estimate Incidence and Predictive Factors of Pediatric Central Diabetes Insipidus in a Single-Institute Study. Endocrine and Metabolic Science 2022, 7–8, 100119. [Google Scholar] [CrossRef]
- Tuli, G.; Munarin, J.; De Sanctis, L. The Diagnostic Role of Arginine-Stimulated Copeptin in the Differential Diagnosis of Polyuria-Polydipsia Syndrome (PPS) in Pediatric Age. Endocrine 2023, 84, 677–682. [Google Scholar] [CrossRef]
- Winzeler, B.; Cesana-Nigro, N.; Refardt, J.; Vogt, D. R.; Imber, C.; Morin, B.; Popovic, M.; Steinmetz, M.; Sailer, C. O.; Szinnai, G.; Chifu, I.; Fassnacht, M.; Christ-Crain, M. Arginine-Stimulated Copeptin Measurements in the Differential Diagnosis of Diabetes Insipidus: A Prospective Diagnostic Study. The Lancet 2019, 394, 587–595. [Google Scholar] [CrossRef]
- Binder, G.; Weber, K.; Peter, A.; Schweizer, R. Arginine-stimulated Copeptin in Children and Adolescents. Clin Endocrinol (Oxf) 2023, 98, 548–553. [Google Scholar] [CrossRef]
- Pedrosa, W.; Drummond, J. B.; Soares, B. S.; Ribeiro-Oliveira, A. A Combined Outpatient and Inpatient Overnight Water Deprivation Test Is Effective and Safe in Diagnosing Patients with Polyuria-Polydipsia Syndrome. Endocrine Practice 2018, 24, 963–972. [Google Scholar] [CrossRef]
- Tuli, G.; Tessaris, D.; Einaudi, S.; Matarazzo, P.; De Sanctis, L. Copeptin Role in Polyuria-polydipsia Syndrome Differential Diagnosis and Reference Range in Paediatric Age. Clin Endocrinol (Oxf) 2018, 88, 873–879. [Google Scholar] [CrossRef]
- March, C. A.; Sastry, S.; McPhaul, M. J.; Wheeler, S. E.; Garibaldi, L. Copeptin Stimulation by Combined Intravenous Arginine and Oral LevoDopa/Carbidopa in Healthy Short Children and Children with the Polyuria-Polydipsia Syndrome. Horm Res Paediatr 2024, 1–11. [Google Scholar] [CrossRef]
- Al Nofal, A.; Hanna, C.; Lteif, A. N.; Pittock, S. T.; Schwartz, J. D.; Brumbaugh, J. E.; Creo, A. L. Copeptin Levels in Hospitalized Infants and Children with Suspected Vasopressin-Dependent Disorders: A Case Series. Journal of Pediatric Endocrinology and Metabolism 2023, 36, 492–499. [Google Scholar] [CrossRef] [PubMed]
- Gippert, S.; Brune, M.; Dirksen, R. L.; Choukair, D.; Bettendorf, M. Arginine-Stimulated Copeptin-Based Diagnosis of Central Diabetes Insipidus in Children and Adolescents. Horm Res Paediatr 2024, 97, 270–278. [Google Scholar] [CrossRef] [PubMed]
- Bonnet, L.; Marquant, E.; Fromonot, J.; Hamouda, I.; Berbis, J.; Godefroy, A.; Vierge, M.; Tsimaratos, M.; Reynaud, R. Copeptin Assays in Children for the Differential Diagnosis of Polyuria-polydipsia Syndrome and Reference Levels in Hospitalized Children. Clin Endocrinol (Oxf) 2022, 96, 47–53. [Google Scholar] [CrossRef] [PubMed]
- D’Alessandri-Silva, C.; Carpenter, M.; Ayoob, R.; Barcia, J.; Chishti, A.; Constantinescu, A.; Dell, K. M.; Goodwin, J.; Hashmat, S.; Iragorri, S.; Kaspar, C.; Mason, S.; Misurac, J. M.; Muff-Luett, M.; Sethna, C.; Shah, S.; Weng, P.; Greenbaum, L. A.; Mahan, J. D. Diagnosis, Treatment, and Outcomes in Children With Congenital Nephrogenic Diabetes Insipidus: A Pediatric Nephrology Research Consortium Study. Front Pediatr 2020, 7. [Google Scholar] [CrossRef] [PubMed]
- Loredana Petrea, C.; Ciortea, D.-A.; Miulescu, M.; Candussi, I.-L.; Chirila, S. I.; Isabela, G.; Răut, V. (; Berghes, S.-E.; Râs, M. C.; Berbece, S. I. A New Case of Paediatric Systemic Lupus Erythematosus with Onset after SARS-CoV-2 and Epstein-Barr Infection-A Case Report and Literature Review. 2024. [CrossRef]
- Serbis, A.; Rallis, D.; Giapros, V.; Galli-Tsinopoulou, A.; Siomou, E. Wolfram Syndrome 1: A Pediatrician’s and Pediatric Endocrinologist’s Perspective. Int J Mol Sci 2023, 24. [Google Scholar] [CrossRef]
- Sagna, Y.; Courtillot, C.; Drabo, J. Y.; Tazi, A.; Donadieu, J.; Idbaih, A.; Cohen, F.; Amoura, Z.; Haroche, J.; Touraine, P. Endocrine Manifestations in a Cohort of 63 Adulthood and Childhood Onset Patients with Langerhans Cell Histiocytosis. Eur J Endocrinol 2019, 181, 275–285. [Google Scholar] [CrossRef]
- Claude, F.; Ubertini, G.; Szinnai, G. Endocrine Disorders in Children with Brain Tumors: At Diagnosis, after Surgery, Radiotherapy and Chemotherapy. Children (Basel) 2022, 9. [Google Scholar] [CrossRef]
- Christ-Crain, M.; Gaisl, O. Diabetes Insipidus. Presse Medicale. Elsevier Masson s.r.l. December 1, 2021. [CrossRef]
- Gionis, D.; Ilias, I.; Moustaki, M.; Mantzos, E.; Papadatos, I.; Koutras, D. A.; Mastorakos, G. Hypothalamic-Pituitary-Adrenal Axis and Interleukin-6 Activity in Children with Head Trauma and Syndrome of Inappropriate Secretion of Antidiuretic Hormone. J Pediatr Endocrinol Metab 2003, 16, 49–54. [Google Scholar] [CrossRef]
- Bockenhauer, D.; van’t Hoff, W.; Dattani, M.; Lehnhardt, A.; Subtirelu, M.; Hildebrandt, F.; Bichet, D. G. Secondary Nephrogenic Diabetes Insipidus as a Complication of Inherited Renal Diseases. Nephron Physiol 2010, 116, p23–p29. [Google Scholar] [CrossRef]
- Nakra, N. A.; Blumberg, D. A.; Herrera-Guerra, A.; Lakshminrusimha, S. Multi-System Inflammatory Syndrome in Children (MIS-C) Following SARS-CoV-2 Infection: Review of Clinical Presentation, Hypothetical Pathogenesis, and Proposed Management. Children (Basel) 2020, 7. [Google Scholar] [CrossRef]
- Saleh, N. Y.; Aboelghar, H. M.; Garib, M. I.; Rizk, M. S.; Mahmoud, A. A. Pediatric Sepsis Diagnostic and Prognostic Biomarkers: Pancreatic Stone Protein, Copeptin, and Apolipoprotein A-V. Pediatr Res 2023, 94, 668–675. [Google Scholar] [CrossRef] [PubMed]
- Mills, T.; Trivedi, A.; Tremoulet, A. H.; Hershey, D.; Burns, J. C. Hyponatremia in Patients With Multisystem Inflammatory Syndrome in Children. Pediatr Infect Dis J 2021, 40, e344–e346. [Google Scholar] [CrossRef] [PubMed]
- Choong, K. Vasopressin in Pediatric Critical Care. J Pediatr Intensive Care 2016, 05, 182–188. [Google Scholar] [CrossRef] [PubMed]
Figure 1.
QUADAS-2 Assessment.
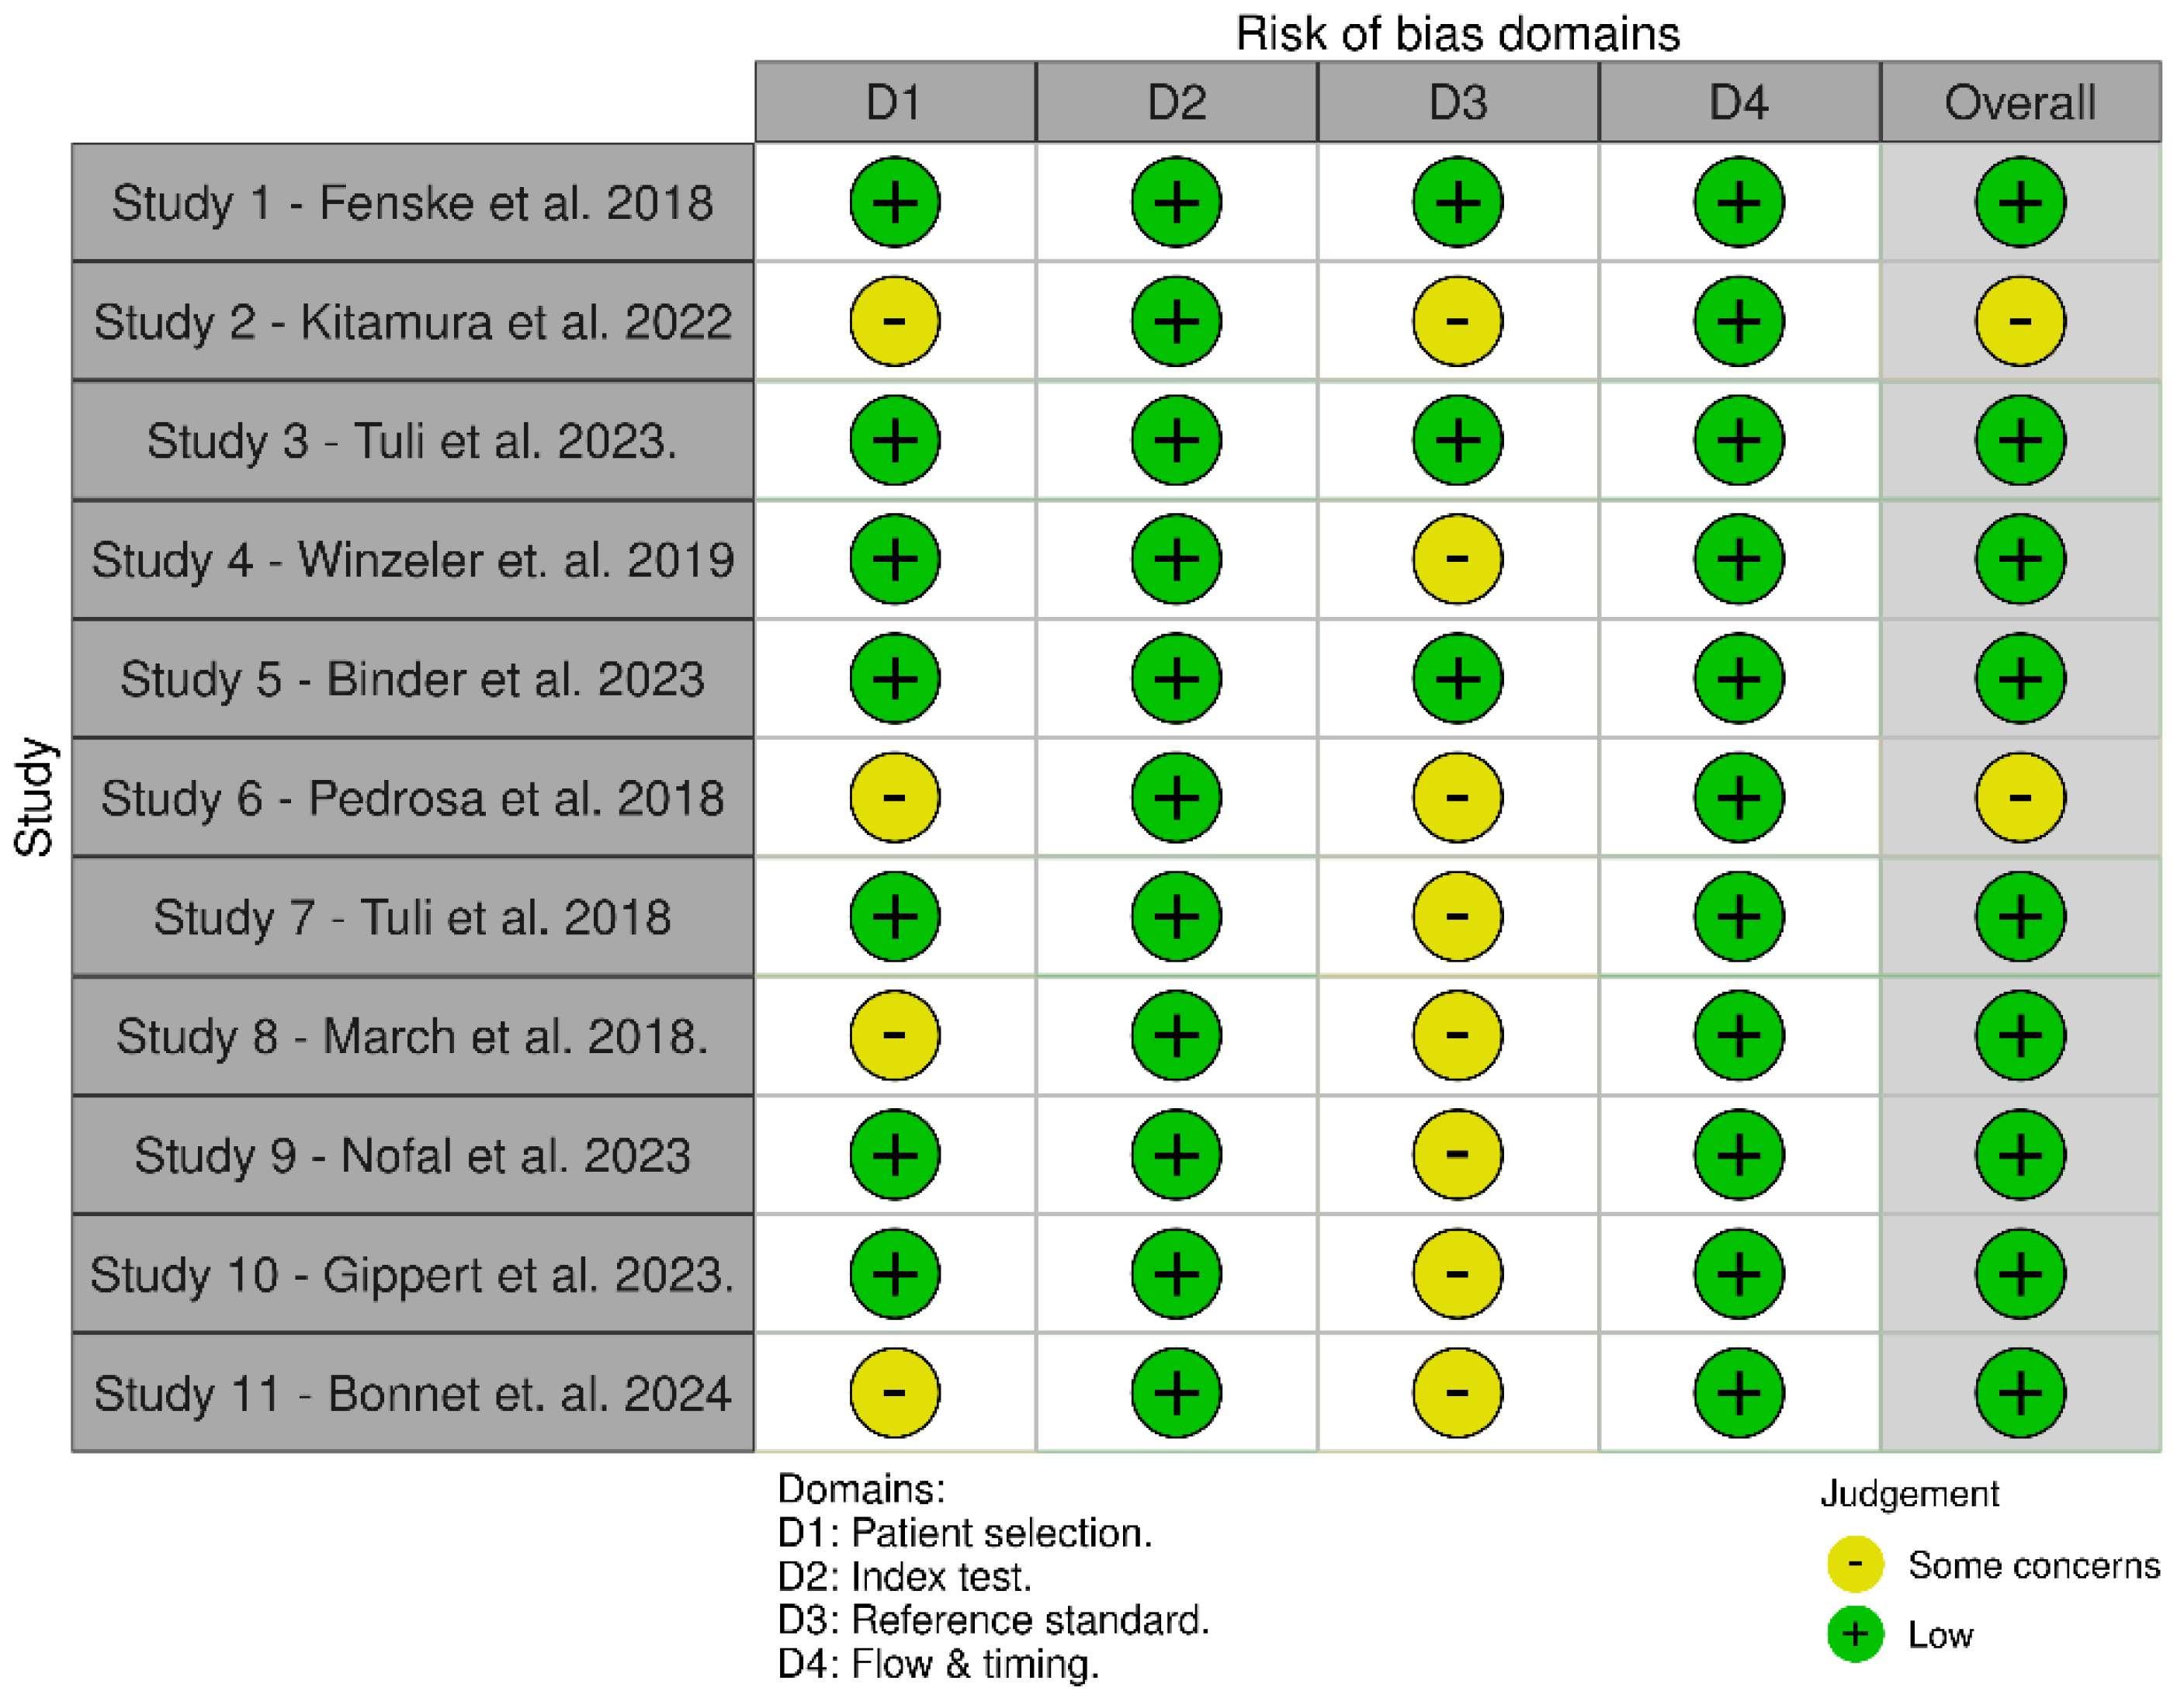
Figure 2.
Forest plot of Sensitivity - illustrating the sensitivity of copeptin across 11 studies. The pooled sensitivity is 0.96, indicating high diagnostic accuracy in identifying true positive cases.
Figure 2.
Forest plot of Sensitivity - illustrating the sensitivity of copeptin across 11 studies. The pooled sensitivity is 0.96, indicating high diagnostic accuracy in identifying true positive cases.
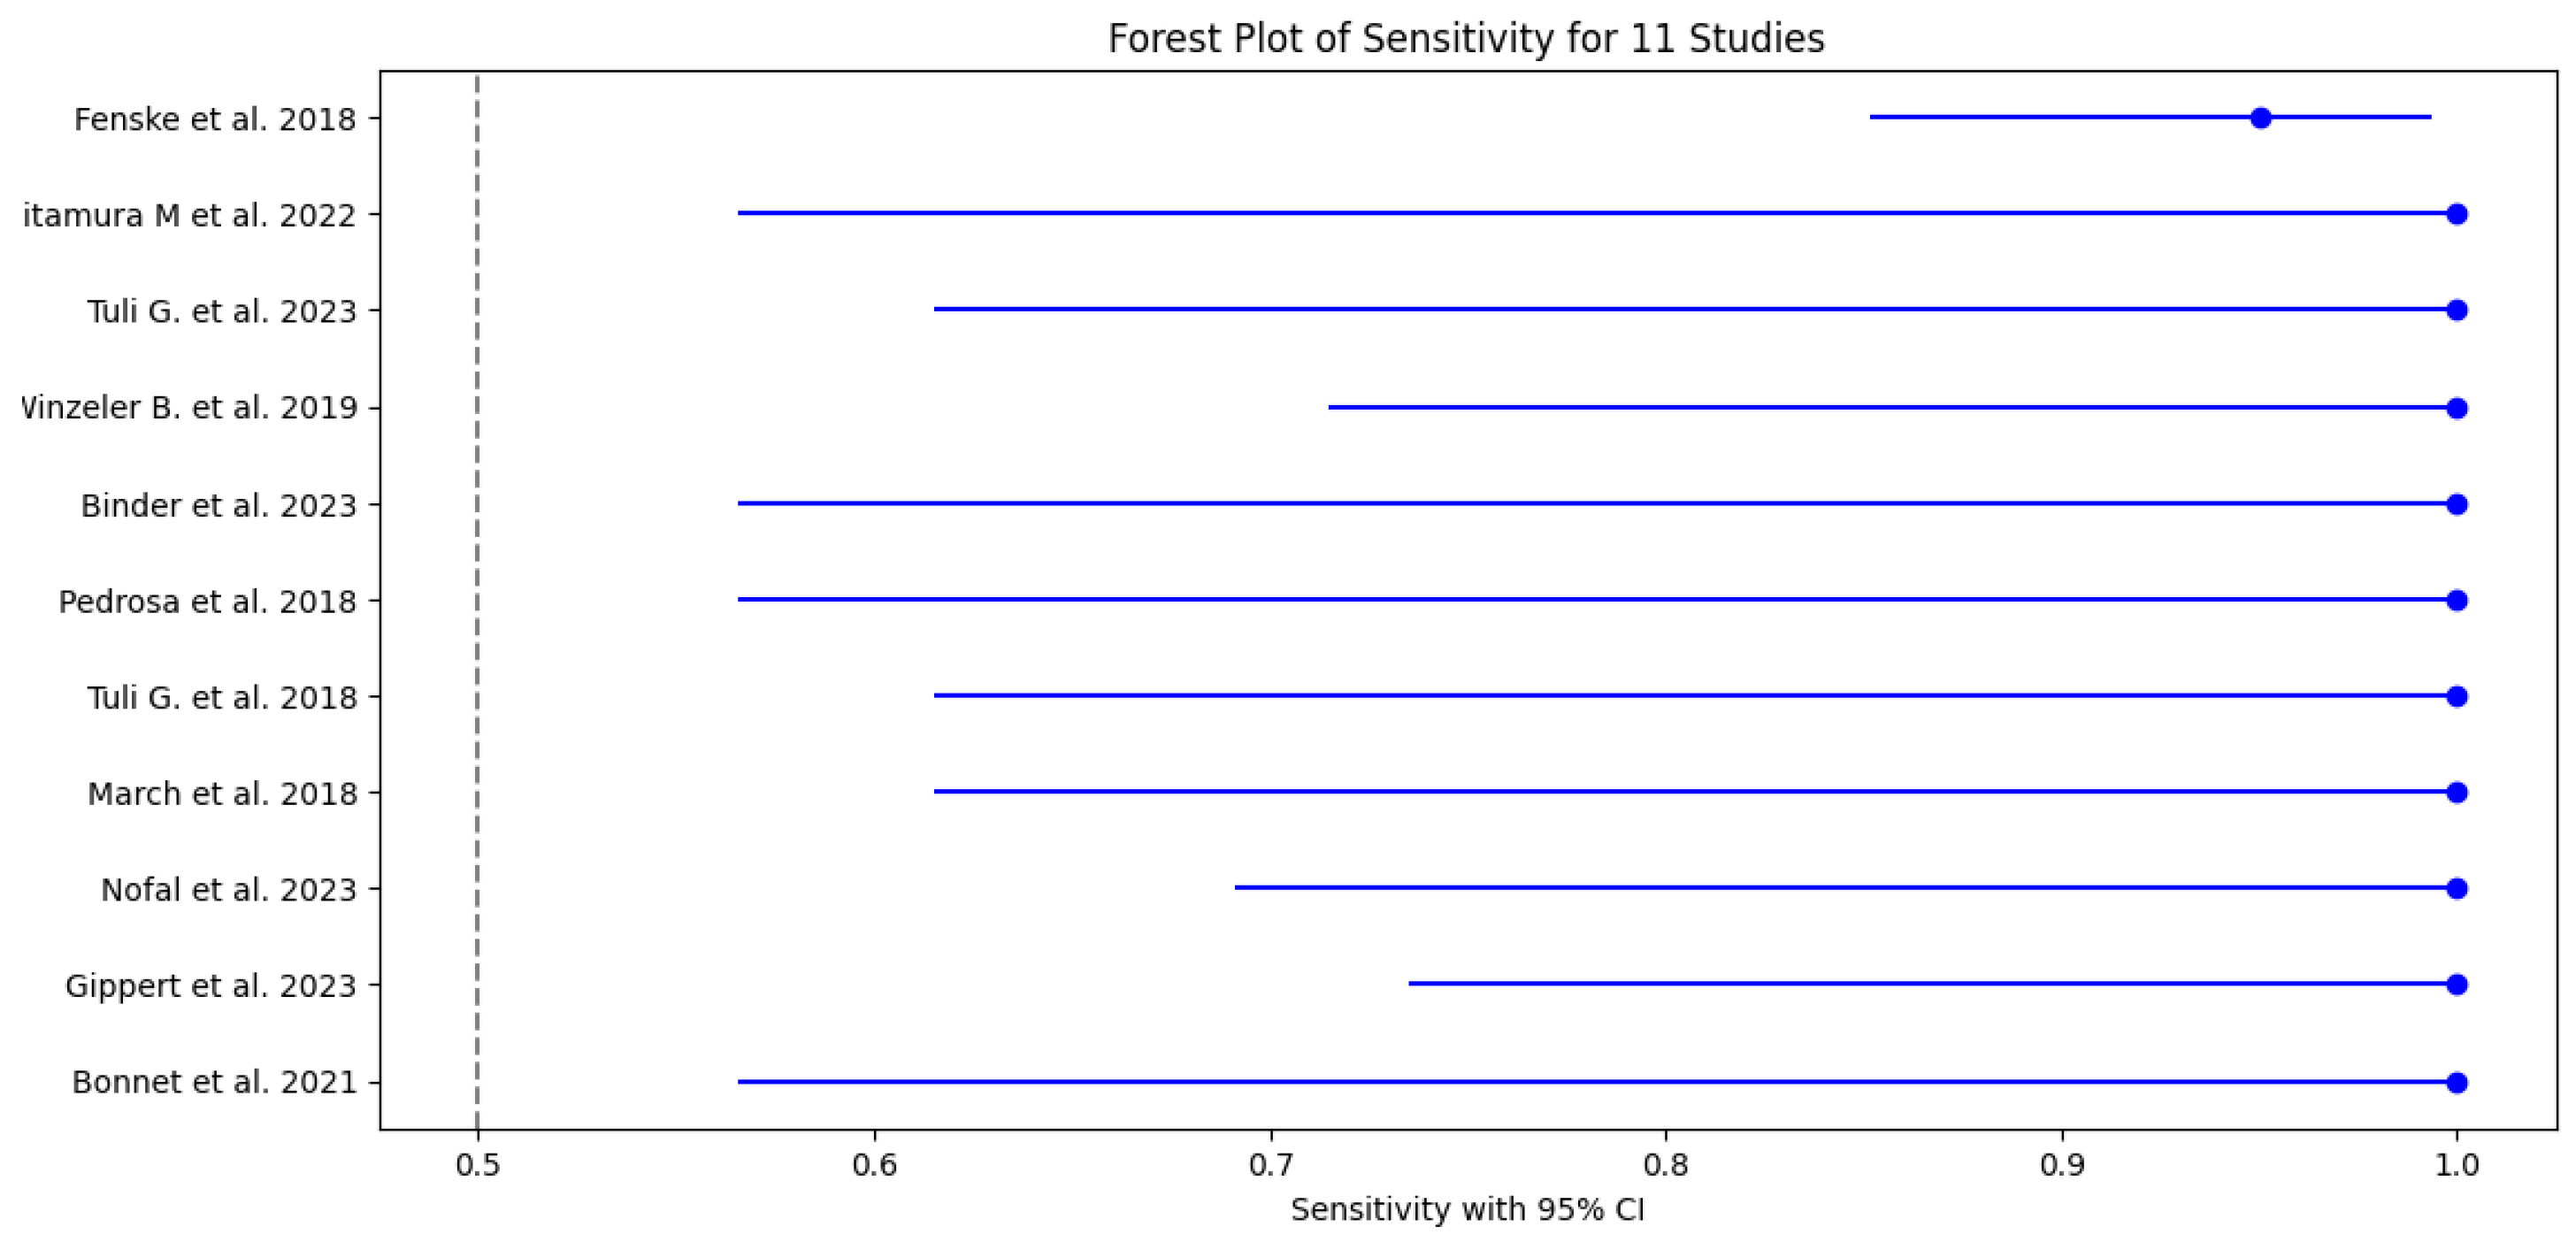
Figure 3.
Forest plot of Specificity - showing the specificity of copeptin across 11 studies. The pooled specificity is 0.95, demonstrating strong diagnostic capability in correctly identifying true negative cases.
Figure 3.
Forest plot of Specificity - showing the specificity of copeptin across 11 studies. The pooled specificity is 0.95, demonstrating strong diagnostic capability in correctly identifying true negative cases.
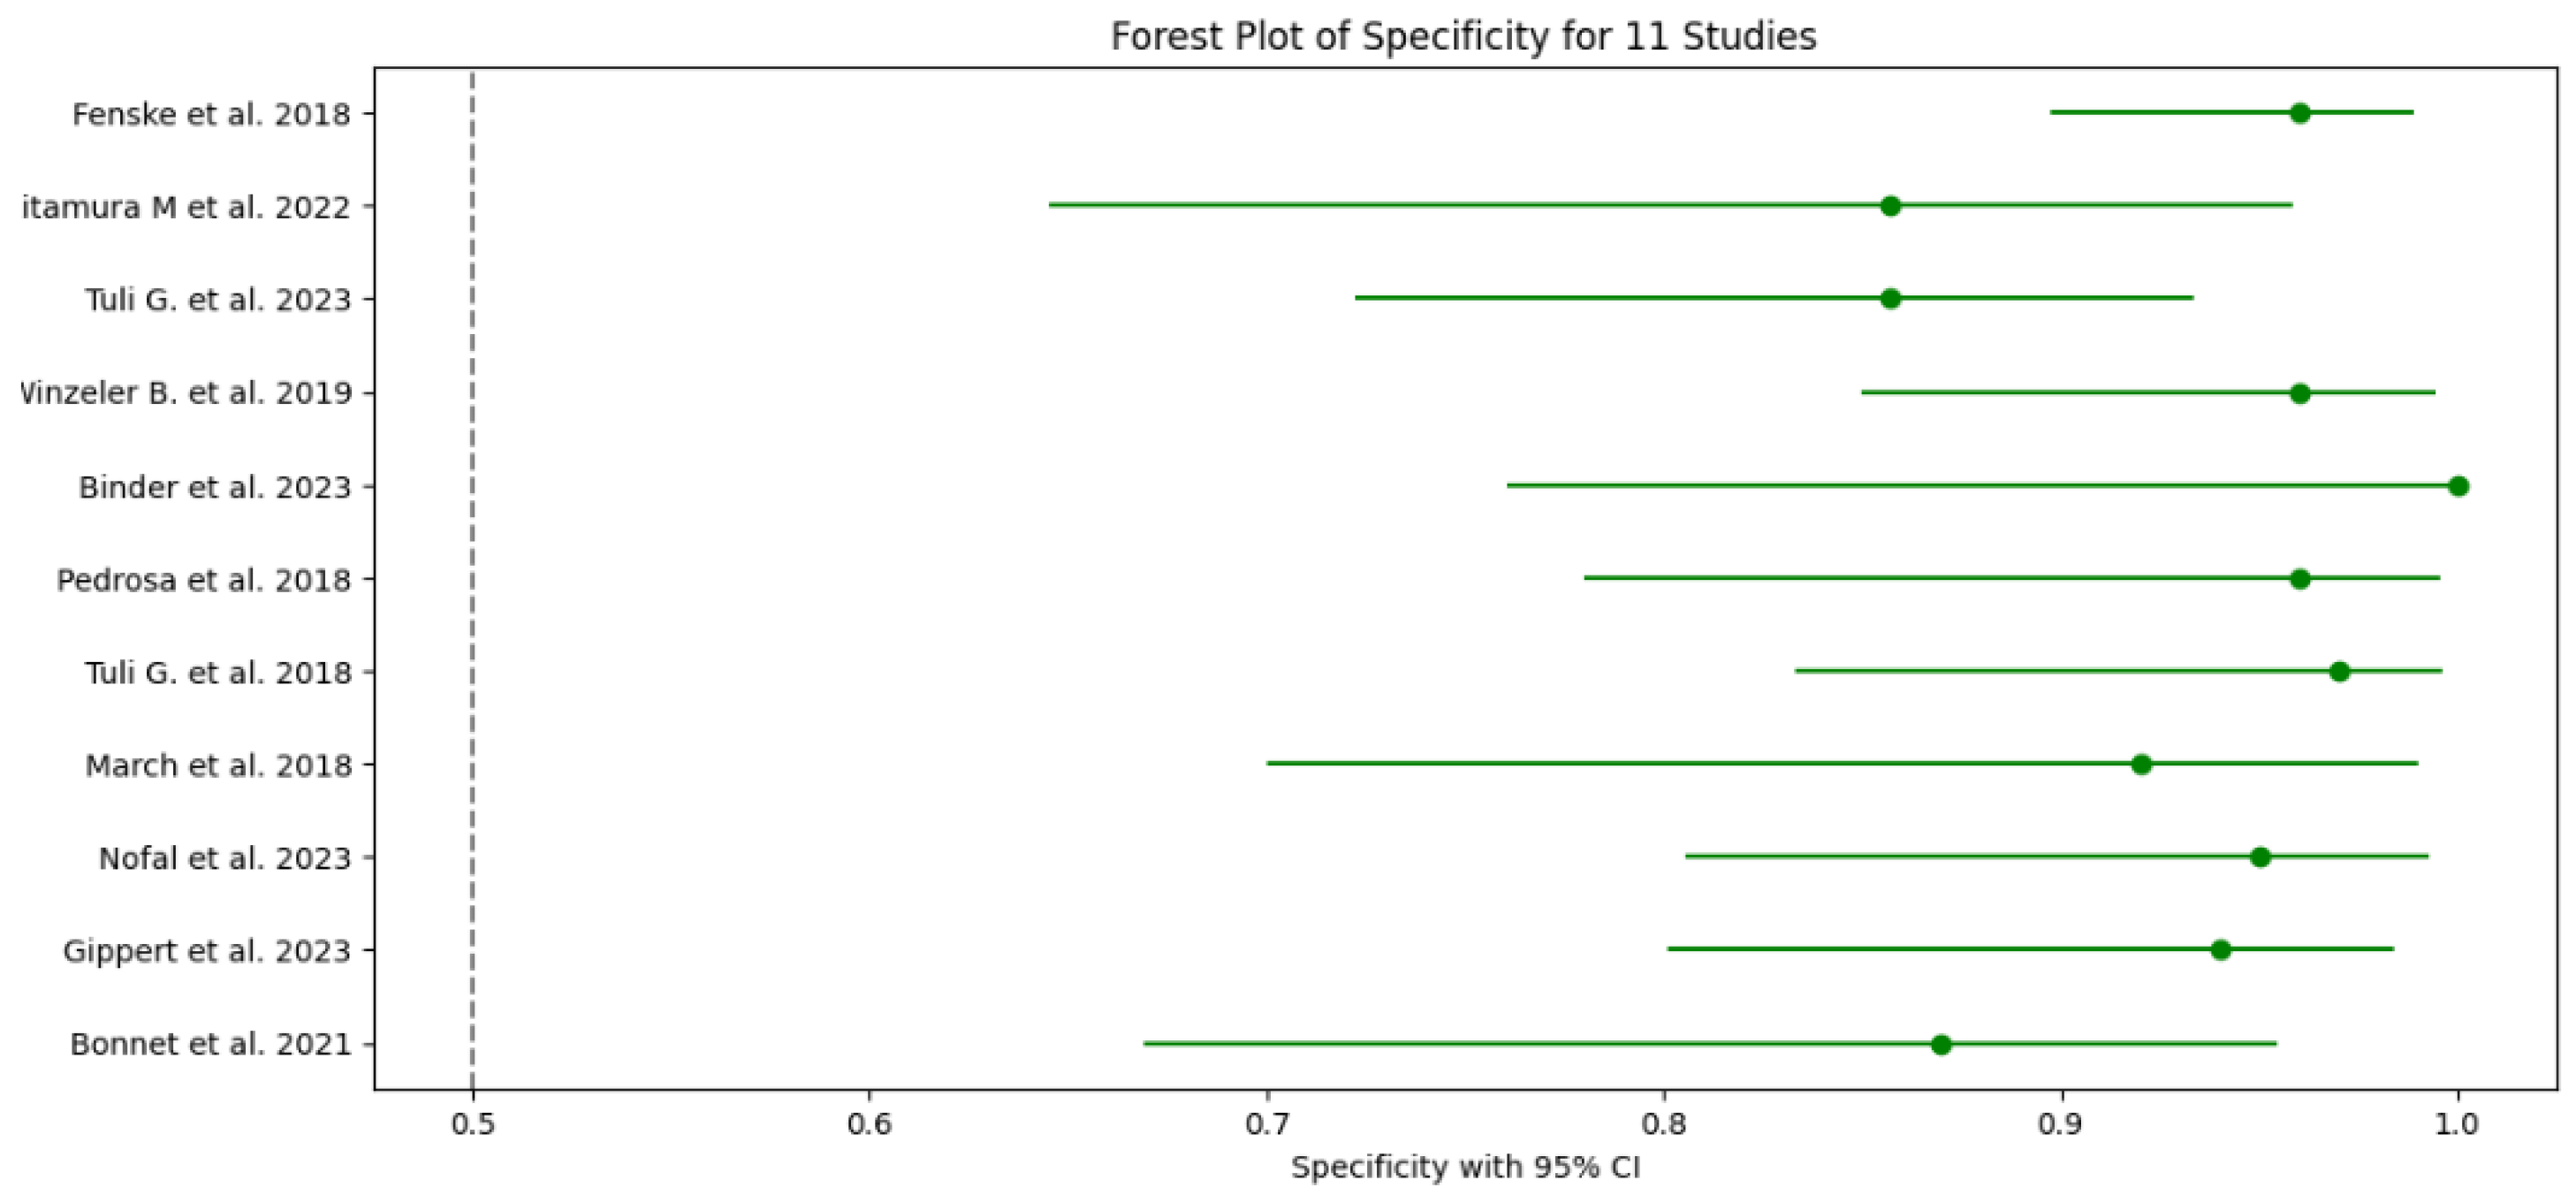
Figure 4.
ROC plot for the selected studies.
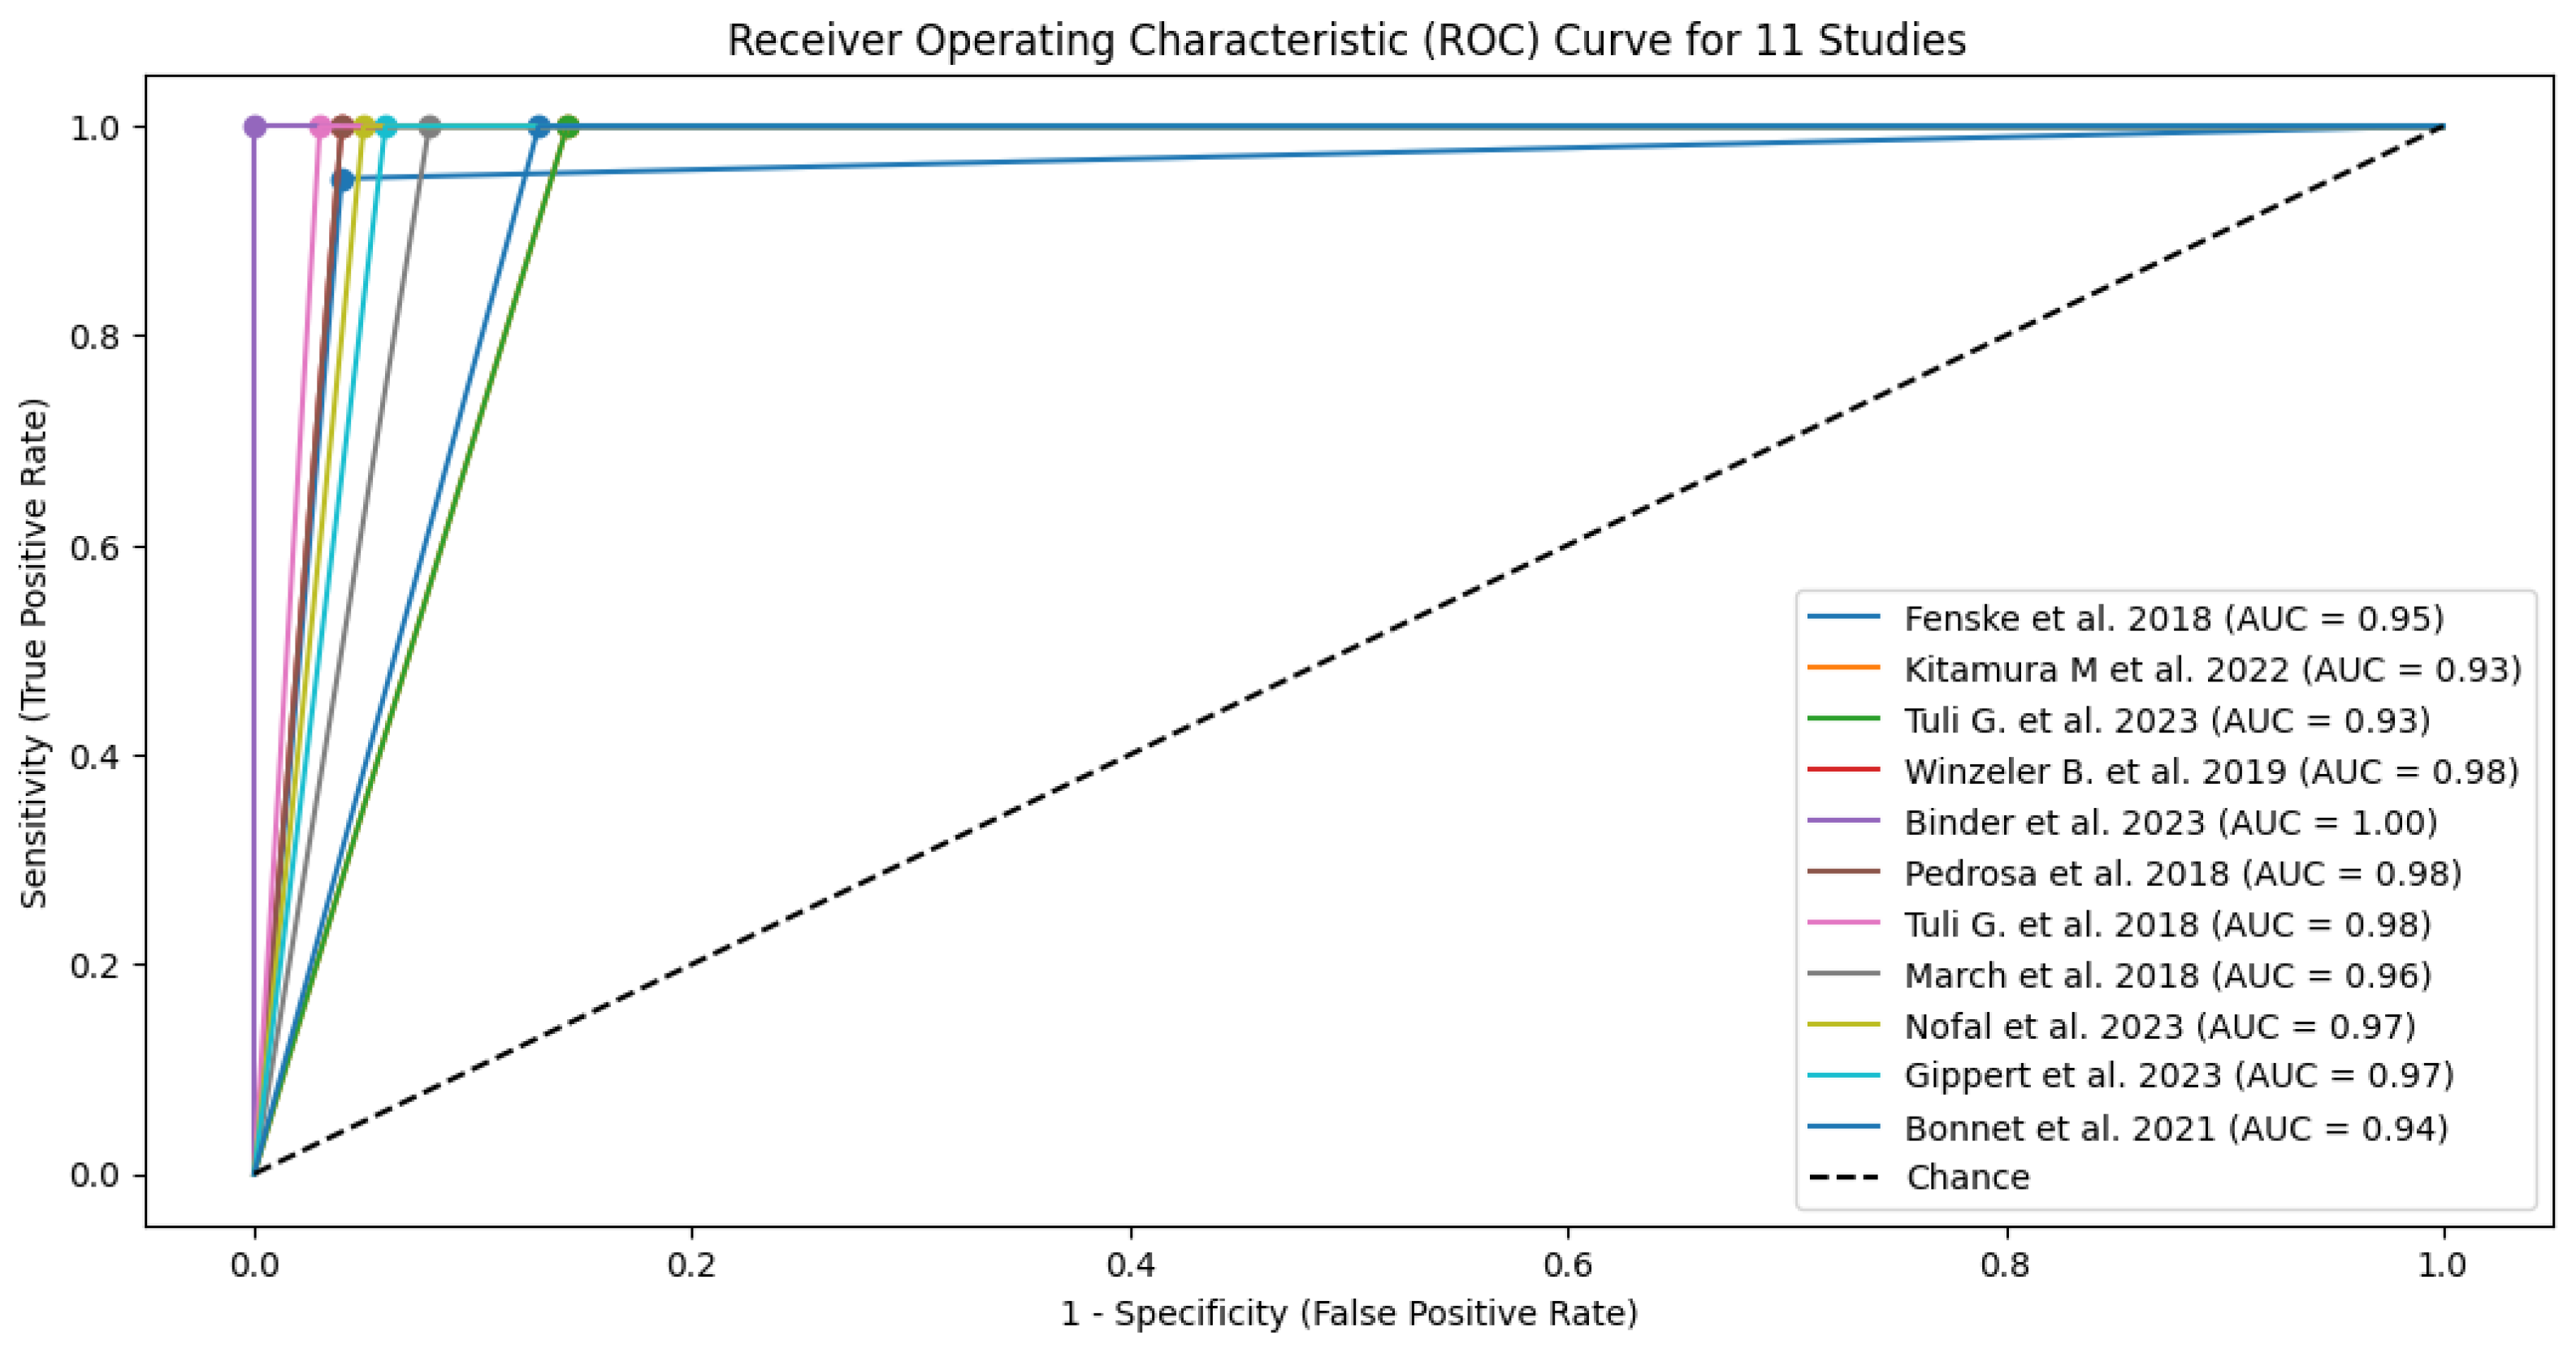
Figure 5.
Forest plot of pooled sensitivity for all 11 studies. The red dashed line represents the overall pooled sensitivity estimate of 0.98 (95% CI: 0.936–1.025). The individual study estimates sensitivity (blue dots) are shown with 95% confidence intervals represented as lines, highlighting the consistency of high sensitivity across most studies.
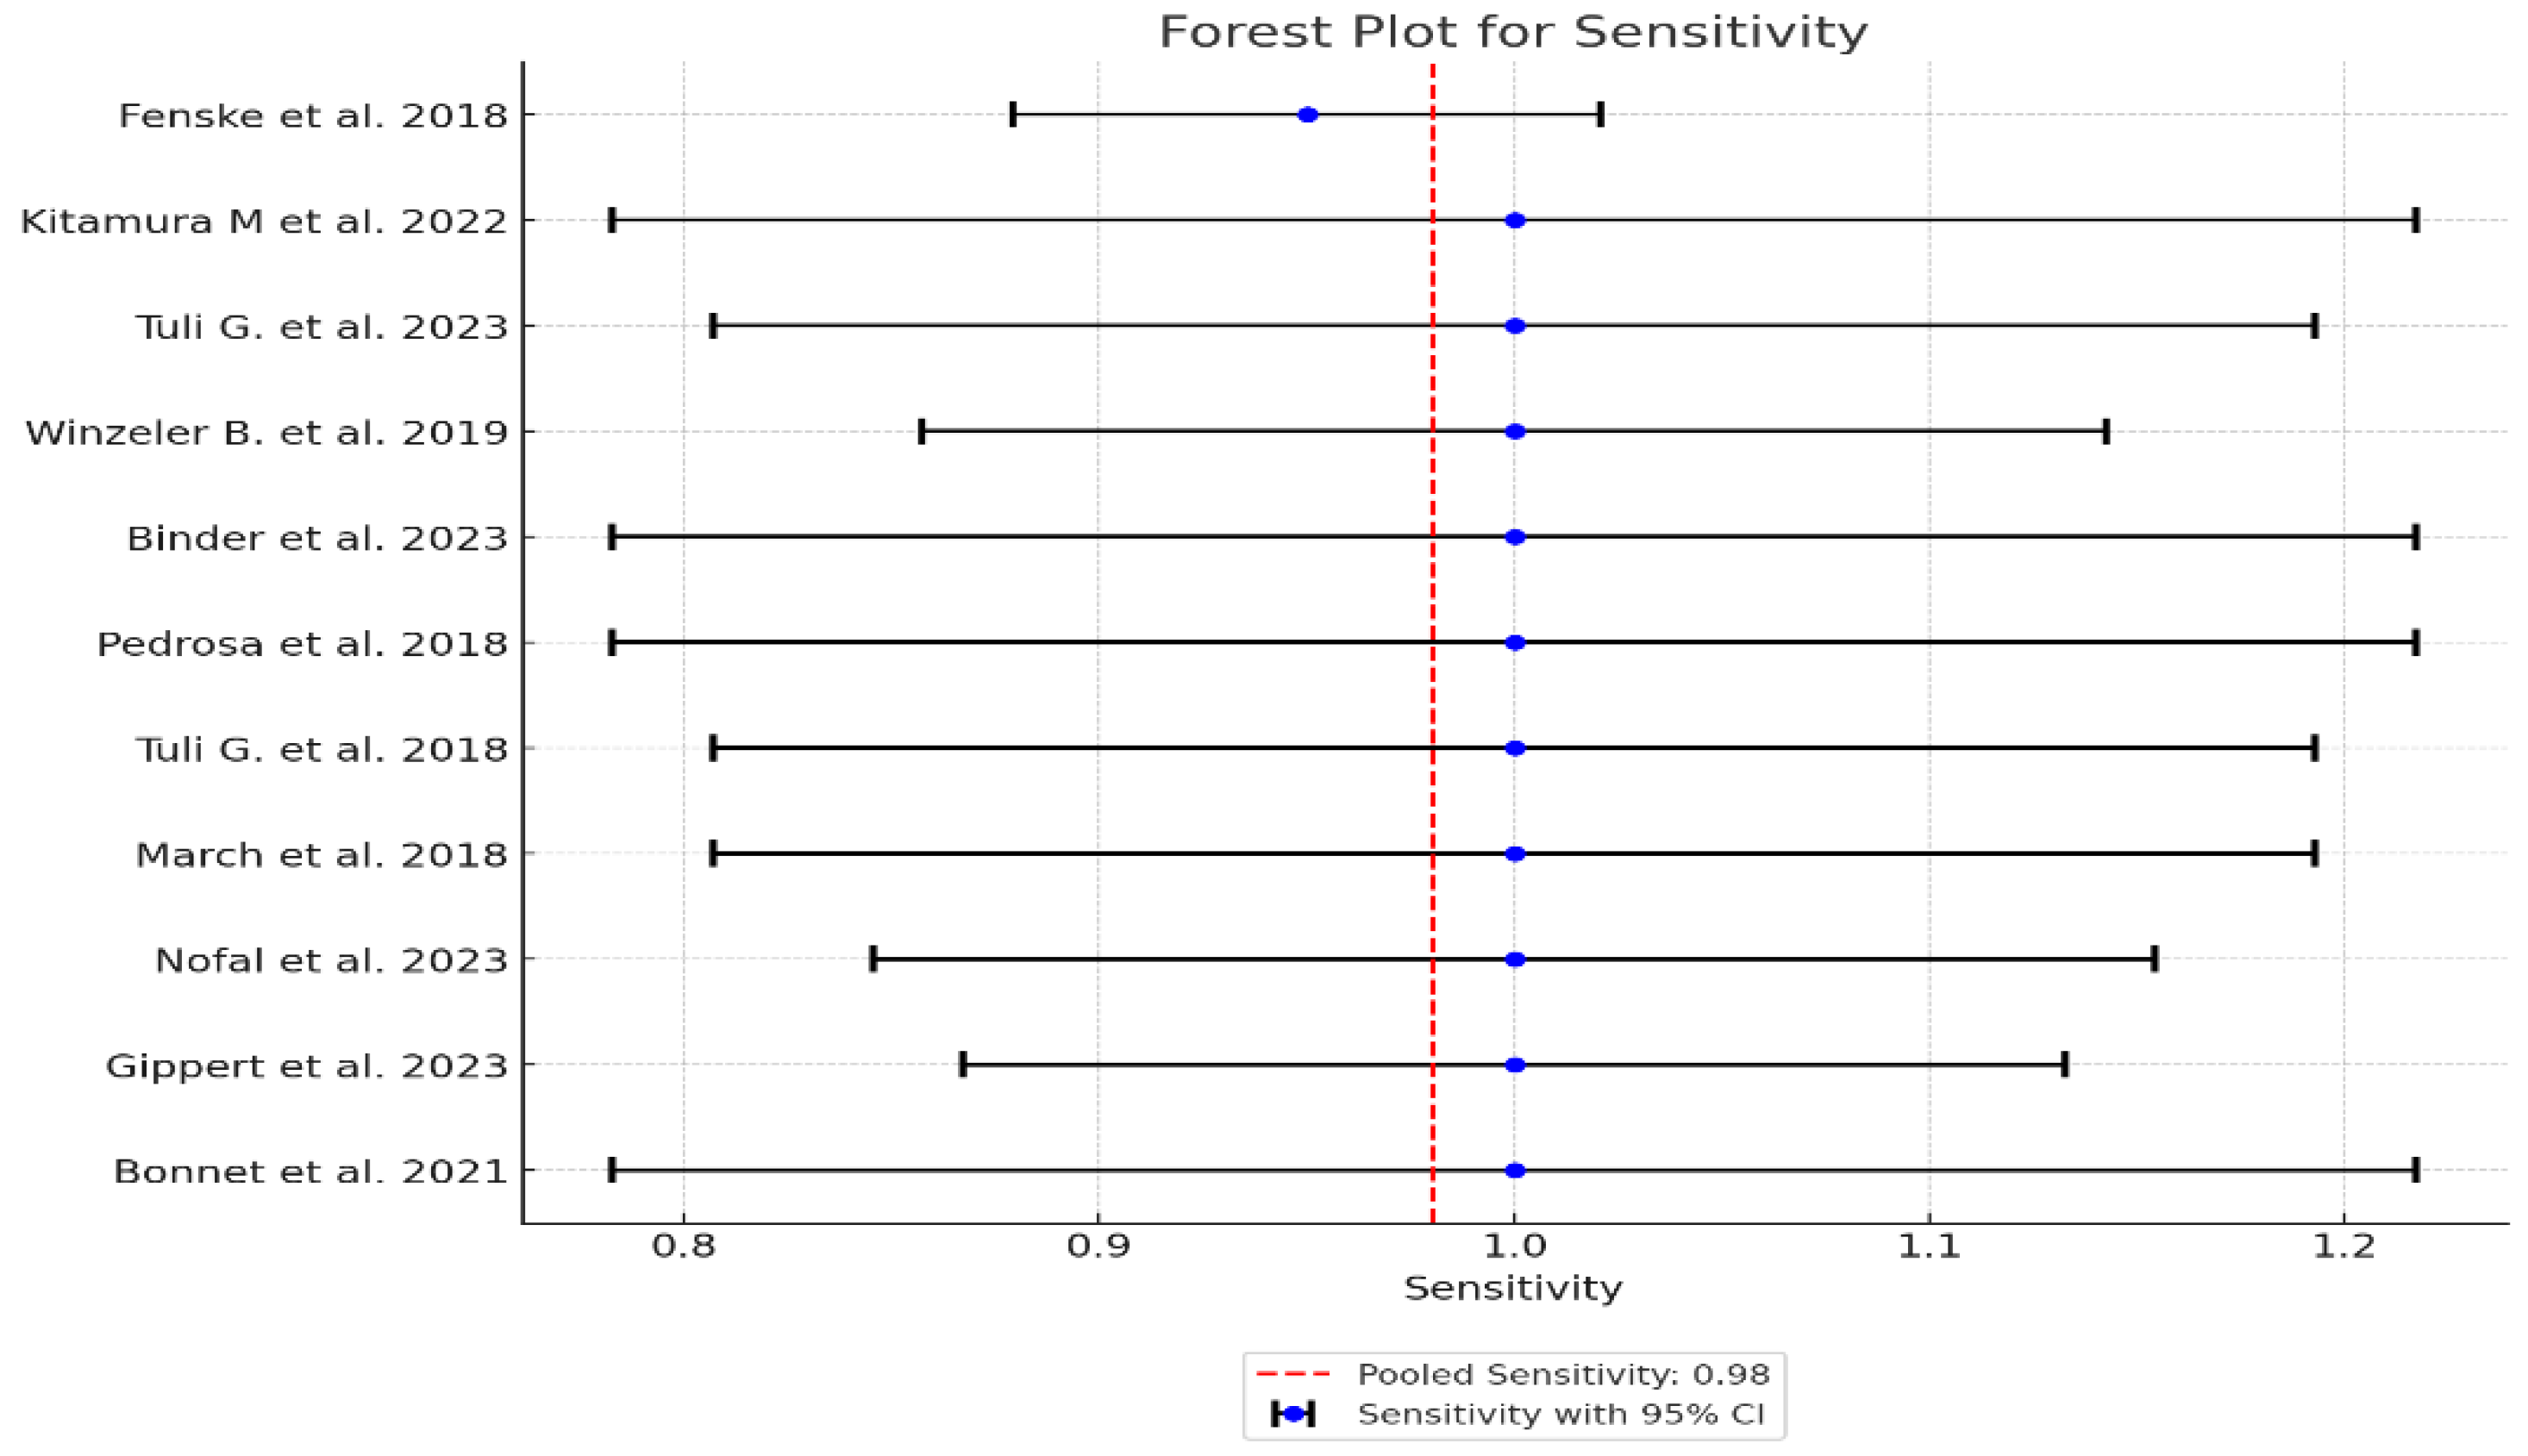
Figure 6.
Forest plot of pooled specificity for 11 studies. The red dashed line represents the overall pooled specificity estimate of 0.95 (95% CI: 0.920–0.973). Each study's specificity represented by a green dot is shown with its respective 95% confidence interval (represented by lines), demonstrating variability in test performance across studies, with most estimates clustering near the pooled estimate.
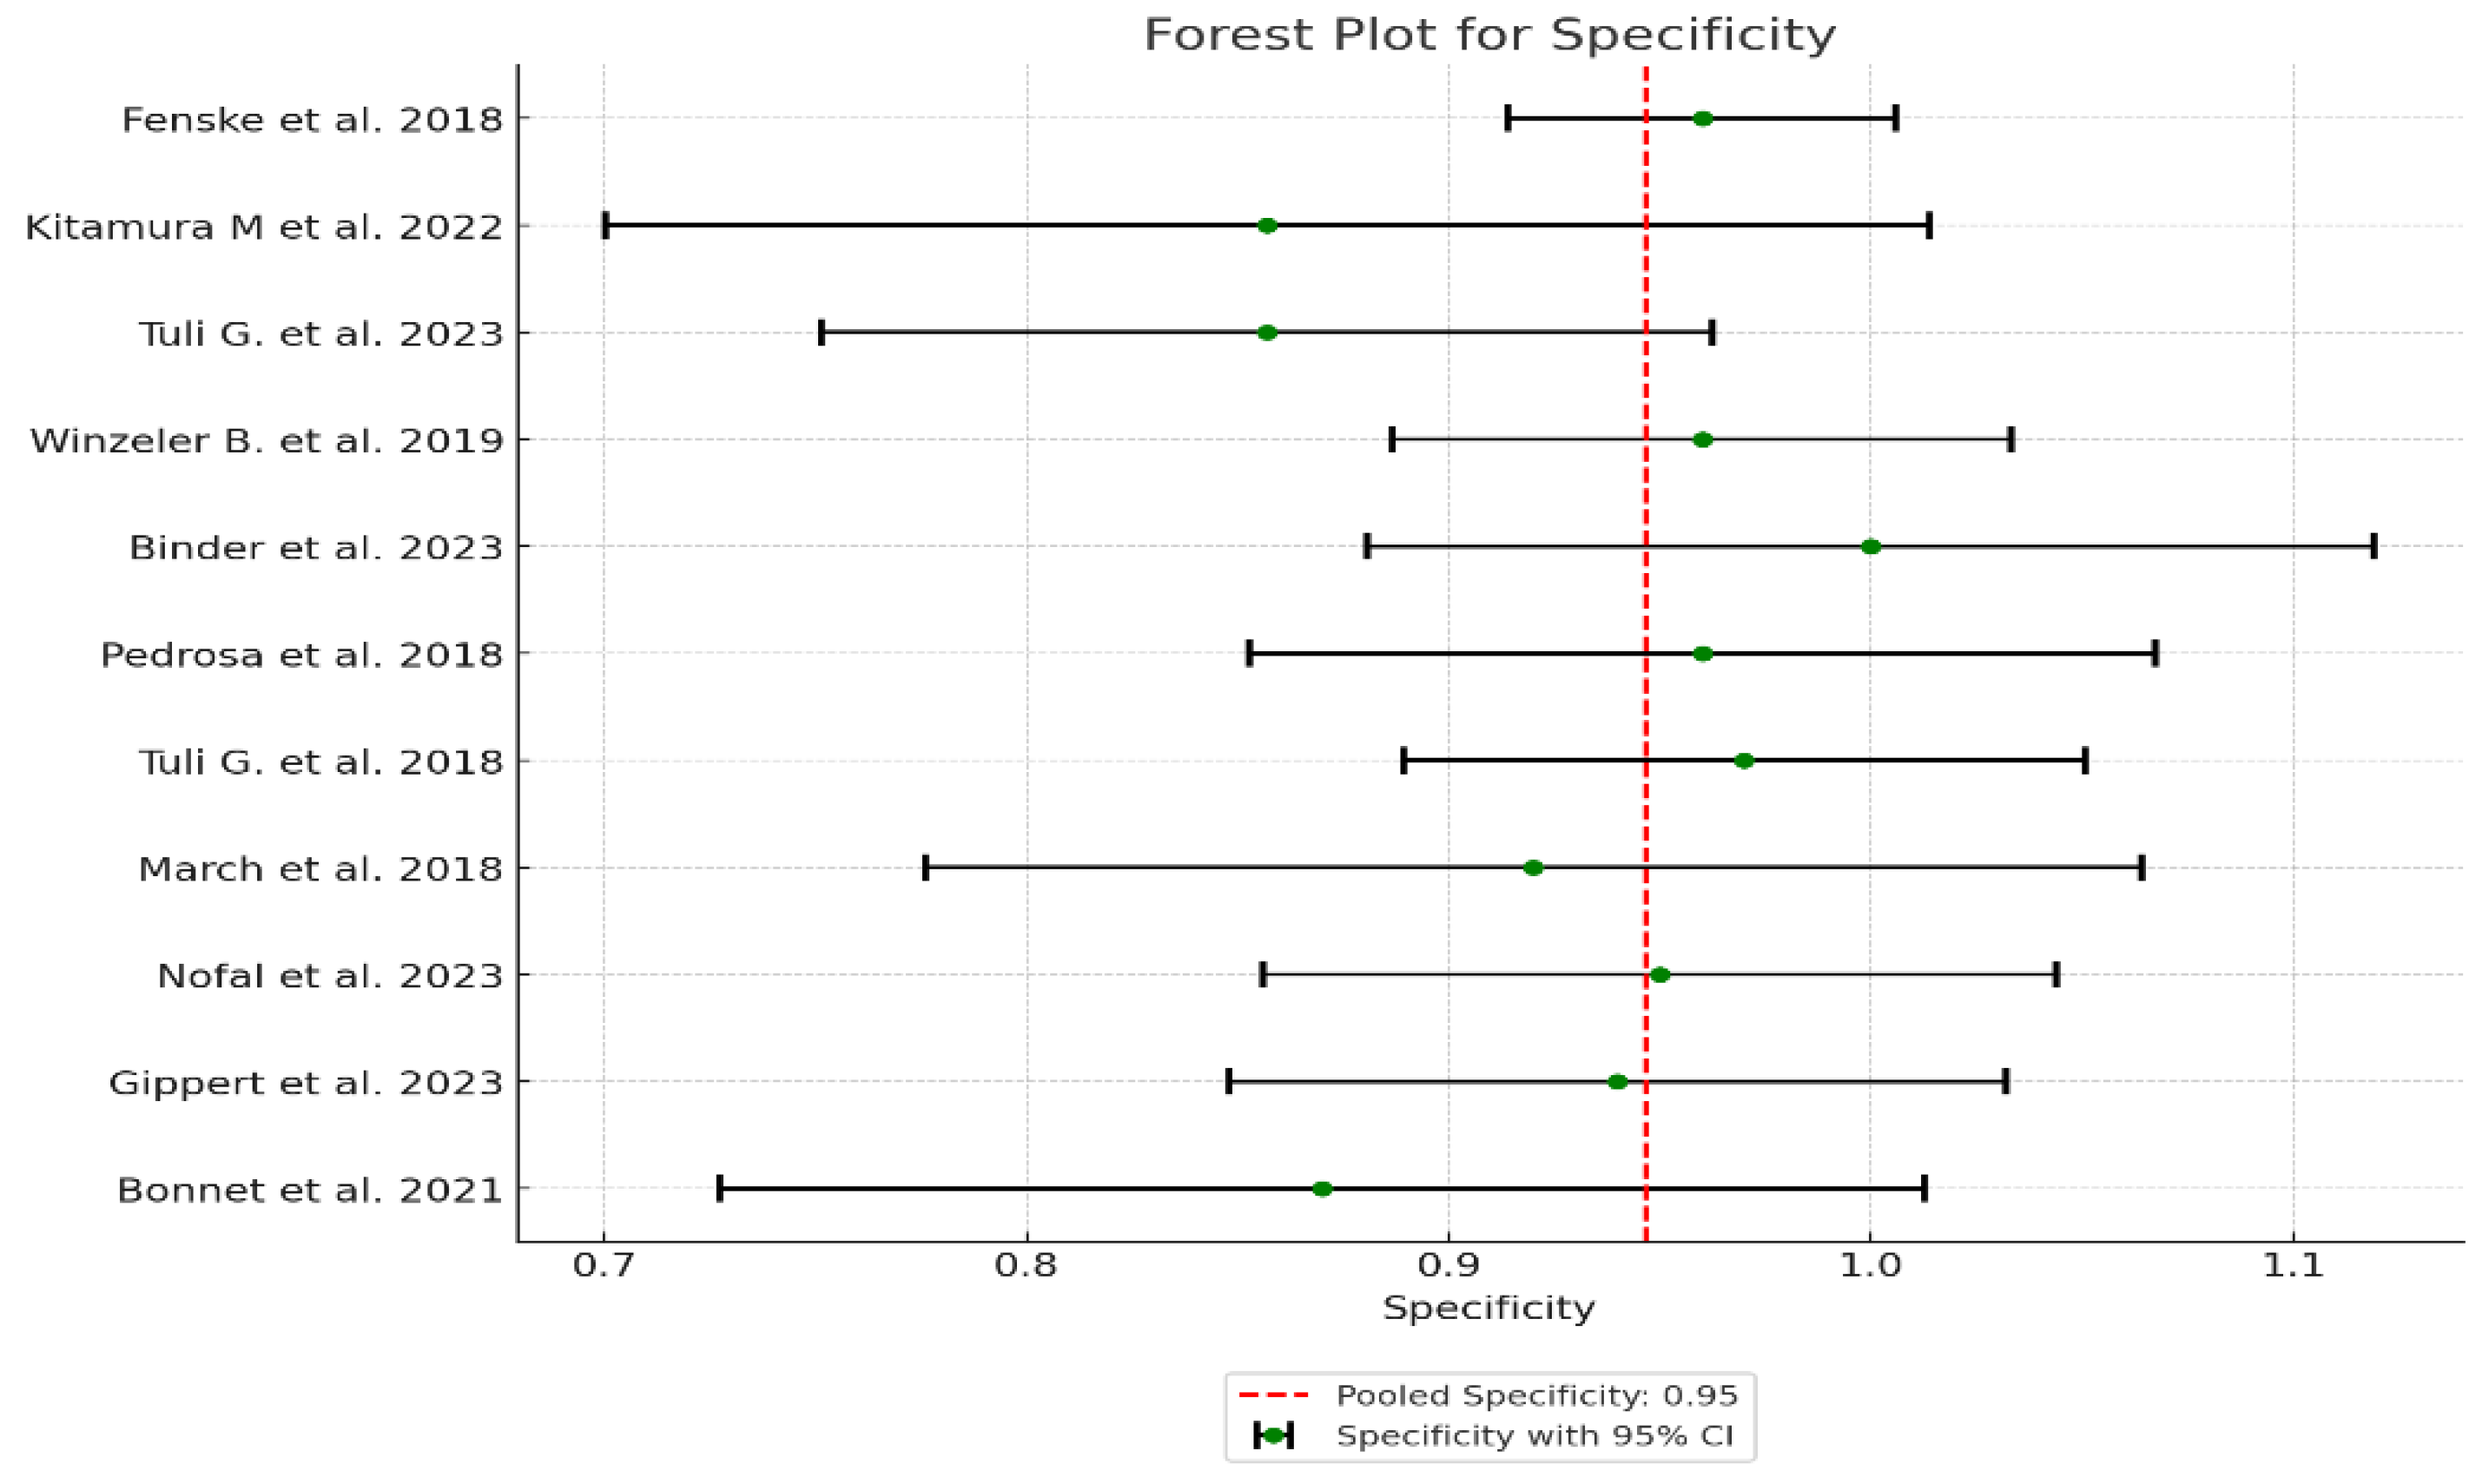
Figure 7.
Forest plot of AUC (Area Under the Curve) across the 11 studies. The red dashed line represents the overall pooled AUC estimate of 0.97 (95% CI: 0.95–0.99), highlighting the high diagnostic accuracy of copeptin across studies. The tight clustering of AUC values (purple dots, associated with lines representing CI) around the pooled estimate further emphasizes the reliability and consistency of copeptin as a diagnostic tool for polyuria-polydipsia syndrome in pediatric patients.
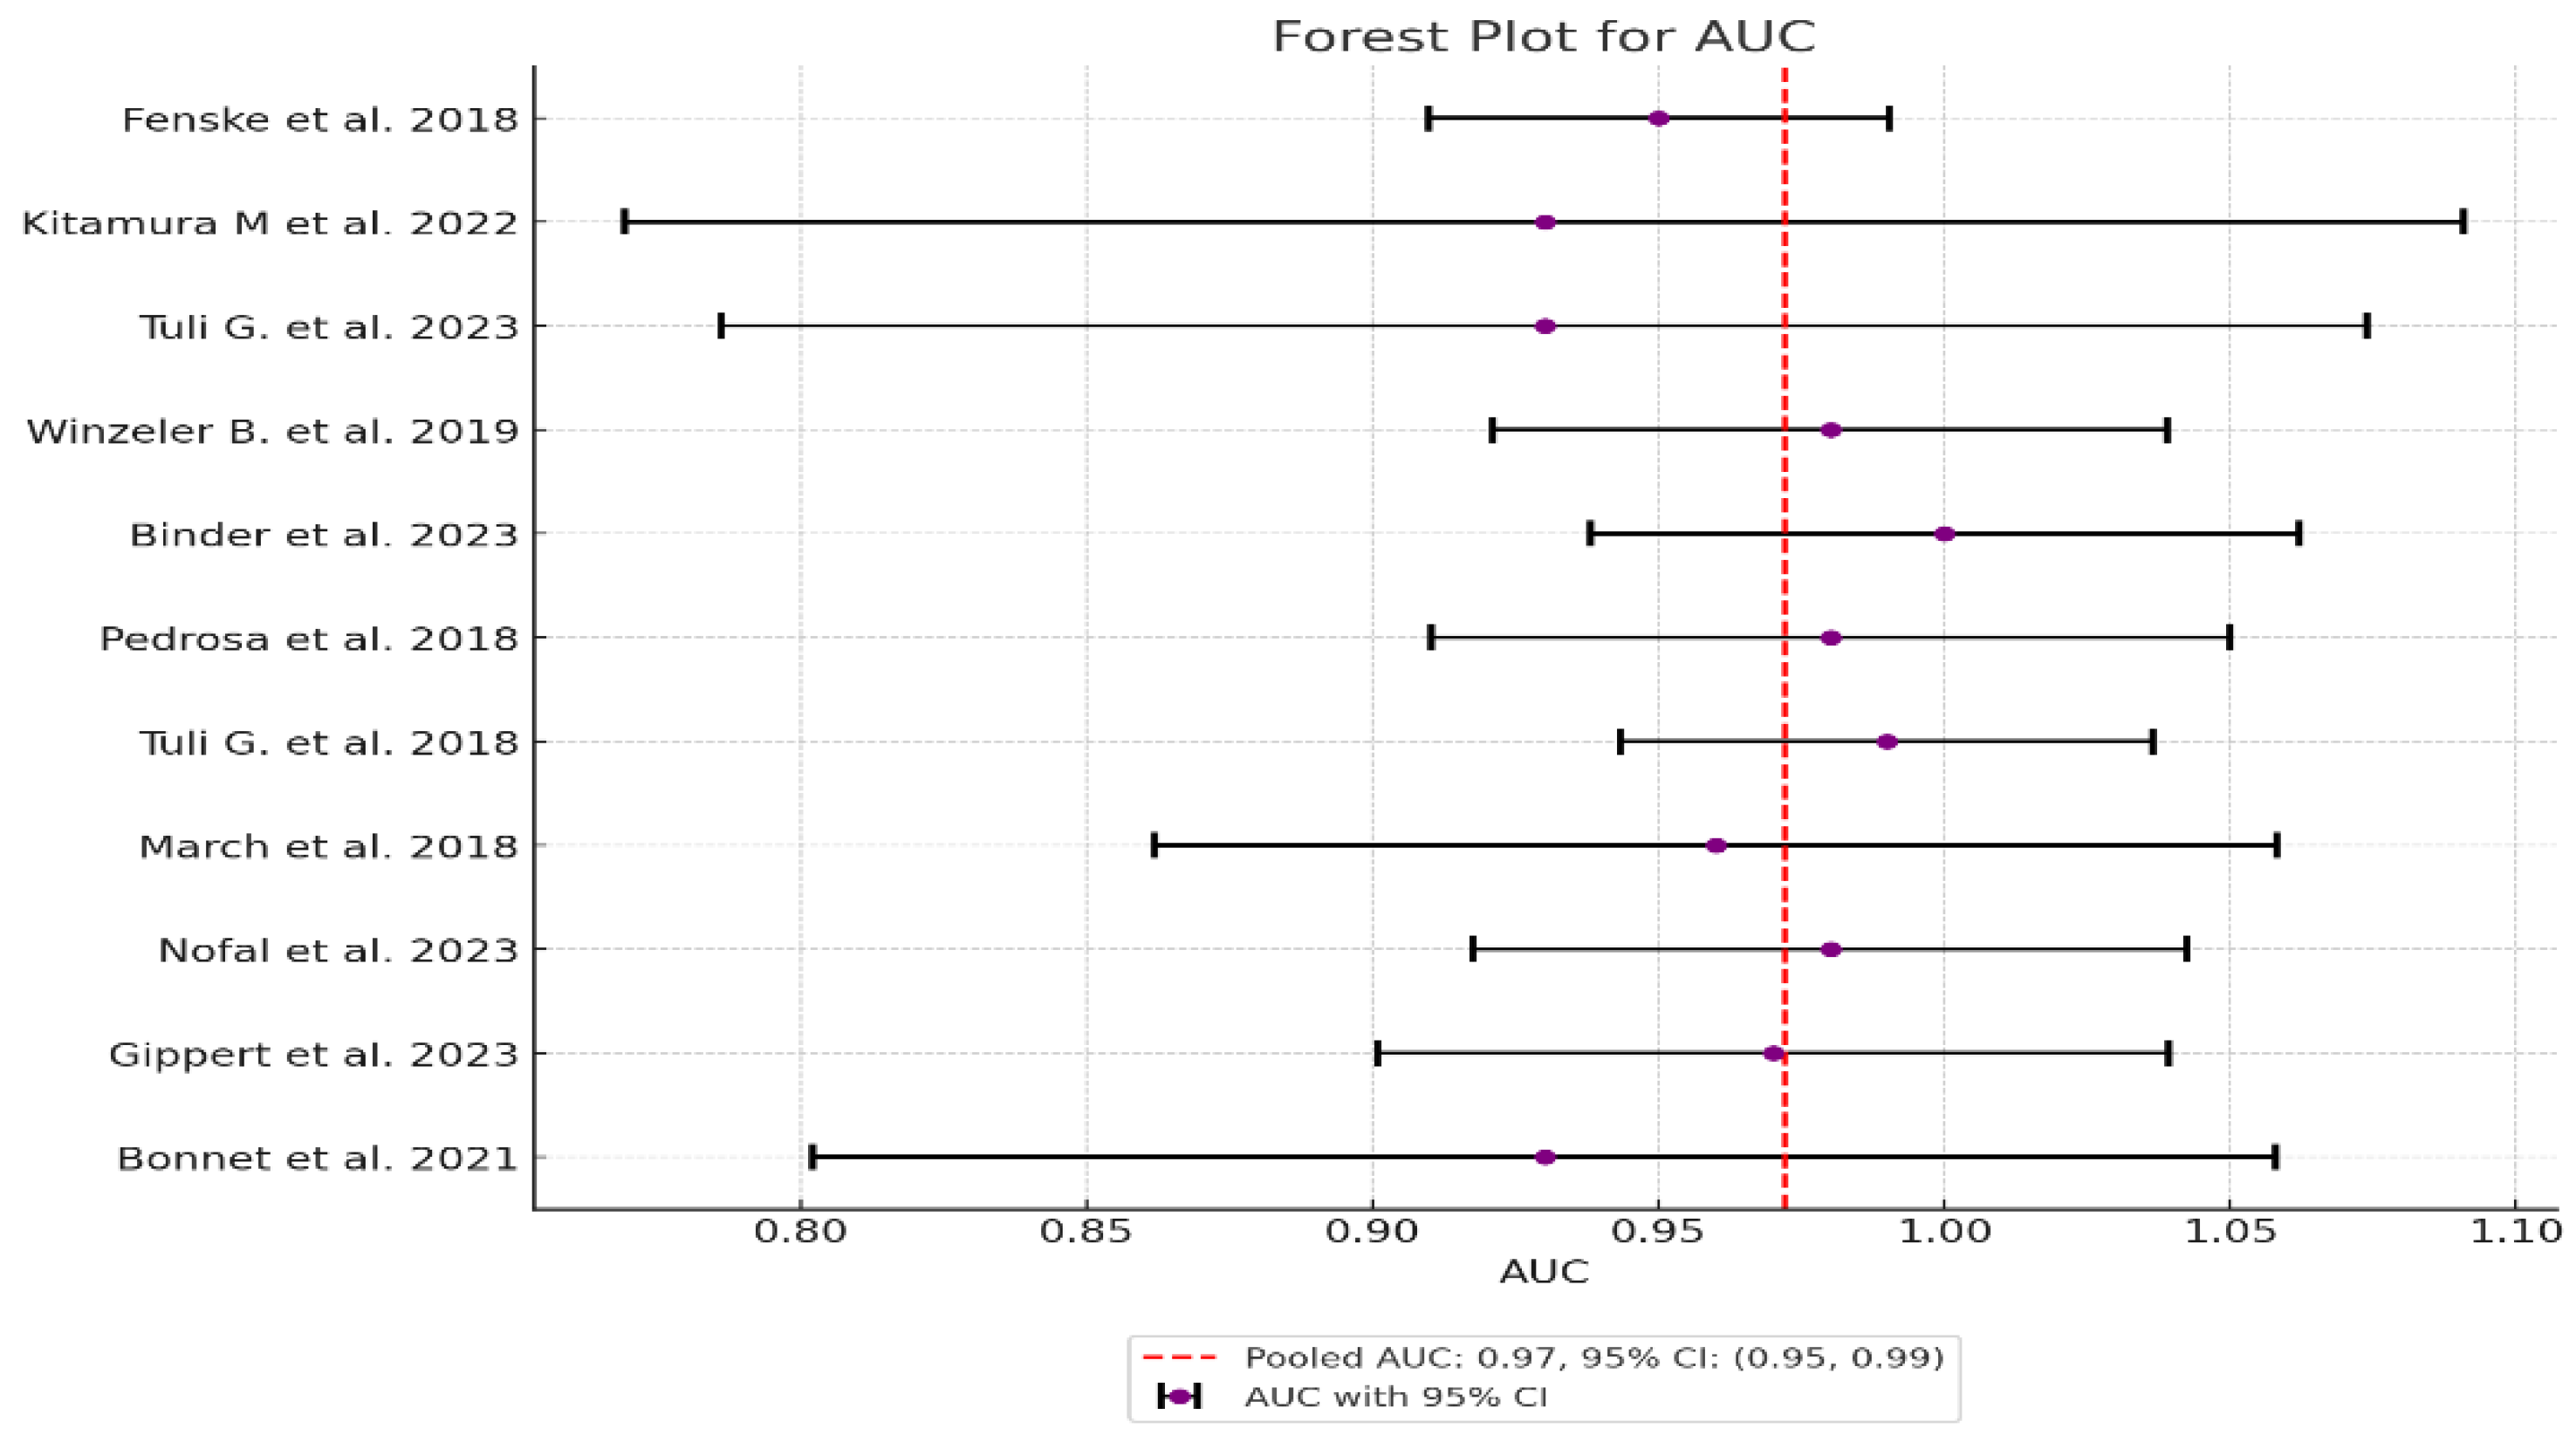
Figure 8.
- SROC plot from HSROC model – shows diagnostic performance of copeptin across all 11 studies. The circles represent the summary estimate of sensitivity and specificity across the studies. The lines around the circle represent the confidence regions for these estimates, showing the uncertainty around the summary points. The x-axis (False Positive Rate) and y-axis (Sensitivity) are used to plot the trade-off between sensitivity and specificity.
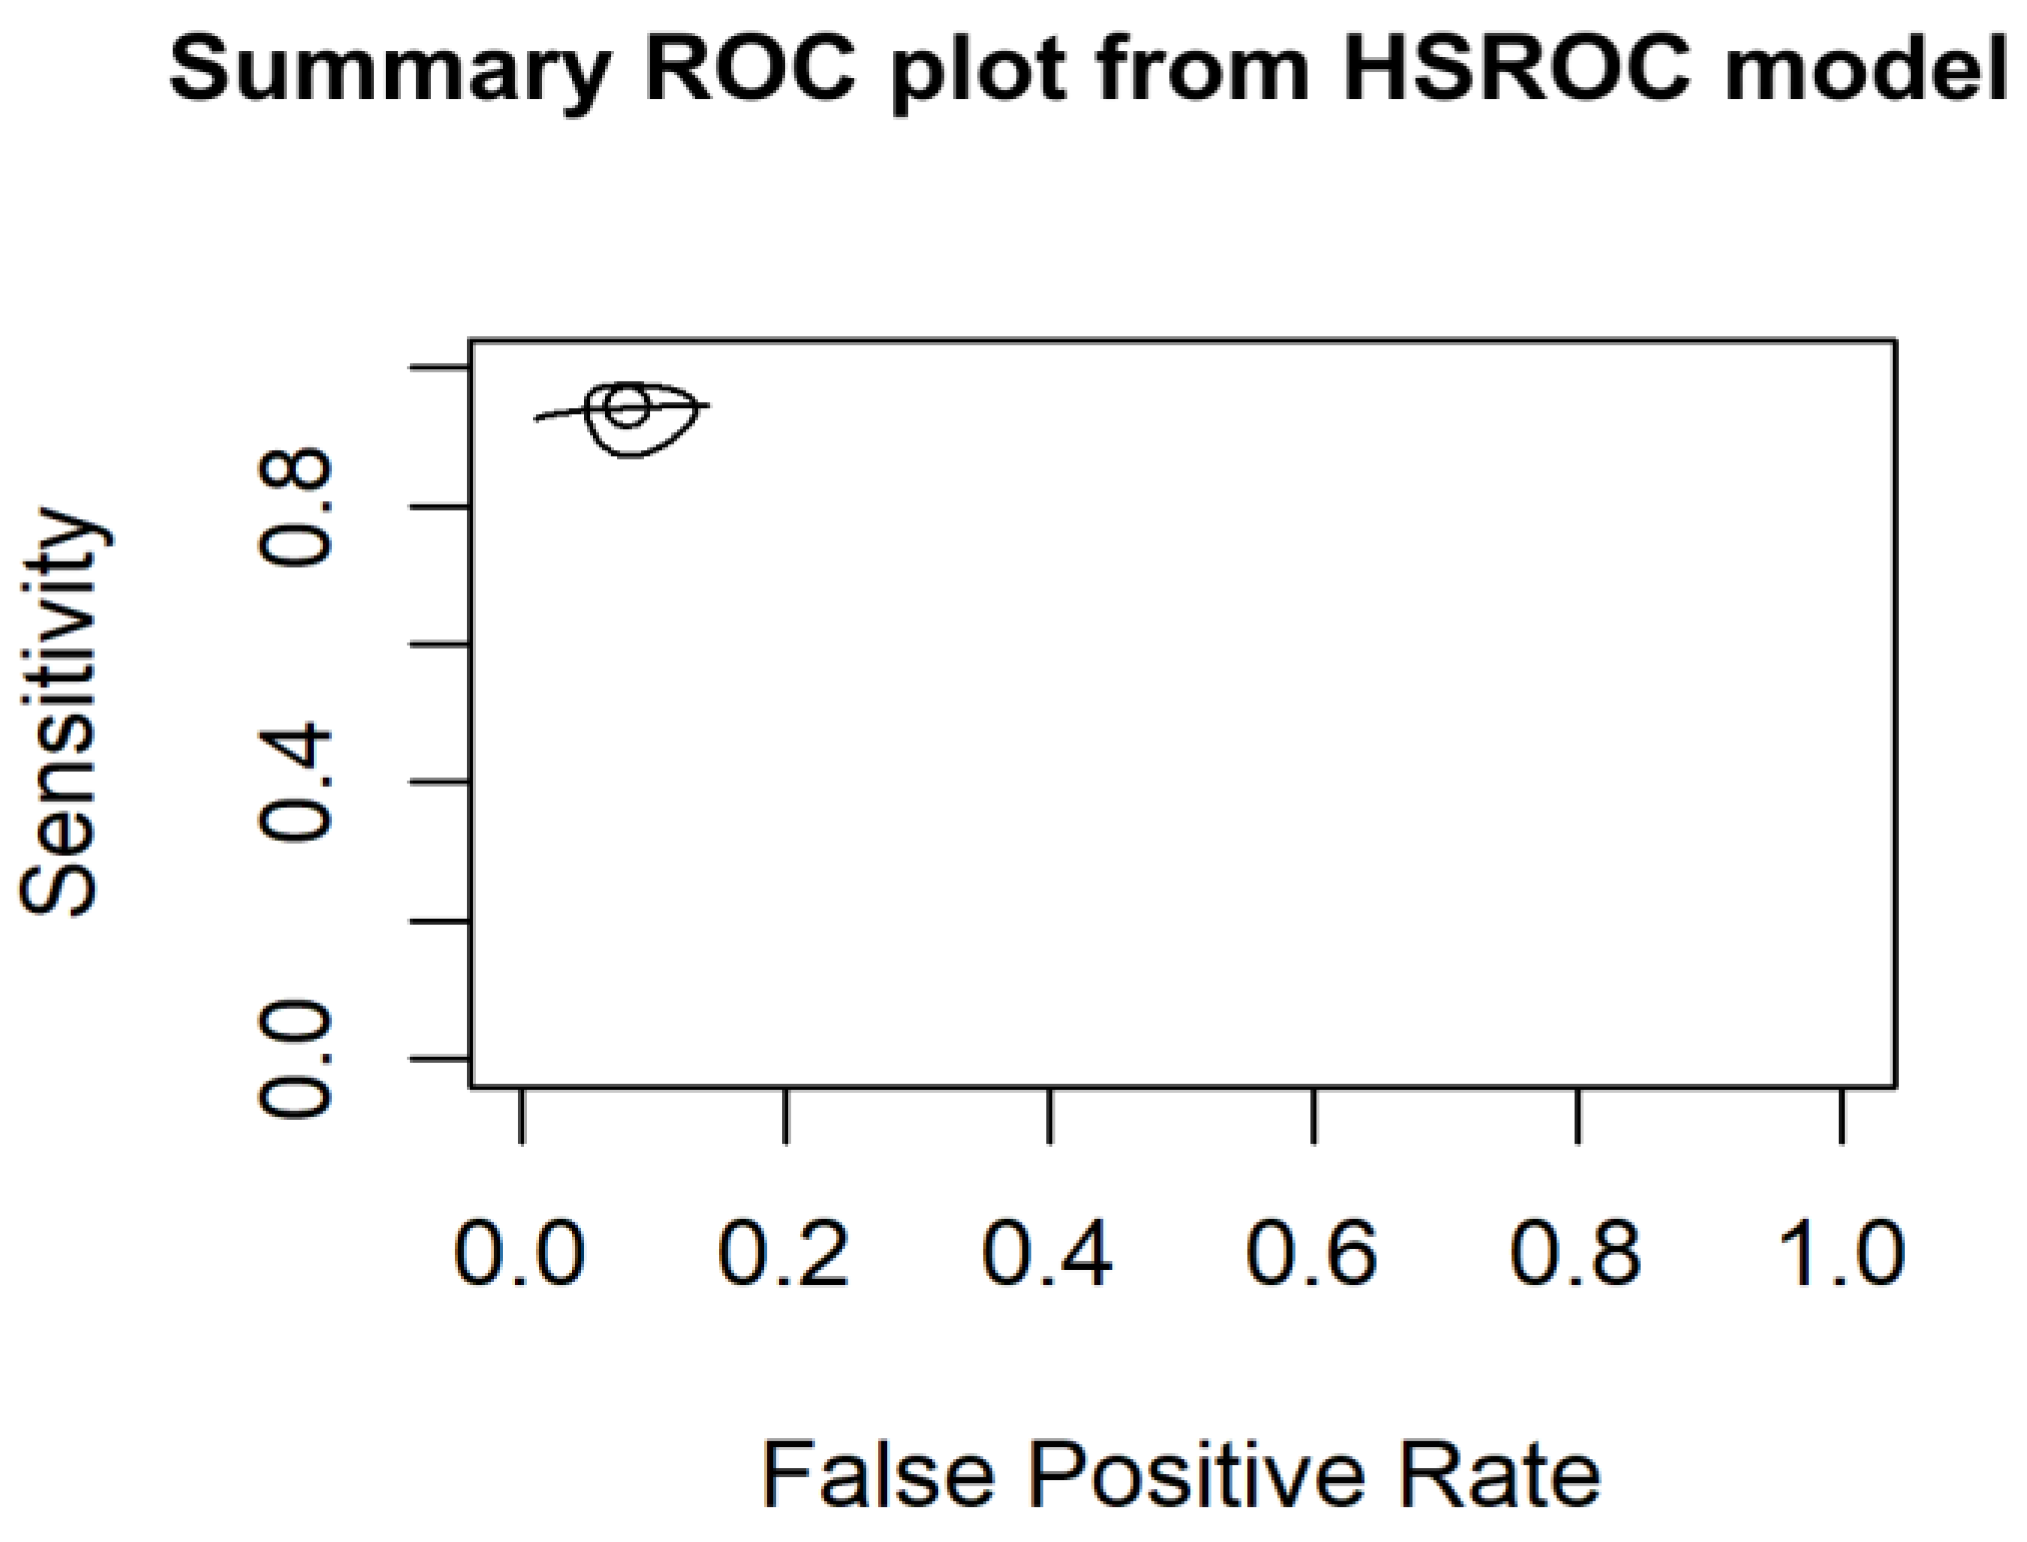
Figure 9.
Funnel plot publication bias - it presents the Log Odds Ratios (LOR) of the included studies along with their respective confidence intervals (CIs) plotted against the standard errors (SE). The vertical red line represents the mean LOR, while the horizontal spread of points indicates the variability in effect sizes. Slightly asymmetry is observed, particularly among some studies, which may reflect underlying differences in study design or populations. Despite this, Egger’s regression test did not indicate statistically significant publication bias (p = 0.716).
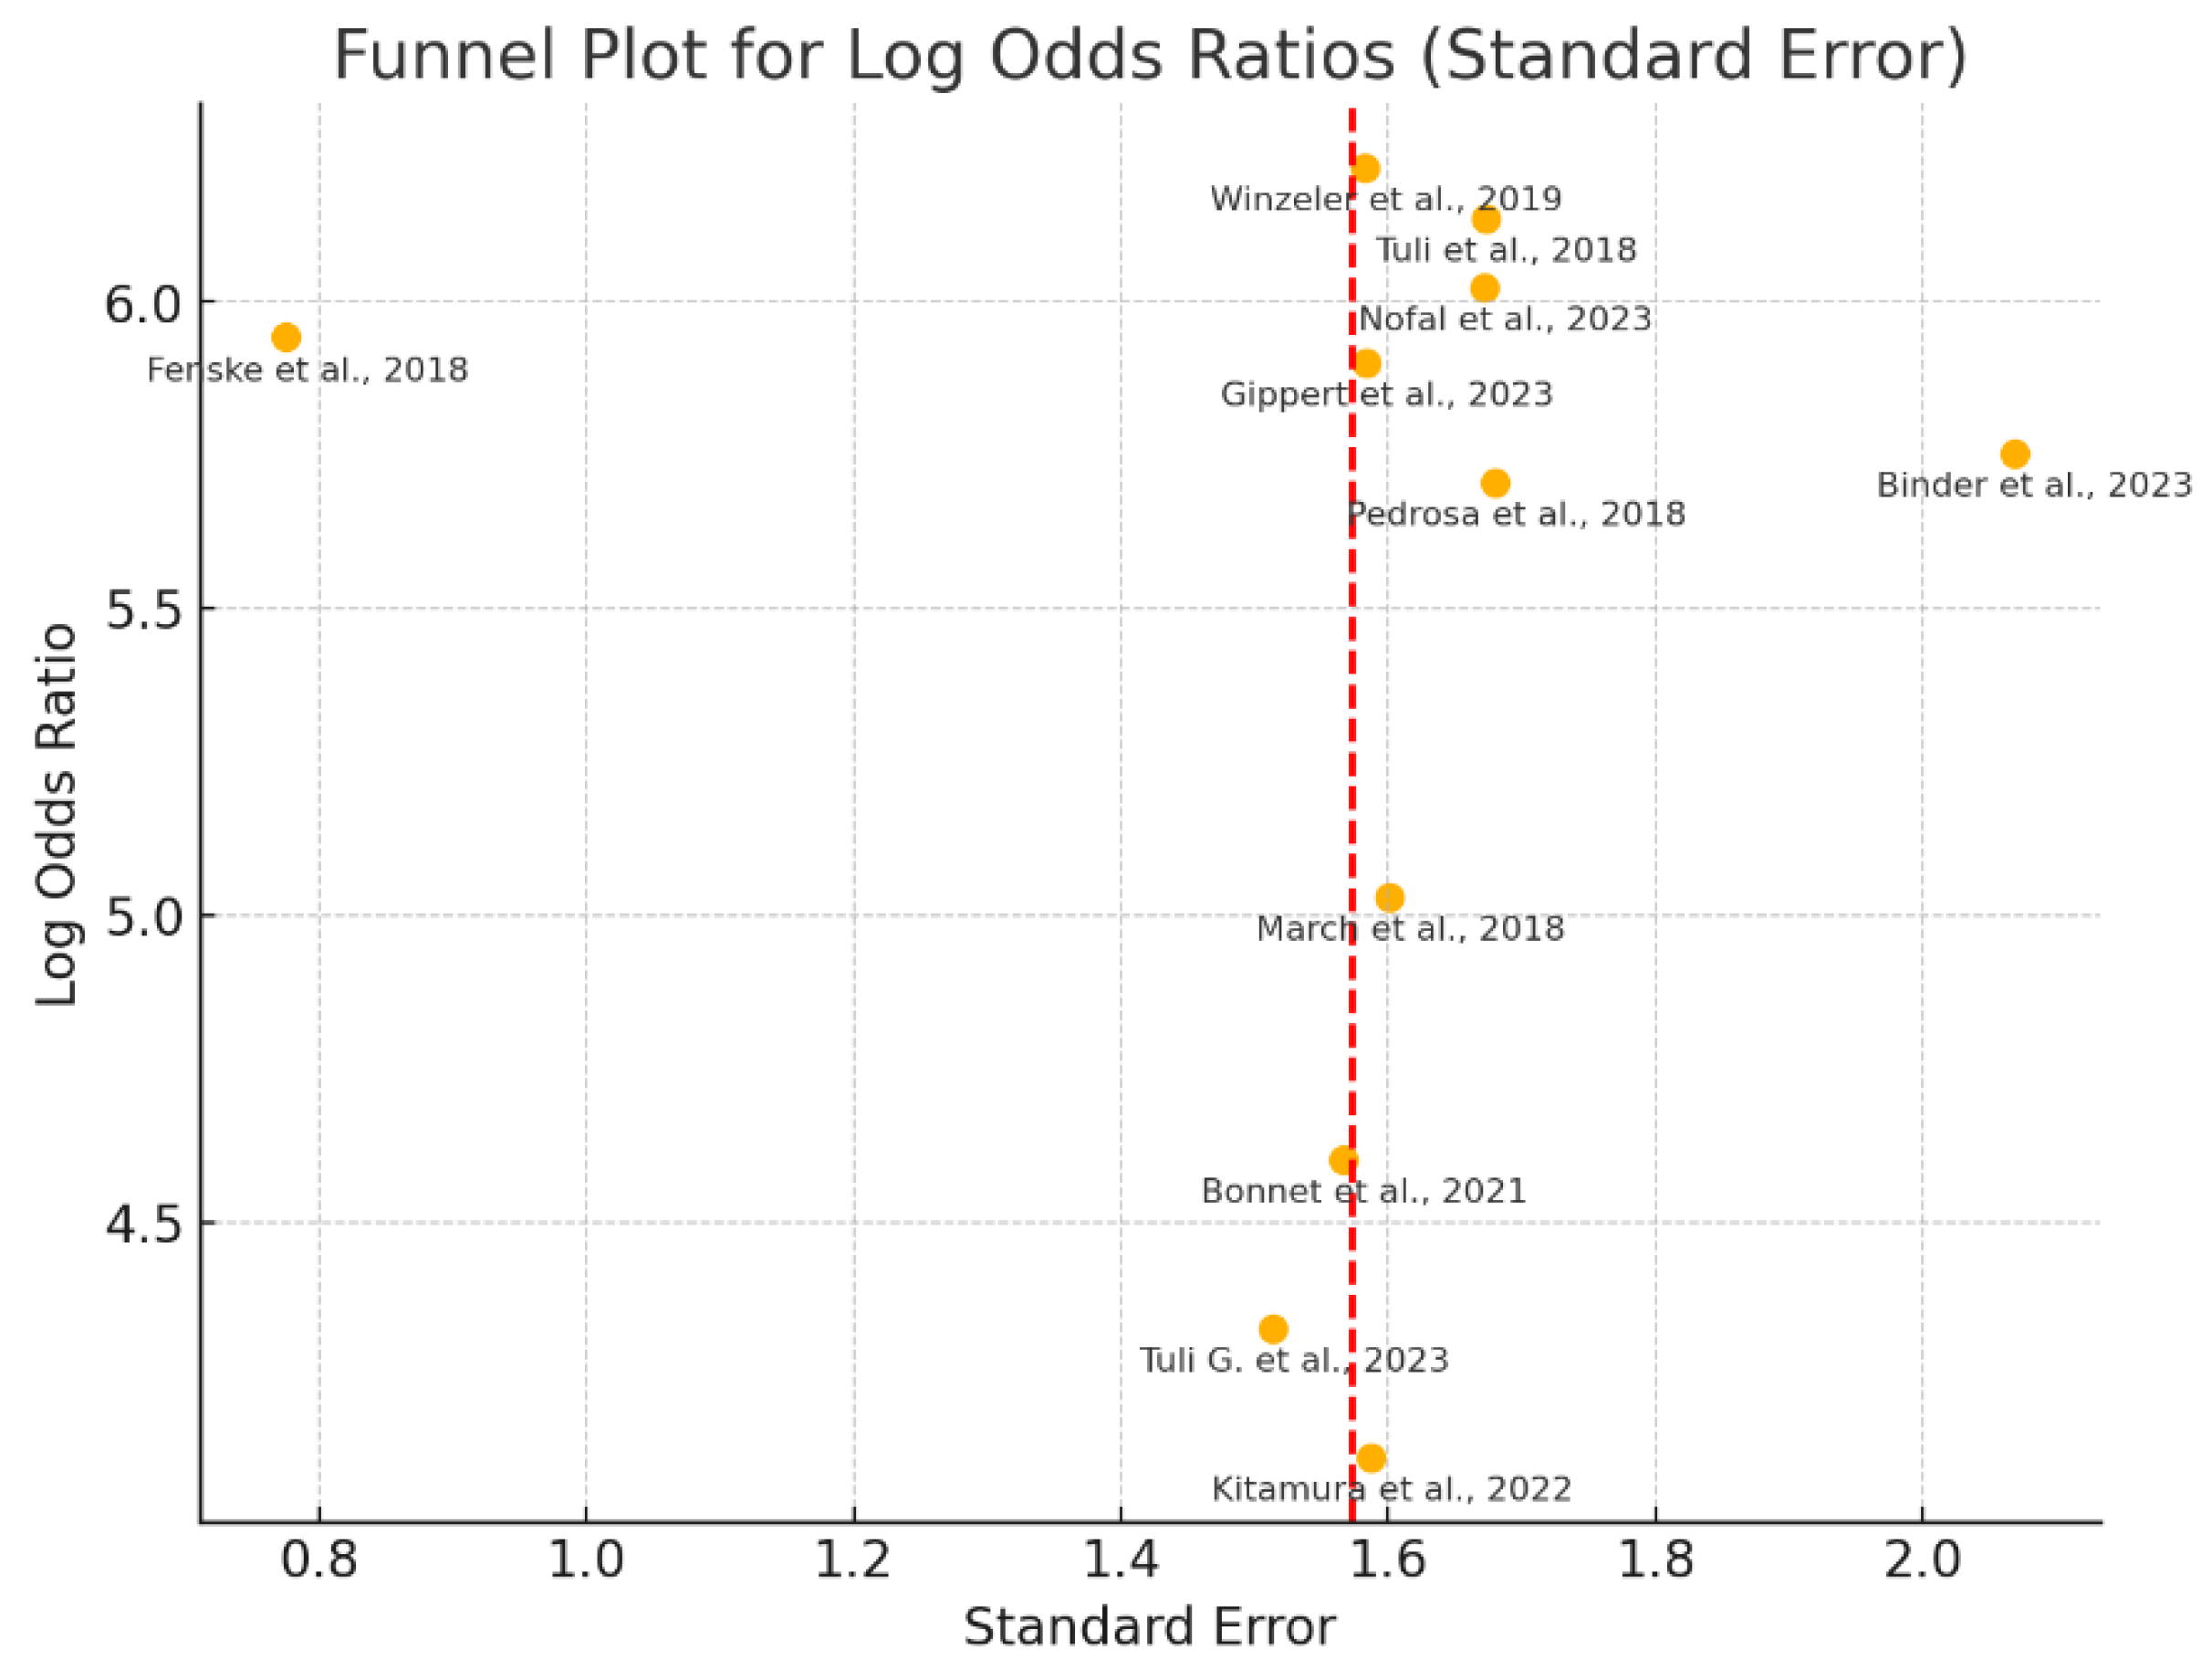
Figure 10.
– Diagnostic accuracy metrics by method – The boxplots illustrate the distribution of Sensitivity, Specificity, Positive Predictive Value (PPV), Negative Predictive Value (NPV), Positive Likelihood Ratio (LR+), Negative Likelihood Ratio (LR-), and Area Under the Curve (AUC) across the different diagnostic methods assessed in the included studies.
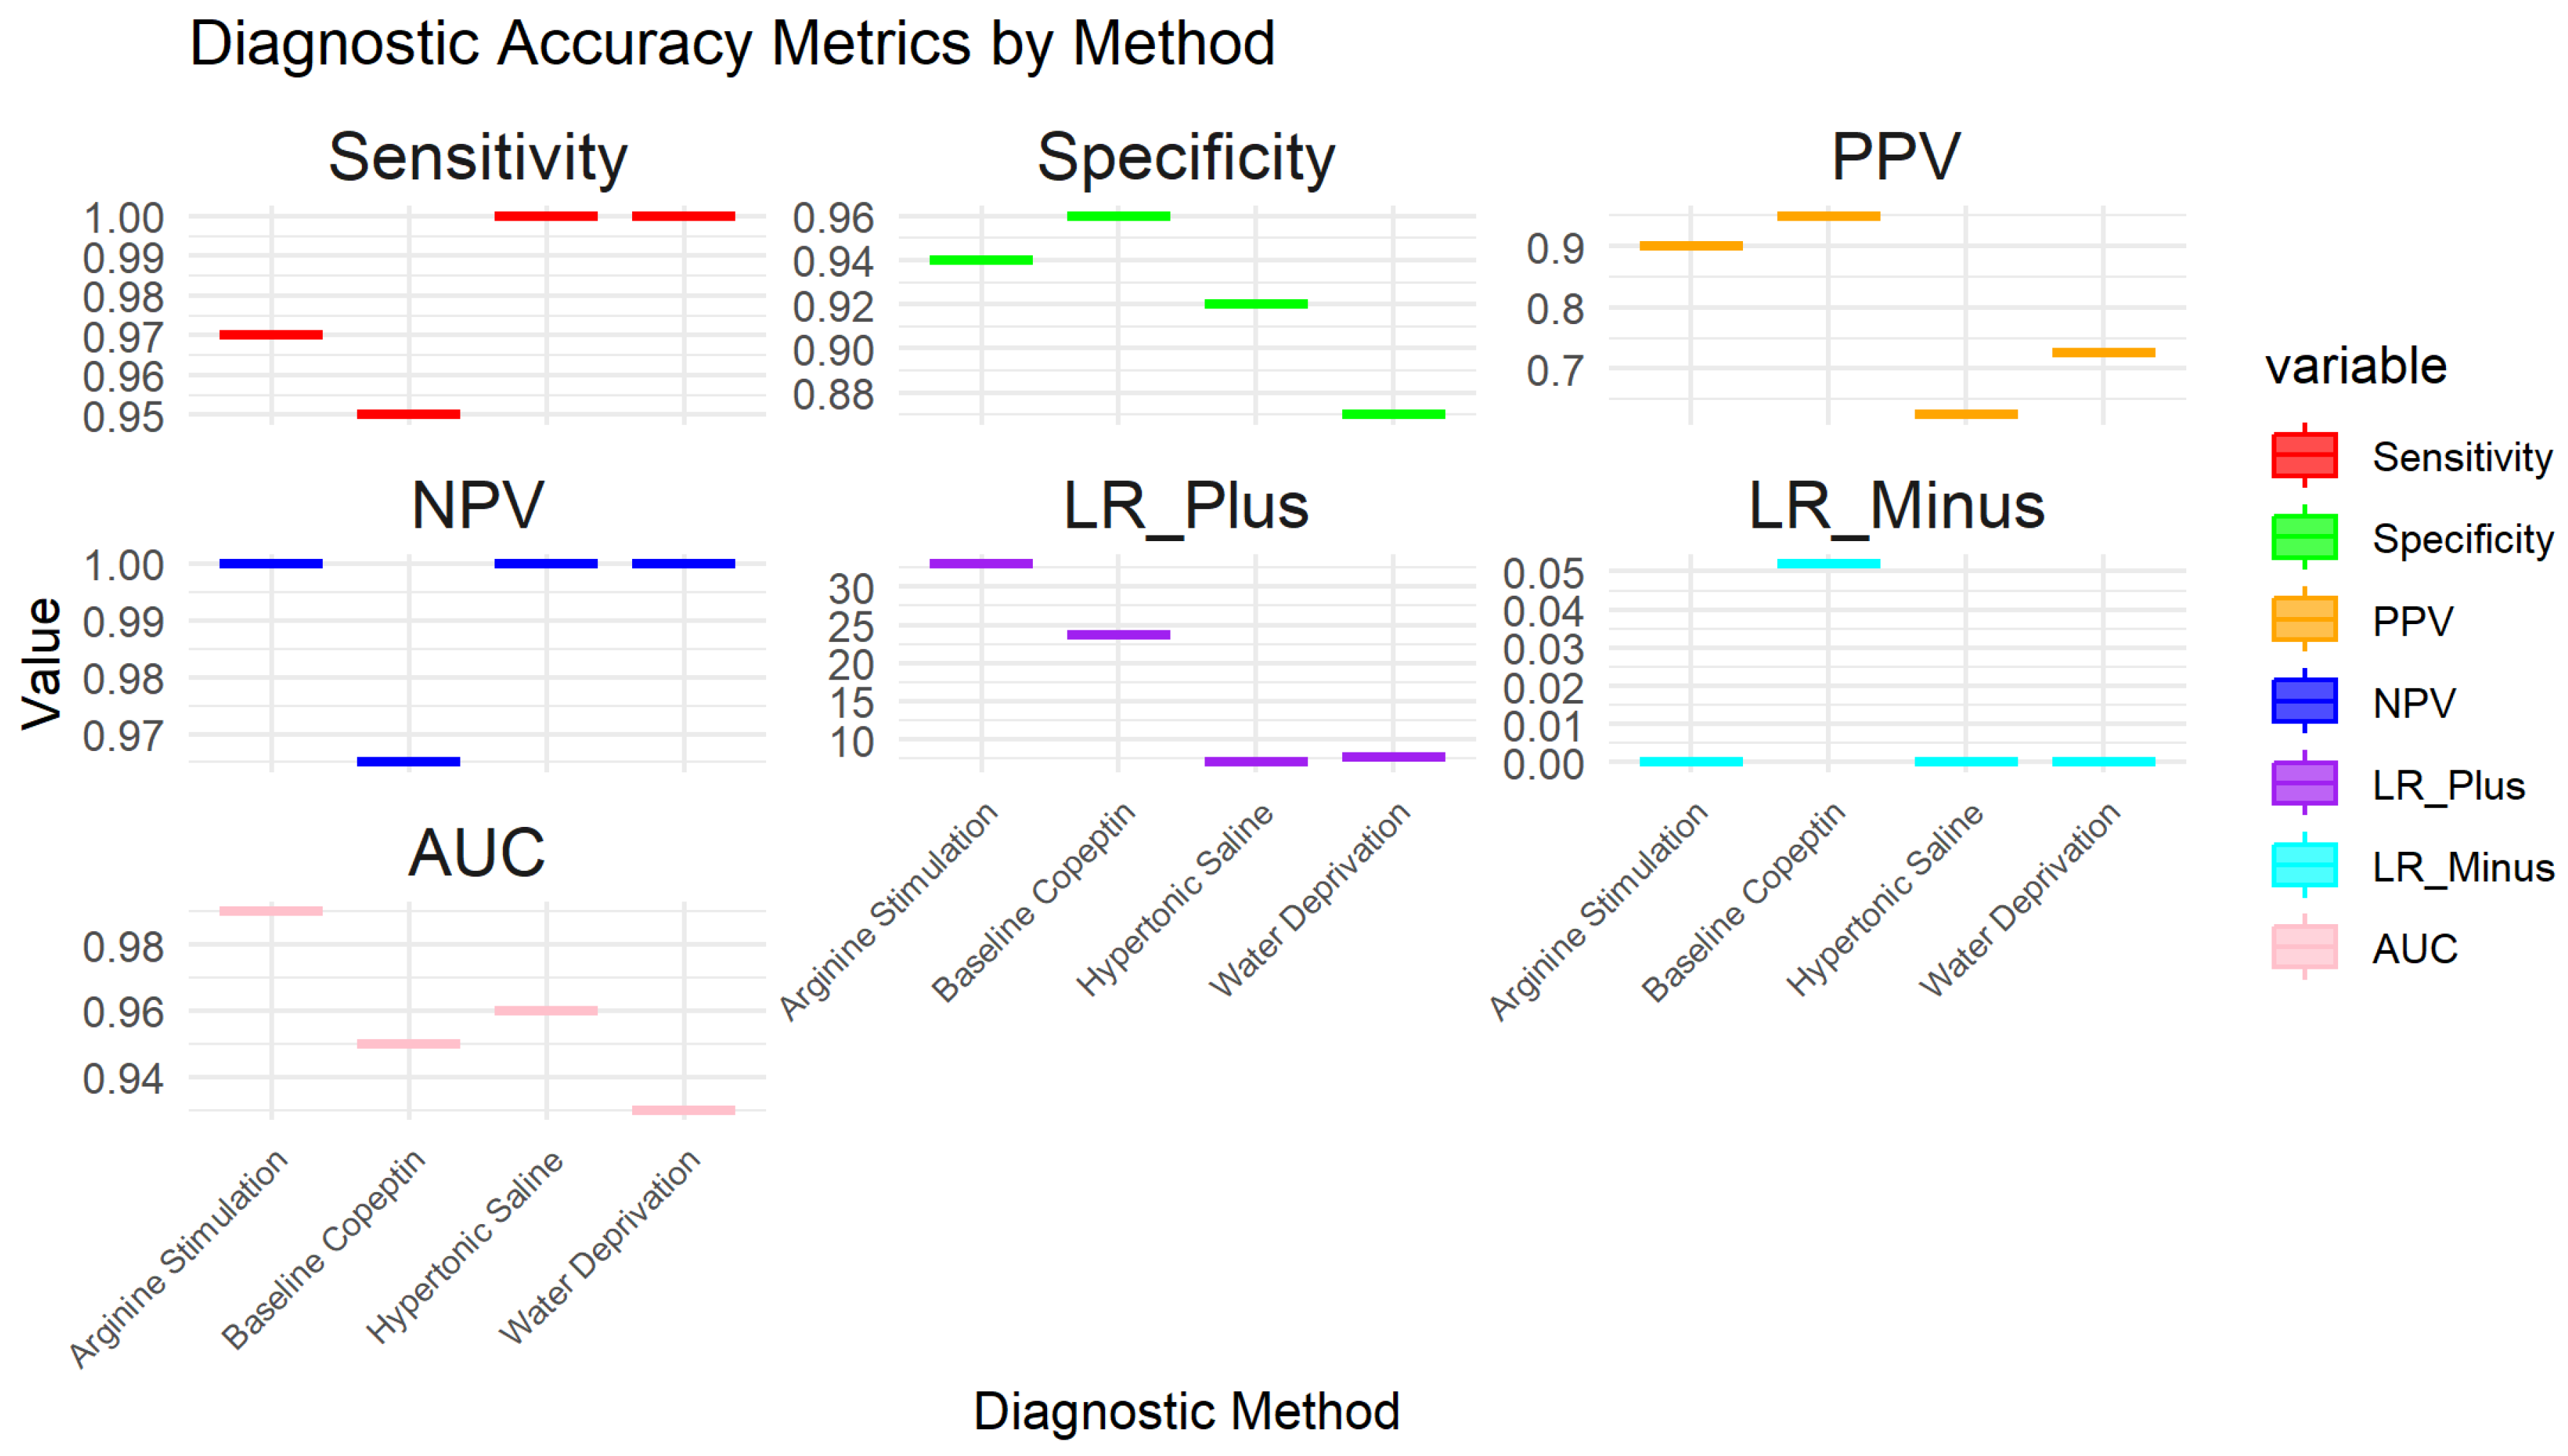
Table 1.
Key selected studies.
| Study | Citation | Participants | Clinical Setting | Study Design | Target Condition | Index Test | Reference Standard | Sample Size | Funding Sources |
|---|---|---|---|---|---|---|---|---|---|
| 1 | Fenske et al., 2018 [10] | 156 patients aged 16 years or older | 11 tertiary medical centers in Switzerland, Germany, | Prospective multicenter study | Hypotonic polyuria | Copeptin measurement after water deprivation and hypertonic saline tests. | Final reference diagnosis by expert consensus. clinical diagnosis based on established criteria for central diabetes insipidus (CDI) and primary polydipsia (PP). | 156 participants | Supported by Swiss National Foundation, University Hospital Basel, Federal Ministry of Education and Research, Germany, Deutsche Forschungsgemeinschaft, Thermo Fisher Scientific |
| 2 | Kitamura M, et al. 2022 [16] | 27 patients polyuria and/or polydipsia (5 with central diabetes insipidus, 5 with primary polydipsia, 1 with nocturnal enuresis, and 16 with type 1 diabetes mellitus excluded due to hyperglycemia). | Department of Pediatrics and Child Health, Kurume University School of Medicine, Japan. | Retrospective chart review | Central diabetes insipidus (CDI), primary polydipsia (PP), nocturnal enuresis | Hypertonic saline test, urine gravity in the morning | Copeptin levels, urine volume over 24 hours, urinary osmolality, plasma osmolality | 27 participants | Not specified |
| 3 | Tuli, G., Munarin, J., De Sanctis, L. (2023) [17] | Children with PPS including 7 with primary polyuria (PP), 6 with central diabetes insipidus (CDI), and 50 control subjects. | Department of Pediatric Endocrinology, Regina Margherita Children Hospital. | Prospective study | Central diabetes insipidus (CDI), primary polyuria (PP). | Arginine-stimulated copeptin test | Water deprivation test (WDT) | 63 participants (13 patients with PPS, 50 controls). | Not specified. |
| 4 | Winzeler B., et. al. 2019 [18] | Development cohort: 52 patients (12 with complete DI, 9 with partial DI, 31 with PP), 20 healthy adults, and 42 child controls; Validation cohort: 46 patients (12 with complete DI, 7 with partial DI, 27 with PP) and 30 healthy adult controls. | Multi-center study involving University Hospital Basel and five other centers in Switzerland and Germany | Prospective diagnostic study | Complete and partial diabetes insipidus, primary polydipsia. | Arginine-stimulated copeptin measurements | diagnostic accuracy of copeptin levels | Development cohort: 114 participants; Validation cohort: 76 participants (after exclusions). | Swiss National Science Foundation and University Hospital Basel. |
| 5 | Binder, G., Weber, K., Peter, A., & Schweizer, R. (2023) [19] | 72 children and adolescents tested for growth hormone deficiency, including 4 with confirmed central diabetes insipidus (CDI). | University Children's Hospital Tübingen, Germany | Monocentric retrospective analysis | Central diabetes insipidus (CDI). | Arginine-stimulated copeptin test. | Water deprivation test, serum osmolalityarginine-stimulation test and clinical evaluation | 72 participants (68 non-CDI, 4 with CDI) | Not specified. |
| 6 | Pedrosa et al., 2018 [20] | 52 patients aged 12–77 years (mean age 38.3 years; 53% women) | Hermes Pardini Endocrine Testing Center, Brazil | Retrospective analysis | Polyuria-Polydipsia Syndrome (PPS) | Hypertonic saline infusion followed by copeptin measurement | Plasma AVP levels | 52 participants | Supported by FAPEMIG and CNPq, JBD received a PhD grant from CAPES |
| 7 | Tuli, G., Munarin, J., De Sanctis, L. 2018 [21] | 80 children (53 control subjects, 12 hypopituitary children, and 15 children with PPS). | Pediatric Endocrinology Department. | Prospective observational study | Nephrogenic diabetes insipidus (NDI), complete central diabetes insipidus (CDI), and primary polydipsia (PP). | Copeptin levels after hypertonic saline infusion test and Water deprivation test | Plasma arginine-vasopressin (AVP) analysis | 80 participants | Not specified |
| 8 | March, C. A., Sastry, S., McPhaul, M. J., Wheeler, S. E., & Garibaldi, L. (2024). [22] | 47 healthy short children (controls), 10 children with primary polydipsia, and 10 children with AVP deficiency. | Pediatric endocrinology settings | Prospective interventional study. | Polyuria-polydipsia syndrome (PPS), arginine vasopressin (AVP) deficiency, primary polydipsia. | Arginine + LevoDopa/Carbidopa stimulation test (ALD-ST) for copeptin measurement. | Copeptin levels measured at baseline and after stimulation. | 67 participants (47 controls, 10 with primary polydipsia, 10 with AVP deficiency). | Not specified |
| 9 | Al Nofal, A., et. Al. (2024). [23] | 29 critically ill patients, including 6 infants, with hyper- or hypo-natremia. | Single-center study conducted in a hospital setting. | Retrospective case series. | Central diabetes insipidus (CDI), syndrome of inappropriate antidiuresis (SIAD). | Copeptin levels after hypertonic saline test. | Diagnostic thresholds for CDI and SIAD. | 29 patients (38% post-neurosurgical procedures). | Not specified |
| 10 | Gippert, S., Brune, M., Dirksen, R. L., Choukair, D., Bettendorf, M. (2024) [24] | 69 patients (32 with central diabetes insipidus [CDI], 32 matched controls, and 5 with primary polydipsia [PP]). | Single-center study in a pediatric endocrinology department. | Retrospective study | Central diabetes insipidus (CDI), primary polydipsia (PP) | Copeptin measurement following water deprivation test. | Comprehensive clinical and diagnostic characteristics, water deprivation test, and hypertonic saline infusion. | 69 participants | Not specified |
| 11 | Bonnet, L., et. al. 2024 [25] | 353 children aged 2 months to 18 years | Pediatric endocrinology and nephrology departments in France. | Single-center retrospective descriptive study | Central diabetes insipidus (CDI), primary polydipsia (PP), and other related conditions | Copeptin levels measured after arginine stimulation | Comparison with traditional diagnostic criteria for CDI and PP. | 353 participants, with 16 diagnosed with CDI and 18 with PP. | Funded by the University of Pittsburgh Clinical and Translational Science Institute Clinical and Translational Science Scholars Program (NIH/NCATS 1 KL2 TR001856). |
Table 2.
Results of individual studies.
| Study | TP | FN | TN | FP | Sensitivity (95% CI) | Specificity (95% CI) | PPV (95% CI) | NPV (95% CI) | LR+ (95% CI) | LR- (95% CI) | AUC (95% CI) |
|---|---|---|---|---|---|---|---|---|---|---|---|
| 1 Fenske et al. 2018 | 56 | 3 | 82 | 3 | 0.95 (95% CI: 85.15% - 99.36%) | 0.96 (96% CI: 89.73% - 98.89%) | 0.949 CI: (0.902-0.996) | 0.965 CI: (0.926-1.000) | 23.75 CI: (6.91-81.57) | 0.052 CI: (0.011-0.241) | 0.95 CI: (0.88-0.98) |
| 2 Kitamura et al. 2022 | 5 | 0 | 19 | 3 | 1 (100% CI: 56.56%-100%) | 0.857 (85.7% CI: 64.54% - 95.85%) | 0.625 CI: (0.396-0.854) | 1.000 CI: (0.829-1.000) | 7.00 CI: (2.55-19.24) | 0.000 CI: (0.00-0.00) | 0.93 CI: (0.85-0.99) |
| 3 Tuli G. et al. 2023 | 6 | 0 | 49 | 8 | 1 (100% CI: 61.51% -100%) | 0.857 (85.7% CI: 72.25% - 93.37%) | 0.429 CI: (0.237-0.621) | 1.000 CI: (0.928-1.000) | 7.00 CI: (2.55-19.24) | 0.000 CI: (0.00-0.00) | 0.93 CI: (0.83-0.98) |
| 4 Winzeler et al. 2019 | 11 | 0 | 54 | 2 | 1 (100% CI – 71.51% - 100%) | 0.96 (96% CI: 84.98% -99.46%) | 0.846 CI: (0.709-0.983) | 1.000 CI: (0.932-1.000) | 25.00 CI: (6.32-98.89) | 0.000 CI: (0.00-0.00) | 0.98 CI: (0.92-1.00) |
| 5 Binder et al. 2023 | 4 | 0 | 17 | 0 | 1 (100% CI: 56.56%-100%) | 1 (100% CI: 76.03% - 100%) | 1.000 CI: (0.783-1.000) | 1.000 CI: (0.803-1.000) | N/A (perfect tets) | N/A (perfect tets) | 1.00 (perfect test) CI: (0.90-1.00) |
| 6 Pedrosa et al. 2018 | 8 | 0 | 26 | 1 | 1 (100% CI: 56.56% - 1000%) | 0.96 (96% CI: 77.97% -99.57%) | 0.889 CI: (0.679-1.000) | 1.000 CI: (0.867-1.000) | 25.00 CI: (3.66-171.14) | 0.000 CI: (0.00-0.00) | 0.98 CI: (0.92-1.00) |
| 7 Tuli et al. 2018 | 9 | 0 | 36 | 1 | 1 (100% CI: 61.51% - 100%) | 0.97 (97% CI: 83.34% - 99.63%) | 0.900 CI: (0.742-1.000) | 1.000 CI: (0.889-1.000) | 33.00 CI: (4.72-230.84) | 0.000 CI: (0.00-0.00) | 0.99 CI: (0.92-1.00) |
| 8 March et al. 2018 | 8 | 0 | 22 | 2 | 1 (100% CI: 61.51% - 100%) | 0.92 (92% CI: 69.99% - 98.98%) | 0.800 CI: (0.543-1.000) | 1.000 CI: (0.824-1.000) | 12.50 CI: (3.46-45.13) | 0.000 CI: (0.00-0.00) | 0.96 CI: (0.88-0.99) |
| 9 Nofal et al. 2023 | 10 | 0 | 29 | 1 | 1 (100% CI: 69.15% - 100%) | 0.95 (95% CI: 80.53% -99.29%) | 0.909 CI: (0.725-1.000) | 1.000 CI: (0.868-1.000) | 20.00 CI: (4.65-86.08) | 0.000 CI: (0.00-0.00) | 0.98 CI: (0.90-0.99) |
| 10 Gippert et al. 2023 | 12 | 0 | 36 | 2 | 1 (100% CI: 73.54% - 100%) | 0.94 (94% CI: 80.09% - 98.40%) | 0.857 CI: (0.689-1.000) | 1.000 CI: (0.917-1.000) | 16.67 CI: (5.15-53.89) | 0.000 CI: (0.00-0.00) | 0.97 CI: (0.89-0.99) |
| 11 Bonnet et al. 2021 | 8 | 0 | 20 | 3 | 1 (100% CI: 56.56% - 100%) | 0.87 (87% CI: 66.89% - 95.45%) | 0.727 CI: (0.476-0.978) | 1.000 CI: (0.823-1.000) | 7.69 CI: (2.86-20.64) | 0.000 CI: (0.00-0.00) | 0.93 CI: (0.82-0.97) |
Table 3.
Variances and Weights.
| Study | Sensitivity | Specificity | AUC (95% CI) | Sensitivity Variance | Specificity Variance | AUC Variance | Weight (Sensitivity) | Weight (Specificity) | Weight (AUC) |
|---|---|---|---|---|---|---|---|---|---|
| 1 Fenske et al. 2018 | 0.95 | 0.96 | 0.95 | 0.0013 | 0.000548 | 0.000423 | 769.23 | 1824.82 | 2364.07 |
| 2 Kitamura et al. 2022 | 1.00 | 0.857 | 0.93 | 0.0123 | 0.0064 | 0.006735 | 81.30 | 156.25 | 148.48 |
| 3 Tuli G. et al. 2023 | 1.00 | 0.857 | 0.93 | 0.0097 | 0.0029 | 0.005389 | 103.09 | 344.83 | 185.56 |
| 4 Winzeler et al. 2019 | 1.00 | 0.96 | 0.98 | 0.0053 | 0.0014 | 0.000904 | 188.68 | 714.29 | 1106.19 |
| 5 Binder et al. 2023 | 1.00 | 1.00 | 1.00 | 0.0123 | 0.0037 | 0.001 | 81.30 | 270.27 | 1000.0 |
| 6 Pedrosa et al. 2018 | 1.00 | 0.96 | 0.98 | 0.0123 | 0.0030 | 0.001271 | 81.30 | 333.33 | 786.78 |
| 7 Tuli et al. 2018 | 1.00 | 0.97 | 0.99 | 0.0097 | 0.0017 | 0.000565 | 103.09 | 588.24 | 1769.91 |
| 8 March et al. 2018 | 1.00 | 0.92 | 0.96 | 0.0097 | 0.0054 | 0.002507 | 103.09 | 185.19 | 398.88 |
| 9 Nofal et al. 2023 | 1.00 | 0.95 | 0.98 | 0.0062 | 0.0023 | 0.001015 | 161.29 | 434.78 | 985.22 |
| 10 Gippert et al. 2023 | 1.00 | 0.94 | 0.97 | 0.0046 | 0.0022 | 0.001247 | 217.39 | 454.55 | 801.92 |
| 11 Bonnet et al. 2021 | 1.00 | 0.87 | 0.93 | 0.0123 | 0.0053 | 0.004267 | 81.30 | 188.68 | 234.36 |
Disclaimer/Publisher’s Note: The statements, opinions and data contained in all publications are solely those of the individual author(s) and contributor(s) and not of MDPI and/or the editor(s). MDPI and/or the editor(s) disclaim responsibility for any injury to people or property resulting from any ideas, methods, instructions or products referred to in the content. |
© 2024 by the authors. Licensee MDPI, Basel, Switzerland. This article is an open access article distributed under the terms and conditions of the Creative Commons Attribution (CC BY) license (http://creativecommons.org/licenses/by/4.0/).
Copyright: This open access article is published under a Creative Commons CC BY 4.0 license, which permit the free download, distribution, and reuse, provided that the author and preprint are cited in any reuse.


