Submitted:
02 September 2024
Posted:
03 September 2024
You are already at the latest version
Preprints on COVID-19 and SARS-CoV-2
Abstract
This study aimed to investigate the impact of specific single nucleotide polymorphisms (SNPs) on clinical and laboratory outcomes in COVID-19 patients receiving Paxlovid treatment. The primary focus was on genetic variants in IFNAR2, OAS1, OAS3, and ACE2.
Laboratory parameters were assessed at admission and discharge, including oxygen saturation, white blood cell count, absolute neutrophil and lymphocyte counts, erythrocyte sedimentation rate, platelet count, hematocrit, and various liver and kidney function tests.
The results demonstrated significant associations between certain SNPs and clinical outcomes. Patients with the IFNAR2 rs2236757 G allele exhibited improved oxygen saturation and lower eosinophil counts. The OAS3 rs10735079 and OAS1 rs10774671 G allele was associated with lower eosinophil and total bilirubin levels.
Furthermore, patients with the ACE2 rs2074192 C allele showed increased segmented neutrophils and AST levels, while the T allele was associated with lower total bilirubin levels.
These findings indicate that the efficacy of Paxlovid treatment may be influenced by genetic variations in IFNAR2, OAS1, OAS3, and ACE2. Further research is warranted to investigate the potential therapeutic implications of these genetic markers.
Keywords:
COVID-19
; Paxlovid
; Nirlmetralvir
; IFNAR2
; OAS1
; OAS3
; ACE2
1. Introduction
Since the emergence of the severe acute respiratory syndrome coronavirus 2 (SARS-CoV-2) pandemic, numerous antiviral therapeutic strategies have been explored to combat COVID-19.
Paxlovid, a combination therapy comprising nirmatrelvir and ritonavir, has garnered significant attention as a potential treatment option [1]. Nirmatrelvir, a specific inhibitor targeting the SARS-CoV-2 main protease, is synergistically enhanced by ritonavir, a cytochrome P450 3A4 inhibitor. Several studies have demonstrated the efficacy of Paxlovid in reducing COVID-19-related mortality and hospitalization rates [2,3,4,5]. In particular, a randomized controlled trial reported an 89% reduction in the risk of hospitalization and death within 28 days when Paxlovid was administered within three days of symptom onset [6].
Although the nirmatrelvir-ritonavir combination is generally well-tolerated, the available data on adverse events associated with this therapy remains limited. Common side effects reported in clinical studies include dysgeusia (altered taste) and diarrhea [3,7,8]. A comprehensive analysis by Li et al. [9] further elucidated the spectrum of adverse events associated with nirmatrelvir-ritonavir administration. The majority of these events were non-serious, with dysgeusia, diarrhea, nausea, headache, pyrexia, vomiting, and malaise being the most frequently observed.
Individual patient variability in drug response is a well-established phenomenon. Doses that are effective for some patients may prove ineffective or cause adverse reactions in others. Drugs primarily metabolized by a single enzyme and with a wide therapeutic index may exhibit significant pharmacokinetic variability due to pharmacogenetic variants. However, given their wide therapeutic window, these genetic differences may not necessarily translate into clinically relevant variations in drug efficacy or toxicity. For instance, drug interactions or underlying diseases that inhibit one metabolic pathway, coupled with genetic variations that impair a second pathway, can contribute to atypical drug responses [10].
Genetic polymorphisms have been implicated in both the susceptibility to and severity of COVID-19, affecting various biological pathways relevant to the disease [11,12,13,14]. The angiotensin-converting enzyme 2 (ACE2) receptor serves as the primary entry point for SARS-CoV-2 [11]. A specific intronic variant, rs2074192, has been associated with alterations in RNA secondary structure, potentially influencing the balance between ACE2 transcription and translation. This dysregulation could impact the binding affinity of SARS-CoV-2 to angiotensin receptors [12]. Notably, studies have identified a correlation between the rs2074192 polymorphism in the ACE2 gene and the severity of COVID-19 in adult populations [13].
In addition, genetic polymorphisms related to the immune response play a crucial role in susceptibility to COVID-19. Variations in interferon genes or their receptors have been linked to increased susceptibility or more severe clinical outcomes [14,15,16]. The IFNAR2 rs2236757 variant, in particular, has been strongly associated with increased disease severity [14]. Furthermore, polymorphisms in antiviral 2′,5′-oligoadenylate synthetase (OAS) enzymes, which are essential for the immune response against SARS-CoV-2, have also been implicated in COVID-19 severity [14]. SNPs such as rs10774671 in OAS1 [17] and rs10735079 in OAS3 [14] may be associated with more severe clinical outcomes following COVID-19 infection.
Given the recommended use of Paxlovid for COVID-19 treatment, further research is warranted to investigate its impact on clinical and laboratory parameters in patients. The presence of specific single nucleotide polymorphisms and their potential effects on treatment outcomes adds to the complexity of managing COVID-19 patients. This review will delve into how certain SNP variations may influence clinical and laboratory outcomes during Paxlovid therapy for COVID-19.
2. Materials and Methods
2.1. Sample Collection
The study included 23 adults of European ancestry (Ukrainian ethnicity) aged 31 to 79 years who tested positive for SARS-CoV-2 and were subsequently hospitalized between October 2022 and May 2023. Confirmation of SARS-CoV-2 infection was achieved through real-time polymerase chain reaction (RT-PCR) analysis of nasopharyngeal swab samples. Participants were recruited from Ternopil City Community Hospital №1. Informed consent was obtained prior to blood sample collection, which were subsequently stored at -80°C for subsequent analysis. All procedures were conducted in accordance with the Declaration of Helsinki and and were approved by the Ethics Committee of I. Horbachevsky Ternopil National Medical University (protocol №74, dated October 13, 2023).
Inclusion criteria included a confirmed COVID-19 diagnosis necessitating hospitalization, the absence of chronic diseases, and no prior antibiotic or probiotic use within the preceding three months. Exclusion criteria encompassed pre-enrollment corticosteroid use, active serious bacterial infection upon admission, pregnancy, alcohol dependence, and HIV infection.
All patients received Nirmatrelvir-ritonavir (Paxlovid) in accordance with Food and Drug Administration (FDA) recommendations, consisting of an oral dose of 300/100 mg twice daily for five days [18].
2.2. Laboratory and Clinical Data
A comprehensive panel of laboratory tests was conducted, encompassing oxygen saturation, leukocytes, neutrophil and lymphocyte counts, erythrocyte sedimentation rate (ESR), platelet count, hematocrit, international normalized ratio (INR), prothrombin time (PT), quick prothrombin time (QTP), activated partial thromboplastin time (APTT), fibrinogen, total bilirubin, alanine aminotransferase (ALT), aspartate aminotransferase (AST), serum creatinine, gamma-glutamyl transferase (GGT), total protein, albumin, alkaline phosphatase (ALP), C-reactive protein (CRP), and blood glucose.
2.3. Identifying Genetic Polymorphisms
Venous blood samples were collected and genomic DNA was extracted using a commercial kit The Thermo Scientific™ GeneJET™ Whole Blood Genomic DNA Purification Mini Kit Cat. No K0781. Polymorphisms in the ACE2, IFNAR2, OAS1, and OAS3 genes were analyzed using real-time PCR. TaqMan assays were employed, and PCR conditions were optimized for amplification and melting curve analysis. The CFX96™Real-Time PCR Basic Software was utilized for genotyping analysis based on the melting curve.
2.4. Statistical Analysis
Descriptive statistics were employed to characterize patient demographics and clinical outcomes. Due to non-normal data distribution, non-parametric tests were employed for comparisons. The Mann-Whitney U test, Kruskal-Wallis test, Dunn’s multiple comparison test, and Wilcoxon matched pairs test were utilized for appropriate comparisons. Statistical significance was set at a two-tailed alpha level of 0.05. Analyses were conducted using GraphPad Prism (version 8.4.3) and IBM SPSS Statistics(version 25).
3. Results
The average age of COVID-19 patients receiving Paxlovid treatment (11 women and 12 men) was 59.6 ± 14.5 years.
3.1. Alleles, Genotypes and Clinical Outcomes
We conducted a comparative analysis of clinical and laboratory outcomes in patients at the time of hospital discharge (Table 1).
Patients carrying the IFNAR2 rs2236757 G allele exhibited significantly lower band neutrophil counts (2%, IQR 2-4 vs. 5.5%, IQR 4.25–6.75, p=0.001) compared to those without the G allele (Figure 1A).
Patients with the OAS3 rs10735079 G allele demonstrated elevated levels of leukocytes (10.4*109/L, IQR 7.59–14.2 vs. 6.59*109/L, IQR 4.56–8.29, p=0.015), monocytes (7%, IQR 5–11vs. 4%, IQR 3–7.25, p=0.019) and hematocrit (41%, IQR 36.2–44 vs. 34.2%, IQR 30.5–37.3, p=0.018) compared to those without the G allele (Figure 1B, C and D). Additionally, patients with the OAS1 rs10774671 G allele exhibited higher leukocyte (10.1*109/L, IQR 6.74–14 vs. 6.19*109/L, IQR 4.40–8.34, p=0,023) and hematocrit (40.2%, IQR 35.2–43.5 vs. 35%, IQR 30.2–37.4, p=0.040) levels compared to those without the G allele (Figure 1C and D).

Table 2.
Impact of SNP alleles on clinical and laboratory outcomes at discharge in Paxlovid-treated COVID-19 patients.
Table 2.
Impact of SNP alleles on clinical and laboratory outcomes at discharge in Paxlovid-treated COVID-19 patients.
| IFNAR2 rs2236757 | |||
| No Allele G (n=4) | Allele G (n=19) | p-Valuea | |
| Band neutrophils, % (IQR) | 5.5 (4.25–6.75) | 2 (2–4) | p=0.001 |
| OAS3 rs10735079 | |||
| No Allele G (n=10) | Allele G (n=13) | p-Value | |
| Leukocytes, 109/L | 6.59 (4.56–8.29) | 10.4 (7.59–14.2) | p=0.015 |
| Monocytes, % | 4 (3–7.25) | 7 (5–11) | p=0.019 |
| Hematocrit, % | 34.2 (30.5–37.3) | 41 (36.2–44) | p=0.018 |
| OAS1 rs10774671 | |||
| No Allele G (n=9) | Allele G (n=14) | p-Value | |
| Leukocytes, 109/L | 6.19 (4.40–8.34) | 10.1 (6.74–14) | p=0.023 |
| Hematocrit, % | 35 (30.2–37.4) | 40.2 (35.2–43.5) | p=0.040 |
aMann-Whitney test; statistically significant findings are denoted in bold.
We further compared patients with different SNP genotypes (Figure 2). Patients with the IFNAR2 rs2236757 AA genotype exhibited higher band neutrophil counts compared to those with the AG genotype (5.5% IQR 4,25–6,75 vs. 3%, 2–4, p=0.042) and the GG genotype (5.5% IQR 4,25–6,75 vs. 2%, 1,25–3,5, p=0.011) (Figure 2A).
Patients with the OAS1 rs10774671 AA genotype demonstrated lower leukocyte levels compared to those with the AG genotype (6.59*109/L, IQR 4,56–8,29 vs. 10.59*109/L, IQR 8,4–14,9, p=0.037)( Figure 2B). Patients with the OAS3 rs10735079 genotype exhibited significant differences in monocyte levels between genotypes as assessed by the Kruskal-Wallis test (p=0,039). However, no significant differences were observed when analyzed using Dunn’s multiple comparisons test (Figure 2C).
3.2. Alleles, Genotypes and Clinical Outcomes
To investigate the potential impact of specific alleles on laboratory outcome variability during hospitalization in COVID-19 patients receiving Paxlovid treatment, a comparative analysis was conducted (Table 3).
At discharge, patients with the IFNAR2 rs2236757 G allele exhibited higher SpO2 (98%, IQR 97–98 vs. 96%, IQR 92–97, p=0.019), segmented neutrophil counts (66%, IQR 52–78 vs. 55%, IQR 46–75, p=0.029) and AST (30.8 mmol/L, IQR 23.3–94.1 vs. 22.6 mmol/L, IQR 16.6–25.8, p=0.014) levels. Conversely, they displayed lower eosinophil counts (1%, IQR 0–1 vs. 1%, IQR 1–2, p=0.048), hematocrit (37%, IQR 32–42.7 vs. 40%, IQR 34.2–45, p=0.040), APTT (29.8 sec., IQR 25–33.7 vs. 33.2 sec, IQR 29.4–37, p=0.025) and total bilirubin (11.2 mmol/L, IQR 10.5–13.5 vs. 13.7 mmol/L, IQR 10.8–19.1, p=0.029) levels. Patients with the IFNAR2 rs2236757 A allele demonstrated higher platelet counts (215*109/L, IQR 166–244 vs. 173*109/L, IQR 142–204, p=0,041) and lower ESR (5 mm/hr, IQR 4–6 vs. 7 mm/hr, IQR 4–11, p=0,021), creatinine (92 mmol/L, IQR 84–109 vs. 103 mmol/L, IQR 95–117, p=0.044) and albumin (43 g/L, IQR 37–51 vs. 50 g/L, IQR 45–57, p=0,023) levels.
Patients with the ACE2 rs2074192 C allele exhibited higher SpO2 (98%, IQR 97–98 vs. 96%, IQR 93.5–98, p=0.019), segmented neutrophil counts (66%, IQR 51.3–75.8 vs. 57%, IQR 46–71.3, p=0.016) and AST (32.3 mmol/L, IQR 24.2–81.2 vs. 22.4 mmol/L, IQR 17.2–26.3, p=0.004) levels along with lower APTT (29.8 sec., IQR 25.5–34.9 vs. 33.3 sec, IQR 29.7–37.1, p=0.027) and fibrinogen (3.33 g/L, IQR 2.76–3.99 vs. 3.99 g/L, IQR 3.55–4.94, p=0,017) levels. n contrast, patients with the ACE2 rs2074192 T allele displayed lower total bilirubin (10.8 mmol/L, IQR 10.2–12 vs. 12.9 mmol/L, IQR 10.7–17.8, p=0.028) and ALP (136 mmol/L, IQR 94.3–148 vs. 148 mmol/L, IQR 125–165, p=0.025) levels.
Patients with the OAS3 rs10735079 A allele exhibited higher segmented neutrophil counts (70.5%, IQR 53,3–77,3 vs. 61%, IQR 47,5–73,8, p=0.027) and AST (30.1 mmol/L, IQR 24,5–67,4 vs. 22.7 mmol/L, IQR 19,4–27,3, p=0.006) levels but lower hematocrit (37.2%, IQR 31,5–42 vs. 38.6%, IQR 34,3–43,5, p=0.021), APTT (29.8 sec., IQR 26,9–35,2 vs. 34.2 sec, IQR 30–37,2, p=0.033) and ALP (113 mmol/L, IQR 93,8–144 vs. 136 mmol/L, IQR 115–152, p=0.025) levels. Conversely, patients with the OAS3 rs10735079 G allele displayed lower eosinophils count (1%, IQR 0–1 vs. 1%, IQR 1–2,5, p=0.046), fibrinogen (3.33 g/L, IQR 2,11–3,88 vs. 3.99 g/L, IQR 3,55–4,1, p=0,031) and total bilirubin (10.7 mmol/L, IQR 10,3–13,2 vs. 12.9 mmol/L, IQR 11,1–20,6, p=0.021) levels.
Patients with the OAS1 rs10774671 A allele exhibited higher segmented neutrophil counts (70.5%, IQR 53,3–77,3 vs. 47.5%, IQR 61–73,8, p=0.027), and AST (30.1 mmol/L, IQR 24,5–67,4 vs. 22.7 mmol/L, IQR 19,4–27,3, p=0.006) levels, lower hematocrit (37.2%, IQR 31,5–42 vs. 38.6%, IQR 34,3–43,5, p=0.021) and ALP (113 mmol/L, IQR 93,8–144 vs. 136 mmol/L, IQR 115–152, p=0.025) levels. Patients with OAS1 rs10774671 G allele showed lower eosinophils count (1%, IQR 0–1 vs. 1%, IQR 1–2,25, p=0.035), fibrinogen (3.33 g/L, IQR 2,27–3,99 vs. 3.99 g/L, IQR 3,55–4,26, p=0,046) and total bilirubin (10.9 mmol/L, IQR 10,4–13,7 vs. 13.3 mmol/L, IQR 11,2–22, p=0.014) levels.
4. Discussion
IFNAR2, a transmembrane receptor, is a component of the type I interferon (IFN) receptor complex, recognizing IFN-α and IFN-β [19,20]. Binding of IFN-I to IFNAR initiates a signaling cascade, leading to the expression of interferon-stimulated genes (ISGs) with antiviral, antiproliferative, and immunomodulatory functions [21]. One critical ISG is the RNA-activated protein kinase (PKR). Additionally, IFN activates the oligoadenylate synthetase (OAS) family proteins (OAS1, 2, and 3), which catalyze the synthesis of 2′-5′ oligoadenylate (2′-5′A). 2′-5′A subsequently activates RNase L, resulting in viral RNA degradation [21]. Genetic variations within IFNAR2, OAS1, and OAS3 could potentially disrupt this signaling pathway, leading to decreased protein abundance, impaired receptor internalization, or altered ligand interactions, thereby exacerbating the severity of COVID-19 [14,15,17].
Nirmatrelvir, an orally administered protease inhibitor, binds to the catalytic dyad of Mpro via its nitrile moiety. Ritonavir, a tripeptide, inhibits HIV protease by binding to its active site [22]. Nirmatrelvir demonstrates potent inhibitory activity against Mpro in all seven human coronavirus genotypes, including alpha-coronaviruses (HCoV-NL63 and HCoV-229E) and beta-coronaviruses (MERS-CoV, SARS-CoV-1, SARS-CoV-2, HCoV-OC43, and HCoV-HKU1) [22].
This study aimed to evaluate the impact of Paxlovid treatment on clinical and laboratory outcomes in COVID-19 patients carrying various SNPs associated with the disease.
These indicators are related to the immune response, namely band neutrophils, leukocytes, monocytes and hematocrit. These differences were found in patients with IFNAR2 rs2236757, OAS3 rs10735079 and OAS1 rs10774671. Patients with G allele showed higher level of leukocytes and hehematocrit (OAS1 and OAS3), monocytes (OAS3) while band neutrophils were lower (IFNAR2), suggesting a heightened immune response based on these markers. In contrast, no significant differences were found between patients with ACE2 rs2074192 alleles C and T compared to those without C and T.
When comparing patients at hospitalization and discharge, we identified statistically significant differences in certain outcomes based on the studied polymorphisms (Figure 3).
Regarding oxygen saturation, we observed increases in patients with IFNAR2 rs2236757 G allele and ACE2 rs2074192 C allele. Additionally, patients with IFNAR2 rs2236757 G allele, OAS3 rs10735079, and OAS1 rs1077467 A alleles exhibited elevated segmented neutrophil counts AST levels, and decreased hematocrit.
The G allele of the three interferon-related SNPs was associated with lower eosinophil and total bilirubin levels. Fibrinogen and ALP levels were decreased in patients with OAS3 rs10735079 and OAS1 rs1077467 G and A alleles, respectively, and with ACE2 rs2074192 C and T alleles. Other changes linked to IFNAR2 rs2236757 A allele included increased platelet count and decreased creatinine, albumin, and ESR levels, while the G allele demonstrated a decreased APTT level. Patients with ACE2 rs2074192 C allele exhibited elevated segmented neutrophils and AST levels, decreased APTT, and the T allele was associated with lower total bilirubin levels.
6. Conclusions
This study highlights the significant impact of genetic variations in IFNAR2, OAS1, OAS3, and ACE2 on the clinical and laboratory outcomes of COVID-19 patients receiving Paxlovid treatment. The findings suggest that these SNPs may influence the immune response, liver function, and coagulation parameters
Further research is necessary to elucidate the precise mechanisms underlying these associations and to explore the potential therapeutic implications of targeting these genetic markers for personalized treatment strategies in COVID-19 patients.
Author Contributions
Conceptualization and writing—original draft preparation, M.B. and O.K.; writing—review and editing, V.O., I.H., and I.K.; supervision, O.K., and V.O.; project administration, V.O. and O.K.; visualization, I.K.; funding acquisition, M.B. and I.H. All authors have read and agreed to the published version of the manuscript.
Funding
RECOOP Grant #36—CSMC Senior Scientists (RCSS) “Comprehensive Analysis of Genetic Predictors for MAFLD Development in Patients with COVID-19”.
Institutional Review Board Statement
The study protocol met the requirements for biomedical research and was approved by the Local Ethics Committee of the I. Horbachevsky Ternopil National Medical University as protocol N74, dated 13 October2023.
Informed Consent Statement
All patients signed an informed consent for the study.
Data Availability Statement
Data are contained within the article.
Conflicts of Interest
The authors declare no conflicts of interest.
References
- Najjar-Debbiny, R.; Gronich, N.; Weber, G.; Khoury, J.; Amar, M.; Stein, N.; Goldstein, L.H.; Saliba, W. Effectiveness of Paxlovid in Reducing Severe Coronavirus Disease 2019 and Mortality in High-Risk Patients. Clin. Infect. Dis. an Off. Publ. Infect. Dis. Soc. Am. 2023, 76, e342–e349. [CrossRef]
- Wong, C.K.H.; Au, I.C.H.; Lau, K.T.K.; Lau, E.H.Y.; Cowling, B.J.; Leung, G.M. Real-World Effectiveness of Early Molnupiravir or Nirmatrelvir-Ritonavir in Hospitalised Patients with COVID-19 without Supplemental Oxygen Requirement on Admission during Hong Kong’s Omicron BA.2 Wave: A Retrospective Cohort Study. Lancet. Infect. Dis. 2022, 22, 1681–1693. [CrossRef]
- Hammond, J.; Leister-Tebbe, H.; Gardner, A.; Abreu, P.; Bao, W.; Wisemandle, W.; Baniecki, M.; Hendrick, V.M.; Damle, B.; Simón-Campos, A.; et al. Oral Nirmatrelvir for High-Risk, Nonhospitalized Adults with Covid-19. N. Engl. J. Med. 2022, 386, 1397–1408. [CrossRef]
- Yip, T.C.-F.; Lui, G.C.-Y.; Lai, M.S.-M.; Wong, V.W.-S.; Tse, Y.-K.; Ma, B.H.-M.; Hui, E.; Leung, M.K.W.; Chan, H.L.-Y.; Hui, D.S.-C.; et al. Impact of the Use of Oral Antiviral Agents on the Risk of Hospitalization in Community Coronavirus Disease 2019 Patients (COVID-19). Clin. Infect. Dis. an Off. Publ. Infect. Dis. Soc. Am. 2023, 76, e26–e33. [CrossRef]
- Buchynskyi, M.; Oksenych, V.; Kamyshna, I.; Kamyshnyi, O. Exploring Paxlovid Efficacy in COVID-19 Patients with MAFLD: Insights from a Single-Center Prospective Cohort Study. Viruses 2024, 16. [CrossRef]
- Pfizer Inc. Pfizer’s Novel COVID-19 Oral Antiviral Treatment Candidate Reduced Risk of Hospitalization or Death by 89% in Interim Analysis of Phase 2/3 EPIC-HR Study | Pfizer. Pfizer Website 2021.
- Saravolatz, L.D.; Depcinski, S.; Sharma, M. Molnupiravir and Nirmatrelvir-Ritonavir: Oral Coronavirus Disease 2019 Antiviral Drugs. Clin. Infect. Dis. an Off. Publ. Infect. Dis. Soc. Am. 2023, 76, 165–171. [CrossRef]
- Lamb, Y.N. Nirmatrelvir Plus Ritonavir: First Approval. Drugs 2022, 82, 585–591. [CrossRef]
- Li, M.; Zhang, Q.-S.; Liu, X.-L.; Wang, H.-L.; Liu, W. Adverse Events Associated with Nirmatrelvir/Ritonavir: A Pharmacovigilance Analysis Based on FAERS. Pharmaceuticals (Basel). 2022, 15. [CrossRef]
- Repchuk, Y.; Sydorchuk, L.P.; Sydorchuk, A.R.; Fedonyuk, L.Y.; Kamyshnyi, O.; Korovenkova, O.; Plehutsa, I.M.; Dzhuryak, V.S.; Myshkovskii, Y.M.; Iftoda, O.M.; et al. Linkage of Blood Pressure, Obesity and Diabetes Mellitus with Angiotensinogen Gene (AGT 704T>C/Rs699) Polymorphism in Hypertensive Patients. Bratisl. Lek. Listy 2021, 122, 715–720. [CrossRef]
- Harrison, A.G.; Lin, T.; Wang, P. Mechanisms of SARS-CoV-2 Transmission and Pathogenesis. Trends Immunol. 2020, 41, 1100–1115. [CrossRef]
- Pouladi, N.; Abdolahi, S. Investigating the ACE2 Polymorphisms in COVID-19 Susceptibility: An in Silico Analysis. Mol. Genet. genomic Med. 2021, 9, e1672. [CrossRef]
- Sienko, J.; Marczak, I.; Kotowski, M.; Bogacz, A.; Tejchman, K.; Sienko, M.; Kotfis, K. Association of ACE2 Gene Variants with the Severity of COVID-19 Disease-A Prospective Observational Study. Int. J. Environ. Res. Public Health 2022, 19. [CrossRef]
- Pairo-Castineira, E.; Clohisey, S.; Klaric, L.; Bretherick, A.D.; Rawlik, K.; Pasko, D.; Walker, S.; Parkinson, N.; Fourman, M.H.; Russell, C.D.; et al. Genetic Mechanisms of Critical Illness in COVID-19. Nat. 2020 5917848 2020, 591, 92–98. [CrossRef]
- Fricke-Galindo, I.; Martínez-Morales, A.; Chávez-Galán, L.; Ocaña-Guzmán, R.; Buendía-Roldán, I.; Pérez-Rubio, G.; Hernández-Zenteno, R. de J.; Verónica-Aguilar, A.; Alarcón-Dionet, A.; Aguilar-Duran, H.; et al. IFNAR2 Relevance in the Clinical Outcome of Individuals with Severe COVID-19. Front. Immunol. 2022, 13, 949413. [CrossRef]
- Dieter, C.; de Almeida Brondani, L.; Lemos, N.E.; Schaeffer, A.F.; Zanotto, C.; Ramos, D.T.; Girardi, E.; Pellenz, F.M.; Camargo, J.L.; Moresco, K.S.; et al. Polymorphisms in ACE1, TMPRSS2, IFIH1, IFNAR2, and TYK2 Genes Are Associated with Worse Clinical Outcomes in COVID-19. Genes (Basel). 2022, 14. [CrossRef]
- Banday, A.R.; Stanifer, M.L.; Florez-Vargas, O.; Onabajo, O.O.; Papenberg, B.W.; Zahoor, M.A.; Mirabello, L.; Ring, T.J.; Lee, C.-H.; Albert, P.S.; et al. Genetic Regulation of OAS1 Nonsense-Mediated Decay Underlies Association with COVID-19 Hospitalization in Patients of European and African Ancestries. Nat. Genet. 2022, 54, 1103–1116. [CrossRef]
- Ritonavir-Boosted Nirmatrelvir (Paxlovid) | COVID-19 Treatment Guidelines Available online: https://www.covid19treatmentguidelines.nih.gov/therapies/antivirals-including-antibody-products/ritonavir-boosted-nirmatrelvir--paxlovid-/ (accessed on 31 October 2023).
- Kamyshnyi, A.; Koval, H.; Kobevko, O.; Buchynskyi, M.; Oksenych, V.; Kainov, D.; Lyubomirskaya, K.; Kamyshna, I.; Potters, G.; Moshynets, O. Therapeutic Effectiveness of Interferon-A2b against COVID-19 with Community-Acquired Pneumonia: The Ukrainian Experience. Int. J. Mol. Sci. 2023, 24, 6887. [CrossRef]
- Buchynskyi, M.; Kamyshna, I.; Lyubomirskaya, K.; Moshynets, O.; Kobyliak, N.; Oksenych, V.; Kamyshnyi, A. Efficacy of Interferon Alpha for the Treatment of Hospitalized Patients with COVID-19: A Meta-Analysis. Front. Immunol. 2023, 14, 1069894. [CrossRef]
- Sodeifian, F.; Nikfarjam, M.; Kian, N.; Mohamed, K.; Rezaei, N. The Role of Type I Interferon in the Treatment of COVID-19. J. Med. Virol. 2022, 94, 63–81. [CrossRef]
- Owen, D.R.; Allerton, C.M.N.; Anderson, A.S.; Aschenbrenner, L.; Avery, M.; Berritt, S.; Boras, B.; Cardin, R.D.; Carlo, A.; Coffman, K.J.; et al. An Oral SARS-CoV-2 Mpro Inhibitor Clinical Candidate for the Treatment of COVID-19. Science (80-. ). 2021, 374, 1586–1593. [CrossRef]
Figure 1.
Comparison of median clinical and laboratory findings at discharge in COVID-19 patients treated with Paxlovid, stratified by allele g presence (IFNAR2 rs2236757, OAS1 rs10774671, and OAS3 rs10735079). Median values with interquartile ranges (IQRs) are presented. Statistical significance was assessed using the Wilcoxon matched-pairs test.
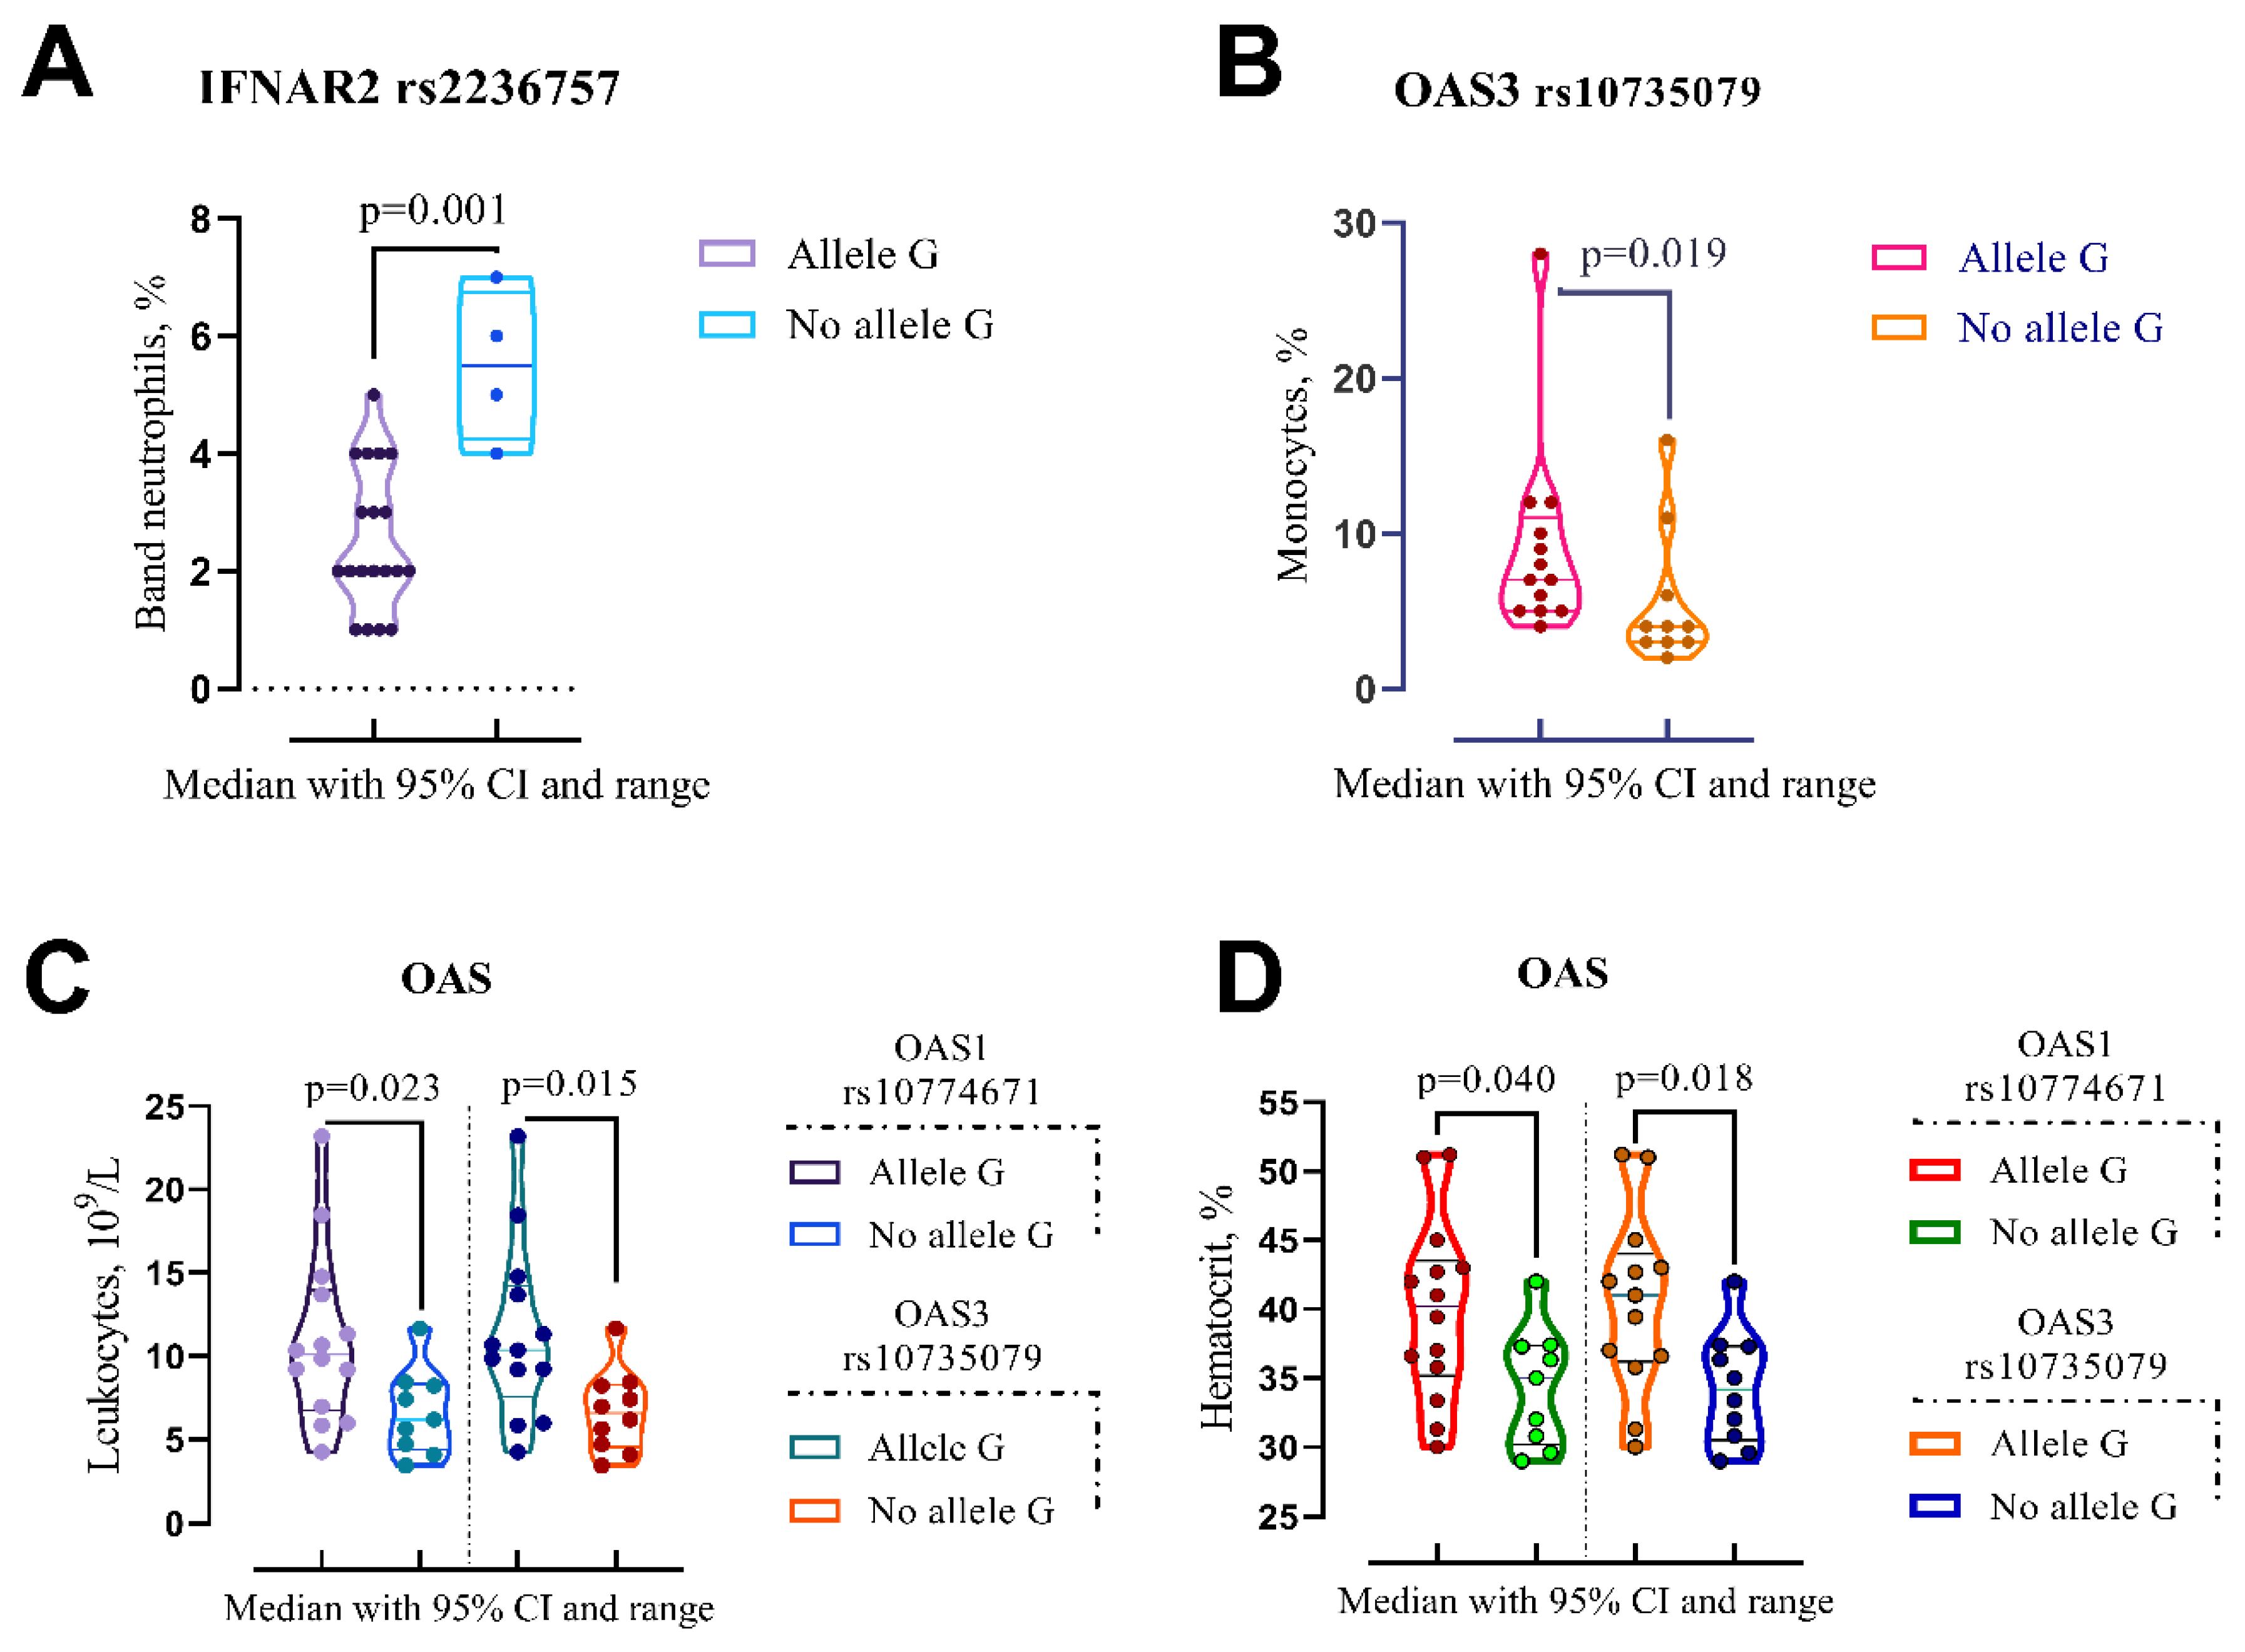
Figure 2.
Comparison of the medians of laboratory findings in patients with different genotypes on discharge: IFNAR2 rs2236757, OAS1 rs10774671 and OAS3 rs10735079. Kruskal-Wallis test with Dunn’s multiple comparisons post-hoc analysis was employed.
Figure 2.
Comparison of the medians of laboratory findings in patients with different genotypes on discharge: IFNAR2 rs2236757, OAS1 rs10774671 and OAS3 rs10735079. Kruskal-Wallis test with Dunn’s multiple comparisons post-hoc analysis was employed.
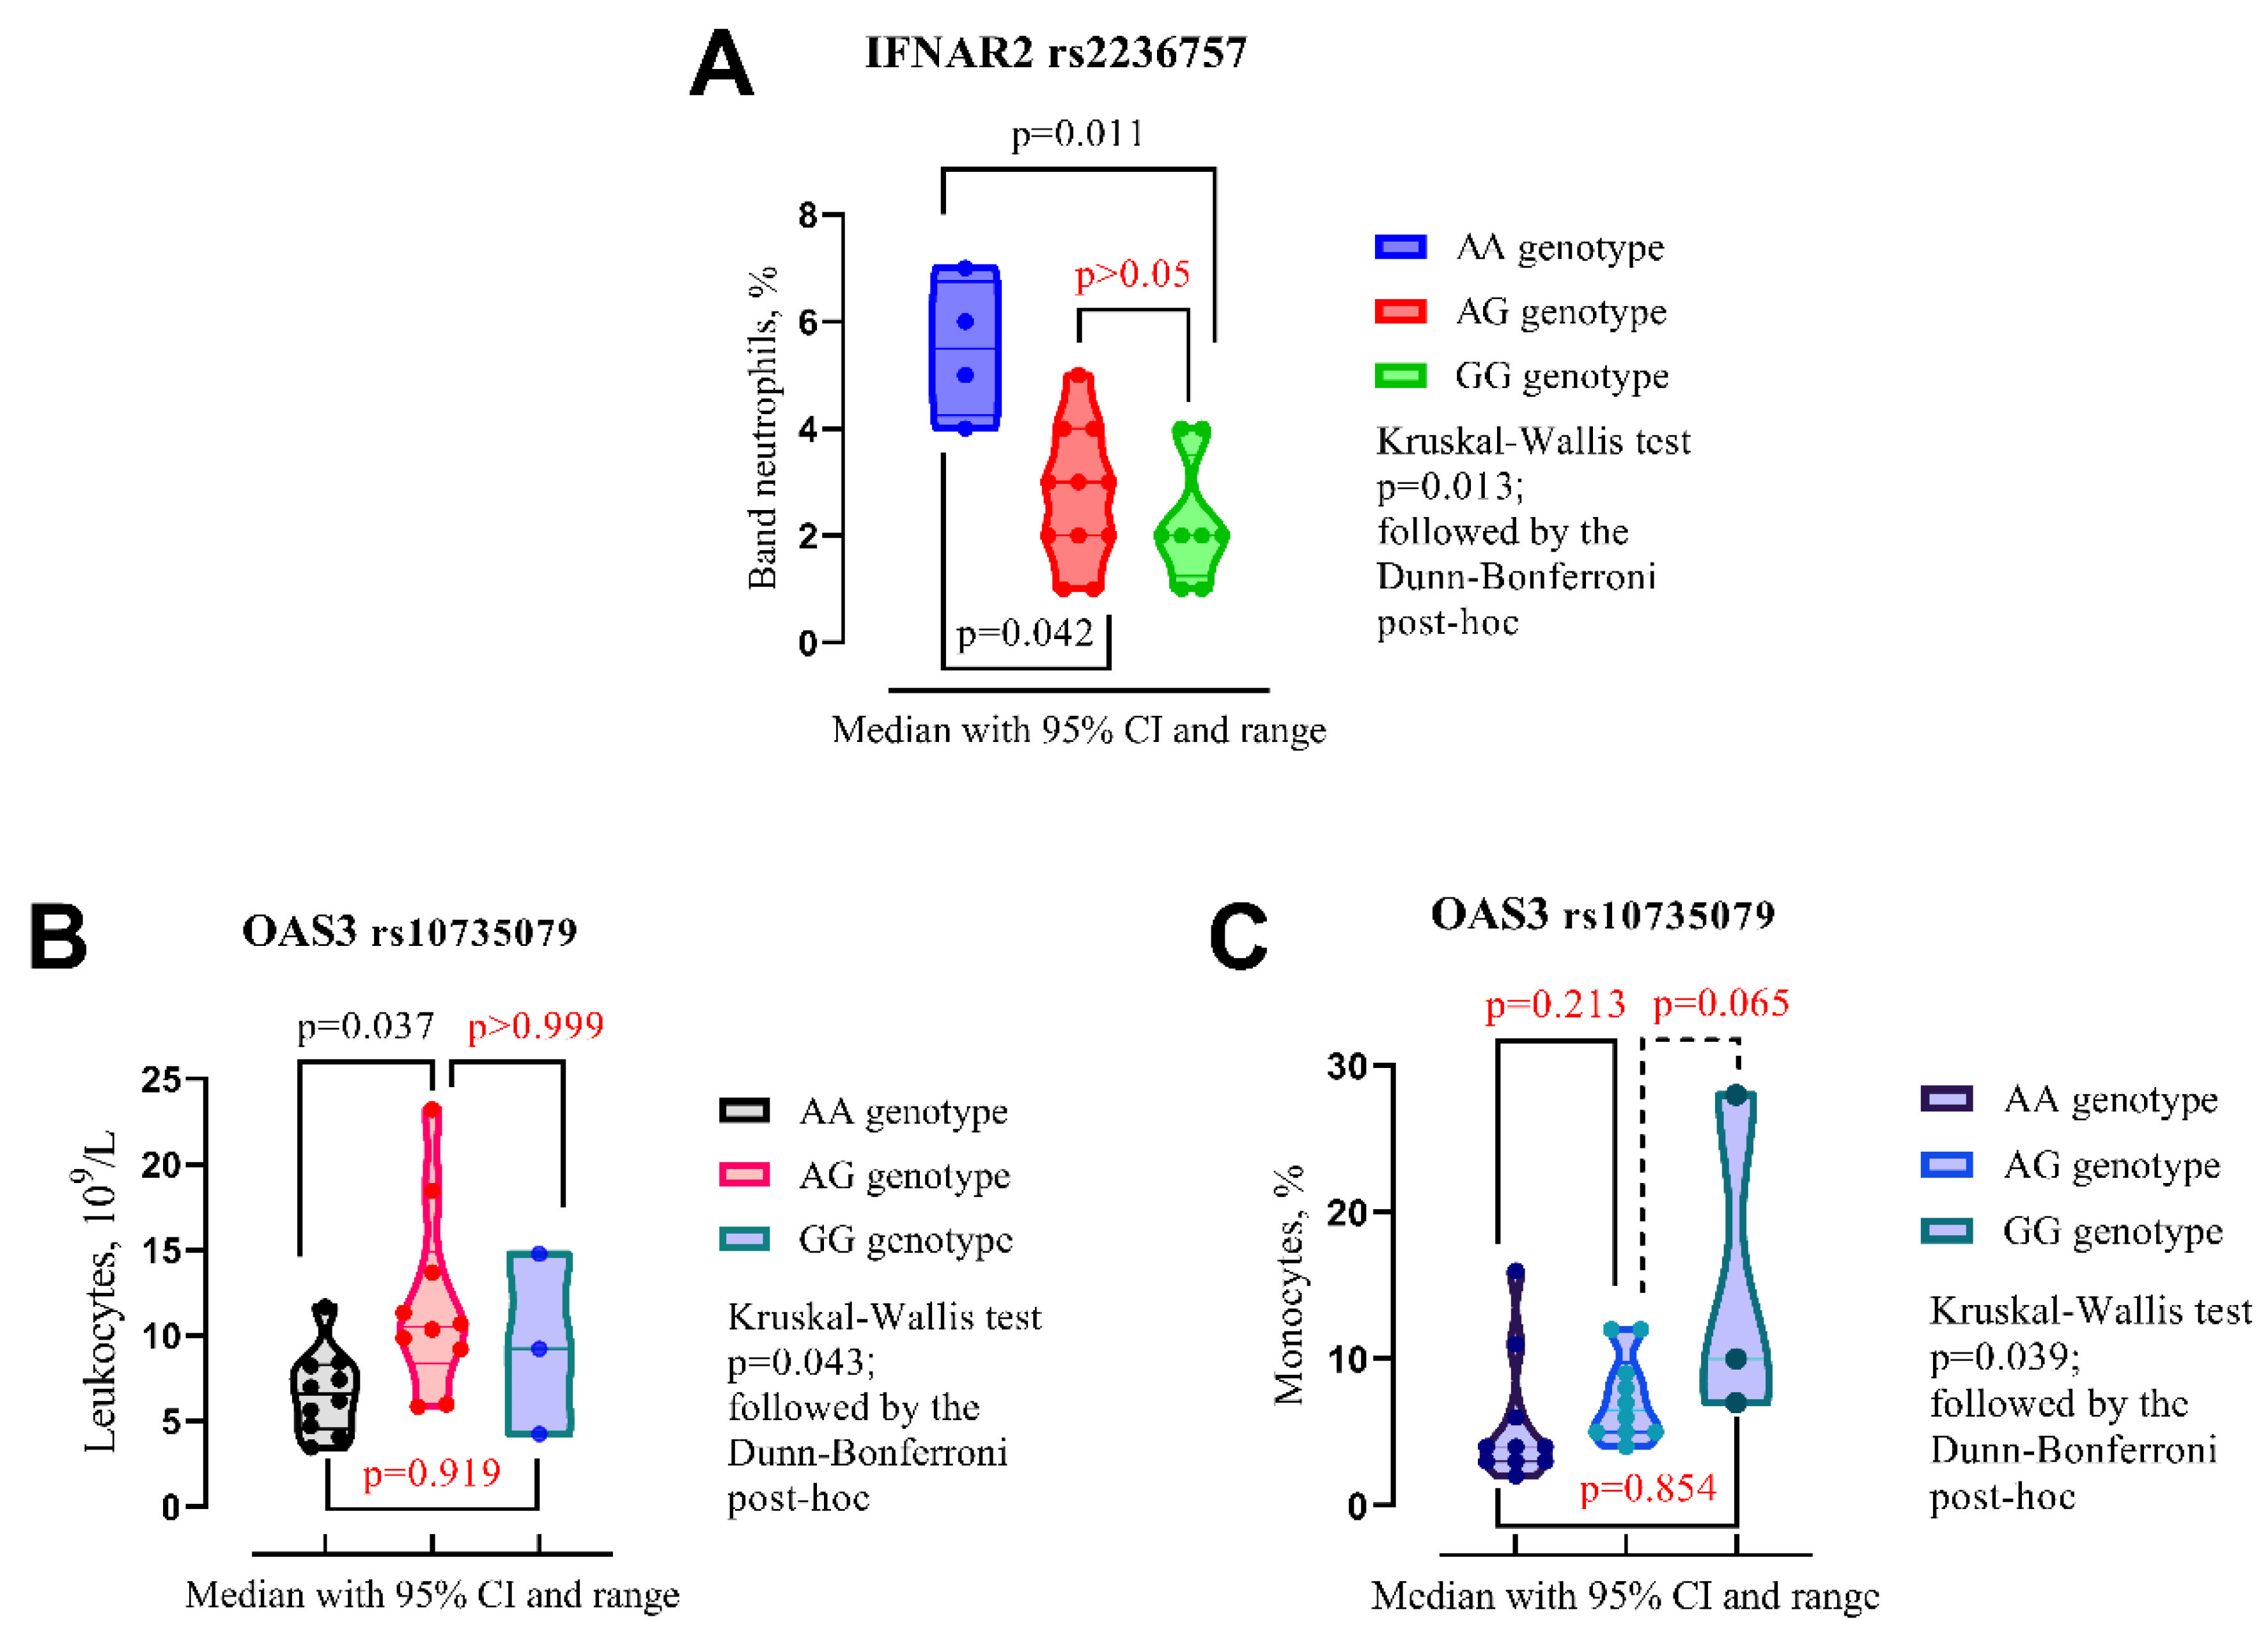
Figure 3.
A Venn diagram illustrates changes in blood parameters between admission and discharge, categorized by SPPs (IFNAR2 rs2236757, OAS3 rs10735079, OAS1 rs1077467 and ACE2 rs2074192) presence of different alleles.
Figure 3.
A Venn diagram illustrates changes in blood parameters between admission and discharge, categorized by SPPs (IFNAR2 rs2236757, OAS3 rs10735079, OAS1 rs1077467 and ACE2 rs2074192) presence of different alleles.
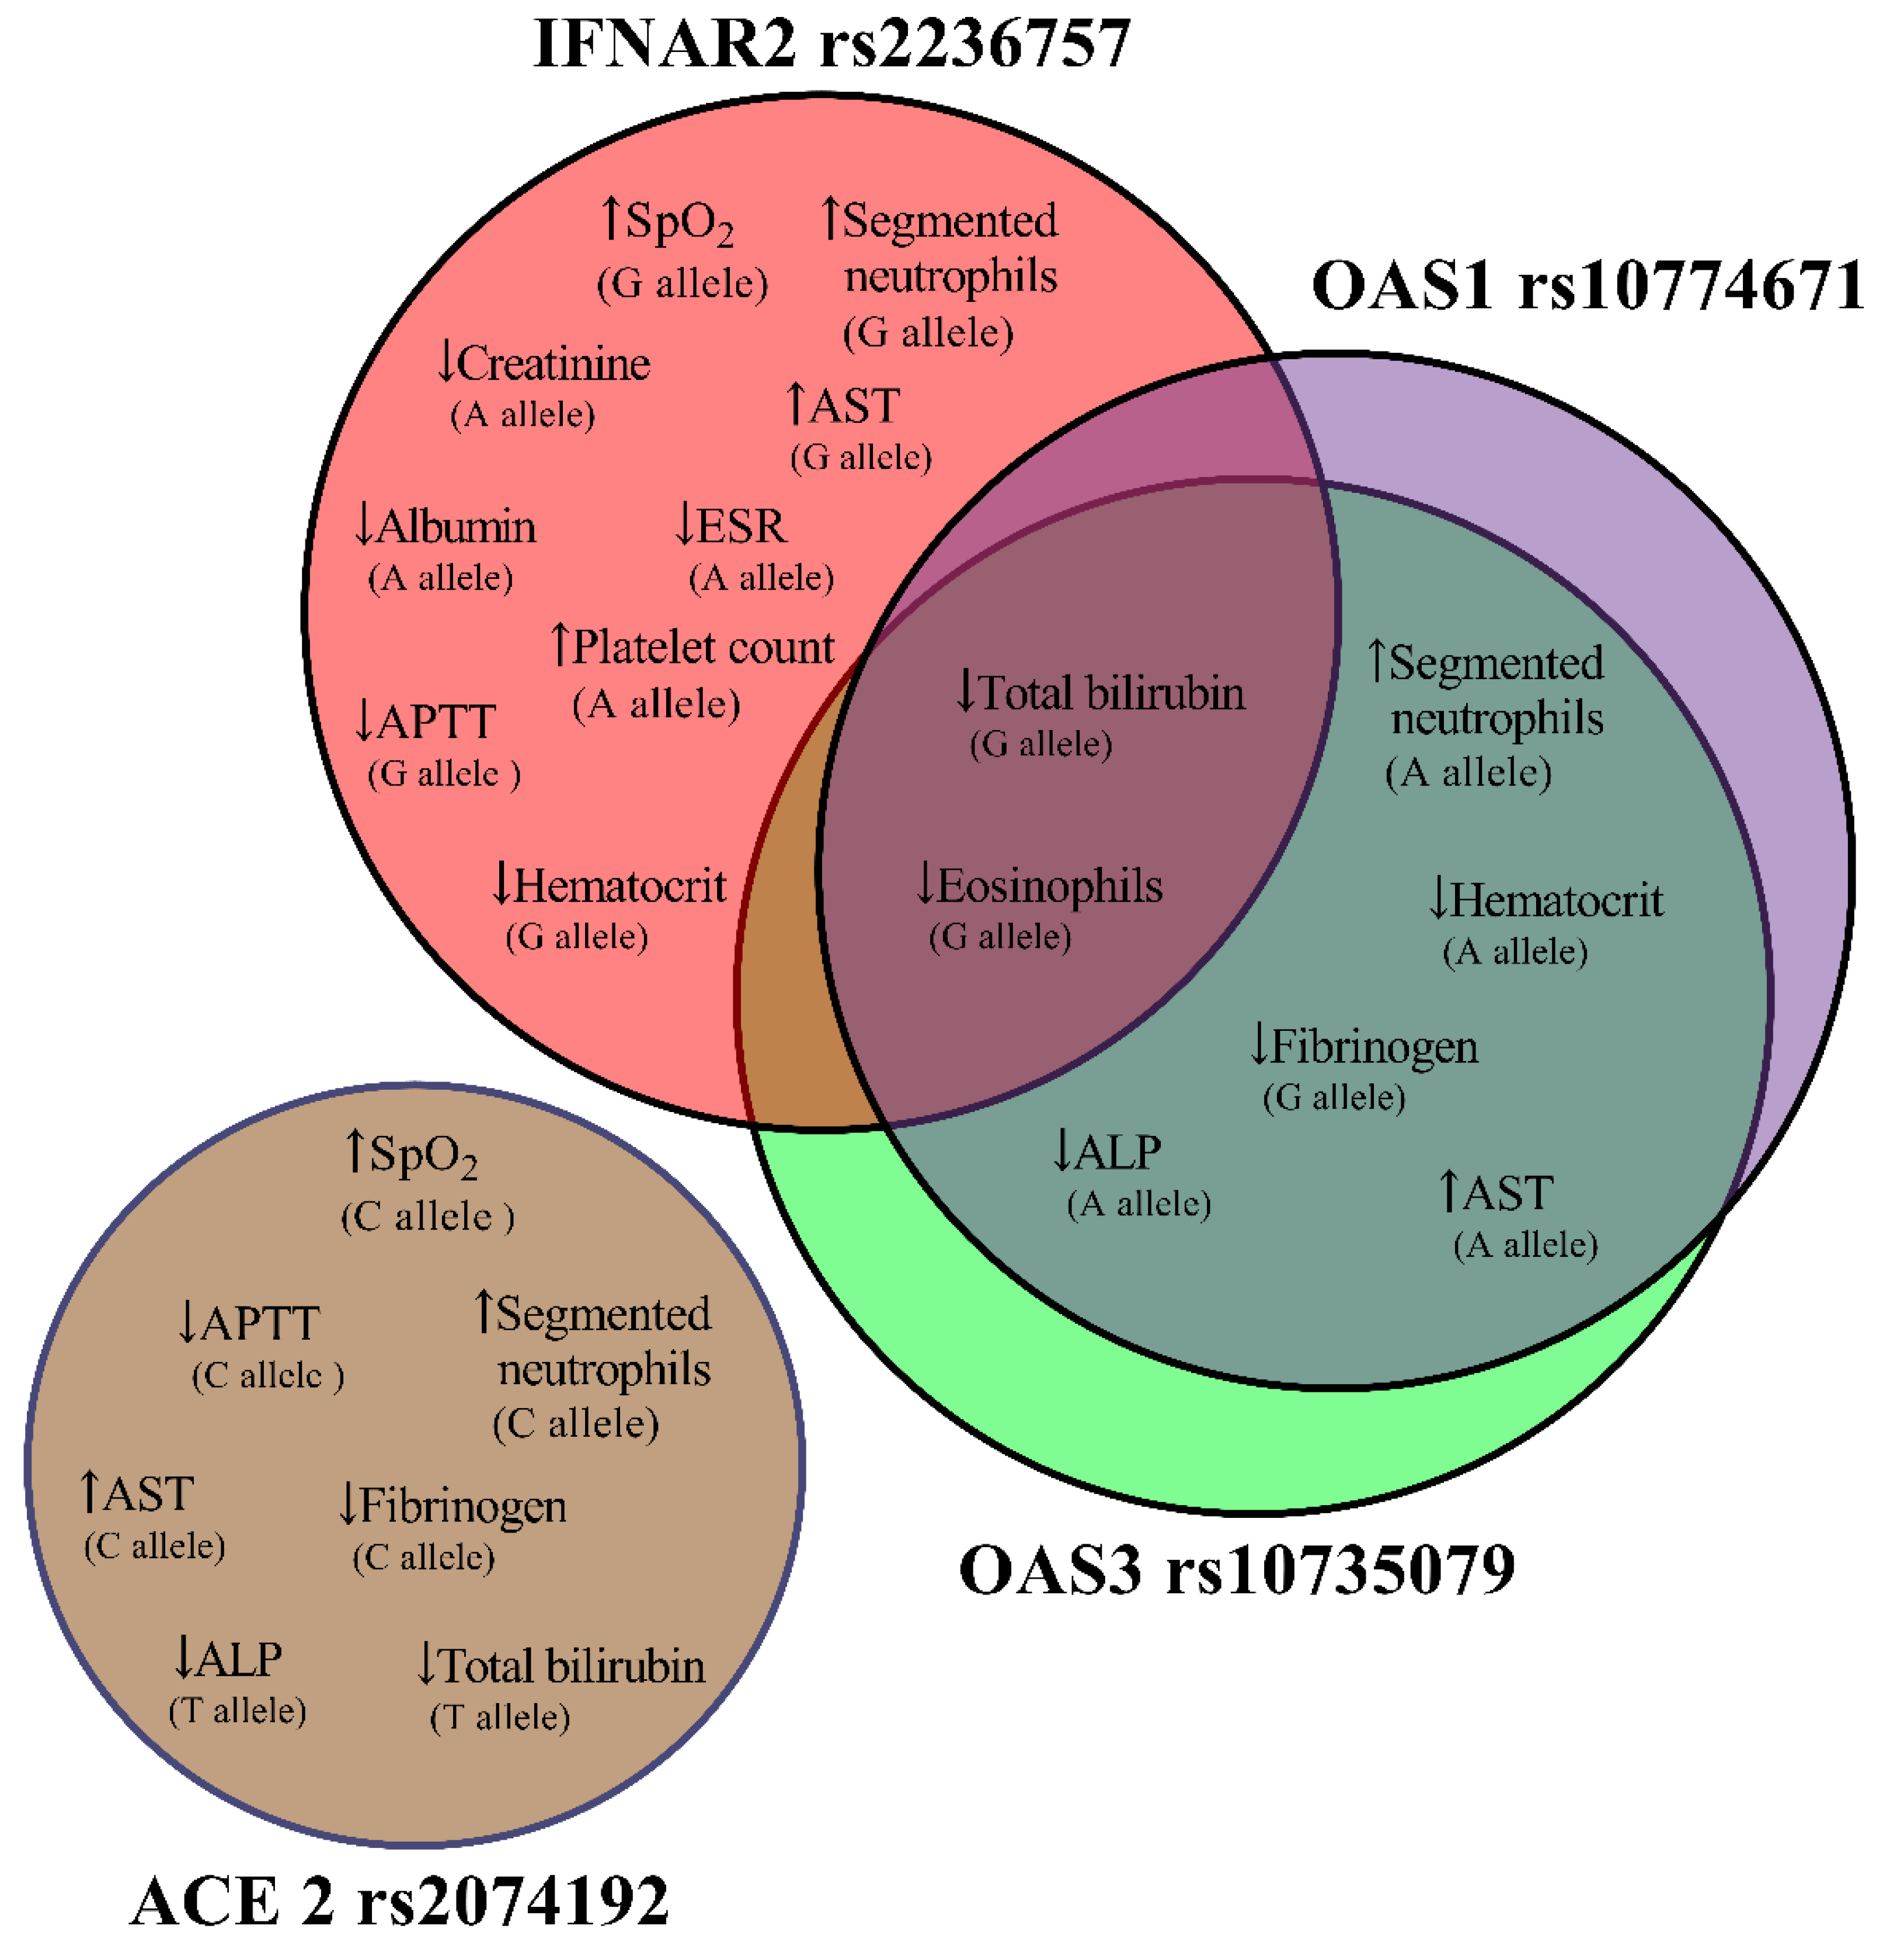
Table 3.
Impact of genetic variation on clinical course and laboratory parameters during Paxlovid treatment for hospitalized COVID-19 patients.
Table 3.
Impact of genetic variation on clinical course and laboratory parameters during Paxlovid treatment for hospitalized COVID-19 patients.
|
IFNAR2 rs2236757 Allele A (n=15) Allele G (n=19) |
Admission | Discharge | p-Valuea | |
| SpO2, %, median (IQR) | Allele A | 96 (94–98) | 98 (97–98) | p=0.151 |
| Allele G | 96 (92–97) | 98 (97–98) | p=0.019 | |
| Segmented neutrophils, % | Allele A | 55 (46–75) | 66 (48–74) | p=0.059 |
| Allele G | 61 (47–70) | 66 (52–78) | p=0.029 | |
| Eosinophils, % | Allele A | 1 (0–2) | 1 (0–1) | p=0.169 |
| Allele G | 1 (1–2) | 1 (0–1) | p=0.048 | |
| ESR, mm/hr | Allele A | 7 (4–11) | 5 (4–6) | p=0.021 |
| Allele G | 5 (4–10) | 4 (4–5) | p=0.371 | |
| Platelet count, 109/L | Allele A | 173 (142–204) | 215 (166–244) | p=0.041 |
| Allele G | 193 (165–231) | 220 (169–262) | p=0.064 | |
| Hematocrit, % | Allele A | 37.2 (34–44) | 36.6 (30.8–41) | p=0.132 |
| Allele G | 40 (34.2–45) | 37 (32–42.7) | p=0.040 | |
| APTT, sec. | Allele A | 33.2 (29.4–35.3) | 32.8 (24.6–35.8) | p=0.177 |
| Allele G | 33.2 (29.4–37) | 29.8 (25–33.7) | p=0.035 | |
| Total bilirubin, mmol/L | Allele A | 13.4 (11.1–19.1) | 11.2 (10.7–14.1) | p=0.128 |
| Allele G | 13.7 (10.8–19.1) | 11.2 (10.5–13.5) | p=0.029 | |
| AST, mmol/L | Allele A | 23.3 (19–27.8) | 25.5 (23.3–67.4) | p=0.112 |
| Allele G | 22.2 (16.6–25.8) | 30.8 (23.3–94.1) | p=0.014 | |
| Creatinine, mmol/L | Allele A | 103 (95–117) | 92 (84–109) | p=0.044 |
| Allele G | 96 (80–117) | 98 (86–109) | p=0.825 | |
| Albumin, g/L | Allele A | 50 (45–57) | 43 (37–51) | p=0.023 |
| Allele G | 50 (45–56) | 46 (42–51) | p=0.159 | |
|
ACE 2 rs2074192 Allele C (n=22) Allele T (n=8) |
Admission | Discharge | p-Valuea | |
| SpO2, %, median (IQR) | Allele C | 96 (93.5–98) | 98 (97–98) | p=0.019 |
| Allele T | 96 (92–97.8) | 97 (97–98) | p=0.102 | |
| Segmented neutrophils, % | Allele C | 57 (46–71.3) | 66 (51.3–75.8) | p=0.016 |
| Allele T | 57 (44.8–65.5) | 68.5 (52.5–73.8) | p=0.078 | |
| APTT, sec. | Allele C | 33.3 (29.7–37.1) | 29.8 (25.5–34.9) | p=0.027 |
| Allele T | 32.8 (29.6–35.1) | 29.8 (25.2–34.5) | p=0.093 | |
| Fibrinogen, g/L | Allele C | 3.99 (3.55–4.94) | 3.33 (2.76–3.99) | p=0.017 |
| Allele T | 3.63 (3.55–4.33) | 3.83 (1.75–3.99) | p=0.611 | |
| Total biligubinum, mmol/L | Allele C | 12.7 (10.8–15.9) | 11.1 (10.6–13.7) | p=0.112 |
| Allele T | 12.9 (10.7–17.8) | 10.8 (10.2–12) | p=0.028 | |
| AST, mmol/L | Allele C | 22.4 (17.2–26.3) | 32.3 (24.2–81.2) | p=0.004 |
| Allele T | 21.9 (14.9–28.1) | 29.1 (21.3–81.1) | p=0.327 | |
| ALP, mmol/L | Allele C | 140 (116–1600 | 122 (95.3–147) | p=0.077 |
| Allele T | 148 (125–165) | 136 (94.3–148) | p=0.025 | |
|
OAS3 rs10735079 Allele A (n=20) Allele G (n=13) |
Admission | Discharge | p-Valuea | |
| Segmented neutrophils, % | Allele A | 61 (47,5–73,8) | 70,5 (53,3–77,3) | p=0.027 |
| Allele G | 55 (46–69,5) | 63 (48,5–75) | p=0.307 | |
| Eosinophils, % | Allele A | 1 (0,25–2) | 1 (0–1) | p=0.134 |
| Allele G | 1 (1–2,5) | 1 (0–1) | p=0.046 | |
| Hematocrit, % | Allele A | 38,6 (34,3–43,5) | 37,2 (31,5–42) | p=0.021 |
| Allele G | 42 (35,3–48,2) | 41 (36,2–44) | p=0.916 | |
| APTT, sec. | Allele A | 34,2 (30–37,2) | 29,8 (26,9–35,2) | p=0.033 |
| Allele G | 33,4 (29,9–37,1) | 29,1 (24,7–34,8) | p=0.066 | |
| Fibrinogen, g/L | Allele A | 3,99 (3,55–)5,05 | 3,63 (2,92–3,99) | p=0.064 |
| Allele G | 3,99 (3,55–4,1) | 3,33 (2,11–3,88) | p=0.031 | |
| Total biligubinum, mmol/L | Allele A | 13,2 (10,7–16,7) | 11,1 (10,6–14,3) | p=0.070 |
| Allele G | 12,9 (11,1–20,6) | 10,7 (10,3–13,2) | p=0.021 | |
| AST, mmol/L | Allele A | 22,7 (19,4–27,3) | 30,1 (24,5–67,4) | p=0.006 |
| Allele G | 22,2 (18,6–26,8) | 26,5 (23,9–96,3) | p=0.116 | |
| ALP, mmol/L | Allele A | 136 (115–152) | 113 (93,8–144) | p=0.025 |
| Allele G | 138 (121–156) | 127 (94–151) | p=0.196 | |
|
OAS1 rs10774671 Allele A (n=20) Allele G (n=14) |
Admission | Discharge | p-Valuea | |
| Segmented neutrophils, % | Allele A | 47,5 (61–73,8) | 70,5 (53,3–77,3) | p=0.027 |
| Allele G | 57 (46–69,3) | 63 (48,8–75) | p=0.183 | |
| Eosinophils, % | Allele A | 1 (0,25–2) | 1 (0–1) | p=0.134 |
| Allele G | 1 (1–2,25) | 1 (0–1) | p=0.032 | |
| Hematocrit, % | Allele A | 38,6 (34,3–43,5) | 37,2 (31,5–42) | p=0.021 |
| Allele G | 41 (35,8–47,7) | 40,2 (35,2–43,5) | p=0.638 | |
| Fibrinogen, g/L | Allele A | 3,99 (3,55–55) | 3,63 (2,92–3,99) | p=0.064 |
| Allele G | 3,99 (3,55–4,26) | 3,33 (2,27–3,99) | p=0.046 | |
| Total biligubinum, mmol/L | Allele A | 13,2 (10,7–16,7) | 11,1 (10,6–14,3) | p=0.170 |
| Allele G | 13,3 (11,2–22) | 10,9 (10,4–13,7) | p=0.014 | |
| AST, mmol/L | Allele A | 22,7 (19,4–27,3) | 30,1 (24,5–67,4) | p=0.006 |
| Allele G | 22,4 (19,5–26,3) | 26 (24,2–95,2) | p=0.096 | |
| ALP, mmol/L | Allele A | 136 (115–152) | 113 (93,8–144) | p=0.025 |
| Allele G | 137 (120–155) | 125 (95–148) | p=0.158 |
aWilcoxon matched pairs test; statistically significant findings are denoted in bold.
Disclaimer/Publisher’s Note: The statements, opinions and data contained in all publications are solely those of the individual author(s) and contributor(s) and not of MDPI and/or the editor(s). MDPI and/or the editor(s) disclaim responsibility for any injury to people or property resulting from any ideas, methods, instructions or products referred to in the content. |
© 2024 by the authors. Licensee MDPI, Basel, Switzerland. This article is an open access article distributed under the terms and conditions of the Creative Commons Attribution (CC BY) license (http://creativecommons.org/licenses/by/4.0/).
Copyright: This open access article is published under a Creative Commons CC BY 4.0 license, which permit the free download, distribution, and reuse, provided that the author and preprint are cited in any reuse.


