

Submitted:
02 September 2024
Posted:
02 September 2024
You are already at the latest version
Abstract
The emergence of "green" materials has been attracting significant attention along the last few years for various applications. Here, we report a rapid, efficient and reproducible microwave-assisted synthesis of graphene quantum dots GQDs of identical features whatever the nature of biomass wastes investigated. The synthesized GQDs were fully characterized by X-ray photoelectron spectroscopy, Fourier transform infrared spectroscopy, transmission electron microscopy and dynamic light scattering. The nanoparticles display narrow size of some nanometers with crystal lattices. Furthermore, the water-soluble particles show excitation-dependent photoluminescence ranging from blue to orange emission wavelength in solution. Interestingly, thin films display white light emission under 325 nm UV-light excitation, while aggregation-induced quenching is usually observed.
Keywords:
graphene quantum dots
; biomass wastes
; nanomaterials
; microwave
; fluorescence
1. Introduction
Carbon dots were fortuitously discovered in 2004 [1] as an unexpected fluorescent material within arc-discharge soot. Since then, carbon dots rapidly emerged as a new fascinating member of the carbon nanomaterials family alongside carbon nanotubes, fullerenes and graphene. To date, the term "carbon dots" usually refers to various nanosized materials mainly composed of carbon that could be divided into two main categories, i.e. graphene quantum dots (GQDs) and carbon nanodots (CDs). GQDs can be described as zero-dimensional (0D) nanomaterials possessing larger lateral dimensions than their height and composed of few layers of graphene sheets bearing functional groups at the edges. According to their graphene-like structure, GQDs usually display intrinsic crystal lattices that could be evidenced by HR-TEM characterizations. In comparison, CDs are quasi-spherical nanoparticles consisting of amorphous and crystalline parts.
Graphene quantum dots have been the subject of many published investigations, owing to a wide range of attributes, e.g., excitation-dependent photoluminescence, chemical inertness, solubility in various polar solvents, possible further functionalization, resistance to photobleaching, biocompatibility, low toxicity and low cost. GQDs are nanometer size particles (< 20 nm) consisting of a partial sp2 hybridized graphitic core bearing various oxygen- and nitrogen containing functional groups, where O- and N- atoms are involved in the formation of carbonyl, hydroxyl, epoxy and amines moieties mostly located at the edges. The presence of these functionalities allows GQDs to be highly soluble in many various organic solvents thus making their processability much more easy than for most of carbon-based materials.[2,3]
Since their discovery, it has been demonstrated that GQDs could find valuable applications in many domains ranging from anti-counterfeiting [4], photocatalysis [5,6], batteries [7], supercapacitors [8,9,10], solar cells [11,12,13], LED [14,15], sensors [16,17], bioimaging [18] and drug carriers [19]. Graphene quantum dots can be synthesized either by bottom-up or top-down approaches [20,21]. Bottom-up synthetic strategies relate to physical or chemical treatments of small organic molecules to promote their graphitization. In comparison, top-down approaches refer to the miniaturization of large carbon-based materials (graphite, graphene oxide, carbon nanotubes, fullerenes) by either hydrothermal or solvothermal cutting [22], microwave-assisted exfoliation [23], electrochemical methods [24] and oxidation [25]. Alternatively, GQDs could be synthesized from biomass-originating raw materials such as for instance biochar[26] and rice husks [27], thus limiting the overall process cost. Nevertheless, typically, the majority of techniques used to prepare GQDs are limited to laboratory-size operations, long reaction times, high pressure, high temperature and using expensive materials. Also, ultracentrifugation and/or dialysis remain the main techniques to purify GQDs, while being limited to small quantities. While graphene quantum dots are already commercially available by some suppliers worldwide, nowadays, only a few dozen of milligrams could be accessible at a price of ca. 5000€/g, hampering the development of GQDs-based applications at the industrial scale. High-quality GQDs have to be synthesized through cost-effective, reproducible and scalable processes in order to facilitate the applications to reach industry.
Herein, we report on the synthesis and characterizations of small GQDs (≈ 1-2 nm) that have been prepared from various biomass wastes (orange peels, date stones and oak acorns) in a straightforward, rapid and high yielding chemical transformation performed under fast microwave heating. The two steps procedure affords GQDs with awesome uniformity (in terms of size, morphology, chemical constitution and photophysical properties) in spite of the different biomass waste sources investigated. The water-soluble particles show excitation-dependent photoluminescence ranging from blue to orange emission wavelength in water solution. Interestingly, thin films display white light emission under UV excitation, while aggregation-induced quenching is usually observed in the solid state.
2. Materials and Methods
General. All solvents were of reagent grade. All chemicals were used as received. Water was of high purity characterized in terms of resistivity (typically 18.2 mΩ.cm at 25°C).
Synthesis and purification of CDs. Various source materials, such as orange peels, date stones and oak acorns were first dried at 70°C for 24 h, then crushed and grounded. Then, GQDs were prepared in two steps under microwave-assisted heating in a Monowave 400 device (Anton Paar) following a procedure that has been recently reported.[28,29] Briefly, dried powder of various non-food biomass wastes (200 mg) were suspended in conc. H2SO4 (16 mL) in a G30 reaction tube and subjected to carbonization at 180°C for 5 minutes. After being cooled down, the reaction medium was carefully diluted in water (200 mL) and the dark carbonized suspension was recovered by centrifugation and subsequently dried at 70°C overnight. The yield of this step was 47% starting from orange peels (92 mg), 38% from date stones (76 mg) and 35% from oak acorns (70 mg). In the second step, the carbonized materials (50 mg) were heated with conc. HNO3 (5 mL) in a G10 reaction vessel at 150°C for 5 minutes. After cooling down and concentration to dryness, GQDs were obtained in 40% starting from orange peels (20 mg), 32% from date stones (16 mg) and 34 % from oak acorns (17 mg).
Characterization.
Fourier transform infrared spectroscopy (FT-IR) was performed on a Nicolet iS5 FTIR Spectrometer. Elemental analyses were performed on CHNS-O analyzer from Thermo Scientific and results are given as average of three independent measurements. The average particle size of CDs was measured by DLS using a VASCO KIN Particle Size Analyzer apparatus (Cordouan Technologies, Pessac, France). All measurements were performed on freshly prepared suspension diluted in ultrapure water, at 25 °C and in triplicate. Data were analyzed using the multimodal number distribution Nano Kin® software supplied with the instrument and expressed as mean (± SD).
UV-vis spectra were obtained with a Varian Cary® 50 UV-Vis spectrophotometer. Fluorescence emission spectra were obtained using a FluoroMax-3 spectrofluorophotometer (Horiba Jobin Yvon) at 298 K.
SEM images were acquired onto a TESCAN VEGA 3 scanning electron microscope equipped with a tungsten filament electron source.
Transmission electron microscopy (TEM) investigations were carried out using a JEM - ARM 200F Cold FEG TEM/STEM operating at 200 kV and equipped with a spherical aberration (Cs) probe and image correctors (point resolution 0.12 nm in TEM mode and 0.078 nm in STEM mode). Grids were prepared by placing a drop of GQDs solution (200 µg/mL in water) on carbon-coated copper grid for four minutes. The drop was then removed by mean of a blotting paper and the grid dried at room temperature for five minutes and at 80°C for twenty minutes.
The X-ray photoelectron spectrometry (XPS) analyses were performed on a Kratos Axis Ultra (Kratos Analytical, U.K.). The spectrometer is equipped with a monochromatic Al Kα source (1486.6 eV). All spectra were recorded at a 90° take-off angle, with an analyzed area of about 0.7 × 0.3 mm. Survey spectra were acquired with 1.0 eV step and 160 eV analyzer pass energy. The high-resolution regions were acquired with 0.1 eV step (0.05 eV for O 1s and C 1s) and 20 eV pass energy. A neutralizer was used to perform the recording to compensate for the charge effects. Curves were fitted using a Gaussian/Lorentzian (70/30) peak shape after Shirley’s background subtraction and using CasaXPS software. The carbon C 1s is calibrated at 284.8ev for C-C and C-H bonds.
3. Results and Discussions
In this work, GQDs were prepared by a facile two-steps MW-assisted synthesis from biomass wastes as starting materials that are orange peels (A0), date stones (B0) and oak acorns (C0) within this study. Firstly, materials have been dried, crushed and grounded to afford powders of uniform grain size as precursors. The microstructures of these powders have been evaluated by scanning transmission electron microscopy (STEM). Images (Figure 1) demonstrate that all precursors’ powders display important micro porosity.
Within the first step, A0-C0 powders were subjected to acidic hydrothermal treatment in monomode microwave reactors. Monomode system allows to set up chemical transformations with an accurate implementation of synthetic parameters (i.e. temperature and pressure) with high reproducibility between batches. Thus, A0-C0 samples were heated at 180°C for 5 minutes in conc. sulfuric acid to afford carbonaceous products A1-C1 as dark powders. During this step, cellulose-based starting materials A0-C0 undergo various successive chemical transformations such as depolymerization, dehydration and further polymerization resulting in the formation of A1-C1 materials with yields ranging from 35 to 47% (wt %). Their chemical composition was evaluated by elemental analysis and FT-IR spectroscopy (Figure 2). Elemental analyses reveal that oxygen content decreases significantly during the first step of our process, which agrees with a dehydration process. Furthermore, sulfur atoms are included inside the structure even if at low amount (1.7 - 2.2%).
The Fourier transform infrared (FTIR) spectra of products A1-C1 are highly similar in spite of the biomass waste nature and show clearly the presence of oxygen-containing functional groups such as carboxylic acid and hydroxyl groups. The presence of carboxylic acid functional groups is confirmed by the presence of a broad band in the region of 3300-2500 cm-1. Besides, C=O stretching is observed in the region of 1700 cm-1 and C-O-C stretching in the region of 1000 to 1200 cm-1. Furthermore, a strong stretching vibration of C=C can be observed at 1574-1580 cm-1 indicating the presence of sp2 units.
The STEM images (Figure 3) indicate that the shape of carbonaceous materials generated during the first step is not uniform. While A1 is composed of angular microstructures, B1 and C1 are kind of spherical. The particles size is of few dozen micrometers.
Within the second step, carbonaceous materials A1-C1 were treated by conc. nitric acid in microwave reactors at 150°C for 5 minutes, time after which the black carbon suspension was completely digested to afford clear orange solutions. After purification, final GQDs A2-C2 have been obtained as yellowish powders with yields ranging from 33-40% (wt %). After purification, the prepared GQDs were then systematically characterized in terms of chemical composition (elemental analysis and XPS), size (DLS and TEM) and photophysical properties (absorbance and luminescence spectroscopies).
GQDs A2-C2 materials display almost the same chemical composition as evidenced by X-Ray photoelectron spectroscopy (Figure 4a, Figure S1a and S2a and Table 1). From the full-scan XPS spectrum (Figure 4a) C, N, O and S are detected with peaks at 284.8 eV (C1s), 405.9 eV (N1s), 532.9 eV (O1s) and 167.6 eV (S2p) respectively. All GQDs display almost the same spectra. To determine the C and N configurations in GQDs A2, C1s and N1s spectra were analyzed (Figure 4b and 4c). The C1s spectra can be decomposed into four main peaks at 284.8 eV, 286.1 eV, 287.5 eV and 288.9 eV, attributed to sp2 C=C, C-O/C-N, C=O and COOH groups, respectively. The N1s spectrum can be deconvoluted into three peaks centered at 400.4 eV, 402.1 eV and 405.9 eV corresponding to pyridinic/pyrrolic N, graphitic N and N-O, respectively. The N-O moieties could presumably be attributed to nitro functional groups (NO2) linked to the aromatic structure, originating from nitric acid treatment that is in perfect agreement with previous reports [30,31]. As a matter of fact, nitration of aromatic rings could occur upon electrophilic aromatic substitutions without the need for sulfuric acid as catalyst [32]. Besides, the O1s signal at 531.6 eV demonstrate the presence of C=O bonds. Finally, the S2p signal at 166.9 clearly demonstrate the presence of oxidized forms of sulfur-based functional group, very likely sulfones and sulfoxides [33,34]. Furthermore, the elemental molar ratio of C, N, S, and O for the three GQDs batches A2-C2 was calculated from the XPS analyses and the results are depicted in table 1.
First of all, the elemental content is almost similar in the three samples investigated in spite of the different biomass waste sources. While the oxygen content was almost not modified during the second step, sulfur was incorporated within the structures in the range of 0.3-1.8 %. Additionally, we observed that nitrogen content increased to reach 4-5.4% atomic content, thereby confirming the presence of nitrogen-based functional group, very likely nitro groups as supposed on the basis of XPS data. FT-IR spectroscopy was used to further characterize the nature of functional groups on A2-C2 (Figure 4d, Figures S1b and S2b). All samples display identical IR profiles with four main bands with nevertheless some slight differences based on respective intensities. The IR band located at 3300-3500 cm-1 could be assigned to carboxylic acid functional groups, the intense band at 1600-1610 cm-1 is assigned to C=C bonds as the elementary units of sp2 conjugated graphene structure, the band at 1340-1350 cm-1 is assigned to NO2 stretching and the one at 1110 cm-1 reflects the stretching of C-O bonds which could originates from epoxy groups. These IR results fully support the existence of various oxygen-based functional groups on the surface of GQDs, which is fully consistent with XPS data. Furthermore, the identification of the presence of various functional groups on GQDs is consistent with their excellent solubility properties in many solvents such as water, ethanol, methanol, acetone and dimethylformamide.
The size of the final graphene quantum dots was determined by DLS from aqueous suspensions (Figure 5a and Figure S3). The results indicate that all GQDs display a narrow size number distribution centered at approximately 1.6 - 1.7 nm. This highlights the convergence of our protocol to form nanoparticles of identical size and chemical composition regardless of the waste source investigated. Also, these observations attest from the high dispersibility of our GQDs in solution. The high resolution transmission electron microscopy (HR-TEM) images (Figure 5b-c and Figure S4) totally corroborate the observations made by DLS, depicting individual nanoparticles of less than 2 nm.
It is noteworthy to observe that nanoparticles have a tendency to aggregate when deposited on the holey carbon-based TEM grids (Figure 5b) that is expected for planar aromatic fragments due to strong van der Waals attractions between graphene-like sheets. Also, GQDs TEM images show clear hexagonal honeycomb networks as expected for graphene quantum dots.[35] Also, the high-resolution TEM (HR-TEM) image (Figure 5c) exhibits crystal structures. Detectable lattices in the selected-area electron-diffraction (SAED) pattern revealed the crystalline structure of GQDs (data not shown). Well-resolved lattice fringes with an interplanar spacing of 0.2021 nm were observed, which is close to the (101) facet of carbon graphite.
The optical properties of the GQDs prepared from different waste sources have been further examined in details. The UV-vis absorption spectrum of A2 (Figure 6a) is identical to those of B2 and C2 (Figures S5a and S6a, respectively). The light-yellow solution shows two absorption peaks in the UV-range including a small and broad one centered at 350 nm ascribed to n – π* transitions in C=O and a peak at 200 nm which is related to π electron transition from π to π* of C=C bonds in the aromatic domains of the graphitic structure. Steady-state fluorescence spectroscopy was performed with diluted water solution of A2-C2 in order to get insight into the photoluminescence features of the prepared nanoparticles. All samples display typical excitation-dependent pholuminescence behavior using different excitation wavelengths ranging from 300 nm to 500 nm (Figure 6b, Figures S5b and S6b). With the increase of the excitation wavelength, GQDs display emission peaks, shifting to longer wavelengths up to 600 nm when excited at 500 nm. Although the excitation dependent PL mechanism is still a controversial topic,[36] this tunable emission is of great interest for applications in various domains. The origin of this excitation-dependent photoluminescence is very likely the result of defect emission, i.e. the recombination of an excited electron in the various surface states with holes in the valence band. Indeed, we could eliminate the quantum confinement effect according to the narrow size distribution of the as-prepared nanoparticles.
During the course of a current research project dealing with the synthesis of new organic materials for energy applications in solid devices, we were interested in studying the photoluminescence of our GQDs at the solid state. Aggregation-induced luminescence quenching of carbon dots (CDots) is the main obstacle for their applications in the solid state. Indeed, solid-state fluorescence is highly desirable in numerous applications such as optoelectronic devices and sensors, which generally require photoluminescent materials emitting at the solid state. Some rare recent reports deal with the emission of CDs-based films. [37,38,39] We were pleased to observe (Figure 7 and Figure S7) that our GQDs deposited on a silicon wafer display a white-light emission without the need of dilution inside either agarose, [37] polyvinyl alcohol (PVA)[38] or silica matrix. [39] Thus, all GQDs samples display almost identical white-light emission profile under 325 nm, with a broad peak centered at 550 nm. It is noteworthy to mention that the emission of our GQDs at the solid state is completely different to the one observed in solution and this point is still unclear.
4. Conclusions
In summary, we have developed a straightforward and reproducible method to prepare graphene quantum dots (GQDs) from biomass wastes of different nature by a two-steps microwave-assisted synthesis. Preparations were done at a laboratory scale and could be easily scaled-up as we proved within our recent patent.[29] Up to now, we have been delighted to observe that in spite of the nature of the waste investigated, the resulting GQDs display similar properties, regarding their chemical composition, their size and morphology as well as their photophysical properties. DLS and TEM analyses showed that the as-prepared GQDs are monodispersed with similar size distribution in the range of 1-2 nm and with crystal lattices similar to the ones observed in graphite. In terms of chemical composition, XPS and IR analyses allowed us to identify the presence of some functional groups such as carboxylic acid, hydroxyl, ether, nitro and sulfoxide groups that are connected to the graphene-like structure backbone. Regarding the photophysical properties, the nanoparticles exhibit excitation-dependent photoluminescence that is very likely the result of defect emission, i.e. the recombination of an excited electron in the various surface states with a hole in the valence band. Interestingly, our nanoparticles display a white-light emitting feature under UV-light excitation at the solid state. It is a noteworthy point since most CDs and organic molecules are not emissive at the solid state due to multiple FRET occurring between close objects. Furthermore, aggregation-induced luminescence quenching of carbon dots (CDots) is the main obstacle for their applications such as in optoelectronic devices and sensors. These encouraging results indicate that our cheap and easily accessible GQDs are promising nanomaterials for future WLED device fabrication.
Supplementary Materials
The following supporting information can be downloaded at the website of this paper posted on Preprints.org. Figures S1-S7.
Author Contributions
P. P. was mainly responsible for writing the manuscript. All authors reviewed the manuscript. All authors have read and agreed to the published version of the manuscript.
Funding
This research was funded by Institut Jean Barriol (Université de Lorrraine) and SATT Sayens (GREEN-CQDs project).
Institutional Review Board Statement
Not applicable
Informed Consent Statement
Not applicable
Data Availability Statement
The data presented in this study are available in article.
Acknowledgments
The authors would like to thank V. Vaillant for performing elemental analyses. We thank Dr. Boulkrah Hafida, (Département de Pétrochimie et Génie des Procédés, Université du 20 août 1955-Skikda – Algérie), for the preparation of the precursor wastes biomass We thank Aurélien Renard from the spectroscopy and microscopy Service Facility of SMI LCPME (Université de Lorraine-CNRS– http://www.lcpme.cnr-nancy.fr). We thank Jaafar Ghanbaja and Mélanie Emo ((Institut Jean Lamour) for HR-TEM measurements.
Conflicts of Interest
The authors declare no conflict of interest.
References
- X. Xu, R. Ray, Y. Gu, H. J. Ploehn, L. Gearheart, K. Raker, W. A. Scrivens, J. Am. Chem. Soc. 2004, 126, 12736–12737.
- S. Dorontić, S. Jovanović, A. Bonasera, Materials 2021, 14, 6153.
- P. Pierrat, J.-J. Gaumet, Tetrahedron Lett. 2020, 61, 152554.
- Y. Zhao, B. Gu, G. Guo, Y. Li, T. Li, Y. Zhu, X. Wang, D. Chen, ACS Appl. Nano Mater. 2023, 6, 3245–3253.
- Q. Nie, L. Jia, J. Luan, Y. Cui, J. Liu, Z. Tan, H. Yu, Chem. Eng. Sci. 2024, 285, 119614.
- T. Selvakumar, M. Rajaram, A. Natarajan, L. Harikrishnan, K. Alwar, A. Rajaram, ACS Omega 2022, 7, 12825–12834.
- A.P. Vijaya Kumar Saroja, M. S. Garapati, R. ShyiamalaDevi, M. Kamaraj, S. Ramaprabhu, Appl. Surf. Sci. 2020, 504, 144430.
- J. Zhao, J. Zhu, Y. Li, L. Wang, Y. Dong, Z. Jiang, C. Fan, Y. Cao, R. Sheng, A. Liu, S. Zhang, H. Song, D. Jia, Z. Fan, ACS Appl. Mater. Interfaces 2020, 12, 11669–11678.
- W. Zhang, Y. Yang, R. Xia, Y. Li, J. Zhao, L. Lin, J. Cao, Q. Wang, Y. Liu, H. Guo, Carbon 2020, 162, 114–123.
- N. Zahir, P. Magri, W. Luo, J. J. Gaumet, P. Pierrat, ENERGY Environ. Mater. 2022, 5, 201–214.
- S. Mahalingam, A. Manap, A. Omar, F. W. Low, N. F. Afandi, C. H. Chia, N. A. Rahim, Renew. Sustain. Energy Rev. 2021, 144, 110999.
- Z. Zhu, J. Ma, Z. Wang, C. Mu, Z. Fan, L. Du, Y. Bai, L. Fan, H. Yan, D. L. Phillips, S. Yang, J. Am. Chem. Soc. 2014, 136, 3760–3763.
- M. Li, W. Ni, B. Kan, X. Wan, L. Zhang, Q. Zhang, G. Long, Y. Zuo, Y. Chen, Phys. Chem. Chem. Phys. 2013, 15, 18973.
- B. Lyu, H.-J. Li, F. Xue, L. Sai, B. Gui, D. Qian, X. Wang, J. Yang, Chem. Eng. J. 2020, 388, 124285.
- L. Yin, J. Zhou, W. Li, J. Zhang, L. Wang, RSC Adv. 2019, 9, 9301–9307.
- Q. Ren, L. Ga, J. Ai, ACS Omega 2019, 4, 15842–15848.
- M. J. Deka, D. Chowdhury, ChemistrySelect 2017, 2, 1999–2005.
- P. A. Rasheed, M. Ankitha, V. K. Pillai, S. Alwarappan, RSC Adv. 2024, 14, 16001–16023.
- H. K. Mohammed-Ahmed, M. Nakipoglu, A. Tezcaner, D. Keskin, Z. Evis, J. Drug Deliv. Sci. Technol. 2023, 80, 104199.
- S. Bak, D. Kim, H. Lee, Curr. Appl. Phys. 2016, 16, 1192–1201.
- P. Tian, L. Tang, K. S. Teng, S. P. Lau, Mater. Today Chem. 2018, 10, 221–258.
- R. Tian, S. Zhong, J. Wu, W. Jiang, Y. Shen, W. Jiang, T. Wang, Opt. Mater. 2016, 60, 204–208.
- J. Lin, Y. Huang, S. Wang, G. Chen, Ind. Eng. Chem. Res. 2017, 56, 9341–9346.
- S. Ahirwar, S. Mallick, D. Bahadur, ACS Omega 2017, 2, 8343–8353.
- Y. Shin, J. Park, D. Hyun, J. Yang, H. Lee, New J. Chem. 2015, 39, 2425–2428.
- A. Abbas, L. T. Mariana, A. N. Phan, Carbon 2018, 140, 77–99.
- Z. Wang, J. Yu, X. Zhang, N. Li, B. Liu, Y. Li, Y. Wang, W. Wang, Y. Li, L. Zhang, S. Dissanayake, S. L. Suib, L. Sun, ACS Appl. Mater. Interfaces 2016, 8, 1434–1439.
- P. Pierrat, P. Magri, J.-J. Gaumet, Solid-State Fluorescent Graphene-Based Quantum Dots, 2023, WO2023194683.
- P. Pierrat, P. Magri, J.-J. Gaumet, Solid-State Fluorescent Graphene-Based Quantum Dots, 2023, FR3134385.
- T. Shao, G. Wang, X. An, S. Zhuo, Y. Xia, C. Zhu, RSC Adv 2014, 4, 47977–47981.
- W. Kwon, Y.-H. Kim, C.-L. Lee, M. Lee, H. C. Choi, T.-W. Lee, S.-W. Rhee, Nano Lett. 2014, 14, 1306–1311.
- G. Yang, H. Hu, Y. Zhou, Y. Hu, H. Huang, F. Nie, W. Shi, Sci. Rep. 2012, 2. [CrossRef]
- P. P. Upare, J.-W. Yoon, M. Y. Kim, H.-Y. Kang, D. W. Hwang, Y. K. Hwang, H. H. Kung, J.-S. Chang, Green Chem. 2013, 15, 2935.
- S. Li, Y. Li, J. Cao, J. Zhu, L. Fan, X. Li, Anal. Chem. 2014, 86, 10201–10207.
- L. Wang, Y. Wang, T. Xu, H. Liao, C. Yao, Y. Liu, Z. Li, Z. Chen, D. Pan, L. Sun, M. Wu, Nat. Commun. 2014, 5, 5357.
- Z. Gan, H. Xu, Y. Hao, Nanoscale 2016, 8, 7794–7807.
- T. Yu, H. Wang, C. Guo, Y. Zhai, J. Yang, J. Yuan, R. Soc. Open Sci. 2018, 5, 180245.
- K. Ahmad, A. Pal, U. N. Pan, A. Chattopadhyay, A. Paul, J. Mater. Chem. C 2018, 6, 6691–6697.
- C. Zhou, D. Li, P. Jing, Y. Zhai, D. Shen, S. Qu, A. L. Rogach, Chem. Mater. 2017, 29, 1779–1787.
Figure 1.
SEM images of precursors (a) A0, (b) B0 and (c) C0.
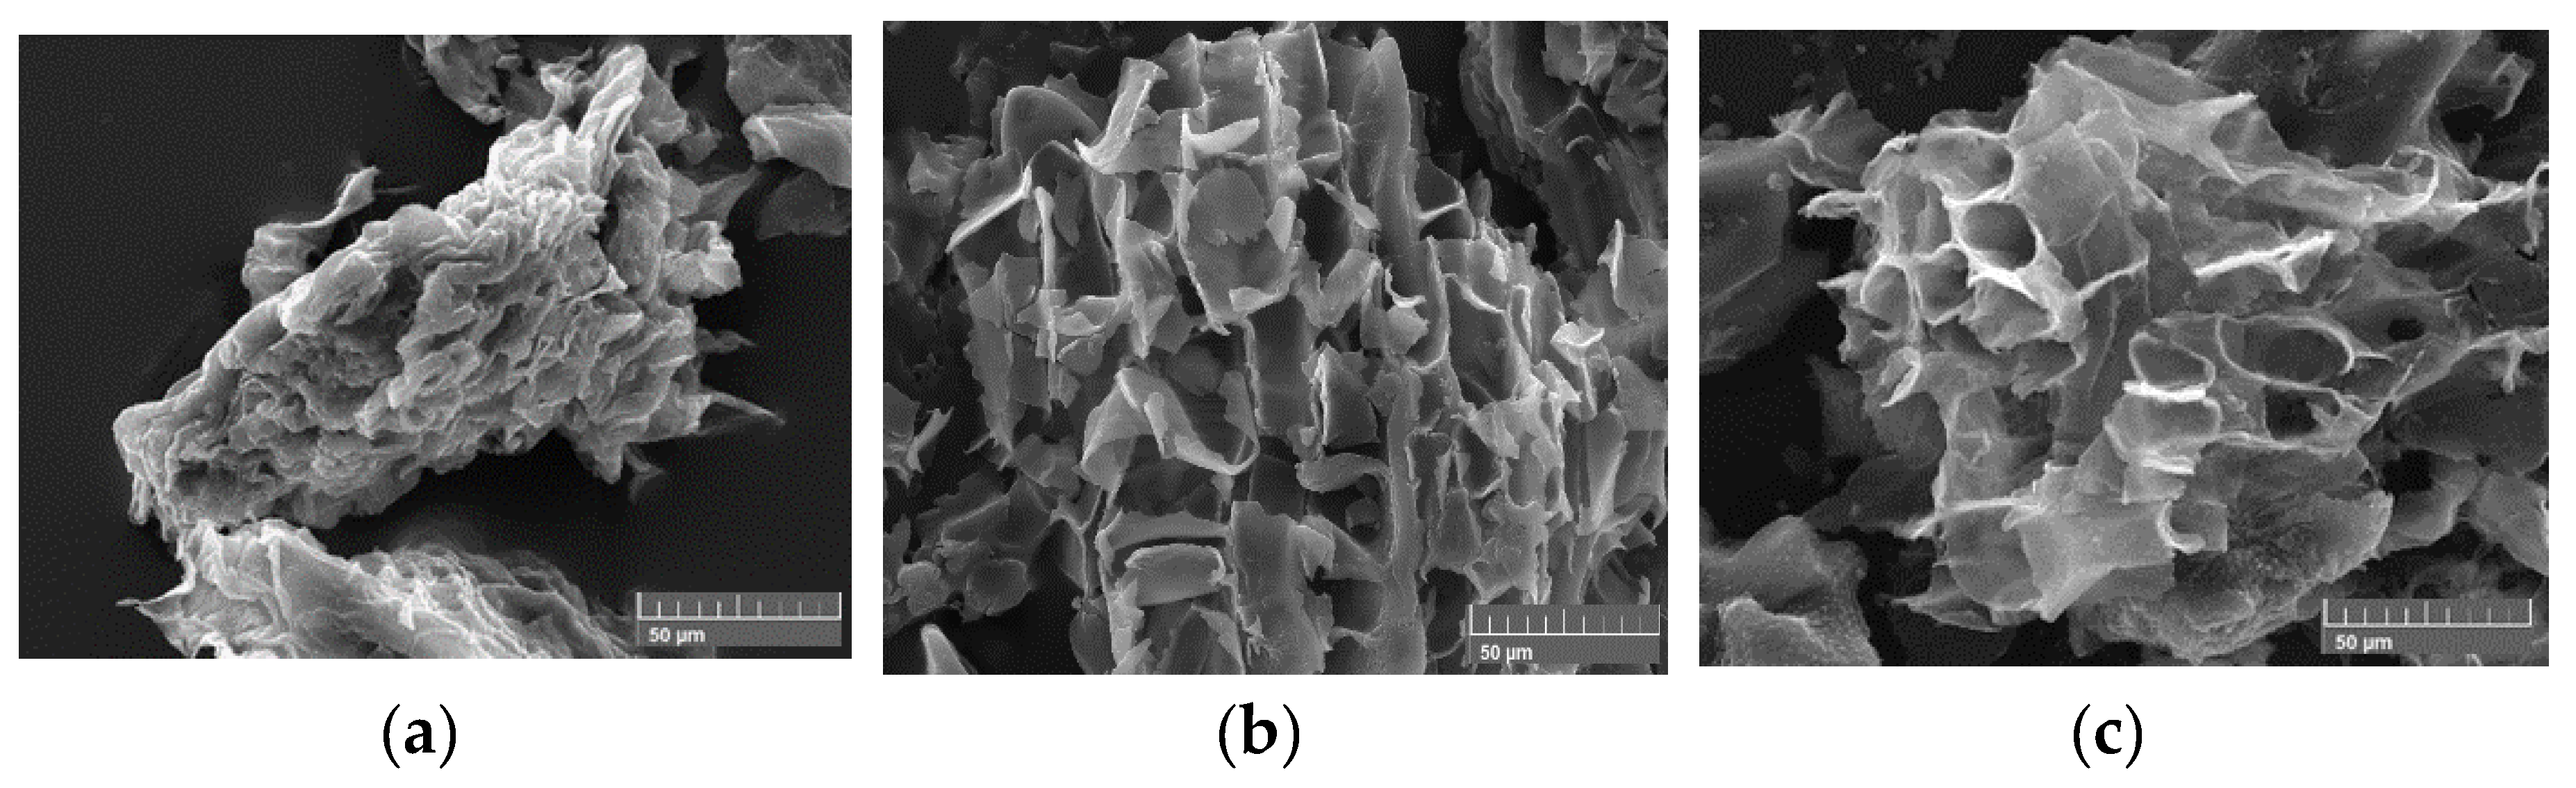
Figure 2.
(a) Elemental analysis of A0-C0 and A1-C1. FT-IR spectra of A1 (b), B1 (c) and C1 (d).
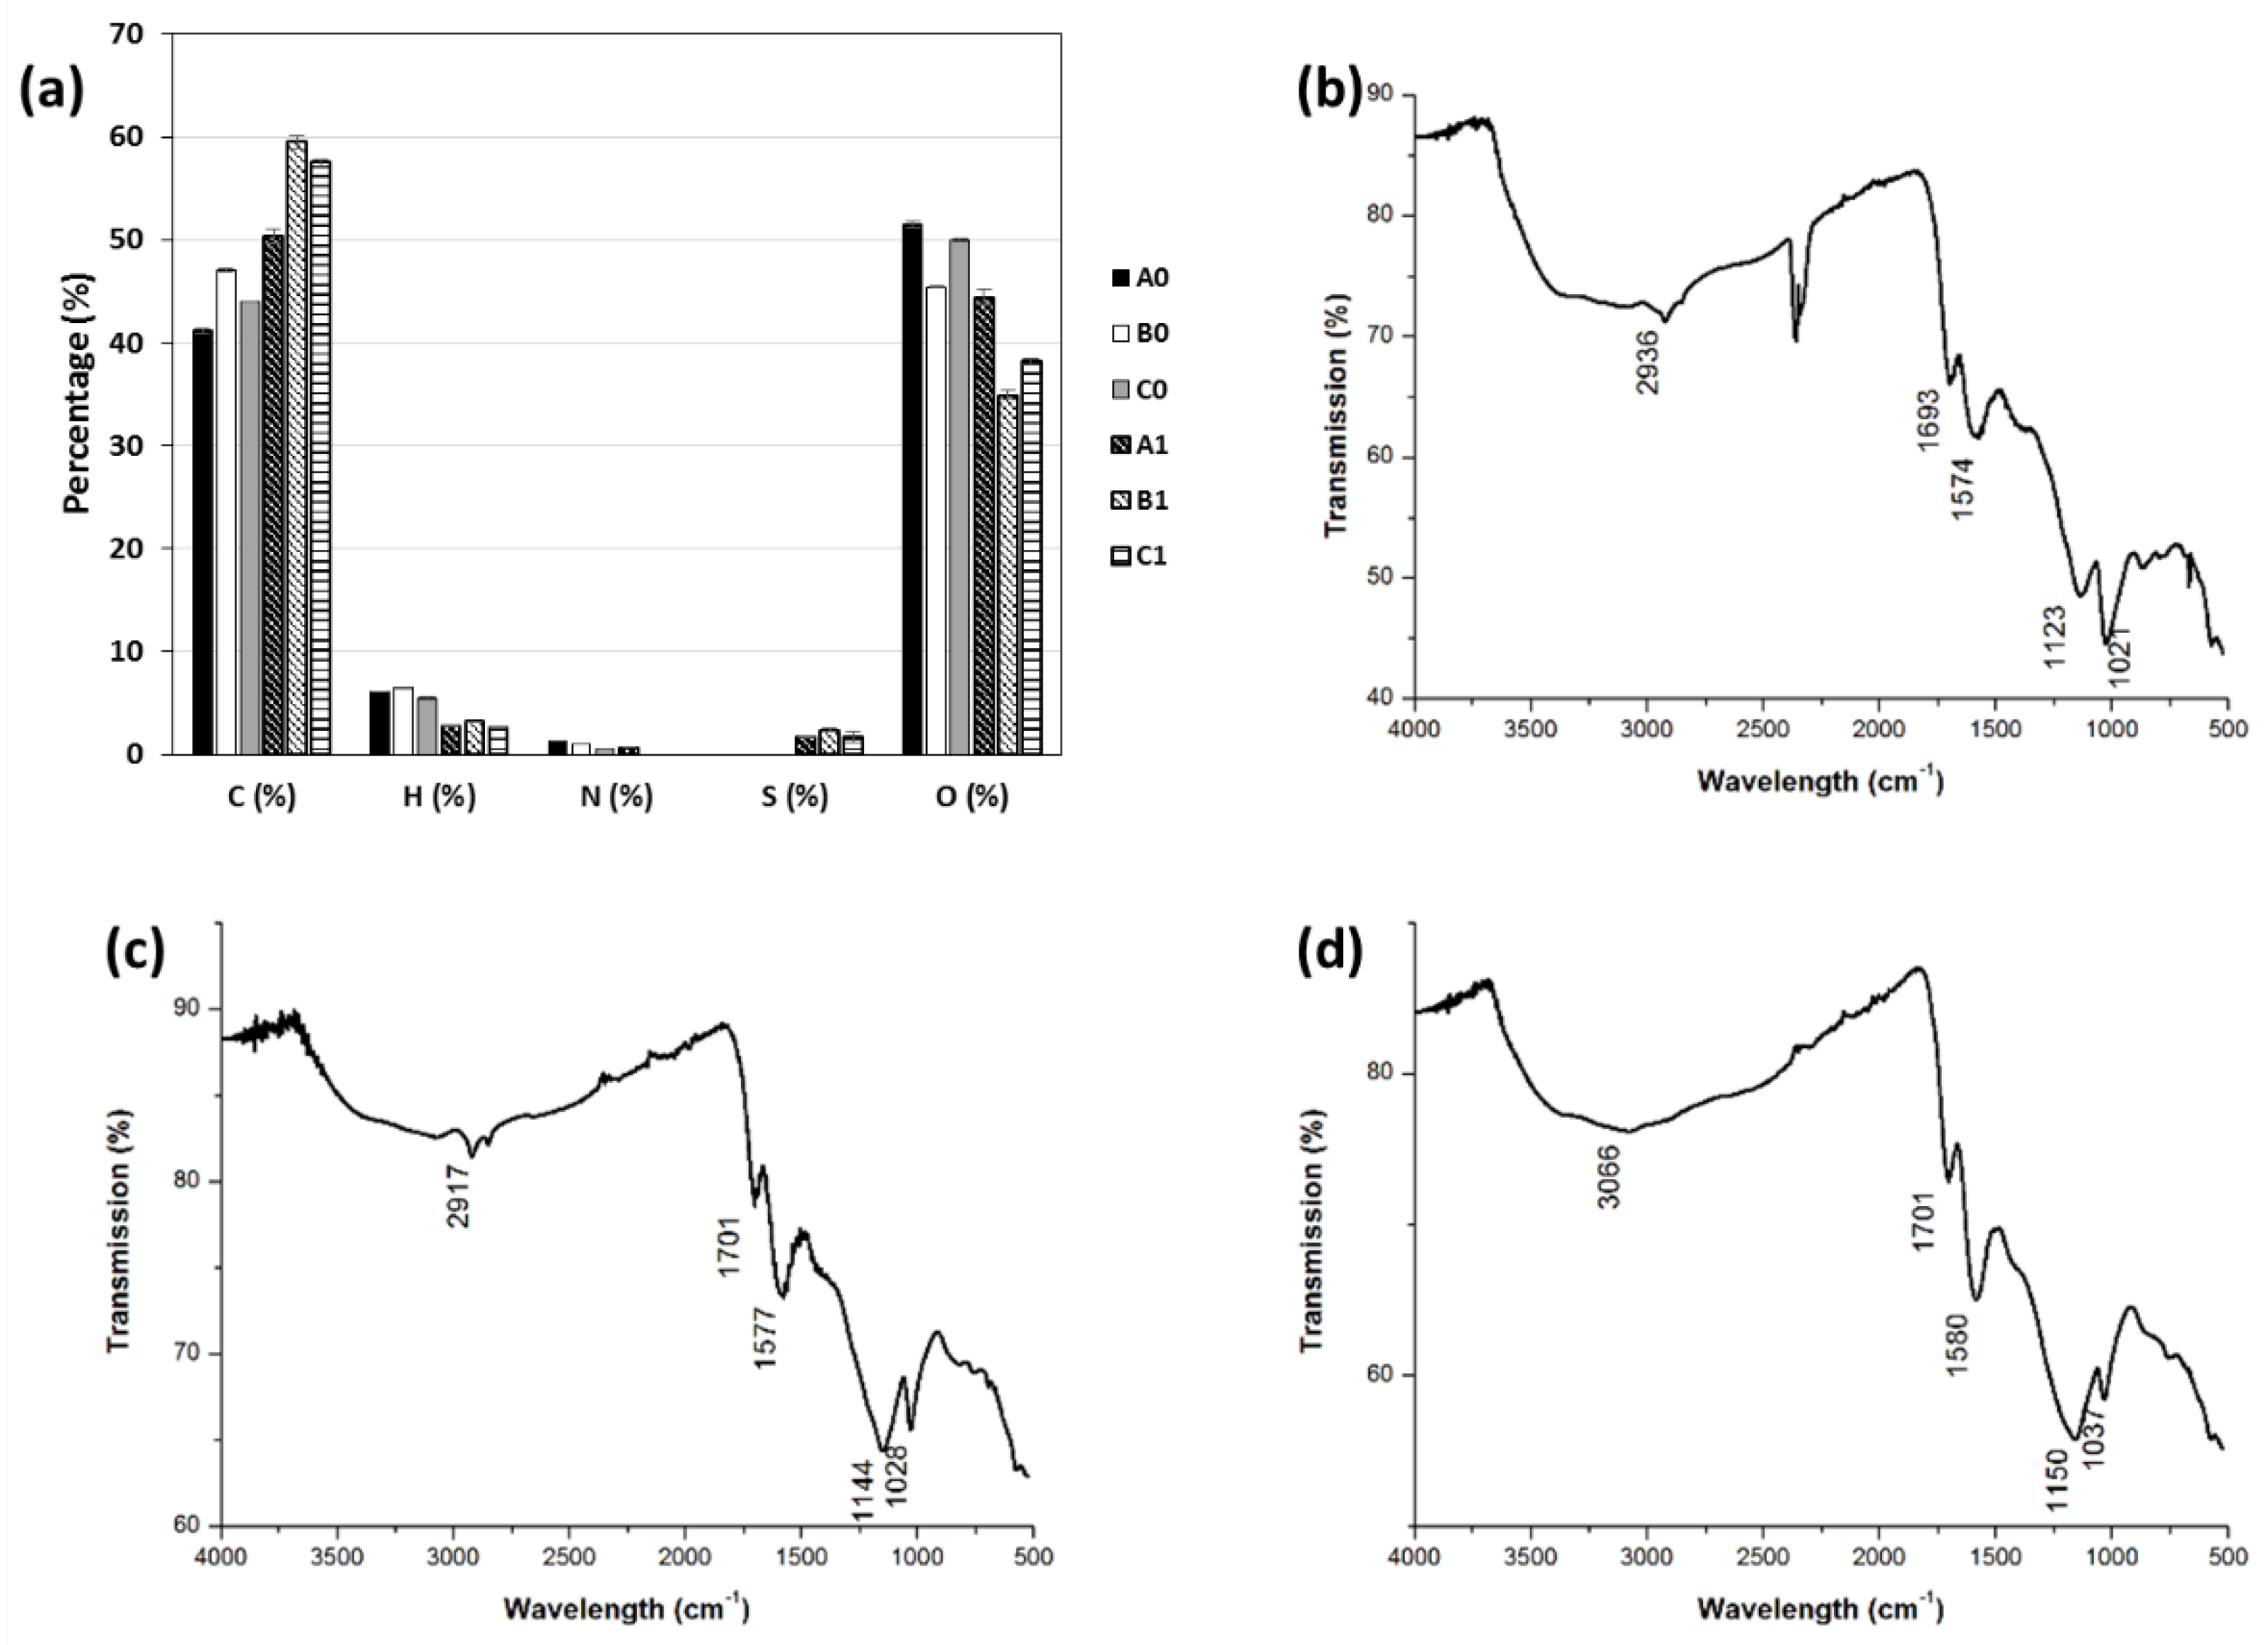
Figure 3.
STEM images of products (a) A1, (b) B1 and (c) C1.
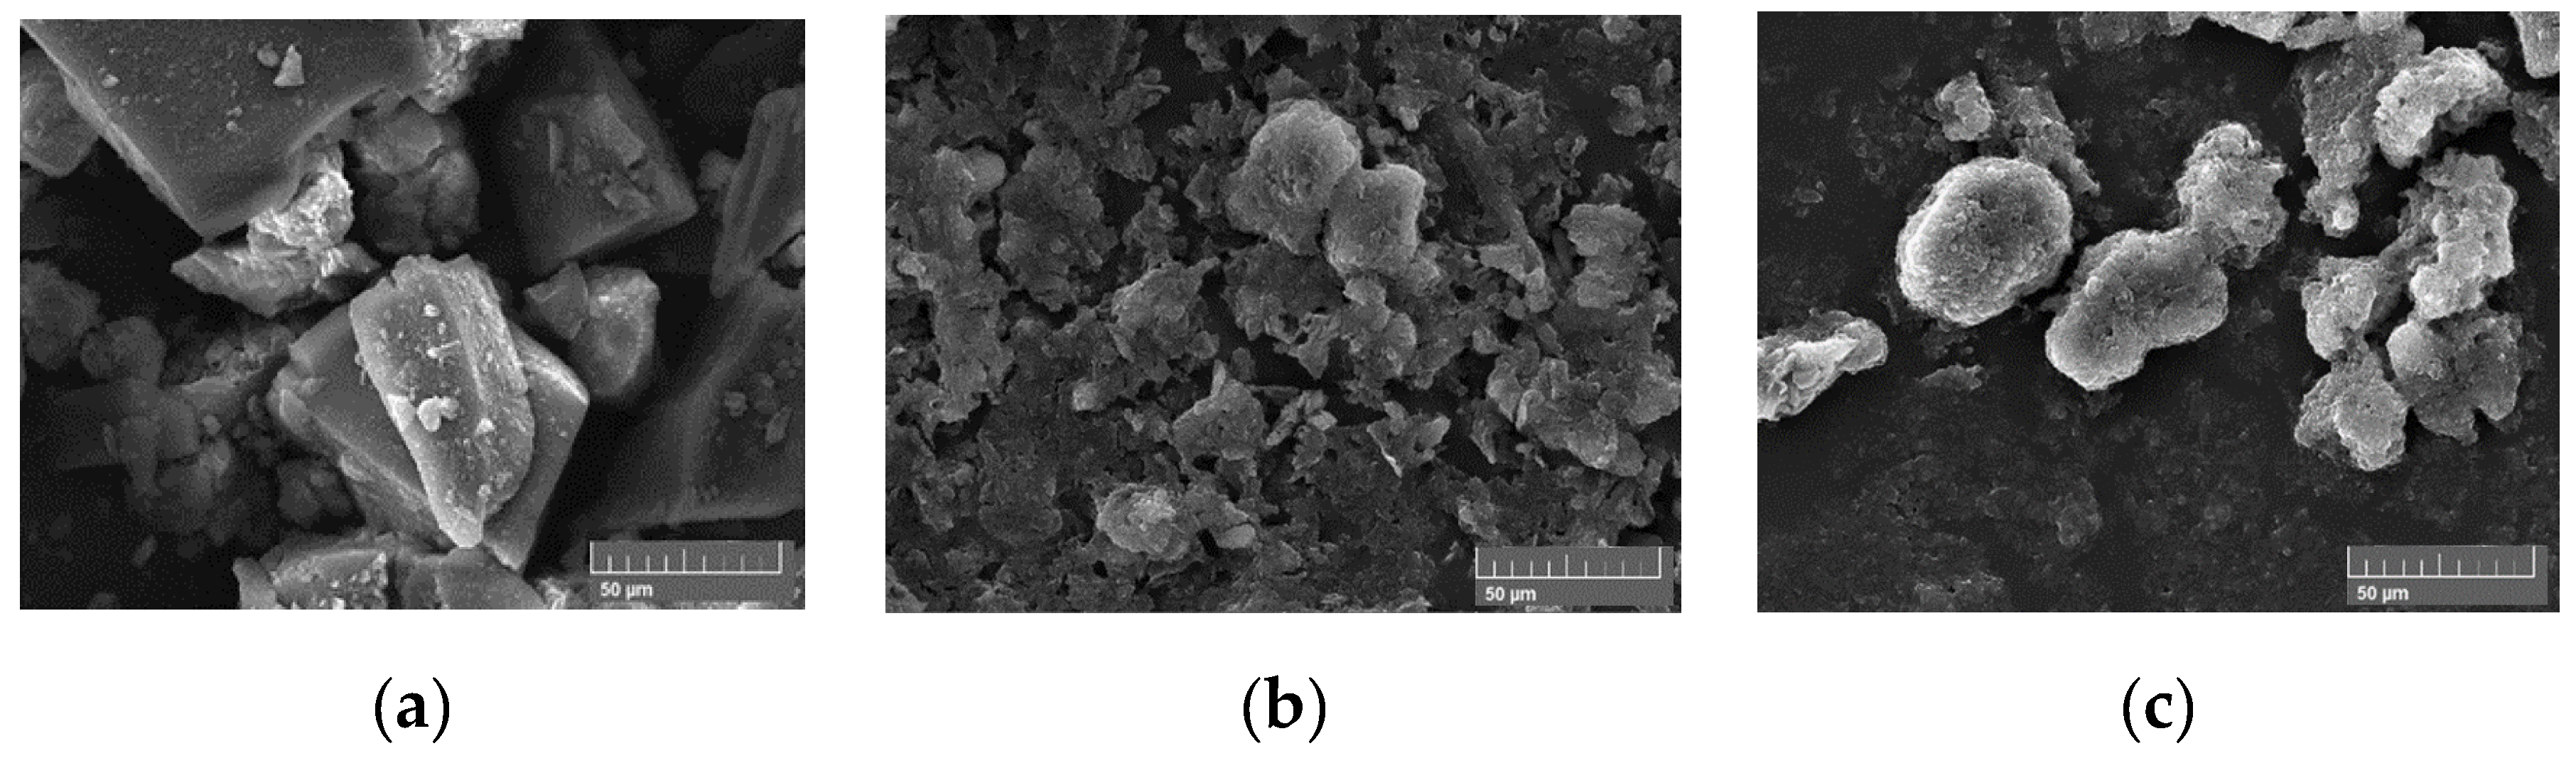
Figure 4.
(a) XPS survey of GQDs A2. (b) deconvoluted C1s spectrum of GQDs A2. (c) deconvoluted N1s spectrum of GQDs A2. d) FTIR spectrum of GQDs A2.
Figure 4.
(a) XPS survey of GQDs A2. (b) deconvoluted C1s spectrum of GQDs A2. (c) deconvoluted N1s spectrum of GQDs A2. d) FTIR spectrum of GQDs A2.
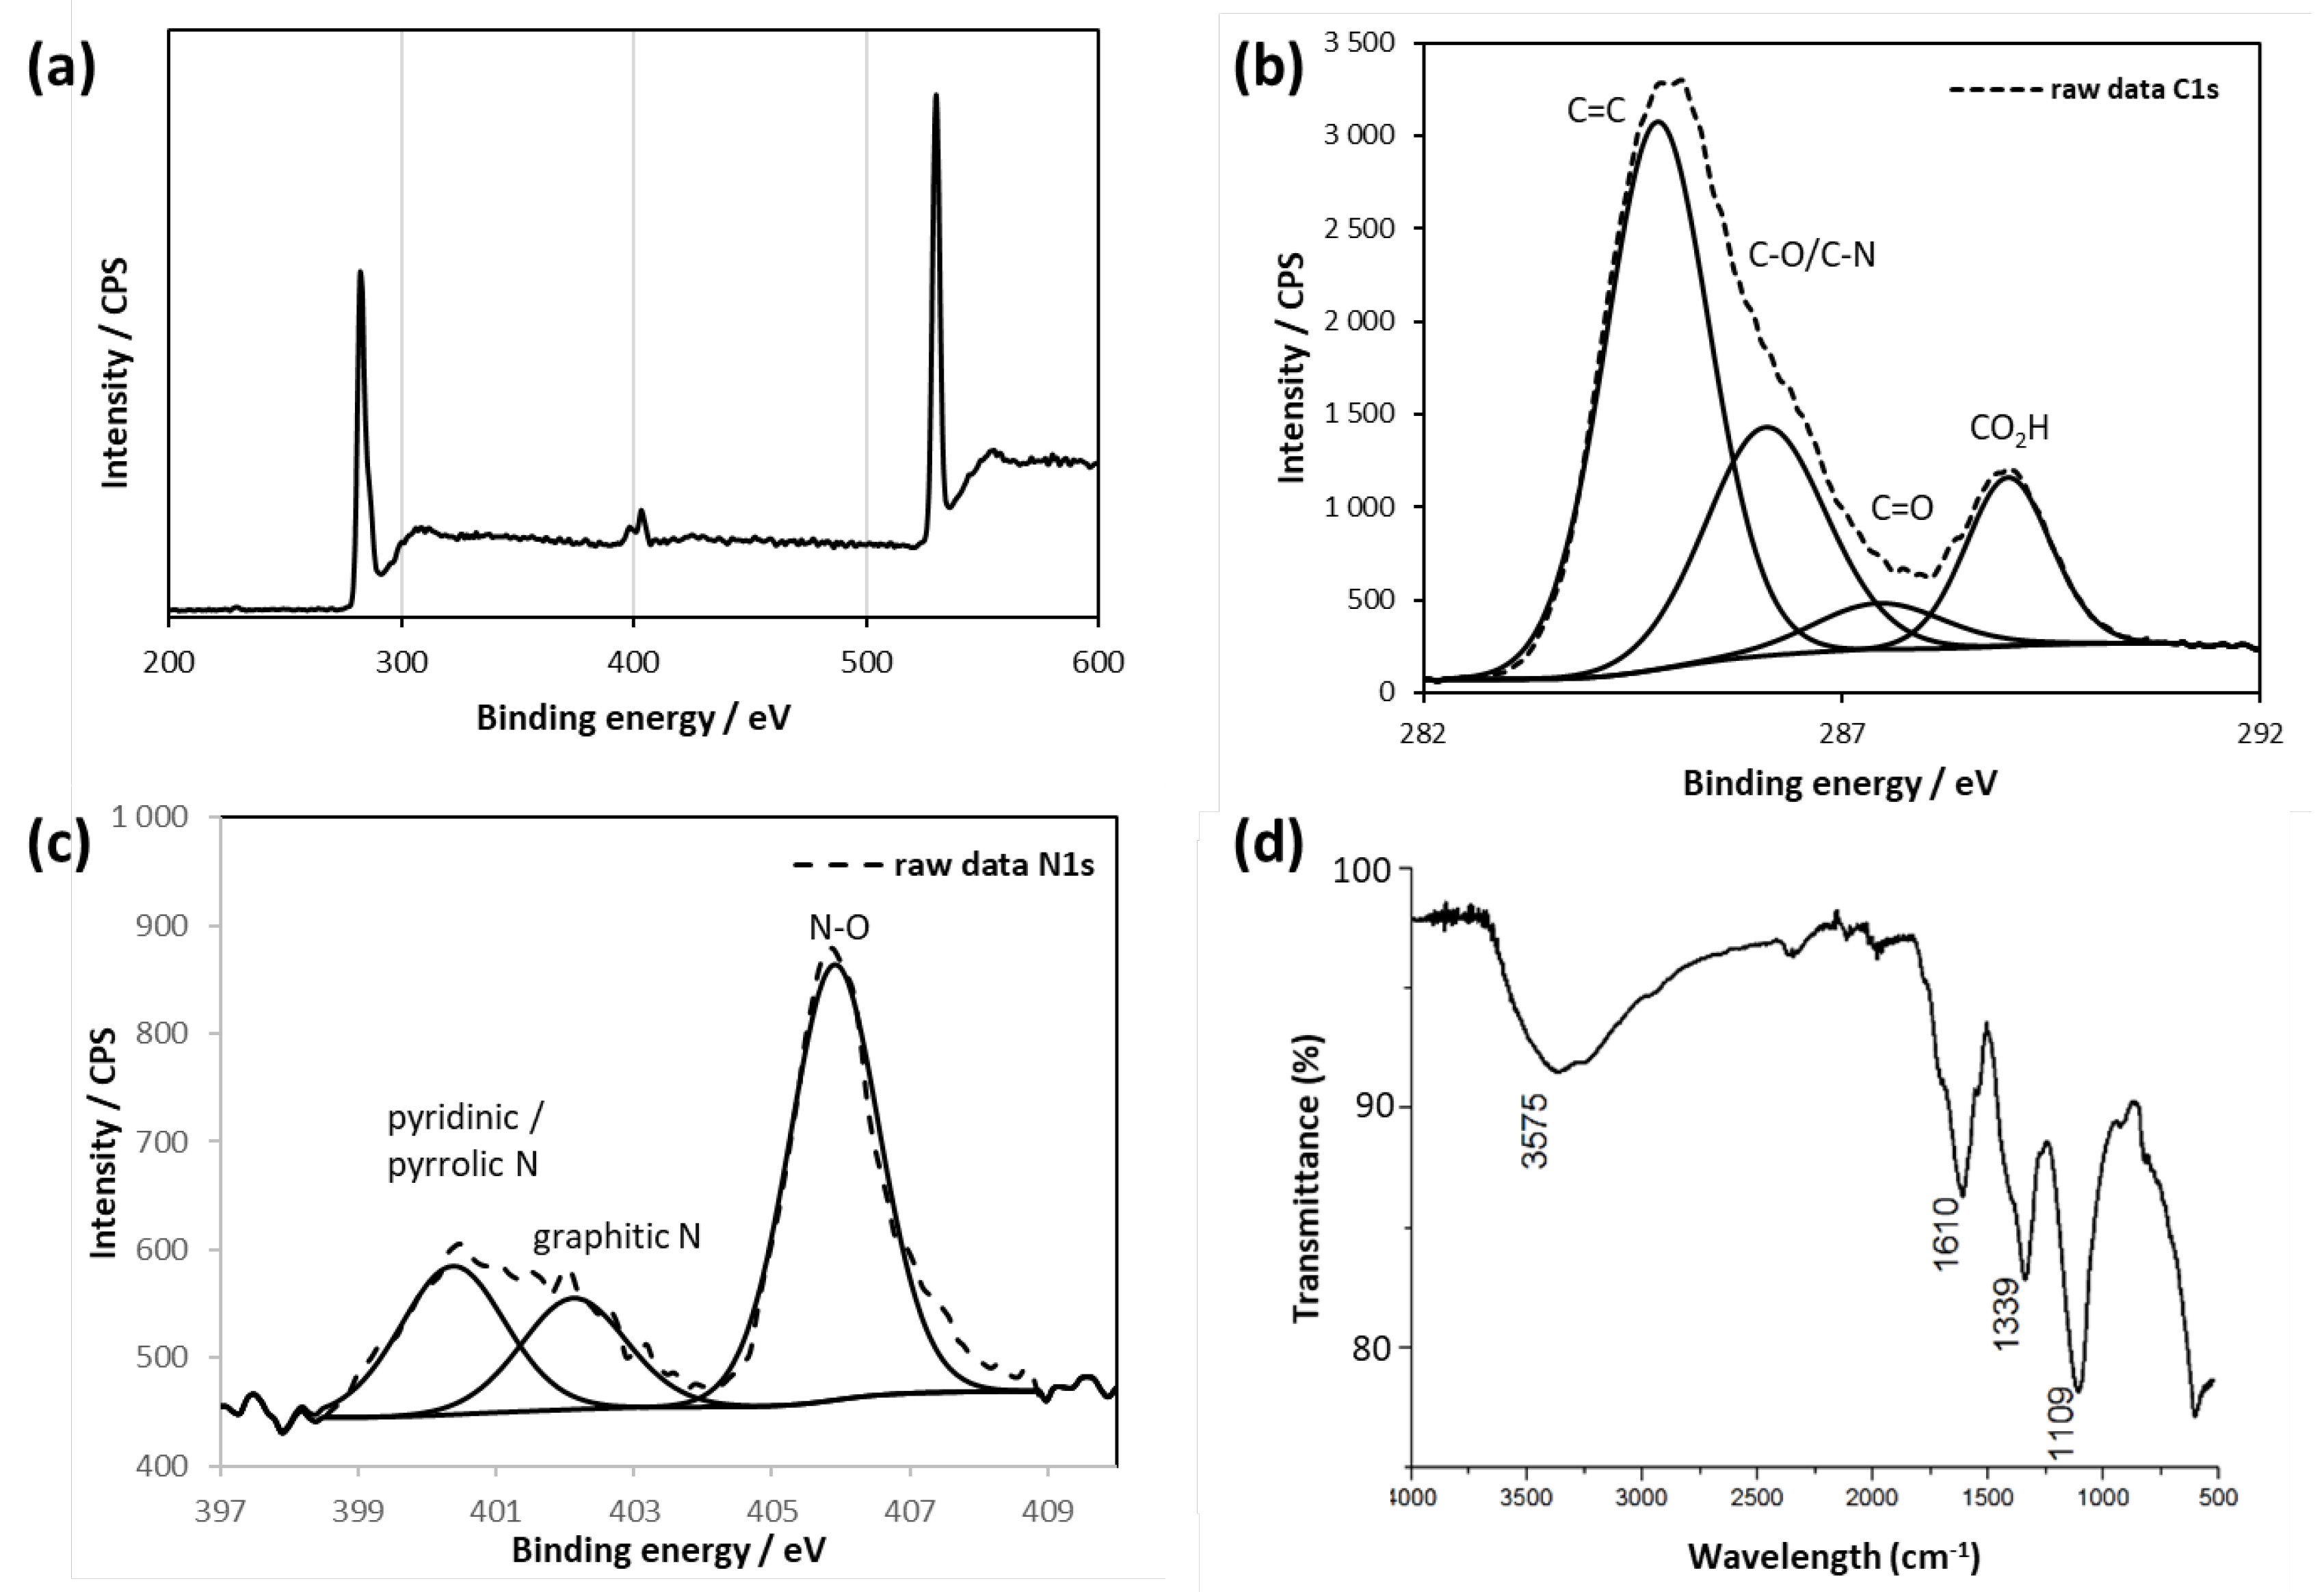
Figure 5.
Size characterization of GGDs A2 determined (a) by DLS and (b-c) by HR-TEM
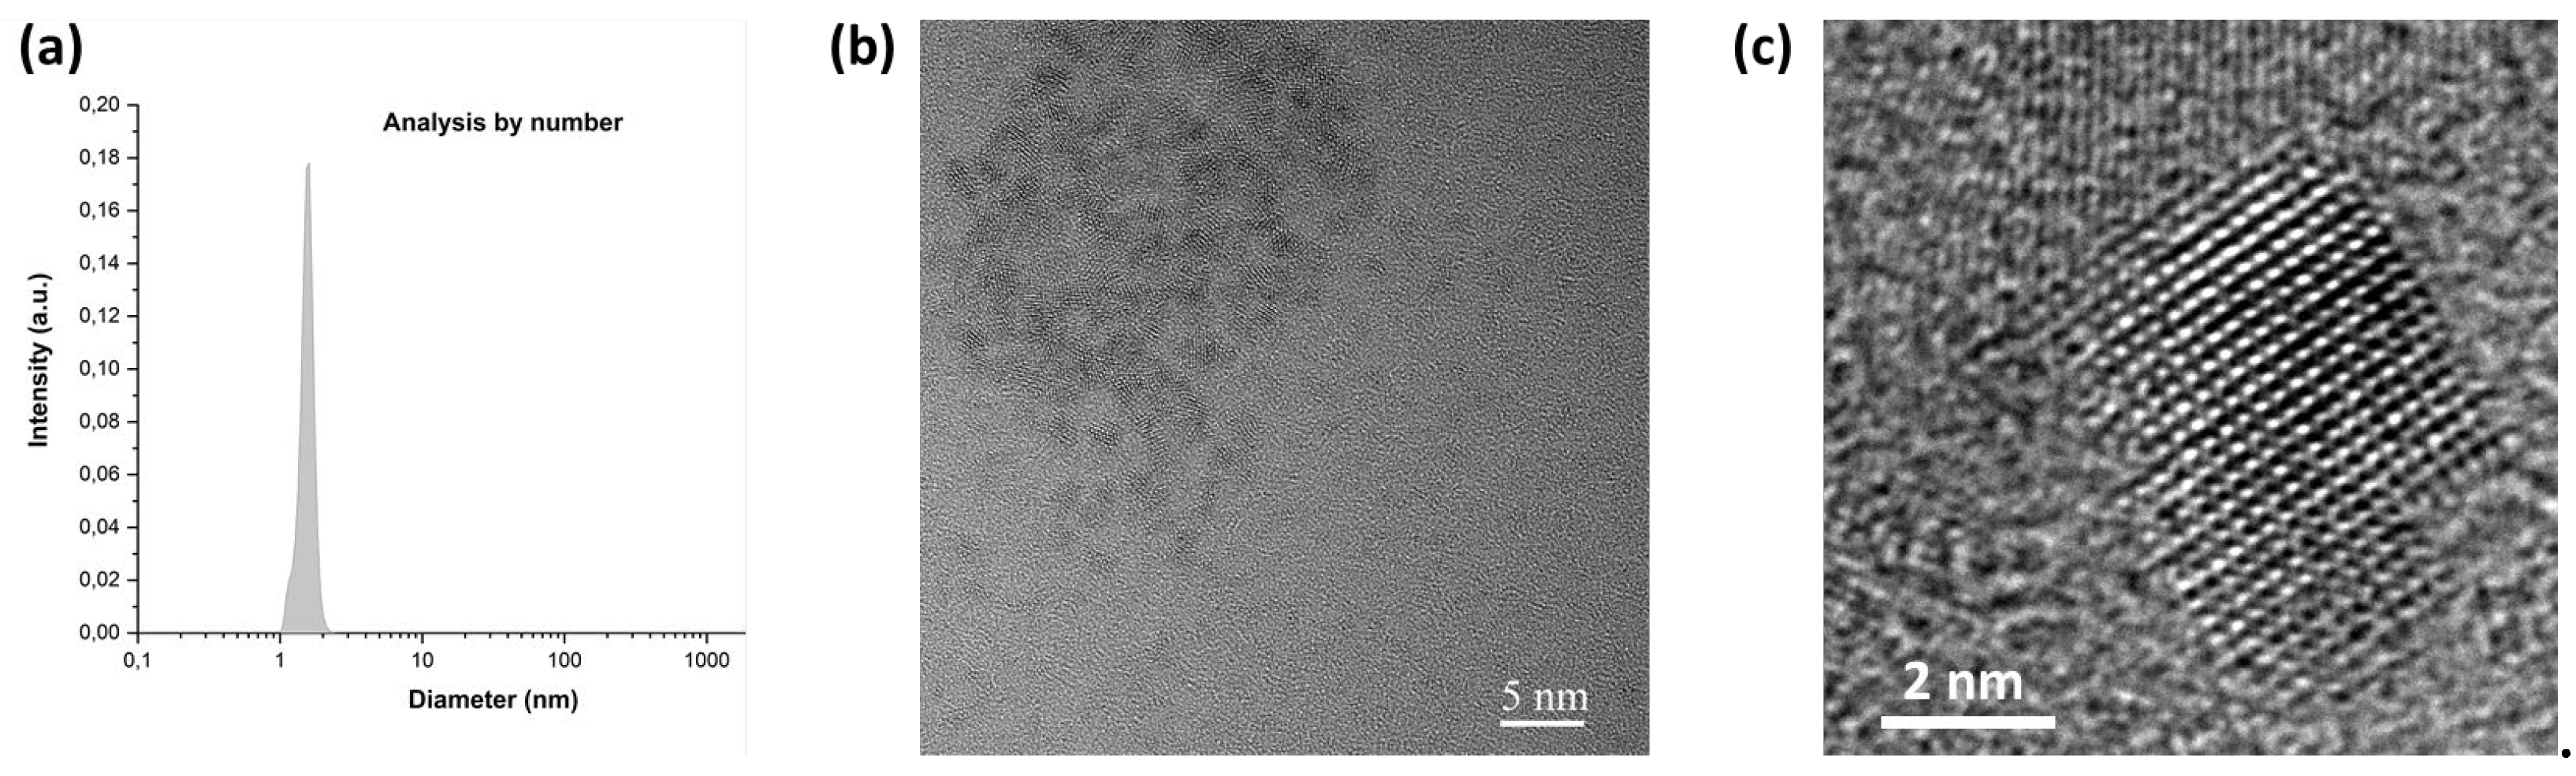
Figure 6.
Photophysical properties of water-dispersed GQDs A2. (a) UV-vis spectrum and (b) normalized emission spectra of GQDs recorded for progressively longer excitation wavelengths ranging from 300 to 500 nm (with a 50 nm increment).
Figure 6.
Photophysical properties of water-dispersed GQDs A2. (a) UV-vis spectrum and (b) normalized emission spectra of GQDs recorded for progressively longer excitation wavelengths ranging from 300 to 500 nm (with a 50 nm increment).
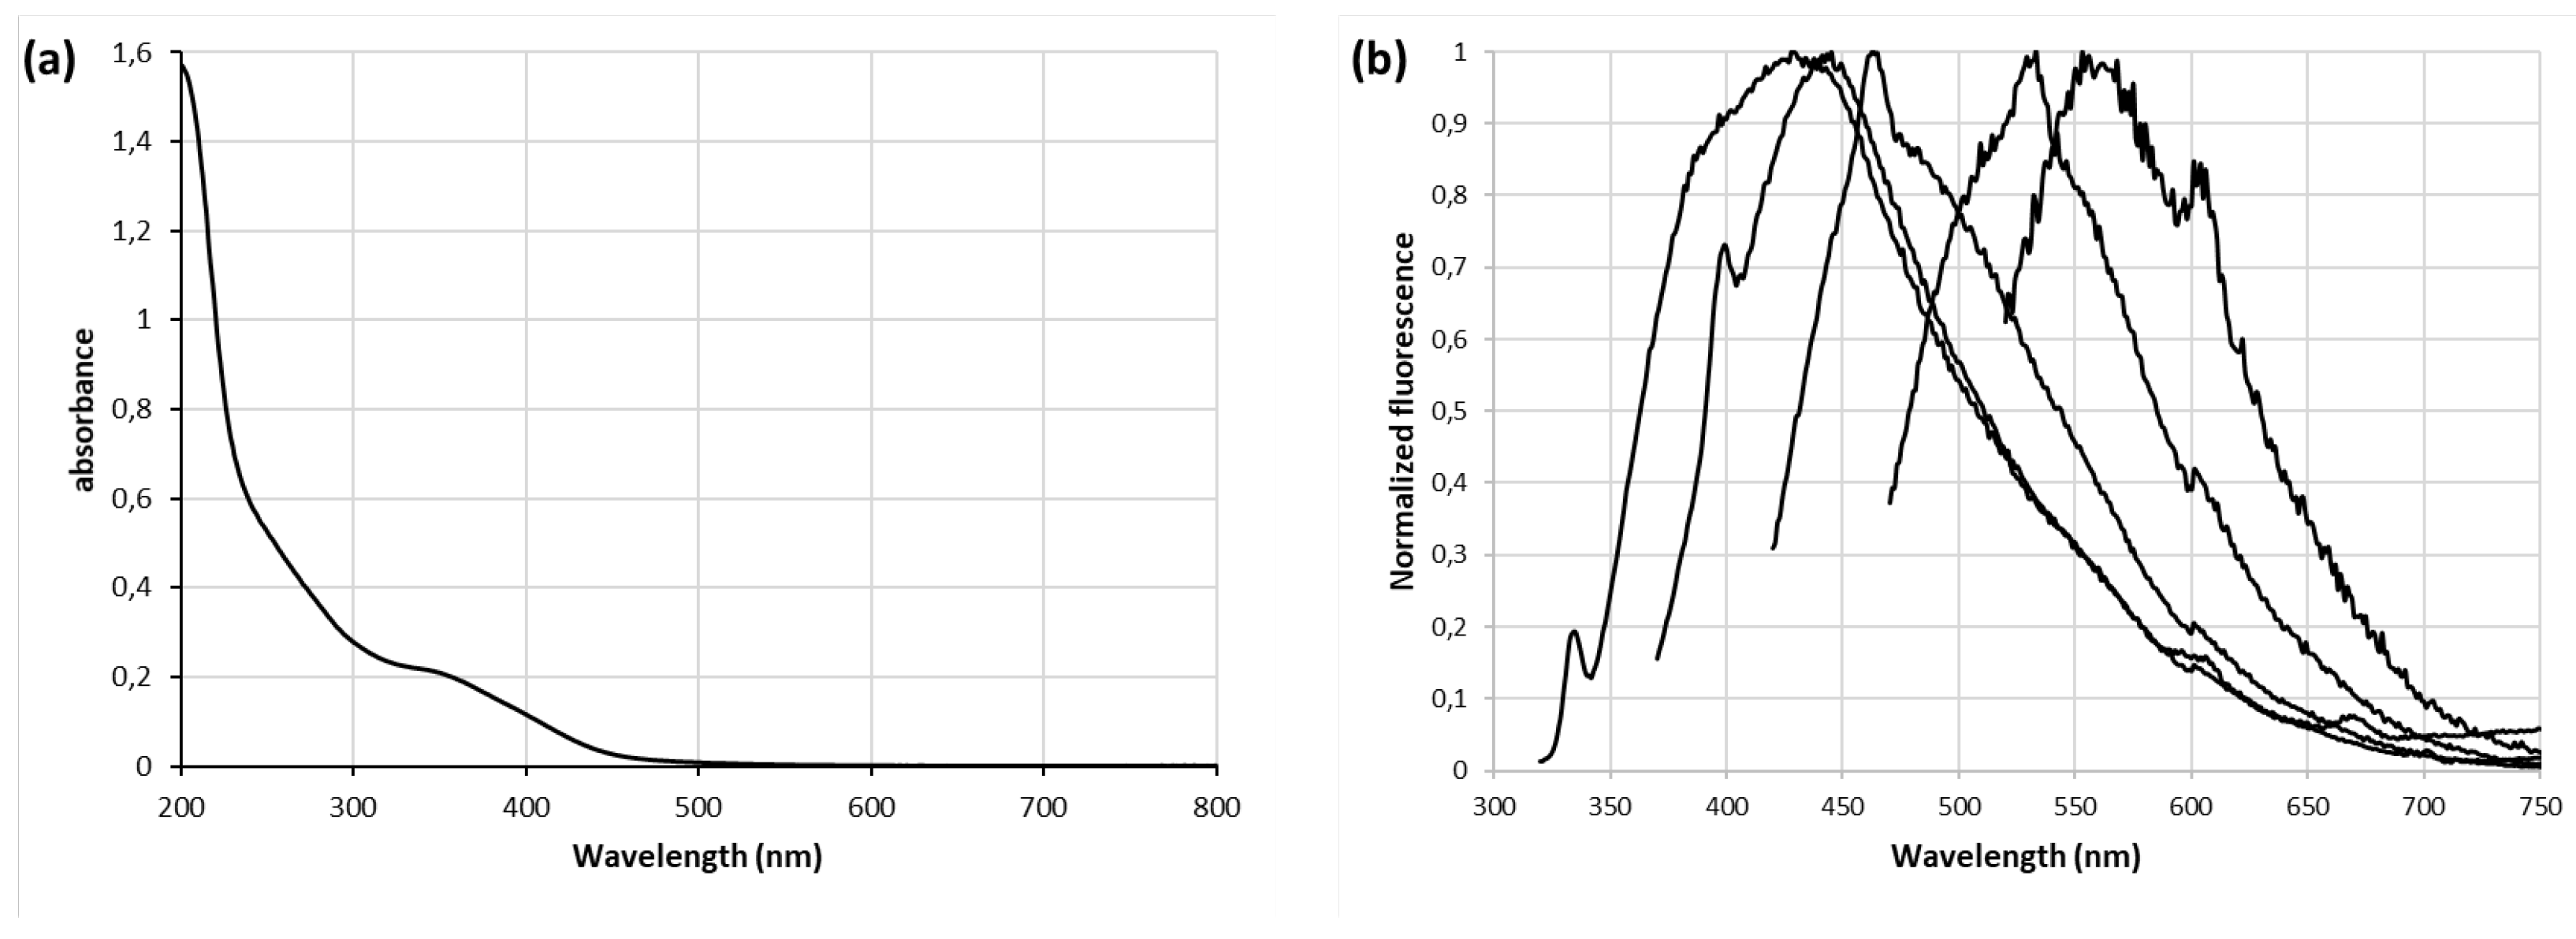
Figure 7.
White light emission (λexc. = 325 nm) of A2-based films deposited on a silicon wafer. The spectrum has been truncated at 650 nm to remove the peak corresponding to the excitation second harmonic.
Figure 7.
White light emission (λexc. = 325 nm) of A2-based films deposited on a silicon wafer. The spectrum has been truncated at 650 nm to remove the peak corresponding to the excitation second harmonic.
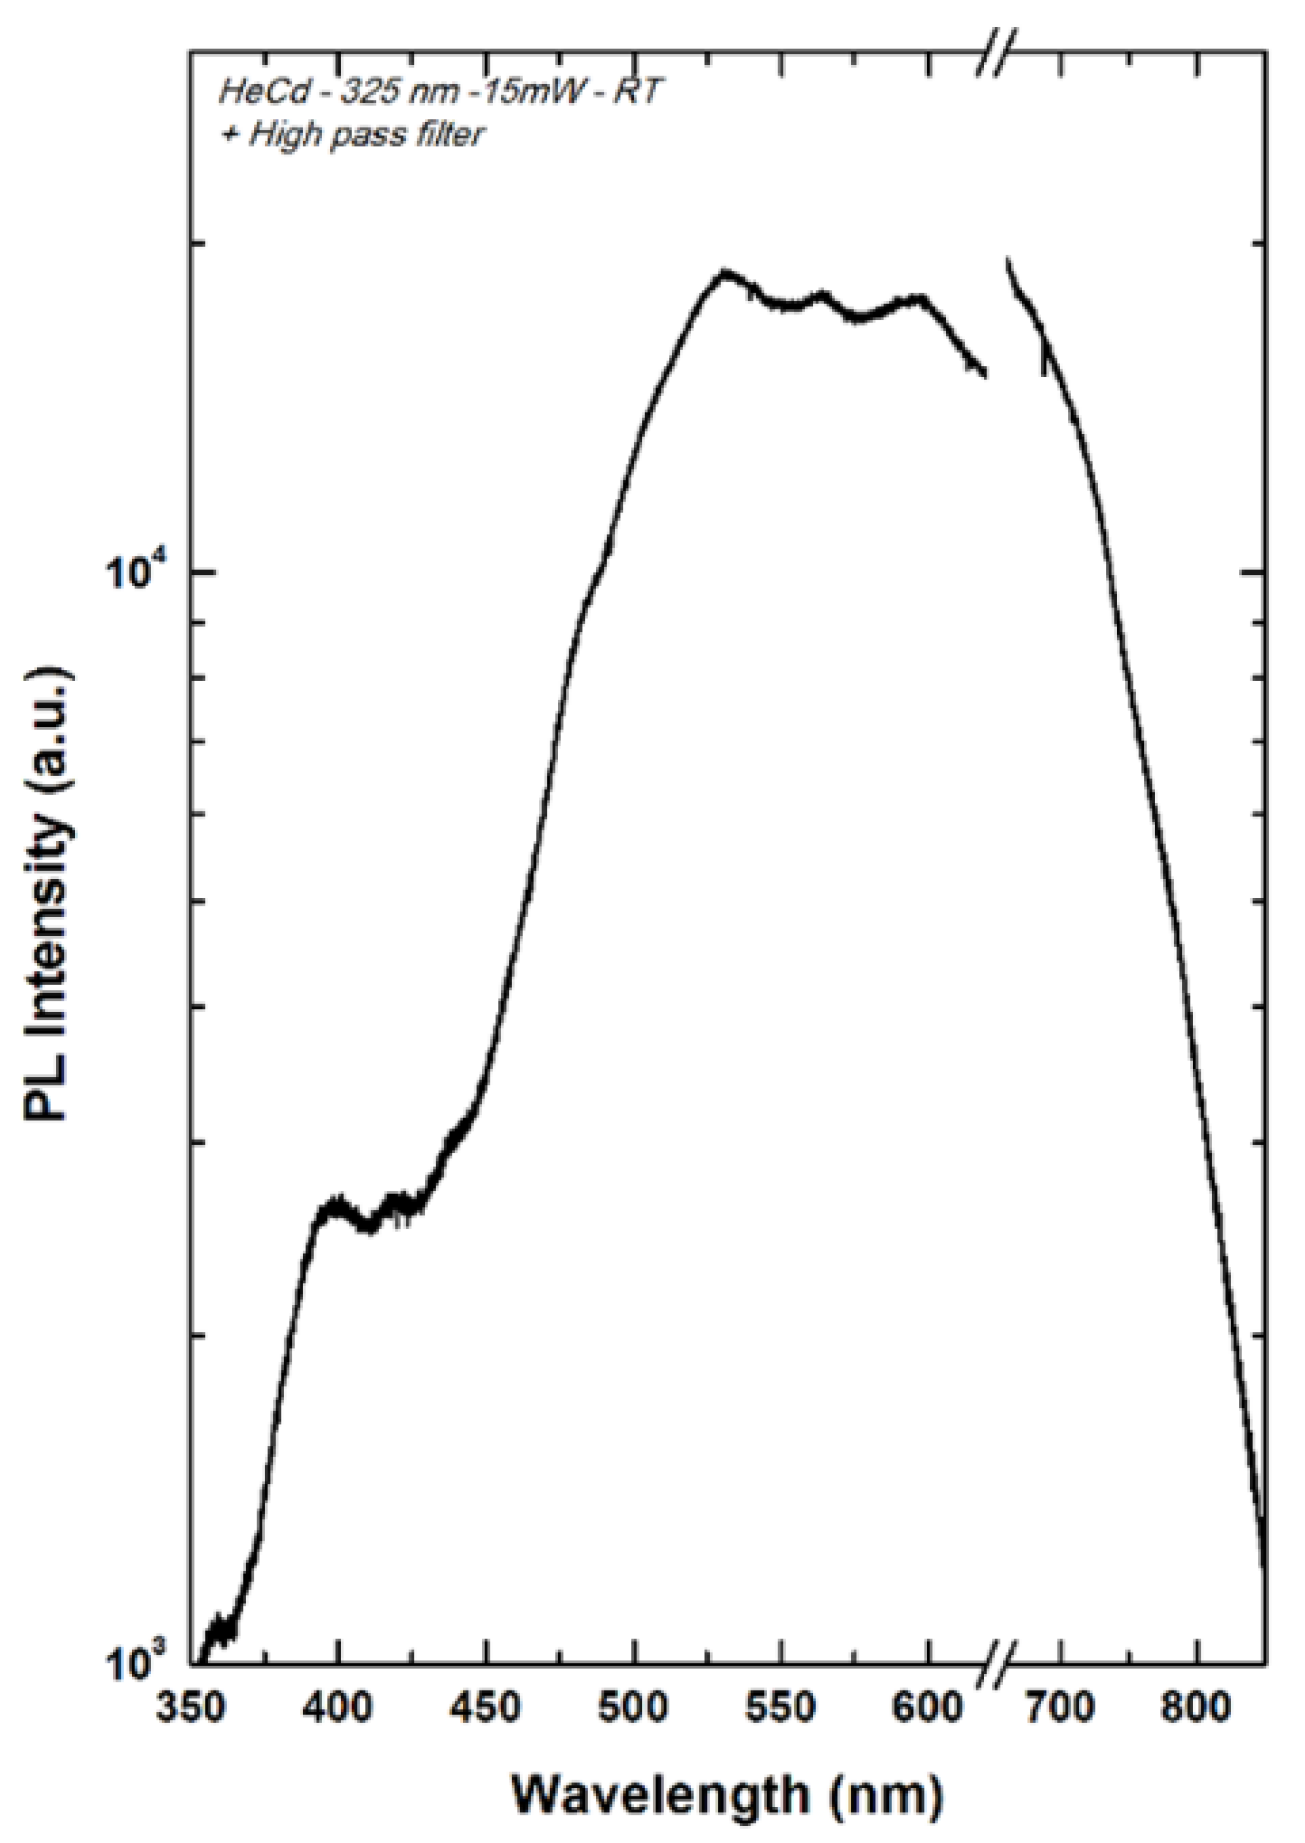

Table 1.
Percentage of C, N, O and S atoms in A2-C2, as determined by XPS measurements.
| Sample A2 | Sample B2 | Sample C2 | |
|---|---|---|---|
| C content (%) | 58.1 ± 2.1 | 64.7 ± 2.2 | 65.2 ± 2.4 |
| N content (%) | 5.4 ± 0.2 | 4.0 ± 0.1 | 4.9 ± 0.2 |
| O content (%) | 34.7 ± 1.2 | 30.5 ± 1.0 | 29.6 ± 1.1 |
| S content (%) | 1.8 ± 0.1 | 0.8 ± 0.1 | 0.3 ± 0.1 |
Disclaimer/Publisher’s Note: The statements, opinions and data contained in all publications are solely those of the individual author(s) and contributor(s) and not of MDPI and/or the editor(s). MDPI and/or the editor(s) disclaim responsibility for any injury to people or property resulting from any ideas, methods, instructions or products referred to in the content. |
© 2024 by the authors. Licensee MDPI, Basel, Switzerland. This article is an open access article distributed under the terms and conditions of the Creative Commons Attribution (CC BY) license (http://creativecommons.org/licenses/by/4.0/).
Copyright: This open access article is published under a Creative Commons CC BY 4.0 license, which permit the free download, distribution, and reuse, provided that the author and preprint are cited in any reuse.